UNITED STATES
SECURITIES AND EXCHANGE COMMISSION
Washington, D.C. 20549
FORM N-CSR
CERTIFIED SHAREHOLDER REPORT OF REGISTERED
MANAGEMENT INVESTMENT COMPANIES
Investment Company Act file number 811-4008
Fidelity Investment Trust
(Exact name of registrant as specified in charter)
245 Summer St., Boston, Massachusetts 02210
(Address of principal executive offices) (Zip code)
Scott C. Goebel, Secretary
245 Summer St.
Boston, Massachusetts 02210
(Name and address of agent for service)
Registrant's telephone number, including area code: 617-563-7000
Date of fiscal year end: | October 31 |
| |
Date of reporting period: | October 31, 2014 |
This report on Form N-CSR relates solely to the Registrant's Fidelity Emerging Europe, Middle East, Africa (EMEA) Fund, Fidelity Emerging Markets Discovery Fund, Fidelity Global Commodity Stock Fund, Fidelity Global Equity Income Fund, Fidelity International Discovery Fund, Fidelity International Growth Fund, Fidelity International Small Cap Fund, Fidelity International Small Cap Opportunities Fund, Fidelity International Value Fund, Fidelity Series Emerging Markets Fund, Fidelity Series International Growth Fund, Fidelity Series International Small Cap Fund, Fidelity Series International Value Fund, Fidelity Total Emerging Markets Fund, and Fidelity Total International Equity Fund (each, a "Fund" and collectively, the "Funds").
Item 1. Reports to Stockholders
(Fidelity Investment logo)(registered trademark)
Fidelity Advisor®
Emerging Europe,
Middle East, Africa (EMEA)
Fund - Class A, Class T, Class B
and Class C
Annual Report
October 31, 2014
(Fidelity Cover Art)
Class A, Class T, Class B, and Class C are classes of Fidelity® Emerging Europe,
Middle East, Africa (EMEA) Fund
Contents
Performance | (Click Here) | How the fund has done over time. |
Management's Discussion of Fund Performance | (Click Here) | The Portfolio Manager's review of fund performance and strategy. |
Shareholder Expense Example | (Click Here) | An example of shareholder expenses. |
Investment Changes | (Click Here) | A summary of major shifts in the fund's investments over the past six months. |
Investments | (Click Here) | A complete list of the fund's investments with their market values. |
Financial Statements | (Click Here) | Statements of assets and liabilities, operations, and changes in net assets, as well as financial highlights. |
Notes | (Click Here) | Notes to the financial statements. |
Report of Independent Registered Public Accounting Firm | (Click Here) | |
Trustees and Officers | (Click Here) | |
Distributions | (Click Here) | |
Board Approval of Investment Advisory Contracts and Management Fees | (Click Here) | |
To view a fund's proxy voting guidelines and proxy voting record for the 12-month period ended June 30, visit http://www.fidelity.com/proxyvotingresults or visit the Securities and Exchange Commission's (SEC) web site at http://www.sec.gov. You may also call 1-877-208-0098 to request a free copy of the proxy voting guidelines.
Standard & Poor's, S&P and S&P 500 are registered service marks of The McGraw-Hill Companies, Inc. and have been licensed for use by Fidelity Distributors Corporation.
Other third-party marks appearing herein are the property of their respective owners.
All other marks appearing herein are registered or unregistered trademarks or service marks of FMR LLC or an affiliated company. © 2014 FMR LLC. All rights reserved.
Annual Report
This report and the financial statements contained herein are submitted for the general information of the shareholders of the fund. This report is not authorized for distribution to prospective investors in the fund unless preceded or accompanied by an effective prospectus.
A fund files its complete schedule of portfolio holdings with the SEC for the first and third quarters of each fiscal year on Form N-Q. Forms N-Q are available on the SEC's web site at http://www.sec.gov. A fund's Forms N-Q may be reviewed and copied at the SEC's Public Reference Room in Washington, DC. Information regarding the operation of the SEC's Public Reference Room may be obtained by calling 1-800-SEC-0330. For a complete list of a fund's portfolio holdings, view the most recent holdings listing, semiannual report, or annual report on Fidelity's web site at http://www.fidelity.com, http://www.advisor.fidelity.com, or http://www.401k.com, as applicable.
NOT FDIC INSURED • MAY LOSE VALUE • NO BANK GUARANTEE
Neither the fund nor Fidelity Distributors Corporation is a bank.
Annual Report
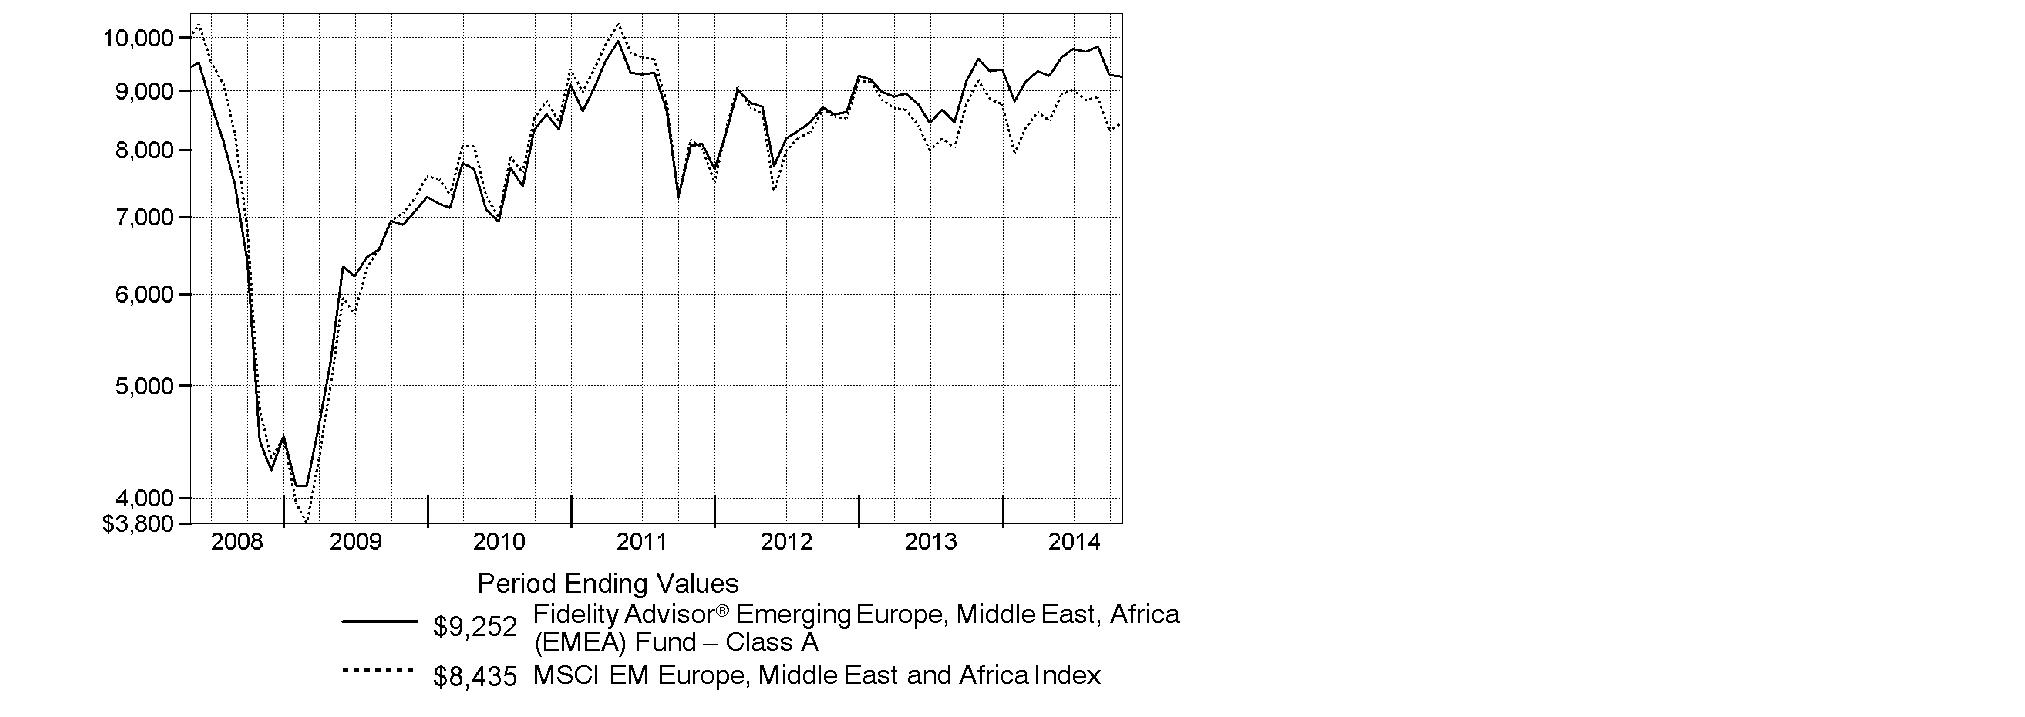
Average annual total return reflects the change in the value of an investment, assuming reinvestment of the class' distributions from dividend income and capital gains (the profits earned upon the sale of securities that have grown in value, if any) and assuming a constant rate of performance each year. The $10,000 table and the fund's returns do not reflect the deduction of taxes that a shareholder would pay on fund distributions or the redemption of fund shares. During periods of reimbursement by Fidelity, a fund's total return will be greater than it would be had the reimbursement not occurred. How a fund did yesterday is no guarantee of how it will do tomorrow.
Average Annual Total Returns
Periods ended October 31, 2014 | Past 1
year | Past 5
years | Life of
fundA |
Class A (incl. 5.75% sales charge) | -9.03% | 4.84% | -1.19% |
Class T (incl. 3.50% sales charge) | -7.04% | 5.06% | -1.09% |
Class B (incl. contingent deferred sales charge) B | -8.99% | 4.94% | -1.04% |
Class C (incl. contingent deferred sales charge) C | -5.19% | 5.26% | -1.04% |
A From May 8, 2008.
B Class B shares' contingent deferred sales charges included in the past one year, past five years, and life of fund total return figures are 5%, 2% and 0%, respectively.
C Class C shares' contingent deferred sales charges included the past one year, past five years, and life of fund total return figures are 1%, 0%, and 0%, respectively.
Annual Report
$10,000 Over Life of Fund
Let's say hypothetically that $10,000 was invested in Fidelity Advisor® Emerging Europe, Middle East, Africa (EMEA) Fund - Class A on May 8, 2008, when the fund started, and the current 5.75% sales charge was paid. The chart shows how the value of your investment would have changed, and also shows how the MSCI EM (Emerging Markets) Europe, Middle East and Africa Index performed over the same period.
Annual Report
Market Recap: Global equities posted a healthy gain for the 12 months ending October 31, 2014, overcoming an October market decline driven by recessionary pressures in China and tepid growth in Europe. The MSCI ACWI (All Country World Index) Index rose 8.15%, helped by subdued market volatility for much of the period and supported by solid corporate earnings, especially in the United States. Stocks also benefited from easy monetary policies in Japan and the eurozone, as well as increased stimulus efforts in China. All but three of the 24 industry groups that compose the index marked a positive return. The U.S. (+17%) remained a pillar of strength, while a strongly rising dollar in the latter part of the period detracted from investors' returns in most non-U.S. markets. Canada (+5%) notched broad gains outside of its energy and materials sectors, as did Asia-Pacific ex Japan (+4%), led by investor enthusiasm for companies in India. The U.K., Europe and Japan, meanwhile, all underperformed. Among sectors, health care (+24%) led the index, with a strong contribution from the pharmaceuticals, biotechnology & life sciences industry. Information technology (+21%) also outperformed. Conversely, materials (-4%) and energy (-1%) lagged the index due to a higher supply of and lower demand for commodities.
Comments from Adam Kutas, Portfolio Manager of Fidelity Advisor® Emerging Europe, Middle East, Africa (EMEA) Fund: For the year, the fund's Class A, Class T, Class B and Class C shares returned -3.48%, -3.67%, -4.23% and -4.24%, respectively (excluding sales charges), outperforming the -8.16% return of the MSCI EM (Emerging Market) Europe, Middle East and Africa Index. Security selection in financials and telecommunications services helped the fund's relative performance, with the top two contributors being an out-of-benchmark position in HSBC Bank and good timing with Dubai Financial Market. HSBC served as a counterparty for investments in consumer staples companies in Saudi Arabia, a country that doesn't allow foreign investment in Saudi firms. My strategy focused on overweighting investments in countries that I call "free riders," which aren't tied to other economies but have benefited from the global decline in the cost of capital. I favored "free riders" over countries and companies tied to growth in China or those closely aligned with "anchor" countries, meaning developed countries like the United States or those in the European Union. I underweighted resources-heavy Russia and South Africa. Conversely, stock selection in materials hurt relative performance, with the biggest individual detractor being an investment in South African gold producer AngloGold Ashanti.
Note to shareholders: The fund may invest up to 35% of its total assets in any industry that represents more than 20% of the emerging Europe, Middle East and Africa markets. As of October 31, 2014, the fund did not have more than 25% of its total assets in any one industry.
The views expressed above reflect those of the portfolio manager(s) only through the end of the period as stated on the cover of this report and do not necessarily represent the views of Fidelity or any other person in the Fidelity organization. Any such views are subject to change at any time based upon market or other conditions and Fidelity disclaims any responsibility to update such views. These views may not be relied on as investment advice and, because investment decisions for a Fidelity fund are based on numerous factors, may not be relied on as an indication of trading intent on behalf of any Fidelity fund.
Annual Report
Shareholder Expense Example
As a shareholder of the Fund, you incur two types of costs: (1) transaction costs, including sales charges (loads) on purchase payments or redemption proceeds, redemption fees and (2) ongoing costs, including management fees, distribution and/or service (12b-1) fees and other Fund expenses. This Example is intended to help you understand your ongoing costs (in dollars) of investing in the Fund and to compare these costs with the ongoing costs of investing in other mutual funds.
The Example is based on an investment of $1,000 invested at the beginning of the period and held for the entire period (May 1, 2014 to October 31, 2014).
Actual Expenses
The first line of the accompanying table for each class of the Fund provides information about actual account values and actual expenses. You may use the information in this line, together with the amount you invested, to estimate the expenses that you paid over the period. Simply divide your account value by $1,000.00 (for example, an $8,600 account value divided by $1,000.00 = 8.6), then multiply the result by the number in the first line for a class of the Fund under the heading entitled "Expenses Paid During Period" to estimate the expenses you paid on your account during this period. A small balance maintenance fee of $12.00 that is charged once a year may apply for certain accounts with a value of less than $2,000. This fee is not included in the table below. If it was, the estimate of expenses you paid during the period would be higher, and your ending account value lower, by this amount. In addition, the Fund, as a shareholder in the underlying Fidelity Central Funds, will indirectly bear its pro-rata share of the fees and expenses incurred by the underlying Fidelity Central Funds. These fees and expenses are not included in the Fund's annualized expense ratio used to calculate the expense estimate in the table below.
Hypothetical Example for Comparison Purposes
The second line of the accompanying table for each class of the Fund provides information about hypothetical account values and hypothetical expenses based on a Class' actual expense ratio and an assumed rate of return of 5% per year before expenses, which is not the Class' actual return. The hypothetical account values and expenses may not be used to estimate the actual ending account balance or expenses you paid for the period. You may use this information to compare the ongoing costs of investing in the Fund and other funds. To do so, compare this 5% hypothetical example with the 5% hypothetical examples that appear in the shareholder reports of the other funds. A small balance maintenance fee of $12.00 that is charged once a year may apply for certain accounts with a value of less than $2,000. This fee is not included in the table below. If it was, the estimate of expenses you paid during the period would be higher, and your ending account value lower, by this amount. In addition, the Fund, as a shareholder in the underlying Fidelity Central Funds, will indirectly bear its pro-rata share of the fees and expenses incurred by the underlying Fidelity Central Funds. These fees and expenses are not included in the Fund's annualized expense ratio used to calculate the expense estimate in the table below.
Please note that the expenses shown in the table are meant to highlight your ongoing costs only and do not reflect any transaction costs. Therefore, the second line of the table is useful in comparing ongoing costs only, and will not help you determine the relative total costs of owning different funds. In addition, if these transactional costs were included, your costs would have been higher.
Annual Report
| Annualized
Expense Ratio B | Beginning
Account Value
May 1, 2014 | Ending
Account Value
October 31, 2014 | Expenses Paid
During Period*
May 1, 2014
to October 31, 2014 |
Class A | 1.54% | | | |
Actual | | $ 1,000.00 | $ 997.80 | $ 7.75 |
HypotheticalA | | $ 1,000.00 | $ 1,017.44 | $ 7.83 |
Class T | 1.90% | | | |
Actual | | $ 1,000.00 | $ 996.70 | $ 9.56 |
HypotheticalA | | $ 1,000.00 | $ 1,015.63 | $ 9.65 |
Class B | 2.38% | | | |
Actual | | $ 1,000.00 | $ 994.50 | $ 11.96 |
HypotheticalA | | $ 1,000.00 | $ 1,013.21 | $ 12.08 |
Class C | 2.40% | | | |
Actual | | $ 1,000.00 | $ 994.40 | $ 12.06 |
HypotheticalA | | $ 1,000.00 | $ 1,013.11 | $ 12.18 |
Emerging Europe, Middle East, Africa (EMEA) | 1.34% | | | |
Actual | | $ 1,000.00 | $ 1,000.00 | $ 6.76 |
HypotheticalA | | $ 1,000.00 | $ 1,018.45 | $ 6.82 |
Institutional Class | 1.16% | | | |
Actual | | $ 1,000.00 | $ 1,000.00 | $ 5.85 |
HypotheticalA | | $ 1,000.00 | $ 1,019.36 | $ 5.90 |
A 5% return per year before expenses
B Annualized expense ratio reflects expenses net of applicable fee waivers.
* Expenses are equal to each Class' annualized expense ratio, multiplied by the average account value over the period, multiplied by 184/365 (to reflect the one-half year period).
Annual Report
Investment Changes (Unaudited)
Geographic Diversification (% of fund's net assets) |
As of October 31, 2014 |
 | South Africa 43.1% | |
 | Russia 20.1% | |
 | Turkey 5.5% | |
 | Poland 5.1% | |
 | United Arab Emirates 4.6% | |
 | United Kingdom 4.0% | |
 | Qatar 3.0% | |
 | Romania 1.9% | |
 | Greece 1.6% | |
 | Other* 11.1% | |

* Includes Short-Term Investments and Net Other Assets (Liabilities). |
Percentages are based on country or territory of incorporation and are adjusted for the effect of futures contracts, if applicable. |
As of April 30, 2014 |
| South Africa 39.1% | |
| Russia 21.1% | |
| Poland 6.6% | |
| United Arab Emirates 5.2% | |
| United Kingdom 4.4% | |
| Qatar 2.5% | |
| United States of America* 2.3% | |
| Czech Republic 2.3% | |
| Turkey 2.3% | |
| Other 14.2% | |

* Includes Short-Term Investments and Net Other Assets (Liabilities). |
Percentages are based on country or territory of incorporation and are adjusted for the effect of futures contracts, if applicable. |
Asset Allocation as of October 31, 2014 |
| % of fund's
net assets | % of fund's net assets
6 months ago |
Stocks | 99.9 | 97.7 |
Short-Term Investments and Net Other Assets (Liabilities) | 0.1 | 2.3 |
Top Ten Stocks as of October 31, 2014 |
| % of fund's
net assets | % of fund's net assets
6 months ago |
MTN Group Ltd. (South Africa, Wireless Telecommunication Services) | 7.4 | 6.2 |
Naspers Ltd. Class N (South Africa, Media) | 5.8 | 4.4 |
Gazprom OAO sponsored ADR (Reg. S) (Russia, Oil, Gas & Consumable Fuels) | 5.3 | 5.1 |
LUKOIL Oil Co. (Russia, Oil, Gas & Consumable Fuels) | 4.3 | 4.3 |
Sasol Ltd. (South Africa, Oil, Gas & Consumable Fuels) | 3.8 | 3.4 |
Sberbank (Savings Bank of the Russian Federation) (Russia, Banks) | 3.1 | 3.6 |
FirstRand Ltd. (South Africa, Diversified Financial Services) | 2.7 | 2.2 |
Remgro Ltd. (South Africa, Diversified Financial Services) | 2.6 | 2.2 |
Bank Polska Kasa Opieki SA (Poland, Banks) | 2.6 | 3.1 |
Standard Bank Group Ltd. (South Africa, Banks) | 2.5 | 2.5 |
| 40.1 | |
Market Sectors as of October 31, 2014 |
| % of fund's
net assets | % of fund's net assets
6 months ago |
Financials | 36.4 | 36.7 |
Energy | 18.5 | 18.7 |
Consumer Discretionary | 12.6 | 9.6 |
Telecommunication Services | 10.1 | 10.8 |
Consumer Staples | 9.1 | 8.4 |
Materials | 6.2 | 8.1 |
Health Care | 3.5 | 2.6 |
Industrials | 3.2 | 2.5 |
Information Technology | 0.3 | 0.3 |
Annual Report
Investments October 31, 2014
Showing Percentage of Net Assets
Common Stocks - 96.3% |
| Shares | | Value |
Austria - 0.5% |
CA Immobilien Anlagen AG | 31,700 | | $ 606,797 |
Bermuda - 0.4% |
Aquarius Platinum Ltd. (a) | 1,967,700 | | 522,710 |
Botswana - 0.3% |
First National Bank of Botswana Ltd. | 814,358 | | 319,114 |
Canada - 0.2% |
Africa Oil Corp. (a) | 86,600 | | 275,848 |
Croatia - 0.3% |
Ledo d.d. | 263 | | 361,058 |
Czech Republic - 1.5% |
Komercni Banka A/S | 8,305 | | 1,778,933 |
Estonia - 0.4% |
Tallinna Kaubamaja AS | 70,900 | | 444,242 |
Greece - 1.6% |
Fourlis Holdings SA (a) | 130,500 | | 513,503 |
Jumbo SA | 53,036 | | 581,543 |
Karelia Tobacco Co., Inc. | 1,970 | | 481,398 |
Sarantis SA | 37,800 | | 331,583 |
TOTAL GREECE | | 1,908,027 |
Hungary - 0.3% |
FHB Land Credit & Mortgage Bank (a) | 138,000 | | 402,441 |
Kenya - 1.2% |
British American Tobacco Kenya Ltd. | 31,700 | | 371,399 |
Kenya Commercial Bank Ltd. | 756,500 | | 465,148 |
Safaricom Ltd. | 4,416,544 | | 602,368 |
TOTAL KENYA | | 1,438,915 |
Kuwait - 1.3% |
Gulf Bank (a) | 502,300 | | 588,498 |
Kuwait Food Co. (Americana) | 95,250 | | 1,010,924 |
TOTAL KUWAIT | | 1,599,422 |
Lithuania - 0.5% |
Apranga AB (a) | 163,766 | | 537,685 |
Luxembourg - 0.5% |
Pegas NONWOVENS SA | 20,400 | | 583,544 |
Common Stocks - continued |
| Shares | | Value |
Nigeria - 0.9% |
FBN Holdings PLC | 6,000,000 | | $ 419,439 |
Zenith Bank PLC | 5,284,656 | | 676,334 |
TOTAL NIGERIA | | 1,095,773 |
Oman - 1.0% |
BankMuscat SAOG (a) | 145,000 | | 265,143 |
National Bank of Oman (a) | 945,224 | | 893,666 |
TOTAL OMAN | | 1,158,809 |
Pakistan - 1.3% |
Indus Motor Co. Ltd. | 47,000 | | 373,522 |
Pak Suzuki Motors | 247,200 | | 819,695 |
United Bank Ltd. | 190,000 | | 363,436 |
TOTAL PAKISTAN | | 1,556,653 |
Poland - 5.1% |
Bank Handlowy w Warszawie SA | 62,000 | | 2,094,085 |
Bank Polska Kasa Opieki SA | 58,600 | | 3,062,790 |
Orbis SA | 40,000 | | 435,818 |
Powszechny Zaklad Ubezpieczen SA | 3,500 | | 524,590 |
TOTAL POLAND | | 6,117,283 |
Qatar - 3.0% |
Al Meera Consumer Goods Co. (a) | 7,996 | | 407,974 |
Commercial Bank of Qatar (a) | 66,748 | | 1,354,554 |
Qatar National Bank SAQ (a) | 30,850 | | 1,815,478 |
TOTAL QATAR | | 3,578,006 |
Romania - 1.9% |
Banca Transilvania SA (a) | 1,751,868 | | 897,500 |
Bursa de Valori Bucuresti (a) | 73,404 | | 619,461 |
SNP Petrom SA | 5,839,899 | | 726,803 |
TOTAL ROMANIA | | 2,243,764 |
Russia - 16.5% |
Gazprom OAO sponsored ADR (Reg. S) | 948,200 | | 6,284,670 |
LUKOIL Oil Co. | 8,300 | | 409,112 |
LUKOIL Oil Co. sponsored ADR (United Kingdom) | 96,695 | | 4,747,725 |
Magnit OJSC (a) | 6,800 | | 1,881,412 |
Megafon OJSC GDR | 38,800 | | 907,920 |
NOVATEK OAO GDR (Reg. S) | 8,325 | | 894,105 |
Common Stocks - continued |
| Shares | | Value |
Russia - continued |
Sberbank (Savings Bank of the Russian Federation) (a) | 2,109,500 | | $ 3,738,811 |
Vozrozhdenie Bank (a) | 90,200 | | 878,716 |
TOTAL RUSSIA | | 19,742,471 |
Slovenia - 0.4% |
Krka dd Novo mesto | 6,700 | | 528,955 |
South Africa - 43.1% |
AngloGold Ashanti Ltd. (a) | 191,000 | | 1,596,175 |
Ascendis Health Ltd. | 210,000 | | 313,198 |
Aspen Pharmacare Holdings Ltd. | 67,800 | | 2,418,480 |
Cashbuild Ltd. | 71,700 | | 1,007,593 |
Clicks Group Ltd. | 329,220 | | 2,241,612 |
DRDGOLD Ltd. | 3,820,214 | | 1,063,022 |
FirstRand Ltd. | 744,300 | | 3,185,109 |
Grand Parade Investments Ltd. (a) | 727,000 | | 468,639 |
Harmony Gold Mining Co. Ltd. (a) | 347,600 | | 561,510 |
Holdsport Ltd. | 165,400 | | 682,237 |
Hulamin Ltd. (a) | 896,200 | | 552,520 |
MTN Group Ltd. | 401,950 | | 8,891,935 |
Murray & Roberts Holdings Ltd. | 112,700 | | 231,434 |
Nampak Ltd. | 618,100 | | 2,520,089 |
Naspers Ltd. Class N | 56,300 | | 7,006,472 |
Pioneer Foods Ltd. | 152,200 | | 1,642,086 |
Raubex Group Ltd. | 599,600 | | 1,212,274 |
Remgro Ltd. | 134,000 | | 3,073,444 |
RMB Holdings Ltd. | 184,600 | | 1,024,444 |
Sasol Ltd. | 92,000 | | 4,594,042 |
Shoprite Holdings Ltd. | 120,100 | | 1,739,802 |
Standard Bank Group Ltd. | 239,363 | | 3,011,094 |
Telkom SA Ltd. (a) | 142,800 | | 758,165 |
Vodacom Group Ltd. | 77,200 | | 936,710 |
Zeder Investments Ltd. | 1,590,847 | | 836,548 |
TOTAL SOUTH AFRICA | | 51,568,634 |
Turkey - 5.5% |
Aselsan A/S | 219,000 | | 995,163 |
Brisa Bridgestone S.A.B. Las San | 197,000 | | 804,787 |
Gubre Fabrikalari TAS | 298,000 | | 564,452 |
Koc Holding A/S | 275,850 | | 1,408,633 |
Logo Yazilim Sanayi Ve Ticar (a) | 32,328 | | 379,619 |
Common Stocks - continued |
| Shares | | Value |
Turkey - continued |
Pinar Sut Mamulleri Sanayi A/S | 42,000 | | $ 404,382 |
Turkiye Garanti Bankasi A/S | 505,000 | | 1,970,961 |
TOTAL TURKEY | | 6,527,997 |
United Arab Emirates - 4.6% |
Agthia Group PJSC | 300,000 | | 537,435 |
Aldar Properties PJSC (a) | 1,409,585 | | 1,228,062 |
Emaar Properties PJSC (a) | 437,227 | | 1,190,381 |
First Gulf Bank PJSC | 270,138 | | 1,334,877 |
SHUAA Capital PSC (a) | 4,749,942 | | 1,269,927 |
TOTAL UNITED ARAB EMIRATES | | 5,560,682 |
United Kingdom - 4.0% |
Abdullah Al Othaim Markets Co. ELS (HSBC Warrant Program) warrants 7/31/17 (a)(c) | 14,236 | | 412,765 |
Al Noor Hospitals Group PLC | 30,100 | | 490,658 |
Alabama Khaleej Training & Education ELS (HSBC Bank Warrant Program) warrants 7/18/16 (a)(c) | 12,900 | | 230,544 |
Aldrees Petroleum & Transport ELS (HSBC Warrant Program) warrants 2/7/17 (a)(c) | 40,399 | | 581,905 |
Fawaz Abdulaziz Alhokair & Co. ELS (HSBC Warrant Program) warrants 2/23/15 (a)(c) | 10,300 | | 320,853 |
Halwani Bros. Co. ELS (HSBC Warrant Program) warrants 5/4/15 (a)(c) | 11,262 | | 236,392 |
NMC Health PLC | 68,700 | | 544,002 |
Saudi Vitrified Clay Pipe Co. ELS (HSBC Warrant Program) warrants 5/4/15 (a)(c) | 12,000 | | 333,892 |
Saudia Dairy & Foodstuff Co. ELS (HSBC Warrant Program) warrants 6/26/15 (a)(c) | 19,000 | | 617,845 |
The Savola Group ELS (HSBC Warrant Program) warrants 2/2/15 (a)(c) | 19,000 | | 432,542 |
United International Transportation Co. ELS (HSBC Warrant Program) warrants 2/23/15 (a)(c) | 30,667 | | 605,043 |
TOTAL UNITED KINGDOM | | 4,806,441 |
TOTAL COMMON STOCKS (Cost $105,022,785) |
115,264,204
|
Nonconvertible Preferred Stocks - 3.6% |
| Shares | | Value |
Russia - 3.6% |
Surgutneftegas (a) | 3,820,100 | | $ 2,619,698 |
Tatneft OAO (a) | 505,500 | | 1,695,960 |
TOTAL NONCONVERTIBLE PREFERRED STOCKS (Cost $3,855,159) |
4,315,658
|
Money Market Funds - 0.3% |
| | | |
Fidelity Cash Central Fund, 0.11% (b)
(Cost $309,902) | 309,902 | |
309,902
|
TOTAL INVESTMENT PORTFOLIO - 100.2% (Cost $109,187,846) | | 119,889,764 |
NET OTHER ASSETS (LIABILITIES) - (0.2)% | | (200,037) |
NET ASSETS - 100% | $ 119,689,727 |
Security Type Abbreviations |
ELS | - | Equity-Linked Security |
Legend |
(a) Non-income producing |
(b) Affiliated fund that is generally available only to investment companies and other accounts managed by Fidelity Investments. The rate quoted is the annualized seven-day yield of the fund at period end. A complete unaudited listing of the fund's holdings as of its most recent quarter end is available upon request. In addition, each Fidelity Central Fund's financial statements, which are not covered by the Fund's Report of Independent Registered Public Accounting Firm, are available on the SEC's website or upon request. |
(c) Security exempt from registration under Rule 144A of the Securities Act of 1933. These securities may be resold in transactions exempt from registration, normally to qualified institutional buyers. At the end of the period, the value of these securities amounted to $3,771,781, or 3.2% of net assets. |
Affiliated Central Funds |
Information regarding fiscal year to date income earned by the Fund from investments in Fidelity Central Funds is as follows: |
Fund | Income earned |
Fidelity Cash Central Fund | $ 1,968 |
Fidelity Securities Lending Cash Central Fund | 5,426 |
Total | $ 7,394 |
Other Information |
Categorizations in the Schedule of Investments are based on country or territory of incorporation. |
The following is a summary of the inputs used, as of October 31, 2014, involving the Fund's assets and liabilities carried at fair value. The inputs or methodology used for valuing securities may not be an indication of the risk associated with investing in those securities. For more information on valuation inputs, and their aggregation into the levels used in the table below, please refer to the Investment Valuation section in the accompanying Notes to Financial Statements. |
Valuation Inputs at Reporting Date: |
Description | Total | Level 1 | Level 2 | Level 3 |
Investments in Securities: | | | | |
Equities: | | | | |
Consumer Discretionary | $ 14,825,962 | $ 13,815,038 | $ - | $ 1,010,924 |
Consumer Staples | 10,844,383 | 10,844,383 | - | - |
Energy | 22,247,963 | 17,653,921 | 4,594,042 | - |
Financials | 43,661,562 | 37,918,820 | 5,742,742 | - |
Health Care | 4,295,293 | 4,295,293 | - | - |
Industrials | 3,847,504 | 3,847,504 | - | - |
Information Technology | 379,619 | 379,619 | - | - |
Materials | 7,380,478 | 4,159,771 | 3,220,707 | - |
Telecommunication Services | 12,097,098 | 12,097,098 | - | - |
Money Market Funds | 309,902 | 309,902 | - | - |
Total Investments in Securities: | $ 119,889,764 | $ 105,321,349 | $ 13,557,491 | $ 1,010,924 |
The following is a summary of transfers between Level 1 and Level 2 for the period ended October 31, 2014. Transfers are assumed to have occurred at the beginning of the period, and are primarily attributable to the valuation techniques used for foreign equity securities, as discussed in the accompanying Notes to Financial Statements: |
Transfers | Total |
Level 1 to Level 2 | $ 1,965,445 |
Level 2 to Level 1 | $ 0 |
See accompanying notes which are an integral part of the financial statements.
Annual Report
Statement of Assets and Liabilities
| October 31, 2014 |
| | |
Assets | | |
Investment in securities, at value - See accompanying schedule: Unaffiliated issuers (cost $108,877,944) | $ 119,579,862 | |
Fidelity Central Funds (cost $309,902) | 309,902 | |
Total Investments (cost $109,187,846) | | $ 119,889,764 |
Foreign currency held at value (cost $4) | | 3 |
Receivable for investments sold | | 126,670 |
Receivable for fund shares sold | | 99,736 |
Dividends receivable | | 109,030 |
Distributions receivable from Fidelity Central Funds | | 159 |
Prepaid expenses | | 310 |
Receivable from investment adviser for expense reductions | | 11 |
Other receivables | | 3 |
Total assets | | 120,225,686 |
| | |
Liabilities | | |
Payable for investments purchased | $ 141,325 | |
Payable for fund shares redeemed | 102,074 | |
Accrued management fee | 79,618 | |
Transfer agent fee payable | 28,392 | |
Distribution and service plan fees payable | 8,448 | |
Other affiliated payables | 5,157 | |
Custody fee payable | 53,865 | |
Audit fee payable | 44,097 | |
Other payables and accrued expenses | 72,983 | |
Total liabilities | | 535,959 |
| | |
Net Assets | | $ 119,689,727 |
Net Assets consist of: | | |
Paid in capital | | $ 113,793,553 |
Undistributed net investment income | | 1,899,047 |
Accumulated undistributed net realized gain (loss) on investments and foreign currency transactions | | (6,642,175) |
Net unrealized appreciation (depreciation) on investments and assets and liabilities in foreign currencies | | 10,639,302 |
Net Assets | | $ 119,689,727 |
See accompanying notes which are an integral part of the financial statements.
Annual Report
Statement of Assets and Liabilities - continued
| October 31, 2014 |
| | |
Calculation of Maximum Offering Price Class A:
Net Asset Value and redemption price per share ($7,888,563 ÷ 872,420 shares) | | $ 9.04 |
| | |
Maximum offering price per share (100/94.25 of $9.04) | | $ 9.59 |
Class T:
Net Asset Value and redemption price per share ($2,465,386 ÷ 273,748 shares) | | $ 9.01 |
| | |
Maximum offering price per share (100/96.50 of $9.01) | | $ 9.34 |
Class B:
Net Asset Value and offering price per share ($294,400 ÷ 32,537 shares)A | | $ 9.05 |
| | |
Class C:
Net Asset Value and offering price per share ($6,661,556 ÷ 745,824 shares)A | | $ 8.93 |
| | |
Emerging Europe, Middle East, Africa (EMEA):
Net Asset Value, offering price and redemption price per share ($96,783,557 ÷ 10,660,010 shares) | | $ 9.08 |
| | |
Institutional Class:
Net Asset Value, offering price and redemption price per share ($5,596,265 ÷ 616,521 shares) | | $ 9.08 |
A Redemption price per share is equal to net asset value less any applicable contingent deferred sales charge.
See accompanying notes which are an integral part of the financial statements.
Annual Report
Financial Statements - continued
Statement of Operations
| Year ended October 31, 2014 |
| | |
Investment Income | | |
Dividends | | $ 4,542,500 |
Income from Fidelity Central Funds | | 7,394 |
Income before foreign taxes withheld | | 4,549,894 |
Less foreign taxes withheld | | (564,289) |
Total income | | 3,985,605 |
| | |
Expenses | | |
Management fee | $ 1,047,346 | |
Transfer agent fees | 354,075 | |
Distribution and service plan fees | 107,916 | |
Accounting and security lending fees | 67,810 | |
Custodian fees and expenses | 166,959 | |
Independent trustees' compensation | 543 | |
Registration fees | 79,271 | |
Audit | 64,358 | |
Legal | 481 | |
Miscellaneous | 1,160 | |
Total expenses before reductions | 1,889,919 | |
Expense reductions | (1,916) | 1,888,003 |
Net investment income (loss) | | 2,097,602 |
Realized and Unrealized Gain (Loss) Net realized gain (loss) on: | | |
Investment securities: | | |
Unaffiliated issuers (net of foreign taxes of $55,716) | (4,138,146) | |
Foreign currency transactions | (96,262) | |
Total net realized gain (loss) | | (4,234,408) |
Change in net unrealized appreciation (depreciation) on: Investment securities (net of increase in deferred foreign taxes of $62,368) | (2,799,835) | |
Assets and liabilities in foreign currencies | (11,085) | |
Total change in net unrealized appreciation (depreciation) | | (2,810,920) |
Net gain (loss) | | (7,045,328) |
Net increase (decrease) in net assets resulting from operations | | $ (4,947,726) |
See accompanying notes which are an integral part of the financial statements.
Annual Report
Statement of Changes in Net Assets
| Year ended
October 31,
2014 | Year ended
October 31,
2013 |
Increase (Decrease) in Net Assets | | |
Operations | | |
Net investment income (loss) | $ 2,097,602 | $ 2,849,848 |
Net realized gain (loss) | (4,234,408) | 425,876 |
Change in net unrealized appreciation (depreciation) | (2,810,920) | 11,151,522 |
Net increase (decrease) in net assets resulting from operations | (4,947,726) | 14,427,246 |
Distributions to shareholders from net investment income | (1,921,556) | (2,689,985) |
Distributions to shareholders from net realized gain | - | (1,184,624) |
Total distributions | (1,921,556) | (3,874,609) |
Share transactions - net increase (decrease) | (15,497,892) | (9,097,663) |
Redemption fees | 42,040 | 52,524 |
Total increase (decrease) in net assets | (22,325,134) | 1,507,498 |
| | |
Net Assets | | |
Beginning of period | 142,014,861 | 140,507,363 |
End of period (including undistributed net investment income of $1,899,047 and undistributed net investment income of $1,897,738, respectively) | $ 119,689,727 | $ 142,014,861 |
See accompanying notes which are an integral part of the financial statements.
Annual Report
Financial Highlights - Class A
Years ended October 31, | 2014 | 2013 | 2012 | 2011 | 2010 |
Selected Per-Share Data | | | | | |
Net asset value, beginning of period | $ 9.49 | $ 8.71 | $ 8.34 | $ 8.97 | $ 7.26 |
Income from Investment Operations | | | | | |
Net investment income (loss) C | .13 | .16 | .18 | .16F | .07 |
Net realized and unrealized gain (loss) | (.46) | .85 | .34 | (.70) | 1.70 |
Total from investment operations | (.33) | 1.01 | .52 | (.54) | 1.77 |
Distributions from net investment income | (.12) | (.15) | (.15) | (.08) | (.04) |
Distributions from net realized gain | - | (.07) | - | (.02) | (.02) |
Total distributions | (.12) | (.23) I | (.15) | (.10) | (.07) J |
Redemption fees added to paid in capital C | - H | - H | - H | .01 | .01 |
Net asset value, end of period | $ 9.04 | $ 9.49 | $ 8.71 | $ 8.34 | $ 8.97 |
Total ReturnA, B | (3.48)% | 11.75% | 6.38% | (6.05)% | 24.66% |
Ratios to Average Net Assets D, G | | | | | |
Expenses before reductions | 1.60% | 1.64% | 1.62% | 1.60% | 1.69% |
Expenses net of fee waivers, if any | 1.60% | 1.63% | 1.62% | 1.56% | 1.50% |
Expenses net of all reductions | 1.60% | 1.62% | 1.60% | 1.51% | 1.38% |
Net investment income (loss) | 1.45% | 1.82% | 2.09% | 1.70% F | .95% |
Supplemental Data | | | | | |
Net assets, end of period (000 omitted) | $ 7,889 | $ 10,883 | $ 8,934 | $ 10,260 | $ 10,045 |
Portfolio turnover rateE | 38% | 64% | 30% | 53% | 96% |
A Total returns would have been lower if certain expenses had not been reduced during the applicable periods shown.
B Total returns do not include the effect of the sales charges.
C Calculated based on average shares outstanding during the period.
D Fees and expenses of any underlying Fidelity Central Funds are not included in the Fund's expense ratio. The Fund indirectly bears its proportionate share of the expenses of any underlying Fidelity Central Funds.
E Amount does not include the portfolio activity of any underlying Fidelity Central Funds.
F Investment income per share reflects a large, non-recurring dividend which amounted to $.04 per share. Excluding this non-recurring dividend, the ratio of net investment income (loss) to average net assets would have been 1.25%.
G Expense ratios reflect operating expenses of the class. Expenses before reductions do not reflect amounts reimbursed by the investment adviser or reductions from brokerage service arrangements or reductions from other expense offset arrangements and do not represent the amount paid by the class during periods when reimbursements or reductions occur. Expenses net of fee waivers reflect expenses after reimbursement by the investment adviser but prior to reductions from brokerage service arrangements or other expense offset arrangements. Expenses net of all reductions represent the net expenses paid by the class.
H Amount represents less than $.01 per share.
I Total distributions of $.23 per share is comprised of distributions from net investment income of $.151 and distributions from net realized gain of $.074 per share.
J Total distributions of $.07 per share is comprised of distributions from net investment income of $.041 and distributions from net realized gain of $.024 per share.
See accompanying notes which are an integral part of the financial statements.
Annual Report
Financial Highlights - Class T
Years ended October 31, | 2014 | 2013 | 2012 | 2011 | 2010 |
Selected Per-Share Data | | | | | |
Net asset value, beginning of period | $ 9.46 | $ 8.68 | $ 8.31 | $ 8.96 | $ 7.25 |
Income from Investment Operations | | | | | |
Net investment income (loss) C | .11 | .14 | .15 | .13F | .06 |
Net realized and unrealized gain (loss) | (.46) | .84 | .35 | (.71) | 1.69 |
Total from investment operations | (.35) | .98 | .50 | (.58) | 1.75 |
Distributions from net investment income | (.10) | (.12) | (.13) | (.07) | (.03) |
Distributions from net realized gain | - | (.07) | - | (.02) | (.02) |
Total distributions | (.10) | (.20) I | (.13) | (.08) J | (.05) |
Redemption fees added to paid in capital C | - H | - H | - H | .01 | .01 |
Net asset value, end of period | $ 9.01 | $ 9.46 | $ 8.68 | $ 8.31 | $ 8.96 |
Total ReturnA, B | (3.67)% | 11.42% | 6.14% | (6.42)% | 24.44% |
Ratios to Average Net Assets D, G | | | | | |
Expenses before reductions | 1.92% | 1.93% | 1.89% | 1.87% | 1.95% |
Expenses net of fee waivers, if any | 1.90% | 1.90% | 1.89% | 1.84% | 1.75% |
Expenses net of all reductions | 1.90% | 1.88% | 1.86% | 1.78% | 1.62% |
Net investment income (loss) | 1.15% | 1.55% | 1.82% | 1.42% F | .70% |
Supplemental Data | | | | | |
Net assets, end of period (000 omitted) | $ 2,465 | $ 3,465 | $ 3,336 | $ 3,502 | $ 3,114 |
Portfolio turnover rateE | 38% | 64% | 30% | 53% | 96% |
A Total returns would have been lower if certain expenses had not been reduced during the applicable periods shown.
B Total returns do not include the effect of the sales charges.
C Calculated based on average shares outstanding during the period.
D Fees and expenses of any underlying Fidelity Central Funds are not included in the Fund's expense ratio. The Fund indirectly bears its proportionate share of the expenses of any underlying Fidelity Central Funds.
E Amount does not include the portfolio activity of any underlying Fidelity Central Funds.
F Investment income per share reflects a large, non-recurring dividend which amounted to $.04 per share. Excluding this non-recurring dividend, the ratio of net investment income (loss) to average net assets would have been .98%.
G Expense ratios reflect operating expenses of the class. Expenses before reductions do not reflect amounts reimbursed by the investment adviser or reductions from brokerage service arrangements or reductions from other expense offset arrangements and do not represent the amount paid by the class during periods when reimbursements or reductions occur. Expenses net of fee waivers reflect expenses after reimbursement by the investment adviser but prior to reductions from brokerage service arrangements or other expense offset arrangements. Expenses net of all reductions represent the net expenses paid by the class.
H Amount represents less than $.01 per share.
I Total distributions of $.20 per share is comprised of distributions from net investment income of $.122 and distributions from net realized gain of $.074 per share.
J Total distributions of $.08 per share is comprised of distributions from net investment income of $.068 and distributions from net realized gain of $.015 per share.
See accompanying notes which are an integral part of the financial statements.
Annual Report
Financial Highlights - Class B
Years ended October 31, | 2014 | 2013 | 2012 | 2011 | 2010 |
Selected Per-Share Data | | | | | |
Net asset value, beginning of period | $ 9.50 | $ 8.69 | $ 8.29 | $ 8.93 | $ 7.23 |
Income from Investment Operations | | | | | |
Net investment income (loss) C | .06 | .09 | .11 | .09F | .02 |
Net realized and unrealized gain (loss) | (.46) | .85 | .35 | (.71) | 1.68 |
Total from investment operations | (.40) | .94 | .46 | (.62) | 1.70 |
Distributions from net investment income | (.05) | (.06) | (.06) | (.02) | - |
Distributions from net realized gain | - | (.07) | - | (.01) | (.01) |
Total distributions | (.05) | (.13) | (.06) | (.03) | (.01) |
Redemption fees added to paid in capital C | - H | - H | - H | .01 | .01 |
Net asset value, end of period | $ 9.05 | $ 9.50 | $ 8.69 | $ 8.29 | $ 8.93 |
Total ReturnA, B | (4.23)% | 10.94% | 5.56% | (6.85)% | 23.72% |
Ratios to Average Net Assets D, G | | | | | |
Expenses before reductions | 2.40% | 2.42% | 2.38% | 2.37% | 2.47% |
Expenses net of fee waivers, if any | 2.40% | 2.40% | 2.38% | 2.33% | 2.25% |
Expenses net of all reductions | 2.40% | 2.38% | 2.35% | 2.27% | 2.12% |
Net investment income (loss) | .65% | 1.05% | 1.33% | .93% F | .20% |
Supplemental Data | | | | | |
Net assets, end of period (000 omitted) | $ 294 | $ 388 | $ 441 | $ 539 | $ 822 |
Portfolio turnover rateE | 38% | 64% | 30% | 53% | 96% |
A Total returns would have been lower if certain expenses had not been reduced during the applicable periods shown.
B Total returns do not include the effect of the contingent deferred sales charge.
C Calculated based on average shares outstanding during the period.
D Fees and expenses of any underlying Fidelity Central Funds are not included in the Fund's expense ratio. The Fund indirectly bears its proportionate share of the expenses of any underlying Fidelity Central Funds.
E Amount does not include the portfolio activity of any underlying Fidelity Central Funds.
F Investment income per share reflects a large, non-recurring dividend which amounted to $.04 per share. Excluding this non-recurring dividend, the ratio of net investment income (loss) to average net assets would have been .49%.
G Expense ratios reflect operating expenses of the class. Expenses before reductions do not reflect amounts reimbursed by the investment adviser or reductions from brokerage service arrangements or reductions from other expense offset arrangements and do not represent the amount paid by the class during periods when reimbursements or reductions occur. Expenses net of fee waivers reflect expenses after reimbursement by the investment adviser but prior to reductions from brokerage service arrangements or other expense offset arrangements. Expenses net of all reductions represent the net expenses paid by the class.
H Amount represents less than $.01 per share.
See accompanying notes which are an integral part of the financial statements.
Annual Report
Financial Highlights - Class C
Years ended October 31, | 2014 | 2013 | 2012 | 2011 | 2010 |
Selected Per-Share Data | | | | | |
Net asset value, beginning of period | $ 9.39 | $ 8.62 | $ 8.24 | $ 8.90 | $ 7.23 |
Income from Investment Operations | | | | | |
Net investment income (loss) C | .06 | .09 | .11 | .08F | .02 |
Net realized and unrealized gain (loss) | (.46) | .83 | .35 | (.69) | 1.67 |
Total from investment operations | (.40) | .92 | .46 | (.61) | 1.69 |
Distributions from net investment income | (.06) | (.08) | (.08) | (.05) | (.01) |
Distributions from net realized gain | - | (.07) | - | (.02) | (.02) |
Total distributions | (.06) | (.15) | (.08) | (.06) I | (.03) |
Redemption fees added to paid in capital C | - H | - H | - H | .01 | .01 |
Net asset value, end of period | $ 8.93 | $ 9.39 | $ 8.62 | $ 8.24 | $ 8.90 |
Total ReturnA, B | (4.24)% | 10.83% | 5.68% | (6.79)% | 23.61% |
Ratios to Average Net Assets D, G | | | | | |
Expenses before reductions | 2.40% | 2.42% | 2.37% | 2.36% | 2.45% |
Expenses net of fee waivers, if any | 2.40% | 2.40% | 2.37% | 2.33% | 2.25% |
Expenses net of all reductions | 2.40% | 2.38% | 2.35% | 2.27% | 2.13% |
Net investment income (loss) | .65% | 1.05% | 1.34% | .93% F | .20% |
Supplemental Data | | | | | |
Net assets, end of period (000 omitted) | $ 6,662 | $ 6,782 | $ 7,770 | $ 6,650 | $ 5,151 |
Portfolio turnover rateE | 38% | 64% | 30% | 53% | 96% |
A Total returns would have been lower if certain expenses had not been reduced during the applicable periods shown.
B Total returns do not include the effect of the contingent deferred sales charge.
C Calculated based on average shares outstanding during the period.
D Fees and expenses of any underlying Fidelity Central Funds are not included in the Fund's expense ratio. The Fund indirectly bears its proportionate share of the expenses of any underlying Fidelity Central Funds.
E Amount does not include the portfolio activity of any underlying Fidelity Central Funds.
F Investment income per share reflects a large, non-recurring dividend which amounted to $.04 per share. Excluding this non-recurring dividend, the ratio of net investment income (loss) to average net assets would have been .49%.
G Expense ratios reflect operating expenses of the class. Expenses before reductions do not reflect amounts reimbursed by the investment adviser or reductions from brokerage service arrangements or reductions from other expense offset arrangements and do not represent the amount paid by the class during periods when reimbursements or reductions occur. Expenses net of fee waivers reflect expenses after reimbursement by the investment adviser but prior to reductions from brokerage service arrangements or other expense offset arrangements. Expenses net of all reductions represent the net expenses paid by the class.
H Amount represents less than $.01 per share.
I Total distributions of $.06 per share is comprised of distributions from net investment income of $.047 and distributions from net realized gain of $.015 per share.
See accompanying notes which are an integral part of the financial statements.
Annual Report
Financial Highlights - Emerging Europe, Middle East, Africa (EMEA)
Years ended October 31, | 2014 | 2013 | 2012 | 2011 | 2010 |
Selected Per-Share Data | | | | | |
Net asset value, beginning of period | $ 9.52 | $ 8.75 | $ 8.37 | $ 9.00 | $ 7.28 |
Income from Investment Operations | | | | | |
Net investment income (loss) B | .16 | .18 | .20 | .18E | .09 |
Net realized and unrealized gain (loss) | (.47) | .84 | .35 | (.71) | 1.70 |
Total from investment operations | (.31) | 1.02 | .55 | (.53) | 1.79 |
Distributions from net investment income | (.13) | (.18) | (.17) | (.09) | (.05) |
Distributions from net realized gain | - | (.07) | - | (.02) | (.02) |
Total distributions | (.13) | (.25) | (.17) | (.11) | (.08) H |
Redemption fees added to paid in capital B | - G | - G | - G | .01 | .01 |
Net asset value, end of period | $ 9.08 | $ 9.52 | $ 8.75 | $ 8.37 | $ 9.00 |
Total ReturnA | (3.21)% | 11.90% | 6.81% | (5.91)% | 24.92% |
Ratios to Average Net Assets C, F | | | | | |
Expenses before reductions | 1.37% | 1.40% | 1.37% | 1.35% | 1.45% |
Expenses net of fee waivers, if any | 1.37% | 1.40% | 1.37% | 1.31% | 1.25% |
Expenses net of all reductions | 1.37% | 1.38% | 1.34% | 1.25% | 1.12% |
Net investment income (loss) | 1.68% | 2.05% | 2.34% | 1.95% E | 1.21% |
Supplemental Data | | | | | |
Net assets, end of period (000 omitted) | $ 96,784 | $ 110,265 | $ 111,441 | $ 114,117 | $ 140,270 |
Portfolio turnover rateD | 38% | 64% | 30% | 53% | 96% |
A Total returns would have been lower if certain expenses had not been reduced during the applicable periods shown.
B Calculated based on average shares outstanding during the period.
C Fees and expenses of any underlying Fidelity Central Funds are not included in the Fund's expense ratio. The Fund indirectly bears its proportionate share of the expenses of any underlying Fidelity Central Funds.
D Amount does not include the portfolio activity of any underlying Fidelity Central Funds.
E Investment income per share reflects a large, non-recurring dividend which amounted to $.04 per share. Excluding this non-recurring dividend, the ratio of net investment income (loss) to average net assets would have been 1.51%.
F Expense ratios reflect operating expenses of the class. Expenses before reductions do not reflect amounts reimbursed by the investment adviser or reductions from brokerage service arrangements or reductions from other expense offset arrangements and do not represent the amount paid by the class during periods when reimbursements or reductions occur. Expenses net of fee waivers reflect expenses after reimbursement by the investment adviser but prior to reductions from brokerage service arrangements or other expense offset arrangements. Expenses net of all reductions represent the net expenses paid by the class.
G Amount represents less than $.01 per share.
H Total distributions of $.08 per share is comprised of distributions from net investment income of $.052 and distributions from net realized gain of $.024 per share.
See accompanying notes which are an integral part of the financial statements.
Annual Report
Financial Highlights - Institutional Class
Years ended October 31, | 2014 | 2013 | 2012 | 2011 | 2010 |
Selected Per-Share Data | | | | | |
Net asset value, beginning of period | $ 9.52 | $ 8.75 | $ 8.37 | $ 9.00 | $ 7.28 |
Income from Investment Operations | | | | | |
Net investment income (loss) B | .16 | .19 | .21 | .19E | .09 |
Net realized and unrealized gain (loss) | (.46) | .84 | .35 | (.72) | 1.70 |
Total from investment operations | (.30) | 1.03 | .56 | (.53) | 1.79 |
Distributions from net investment income | (.14) | (.19) | (.18) | (.09) | (.05) |
Distributions from net realized gain | - | (.07) | - | (.02) | (.02) |
Total distributions | (.14) | (.26) | (.18) | (.11) | (.08) H |
Redemption fees added to paid in capital B | - G | - G | - G | .01 | .01 |
Net asset value, end of period | $ 9.08 | $ 9.52 | $ 8.75 | $ 8.37 | $ 9.00 |
Total ReturnA | (3.09)% | 12.05% | 6.93% | (5.91)% | 24.95% |
Ratios to Average Net Assets C, F | | | | | |
Expenses before reductions | 1.26% | 1.30% | 1.28% | 1.26% | 1.34% |
Expenses net of fee waivers, if any | 1.26% | 1.30% | 1.28% | 1.24% | 1.25% |
Expenses net of all reductions | 1.26% | 1.28% | 1.25% | 1.19% | 1.13% |
Net investment income (loss) | 1.79% | 2.15% | 2.43% | 2.02% E | 1.20% |
Supplemental Data | | | | | |
Net assets, end of period (000 omitted) | $ 5,596 | $ 10,231 | $ 8,586 | $ 7,633 | $ 7,171 |
Portfolio turnover rateD | 38% | 64% | 30% | 53% | 96% |
A Total returns would have been lower if certain expenses had not been reduced during the applicable periods shown.
B Calculated based on average shares outstanding during the period.
C Fees and expenses of any underlying Fidelity Central Funds are not included in the Fund's expense ratio. The Fund indirectly bears its proportionate share of the expenses of any underlying Fidelity Central Funds.
D Amount does not include the portfolio activity of any underlying Fidelity Central Funds.
E Investment income per share reflects a large, non-recurring dividend which amounted to $.04 per share. Excluding this non-recurring dividend, the ratio of net investment income (loss) to average net assets would have been 1.58%.
F Expense ratios reflect operating expenses of the class. Expenses before reductions do not reflect amounts reimbursed by the investment adviser or reductions from brokerage service arrangements or reductions from other expense offset arrangements and do not represent the amount paid by the class during periods when reimbursements or reductions occur. Expenses net of fee waivers reflect expenses after reimbursement by the investment adviser but prior to reductions from brokerage service arrangements or other expense offset arrangements. Expenses net of all reductions represent the net expenses paid by the class.
G Amount represents less than $.01 per share.
H Total distributions of $.08 per share is comprised of distributions from net investment income of $.054 and distributions from net realized gain of $.024 per share.
See accompanying notes which are an integral part of the financial statements.
Annual Report
Notes to Financial Statements
For the period ended October 31, 2014
1. Organization.
Fidelity Emerging Europe, Middle East, Africa (EMEA) Fund (the Fund) is a fund of Fidelity Investment Trust (the Trust) and is authorized to issue an unlimited number of shares. The Trust is registered under the Investment Company Act of 1940, as amended (the 1940 Act), as an open-end management investment company organized as a Massachusetts business trust. The Fund offers Class A, Class T, Class C, Emerging Europe, Middle East, Africa (EMEA) and Institutional Class, each of which, along with Class B shares, has equal rights as to assets and voting privileges. Class B shares are closed to new accounts and additional purchases, except for exchanges and reinvestments. Each class has exclusive voting rights with respect to matters that affect that class. Class B shares will automatically convert to Class A shares after a holding period of seven years from the initial date of purchase. The Fund's investments in emerging markets can be subject to social, economic, regulatory, and political uncertainties and can be extremely volatile.
2. Investments in Fidelity Central Funds.
The Fund invests in Fidelity Central Funds, which are open-end investment companies generally available only to other investment companies and accounts managed by the investment adviser and its affiliates. The Fund's Schedule of Investments lists each of the Fidelity Central Funds held as of period end, if any, as an investment of the Fund, but does not include the underlying holdings of each Fidelity Central Fund. As an Investing Fund, the Fund indirectly bears its proportionate share of the expenses of the underlying Fidelity Central Funds.
The Money Market Central Funds seek preservation of capital and current income and are managed by Fidelity Investments Money Management, Inc. (FIMM), an affiliate of the investment adviser. Annualized expenses of the Money Market Central Funds as of their most recent shareholder report date are less than .01%.
In addition, the financial statements of the Fidelity Central Funds are available on the SEC website or upon request.
3. Significant Accounting Policies.
The financial statements have been prepared in conformity with accounting principles generally accepted in the United States of America (GAAP), which require management to make certain estimates and assumptions at the date of the financial statements. Actual results could differ from those estimates. Subsequent events, if any, through the date that the financial statements were issued have been evaluated in the preparation of
Annual Report
Notes to Financial Statements - continued
3. Significant Accounting Policies - continued
the financial statements. The following summarizes the significant accounting policies of the Fund:
Investment Valuation. Investments are valued as of 4:00 p.m. Eastern time on the last calendar day of the period. In accordance with valuation policies and procedures approved by the Board of Trustees (the Board), the Fund attempts to obtain prices from one or more third party pricing vendors or brokers to value its investments. When current market prices, quotations or currency exchange rates are not readily available or reliable, investments will be fair valued in good faith by the Fidelity Management & Research Company (FMR) Fair Value Committee (the Committee), in accordance with procedures adopted by the Board. Factors used in determining fair value vary by investment type and may include market or investment specific events. The frequency with which these procedures are used cannot be predicted and they may be utilized to a significant extent. The Committee oversees the Fund's valuation policies and procedures and is responsible for approving and reporting to the Board all fair value determinations.
The Fund categorizes the inputs to valuation techniques used to value its investments into a disclosure hierarchy consisting of three levels as shown below:
Level 1 - quoted prices in active markets for identical investments
Level 2 - other significant observable inputs (including quoted prices for similar investments, interest rates, prepayment speeds, etc.)
Level 3 - unobservable inputs (including the Fund's own assumptions based on the best information available)
Valuation techniques used to value the Fund's investments by major category are as follows:
Equity securities, including restricted securities, for which market quotations are readily available, are valued at the last reported sale price or official closing price as reported by a third party pricing vendor on the primary market or exchange on which they are traded and are categorized as Level 1 in the hierarchy. In the event there were no sales during the day or closing prices are not available, securities are valued at the last quoted bid price or may be valued using the last available price and are generally categorized as Level 2 in the hierarchy. For foreign equity securities, when market or security specific events arise, comparisons to the valuation of American Depositary Receipts (ADRs), futures contracts, Exchange-Traded Funds (ETFs) and certain indexes as well as quoted prices for similar securities may be used and would be categorized as Level 2 in the hierarchy. Utilizing these techniques may result in transfers between Level 1 and Level 2. For equity securities, including restricted securities, where observable inputs are
Annual Report
3. Significant Accounting Policies - continued
Investment Valuation - continued
limited, assumptions about market activity and risk are used and these securities may be categorized as Level 3 in the hierarchy.
Investments in open-end mutual funds, including the Fidelity Central Funds, are valued at their closing net asset value (NAV) each business day and are categorized as Level 1 in the hierarchy.
Changes in valuation techniques may result in transfers in or out of an assigned level within the disclosure hierarchy. The aggregate value of investments by input level, as of October 31, 2014, including information on transfers between Levels 1 and 2, is included at the end of the Fund's Schedule of Investments.
Foreign Currency. The Fund may use foreign currency contracts to facilitate transactions in foreign-denominated securities. Gains and losses from these transactions may arise from changes in the value of the foreign currency or if the counterparties do not perform under the contracts' terms.
Foreign-denominated assets, including investment securities, and liabilities are translated into U.S. dollars at the exchange rates at period end. Purchases and sales of investment securities, income and dividends received and expenses denominated in foreign currencies are translated into U.S. dollars at the exchange rate in effect on the transaction date.
The effects of exchange rate fluctuations on investments are included with the net realized and unrealized gain (loss) on investment securities. Other foreign currency transactions resulting in realized and unrealized gain (loss) are disclosed separately.
Investment Transactions and Income. For financial reporting purposes, the Fund's investment holdings and NAV include trades executed through the end of the last business day of the period. The NAV per share for processing shareholder transactions is calculated as of the close of business of the New York Stock Exchange (NYSE), normally 4:00 p.m. Eastern time and includes trades executed through the end of the prior business day. Gains and losses on securities sold are determined on the basis of identified cost. Dividend income is recorded on the ex-dividend date, except for certain dividends from foreign securities where the ex-dividend date may have passed, which are recorded as soon as the Fund is informed of the ex-dividend date. Non-cash dividends included in dividend income, if any, are recorded at the fair market value of the securities received. Investment income is recorded net of foreign taxes withheld where recovery of such taxes is uncertain.
Annual Report
Notes to Financial Statements - continued
3. Significant Accounting Policies - continued
Class Allocations and Expenses. Investment income, realized and unrealized capital gains and losses, common expenses of the Fund, and certain fund-level expense reductions, if any, are allocated daily on a pro-rata basis to each class based on the relative net assets of each class to the total net assets of the Fund. Each class differs with respect to transfer agent and distribution and service plan fees incurred. Certain expense reductions may also differ by class. For the reporting period, the allocated portion of income and expenses to each class as a percent of its average net assets may vary due to the timing of recording these transactions in relation to fluctuating net assets of the classes. Expenses directly attributable to a fund are charged to that fund. Expenses attributable to more than one fund are allocated among the respective funds on the basis of relative net assets or other appropriate methods. Expense estimates are accrued in the period to which they relate and adjustments are made when actual amounts are known.
Income Tax Information and Distributions to Shareholders. Each year, the Fund intends to qualify as a regulated investment company under Subchapter M of the Internal Revenue Code, including distributing substantially all of its taxable income and realized gains. As a result, no provision for U.S. Federal income taxes is required. As of October 31, 2014, the Fund did not have any unrecognized tax benefits in the financial statements; nor is the Fund aware of any tax positions for which it is reasonably possible that the total amounts of unrecognized tax benefits will significantly change in the next twelve months. The Fund files a U.S. federal tax return, in addition to state and local tax returns as required. The Fund's federal income tax returns are subject to examination by the Internal Revenue Service (IRS) for a period of three fiscal years after they are filed. State and local tax returns may be subject to examination for an additional fiscal year depending on the jurisdiction. Foreign taxes are provided for based on the Fund's understanding of the tax rules and rates that exist in the foreign markets in which it invests. The Fund is subject to a tax imposed on capital gains by certain countries in which it invests.
Distributions are declared and recorded on the ex-dividend date. Income dividends and capital gain distributions are declared separately for each class. Income and capital gain distributions are determined in accordance with income tax regulations, which may differ from GAAP. In addition, the Fund claimed a portion of the payment made to redeeming shareholders as a distribution for income tax purposes.
Capital accounts within the financial statements are adjusted for permanent book-tax differences. These adjustments have no impact on net assets or the results of operations. Capital accounts are not adjusted for temporary book-tax differences which will reverse in a subsequent period.
Book-tax differences are primarily due to foreign currency transactions, certain foreign taxes, passive foreign investment companies (PFIC), capital loss carryforwards and losses due to wash sales.
Annual Report
3. Significant Accounting Policies - continued
Income Tax Information and Distributions to Shareholders - continued
The federal tax cost of investment securities and unrealized appreciation (depreciation) as of period end were as follows:
Gross unrealized appreciation | $ 22,933,818 |
Gross unrealized depreciation | (13,301,769) |
Net unrealized appreciation (depreciation) on securities | $ 9,632,049 |
| |
Tax Cost | $ 110,257,715 |
The tax-based components of distributable earnings as of period end were as follows:
Undistributed ordinary income | $ 2,385,005 |
Capital loss carryforward | $ (6,057,255) |
Net unrealized appreciation (depreciation) on securities and other investments | $ 9,630,792 |
Capital loss carryforwards are only available to offset future capital gains of the Fund to the extent provided by regulations and may be limited. Under the Regulated Investment Company Modernization Act of 2010 (the Act), the Fund is permitted to carry forward capital losses incurred in taxable years beginning after December 22, 2010 for an unlimited period and such capital losses are required to be used prior to any losses that expire. The capital loss carryforward information presented below, including any applicable limitation, is estimated as of fiscal period end and is subject to adjustment.
Fiscal year of expiration | |
2018 | $ (1,624,705) |
No expiration | |
Short-term | (373,258) |
Long-term | (4,059,292) |
Total no expiration | (4,432,550) |
Total capital loss carryforward | $ (6,057,255) |
The tax character of distributions paid was as follows:
| October 31, 2014 | October 31, 2013 |
Ordinary Income | $ 1,921,556 | $ 3,874,609 |
Short-Term Trading (Redemption) Fees. Shares held by investors in the Fund less than 90 days may have been subject to a redemption fee equal to 1.50% of the NAV of shares redeemed. All redemption fees, which reduce the proceeds of the shareholder redemption, are retained by the Fund and accounted for as an addition to paid in capital.
Annual Report
Notes to Financial Statements - continued
3. Significant Accounting Policies - continued
Restricted Securities. The Fund may invest in securities that are subject to legal or contractual restrictions on resale. These securities generally may be resold in transactions exempt from registration or to the public if the securities are registered. Disposal of these securities may involve time-consuming negotiations and expense, and prompt sale at an acceptable price may be difficult. Information regarding restricted securities is included at the end of the Fund's Schedule of Investments.
New Accounting Pronouncement. In June 2014, the Financial Accounting Standards Board issued Accounting Standard Update No. 2014-11, Repurchase-to-Maturity Transactions, Repurchase Financings, and Disclosures. The Update amends the accounting for certain repurchase agreements and expands disclosure requirements for reverse repurchase agreements, securities lending and other similar transactions. The disclosure requirements are effective for annual and interim reporting periods beginning after December 15, 2014. Management is currently evaluating the impact of the Update on the Fund's financial statements and related disclosures.
4. Purchases and Sales of Investments.
Purchases and sales of securities, other than short-term securities, aggregated $49,109,257 and $63,629,040, respectively.
5. Fees and Other Transactions with Affiliates.
Management Fee. FMR and its affiliates provide the Fund with investment management related services for which the Fund pays a monthly management fee. The management fee is the sum of an individual fund fee rate that is based on an annual rate of .55% of the Fund's average net assets and an annualized group fee rate that averaged .25% during the period. The group fee rate is based upon the average net assets of all the mutual funds advised by the investment adviser, including any mutual funds previously advised by the investment adviser that are currently advised by Fidelity SelectCo, LLC, an affiliate of the investment adviser. The group fee rate decreases as assets under management increase and increases as assets under management decrease. For the reporting period, the total annual management fee rate was .80% of the Fund's average net assets.
Distribution and Service Plan Fees. In accordance with Rule 12b-1 of the 1940 Act, the Fund has adopted separate Distribution and Service Plans for each class of shares. Certain classes pay Fidelity Distributors Corporation (FDC), an affiliate of the investment adviser, separate Distribution and Service Fees, each of which is based on an annual percentage of each class' average net assets. In addition, FDC may pay financial intermediaries for selling shares of the Fund and providing shareholder support services.
Annual Report
5. Fees and Other Transactions with Affiliates - continued
Distribution and Service Plan Fees - continued
For the period, the Distribution and Service Fee rates, total fees and amounts retained by FDC were as follows:
| Distribution
Fee | Service
Fee | Total Fees | Retained
by FDC |
Class A | -% | .25% | $ 24,843 | $ 1,208 |
Class T | .25% | .25% | 13,280 | 23 |
Class B | .75% | .25% | 3,284 | 2,463 |
Class C | .75% | .25% | 66,509 | 10,322 |
| | | $ 107,916 | $ 14,016 |
Sales Load. FDC may receive a front-end sales charge of up to 5.75% for selling Class A shares and 3.50% for selling Class T shares, some of which is paid to financial intermediaries for selling shares of the Fund. Depending on the holding period, FDC may receive contingent deferred sales charges levied on Class A, Class T, Class B, and Class C redemptions. The deferred sales charges range from 5.00% to 1.00% for Class B shares, 1.00% for Class C shares, 1.00% for certain purchases of Class A shares and .25% for certain purchases of Class T shares.
For the period, sales charge amounts retained by FDC were as follows:
| Retained
by FDC |
Class A | $ 15,260 |
Class T | 1,500 |
Class B* | 445 |
Class C* | 319 |
| $ 17,524 |
* When Class B and Class C shares are initially sold, FDC pays commissions from its own resources to financial intermediaries through which the sales are made.
Transfer Agent Fees. Fidelity Investments Institutional Operations Company, Inc., (FIIOC), an affiliate of FMR, is the transfer, dividend disbursing and shareholder servicing agent for each class of the Fund. FIIOC receives account fees and asset-based fees that vary according to the account size and type of account of the shareholders of the respective classes of the Fund. FIIOC pays for typesetting, printing and mailing of shareholder reports, except proxy statements.
Annual Report
Notes to Financial Statements - continued
5. Fees and Other Transactions with Affiliates - continued
Transfer Agent Fees - continued
For the period, transfer agent fees for each class were as follows:
| Amount | % of
Class-Level Average
Net Assets |
Class A | $ 25,172 | .25 |
Class T | 8,709 | .33 |
Class B | 995 | .30 |
Class C | 20,260 | .30 |
Emerging Europe, Middle East, Africa (EMEA) | 287,461 | .28 |
Institutional Class | 11,478 | .17 |
| $ 354,075 | |
Accounting and Security Lending Fees. Fidelity Service Company, Inc. (FSC), an affiliate of the investment adviser, maintains the Fund's accounting records. The accounting fee is based on the level of average net assets for each month. Under a separate contract, FSC administers the security lending program. The security lending fee is based on the number and duration of lending transactions.
Brokerage Commissions. The Fund placed a portion of its portfolio transactions with brokerage firms which are affiliates of the investment. Brokerage commissions are included in net realized gain (loss) and change in net unrealized appreciation (depreciation) in the Statement of Operations. The commissions paid to these affiliated firms were $48 for the period.
Other. During the period, the investment adviser reimbursed the Fund for certain losses in the amount of $1,567.
6. Committed Line of Credit.
The Fund participates with other funds managed by the investment adviser or an affiliate in a $4.25 billion credit facility (the "line of credit") to be utilized for temporary or emergency purposes to fund shareholder redemptions or for other short-term liquidity purposes. The Fund has agreed to pay commitment fees on its pro-rata portion of the line of credit, which amounted to $215 and is reflected in Miscellaneous expenses on the Statement of Operations. During the period, the Fund did not borrow on this line of credit.
Annual Report
7. Security Lending.
The Fund lends portfolio securities through a lending agent from time to time in order to earn additional income. For equity securities, a lending agent is used and may loan securities to certain qualified borrowers, including Fidelity Capital Markets (FCM), a broker-dealer affiliated with the Fund. On the settlement date of the loan, the Fund receives collateral (in the form of U.S. Treasury obligations, letters of credit and/or cash) against the loaned securities and maintains collateral in an amount not less than 100% of the market value of the loaned securities during the period of the loan. The market value of the loaned securities is determined at the close of business of the Fund and any additional required collateral is delivered to the Fund on the next business day. If the borrower defaults on its obligation to return the securities loaned because of insolvency or other reasons, the Fund may apply collateral received from the borrower against the obligation. The Fund may experience delays and costs in recovering the securities loaned. Any cash collateral received is invested in the Fidelity Securities Lending Cash Central Fund. The value of loaned securities is disclosed on the Fund's Statement of Assets and Liabilities. At period end, there were no security loans outstanding. Security lending income represents the income earned on investing cash collateral, less rebates paid to borrowers and any lending agent fees associated with the loan, plus any premium payments received for lending certain types of securities. Security lending income is presented in the Statement of Operations as a component of income from Fidelity Central Funds. Total security lending income during the period amounted to $5,426. During the period, there were no securities loaned to FCM.
8. Expense Reductions.
The investment adviser voluntarily agreed to reimburse each class to the extent annual operating expenses exceeded certain levels of average net assets as noted in the table below. Some expenses, for example interest expense, including commitment fees, are excluded from this reimbursement.
The following classes were in reimbursement during the period:
| Expense
Limitations | Reimbursement |
Class T | 1.90% | $ 595 |
In addition, the investment adviser reimbursed a portion of the fund's operating expenses during the period in the amount of $1,064.
Commissions paid to certain brokers with whom the investment adviser, or its affiliates, places trades on behalf of the Fund include an amount in addition to trade execution, which may be rebated back to the Fund to offset certain expenses. This amount totaled $257 for the period.
Annual Report
Notes to Financial Statements - continued
9. Distributions to Shareholders.
Distributions to shareholders of each class were as follows:
Years ended October 31, | 2014 | 2013 |
From net investment income | | |
Class A | $ 138,741 | $ 155,525 |
Class T | 39,254 | 46,756 |
Class B | 1,980 | 2,757 |
Class C | 46,648 | 69,716 |
Emerging Europe, Middle East, Africa (EMEA) | 1,537,065 | 2,222,632 |
Institutional Class | 157,868 | 192,599 |
Total | $ 1,921,556 | $ 2,689,985 |
From net realized gain | | |
Class A | $ - | $ 76,218 |
Class T | - | 28,360 |
Class B | - | 3,579 |
Class C | - | 66,141 |
Emerging Europe, Middle East, Africa (EMEA) | - | 934,516 |
Institutional Class | - | 75,810 |
Total | $ - | $ 1,184,624 |
10. Share Transactions.
Share transactions for each class were as follows and may contain automatic conversions between classes or exchanges between funds:
| Shares | Dollars |
Years ended October 31, | 2014 | 2013 | 2014 | 2013 |
Class A | | | | |
Shares sold | 315,373 | 422,392 | $ 2,918,425 | $ 3,786,551 |
Reinvestment of distributions | 11,698 | 20,821 | 104,929 | 182,599 |
Shares redeemed | (601,453) | (321,728) | (5,463,762) | (2,828,311) |
Net increase (decrease) | (274,382) | 121,485 | $ (2,440,408) | $ 1,140,839 |
Class T | | | | |
Shares sold | 101,639 | 88,958 | $ 928,488 | $ 793,473 |
Reinvestment of distributions | 4,323 | 8,485 | 38,736 | 74,325 |
Shares redeemed | (198,384) | (115,399) | (1,797,181) | (1,019,893) |
Net increase (decrease) | (92,422) | (17,956) | $ (829,957) | $ (152,095) |
Class B | | | | |
Shares sold | 4,359 | 10,659 | $ 39,785 | $ 95,440 |
Reinvestment of distributions | 219 | 679 | 1,980 | 5,999 |
Shares redeemed | (12,911) | (21,228) | (117,435) | (189,688) |
Net increase (decrease) | (8,333) | (9,890) | $ (75,670) | $ (88,249) |
Annual Report
10. Share Transactions - continued
| Shares | Dollars |
Years ended October 31, | 2014 | 2013 | 2014 | 2013 |
Emerging Europe, Middle East, Africa (EMEA) | | | | |
Class C | | | | |
Shares sold | 241,646 | 249,509 | $ 2,211,783 | $ 2,176,685 |
Reinvestment of distributions | 3,905 | 12,615 | 34,875 | 110,128 |
Shares redeemed | (221,913) | (441,523) | (2,006,697) | (3,878,247) |
Net increase (decrease) | 23,638 | (179,399) | $ 239,961 | $ (1,591,434) |
Shares sold | 2,719,041 | 4,724,612 | $ 24,959,563 | $ 42,683,733 |
Reinvestment of distributions | 162,803 | 341,639 | 1,463,600 | 2,999,595 |
Shares redeemed | (3,802,325) | (6,228,497) | (34,854,232) | (55,025,066) |
Net increase (decrease) | (920,481) | (1,162,246) | $ (8,431,069) | $ (9,341,738) |
Institutional Class | | | | |
Shares sold | 374,756 | 478,817 | $ 3,428,841 | $ 4,308,546 |
Reinvestment of distributions | 8,639 | 10,415 | 77,579 | 91,338 |
Shares redeemed | (841,493) | (396,145) | (7,467,169) | (3,464,870) |
Net increase (decrease) | (458,098) | 93,087 | $ (3,960,749) | $ 935,014 |
11. Other.
The Fund's organizational documents provide former and current trustees and officers with a limited indemnification against liabilities arising in connection with the performance of their duties to the Fund. In the normal course of business, the Fund may also enter into contracts that provide general indemnifications. The Fund's maximum exposure under these arrangements is unknown as this would be dependent on future claims that may be made against the Fund. The risk of material loss from such claims is considered remote.
Annual Report
To the Trustees of Fidelity Investment Trust and Shareholders of Fidelity Emerging Europe, Middle East, Africa (EMEA) Fund:
We have audited the accompanying statement of assets and liabilities of Fidelity Emerging Europe, Middle East, Africa (EMEA) Fund (the Fund), a fund of Fidelity Investment Trust, including the schedule of investments, as of October 31, 2014, and the related statement of operations for the year then ended, the statement of changes in net assets for each of the two years in the period then ended, and the financial highlights for each of the five years in the period then ended. These financial statements and financial highlights are the responsibility of the Fund's management. Our responsibility is to express an opinion on these financial statements and financial highlights based on our audits.
We conducted our audits in accordance with the standards of the Public Company Accounting Oversight Board (United States). Those standards require that we plan and perform the audit to obtain reasonable assurance about whether the financial statements and financial highlights are free of material misstatement. The Fund is not required to have, nor were we engaged to perform, an audit of its internal control over financial reporting. Our audits included consideration of internal control over financial reporting as a basis for designing audit procedures that are appropriate in the circumstances, but not for the purpose of expressing an opinion on the effectiveness of the Fund's internal control over financial reporting. Accordingly, we express no such opinion. An audit also includes examining, on a test basis, evidence supporting the amounts and disclosures in the financial statements, assessing the accounting principles used and significant estimates made by management, as well as evaluating the overall financial statement presentation. Our procedures included confirmation of securities owned as of October 31, 2014, by correspondence with the custodians and brokers; where replies were not received from brokers, we performed other auditing procedures. We believe that our audits provide a reasonable basis for our opinion.
In our opinion, the financial statements and financial highlights referred to above present fairly, in all material respects, the financial position of Fidelity Emerging Europe, Middle East, Africa (EMEA) Fund as of October 31, 2014, the results of its operations for the year then ended, the changes in its net assets for each of the two years in the period then ended, and the financial highlights for each of the five years in the period then ended, in conformity with accounting principles generally accepted in the United States of America.
DELOITTE & TOUCHE LLP
Boston, Massachusetts
December 19, 2014
Annual Report
The Trustees, Member of the Advisory Board, and officers of the trust and fund, as applicable, are listed below. The Board of Trustees governs the fund and is responsible for protecting the interests of shareholders. The Trustees are experienced executives who meet periodically throughout the year to oversee the fund's activities, review contractual arrangements with companies that provide services to the fund, oversee management of the risks associated with such activities and contractual arrangements, and review the fund's performance. Except for James C. Curvey, each of the Trustees oversees 174 funds. Mr. Curvey oversees 407 funds.
The Trustees hold office without limit in time except that (a) any Trustee may resign; (b) any Trustee may be removed by written instrument, signed by at least two-thirds of the number of Trustees prior to such removal; (c) any Trustee who requests to be retired or who has become incapacitated by illness or injury may be retired by written instrument signed by a majority of the other Trustees; and (d) any Trustee may be removed at any special meeting of shareholders by a two-thirds vote of the outstanding voting securities of the trust. Each Trustee who is not an interested person (as defined in the 1940 Act) of the trust and the fund (Independent Trustee), shall retire not later than the last day of the calendar year in which his or her 75th birthday occurs. The Independent Trustees may waive this mandatory retirement age policy with respect to individual Trustees. The officers and Advisory Board Member hold office without limit in time, except that any officer and Advisory Board Member may resign or may be removed by a vote of a majority of the Trustees at any regular meeting or any special meeting of the Trustees. Except as indicated, each individual has held the office shown or other offices in the same company for the past five years.
Experience, Skills, Attributes, and Qualifications of the Fund's Trustees. The Governance and Nominating Committee has adopted a statement of policy that describes the experience, qualifications, attributes, and skills that are necessary and desirable for potential Independent Trustee candidates (Statement of Policy). The Board believes that each Trustee satisfied at the time he or she was initially elected or appointed a Trustee, and continues to satisfy, the standards contemplated by the Statement of Policy. The Governance and Nominating Committee also engages professional search firms to help identify potential Independent Trustee candidates who have the experience, qualifications, attributes, and skills consistent with the Statement of Policy. From time to time, additional criteria based on the composition and skills of the current Independent Trustees, as well as experience or skills that may be appropriate in light of future changes to board composition, business conditions, and regulatory or other developments, have also been considered by the professional search firms and the Governance and Nominating Committee. In addition, the Board takes into account the Trustees' commitment and participation in Board and committee meetings, as well as their leadership of standing and ad hoc committees throughout their tenure.
In determining that a particular Trustee was and continues to be qualified to serve as a Trustee, the Board has considered a variety of criteria, none of which, in isolation, was controlling. The Board believes that, collectively, the Trustees have balanced and diverse experience, qualifications, attributes, and skills, which allow the Board to operate effectively in governing the fund and protecting the interests of shareholders. Information about the specific experience, skills, attributes, and qualifications of each Trustee, which in each case led to the Board's conclusion that the Trustee should serve (or continue to serve) as a trustee of the fund, is provided below.
Annual Report
Board Structure and Oversight Function. James C. Curvey is an interested person (as defined in the 1940 Act) and currently serves as Chairman. The Trustees have determined that an interested Chairman is appropriate and benefits shareholders because an interested Chairman has a personal and professional stake in the quality and continuity of services provided to the fund. Independent Trustees exercise their informed business judgment to appoint an individual of their choosing to serve as Chairman, regardless of whether the Trustee happens to be independent or a member of management. The Independent Trustees have determined that they can act independently and effectively without having an Independent Trustee serve as Chairman and that a key structural component for assuring that they are in a position to do so is for the Independent Trustees to constitute a substantial majority for the Board. The Independent Trustees also regularly meet in executive session. Ned C. Lautenbach serves as Chairman of the Independent Trustees and as such (i) acts as a liaison between the Independent Trustees and management with respect to matters important to the Independent Trustees and (ii) with management prepares agendas for Board meetings.
Fidelity funds are overseen by different Boards of Trustees. The fund's Board oversees Fidelity's equity and high income funds and another Board oversees Fidelity's investment-grade bond, money market, and asset allocation funds. The asset allocation funds may invest in Fidelity funds overseen by the fund's Board. The use of separate Boards, each with its own committee structure, allows the Trustees of each group of Fidelity funds to focus on the unique issues of the funds they oversee, including common research, investment, and operational issues. On occasion, the separate Boards establish joint committees to address issues of overlapping consequences for the Fidelity funds overseen by each Board.
The Trustees operate using a system of committees to facilitate the timely and efficient consideration of all matters of importance to the Trustees, the fund, and fund shareholders and to facilitate compliance with legal and regulatory requirements and oversight of the fund's activities and associated risks. The Board, acting through its committees, has charged FMR and its affiliates with (i) identifying events or circumstances the occurrence of which could have demonstrably adverse effects on the fund's business and/or reputation; (ii) implementing processes and controls to lessen the possibility that such events or circumstances occur or to mitigate the effects of such events or circumstances if they do occur; and (iii) creating and maintaining a system designed to evaluate continuously business and market conditions in order to facilitate the identification and implementation processes described in (i) and (ii) above. Because the day-to-day operations and activities of the fund are carried out by or through FMR, its affiliates and other service providers, the fund's exposure to risks is mitigated but not eliminated by the processes overseen by the Trustees. While each of the Board's committees has responsibility for overseeing different aspects of the fund's activities, oversight is exercised primarily through the Operations, Audit, and Compliance Committees. In addition, the Independent Trustees have worked with FMR to enhance the Board's oversight of investment and financial risks, legal and regulatory risks, technology risks, and operational risks, including the development of additional risk reporting to the Board. For example, a working group comprised of Independent Trustees and FMR has worked and continues to work to review the Fidelity funds' valuation-related activities, reporting and risk management. Appropriate personnel, including but not limited to the fund's Chief Compliance Officer (CCO), FMR's internal auditor, the independent accountants, the fund's Treasurer and portfolio management personnel, make periodic reports to the Board's committees, as appropriate, including an annual review of FMR's risk management program for the Fidelity funds. The responsibilities of each standing committee, including their oversight responsibilities, are described further under "Standing Committees of the Fund's Trustees."
Annual Report
Trustees and Officers - continued
The fund's Statement of Additional Information (SAI) includes more information about the Trustees. To request a free copy, call Fidelity at 1-877-208-0098.
Interested Trustees*:
Correspondence intended for each Trustee who is an interested person may be sent to Fidelity Investments, 245 Summer Street, Boston, Massachusetts 02210.
Name, Year of Birth; Principal Occupations and Other Relevant Experience+ |
James C. Curvey (1935) |
Year of Election or Appointment: 2007 Trustee Chairman of the Board of Trustees |
| Mr. Curvey also serves as Trustee of other Fidelity funds. Mr. Curvey is a Director of Fidelity Research & Analysis Co. (2009-present), and Vice Chairman (2007-present) and Director of FMR LLC. In addition, Mr. Curvey serves as an Overseer for the Boston Symphony Orchestra and a member of the board of Artis-Naples, Naples, Florida, and as a Trustee for Brewster Academy, Wolfeboro, New Hampshire. Previously, Mr. Curvey served as a Director of Fidelity Investments Money Management, Inc. (2009-2014), a Director of FMR (2007-2014), and a Director of FMR Co., Inc. (2007-2014). |
Charles S. Morrison (1960) |
Year of Election or Appointment: 2014 Trustee |
| Mr. Morrison also serves as Trustee of other funds. He serves as a Director of Fidelity Investments Money Management, Inc. (FIMM) (2014-present), Director of Fidelity SelectCo, LLC (2014-present), President, Asset Management (2014-present), and is an employee of Fidelity Investments. Previously, Mr. Morrison served as Vice President of Fidelity's Fixed Income and Asset Allocation Funds (2012-2014), President, Fixed Income (2011-2014), Vice President of Fidelity's Money Market Funds (2005-2009), President, Money Market Group Leader of FMR (2009), and Senior Vice President, Money Market Group of FMR (2004-2009). Mr. Morrison also served as Vice President of Fidelity's Bond Funds (2002-2005), certain Balanced Funds (2002-2005), and certain Asset Allocation Funds (2002-2007), and as Senior Vice President (2002-2005) of Fidelity's Bond Division. |
* Trustees have been determined to be "Interested Trustees" by virtue of, among other things, their affiliation with the trust or various entities under common control with FMR.
+ The information above includes each Trustee's principal occupation during the last five years and other information relating to the experience, attributes, and skills relevant to each Trustee's qualifications to serve as a Trustee, which led to the conclusion that each Trustee should serve as a Trustee for the fund.
Annual Report
Trustees and Officers - continued
Independent Trustees:
Correspondence intended for each Independent Trustee (that is, the Trustees other than the Interested Trustees) may be sent to Fidelity Investments, P.O. Box 55235, Boston, Massachusetts 02205-5235.
Name, Year of Birth; Principal Occupations and Other Relevant Experience+ |
Dennis J. Dirks (1948) |
Year of Election or Appointment: 2005 Trustee |
| Mr. Dirks also serves as Trustee of other Fidelity funds. Prior to his retirement in May 2003, Mr. Dirks was Chief Operating Officer and a member of the Board of The Depository Trust & Clearing Corporation (DTCC). He also served as President, Chief Operating Officer, and Board member of The Depository Trust Company (DTC) and President and Board member of the National Securities Clearing Corporation (NSCC). In addition, Mr. Dirks served as Chief Executive Officer and Board member of the Government Securities Clearing Corporation, Chief Executive Officer and Board member of the Mortgage-Backed Securities Clearing Corporation, as a Trustee and a member of the Finance Committee of Manhattan College (2005-2008), and as a Trustee and a member of the Finance Committee of AHRC of Nassau County (2006-2008). Mr. Dirks is a member of the Independent Directors Council (IDC) Governing Council (2010-present) and Board of Directors for The Brookville Center for Children's Services, Inc. (2009-present). |
Alan J. Lacy (1953) |
Year of Election or Appointment: 2008 Trustee |
| Mr. Lacy also serves as Trustee of other Fidelity funds. Mr. Lacy serves as Senior Adviser (2007-present) of Oak Hill Capital Partners, L.P. (private equity). Mr. Lacy also served as Chief Executive Officer (2000-2005) and Vice Chairman (2005-2006) of Sears Holdings Corporation and Sears, Roebuck and Co. (retail). In addition, Mr. Lacy serves as a member of the Board of Directors of Dave & Buster's Entertainment, Inc. (restaurant and entertainment complexes, 2010-present), Earth Fare, Inc. (retail grocery, 2012-present), The Hillman Companies, Inc. (hardware wholesalers, 2010-present), and Bristol-Myers Squibb Company (global pharmaceuticals, 2008-present). Mr. Lacy is a member of the Board of Trustees of The National Parks Conservation Association (2006-present). Previously, Mr. Lacy served as Chairman of the Board of Trustees of the National Parks Conservation Association (2008-2011) and as a member of the Board of Directors for the Western Union Company (global money transfer, 2006-2011). |
Ned C. Lautenbach (1944) |
Year of Election or Appointment: 2000 Trustee Chairman of the Independent Trustees |
| Mr. Lautenbach also serves as Trustee of other Fidelity funds. Mr. Lautenbach currently serves as the Lead Director of the Eaton Corporation Board of Directors (diversified industrial, 1997-present). Mr. Lautenbach is Chairman of the Board of Directors of the Philharmonic Center for the Arts in Naples, Florida (2012-present) and a member of the Council on Foreign Relations (1994-present). Previously, Mr. Lautenbach was a Partner/Advisory Partner at Clayton, Dubilier & Rice, LLC (private equity investment, 1998-2010), as well as a Director of Sony Corporation (2006-2007). |
Joseph Mauriello (1944) |
Year of Election or Appointment: 2008 Trustee |
| Mr. Mauriello also serves as Trustee of other Fidelity funds. Prior to his retirement in January 2006, Mr. Mauriello served in numerous senior management positions including Deputy Chairman and Chief Operating Officer (2004-2005), and Vice Chairman of Financial Services (2002-2004) of KPMG LLP US (professional services, 1965-2005). Mr. Mauriello currently serves as a member of the Board of Directors of XL Group plc. (global insurance and re-insurance, 2006-present). Previously, Mr. Mauriello served as a Director of the Hamilton Funds of the Bank of New York (2006-2007) and of Arcadia Resources Inc. (health care services and products, 2007-2012). |
Robert W. Selander (1950) |
Year of Election or Appointment: 2011 Trustee |
| Mr. Selander also serves as Trustee of other Fidelity funds. Previously, Mr. Selander served as a Member of the Advisory Board of other Fidelity funds (2011), and Executive Vice Chairman (2010), Chief Executive Officer (2009-2010), and President and Chief Executive Officer (1997-2009) of Mastercard, Inc. |
Cornelia M. Small (1944) |
Year of Election or Appointment: 2005 Trustee |
| Ms. Small also serves as Trustee of other Fidelity funds. Ms. Small is a member of the Board of Directors (2009-present) and Chair of the Investment Committee (2010-present) of the Teagle Foundation. Ms. Small also serves on the Investment Committee of the Berkshire Taconic Community Foundation (2008-present). Previously, Ms. Small served as Chairperson (2002-2008) and a member of the Investment Committee and Chairperson (2008-2012) and a member of the Board of Trustees of Smith College. In addition, Ms. Small served as Chief Investment Officer, Director of Global Equity Investments, and a member of the Board of Directors of Scudder, Stevens & Clark and Scudder Kemper Investments. |
William S. Stavropoulos (1939) |
Year of Election or Appointment: 2001 Trustee Vice Chairman of the Independent Trustees |
| Mr. Stavropoulos also serves as Trustee of other Fidelity funds. Mr. Stavropoulos serves as President and Founder of the Michigan Baseball Foundation, the Great Lakes Loons (2007-present). Mr. Stavropoulos is Chairman Emeritus of the Board of Directors of The Dow Chemical Company, where he previously served in numerous senior management positions, including President, CEO (1995-2000; 2002-2004), Chairman of the Executive Committee (2000-2006), and as a member of the Board of Directors (1990-2006). Currently, Mr. Stavropoulos is Chairman of the Board of Directors of Univar Inc. (global distributor of commodity and specialty chemicals), a Director of Teradata Corporation (data warehousing and technology solutions), and Maersk Inc. (industrial conglomerate), and a member of the Advisory Board for Metalmark Capital LLC (private equity investment, 2005-present). Mr. Stavropoulos is an operating advisor to Clayton, Dubilier & Rice, LLC (private equity investment). In addition, Mr. Stavropoulos is a member of the University of Notre Dame Advisory Council for the College of Science, a Trustee of the Rollin L. Gerstacker Foundation, and a Director of the Naples Philharmonic Center for the Arts. Previously, Mr. Stavropoulos served as a Director of Chemical Financial Corporation (bank holding company, 1993-2012) and Tyco International, Ltd. (multinational manufacturing and services, 2007-2012). |
David M. Thomas (1949) |
Year of Election or Appointment: 2008 Trustee |
| Mr. Thomas also serves as Trustee of other Fidelity funds. Mr. Thomas serves as Non-Executive Chairman of the Board of Directors of Fortune Brands Home and Security (home and security products, 2011-present), and as a member of the Board of Directors of Interpublic Group of Companies, Inc. (marketing communication, 2004-present). Previously, Mr. Thomas served as Executive Chairman (2005-2006) and Chairman and Chief Executive Officer (2000-2005) of IMS Health, Inc. (pharmaceutical and healthcare information solutions), and a Director of Fortune Brands, Inc. (consumer products, 2000-2011). |
+ The information above includes each Trustee's principal occupation during the last five years and other information relating to the experience, attributes, and skills relevant to each Trustee's qualifications to serve as a Trustee, which led to the conclusion that each Trustee should serve as a Trustee for the fund.
Advisory Board Member and Officers:
Correspondence intended for each officer and Peter S. Lynch may be sent to Fidelity Investments, 245 Summer Street, Boston, Massachusetts 02210. Officers appear below in alphabetical order.
Name, Year of Birth; Principal Occupation |
Peter S. Lynch (1944) |
Year of Election or Appointment: 2003 Member of the Advisory Board |
| Mr. Lynch also serves as Member of the Advisory Board of other Fidelity funds. Mr. Lynch is Vice Chairman and a Director of FMR and FMR Co., Inc. In addition, Mr. Lynch serves as a Trustee of Boston College and as the Chairman of the Inner-City Scholarship Fund. Previously, Mr. Lynch served on the Special Olympics International Board of Directors (1997-2006). |
Elizabeth Paige Baumann (1968) |
Year of Election or Appointment: 2012 Anti-Money Laundering (AML) Officer |
| Ms. Baumann also serves as AML Officer of other funds. She is Chief AML Officer of FMR LLC (2012-present) and is an employee of Fidelity Investments. Previously, Ms. Baumann served as Vice President and Deputy Anti-Money Laundering Officer (2007-2012). |
William C. Coffey (1969) |
Year of Election or Appointment: 2009 Assistant Secretary |
| Mr. Coffey also serves as Assistant Secretary of other funds. He is Senior Vice President and Deputy General Counsel of FMR LLC (2010-present), and is an employee of Fidelity Investments. Previously, Mr. Coffey served as Vice President and Associate General Counsel of FMR LLC (2005-2009). |
Timothy M. Cohen (1969) |
Year of Election or Appointment: 2014 Vice President of certain Equity Funds |
| Mr. Cohen also serves as Vice President of other funds. Mr. Cohen serves as a Director and Chief Compliance Officer of Fidelity Management & Research (U.K.) Inc. (2013-present) and is an employee of Fidelity Investments. |
Jonathan Davis (1968) |
Year of Election or Appointment: 2010 Assistant Treasurer |
| Mr. Davis also serves as Assistant Treasurer of other funds. Mr. Davis is an employee of Fidelity Investments. Previously, Mr. Davis served as Vice President and Associate General Counsel of FMR LLC (2003-2010). |
Adrien E. Deberghes (1967) |
Year of Election or Appointment: 2008 Deputy Treasurer |
| Mr. Deberghes also serves as an officer of other funds. He is an employee of Fidelity Investments (2008-present). Prior to joining Fidelity Investments, Mr. Deberghes was Senior Vice President of Mutual Fund Administration at State Street Corporation (2007-2008), Senior Director of Mutual Fund Administration at Investors Bank & Trust (2005-2007), and Director of Finance for Dunkin' Brands (2000-2005). |
Stephanie J. Dorsey (1969) |
Year of Election or Appointment: 2010 Assistant Treasurer |
| Ms. Dorsey also serves as an officer of other funds. She is an employee of Fidelity Investments (2008-present) and has served in other fund officer roles. Prior to joining Fidelity Investments, Ms. Dorsey served as Treasurer (2004-2008) of the JPMorgan Mutual Funds and Vice President (2004-2008) of JPMorgan Chase Bank. |
Howard J. Galligan III (1966) |
Year of Election or Appointment: 2014 Chief Financial Officer |
| Mr. Galligan also serves as Chief Financial Officer of other funds. Mr. Galligan serves as President of Fidelity Pricing and Cash Management Services (FPCMS) (2014-present) and as a Director of Strategic Advisers, Inc. (2008-present). Previously, Mr. Galligan served as Chief Administrative Officer of Asset Management (2011-2014) and Chief Operating Officer and Senior Vice President of Investment Support for Strategic Advisers, Inc. (2003-2011). |
Scott C. Goebel (1968) |
Year of Election or Appointment: 2008 Secretary and Chief Legal Officer (CLO) |
| Mr. Goebel serves as Secretary and CLO of other funds. Mr. Goebel also serves as Secretary of Fidelity SelectCo, LLC (2013-present), Fidelity Investments Money Management, Inc. (FIMM) (2010-present) and Fidelity Research and Analysis Company (FRAC) (2010-present); General Counsel, Secretary, and Senior Vice President of FMR (2008-present) and FMR Co., Inc. (2008-present); Chief Legal Officer of Fidelity Management & Research (Hong Kong) Limited (2008-present); and Assistant Secretary of Fidelity Management & Research (Japan) Limited (2008-present) and Fidelity Management & Research (U.K.) Inc. (2008-present). Previously, Mr. Goebel served as Secretary and CLO of other Fidelity funds (2008-2013), Assistant Secretary of FIMM (2008-2010), FRAC (2008-2010), and certain funds (2007-2008); and as Vice President and Secretary of Fidelity Distributors Corporation (FDC) (2005-2007). Mr. Goebel has been employed by FMR LLC or an affiliate since 2001. |
Brian B. Hogan (1964) |
Year of Election or Appointment: 2009 Vice President |
| Mr. Hogan also serves as Trustee or Vice President of other funds. Mr. Hogan serves as a Director of Fidelity SelectCo, LLC (2014-present) and President of FMR's Equity Division (2009-present). Previously, Mr. Hogan served as Senior Vice President, Equity Research of FMR (2006-2009) and as a portfolio manager. |
Chris Maher (1972) |
Year of Election or Appointment: 2013 Assistant Treasurer |
| Mr. Maher serves as Assistant Treasurer of other funds. Mr. Maher is Vice President of Valuation Oversight and is an employee of Fidelity Investments. Previously, Mr. Maher served as Vice President of Asset Management Compliance (2013), Vice President of FMR's Program Management Group (2010-2013), and Vice President of Valuation Oversight (2008-2010). |
Kenneth B. Robins (1969) |
Year of Election or Appointment: 2008 President and Treasurer |
| Mr. Robins also serves as an officer of other funds. Mr. Robins serves as Executive Vice President of Fidelity Investments Money Management, Inc. (FIMM) (2013-present) and is an employee of Fidelity Investments (2004-present). Previously, Mr. Robins served in other fund officer roles. |
Stephen Sadoski (1971) |
Year of Election or Appointment: 2012 Deputy Treasurer |
| Mr. Sadoski also serves as Deputy Treasurer of other funds. He is an employee of Fidelity Investments (2012-present) and has served in another fund officer role. Prior to joining Fidelity Investments, Mr. Sadoski served as an assistant chief accountant in the Division of Investment Management of the Securities and Exchange Commission (SEC) (2009-2012) and as a senior manager at Deloitte & Touche LLP (1997-2009). |
Stacie M. Smith (1974) |
Year of Election or Appointment: 2013 Deputy Treasurer |
| Ms. Smith also serves as an officer of other funds. She is an employee of Fidelity Investments (2009-present) and has served in other fund officer roles. Prior to joining Fidelity Investments, Ms. Smith served as Senior Audit Manager of Ernst & Young LLP (1996-2009). |
Renee Stagnone (1975) |
Year of Election or Appointment: 2013 Deputy Treasurer |
| Ms. Stagnone also serves as Deputy Treasurer of other funds. Ms. Stagnone is an employee of Fidelity Investments. |
Linda J. Wondrack (1964) |
Year of Election or Appointment: 2014 Chief Compliance Officer |
| Ms. Wondrack also serves as Chief Compliance Officer of other funds. Ms. Wondrack is Executive Vice President and head of the Ethics Office and Asset Management Compliance for Fidelity Investments (2012-present). Ms. Wondrack also serves as Chief Compliance Officer of Fidelity SelectCo, LLC (2014-present); Chief Compliance Officer of Impresa Management LLC (2013-present); and Chief Compliance Officer of FMR Co., Inc., Fidelity Investments Money Management, Inc., Fidelity Management & Research (Japan) Limited, Fidelity Management & Research (U.K.) Inc., Fidelity Management & Research (Hong Kong), Fidelity Management & Research Company, Pyramis Global Advisors, LLC, and Strategic Advisers, Inc., Ballyrock Investment Advisors LLC, and Northern Neck Investors LLC (2012-present). Previously, Ms. Wondrack served as Senior Vice President and Chief Compliance Officer for Columbia Management Investment Advisers, LLC (2005-2012); Chief Compliance Officer for certain funds within the Columbia Family of Funds (2007-2012); and Senior Vice President of Compliance Risk Management at Bank of America (2005-2010). |
Joseph F. Zambello (1957) |
Year of Election or Appointment: 2011 Deputy Treasurer |
| Mr. Zambello also serves as Deputy Treasurer of other funds. Mr. Zambello is an employee of Fidelity Investments. Previously, Mr. Zambello served as Vice President of FMR's Program Management Group (2009-2011) and Vice President of the Transfer Agent Oversight Group (2005-2009). |
Annual Report
The Board of Trustees of Fidelity Emerging Europe, Middle East, Africa (EMEA) Fund voted to pay to shareholders of record at the opening of business on record date, the following distributions per share derived from capital gains realized from sales of portfolio securities, and dividends derived from net investment income:
| Pay Date | Record Date | Dividends | Capital Gains |
Class A | 12/08/14 | 12/05/14 | $0.135 | $0.039 |
Class T | 12/08/14 | 12/05/14 | $0.125 | $0.039 |
Class B | 12/08/14 | 12/05/14 | $0.059 | $0.039 |
Class C | 12/08/14 | 12/05/14 | $0.078 | $0.039 |
Class A, T, B and C designate 100% of the dividend distributed during the fiscal year, as amounts which may be taken into account as a dividend for purposes of the maximum rate under section 1(h)(11) of the Internal Revenue Code.
The amounts per share which represent income derived from sources within, and taxes paid to, foreign countries or possessions of the United States are as follows:
| Pay Date | Income | Taxes |
Class A | 12/09/13 | $0.0956 | $0.0491 |
Class T | 12/09/13 | $0.0859 | $0.0491 |
Class B | 12/09/13 | $0.0552 | $0.0491 |
Class C | 12/09/13 | $0.0632 | $0.0491 |
The fund will notify shareholders in January 2015 of amounts for use in preparing 2014 income tax returns.
Annual Report
Board Approval of Investment Advisory Contracts and Management Fees
Fidelity Emerging Europe, Middle East, Africa (EMEA) Fund
Each year, the Board of Trustees, including the Independent Trustees (together, the Board), votes on the renewal of the management contract with Fidelity Management & Research Company (FMR) and the sub-advisory agreements (together, the Advisory Contracts) for the fund. The Board, assisted by the advice of fund counsel and Independent Trustees' counsel, requests and considers a broad range of information relevant to the renewal of the Advisory Contracts throughout the year.
The Board meets regularly and, at each of its meetings, covers an extensive agenda of topics and materials and considers factors that are relevant to its annual consideration of the renewal of the fund's Advisory Contracts, including the services and support provided to the fund and its shareholders. The Board has established various standing committees (Committees), each composed of and chaired by Independent Trustees with varying backgrounds, to which the Board has assigned specific subject matter responsibilities in order to enhance effective decision-making by the Board. The Board, acting directly and through its Committees, requests and receives information concerning the annual consideration of the renewal of the fund's Advisory Contracts. The Board also meets as needed to consider matters specifically related to the Board's annual consideration of the renewal of the Advisory Contracts. Members of the Board may also meet with trustees of other Fidelity funds through ad hoc joint committees to discuss certain matters relevant to the Fidelity funds.
At its July 2014 meeting, the Board, including the Independent Trustees, unanimously determined to renew the fund's Advisory Contracts. In reaching its determination, the Board considered all factors it believed relevant, including (i) the nature, extent, and quality of the services to be provided to the fund and its shareholders (including the investment performance of the fund); (ii) the competitiveness of the fund's management fee and total expense ratio relative to peer funds; (iii) the total costs of the services to be provided by and the profits to be realized by Fidelity from its relationship with the fund; (iv) the extent to which economies of scale exist and would be realized as the fund grows; and (v) whether fee levels reflect these economies of scale, if any, for the benefit of fund shareholders. In connection with separate internal corporate reorganizations involving Fidelity Management & Research (U.K.) Inc. (FMR U.K.) and Fidelity Management & Research (Japan) Inc. (FMR Japan), the Board approved certain non-material amendments to the fund's sub-advisory agreements with FMR U.K. and FMR Japan to reflect that, after these reorganizations, FMR Investment Management (UK) Limited and Fidelity Management & Research (Japan) Limited will carry on the business of FMR U.K. and FMR Japan, respectively. The Board noted that no changes to the portfolio managers or to the foreign research or investment advisory services provided to the fund were expected in connection with either reorganization and that the same personnel and resources would continue to be available to the fund at the new entities.
Annual Report
Board Approval of Investment Advisory Contracts and
Management Fees - continued
In considering whether to renew the Advisory Contracts for the fund, the Board reached a determination, with the assistance of fund counsel and Independent Trustees' counsel and through the exercise of its business judgment, that the renewal of the Advisory Contracts was in the best interests of the fund and its shareholders and that the compensation payable under the Advisory Contracts was fair and reasonable. The Board's decision to renew the Advisory Contracts was not based on any single factor, but rather was based on a comprehensive consideration of all the information provided to the Board at its meetings throughout the year. The Board, in reaching its determination to renew the Advisory Contracts, was aware that shareholders of the fund have a broad range of investment choices available to them, including a wide choice among funds offered by Fidelity's competitors, and that the fund's shareholders, who have the opportunity to review and weigh the disclosure provided by the fund in its prospectus and other public disclosures, have chosen to invest in this fund, which is part of the Fidelity family of funds.
Nature, Extent, and Quality of Services Provided. The Board considered Fidelity's staffing as it relates to the fund, including the backgrounds of investment personnel of FMR and the sub-advisers (together, the Investment Advisers), and also considered the fund's investment objective, strategies, and related investment philosophy. The Independent Trustees also had discussions with senior management of Fidelity's investment operations and investment groups. The Board considered the structure of the portfolio manager compensation program and whether this structure provides appropriate incentives to act in the best interests of the fund. Additionally, the Board considered the portfolio managers' investments, if any, in the funds that they manage.
Resources Dedicated to Investment Management and Support Services. The Board and the Fund Oversight and Research Committees reviewed the general qualifications and capabilities of Fidelity's investment staff, including its size, education, experience, and resources, as well as Fidelity's approach to recruiting, training, managing, and compensating investment personnel. The Board noted that Fidelity has continued to increase the resources devoted to non-U.S. offices, including expansion of Fidelity's global investment organization. The Board also noted that Fidelity's analysts have extensive resources, tools and capabilities that allow them to conduct sophisticated quantitative and fundamental analysis, as well as credit analysis of issuers, counterparties and guarantors. Further, the Board believes that Fidelity's investment professionals have sufficient access to global information and data so as to provide competitive investment results over time, and that those professionals also have access to sophisticated tools that permit them to assess portfolio construction and risk and performance attribution characteristics continuously, as well as to transmit new information and research conclusions rapidly around the world. Additionally, in its deliberations, the Board considered Fidelity's trading and risk management capabilities and resources and global compliance infrastructure, which are an integral part of the investment management process.
Annual Report
Shareholder and Administrative Services. The Board considered (i) the nature, extent, quality, and cost of advisory, administrative, and shareholder services performed by the Investment Advisers and their affiliates under the Advisory Contracts and under separate agreements covering transfer agency, pricing and bookkeeping, and securities lending services for the fund; (ii) the nature and extent of the supervision of third party service providers, principally custodians and subcustodians; and (iii) the resources devoted to, and the record of compliance with, the fund's compliance policies and procedures. The Board also reviewed the allocation of fund brokerage, including allocations to brokers affiliated with the Investment Advisers, the use of brokerage commissions to pay fund expenses, and the use of "soft" commission dollars to pay for research services.
The Board noted that the growth of fund assets over time across the complex allows Fidelity to reinvest in the development of services designed to enhance the value or convenience of the Fidelity funds as investment vehicles. These services include 24-hour access to account information and market information through telephone representatives and over the Internet, investor education materials and asset allocation tools, and the expanded availability of Fidelity Investor Centers.
In 2014, the Board formed an ad hoc Committee on Transfer Agency Fees to review the variety of transfer agency fee structures throughout the industry and Fidelity's competitive positioning with respect to industry participants.
Investment in a Large Fund Family. The Board considered the benefits to shareholders of investing in a Fidelity fund, including the benefits of investing in a fund that is part of a large family of funds offering a variety of investment disciplines and providing a large variety of mutual fund investor services. The Board noted that Fidelity had taken, or had made recommendations that resulted in the Fidelity funds taking, a number of actions over the previous year that benefited particular funds, including (i) continuing to dedicate additional resources to investment research and to the support of the senior management team that oversees asset management; (ii) persisting in efforts to enhance Fidelity's global research capabilities; (iii) launching new funds and making other enhancements to meet client needs for income-oriented solutions; (iv) reducing fund expenses for certain index funds; (v) continuing to launch dedicated lower cost underlying funds to meet portfolio construction needs related to expanding underlying fund options for Fidelity funds of funds, specifically for the Freedom Fund product lines; (vi) rationalizing product lines and gaining increased efficiencies through fund mergers; (vii) launching sector-based exchange-traded funds and establishing a new Fidelity adviser to manage sector-based funds and products; (viii) continuing to develop and implement technology to improve security and increase efficiency; (ix) modifying the eligibility criteria for certain share classes to increase their marketability to a portion of the defined contribution plan market; (x) waiving redemption fees for certain qualified fund-of-fund and wrap programs and certain retirement plan transactions; and (xi) launching new Institutional Class shares of certain money market funds to attract and retain assets and to fill a gap in the money market fund lineup.
Annual Report
Board Approval of Investment Advisory Contracts and
Management Fees - continued
Investment Performance. The Board considered whether the fund has operated in accordance with its investment objective, as well as its record of compliance with its investment restrictions and its performance history.
The Board took into account discussions with the Investment Advisers about fund investment performance that occur at Board meetings throughout the year. In this regard the Board noted that as part of regularly scheduled fund reviews and other reports to the Board on fund performance, the Board periodically considers annualized return information for the fund, for different time periods, measured against a securities market index ("benchmark index") and a peer group of funds with similar objectives ("peer group"). In its evaluation of fund investment performance, the Board gave particular attention to information indicating changes in performance of certain Fidelity funds for specific time periods and the Investment Advisers' explanations for any overperformance or underperformance.
In addition to reviewing absolute and relative fund performance, the Independent Trustees periodically consider the appropriateness of fund performance metrics in evaluating the results achieved. In general, the Independent Trustees believe that fund performance should be evaluated based on net performance (after fees and expenses) of both the highest performing and lowest performing classes, where applicable, compared to appropriate benchmark indices, over appropriate time periods which may include full market cycles, and compared to peer groups, as applicable, over the same periods, taking into account relevant factors including the following: general market conditions; issuer-specific information; tactical opportunities for investment; and fund cash flows and other factors.
The Independent Trustees recognize that shareholders evaluate performance on a net basis over their own holding periods, for which one-, three-, and five-year periods are often used as a proxy. For this reason, the performance information reviewed by the Board also included net cumulative calendar year total return information for the fund and an appropriate benchmark index for the most recent one-, three-, and five-year periods, as shown below. A peer group comparison is not shown below.
Annual Report
Fidelity Emerging Europe, Middle East, Africa (EMEA) Fund
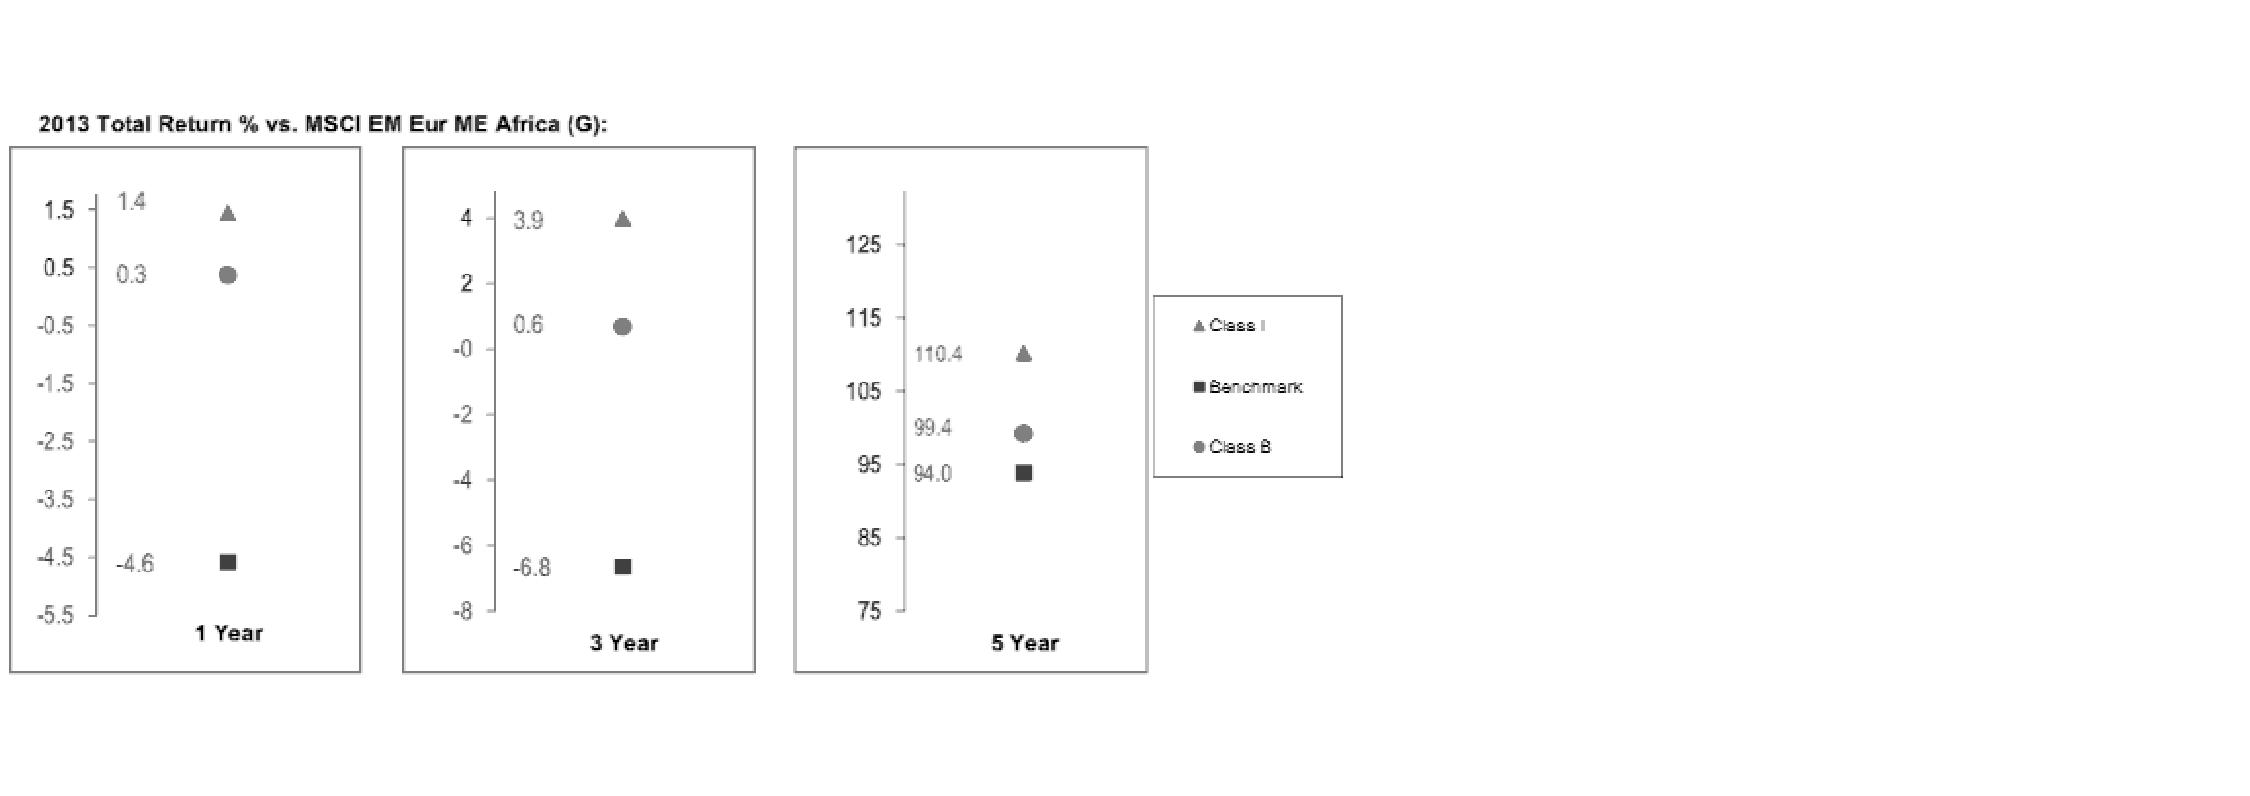
Based on its review, the Board concluded that the nature, extent, and quality of services provided to the fund under the Advisory Contracts should benefit the fund's shareholders.
Competitiveness of Management Fee and Total Expense Ratio. The Board considered the fund's management fee and total expense ratio compared to "mapped groups" of competitive funds and classes. Fidelity creates "mapped groups" by combining similar Lipper investment objective categories that have comparable investment mandates. Combining Lipper investment objective categories aids the Board's management fee and total expense ratio comparisons by broadening the competitive group used for comparison and by reducing the number of universes to which various Fidelity funds are compared.
Management Fee. The Board considered two proprietary management fee comparisons for the 12-month periods shown in the chart below. The group of Lipper funds used by the Board for management fee comparisons is referred to below as the "Total Mapped Group." The Total Mapped Group comparison focuses on a fund's standing in terms of gross management fees before expense reimbursements or caps relative to the total universe of funds with comparable investment mandates, regardless of whether their management fee structures also are comparable. Funds with comparable investment mandates offer exposure to similar types of securities. Funds with comparable management fee structures have similar management fee contractual arrangements (e.g., flat rate charged for advisory services, all-inclusive fee rate, etc.). "TMG %" represents the percentage of funds in the Total Mapped Group that had management fees that were lower than the fund's. For example, a hypothetical TMG % of 20% would mean that 80% of the funds in the Total Mapped Group had higher, and 20% had lower, management fees than the fund. The fund's actual TMG %s are in the chart below. The "Asset-Size Peer Group" (ASPG) comparison focuses on a fund's standing relative to a subset of non-Fidelity funds within the Total Mapped Group that are similar in size and management fee structure. For example, if a fund is in the first quartile of the ASPG, the fund's management fee ranks in the least expensive or lowest 25% of funds in the ASPG. The ASPG represents at least 15% of the funds in the Total Mapped Group with comparable asset size and management fee structures, subject to a minimum of 50 funds (or all funds in the Total Mapped Group if fewer than 50). Additional information, such as the ASPG quartile in which the fund's management fee rate ranked, is also included in the chart and considered by the Board.
Annual Report
Board Approval of Investment Advisory Contracts and
Management Fees - continued
Fidelity Emerging Europe, Middle East, Africa (EMEA) Fund

The Board noted that the fund's management fee rate ranked below the median of its Total Mapped Group and below the median of its ASPG for 2013.
The Board also noted that, in August 2013, the ad hoc Committee on Management Fees was formed to conduct an in-depth review of the management fee rates of Fidelity's active equity mutual funds. The Committee focused on the following areas: (i) standard fee structures; (ii) research consumption and trading evolution; (iii) management fee competitiveness/profitability by category; and (iv) factors that drive institutional pricing.
Based on its review, the Board concluded that the fund's management fee is fair and reasonable in light of the services that the fund receives and the other factors considered.
Annual Report
Total Expense Ratio. In its review of each class's total expense ratio, the Board considered the fund's management fee as well as other fund or class expenses, as applicable, such as transfer agent fees, pricing and bookkeeping fees, fund-paid 12b-1 fees, and custodial, legal, and audit fees. The Board also noted the effects of any waivers and reimbursements on fees and expenses. As part of its review, the Board also considered the current and historical total expense ratios of each class of the fund compared to competitive fund median expenses. Each class of the fund is compared to those funds and classes in the Total Mapped Group (used by the Board for management fee comparisons) that have a similar sales load structure.
The Board noted that the total expense ratio of each of Class A, Institutional Class, and the retail class ranked below its competitive median for 2013 and the total expense ratio of each of Class T, Class B, and Class C ranked above its competitive median for 2013. The Board considered that, in general, various factors can affect total expense ratios. The Board noted that the total expense ratio of Class T was above the competitive median primarily because of higher 12b-1 fees on Class T as compared to most competitor funds. Class T has a higher 12b-1 fee, but a lower front-end sales charge, than traditionally priced front-end sales charge classes. The Board considered that Class T is primarily sold load-waived in the retirement plan market where its 0.50% 12b-1 fee is comparable to competing no-load, higher 12b-1 fee classes designed specifically for retirement plans. The Board noted that the fund offers multiple classes, each of which has a different sales load and 12b-1 fee structure, and that the multiple structures are intended to offer a range of pricing options for the intermediary market. The Board also noted that the total expense ratios of the classes vary primarily by the level of their 12b-1 fees, although differences in transfer agent fees may also cause expenses to vary from class to class.
Fees Charged to Other Fidelity Clients. The Board also considered Fidelity fee structures and other information with respect to clients of Fidelity, such as other funds advised or subadvised by Fidelity, pension plan clients, and other institutional clients. The Board noted the findings of the 2013 ad hoc joint committee (created with the board of other Fidelity funds), which reviewed and compared Fidelity's institutional investment advisory business with its business of providing services to the Fidelity funds, including the differences in services provided, fees charged, and costs incurred, as well as competition in their respective marketplaces.
Based on its review of total expense ratios and fees charged to other Fidelity clients, the Board concluded that the total expense ratio of each class of the fund was reasonable, although in some cases above the median of the universe presented for comparison, in light of the services that the fund and its shareholders receive and the other factors considered.
Costs of the Services and Profitability. The Board considered the revenues earned and the expenses incurred by Fidelity in conducting the business of developing, marketing, distributing, managing, administering and servicing the fund and servicing the fund's shareholders. The Board also considered the level of Fidelity's profits in respect of all the Fidelity funds.
Annual Report
Board Approval of Investment Advisory Contracts and
Management Fees - continued
On an annual basis, Fidelity presents to the Board Fidelity's profitability for the fund. Fidelity calculates the profitability for each fund, as well as aggregate profitability for groups of Fidelity funds and all Fidelity funds, using a series of detailed revenue and cost allocation methodologies which originate with the books and records of Fidelity on which Fidelity's audited financial statements are based. The Audit Committee of the Board reviews any significant changes from the prior year's methodologies.
PricewaterhouseCoopers LLP (PwC), independent registered public accounting firm and auditor to Fidelity and certain Fidelity funds, has been engaged annually by the Board as part of the Board's assessment of Fidelity's profitability analysis. PwC's engagement includes the review and assessment of the methodologies used by Fidelity in determining the revenues and expenses attributable to Fidelity's mutual fund business, and completion of agreed-upon procedures in respect of the mathematical accuracy of fund profitability and its conformity to established allocation methodologies. After considering PwC's reports issued under the engagement and information provided by Fidelity, the Board concluded that while other allocation methods may also be reasonable, Fidelity's profitability methodologies are reasonable in all material respects.
The Board also reviewed Fidelity's non-fund businesses and fall-out benefits related to the mutual fund business as well as cases where Fidelity's affiliates may benefit from or be related to the fund's business.
The Board considered the costs of the services provided by and the profits realized by Fidelity in connection with the operation of the fund and was satisfied that the profitability was not excessive in the circumstances.
Economies of Scale. The Board considered whether there have been economies of scale in respect of the management of the Fidelity funds, whether the Fidelity funds (including the fund) have appropriately benefited from any such economies of scale, and whether there is potential for realization of any further economies of scale. The Board considered the extent to which the fund will benefit from economies of scale through increased services to the fund, through waivers or reimbursements, or through fee or expense ratio reductions. The Board also noted that in 2013, it and the boards of other Fidelity funds created an ad hoc committee (the Economies of Scale Committee) to analyze whether Fidelity attains economies of scale in respect of the management and servicing of the Fidelity funds, whether the Fidelity funds have appropriately benefited from such economies of scale, and whether there is potential for realization of any further economies of scale.
Annual Report
The Board recognized that the fund's management contract incorporates a "group fee" structure, which provides for lower group fee rates as total group assets increase, and for higher group fee rates as total group assets decrease (with "group assets" defined to include fund assets under FMR's management plus sector fund assets previously under FMR's management and currently managed by Fidelity SelectCo, LLC). FMR calculates the group fee rates based on a tiered asset "breakpoint" schedule that varies based on asset class. The Board considered that the group fee is designed to deliver the benefits of economies of scale to fund shareholders when total Fidelity fund assets increase, even if assets of any particular fund are unchanged or have declined, because some portion of Fidelity's costs are attributable to services provided to all Fidelity funds, and all funds benefit if those costs can be allocated among more assets. The Board concluded that, given the group fee structure, fund shareholders will benefit from lower management fees as group assets increase at the fund complex level, regardless of whether Fidelity achieves any such economies of scale.
The Board concluded, taking into account the analysis of the Economies of Scale Committee, that economies of scale, if any, are being appropriately shared between fund shareholders and Fidelity.
Additional Information Requested by the Board. In order to develop fully the factual basis for consideration of the Fidelity funds' Advisory Contracts, the Board requested and received additional information on certain topics, including: (i) fund performance trends and Fidelity's long-term strategies for certain funds; (ii) Fidelity's strategic marketing and product lineup goals; (iii) the methodology with respect to competitive fund data and peer group classifications; (iv) the arrangements with, and performance of, certain sub-advisers on behalf of the Fidelity funds, as well as certain proposed participating affiliate arrangements; (v) the realization of fall-out benefits in certain Fidelity business units; (vi) Fidelity's group fee structures, including the rationale for the individual fee rates of certain categories of funds and the definition of group assets; (vii) trends regarding industry use of performance fee structures and the performance adjustment methodologies applicable to the Fidelity funds; (viii) additional competitive analysis regarding the total expenses for certain classes; (ix) fund profitability methodology, including Fidelity's cost allocation methodology, and the impact of certain factors on fund profitability results; and (x) the process by which Fidelity determines sub-advisory fees for funds it advises.
Based on its evaluation of all of the conclusions noted above, and after considering all factors it believed relevant, the Board ultimately concluded that the advisory fee structures are fair and reasonable, and that the fund's Advisory Contracts should be renewed.
Annual Report
Investment Adviser
Fidelity Management & Research Company
Boston, MA
Investment Sub-Advisers
FMR Co., Inc.
Fidelity Management & Research
(U.K.) Inc.
FIL Investments (Japan) Limited
FIL Investment Advisors
FIL Investment Advisors
(U.K.) Limited
Fidelity Management & Research
(Hong Kong) Limited
Fidelity Management & Research
(Japan) Limited
General Distributor
Fidelity Distributors Corporation
Smithfield, RI
Transfer and Service Agents
Fidelity Investments Institutional
Operations Company, Inc.
Boston, MA
Fidelity Service Company, Inc.
Boston, MA
Custodian
State Street Bank & Trust Company
Quincy, MA
(Fidelity Investment logo)(registered trademark)
AEME-UANN-1214
1.861988.106
(Fidelity Investment logo)(registered trademark)
Fidelity Advisor®
Emerging Europe,
Middle East, Africa (EMEA)
Fund - Institutional Class
Annual Report
October 31, 2014
(Fidelity Cover Art)
Institutional Class is a
class of Fidelity® Emerging Europe, Middle East, Africa (EMEA) Fund
Contents
Performance | (Click Here) | How the fund has done over time. |
Management's Discussion of Fund Performance | (Click Here) | The Portfolio Manager's review of fund performance and strategy. |
Shareholder Expense Example | (Click Here) | An example of shareholder expenses. |
Investment Changes | (Click Here) | A summary of major shifts in the fund's investments over the past six months. |
Investments | (Click Here) | A complete list of the fund's investments with their market values. |
Financial Statements | (Click Here) | Statements of assets and liabilities, operations, and changes in net assets, as well as financial highlights. |
Notes | (Click Here) | Notes to the financial statements. |
Report of Independent Registered Public Accounting Firm | (Click Here) | |
Trustees and Officers | (Click Here) | |
Distributions | (Click Here) | |
Board Approval of Investment Advisory Contracts and Management Fees | (Click Here) | |
To view a fund's proxy voting guidelines and proxy voting record for the 12-month period ended June 30, visit http://www.fidelity.com/proxyvotingresults or visit the Securities and Exchange Commission's (SEC) web site at http://www.sec.gov. You may also call 1-877-208-0098 to request a free copy of the proxy voting guidelines.
Standard & Poor's, S&P and S&P 500 are registered service marks of The McGraw-Hill Companies, Inc. and have been licensed for use by Fidelity Distributors Corporation.
Other third-party marks appearing herein are the property of their respective owners.
All other marks appearing herein are registered or unregistered trademarks or service marks of FMR LLC or an affiliated company. © 2014 FMR LLC. All rights reserved.
Annual Report
This report and the financial statements contained herein are submitted for the general information of the shareholders of the fund. This report is not authorized for distribution to prospective investors in the fund unless preceded or accompanied by an effective prospectus.
A fund files its complete schedule of portfolio holdings with the SEC for the first and third quarters of each fiscal year on Form N-Q. Forms N-Q are available on the SEC's web site at http://www.sec.gov. A fund's Forms N-Q may be reviewed and copied at the SEC's Public Reference Room in Washington, DC. Information regarding the operation of the SEC's Public Reference Room may be obtained by calling 1-800-SEC-0330. For a complete list of a fund's portfolio holdings, view the most recent holdings listing, semiannual report, or annual report on Fidelity's web site at http://www.fidelity.com, http://www.advisor.fidelity.com, or http://www.401k.com, as applicable.
NOT FDIC INSURED • MAY LOSE VALUE • NO BANK GUARANTEE
Neither the fund nor Fidelity Distributors Corporation is a bank.
Annual Report
Average annual total return reflects the change in the value of an investment, assuming reinvestment of the class' distributions from dividend income and capital gains (the profits earned upon the sale of securities that have grown in value, if any) and assuming a constant rate of performance each year. The $10,000 table and the fund's returns do not reflect the deduction of taxes that a shareholder would pay on fund distributions or the redemption of fund shares. During periods of reimbursement by Fidelity, a fund's total return will be greater than it would be had the reimbursement not occurred. How a fund did yesterday is no guarantee of how it will do tomorrow.
Average Annual Total Returns
Periods ended October 31, 2014 | Past 1
year | Past 5
years | Life of
fund A |
Institutional Class | -3.09% | 6.42% | 0.03% |
A From May 8, 2008.
$10,000 Over Life of Fund
Let's say hypothetically that $10,000 was invested in Fidelity Advisor® Emerging Europe, Middle East, Africa (EMEA) Fund - Institutional Class on May 8, 2008, when the fund started. The chart shows how the value of your investment would have changed, and also shows how the MSCI EM (Emerging Markets) Europe, Middle East and Africa Index performed over the same period.
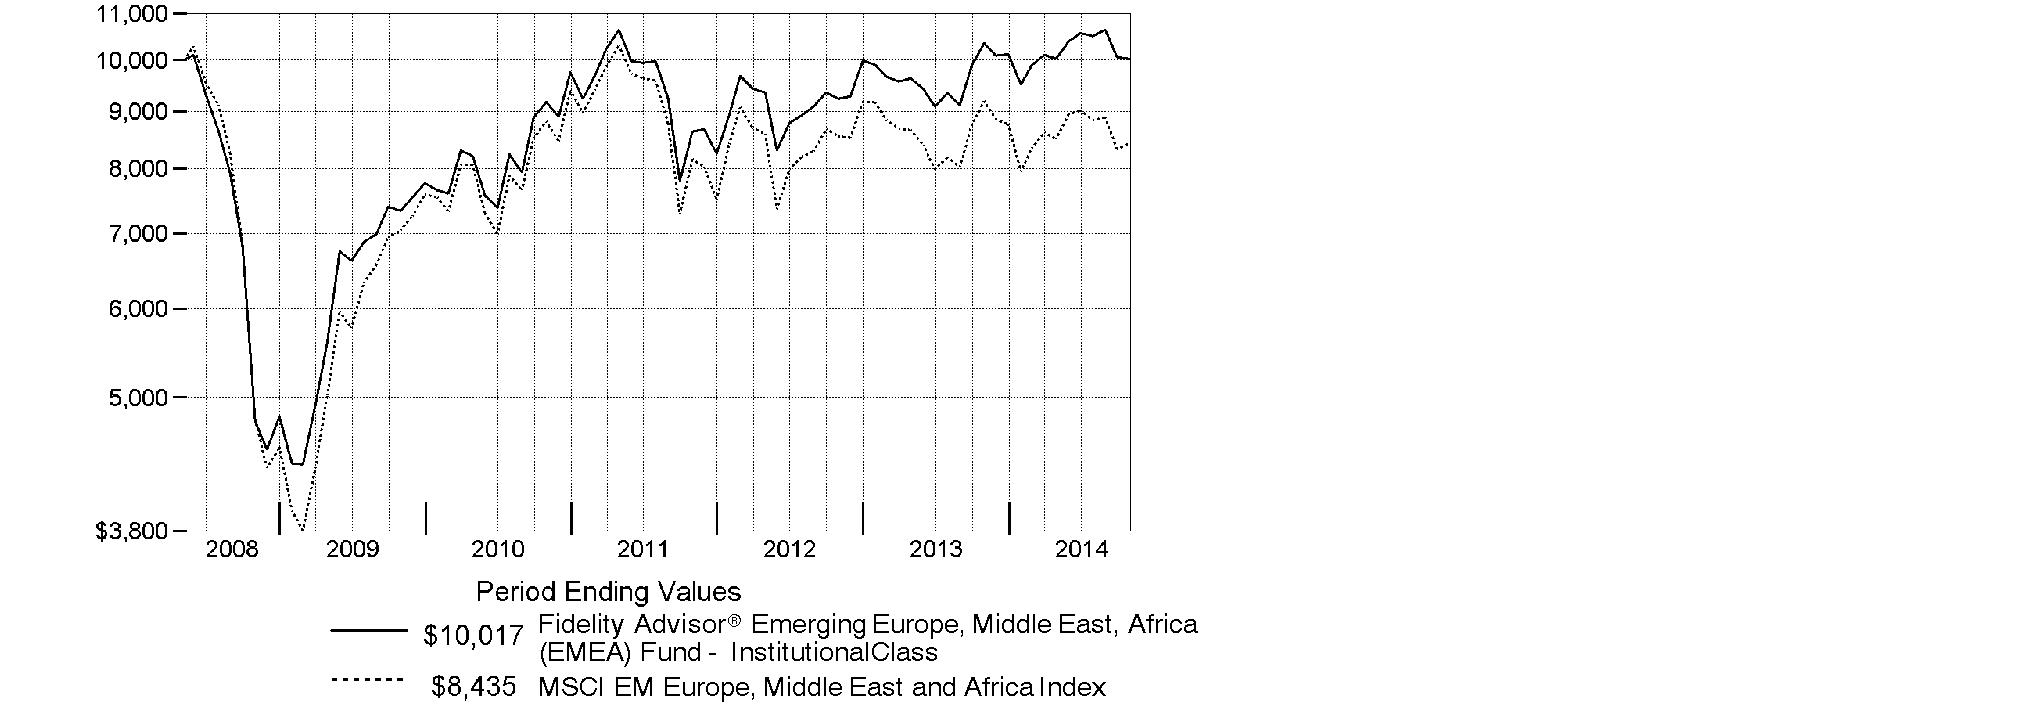
Annual Report
Market Recap: Global equities posted a healthy gain for the 12 months ending October 31, 2014, overcoming an October market decline driven by recessionary pressures in China and tepid growth in Europe. The MSCI ACWI (All Country World Index) Index rose 8.15%, helped by subdued market volatility for much of the period and supported by solid corporate earnings, especially in the United States. Stocks also benefited from easy monetary policies in Japan and the eurozone, as well as increased stimulus efforts in China. All but three of the 24 industry groups that compose the index marked a positive return. The U.S. (+17%) remained a pillar of strength, while a strongly rising dollar in the latter part of the period detracted from investors' returns in most non-U.S. markets. Canada (+5%) notched broad gains outside of its energy and materials sectors, as did Asia-Pacific ex Japan (+4%), led by investor enthusiasm for companies in India. The U.K., Europe and Japan, meanwhile, all underperformed. Among sectors, health care (+24%) led the index, with a strong contribution from the pharmaceuticals, biotechnology & life sciences industry. Information technology (+21%) also outperformed. Conversely, materials (-4%) and energy (-1%) lagged the index due to a higher supply of and lower demand for commodities.
Comments from Adam Kutas, Portfolio Manager of Fidelity Advisor® Emerging Europe, Middle East, Africa (EMEA) Fund: For the year, the fund's Institutional Class shares returned -3.09%, outperforming the -8.16% return of the MSCI EM (Emerging Market) Europe, Middle East and Africa Index. Security selection in financials and telecommunications services helped the fund's relative performance, with the top two contributors being an out-of-benchmark position in HSBC Bank and good timing with Dubai Financial Market. HSBC served as a counterparty for investments in consumer staples companies in Saudi Arabia, a country that doesn't allow foreign investment in Saudi firms. My strategy focused on overweighting investments in countries that I call "free riders," which aren't tied to other economies but have benefited from the global decline in the cost of capital. I favored "free riders" over countries and companies tied to growth in China or those closely aligned with "anchor" countries, meaning developed countries like the United States or those in the European Union. I underweighted resources-heavy Russia and South Africa. Conversely, stock selection in materials hurt relative performance, with the biggest individual detractor being an investment in South African gold producer AngloGold Ashanti.
Note to shareholders: The fund may invest up to 35% of its total assets in any industry that represents more than 20% of the emerging Europe, Middle East and Africa markets. As of October 31, 2014, the fund did not have more than 25% of its total assets in any one industry.
The views expressed above reflect those of the portfolio manager(s) only through the end of the period as stated on the cover of this report and do not necessarily represent the views of Fidelity or any other person in the Fidelity organization. Any such views are subject to change at any time based upon market or other conditions and Fidelity disclaims any responsibility to update such views. These views may not be relied on as investment advice and, because investment decisions for a Fidelity fund are based on numerous factors, may not be relied on as an indication of trading intent on behalf of any Fidelity fund.
Annual Report
Shareholder Expense Example
As a shareholder of the Fund, you incur two types of costs: (1) transaction costs, including sales charges (loads) on purchase payments or redemption proceeds, redemption fees and (2) ongoing costs, including management fees, distribution and/or service (12b-1) fees and other Fund expenses. This Example is intended to help you understand your ongoing costs (in dollars) of investing in the Fund and to compare these costs with the ongoing costs of investing in other mutual funds.
The Example is based on an investment of $1,000 invested at the beginning of the period and held for the entire period (May 1, 2014 to October 31, 2014).
Actual Expenses
The first line of the accompanying table for each class of the Fund provides information about actual account values and actual expenses. You may use the information in this line, together with the amount you invested, to estimate the expenses that you paid over the period. Simply divide your account value by $1,000.00 (for example, an $8,600 account value divided by $1,000.00 = 8.6), then multiply the result by the number in the first line for a class of the Fund under the heading entitled "Expenses Paid During Period" to estimate the expenses you paid on your account during this period. A small balance maintenance fee of $12.00 that is charged once a year may apply for certain accounts with a value of less than $2,000. This fee is not included in the table below. If it was, the estimate of expenses you paid during the period would be higher, and your ending account value lower, by this amount. In addition, the Fund, as a shareholder in the underlying Fidelity Central Funds, will indirectly bear its pro-rata share of the fees and expenses incurred by the underlying Fidelity Central Funds. These fees and expenses are not included in the Fund's annualized expense ratio used to calculate the expense estimate in the table below.
Hypothetical Example for Comparison Purposes
The second line of the accompanying table for each class of the Fund provides information about hypothetical account values and hypothetical expenses based on a Class' actual expense ratio and an assumed rate of return of 5% per year before expenses, which is not the Class' actual return. The hypothetical account values and expenses may not be used to estimate the actual ending account balance or expenses you paid for the period. You may use this information to compare the ongoing costs of investing in the Fund and other funds. To do so, compare this 5% hypothetical example with the 5% hypothetical examples that appear in the shareholder reports of the other funds. A small balance maintenance fee of $12.00 that is charged once a year may apply for certain accounts with a value of less than $2,000. This fee is not included in the table below. If it was, the estimate of expenses you paid during the period would be higher, and your ending account value lower, by this amount. In addition, the Fund, as a shareholder in the underlying Fidelity Central Funds, will indirectly bear its pro-rata share of the fees and expenses incurred by the underlying Fidelity Central Funds. These fees and expenses are not included in the Fund's annualized expense ratio used to calculate the expense estimate in the table below.
Please note that the expenses shown in the table are meant to highlight your ongoing costs only and do not reflect any transaction costs. Therefore, the second line of the table is useful in comparing ongoing costs only, and will not help you determine the relative total costs of owning different funds. In addition, if these transactional costs were included, your costs would have been higher.
Annual Report
Shareholder Expense Example - continued
| Annualized
Expense Ratio B | Beginning
Account Value
May 1, 2014 | Ending
Account Value
October 31, 2014 | Expenses Paid
During Period*
May 1, 2014
to October 31, 2014 |
Class A | 1.54% | | | |
Actual | | $ 1,000.00 | $ 997.80 | $ 7.75 |
HypotheticalA | | $ 1,000.00 | $ 1,017.44 | $ 7.83 |
Class T | 1.90% | | | |
Actual | | $ 1,000.00 | $ 996.70 | $ 9.56 |
HypotheticalA | | $ 1,000.00 | $ 1,015.63 | $ 9.65 |
Class B | 2.38% | | | |
Actual | | $ 1,000.00 | $ 994.50 | $ 11.96 |
HypotheticalA | | $ 1,000.00 | $ 1,013.21 | $ 12.08 |
Class C | 2.40% | | | |
Actual | | $ 1,000.00 | $ 994.40 | $ 12.06 |
HypotheticalA | | $ 1,000.00 | $ 1,013.11 | $ 12.18 |
Emerging Europe, Middle East, Africa (EMEA) | 1.34% | | | |
Actual | | $ 1,000.00 | $ 1,000.00 | $ 6.76 |
HypotheticalA | | $ 1,000.00 | $ 1,018.45 | $ 6.82 |
Institutional Class | 1.16% | | | |
Actual | | $ 1,000.00 | $ 1,000.00 | $ 5.85 |
HypotheticalA | | $ 1,000.00 | $ 1,019.36 | $ 5.90 |
A 5% return per year before expenses
B Annualized expense ratio reflects expenses net of applicable fee waivers.
* Expenses are equal to each Class' annualized expense ratio, multiplied by the average account value over the period, multiplied by 184/365 (to reflect the one-half year period).
Annual Report
Investment Changes (Unaudited)
Geographic Diversification (% of fund's net assets) |
As of October 31, 2014 |
 | South Africa 43.1% | |
 | Russia 20.1% | |
 | Turkey 5.5% | |
 | Poland 5.1% | |
 | United Arab Emirates 4.6% | |
 | United Kingdom 4.0% | |
 | Qatar 3.0% | |
 | Romania 1.9% | |
 | Greece 1.6% | |
 | Other* 11.1% | |

* Includes Short-Term Investments and Net Other Assets (Liabilities). |
Percentages are based on country or territory of incorporation and are adjusted for the effect of futures contracts, if applicable. |
As of April 30, 2014 |
| South Africa 39.1% | |
| Russia 21.1% | |
| Poland 6.6% | |
| United Arab Emirates 5.2% | |
| United Kingdom 4.4% | |
| Qatar 2.5% | |
| United States of America* 2.3% | |
| Czech Republic 2.3% | |
| Turkey 2.3% | |
| Other 14.2% | |

* Includes Short-Term Investments and Net Other Assets (Liabilities). |
Percentages are based on country or territory of incorporation and are adjusted for the effect of futures contracts, if applicable. |
Asset Allocation as of October 31, 2014 |
| % of fund's
net assets | % of fund's net assets
6 months ago |
Stocks | 99.9 | 97.7 |
Short-Term Investments and Net Other Assets (Liabilities) | 0.1 | 2.3 |
Top Ten Stocks as of October 31, 2014 |
| % of fund's
net assets | % of fund's net assets
6 months ago |
MTN Group Ltd. (South Africa, Wireless Telecommunication Services) | 7.4 | 6.2 |
Naspers Ltd. Class N (South Africa, Media) | 5.8 | 4.4 |
Gazprom OAO sponsored ADR (Reg. S) (Russia, Oil, Gas & Consumable Fuels) | 5.3 | 5.1 |
LUKOIL Oil Co. (Russia, Oil, Gas & Consumable Fuels) | 4.3 | 4.3 |
Sasol Ltd. (South Africa, Oil, Gas & Consumable Fuels) | 3.8 | 3.4 |
Sberbank (Savings Bank of the Russian Federation) (Russia, Banks) | 3.1 | 3.6 |
FirstRand Ltd. (South Africa, Diversified Financial Services) | 2.7 | 2.2 |
Remgro Ltd. (South Africa, Diversified Financial Services) | 2.6 | 2.2 |
Bank Polska Kasa Opieki SA (Poland, Banks) | 2.6 | 3.1 |
Standard Bank Group Ltd. (South Africa, Banks) | 2.5 | 2.5 |
| 40.1 | |
Market Sectors as of October 31, 2014 |
| % of fund's
net assets | % of fund's net assets
6 months ago |
Financials | 36.4 | 36.7 |
Energy | 18.5 | 18.7 |
Consumer Discretionary | 12.6 | 9.6 |
Telecommunication Services | 10.1 | 10.8 |
Consumer Staples | 9.1 | 8.4 |
Materials | 6.2 | 8.1 |
Health Care | 3.5 | 2.6 |
Industrials | 3.2 | 2.5 |
Information Technology | 0.3 | 0.3 |
Annual Report
Investments October 31, 2014
Showing Percentage of Net Assets
Common Stocks - 96.3% |
| Shares | | Value |
Austria - 0.5% |
CA Immobilien Anlagen AG | 31,700 | | $ 606,797 |
Bermuda - 0.4% |
Aquarius Platinum Ltd. (a) | 1,967,700 | | 522,710 |
Botswana - 0.3% |
First National Bank of Botswana Ltd. | 814,358 | | 319,114 |
Canada - 0.2% |
Africa Oil Corp. (a) | 86,600 | | 275,848 |
Croatia - 0.3% |
Ledo d.d. | 263 | | 361,058 |
Czech Republic - 1.5% |
Komercni Banka A/S | 8,305 | | 1,778,933 |
Estonia - 0.4% |
Tallinna Kaubamaja AS | 70,900 | | 444,242 |
Greece - 1.6% |
Fourlis Holdings SA (a) | 130,500 | | 513,503 |
Jumbo SA | 53,036 | | 581,543 |
Karelia Tobacco Co., Inc. | 1,970 | | 481,398 |
Sarantis SA | 37,800 | | 331,583 |
TOTAL GREECE | | 1,908,027 |
Hungary - 0.3% |
FHB Land Credit & Mortgage Bank (a) | 138,000 | | 402,441 |
Kenya - 1.2% |
British American Tobacco Kenya Ltd. | 31,700 | | 371,399 |
Kenya Commercial Bank Ltd. | 756,500 | | 465,148 |
Safaricom Ltd. | 4,416,544 | | 602,368 |
TOTAL KENYA | | 1,438,915 |
Kuwait - 1.3% |
Gulf Bank (a) | 502,300 | | 588,498 |
Kuwait Food Co. (Americana) | 95,250 | | 1,010,924 |
TOTAL KUWAIT | | 1,599,422 |
Lithuania - 0.5% |
Apranga AB (a) | 163,766 | | 537,685 |
Luxembourg - 0.5% |
Pegas NONWOVENS SA | 20,400 | | 583,544 |
Common Stocks - continued |
| Shares | | Value |
Nigeria - 0.9% |
FBN Holdings PLC | 6,000,000 | | $ 419,439 |
Zenith Bank PLC | 5,284,656 | | 676,334 |
TOTAL NIGERIA | | 1,095,773 |
Oman - 1.0% |
BankMuscat SAOG (a) | 145,000 | | 265,143 |
National Bank of Oman (a) | 945,224 | | 893,666 |
TOTAL OMAN | | 1,158,809 |
Pakistan - 1.3% |
Indus Motor Co. Ltd. | 47,000 | | 373,522 |
Pak Suzuki Motors | 247,200 | | 819,695 |
United Bank Ltd. | 190,000 | | 363,436 |
TOTAL PAKISTAN | | 1,556,653 |
Poland - 5.1% |
Bank Handlowy w Warszawie SA | 62,000 | | 2,094,085 |
Bank Polska Kasa Opieki SA | 58,600 | | 3,062,790 |
Orbis SA | 40,000 | | 435,818 |
Powszechny Zaklad Ubezpieczen SA | 3,500 | | 524,590 |
TOTAL POLAND | | 6,117,283 |
Qatar - 3.0% |
Al Meera Consumer Goods Co. (a) | 7,996 | | 407,974 |
Commercial Bank of Qatar (a) | 66,748 | | 1,354,554 |
Qatar National Bank SAQ (a) | 30,850 | | 1,815,478 |
TOTAL QATAR | | 3,578,006 |
Romania - 1.9% |
Banca Transilvania SA (a) | 1,751,868 | | 897,500 |
Bursa de Valori Bucuresti (a) | 73,404 | | 619,461 |
SNP Petrom SA | 5,839,899 | | 726,803 |
TOTAL ROMANIA | | 2,243,764 |
Russia - 16.5% |
Gazprom OAO sponsored ADR (Reg. S) | 948,200 | | 6,284,670 |
LUKOIL Oil Co. | 8,300 | | 409,112 |
LUKOIL Oil Co. sponsored ADR (United Kingdom) | 96,695 | | 4,747,725 |
Magnit OJSC (a) | 6,800 | | 1,881,412 |
Megafon OJSC GDR | 38,800 | | 907,920 |
NOVATEK OAO GDR (Reg. S) | 8,325 | | 894,105 |
Common Stocks - continued |
| Shares | | Value |
Russia - continued |
Sberbank (Savings Bank of the Russian Federation) (a) | 2,109,500 | | $ 3,738,811 |
Vozrozhdenie Bank (a) | 90,200 | | 878,716 |
TOTAL RUSSIA | | 19,742,471 |
Slovenia - 0.4% |
Krka dd Novo mesto | 6,700 | | 528,955 |
South Africa - 43.1% |
AngloGold Ashanti Ltd. (a) | 191,000 | | 1,596,175 |
Ascendis Health Ltd. | 210,000 | | 313,198 |
Aspen Pharmacare Holdings Ltd. | 67,800 | | 2,418,480 |
Cashbuild Ltd. | 71,700 | | 1,007,593 |
Clicks Group Ltd. | 329,220 | | 2,241,612 |
DRDGOLD Ltd. | 3,820,214 | | 1,063,022 |
FirstRand Ltd. | 744,300 | | 3,185,109 |
Grand Parade Investments Ltd. (a) | 727,000 | | 468,639 |
Harmony Gold Mining Co. Ltd. (a) | 347,600 | | 561,510 |
Holdsport Ltd. | 165,400 | | 682,237 |
Hulamin Ltd. (a) | 896,200 | | 552,520 |
MTN Group Ltd. | 401,950 | | 8,891,935 |
Murray & Roberts Holdings Ltd. | 112,700 | | 231,434 |
Nampak Ltd. | 618,100 | | 2,520,089 |
Naspers Ltd. Class N | 56,300 | | 7,006,472 |
Pioneer Foods Ltd. | 152,200 | | 1,642,086 |
Raubex Group Ltd. | 599,600 | | 1,212,274 |
Remgro Ltd. | 134,000 | | 3,073,444 |
RMB Holdings Ltd. | 184,600 | | 1,024,444 |
Sasol Ltd. | 92,000 | | 4,594,042 |
Shoprite Holdings Ltd. | 120,100 | | 1,739,802 |
Standard Bank Group Ltd. | 239,363 | | 3,011,094 |
Telkom SA Ltd. (a) | 142,800 | | 758,165 |
Vodacom Group Ltd. | 77,200 | | 936,710 |
Zeder Investments Ltd. | 1,590,847 | | 836,548 |
TOTAL SOUTH AFRICA | | 51,568,634 |
Turkey - 5.5% |
Aselsan A/S | 219,000 | | 995,163 |
Brisa Bridgestone S.A.B. Las San | 197,000 | | 804,787 |
Gubre Fabrikalari TAS | 298,000 | | 564,452 |
Koc Holding A/S | 275,850 | | 1,408,633 |
Logo Yazilim Sanayi Ve Ticar (a) | 32,328 | | 379,619 |
Common Stocks - continued |
| Shares | | Value |
Turkey - continued |
Pinar Sut Mamulleri Sanayi A/S | 42,000 | | $ 404,382 |
Turkiye Garanti Bankasi A/S | 505,000 | | 1,970,961 |
TOTAL TURKEY | | 6,527,997 |
United Arab Emirates - 4.6% |
Agthia Group PJSC | 300,000 | | 537,435 |
Aldar Properties PJSC (a) | 1,409,585 | | 1,228,062 |
Emaar Properties PJSC (a) | 437,227 | | 1,190,381 |
First Gulf Bank PJSC | 270,138 | | 1,334,877 |
SHUAA Capital PSC (a) | 4,749,942 | | 1,269,927 |
TOTAL UNITED ARAB EMIRATES | | 5,560,682 |
United Kingdom - 4.0% |
Abdullah Al Othaim Markets Co. ELS (HSBC Warrant Program) warrants 7/31/17 (a)(c) | 14,236 | | 412,765 |
Al Noor Hospitals Group PLC | 30,100 | | 490,658 |
Alabama Khaleej Training & Education ELS (HSBC Bank Warrant Program) warrants 7/18/16 (a)(c) | 12,900 | | 230,544 |
Aldrees Petroleum & Transport ELS (HSBC Warrant Program) warrants 2/7/17 (a)(c) | 40,399 | | 581,905 |
Fawaz Abdulaziz Alhokair & Co. ELS (HSBC Warrant Program) warrants 2/23/15 (a)(c) | 10,300 | | 320,853 |
Halwani Bros. Co. ELS (HSBC Warrant Program) warrants 5/4/15 (a)(c) | 11,262 | | 236,392 |
NMC Health PLC | 68,700 | | 544,002 |
Saudi Vitrified Clay Pipe Co. ELS (HSBC Warrant Program) warrants 5/4/15 (a)(c) | 12,000 | | 333,892 |
Saudia Dairy & Foodstuff Co. ELS (HSBC Warrant Program) warrants 6/26/15 (a)(c) | 19,000 | | 617,845 |
The Savola Group ELS (HSBC Warrant Program) warrants 2/2/15 (a)(c) | 19,000 | | 432,542 |
United International Transportation Co. ELS (HSBC Warrant Program) warrants 2/23/15 (a)(c) | 30,667 | | 605,043 |
TOTAL UNITED KINGDOM | | 4,806,441 |
TOTAL COMMON STOCKS (Cost $105,022,785) |
115,264,204
|
Nonconvertible Preferred Stocks - 3.6% |
| Shares | | Value |
Russia - 3.6% |
Surgutneftegas (a) | 3,820,100 | | $ 2,619,698 |
Tatneft OAO (a) | 505,500 | | 1,695,960 |
TOTAL NONCONVERTIBLE PREFERRED STOCKS (Cost $3,855,159) |
4,315,658
|
Money Market Funds - 0.3% |
| | | |
Fidelity Cash Central Fund, 0.11% (b)
(Cost $309,902) | 309,902 | |
309,902
|
TOTAL INVESTMENT PORTFOLIO - 100.2% (Cost $109,187,846) | | 119,889,764 |
NET OTHER ASSETS (LIABILITIES) - (0.2)% | | (200,037) |
NET ASSETS - 100% | $ 119,689,727 |
Security Type Abbreviations |
ELS | - | Equity-Linked Security |
Legend |
(a) Non-income producing |
(b) Affiliated fund that is generally available only to investment companies and other accounts managed by Fidelity Investments. The rate quoted is the annualized seven-day yield of the fund at period end. A complete unaudited listing of the fund's holdings as of its most recent quarter end is available upon request. In addition, each Fidelity Central Fund's financial statements, which are not covered by the Fund's Report of Independent Registered Public Accounting Firm, are available on the SEC's website or upon request. |
(c) Security exempt from registration under Rule 144A of the Securities Act of 1933. These securities may be resold in transactions exempt from registration, normally to qualified institutional buyers. At the end of the period, the value of these securities amounted to $3,771,781, or 3.2% of net assets. |
Affiliated Central Funds |
Information regarding fiscal year to date income earned by the Fund from investments in Fidelity Central Funds is as follows: |
Fund | Income earned |
Fidelity Cash Central Fund | $ 1,968 |
Fidelity Securities Lending Cash Central Fund | 5,426 |
Total | $ 7,394 |
Other Information |
Categorizations in the Schedule of Investments are based on country or territory of incorporation. |
The following is a summary of the inputs used, as of October 31, 2014, involving the Fund's assets and liabilities carried at fair value. The inputs or methodology used for valuing securities may not be an indication of the risk associated with investing in those securities. For more information on valuation inputs, and their aggregation into the levels used in the table below, please refer to the Investment Valuation section in the accompanying Notes to Financial Statements. |
Valuation Inputs at Reporting Date: |
Description | Total | Level 1 | Level 2 | Level 3 |
Investments in Securities: | | | | |
Equities: | | | | |
Consumer Discretionary | $ 14,825,962 | $ 13,815,038 | $ - | $ 1,010,924 |
Consumer Staples | 10,844,383 | 10,844,383 | - | - |
Energy | 22,247,963 | 17,653,921 | 4,594,042 | - |
Financials | 43,661,562 | 37,918,820 | 5,742,742 | - |
Health Care | 4,295,293 | 4,295,293 | - | - |
Industrials | 3,847,504 | 3,847,504 | - | - |
Information Technology | 379,619 | 379,619 | - | - |
Materials | 7,380,478 | 4,159,771 | 3,220,707 | - |
Telecommunication Services | 12,097,098 | 12,097,098 | - | - |
Money Market Funds | 309,902 | 309,902 | - | - |
Total Investments in Securities: | $ 119,889,764 | $ 105,321,349 | $ 13,557,491 | $ 1,010,924 |
The following is a summary of transfers between Level 1 and Level 2 for the period ended October 31, 2014. Transfers are assumed to have occurred at the beginning of the period, and are primarily attributable to the valuation techniques used for foreign equity securities, as discussed in the accompanying Notes to Financial Statements: |
Transfers | Total |
Level 1 to Level 2 | $ 1,965,445 |
Level 2 to Level 1 | $ 0 |
See accompanying notes which are an integral part of the financial statements.
Annual Report
Statement of Assets and Liabilities
| October 31, 2014 |
| | |
Assets | | |
Investment in securities, at value - See accompanying schedule: Unaffiliated issuers (cost $108,877,944) | $ 119,579,862 | |
Fidelity Central Funds (cost $309,902) | 309,902 | |
Total Investments (cost $109,187,846) | | $ 119,889,764 |
Foreign currency held at value (cost $4) | | 3 |
Receivable for investments sold | | 126,670 |
Receivable for fund shares sold | | 99,736 |
Dividends receivable | | 109,030 |
Distributions receivable from Fidelity Central Funds | | 159 |
Prepaid expenses | | 310 |
Receivable from investment adviser for expense reductions | | 11 |
Other receivables | | 3 |
Total assets | | 120,225,686 |
| | |
Liabilities | | |
Payable for investments purchased | $ 141,325 | |
Payable for fund shares redeemed | 102,074 | |
Accrued management fee | 79,618 | |
Transfer agent fee payable | 28,392 | |
Distribution and service plan fees payable | 8,448 | |
Other affiliated payables | 5,157 | |
Custody fee payable | 53,865 | |
Audit fee payable | 44,097 | |
Other payables and accrued expenses | 72,983 | |
Total liabilities | | 535,959 |
| | |
Net Assets | | $ 119,689,727 |
Net Assets consist of: | | |
Paid in capital | | $ 113,793,553 |
Undistributed net investment income | | 1,899,047 |
Accumulated undistributed net realized gain (loss) on investments and foreign currency transactions | | (6,642,175) |
Net unrealized appreciation (depreciation) on investments and assets and liabilities in foreign currencies | | 10,639,302 |
Net Assets | | $ 119,689,727 |
See accompanying notes which are an integral part of the financial statements.
Annual Report
Financial Statements - continued
Statement of Assets and Liabilities - continued
| October 31, 2014 |
| | |
Calculation of Maximum Offering Price Class A:
Net Asset Value and redemption price per share ($7,888,563 ÷ 872,420 shares) | | $ 9.04 |
| | |
Maximum offering price per share (100/94.25 of $9.04) | | $ 9.59 |
Class T:
Net Asset Value and redemption price per share ($2,465,386 ÷ 273,748 shares) | | $ 9.01 |
| | |
Maximum offering price per share (100/96.50 of $9.01) | | $ 9.34 |
Class B:
Net Asset Value and offering price per share ($294,400 ÷ 32,537 shares)A | | $ 9.05 |
| | |
Class C:
Net Asset Value and offering price per share ($6,661,556 ÷ 745,824 shares)A | | $ 8.93 |
| | |
Emerging Europe, Middle East, Africa (EMEA):
Net Asset Value, offering price and redemption price per share ($96,783,557 ÷ 10,660,010 shares) | | $ 9.08 |
| | |
Institutional Class:
Net Asset Value, offering price and redemption price per share ($5,596,265 ÷ 616,521 shares) | | $ 9.08 |
A Redemption price per share is equal to net asset value less any applicable contingent deferred sales charge.
See accompanying notes which are an integral part of the financial statements.
Annual Report
Statement of Operations
| Year ended October 31, 2014 |
| | |
Investment Income | | |
Dividends | | $ 4,542,500 |
Income from Fidelity Central Funds | | 7,394 |
Income before foreign taxes withheld | | 4,549,894 |
Less foreign taxes withheld | | (564,289) |
Total income | | 3,985,605 |
| | |
Expenses | | |
Management fee | $ 1,047,346 | |
Transfer agent fees | 354,075 | |
Distribution and service plan fees | 107,916 | |
Accounting and security lending fees | 67,810 | |
Custodian fees and expenses | 166,959 | |
Independent trustees' compensation | 543 | |
Registration fees | 79,271 | |
Audit | 64,358 | |
Legal | 481 | |
Miscellaneous | 1,160 | |
Total expenses before reductions | 1,889,919 | |
Expense reductions | (1,916) | 1,888,003 |
Net investment income (loss) | | 2,097,602 |
Realized and Unrealized Gain (Loss) Net realized gain (loss) on: | | |
Investment securities: | | |
Unaffiliated issuers (net of foreign taxes of $55,716) | (4,138,146) | |
Foreign currency transactions | (96,262) | |
Total net realized gain (loss) | | (4,234,408) |
Change in net unrealized appreciation (depreciation) on: Investment securities (net of increase in deferred foreign taxes of $62,368) | (2,799,835) | |
Assets and liabilities in foreign currencies | (11,085) | |
Total change in net unrealized appreciation (depreciation) | | (2,810,920) |
Net gain (loss) | | (7,045,328) |
Net increase (decrease) in net assets resulting from operations | | $ (4,947,726) |
See accompanying notes which are an integral part of the financial statements.
Annual Report
Financial Statements - continued
Statement of Changes in Net Assets
| Year ended
October 31,
2014 | Year ended
October 31,
2013 |
Increase (Decrease) in Net Assets | | |
Operations | | |
Net investment income (loss) | $ 2,097,602 | $ 2,849,848 |
Net realized gain (loss) | (4,234,408) | 425,876 |
Change in net unrealized appreciation (depreciation) | (2,810,920) | 11,151,522 |
Net increase (decrease) in net assets resulting from operations | (4,947,726) | 14,427,246 |
Distributions to shareholders from net investment income | (1,921,556) | (2,689,985) |
Distributions to shareholders from net realized gain | - | (1,184,624) |
Total distributions | (1,921,556) | (3,874,609) |
Share transactions - net increase (decrease) | (15,497,892) | (9,097,663) |
Redemption fees | 42,040 | 52,524 |
Total increase (decrease) in net assets | (22,325,134) | 1,507,498 |
| | |
Net Assets | | |
Beginning of period | 142,014,861 | 140,507,363 |
End of period (including undistributed net investment income of $1,899,047 and undistributed net investment income of $1,897,738, respectively) | $ 119,689,727 | $ 142,014,861 |
See accompanying notes which are an integral part of the financial statements.
Annual Report
Financial Highlights - Class A
Years ended October 31, | 2014 | 2013 | 2012 | 2011 | 2010 |
Selected Per-Share Data | | | | | |
Net asset value, beginning of period | $ 9.49 | $ 8.71 | $ 8.34 | $ 8.97 | $ 7.26 |
Income from Investment Operations | | | | | |
Net investment income (loss) C | .13 | .16 | .18 | .16F | .07 |
Net realized and unrealized gain (loss) | (.46) | .85 | .34 | (.70) | 1.70 |
Total from investment operations | (.33) | 1.01 | .52 | (.54) | 1.77 |
Distributions from net investment income | (.12) | (.15) | (.15) | (.08) | (.04) |
Distributions from net realized gain | - | (.07) | - | (.02) | (.02) |
Total distributions | (.12) | (.23) I | (.15) | (.10) | (.07) J |
Redemption fees added to paid in capital C | - H | - H | - H | .01 | .01 |
Net asset value, end of period | $ 9.04 | $ 9.49 | $ 8.71 | $ 8.34 | $ 8.97 |
Total ReturnA, B | (3.48)% | 11.75% | 6.38% | (6.05)% | 24.66% |
Ratios to Average Net Assets D, G | | | | | |
Expenses before reductions | 1.60% | 1.64% | 1.62% | 1.60% | 1.69% |
Expenses net of fee waivers, if any | 1.60% | 1.63% | 1.62% | 1.56% | 1.50% |
Expenses net of all reductions | 1.60% | 1.62% | 1.60% | 1.51% | 1.38% |
Net investment income (loss) | 1.45% | 1.82% | 2.09% | 1.70% F | .95% |
Supplemental Data | | | | | |
Net assets, end of period (000 omitted) | $ 7,889 | $ 10,883 | $ 8,934 | $ 10,260 | $ 10,045 |
Portfolio turnover rateE | 38% | 64% | 30% | 53% | 96% |
A Total returns would have been lower if certain expenses had not been reduced during the applicable periods shown.
B Total returns do not include the effect of the sales charges.
C Calculated based on average shares outstanding during the period.
D Fees and expenses of any underlying Fidelity Central Funds are not included in the Fund's expense ratio. The Fund indirectly bears its proportionate share of the expenses of any underlying Fidelity Central Funds.
E Amount does not include the portfolio activity of any underlying Fidelity Central Funds.
F Investment income per share reflects a large, non-recurring dividend which amounted to $.04 per share. Excluding this non-recurring dividend, the ratio of net investment income (loss) to average net assets would have been 1.25%.
G Expense ratios reflect operating expenses of the class. Expenses before reductions do not reflect amounts reimbursed by the investment adviser or reductions from brokerage service arrangements or reductions from other expense offset arrangements and do not represent the amount paid by the class during periods when reimbursements or reductions occur. Expenses net of fee waivers reflect expenses after reimbursement by the investment adviser but prior to reductions from brokerage service arrangements or other expense offset arrangements. Expenses net of all reductions represent the net expenses paid by the class.
H Amount represents less than $.01 per share.
I Total distributions of $.23 per share is comprised of distributions from net investment income of $.151 and distributions from net realized gain of $.074 per share.
J Total distributions of $.07 per share is comprised of distributions from net investment income of $.041 and distributions from net realized gain of $.024 per share.
See accompanying notes which are an integral part of the financial statements.
Annual Report
Financial Highlights - Class T
Years ended October 31, | 2014 | 2013 | 2012 | 2011 | 2010 |
Selected Per-Share Data | | | | | |
Net asset value, beginning of period | $ 9.46 | $ 8.68 | $ 8.31 | $ 8.96 | $ 7.25 |
Income from Investment Operations | | | | | |
Net investment income (loss) C | .11 | .14 | .15 | .13F | .06 |
Net realized and unrealized gain (loss) | (.46) | .84 | .35 | (.71) | 1.69 |
Total from investment operations | (.35) | .98 | .50 | (.58) | 1.75 |
Distributions from net investment income | (.10) | (.12) | (.13) | (.07) | (.03) |
Distributions from net realized gain | - | (.07) | - | (.02) | (.02) |
Total distributions | (.10) | (.20) I | (.13) | (.08) J | (.05) |
Redemption fees added to paid in capital C | - H | - H | - H | .01 | .01 |
Net asset value, end of period | $ 9.01 | $ 9.46 | $ 8.68 | $ 8.31 | $ 8.96 |
Total ReturnA, B | (3.67)% | 11.42% | 6.14% | (6.42)% | 24.44% |
Ratios to Average Net Assets D, G | | | | | |
Expenses before reductions | 1.92% | 1.93% | 1.89% | 1.87% | 1.95% |
Expenses net of fee waivers, if any | 1.90% | 1.90% | 1.89% | 1.84% | 1.75% |
Expenses net of all reductions | 1.90% | 1.88% | 1.86% | 1.78% | 1.62% |
Net investment income (loss) | 1.15% | 1.55% | 1.82% | 1.42% F | .70% |
Supplemental Data | | | | | |
Net assets, end of period (000 omitted) | $ 2,465 | $ 3,465 | $ 3,336 | $ 3,502 | $ 3,114 |
Portfolio turnover rateE | 38% | 64% | 30% | 53% | 96% |
A Total returns would have been lower if certain expenses had not been reduced during the applicable periods shown.
B Total returns do not include the effect of the sales charges.
C Calculated based on average shares outstanding during the period.
D Fees and expenses of any underlying Fidelity Central Funds are not included in the Fund's expense ratio. The Fund indirectly bears its proportionate share of the expenses of any underlying Fidelity Central Funds.
E Amount does not include the portfolio activity of any underlying Fidelity Central Funds.
F Investment income per share reflects a large, non-recurring dividend which amounted to $.04 per share. Excluding this non-recurring dividend, the ratio of net investment income (loss) to average net assets would have been .98%.
G Expense ratios reflect operating expenses of the class. Expenses before reductions do not reflect amounts reimbursed by the investment adviser or reductions from brokerage service arrangements or reductions from other expense offset arrangements and do not represent the amount paid by the class during periods when reimbursements or reductions occur. Expenses net of fee waivers reflect expenses after reimbursement by the investment adviser but prior to reductions from brokerage service arrangements or other expense offset arrangements. Expenses net of all reductions represent the net expenses paid by the class.
H Amount represents less than $.01 per share.
I Total distributions of $.20 per share is comprised of distributions from net investment income of $.122 and distributions from net realized gain of $.074 per share.
J Total distributions of $.08 per share is comprised of distributions from net investment income of $.068 and distributions from net realized gain of $.015 per share.
See accompanying notes which are an integral part of the financial statements.
Annual Report
Financial Highlights - Class B
Years ended October 31, | 2014 | 2013 | 2012 | 2011 | 2010 |
Selected Per-Share Data | | | | | |
Net asset value, beginning of period | $ 9.50 | $ 8.69 | $ 8.29 | $ 8.93 | $ 7.23 |
Income from Investment Operations | | | | | |
Net investment income (loss) C | .06 | .09 | .11 | .09F | .02 |
Net realized and unrealized gain (loss) | (.46) | .85 | .35 | (.71) | 1.68 |
Total from investment operations | (.40) | .94 | .46 | (.62) | 1.70 |
Distributions from net investment income | (.05) | (.06) | (.06) | (.02) | - |
Distributions from net realized gain | - | (.07) | - | (.01) | (.01) |
Total distributions | (.05) | (.13) | (.06) | (.03) | (.01) |
Redemption fees added to paid in capital C | - H | - H | - H | .01 | .01 |
Net asset value, end of period | $ 9.05 | $ 9.50 | $ 8.69 | $ 8.29 | $ 8.93 |
Total ReturnA, B | (4.23)% | 10.94% | 5.56% | (6.85)% | 23.72% |
Ratios to Average Net Assets D, G | | | | | |
Expenses before reductions | 2.40% | 2.42% | 2.38% | 2.37% | 2.47% |
Expenses net of fee waivers, if any | 2.40% | 2.40% | 2.38% | 2.33% | 2.25% |
Expenses net of all reductions | 2.40% | 2.38% | 2.35% | 2.27% | 2.12% |
Net investment income (loss) | .65% | 1.05% | 1.33% | .93% F | .20% |
Supplemental Data | | | | | |
Net assets, end of period (000 omitted) | $ 294 | $ 388 | $ 441 | $ 539 | $ 822 |
Portfolio turnover rateE | 38% | 64% | 30% | 53% | 96% |
A Total returns would have been lower if certain expenses had not been reduced during the applicable periods shown.
B Total returns do not include the effect of the contingent deferred sales charge.
C Calculated based on average shares outstanding during the period.
D Fees and expenses of any underlying Fidelity Central Funds are not included in the Fund's expense ratio. The Fund indirectly bears its proportionate share of the expenses of any underlying Fidelity Central Funds.
E Amount does not include the portfolio activity of any underlying Fidelity Central Funds.
F Investment income per share reflects a large, non-recurring dividend which amounted to $.04 per share. Excluding this non-recurring dividend, the ratio of net investment income (loss) to average net assets would have been .49%.
G Expense ratios reflect operating expenses of the class. Expenses before reductions do not reflect amounts reimbursed by the investment adviser or reductions from brokerage service arrangements or reductions from other expense offset arrangements and do not represent the amount paid by the class during periods when reimbursements or reductions occur. Expenses net of fee waivers reflect expenses after reimbursement by the investment adviser but prior to reductions from brokerage service arrangements or other expense offset arrangements. Expenses net of all reductions represent the net expenses paid by the class.
H Amount represents less than $.01 per share.
See accompanying notes which are an integral part of the financial statements.
Annual Report
Financial Highlights - Class C
Years ended October 31, | 2014 | 2013 | 2012 | 2011 | 2010 |
Selected Per-Share Data | | | | | |
Net asset value, beginning of period | $ 9.39 | $ 8.62 | $ 8.24 | $ 8.90 | $ 7.23 |
Income from Investment Operations | | | | | |
Net investment income (loss) C | .06 | .09 | .11 | .08F | .02 |
Net realized and unrealized gain (loss) | (.46) | .83 | .35 | (.69) | 1.67 |
Total from investment operations | (.40) | .92 | .46 | (.61) | 1.69 |
Distributions from net investment income | (.06) | (.08) | (.08) | (.05) | (.01) |
Distributions from net realized gain | - | (.07) | - | (.02) | (.02) |
Total distributions | (.06) | (.15) | (.08) | (.06) I | (.03) |
Redemption fees added to paid in capital C | - H | - H | - H | .01 | .01 |
Net asset value, end of period | $ 8.93 | $ 9.39 | $ 8.62 | $ 8.24 | $ 8.90 |
Total ReturnA, B | (4.24)% | 10.83% | 5.68% | (6.79)% | 23.61% |
Ratios to Average Net Assets D, G | | | | | |
Expenses before reductions | 2.40% | 2.42% | 2.37% | 2.36% | 2.45% |
Expenses net of fee waivers, if any | 2.40% | 2.40% | 2.37% | 2.33% | 2.25% |
Expenses net of all reductions | 2.40% | 2.38% | 2.35% | 2.27% | 2.13% |
Net investment income (loss) | .65% | 1.05% | 1.34% | .93% F | .20% |
Supplemental Data | | | | | |
Net assets, end of period (000 omitted) | $ 6,662 | $ 6,782 | $ 7,770 | $ 6,650 | $ 5,151 |
Portfolio turnover rateE | 38% | 64% | 30% | 53% | 96% |
A Total returns would have been lower if certain expenses had not been reduced during the applicable periods shown.
B Total returns do not include the effect of the contingent deferred sales charge.
C Calculated based on average shares outstanding during the period.
D Fees and expenses of any underlying Fidelity Central Funds are not included in the Fund's expense ratio. The Fund indirectly bears its proportionate share of the expenses of any underlying Fidelity Central Funds.
E Amount does not include the portfolio activity of any underlying Fidelity Central Funds.
F Investment income per share reflects a large, non-recurring dividend which amounted to $.04 per share. Excluding this non-recurring dividend, the ratio of net investment income (loss) to average net assets would have been .49%.
G Expense ratios reflect operating expenses of the class. Expenses before reductions do not reflect amounts reimbursed by the investment adviser or reductions from brokerage service arrangements or reductions from other expense offset arrangements and do not represent the amount paid by the class during periods when reimbursements or reductions occur. Expenses net of fee waivers reflect expenses after reimbursement by the investment adviser but prior to reductions from brokerage service arrangements or other expense offset arrangements. Expenses net of all reductions represent the net expenses paid by the class.
H Amount represents less than $.01 per share.
I Total distributions of $.06 per share is comprised of distributions from net investment income of $.047 and distributions from net realized gain of $.015 per share.
See accompanying notes which are an integral part of the financial statements.
Annual Report
Financial Highlights - Emerging Europe, Middle East, Africa (EMEA)
Years ended October 31, | 2014 | 2013 | 2012 | 2011 | 2010 |
Selected Per-Share Data | | | | | |
Net asset value, beginning of period | $ 9.52 | $ 8.75 | $ 8.37 | $ 9.00 | $ 7.28 |
Income from Investment Operations | | | | | |
Net investment income (loss) B | .16 | .18 | .20 | .18E | .09 |
Net realized and unrealized gain (loss) | (.47) | .84 | .35 | (.71) | 1.70 |
Total from investment operations | (.31) | 1.02 | .55 | (.53) | 1.79 |
Distributions from net investment income | (.13) | (.18) | (.17) | (.09) | (.05) |
Distributions from net realized gain | - | (.07) | - | (.02) | (.02) |
Total distributions | (.13) | (.25) | (.17) | (.11) | (.08) H |
Redemption fees added to paid in capital B | - G | - G | - G | .01 | .01 |
Net asset value, end of period | $ 9.08 | $ 9.52 | $ 8.75 | $ 8.37 | $ 9.00 |
Total ReturnA | (3.21)% | 11.90% | 6.81% | (5.91)% | 24.92% |
Ratios to Average Net Assets C, F | | | | | |
Expenses before reductions | 1.37% | 1.40% | 1.37% | 1.35% | 1.45% |
Expenses net of fee waivers, if any | 1.37% | 1.40% | 1.37% | 1.31% | 1.25% |
Expenses net of all reductions | 1.37% | 1.38% | 1.34% | 1.25% | 1.12% |
Net investment income (loss) | 1.68% | 2.05% | 2.34% | 1.95% E | 1.21% |
Supplemental Data | | | | | |
Net assets, end of period (000 omitted) | $ 96,784 | $ 110,265 | $ 111,441 | $ 114,117 | $ 140,270 |
Portfolio turnover rateD | 38% | 64% | 30% | 53% | 96% |
A Total returns would have been lower if certain expenses had not been reduced during the applicable periods shown.
B Calculated based on average shares outstanding during the period.
C Fees and expenses of any underlying Fidelity Central Funds are not included in the Fund's expense ratio. The Fund indirectly bears its proportionate share of the expenses of any underlying Fidelity Central Funds.
D Amount does not include the portfolio activity of any underlying Fidelity Central Funds.
E Investment income per share reflects a large, non-recurring dividend which amounted to $.04 per share. Excluding this non-recurring dividend, the ratio of net investment income (loss) to average net assets would have been 1.51%.
F Expense ratios reflect operating expenses of the class. Expenses before reductions do not reflect amounts reimbursed by the investment adviser or reductions from brokerage service arrangements or reductions from other expense offset arrangements and do not represent the amount paid by the class during periods when reimbursements or reductions occur. Expenses net of fee waivers reflect expenses after reimbursement by the investment adviser but prior to reductions from brokerage service arrangements or other expense offset arrangements. Expenses net of all reductions represent the net expenses paid by the class.
G Amount represents less than $.01 per share.
H Total distributions of $.08 per share is comprised of distributions from net investment income of $.052 and distributions from net realized gain of $.024 per share.
See accompanying notes which are an integral part of the financial statements.
Annual Report
Financial Highlights - Institutional Class
Years ended October 31, | 2014 | 2013 | 2012 | 2011 | 2010 |
Selected Per-Share Data | | | | | |
Net asset value, beginning of period | $ 9.52 | $ 8.75 | $ 8.37 | $ 9.00 | $ 7.28 |
Income from Investment Operations | | | | | |
Net investment income (loss) B | .16 | .19 | .21 | .19E | .09 |
Net realized and unrealized gain (loss) | (.46) | .84 | .35 | (.72) | 1.70 |
Total from investment operations | (.30) | 1.03 | .56 | (.53) | 1.79 |
Distributions from net investment income | (.14) | (.19) | (.18) | (.09) | (.05) |
Distributions from net realized gain | - | (.07) | - | (.02) | (.02) |
Total distributions | (.14) | (.26) | (.18) | (.11) | (.08) H |
Redemption fees added to paid in capital B | - G | - G | - G | .01 | .01 |
Net asset value, end of period | $ 9.08 | $ 9.52 | $ 8.75 | $ 8.37 | $ 9.00 |
Total ReturnA | (3.09)% | 12.05% | 6.93% | (5.91)% | 24.95% |
Ratios to Average Net Assets C, F | | | | | |
Expenses before reductions | 1.26% | 1.30% | 1.28% | 1.26% | 1.34% |
Expenses net of fee waivers, if any | 1.26% | 1.30% | 1.28% | 1.24% | 1.25% |
Expenses net of all reductions | 1.26% | 1.28% | 1.25% | 1.19% | 1.13% |
Net investment income (loss) | 1.79% | 2.15% | 2.43% | 2.02% E | 1.20% |
Supplemental Data | | | | | |
Net assets, end of period (000 omitted) | $ 5,596 | $ 10,231 | $ 8,586 | $ 7,633 | $ 7,171 |
Portfolio turnover rateD | 38% | 64% | 30% | 53% | 96% |
A Total returns would have been lower if certain expenses had not been reduced during the applicable periods shown.
B Calculated based on average shares outstanding during the period.
C Fees and expenses of any underlying Fidelity Central Funds are not included in the Fund's expense ratio. The Fund indirectly bears its proportionate share of the expenses of any underlying Fidelity Central Funds.
D Amount does not include the portfolio activity of any underlying Fidelity Central Funds.
E Investment income per share reflects a large, non-recurring dividend which amounted to $.04 per share. Excluding this non-recurring dividend, the ratio of net investment income (loss) to average net assets would have been 1.58%.
F Expense ratios reflect operating expenses of the class. Expenses before reductions do not reflect amounts reimbursed by the investment adviser or reductions from brokerage service arrangements or reductions from other expense offset arrangements and do not represent the amount paid by the class during periods when reimbursements or reductions occur. Expenses net of fee waivers reflect expenses after reimbursement by the investment adviser but prior to reductions from brokerage service arrangements or other expense offset arrangements. Expenses net of all reductions represent the net expenses paid by the class.
G Amount represents less than $.01 per share.
H Total distributions of $.08 per share is comprised of distributions from net investment income of $.054 and distributions from net realized gain of $.024 per share.
See accompanying notes which are an integral part of the financial statements.
Annual Report
Notes to Financial Statements
For the period ended October 31, 2014
1. Organization.
Fidelity Emerging Europe, Middle East, Africa (EMEA) Fund (the Fund) is a fund of Fidelity Investment Trust (the Trust) and is authorized to issue an unlimited number of shares. The Trust is registered under the Investment Company Act of 1940, as amended (the 1940 Act), as an open-end management investment company organized as a Massachusetts business trust. The Fund offers Class A, Class T, Class C, Emerging Europe, Middle East, Africa (EMEA) and Institutional Class, each of which, along with Class B shares, has equal rights as to assets and voting privileges. Class B shares are closed to new accounts and additional purchases, except for exchanges and reinvestments. Each class has exclusive voting rights with respect to matters that affect that class. Class B shares will automatically convert to Class A shares after a holding period of seven years from the initial date of purchase. The Fund's investments in emerging markets can be subject to social, economic, regulatory, and political uncertainties and can be extremely volatile.
2. Investments in Fidelity Central Funds.
The Fund invests in Fidelity Central Funds, which are open-end investment companies generally available only to other investment companies and accounts managed by the investment adviser and its affiliates. The Fund's Schedule of Investments lists each of the Fidelity Central Funds held as of period end, if any, as an investment of the Fund, but does not include the underlying holdings of each Fidelity Central Fund. As an Investing Fund, the Fund indirectly bears its proportionate share of the expenses of the underlying Fidelity Central Funds.
The Money Market Central Funds seek preservation of capital and current income and are managed by Fidelity Investments Money Management, Inc. (FIMM), an affiliate of the investment adviser. Annualized expenses of the Money Market Central Funds as of their most recent shareholder report date are less than .01%.
In addition, the financial statements of the Fidelity Central Funds are available on the SEC website or upon request.
3. Significant Accounting Policies.
The financial statements have been prepared in conformity with accounting principles generally accepted in the United States of America (GAAP), which require management to make certain estimates and assumptions at the date of the financial statements. Actual results could differ from those estimates. Subsequent events, if any, through the date that the financial statements were issued have been evaluated in the preparation of
Annual Report
Notes to Financial Statements - continued
3. Significant Accounting Policies - continued
the financial statements. The following summarizes the significant accounting policies of the Fund:
Investment Valuation. Investments are valued as of 4:00 p.m. Eastern time on the last calendar day of the period. In accordance with valuation policies and procedures approved by the Board of Trustees (the Board), the Fund attempts to obtain prices from one or more third party pricing vendors or brokers to value its investments. When current market prices, quotations or currency exchange rates are not readily available or reliable, investments will be fair valued in good faith by the Fidelity Management & Research Company (FMR) Fair Value Committee (the Committee), in accordance with procedures adopted by the Board. Factors used in determining fair value vary by investment type and may include market or investment specific events. The frequency with which these procedures are used cannot be predicted and they may be utilized to a significant extent. The Committee oversees the Fund's valuation policies and procedures and is responsible for approving and reporting to the Board all fair value determinations.
The Fund categorizes the inputs to valuation techniques used to value its investments into a disclosure hierarchy consisting of three levels as shown below:
Level 1 - quoted prices in active markets for identical investments
Level 2 - other significant observable inputs (including quoted prices for similar investments, interest rates, prepayment speeds, etc.)
Level 3 - unobservable inputs (including the Fund's own assumptions based on the best information available)
Valuation techniques used to value the Fund's investments by major category are as follows:
Equity securities, including restricted securities, for which market quotations are readily available, are valued at the last reported sale price or official closing price as reported by a third party pricing vendor on the primary market or exchange on which they are traded and are categorized as Level 1 in the hierarchy. In the event there were no sales during the day or closing prices are not available, securities are valued at the last quoted bid price or may be valued using the last available price and are generally categorized as Level 2 in the hierarchy. For foreign equity securities, when market or security specific events arise, comparisons to the valuation of American Depositary Receipts (ADRs), futures contracts, Exchange-Traded Funds (ETFs) and certain indexes as well as quoted prices for similar securities may be used and would be categorized as Level 2 in the hierarchy. Utilizing these techniques may result in transfers between Level 1 and Level 2. For equity securities, including restricted securities, where observable inputs are
Annual Report
3. Significant Accounting Policies - continued
Investment Valuation - continued
limited, assumptions about market activity and risk are used and these securities may be categorized as Level 3 in the hierarchy.
Investments in open-end mutual funds, including the Fidelity Central Funds, are valued at their closing net asset value (NAV) each business day and are categorized as Level 1 in the hierarchy.
Changes in valuation techniques may result in transfers in or out of an assigned level within the disclosure hierarchy. The aggregate value of investments by input level, as of October 31, 2014, including information on transfers between Levels 1 and 2, is included at the end of the Fund's Schedule of Investments.
Foreign Currency. The Fund may use foreign currency contracts to facilitate transactions in foreign-denominated securities. Gains and losses from these transactions may arise from changes in the value of the foreign currency or if the counterparties do not perform under the contracts' terms.
Foreign-denominated assets, including investment securities, and liabilities are translated into U.S. dollars at the exchange rates at period end. Purchases and sales of investment securities, income and dividends received and expenses denominated in foreign currencies are translated into U.S. dollars at the exchange rate in effect on the transaction date.
The effects of exchange rate fluctuations on investments are included with the net realized and unrealized gain (loss) on investment securities. Other foreign currency transactions resulting in realized and unrealized gain (loss) are disclosed separately.
Investment Transactions and Income. For financial reporting purposes, the Fund's investment holdings and NAV include trades executed through the end of the last business day of the period. The NAV per share for processing shareholder transactions is calculated as of the close of business of the New York Stock Exchange (NYSE), normally 4:00 p.m. Eastern time and includes trades executed through the end of the prior business day. Gains and losses on securities sold are determined on the basis of identified cost. Dividend income is recorded on the ex-dividend date, except for certain dividends from foreign securities where the ex-dividend date may have passed, which are recorded as soon as the Fund is informed of the ex-dividend date. Non-cash dividends included in dividend income, if any, are recorded at the fair market value of the securities received. Investment income is recorded net of foreign taxes withheld where recovery of such taxes is uncertain.
Annual Report
Notes to Financial Statements - continued
3. Significant Accounting Policies - continued
Class Allocations and Expenses. Investment income, realized and unrealized capital gains and losses, common expenses of the Fund, and certain fund-level expense reductions, if any, are allocated daily on a pro-rata basis to each class based on the relative net assets of each class to the total net assets of the Fund. Each class differs with respect to transfer agent and distribution and service plan fees incurred. Certain expense reductions may also differ by class. For the reporting period, the allocated portion of income and expenses to each class as a percent of its average net assets may vary due to the timing of recording these transactions in relation to fluctuating net assets of the classes. Expenses directly attributable to a fund are charged to that fund. Expenses attributable to more than one fund are allocated among the respective funds on the basis of relative net assets or other appropriate methods. Expense estimates are accrued in the period to which they relate and adjustments are made when actual amounts are known.
Income Tax Information and Distributions to Shareholders. Each year, the Fund intends to qualify as a regulated investment company under Subchapter M of the Internal Revenue Code, including distributing substantially all of its taxable income and realized gains. As a result, no provision for U.S. Federal income taxes is required. As of October 31, 2014, the Fund did not have any unrecognized tax benefits in the financial statements; nor is the Fund aware of any tax positions for which it is reasonably possible that the total amounts of unrecognized tax benefits will significantly change in the next twelve months. The Fund files a U.S. federal tax return, in addition to state and local tax returns as required. The Fund's federal income tax returns are subject to examination by the Internal Revenue Service (IRS) for a period of three fiscal years after they are filed. State and local tax returns may be subject to examination for an additional fiscal year depending on the jurisdiction. Foreign taxes are provided for based on the Fund's understanding of the tax rules and rates that exist in the foreign markets in which it invests. The Fund is subject to a tax imposed on capital gains by certain countries in which it invests.
Distributions are declared and recorded on the ex-dividend date. Income dividends and capital gain distributions are declared separately for each class. Income and capital gain distributions are determined in accordance with income tax regulations, which may differ from GAAP. In addition, the Fund claimed a portion of the payment made to redeeming shareholders as a distribution for income tax purposes.
Capital accounts within the financial statements are adjusted for permanent book-tax differences. These adjustments have no impact on net assets or the results of operations. Capital accounts are not adjusted for temporary book-tax differences which will reverse in a subsequent period.
Book-tax differences are primarily due to foreign currency transactions, certain foreign taxes, passive foreign investment companies (PFIC), capital loss carryforwards and losses due to wash sales.
Annual Report
3. Significant Accounting Policies - continued
Income Tax Information and Distributions to Shareholders - continued
The federal tax cost of investment securities and unrealized appreciation (depreciation) as of period end were as follows:
Gross unrealized appreciation | $ 22,933,818 |
Gross unrealized depreciation | (13,301,769) |
Net unrealized appreciation (depreciation) on securities | $ 9,632,049 |
| |
Tax Cost | $ 110,257,715 |
The tax-based components of distributable earnings as of period end were as follows:
Undistributed ordinary income | $ 2,385,005 |
Capital loss carryforward | $ (6,057,255) |
Net unrealized appreciation (depreciation) on securities and other investments | $ 9,630,792 |
Capital loss carryforwards are only available to offset future capital gains of the Fund to the extent provided by regulations and may be limited. Under the Regulated Investment Company Modernization Act of 2010 (the Act), the Fund is permitted to carry forward capital losses incurred in taxable years beginning after December 22, 2010 for an unlimited period and such capital losses are required to be used prior to any losses that expire. The capital loss carryforward information presented below, including any applicable limitation, is estimated as of fiscal period end and is subject to adjustment.
Fiscal year of expiration | |
2018 | $ (1,624,705) |
No expiration | |
Short-term | (373,258) |
Long-term | (4,059,292) |
Total no expiration | (4,432,550) |
Total capital loss carryforward | $ (6,057,255) |
The tax character of distributions paid was as follows:
| October 31, 2014 | October 31, 2013 |
Ordinary Income | $ 1,921,556 | $ 3,874,609 |
Short-Term Trading (Redemption) Fees. Shares held by investors in the Fund less than 90 days may have been subject to a redemption fee equal to 1.50% of the NAV of shares redeemed. All redemption fees, which reduce the proceeds of the shareholder redemption, are retained by the Fund and accounted for as an addition to paid in capital.
Annual Report
Notes to Financial Statements - continued
3. Significant Accounting Policies - continued
Restricted Securities. The Fund may invest in securities that are subject to legal or contractual restrictions on resale. These securities generally may be resold in transactions exempt from registration or to the public if the securities are registered. Disposal of these securities may involve time-consuming negotiations and expense, and prompt sale at an acceptable price may be difficult. Information regarding restricted securities is included at the end of the Fund's Schedule of Investments.
New Accounting Pronouncement. In June 2014, the Financial Accounting Standards Board issued Accounting Standard Update No. 2014-11, Repurchase-to-Maturity Transactions, Repurchase Financings, and Disclosures. The Update amends the accounting for certain repurchase agreements and expands disclosure requirements for reverse repurchase agreements, securities lending and other similar transactions. The disclosure requirements are effective for annual and interim reporting periods beginning after December 15, 2014. Management is currently evaluating the impact of the Update on the Fund's financial statements and related disclosures.
4. Purchases and Sales of Investments.
Purchases and sales of securities, other than short-term securities, aggregated $49,109,257 and $63,629,040, respectively.
5. Fees and Other Transactions with Affiliates.
Management Fee. FMR and its affiliates provide the Fund with investment management related services for which the Fund pays a monthly management fee. The management fee is the sum of an individual fund fee rate that is based on an annual rate of .55% of the Fund's average net assets and an annualized group fee rate that averaged .25% during the period. The group fee rate is based upon the average net assets of all the mutual funds advised by the investment adviser, including any mutual funds previously advised by the investment adviser that are currently advised by Fidelity SelectCo, LLC, an affiliate of the investment adviser. The group fee rate decreases as assets under management increase and increases as assets under management decrease. For the reporting period, the total annual management fee rate was .80% of the Fund's average net assets.
Distribution and Service Plan Fees. In accordance with Rule 12b-1 of the 1940 Act, the Fund has adopted separate Distribution and Service Plans for each class of shares. Certain classes pay Fidelity Distributors Corporation (FDC), an affiliate of the investment adviser, separate Distribution and Service Fees, each of which is based on an annual percentage of each class' average net assets. In addition, FDC may pay financial intermediaries for selling shares of the Fund and providing shareholder support services.
Annual Report
5. Fees and Other Transactions with Affiliates - continued
Distribution and Service Plan Fees - continued
For the period, the Distribution and Service Fee rates, total fees and amounts retained by FDC were as follows:
| Distribution
Fee | Service
Fee | Total Fees | Retained
by FDC |
Class A | -% | .25% | $ 24,843 | $ 1,208 |
Class T | .25% | .25% | 13,280 | 23 |
Class B | .75% | .25% | 3,284 | 2,463 |
Class C | .75% | .25% | 66,509 | 10,322 |
| | | $ 107,916 | $ 14,016 |
Sales Load. FDC may receive a front-end sales charge of up to 5.75% for selling Class A shares and 3.50% for selling Class T shares, some of which is paid to financial intermediaries for selling shares of the Fund. Depending on the holding period, FDC may receive contingent deferred sales charges levied on Class A, Class T, Class B, and Class C redemptions. The deferred sales charges range from 5.00% to 1.00% for Class B shares, 1.00% for Class C shares, 1.00% for certain purchases of Class A shares and .25% for certain purchases of Class T shares.
For the period, sales charge amounts retained by FDC were as follows:
| Retained
by FDC |
Class A | $ 15,260 |
Class T | 1,500 |
Class B* | 445 |
Class C* | 319 |
| $ 17,524 |
* When Class B and Class C shares are initially sold, FDC pays commissions from its own resources to financial intermediaries through which the sales are made.
Transfer Agent Fees. Fidelity Investments Institutional Operations Company, Inc., (FIIOC), an affiliate of FMR, is the transfer, dividend disbursing and shareholder servicing agent for each class of the Fund. FIIOC receives account fees and asset-based fees that vary according to the account size and type of account of the shareholders of the respective classes of the Fund. FIIOC pays for typesetting, printing and mailing of shareholder reports, except proxy statements.
Annual Report
Notes to Financial Statements - continued
5. Fees and Other Transactions with Affiliates - continued
Transfer Agent Fees - continued
For the period, transfer agent fees for each class were as follows:
| Amount | % of
Class-Level Average
Net Assets |
Class A | $ 25,172 | .25 |
Class T | 8,709 | .33 |
Class B | 995 | .30 |
Class C | 20,260 | .30 |
Emerging Europe, Middle East, Africa (EMEA) | 287,461 | .28 |
Institutional Class | 11,478 | .17 |
| $ 354,075 | |
Accounting and Security Lending Fees. Fidelity Service Company, Inc. (FSC), an affiliate of the investment adviser, maintains the Fund's accounting records. The accounting fee is based on the level of average net assets for each month. Under a separate contract, FSC administers the security lending program. The security lending fee is based on the number and duration of lending transactions.
Brokerage Commissions. The Fund placed a portion of its portfolio transactions with brokerage firms which are affiliates of the investment. Brokerage commissions are included in net realized gain (loss) and change in net unrealized appreciation (depreciation) in the Statement of Operations. The commissions paid to these affiliated firms were $48 for the period.
Other. During the period, the investment adviser reimbursed the Fund for certain losses in the amount of $1,567.
6. Committed Line of Credit.
The Fund participates with other funds managed by the investment adviser or an affiliate in a $4.25 billion credit facility (the "line of credit") to be utilized for temporary or emergency purposes to fund shareholder redemptions or for other short-term liquidity purposes. The Fund has agreed to pay commitment fees on its pro-rata portion of the line of credit, which amounted to $215 and is reflected in Miscellaneous expenses on the Statement of Operations. During the period, the Fund did not borrow on this line of credit.
Annual Report
7. Security Lending.
The Fund lends portfolio securities through a lending agent from time to time in order to earn additional income. For equity securities, a lending agent is used and may loan securities to certain qualified borrowers, including Fidelity Capital Markets (FCM), a broker-dealer affiliated with the Fund. On the settlement date of the loan, the Fund receives collateral (in the form of U.S. Treasury obligations, letters of credit and/or cash) against the loaned securities and maintains collateral in an amount not less than 100% of the market value of the loaned securities during the period of the loan. The market value of the loaned securities is determined at the close of business of the Fund and any additional required collateral is delivered to the Fund on the next business day. If the borrower defaults on its obligation to return the securities loaned because of insolvency or other reasons, the Fund may apply collateral received from the borrower against the obligation. The Fund may experience delays and costs in recovering the securities loaned. Any cash collateral received is invested in the Fidelity Securities Lending Cash Central Fund. The value of loaned securities is disclosed on the Fund's Statement of Assets and Liabilities. At period end, there were no security loans outstanding. Security lending income represents the income earned on investing cash collateral, less rebates paid to borrowers and any lending agent fees associated with the loan, plus any premium payments received for lending certain types of securities. Security lending income is presented in the Statement of Operations as a component of income from Fidelity Central Funds. Total security lending income during the period amounted to $5,426. During the period, there were no securities loaned to FCM.
8. Expense Reductions.
The investment adviser voluntarily agreed to reimburse each class to the extent annual operating expenses exceeded certain levels of average net assets as noted in the table below. Some expenses, for example interest expense, including commitment fees, are excluded from this reimbursement.
The following classes were in reimbursement during the period:
| Expense
Limitations | Reimbursement |
Class T | 1.90% | $ 595 |
In addition, the investment adviser reimbursed a portion of the fund's operating expenses during the period in the amount of $1,064.
Commissions paid to certain brokers with whom the investment adviser, or its affiliates, places trades on behalf of the Fund include an amount in addition to trade execution, which may be rebated back to the Fund to offset certain expenses. This amount totaled $257 for the period.
Annual Report
Notes to Financial Statements - continued
9. Distributions to Shareholders.
Distributions to shareholders of each class were as follows:
Years ended October 31, | 2014 | 2013 |
From net investment income | | |
Class A | $ 138,741 | $ 155,525 |
Class T | 39,254 | 46,756 |
Class B | 1,980 | 2,757 |
Class C | 46,648 | 69,716 |
Emerging Europe, Middle East, Africa (EMEA) | 1,537,065 | 2,222,632 |
Institutional Class | 157,868 | 192,599 |
Total | $ 1,921,556 | $ 2,689,985 |
From net realized gain | | |
Class A | $ - | $ 76,218 |
Class T | - | 28,360 |
Class B | - | 3,579 |
Class C | - | 66,141 |
Emerging Europe, Middle East, Africa (EMEA) | - | 934,516 |
Institutional Class | - | 75,810 |
Total | $ - | $ 1,184,624 |
10. Share Transactions.
Share transactions for each class were as follows and may contain automatic conversions between classes or exchanges between funds:
| Shares | Dollars |
Years ended October 31, | 2014 | 2013 | 2014 | 2013 |
Class A | | | | |
Shares sold | 315,373 | 422,392 | $ 2,918,425 | $ 3,786,551 |
Reinvestment of distributions | 11,698 | 20,821 | 104,929 | 182,599 |
Shares redeemed | (601,453) | (321,728) | (5,463,762) | (2,828,311) |
Net increase (decrease) | (274,382) | 121,485 | $ (2,440,408) | $ 1,140,839 |
Class T | | | | |
Shares sold | 101,639 | 88,958 | $ 928,488 | $ 793,473 |
Reinvestment of distributions | 4,323 | 8,485 | 38,736 | 74,325 |
Shares redeemed | (198,384) | (115,399) | (1,797,181) | (1,019,893) |
Net increase (decrease) | (92,422) | (17,956) | $ (829,957) | $ (152,095) |
Class B | | | | |
Shares sold | 4,359 | 10,659 | $ 39,785 | $ 95,440 |
Reinvestment of distributions | 219 | 679 | 1,980 | 5,999 |
Shares redeemed | (12,911) | (21,228) | (117,435) | (189,688) |
Net increase (decrease) | (8,333) | (9,890) | $ (75,670) | $ (88,249) |
Annual Report
10. Share Transactions - continued
| Shares | Dollars |
Years ended October 31, | 2014 | 2013 | 2014 | 2013 |
Emerging Europe, Middle East, Africa (EMEA) | | | | |
Class C | | | | |
Shares sold | 241,646 | 249,509 | $ 2,211,783 | $ 2,176,685 |
Reinvestment of distributions | 3,905 | 12,615 | 34,875 | 110,128 |
Shares redeemed | (221,913) | (441,523) | (2,006,697) | (3,878,247) |
Net increase (decrease) | 23,638 | (179,399) | $ 239,961 | $ (1,591,434) |
Shares sold | 2,719,041 | 4,724,612 | $ 24,959,563 | $ 42,683,733 |
Reinvestment of distributions | 162,803 | 341,639 | 1,463,600 | 2,999,595 |
Shares redeemed | (3,802,325) | (6,228,497) | (34,854,232) | (55,025,066) |
Net increase (decrease) | (920,481) | (1,162,246) | $ (8,431,069) | $ (9,341,738) |
Institutional Class | | | | |
Shares sold | 374,756 | 478,817 | $ 3,428,841 | $ 4,308,546 |
Reinvestment of distributions | 8,639 | 10,415 | 77,579 | 91,338 |
Shares redeemed | (841,493) | (396,145) | (7,467,169) | (3,464,870) |
Net increase (decrease) | (458,098) | 93,087 | $ (3,960,749) | $ 935,014 |
11. Other.
The Fund's organizational documents provide former and current trustees and officers with a limited indemnification against liabilities arising in connection with the performance of their duties to the Fund. In the normal course of business, the Fund may also enter into contracts that provide general indemnifications. The Fund's maximum exposure under these arrangements is unknown as this would be dependent on future claims that may be made against the Fund. The risk of material loss from such claims is considered remote.
Annual Report
To the Trustees of Fidelity Investment Trust and Shareholders of Fidelity Emerging Europe, Middle East, Africa (EMEA) Fund:
We have audited the accompanying statement of assets and liabilities of Fidelity Emerging Europe, Middle East, Africa (EMEA) Fund (the Fund), a fund of Fidelity Investment Trust, including the schedule of investments, as of October 31, 2014, and the related statement of operations for the year then ended, the statement of changes in net assets for each of the two years in the period then ended, and the financial highlights for each of the five years in the period then ended. These financial statements and financial highlights are the responsibility of the Fund's management. Our responsibility is to express an opinion on these financial statements and financial highlights based on our audits.
We conducted our audits in accordance with the standards of the Public Company Accounting Oversight Board (United States). Those standards require that we plan and perform the audit to obtain reasonable assurance about whether the financial statements and financial highlights are free of material misstatement. The Fund is not required to have, nor were we engaged to perform, an audit of its internal control over financial reporting. Our audits included consideration of internal control over financial reporting as a basis for designing audit procedures that are appropriate in the circumstances, but not for the purpose of expressing an opinion on the effectiveness of the Fund's internal control over financial reporting. Accordingly, we express no such opinion. An audit also includes examining, on a test basis, evidence supporting the amounts and disclosures in the financial statements, assessing the accounting principles used and significant estimates made by management, as well as evaluating the overall financial statement presentation. Our procedures included confirmation of securities owned as of October 31, 2014, by correspondence with the custodians and brokers; where replies were not received from brokers, we performed other auditing procedures. We believe that our audits provide a reasonable basis for our opinion.
In our opinion, the financial statements and financial highlights referred to above present fairly, in all material respects, the financial position of Fidelity Emerging Europe, Middle East, Africa (EMEA) Fund as of October 31, 2014, the results of its operations for the year then ended, the changes in its net assets for each of the two years in the period then ended, and the financial highlights for each of the five years in the period then ended, in conformity with accounting principles generally accepted in the United States of America.
DELOITTE & TOUCHE LLP
Boston, Massachusetts
December 19, 2014
Annual Report
The Trustees, Member of the Advisory Board, and officers of the trust and fund, as applicable, are listed below. The Board of Trustees governs the fund and is responsible for protecting the interests of shareholders. The Trustees are experienced executives who meet periodically throughout the year to oversee the fund's activities, review contractual arrangements with companies that provide services to the fund, oversee management of the risks associated with such activities and contractual arrangements, and review the fund's performance. Except for James C. Curvey, each of the Trustees oversees 174 funds. Mr. Curvey oversees 407 funds.
The Trustees hold office without limit in time except that (a) any Trustee may resign; (b) any Trustee may be removed by written instrument, signed by at least two-thirds of the number of Trustees prior to such removal; (c) any Trustee who requests to be retired or who has become incapacitated by illness or injury may be retired by written instrument signed by a majority of the other Trustees; and (d) any Trustee may be removed at any special meeting of shareholders by a two-thirds vote of the outstanding voting securities of the trust. Each Trustee who is not an interested person (as defined in the 1940 Act) of the trust and the fund (Independent Trustee), shall retire not later than the last day of the calendar year in which his or her 75th birthday occurs. The Independent Trustees may waive this mandatory retirement age policy with respect to individual Trustees. The officers and Advisory Board Member hold office without limit in time, except that any officer and Advisory Board Member may resign or may be removed by a vote of a majority of the Trustees at any regular meeting or any special meeting of the Trustees. Except as indicated, each individual has held the office shown or other offices in the same company for the past five years.
Experience, Skills, Attributes, and Qualifications of the Fund's Trustees. The Governance and Nominating Committee has adopted a statement of policy that describes the experience, qualifications, attributes, and skills that are necessary and desirable for potential Independent Trustee candidates (Statement of Policy). The Board believes that each Trustee satisfied at the time he or she was initially elected or appointed a Trustee, and continues to satisfy, the standards contemplated by the Statement of Policy. The Governance and Nominating Committee also engages professional search firms to help identify potential Independent Trustee candidates who have the experience, qualifications, attributes, and skills consistent with the Statement of Policy. From time to time, additional criteria based on the composition and skills of the current Independent Trustees, as well as experience or skills that may be appropriate in light of future changes to board composition, business conditions, and regulatory or other developments, have also been considered by the professional search firms and the Governance and Nominating Committee. In addition, the Board takes into account the Trustees' commitment and participation in Board and committee meetings, as well as their leadership of standing and ad hoc committees throughout their tenure.
In determining that a particular Trustee was and continues to be qualified to serve as a Trustee, the Board has considered a variety of criteria, none of which, in isolation, was controlling. The Board believes that, collectively, the Trustees have balanced and diverse experience, qualifications, attributes, and skills, which allow the Board to operate effectively in governing the fund and protecting the interests of shareholders. Information about the specific experience, skills, attributes, and qualifications of each Trustee, which in each case led to the Board's conclusion that the Trustee should serve (or continue to serve) as a trustee of the fund, is provided below.
Annual Report
Board Structure and Oversight Function. James C. Curvey is an interested person (as defined in the 1940 Act) and currently serves as Chairman. The Trustees have determined that an interested Chairman is appropriate and benefits shareholders because an interested Chairman has a personal and professional stake in the quality and continuity of services provided to the fund. Independent Trustees exercise their informed business judgment to appoint an individual of their choosing to serve as Chairman, regardless of whether the Trustee happens to be independent or a member of management. The Independent Trustees have determined that they can act independently and effectively without having an Independent Trustee serve as Chairman and that a key structural component for assuring that they are in a position to do so is for the Independent Trustees to constitute a substantial majority for the Board. The Independent Trustees also regularly meet in executive session. Ned C. Lautenbach serves as Chairman of the Independent Trustees and as such (i) acts as a liaison between the Independent Trustees and management with respect to matters important to the Independent Trustees and (ii) with management prepares agendas for Board meetings.
Fidelity funds are overseen by different Boards of Trustees. The fund's Board oversees Fidelity's equity and high income funds and another Board oversees Fidelity's investment-grade bond, money market, and asset allocation funds. The asset allocation funds may invest in Fidelity funds overseen by the fund's Board. The use of separate Boards, each with its own committee structure, allows the Trustees of each group of Fidelity funds to focus on the unique issues of the funds they oversee, including common research, investment, and operational issues. On occasion, the separate Boards establish joint committees to address issues of overlapping consequences for the Fidelity funds overseen by each Board.
The Trustees operate using a system of committees to facilitate the timely and efficient consideration of all matters of importance to the Trustees, the fund, and fund shareholders and to facilitate compliance with legal and regulatory requirements and oversight of the fund's activities and associated risks. The Board, acting through its committees, has charged FMR and its affiliates with (i) identifying events or circumstances the occurrence of which could have demonstrably adverse effects on the fund's business and/or reputation; (ii) implementing processes and controls to lessen the possibility that such events or circumstances occur or to mitigate the effects of such events or circumstances if they do occur; and (iii) creating and maintaining a system designed to evaluate continuously business and market conditions in order to facilitate the identification and implementation processes described in (i) and (ii) above. Because the day-to-day operations and activities of the fund are carried out by or through FMR, its affiliates and other service providers, the fund's exposure to risks is mitigated but not eliminated by the processes overseen by the Trustees. While each of the Board's committees has responsibility for overseeing different aspects of the fund's activities, oversight is exercised primarily through the Operations, Audit, and Compliance Committees. In addition, the Independent Trustees have worked with FMR to enhance the Board's oversight of investment and financial risks, legal and regulatory risks, technology risks, and operational risks, including the development of additional risk reporting to the Board. For example, a working group comprised of Independent Trustees and FMR has worked and continues to work to review the Fidelity funds' valuation-related activities, reporting and risk management. Appropriate personnel, including but not limited to the fund's Chief Compliance Officer (CCO), FMR's internal auditor, the independent accountants, the fund's Treasurer and portfolio management personnel, make periodic reports to the Board's committees, as appropriate, including an annual review of FMR's risk management program for the Fidelity funds. The responsibilities of each standing committee, including their oversight responsibilities, are described further under "Standing Committees of the Fund's Trustees."
Annual Report
Trustees and Officers - continued
The fund's Statement of Additional Information (SAI) includes more information about the Trustees. To request a free copy, call Fidelity at 1-877-208-0098.
Interested Trustees*:
Correspondence intended for each Trustee who is an interested person may be sent to Fidelity Investments, 245 Summer Street, Boston, Massachusetts 02210.
Name, Year of Birth; Principal Occupations and Other Relevant Experience+ |
James C. Curvey (1935) |
Year of Election or Appointment: 2007 Trustee Chairman of the Board of Trustees |
| Mr. Curvey also serves as Trustee of other Fidelity funds. Mr. Curvey is a Director of Fidelity Research & Analysis Co. (2009-present), and Vice Chairman (2007-present) and Director of FMR LLC. In addition, Mr. Curvey serves as an Overseer for the Boston Symphony Orchestra and a member of the board of Artis-Naples, Naples, Florida, and as a Trustee for Brewster Academy, Wolfeboro, New Hampshire. Previously, Mr. Curvey served as a Director of Fidelity Investments Money Management, Inc. (2009-2014), a Director of FMR (2007-2014), and a Director of FMR Co., Inc. (2007-2014). |
Charles S. Morrison (1960) |
Year of Election or Appointment: 2014 Trustee |
| Mr. Morrison also serves as Trustee of other funds. He serves as a Director of Fidelity Investments Money Management, Inc. (FIMM) (2014-present), Director of Fidelity SelectCo, LLC (2014-present), President, Asset Management (2014-present), and is an employee of Fidelity Investments. Previously, Mr. Morrison served as Vice President of Fidelity's Fixed Income and Asset Allocation Funds (2012-2014), President, Fixed Income (2011-2014), Vice President of Fidelity's Money Market Funds (2005-2009), President, Money Market Group Leader of FMR (2009), and Senior Vice President, Money Market Group of FMR (2004-2009). Mr. Morrison also served as Vice President of Fidelity's Bond Funds (2002-2005), certain Balanced Funds (2002-2005), and certain Asset Allocation Funds (2002-2007), and as Senior Vice President (2002-2005) of Fidelity's Bond Division. |
* Trustees have been determined to be "Interested Trustees" by virtue of, among other things, their affiliation with the trust or various entities under common control with FMR.
+ The information above includes each Trustee's principal occupation during the last five years and other information relating to the experience, attributes, and skills relevant to each Trustee's qualifications to serve as a Trustee, which led to the conclusion that each Trustee should serve as a Trustee for the fund.
Annual Report
Trustees and Officers - continued
Independent Trustees:
Correspondence intended for each Independent Trustee (that is, the Trustees other than the Interested Trustees) may be sent to Fidelity Investments, P.O. Box 55235, Boston, Massachusetts 02205-5235.
Name, Year of Birth; Principal Occupations and Other Relevant Experience+ |
Dennis J. Dirks (1948) |
Year of Election or Appointment: 2005 Trustee |
| Mr. Dirks also serves as Trustee of other Fidelity funds. Prior to his retirement in May 2003, Mr. Dirks was Chief Operating Officer and a member of the Board of The Depository Trust & Clearing Corporation (DTCC). He also served as President, Chief Operating Officer, and Board member of The Depository Trust Company (DTC) and President and Board member of the National Securities Clearing Corporation (NSCC). In addition, Mr. Dirks served as Chief Executive Officer and Board member of the Government Securities Clearing Corporation, Chief Executive Officer and Board member of the Mortgage-Backed Securities Clearing Corporation, as a Trustee and a member of the Finance Committee of Manhattan College (2005-2008), and as a Trustee and a member of the Finance Committee of AHRC of Nassau County (2006-2008). Mr. Dirks is a member of the Independent Directors Council (IDC) Governing Council (2010-present) and Board of Directors for The Brookville Center for Children's Services, Inc. (2009-present). |
Alan J. Lacy (1953) |
Year of Election or Appointment: 2008 Trustee |
| Mr. Lacy also serves as Trustee of other Fidelity funds. Mr. Lacy serves as Senior Adviser (2007-present) of Oak Hill Capital Partners, L.P. (private equity). Mr. Lacy also served as Chief Executive Officer (2000-2005) and Vice Chairman (2005-2006) of Sears Holdings Corporation and Sears, Roebuck and Co. (retail). In addition, Mr. Lacy serves as a member of the Board of Directors of Dave & Buster's Entertainment, Inc. (restaurant and entertainment complexes, 2010-present), Earth Fare, Inc. (retail grocery, 2012-present), The Hillman Companies, Inc. (hardware wholesalers, 2010-present), and Bristol-Myers Squibb Company (global pharmaceuticals, 2008-present). Mr. Lacy is a member of the Board of Trustees of The National Parks Conservation Association (2006-present). Previously, Mr. Lacy served as Chairman of the Board of Trustees of the National Parks Conservation Association (2008-2011) and as a member of the Board of Directors for the Western Union Company (global money transfer, 2006-2011). |
Ned C. Lautenbach (1944) |
Year of Election or Appointment: 2000 Trustee Chairman of the Independent Trustees |
| Mr. Lautenbach also serves as Trustee of other Fidelity funds. Mr. Lautenbach currently serves as the Lead Director of the Eaton Corporation Board of Directors (diversified industrial, 1997-present). Mr. Lautenbach is Chairman of the Board of Directors of the Philharmonic Center for the Arts in Naples, Florida (2012-present) and a member of the Council on Foreign Relations (1994-present). Previously, Mr. Lautenbach was a Partner/Advisory Partner at Clayton, Dubilier & Rice, LLC (private equity investment, 1998-2010), as well as a Director of Sony Corporation (2006-2007). |
Joseph Mauriello (1944) |
Year of Election or Appointment: 2008 Trustee |
| Mr. Mauriello also serves as Trustee of other Fidelity funds. Prior to his retirement in January 2006, Mr. Mauriello served in numerous senior management positions including Deputy Chairman and Chief Operating Officer (2004-2005), and Vice Chairman of Financial Services (2002-2004) of KPMG LLP US (professional services, 1965-2005). Mr. Mauriello currently serves as a member of the Board of Directors of XL Group plc. (global insurance and re-insurance, 2006-present). Previously, Mr. Mauriello served as a Director of the Hamilton Funds of the Bank of New York (2006-2007) and of Arcadia Resources Inc. (health care services and products, 2007-2012). |
Robert W. Selander (1950) |
Year of Election or Appointment: 2011 Trustee |
| Mr. Selander also serves as Trustee of other Fidelity funds. Previously, Mr. Selander served as a Member of the Advisory Board of other Fidelity funds (2011), and Executive Vice Chairman (2010), Chief Executive Officer (2009-2010), and President and Chief Executive Officer (1997-2009) of Mastercard, Inc. |
Cornelia M. Small (1944) |
Year of Election or Appointment: 2005 Trustee |
| Ms. Small also serves as Trustee of other Fidelity funds. Ms. Small is a member of the Board of Directors (2009-present) and Chair of the Investment Committee (2010-present) of the Teagle Foundation. Ms. Small also serves on the Investment Committee of the Berkshire Taconic Community Foundation (2008-present). Previously, Ms. Small served as Chairperson (2002-2008) and a member of the Investment Committee and Chairperson (2008-2012) and a member of the Board of Trustees of Smith College. In addition, Ms. Small served as Chief Investment Officer, Director of Global Equity Investments, and a member of the Board of Directors of Scudder, Stevens & Clark and Scudder Kemper Investments. |
William S. Stavropoulos (1939) |
Year of Election or Appointment: 2001 Trustee Vice Chairman of the Independent Trustees |
| Mr. Stavropoulos also serves as Trustee of other Fidelity funds. Mr. Stavropoulos serves as President and Founder of the Michigan Baseball Foundation, the Great Lakes Loons (2007-present). Mr. Stavropoulos is Chairman Emeritus of the Board of Directors of The Dow Chemical Company, where he previously served in numerous senior management positions, including President, CEO (1995-2000; 2002-2004), Chairman of the Executive Committee (2000-2006), and as a member of the Board of Directors (1990-2006). Currently, Mr. Stavropoulos is Chairman of the Board of Directors of Univar Inc. (global distributor of commodity and specialty chemicals), a Director of Teradata Corporation (data warehousing and technology solutions), and Maersk Inc. (industrial conglomerate), and a member of the Advisory Board for Metalmark Capital LLC (private equity investment, 2005-present). Mr. Stavropoulos is an operating advisor to Clayton, Dubilier & Rice, LLC (private equity investment). In addition, Mr. Stavropoulos is a member of the University of Notre Dame Advisory Council for the College of Science, a Trustee of the Rollin L. Gerstacker Foundation, and a Director of the Naples Philharmonic Center for the Arts. Previously, Mr. Stavropoulos served as a Director of Chemical Financial Corporation (bank holding company, 1993-2012) and Tyco International, Ltd. (multinational manufacturing and services, 2007-2012). |
David M. Thomas (1949) |
Year of Election or Appointment: 2008 Trustee |
| Mr. Thomas also serves as Trustee of other Fidelity funds. Mr. Thomas serves as Non-Executive Chairman of the Board of Directors of Fortune Brands Home and Security (home and security products, 2011-present), and as a member of the Board of Directors of Interpublic Group of Companies, Inc. (marketing communication, 2004-present). Previously, Mr. Thomas served as Executive Chairman (2005-2006) and Chairman and Chief Executive Officer (2000-2005) of IMS Health, Inc. (pharmaceutical and healthcare information solutions), and a Director of Fortune Brands, Inc. (consumer products, 2000-2011). |
+ The information above includes each Trustee's principal occupation during the last five years and other information relating to the experience, attributes, and skills relevant to each Trustee's qualifications to serve as a Trustee, which led to the conclusion that each Trustee should serve as a Trustee for the fund.
Advisory Board Member and Officers:
Correspondence intended for each officer and Peter S. Lynch may be sent to Fidelity Investments, 245 Summer Street, Boston, Massachusetts 02210. Officers appear below in alphabetical order.
Name, Year of Birth; Principal Occupation |
Peter S. Lynch (1944) |
Year of Election or Appointment: 2003 Member of the Advisory Board |
| Mr. Lynch also serves as Member of the Advisory Board of other Fidelity funds. Mr. Lynch is Vice Chairman and a Director of FMR and FMR Co., Inc. In addition, Mr. Lynch serves as a Trustee of Boston College and as the Chairman of the Inner-City Scholarship Fund. Previously, Mr. Lynch served on the Special Olympics International Board of Directors (1997-2006). |
Elizabeth Paige Baumann (1968) |
Year of Election or Appointment: 2012 Anti-Money Laundering (AML) Officer |
| Ms. Baumann also serves as AML Officer of other funds. She is Chief AML Officer of FMR LLC (2012-present) and is an employee of Fidelity Investments. Previously, Ms. Baumann served as Vice President and Deputy Anti-Money Laundering Officer (2007-2012). |
William C. Coffey (1969) |
Year of Election or Appointment: 2009 Assistant Secretary |
| Mr. Coffey also serves as Assistant Secretary of other funds. He is Senior Vice President and Deputy General Counsel of FMR LLC (2010-present), and is an employee of Fidelity Investments. Previously, Mr. Coffey served as Vice President and Associate General Counsel of FMR LLC (2005-2009). |
Timothy M. Cohen (1969) |
Year of Election or Appointment: 2014 Vice President of certain Equity Funds |
| Mr. Cohen also serves as Vice President of other funds. Mr. Cohen serves as a Director and Chief Compliance Officer of Fidelity Management & Research (U.K.) Inc. (2013-present) and is an employee of Fidelity Investments. |
Jonathan Davis (1968) |
Year of Election or Appointment: 2010 Assistant Treasurer |
| Mr. Davis also serves as Assistant Treasurer of other funds. Mr. Davis is an employee of Fidelity Investments. Previously, Mr. Davis served as Vice President and Associate General Counsel of FMR LLC (2003-2010). |
Adrien E. Deberghes (1967) |
Year of Election or Appointment: 2008 Deputy Treasurer |
| Mr. Deberghes also serves as an officer of other funds. He is an employee of Fidelity Investments (2008-present). Prior to joining Fidelity Investments, Mr. Deberghes was Senior Vice President of Mutual Fund Administration at State Street Corporation (2007-2008), Senior Director of Mutual Fund Administration at Investors Bank & Trust (2005-2007), and Director of Finance for Dunkin' Brands (2000-2005). |
Stephanie J. Dorsey (1969) |
Year of Election or Appointment: 2010 Assistant Treasurer |
| Ms. Dorsey also serves as an officer of other funds. She is an employee of Fidelity Investments (2008-present) and has served in other fund officer roles. Prior to joining Fidelity Investments, Ms. Dorsey served as Treasurer (2004-2008) of the JPMorgan Mutual Funds and Vice President (2004-2008) of JPMorgan Chase Bank. |
Howard J. Galligan III (1966) |
Year of Election or Appointment: 2014 Chief Financial Officer |
| Mr. Galligan also serves as Chief Financial Officer of other funds. Mr. Galligan serves as President of Fidelity Pricing and Cash Management Services (FPCMS) (2014-present) and as a Director of Strategic Advisers, Inc. (2008-present). Previously, Mr. Galligan served as Chief Administrative Officer of Asset Management (2011-2014) and Chief Operating Officer and Senior Vice President of Investment Support for Strategic Advisers, Inc. (2003-2011). |
Scott C. Goebel (1968) |
Year of Election or Appointment: 2008 Secretary and Chief Legal Officer (CLO) |
| Mr. Goebel serves as Secretary and CLO of other funds. Mr. Goebel also serves as Secretary of Fidelity SelectCo, LLC (2013-present), Fidelity Investments Money Management, Inc. (FIMM) (2010-present) and Fidelity Research and Analysis Company (FRAC) (2010-present); General Counsel, Secretary, and Senior Vice President of FMR (2008-present) and FMR Co., Inc. (2008-present); Chief Legal Officer of Fidelity Management & Research (Hong Kong) Limited (2008-present); and Assistant Secretary of Fidelity Management & Research (Japan) Limited (2008-present) and Fidelity Management & Research (U.K.) Inc. (2008-present). Previously, Mr. Goebel served as Secretary and CLO of other Fidelity funds (2008-2013), Assistant Secretary of FIMM (2008-2010), FRAC (2008-2010), and certain funds (2007-2008); and as Vice President and Secretary of Fidelity Distributors Corporation (FDC) (2005-2007). Mr. Goebel has been employed by FMR LLC or an affiliate since 2001. |
Brian B. Hogan (1964) |
Year of Election or Appointment: 2009 Vice President |
| Mr. Hogan also serves as Trustee or Vice President of other funds. Mr. Hogan serves as a Director of Fidelity SelectCo, LLC (2014-present) and President of FMR's Equity Division (2009-present). Previously, Mr. Hogan served as Senior Vice President, Equity Research of FMR (2006-2009) and as a portfolio manager. |
Chris Maher (1972) |
Year of Election or Appointment: 2013 Assistant Treasurer |
| Mr. Maher serves as Assistant Treasurer of other funds. Mr. Maher is Vice President of Valuation Oversight and is an employee of Fidelity Investments. Previously, Mr. Maher served as Vice President of Asset Management Compliance (2013), Vice President of FMR's Program Management Group (2010-2013), and Vice President of Valuation Oversight (2008-2010). |
Kenneth B. Robins (1969) |
Year of Election or Appointment: 2008 President and Treasurer |
| Mr. Robins also serves as an officer of other funds. Mr. Robins serves as Executive Vice President of Fidelity Investments Money Management, Inc. (FIMM) (2013-present) and is an employee of Fidelity Investments (2004-present). Previously, Mr. Robins served in other fund officer roles. |
Stephen Sadoski (1971) |
Year of Election or Appointment: 2012 Deputy Treasurer |
| Mr. Sadoski also serves as Deputy Treasurer of other funds. He is an employee of Fidelity Investments (2012-present) and has served in another fund officer role. Prior to joining Fidelity Investments, Mr. Sadoski served as an assistant chief accountant in the Division of Investment Management of the Securities and Exchange Commission (SEC) (2009-2012) and as a senior manager at Deloitte & Touche LLP (1997-2009). |
Stacie M. Smith (1974) |
Year of Election or Appointment: 2013 Deputy Treasurer |
| Ms. Smith also serves as an officer of other funds. She is an employee of Fidelity Investments (2009-present) and has served in other fund officer roles. Prior to joining Fidelity Investments, Ms. Smith served as Senior Audit Manager of Ernst & Young LLP (1996-2009). |
Renee Stagnone (1975) |
Year of Election or Appointment: 2013 Deputy Treasurer |
| Ms. Stagnone also serves as Deputy Treasurer of other funds. Ms. Stagnone is an employee of Fidelity Investments. |
Linda J. Wondrack (1964) |
Year of Election or Appointment: 2014 Chief Compliance Officer |
| Ms. Wondrack also serves as Chief Compliance Officer of other funds. Ms. Wondrack is Executive Vice President and head of the Ethics Office and Asset Management Compliance for Fidelity Investments (2012-present). Ms. Wondrack also serves as Chief Compliance Officer of Fidelity SelectCo, LLC (2014-present); Chief Compliance Officer of Impresa Management LLC (2013-present); and Chief Compliance Officer of FMR Co., Inc., Fidelity Investments Money Management, Inc., Fidelity Management & Research (Japan) Limited, Fidelity Management & Research (U.K.) Inc., Fidelity Management & Research (Hong Kong), Fidelity Management & Research Company, Pyramis Global Advisors, LLC, and Strategic Advisers, Inc., Ballyrock Investment Advisors LLC, and Northern Neck Investors LLC (2012-present). Previously, Ms. Wondrack served as Senior Vice President and Chief Compliance Officer for Columbia Management Investment Advisers, LLC (2005-2012); Chief Compliance Officer for certain funds within the Columbia Family of Funds (2007-2012); and Senior Vice President of Compliance Risk Management at Bank of America (2005-2010). |
Joseph F. Zambello (1957) |
Year of Election or Appointment: 2011 Deputy Treasurer |
| Mr. Zambello also serves as Deputy Treasurer of other funds. Mr. Zambello is an employee of Fidelity Investments. Previously, Mr. Zambello served as Vice President of FMR's Program Management Group (2009-2011) and Vice President of the Transfer Agent Oversight Group (2005-2009). |
Annual Report
The Board of Trustees of Fidelity Emerging Europe, Middle East, Africa, (EMEA) Fund voted to pay to shareholders of record at the opening of business on record date, the following distributions per share derived from capital gains realized from sales of portfolio securities, and dividends derived from net investment income:
| Pay Date | Record Date | Dividends | Capital Gains |
Institutional Class | 12/08/14 | 12/05/14 | $0.180 | $0.039 |
Institutional Class designates 100% of the dividend distributed during the fiscal year, as amounts which may be taken into account as a dividend for purposes of the maximum rate under section 1(h)(11) of the Internal Revenue Code.
The amounts per share which represent income derived from sources within, and taxes paid to, foreign countries or possessions of the United States are as follows:
| Pay Date | Income | Taxes |
Institutional Class | 12/09/2013 | $0.1098 | $0.0491 |
The fund will notify shareholders in January 2015 of amounts for use in preparing 2014 income tax returns.
Annual Report
Board Approval of Investment Advisory Contracts and Management Fees
Fidelity Emerging Europe, Middle East, Africa (EMEA) Fund
Each year, the Board of Trustees, including the Independent Trustees (together, the Board), votes on the renewal of the management contract with Fidelity Management & Research Company (FMR) and the sub-advisory agreements (together, the Advisory Contracts) for the fund. The Board, assisted by the advice of fund counsel and Independent Trustees' counsel, requests and considers a broad range of information relevant to the renewal of the Advisory Contracts throughout the year.
The Board meets regularly and, at each of its meetings, covers an extensive agenda of topics and materials and considers factors that are relevant to its annual consideration of the renewal of the fund's Advisory Contracts, including the services and support provided to the fund and its shareholders. The Board has established various standing committees (Committees), each composed of and chaired by Independent Trustees with varying backgrounds, to which the Board has assigned specific subject matter responsibilities in order to enhance effective decision-making by the Board. The Board, acting directly and through its Committees, requests and receives information concerning the annual consideration of the renewal of the fund's Advisory Contracts. The Board also meets as needed to consider matters specifically related to the Board's annual consideration of the renewal of the Advisory Contracts. Members of the Board may also meet with trustees of other Fidelity funds through ad hoc joint committees to discuss certain matters relevant to the Fidelity funds.
At its July 2014 meeting, the Board, including the Independent Trustees, unanimously determined to renew the fund's Advisory Contracts. In reaching its determination, the Board considered all factors it believed relevant, including (i) the nature, extent, and quality of the services to be provided to the fund and its shareholders (including the investment performance of the fund); (ii) the competitiveness of the fund's management fee and total expense ratio relative to peer funds; (iii) the total costs of the services to be provided by and the profits to be realized by Fidelity from its relationship with the fund; (iv) the extent to which economies of scale exist and would be realized as the fund grows; and (v) whether fee levels reflect these economies of scale, if any, for the benefit of fund shareholders. In connection with separate internal corporate reorganizations involving Fidelity Management & Research (U.K.) Inc. (FMR U.K.) and Fidelity Management & Research (Japan) Inc. (FMR Japan), the Board approved certain non-material amendments to the fund's sub-advisory agreements with FMR U.K. and FMR Japan to reflect that, after these reorganizations, FMR Investment Management (UK) Limited and Fidelity Management & Research (Japan) Limited will carry on the business of FMR U.K. and FMR Japan, respectively. The Board noted that no changes to the portfolio managers or to the foreign research or investment advisory services provided to the fund were expected in connection with either reorganization and that the same personnel and resources would continue to be available to the fund at the new entities.
Annual Report
Board Approval of Investment Advisory Contracts and
Management Fees - continued
In considering whether to renew the Advisory Contracts for the fund, the Board reached a determination, with the assistance of fund counsel and Independent Trustees' counsel and through the exercise of its business judgment, that the renewal of the Advisory Contracts was in the best interests of the fund and its shareholders and that the compensation payable under the Advisory Contracts was fair and reasonable. The Board's decision to renew the Advisory Contracts was not based on any single factor, but rather was based on a comprehensive consideration of all the information provided to the Board at its meetings throughout the year. The Board, in reaching its determination to renew the Advisory Contracts, was aware that shareholders of the fund have a broad range of investment choices available to them, including a wide choice among funds offered by Fidelity's competitors, and that the fund's shareholders, who have the opportunity to review and weigh the disclosure provided by the fund in its prospectus and other public disclosures, have chosen to invest in this fund, which is part of the Fidelity family of funds.
Nature, Extent, and Quality of Services Provided. The Board considered Fidelity's staffing as it relates to the fund, including the backgrounds of investment personnel of FMR and the sub-advisers (together, the Investment Advisers), and also considered the fund's investment objective, strategies, and related investment philosophy. The Independent Trustees also had discussions with senior management of Fidelity's investment operations and investment groups. The Board considered the structure of the portfolio manager compensation program and whether this structure provides appropriate incentives to act in the best interests of the fund. Additionally, the Board considered the portfolio managers' investments, if any, in the funds that they manage.
Resources Dedicated to Investment Management and Support Services. The Board and the Fund Oversight and Research Committees reviewed the general qualifications and capabilities of Fidelity's investment staff, including its size, education, experience, and resources, as well as Fidelity's approach to recruiting, training, managing, and compensating investment personnel. The Board noted that Fidelity has continued to increase the resources devoted to non-U.S. offices, including expansion of Fidelity's global investment organization. The Board also noted that Fidelity's analysts have extensive resources, tools and capabilities that allow them to conduct sophisticated quantitative and fundamental analysis, as well as credit analysis of issuers, counterparties and guarantors. Further, the Board believes that Fidelity's investment professionals have sufficient access to global information and data so as to provide competitive investment results over time, and that those professionals also have access to sophisticated tools that permit them to assess portfolio construction and risk and performance attribution characteristics continuously, as well as to transmit new information and research conclusions rapidly around the world. Additionally, in its deliberations, the Board considered Fidelity's trading and risk management capabilities and resources and global compliance infrastructure, which are an integral part of the investment management process.
Annual Report
Shareholder and Administrative Services. The Board considered (i) the nature, extent, quality, and cost of advisory, administrative, and shareholder services performed by the Investment Advisers and their affiliates under the Advisory Contracts and under separate agreements covering transfer agency, pricing and bookkeeping, and securities lending services for the fund; (ii) the nature and extent of the supervision of third party service providers, principally custodians and subcustodians; and (iii) the resources devoted to, and the record of compliance with, the fund's compliance policies and procedures. The Board also reviewed the allocation of fund brokerage, including allocations to brokers affiliated with the Investment Advisers, the use of brokerage commissions to pay fund expenses, and the use of "soft" commission dollars to pay for research services.
The Board noted that the growth of fund assets over time across the complex allows Fidelity to reinvest in the development of services designed to enhance the value or convenience of the Fidelity funds as investment vehicles. These services include 24-hour access to account information and market information through telephone representatives and over the Internet, investor education materials and asset allocation tools, and the expanded availability of Fidelity Investor Centers.
In 2014, the Board formed an ad hoc Committee on Transfer Agency Fees to review the variety of transfer agency fee structures throughout the industry and Fidelity's competitive positioning with respect to industry participants.
Investment in a Large Fund Family. The Board considered the benefits to shareholders of investing in a Fidelity fund, including the benefits of investing in a fund that is part of a large family of funds offering a variety of investment disciplines and providing a large variety of mutual fund investor services. The Board noted that Fidelity had taken, or had made recommendations that resulted in the Fidelity funds taking, a number of actions over the previous year that benefited particular funds, including (i) continuing to dedicate additional resources to investment research and to the support of the senior management team that oversees asset management; (ii) persisting in efforts to enhance Fidelity's global research capabilities; (iii) launching new funds and making other enhancements to meet client needs for income-oriented solutions; (iv) reducing fund expenses for certain index funds; (v) continuing to launch dedicated lower cost underlying funds to meet portfolio construction needs related to expanding underlying fund options for Fidelity funds of funds, specifically for the Freedom Fund product lines; (vi) rationalizing product lines and gaining increased efficiencies through fund mergers; (vii) launching sector-based exchange-traded funds and establishing a new Fidelity adviser to manage sector-based funds and products; (viii) continuing to develop and implement technology to improve security and increase efficiency; (ix) modifying the eligibility criteria for certain share classes to increase their marketability to a portion of the defined contribution plan market; (x) waiving redemption fees for certain qualified fund-of-fund and wrap programs and certain retirement plan transactions; and (xi) launching new Institutional Class shares of certain money market funds to attract and retain assets and to fill a gap in the money market fund lineup.
Annual Report
Board Approval of Investment Advisory Contracts and
Management Fees - continued
Investment Performance. The Board considered whether the fund has operated in accordance with its investment objective, as well as its record of compliance with its investment restrictions and its performance history.
The Board took into account discussions with the Investment Advisers about fund investment performance that occur at Board meetings throughout the year. In this regard the Board noted that as part of regularly scheduled fund reviews and other reports to the Board on fund performance, the Board periodically considers annualized return information for the fund, for different time periods, measured against a securities market index ("benchmark index") and a peer group of funds with similar objectives ("peer group"). In its evaluation of fund investment performance, the Board gave particular attention to information indicating changes in performance of certain Fidelity funds for specific time periods and the Investment Advisers' explanations for any overperformance or underperformance.
In addition to reviewing absolute and relative fund performance, the Independent Trustees periodically consider the appropriateness of fund performance metrics in evaluating the results achieved. In general, the Independent Trustees believe that fund performance should be evaluated based on net performance (after fees and expenses) of both the highest performing and lowest performing classes, where applicable, compared to appropriate benchmark indices, over appropriate time periods which may include full market cycles, and compared to peer groups, as applicable, over the same periods, taking into account relevant factors including the following: general market conditions; issuer-specific information; tactical opportunities for investment; and fund cash flows and other factors.
The Independent Trustees recognize that shareholders evaluate performance on a net basis over their own holding periods, for which one-, three-, and five-year periods are often used as a proxy. For this reason, the performance information reviewed by the Board also included net cumulative calendar year total return information for the fund and an appropriate benchmark index for the most recent one-, three-, and five-year periods, as shown below. A peer group comparison is not shown below.
Annual Report
Fidelity Emerging Europe, Middle East, Africa (EMEA) Fund

Based on its review, the Board concluded that the nature, extent, and quality of services provided to the fund under the Advisory Contracts should benefit the fund's shareholders.
Competitiveness of Management Fee and Total Expense Ratio. The Board considered the fund's management fee and total expense ratio compared to "mapped groups" of competitive funds and classes. Fidelity creates "mapped groups" by combining similar Lipper investment objective categories that have comparable investment mandates. Combining Lipper investment objective categories aids the Board's management fee and total expense ratio comparisons by broadening the competitive group used for comparison and by reducing the number of universes to which various Fidelity funds are compared.
Management Fee. The Board considered two proprietary management fee comparisons for the 12-month periods shown in the chart below. The group of Lipper funds used by the Board for management fee comparisons is referred to below as the "Total Mapped Group." The Total Mapped Group comparison focuses on a fund's standing in terms of gross management fees before expense reimbursements or caps relative to the total universe of funds with comparable investment mandates, regardless of whether their management fee structures also are comparable. Funds with comparable investment mandates offer exposure to similar types of securities. Funds with comparable management fee structures have similar management fee contractual arrangements (e.g., flat rate charged for advisory services, all-inclusive fee rate, etc.). "TMG %" represents the percentage of funds in the Total Mapped Group that had management fees that were lower than the fund's. For example, a hypothetical TMG % of 20% would mean that 80% of the funds in the Total Mapped Group had higher, and 20% had lower, management fees than the fund. The fund's actual TMG %s are in the chart below. The "Asset-Size Peer Group" (ASPG) comparison focuses on a fund's standing relative to a subset of non-Fidelity funds within the Total Mapped Group that are similar in size and management fee structure. For example, if a fund is in the first quartile of the ASPG, the fund's management fee ranks in the least expensive or lowest 25% of funds in the ASPG. The ASPG represents at least 15% of the funds in the Total Mapped Group with comparable asset size and management fee structures, subject to a minimum of 50 funds (or all funds in the Total Mapped Group if fewer than 50). Additional information, such as the ASPG quartile in which the fund's management fee rate ranked, is also included in the chart and considered by the Board.
Annual Report
Board Approval of Investment Advisory Contracts and
Management Fees - continued
Fidelity Emerging Europe, Middle East, Africa (EMEA) Fund

The Board noted that the fund's management fee rate ranked below the median of its Total Mapped Group and below the median of its ASPG for 2013.
The Board also noted that, in August 2013, the ad hoc Committee on Management Fees was formed to conduct an in-depth review of the management fee rates of Fidelity's active equity mutual funds. The Committee focused on the following areas: (i) standard fee structures; (ii) research consumption and trading evolution; (iii) management fee competitiveness/profitability by category; and (iv) factors that drive institutional pricing.
Based on its review, the Board concluded that the fund's management fee is fair and reasonable in light of the services that the fund receives and the other factors considered.
Annual Report
Total Expense Ratio. In its review of each class's total expense ratio, the Board considered the fund's management fee as well as other fund or class expenses, as applicable, such as transfer agent fees, pricing and bookkeeping fees, fund-paid 12b-1 fees, and custodial, legal, and audit fees. The Board also noted the effects of any waivers and reimbursements on fees and expenses. As part of its review, the Board also considered the current and historical total expense ratios of each class of the fund compared to competitive fund median expenses. Each class of the fund is compared to those funds and classes in the Total Mapped Group (used by the Board for management fee comparisons) that have a similar sales load structure.
The Board noted that the total expense ratio of each of Class A, Institutional Class, and the retail class ranked below its competitive median for 2013 and the total expense ratio of each of Class T, Class B, and Class C ranked above its competitive median for 2013. The Board considered that, in general, various factors can affect total expense ratios. The Board noted that the total expense ratio of Class T was above the competitive median primarily because of higher 12b-1 fees on Class T as compared to most competitor funds. Class T has a higher 12b-1 fee, but a lower front-end sales charge, than traditionally priced front-end sales charge classes. The Board considered that Class T is primarily sold load-waived in the retirement plan market where its 0.50% 12b-1 fee is comparable to competing no-load, higher 12b-1 fee classes designed specifically for retirement plans. The Board noted that the fund offers multiple classes, each of which has a different sales load and 12b-1 fee structure, and that the multiple structures are intended to offer a range of pricing options for the intermediary market. The Board also noted that the total expense ratios of the classes vary primarily by the level of their 12b-1 fees, although differences in transfer agent fees may also cause expenses to vary from class to class.
Fees Charged to Other Fidelity Clients. The Board also considered Fidelity fee structures and other information with respect to clients of Fidelity, such as other funds advised or subadvised by Fidelity, pension plan clients, and other institutional clients. The Board noted the findings of the 2013 ad hoc joint committee (created with the board of other Fidelity funds), which reviewed and compared Fidelity's institutional investment advisory business with its business of providing services to the Fidelity funds, including the differences in services provided, fees charged, and costs incurred, as well as competition in their respective marketplaces.
Based on its review of total expense ratios and fees charged to other Fidelity clients, the Board concluded that the total expense ratio of each class of the fund was reasonable, although in some cases above the median of the universe presented for comparison, in light of the services that the fund and its shareholders receive and the other factors considered.
Costs of the Services and Profitability. The Board considered the revenues earned and the expenses incurred by Fidelity in conducting the business of developing, marketing, distributing, managing, administering and servicing the fund and servicing the fund's shareholders. The Board also considered the level of Fidelity's profits in respect of all the Fidelity funds.
Annual Report
Board Approval of Investment Advisory Contracts and
Management Fees - continued
On an annual basis, Fidelity presents to the Board Fidelity's profitability for the fund. Fidelity calculates the profitability for each fund, as well as aggregate profitability for groups of Fidelity funds and all Fidelity funds, using a series of detailed revenue and cost allocation methodologies which originate with the books and records of Fidelity on which Fidelity's audited financial statements are based. The Audit Committee of the Board reviews any significant changes from the prior year's methodologies.
PricewaterhouseCoopers LLP (PwC), independent registered public accounting firm and auditor to Fidelity and certain Fidelity funds, has been engaged annually by the Board as part of the Board's assessment of Fidelity's profitability analysis. PwC's engagement includes the review and assessment of the methodologies used by Fidelity in determining the revenues and expenses attributable to Fidelity's mutual fund business, and completion of agreed-upon procedures in respect of the mathematical accuracy of fund profitability and its conformity to established allocation methodologies. After considering PwC's reports issued under the engagement and information provided by Fidelity, the Board concluded that while other allocation methods may also be reasonable, Fidelity's profitability methodologies are reasonable in all material respects.
The Board also reviewed Fidelity's non-fund businesses and fall-out benefits related to the mutual fund business as well as cases where Fidelity's affiliates may benefit from or be related to the fund's business.
The Board considered the costs of the services provided by and the profits realized by Fidelity in connection with the operation of the fund and was satisfied that the profitability was not excessive in the circumstances.
Economies of Scale. The Board considered whether there have been economies of scale in respect of the management of the Fidelity funds, whether the Fidelity funds (including the fund) have appropriately benefited from any such economies of scale, and whether there is potential for realization of any further economies of scale. The Board considered the extent to which the fund will benefit from economies of scale through increased services to the fund, through waivers or reimbursements, or through fee or expense ratio reductions. The Board also noted that in 2013, it and the boards of other Fidelity funds created an ad hoc committee (the Economies of Scale Committee) to analyze whether Fidelity attains economies of scale in respect of the management and servicing of the Fidelity funds, whether the Fidelity funds have appropriately benefited from such economies of scale, and whether there is potential for realization of any further economies of scale.
Annual Report
The Board recognized that the fund's management contract incorporates a "group fee" structure, which provides for lower group fee rates as total group assets increase, and for higher group fee rates as total group assets decrease (with "group assets" defined to include fund assets under FMR's management plus sector fund assets previously under FMR's management and currently managed by Fidelity SelectCo, LLC). FMR calculates the group fee rates based on a tiered asset "breakpoint" schedule that varies based on asset class. The Board considered that the group fee is designed to deliver the benefits of economies of scale to fund shareholders when total Fidelity fund assets increase, even if assets of any particular fund are unchanged or have declined, because some portion of Fidelity's costs are attributable to services provided to all Fidelity funds, and all funds benefit if those costs can be allocated among more assets. The Board concluded that, given the group fee structure, fund shareholders will benefit from lower management fees as group assets increase at the fund complex level, regardless of whether Fidelity achieves any such economies of scale.
The Board concluded, taking into account the analysis of the Economies of Scale Committee, that economies of scale, if any, are being appropriately shared between fund shareholders and Fidelity.
Additional Information Requested by the Board. In order to develop fully the factual basis for consideration of the Fidelity funds' Advisory Contracts, the Board requested and received additional information on certain topics, including: (i) fund performance trends and Fidelity's long-term strategies for certain funds; (ii) Fidelity's strategic marketing and product lineup goals; (iii) the methodology with respect to competitive fund data and peer group classifications; (iv) the arrangements with, and performance of, certain sub-advisers on behalf of the Fidelity funds, as well as certain proposed participating affiliate arrangements; (v) the realization of fall-out benefits in certain Fidelity business units; (vi) Fidelity's group fee structures, including the rationale for the individual fee rates of certain categories of funds and the definition of group assets; (vii) trends regarding industry use of performance fee structures and the performance adjustment methodologies applicable to the Fidelity funds; (viii) additional competitive analysis regarding the total expenses for certain classes; (ix) fund profitability methodology, including Fidelity's cost allocation methodology, and the impact of certain factors on fund profitability results; and (x) the process by which Fidelity determines sub-advisory fees for funds it advises.
Based on its evaluation of all of the conclusions noted above, and after considering all factors it believed relevant, the Board ultimately concluded that the advisory fee structures are fair and reasonable, and that the fund's Advisory Contracts should be renewed.
Annual Report
Investment Adviser
Fidelity Management & Research Company
Boston, MA
Investment Sub-Advisers
FMR Co., Inc.
Fidelity Management & Research
(U.K.) Inc.
FIL Investments (Japan) Limited
FIL Investment Advisors
FIL Investment Advisors
(U.K.) Limited
Fidelity Management & Research
(Hong Kong) Limited
Fidelity Management & Research
(Japan) Limited
General Distributor
Fidelity Distributors Corporation
Smithfield, RI
Transfer and Service Agents
Fidelity Investments Institutional
Operations Company, Inc.
Boston, MA
Fidelity Service Company, Inc.
Boston, MA
Custodian
State Street Bank & Trust Company
Quincy, MA
(Fidelity Investment logo)(registered trademark)
AEMEI-UANN-1214
1.861980.106
Fidelity®
Emerging Europe,
Middle East, Africa (EMEA)
Fund
Annual Report
October 31, 2014
(Fidelity Cover Art)
Contents
Performance | (Click Here) | How the fund has done over time. |
Management's Discussion of Fund Performance | (Click Here) | The Portfolio Manager's review of fund performance and strategy. |
Shareholder Expense Example | (Click Here) | An example of shareholder expenses. |
Investment Changes | (Click Here) | A summary of major shifts in the fund's investments over the past six months. |
Investments | (Click Here) | A complete list of the fund's investments with their market values. |
Financial Statements | (Click Here) | Statements of assets and liabilities, operations, and changes in net assets, as well as financial highlights. |
Notes | (Click Here) | Notes to the financial statements. |
Report of Independent Registered Public Accounting Firm | (Click Here) | |
Trustees and Officers | (Click Here) | |
Distributions | (Click Here) | |
Board Approval of Investment Advisory Contracts and Management Fees | (Click Here) | |
To view a fund's proxy voting guidelines and proxy voting record for the 12-month period ended June 30, visit http://www.fidelity.com/proxyvotingresults or visit the Securities and Exchange Commission's (SEC) web site at http://www.sec.gov. You may also call 1-800-544-8544 to request a free copy of the proxy voting guidelines.
Standard & Poor's, S&P and S&P 500 are registered service marks of The McGraw-Hill Companies, Inc. and have been licensed for use by Fidelity Distributors Corporation.
Other third-party marks appearing herein are the property of their respective owners.
All other marks appearing herein are registered or unregistered trademarks or service marks of FMR LLC or an affiliated company. © 2014 FMR LLC. All rights reserved.
Annual Report
This report and the financial statements contained herein are submitted for the general information of the shareholders of the fund. This report is not authorized for distribution to prospective investors in the fund unless preceded or accompanied by an effective prospectus.
A fund files its complete schedule of portfolio holdings with the SEC for the first and third quarters of each fiscal year on Form N-Q. Forms N-Q are available on the SEC's web site at http://www.sec.gov. A fund's Forms N-Q may be reviewed and copied at the SEC's Public Reference Room in Washington, DC. Information regarding the operation of the SEC's Public Reference Room may be obtained by calling 1-800-SEC-0330. For a complete list of a fund's portfolio holdings, view the most recent holdings listing, semiannual report, or annual report on Fidelity's web site at http://www.fidelity.com, http://www.advisor.fidelity.com, or http://www.401k.com, as applicable.
NOT FDIC INSURED • MAY LOSE VALUE • NO BANK GUARANTEE
Neither the fund nor Fidelity Distributors Corporation is a bank.
Annual Report
Average annual total return reflects the change in the value of an investment, assuming reinvestment of the class' distributions from dividend income and capital gains (the profits earned upon the sale of securities that have grown in value, if any) and assuming a constant rate of performance each year. The $10,000 table and the fund's returns do not reflect the deduction of taxes that a shareholder would pay on fund distributions or the redemption of fund shares. During periods of reimbursement by Fidelity, a fund's total return will be greater than it would be had the reimbursement not occurred. How a fund did yesterday is no guarantee of how it will do tomorrow.
Average Annual Total Returns
Periods ended October 31, 2014 | Past 1
year | Past 5
years | Life of
fund A |
Fidelity® Emerging Europe, Middle East, Africa (EMEA) Fund | -3.21% | 6.34% | -0.04% |
A From May 8, 2008.
$10,000 Over Life of Fund
Let's say hypothetically that $10,000 was invested in Fidelity® Emerging Europe, Middle East, Africa (EMEA) Fund, a class of the fund, on May 8, 2008, when the fund started. The chart shows how the value of your investment would have changed, and also shows how the MSCI EM (Emerging Markets) Europe, Middle East and Africa Index performed over the same period.
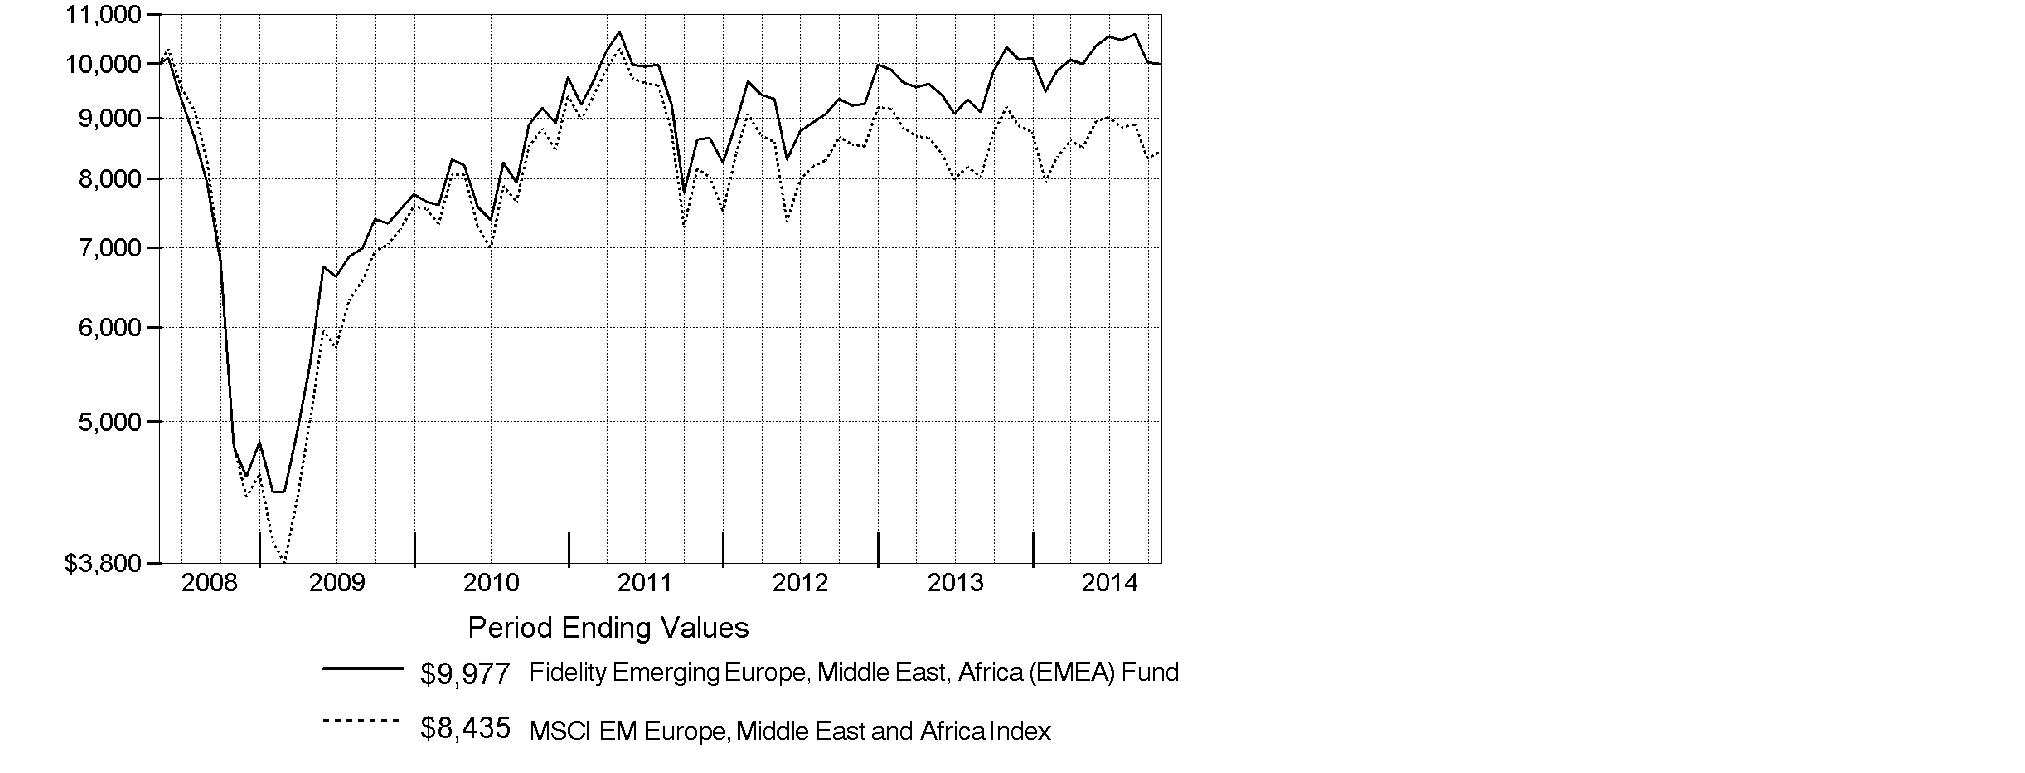
Annual Report
Market Recap: Global equities posted a healthy gain for the 12 months ending October 31, 2014, overcoming an October market decline driven by recessionary pressures in China and tepid growth in Europe. The MSCI ACWI (All Country World Index) Index rose 8.15%, helped by subdued market volatility for much of the period and supported by solid corporate earnings, especially in the United States. Stocks also benefited from easy monetary policies in Japan and the eurozone, as well as increased stimulus efforts in China. All but three of the 24 industry groups that compose the index marked a positive return. The U.S. (+17%) remained a pillar of strength, while a strongly rising dollar in the latter part of the period detracted from investors' returns in most non-U.S. markets. Canada (+5%) notched broad gains outside of its energy and materials sectors, as did Asia-Pacific ex Japan (+4%), led by investor enthusiasm for companies in India. The U.K., Europe and Japan, meanwhile, all underperformed. Among sectors, health care (+24%) led the index, with a strong contribution from the pharmaceuticals, biotechnology & life sciences industry. Information technology (+21%) also outperformed. Conversely, materials (-4%) and energy (-1%) lagged the index due to a higher supply of and lower demand for commodities.
Comments from Adam Kutas, Portfolio Manager of Fidelity® Emerging Europe, Middle East, Africa (EMEA) Fund: For the year, the fund's Retail Class shares returned -3.21%, outperforming the -8.16% return of the MSCI EM (Emerging Market) Europe, Middle East and Africa Index. Security selection in financials and telecommunications services helped the fund's relative performance, with the top two contributors being an out-of-benchmark position in HSBC Bank and good timing with Dubai Financial Market. HSBC served as counterparty for investments in consumer staples companies in Saudi Arabia, a country that doesn't allow foreign investment in Saudi firms. My strategy focused on overweighting investments in countries that I call "free riders," which aren't tied to other economies but have benefited from the global decline in the cost of capital. These can be frontier countries, where companies with low debt have been able to borrow at cheap interest rates. I favored "free riders" over countries and companies tied to growth in China or those whose prospects are closely aligned with "anchor" countries, meaning developed countries such as the United States or those in the European Union. I underweighted resources-heavy Russia and South Africa. Conversely, stock selection in materials hurt relative performance, with the biggest individual detractor being an investment in South African gold producer AngloGold Ashanti.
Note to shareholders: The fund may invest up to 35% of its total assets in any industry that represents more than 20% of the emerging Europe, Middle East and Africa markets. As of October 31, 2014, the fund did not have more than 25% of its total assets in any one industry.
The views expressed above reflect those of the portfolio manager(s) only through the end of the period as stated on the cover of this report and do not necessarily represent the views of Fidelity or any other person in the Fidelity organization. Any such views are subject to change at any time based upon market or other conditions and Fidelity disclaims any responsibility to update such views. These views may not be relied on as investment advice and, because investment decisions for a Fidelity fund are based on numerous factors, may not be relied on as an indication of trading intent on behalf of any Fidelity fund.
Annual Report
Shareholder Expense Example
As a shareholder of the Fund, you incur two types of costs: (1) transaction costs, including sales charges (loads) on purchase payments or redemption proceeds, redemption fees and (2) ongoing costs, including management fees, distribution and/or service (12b-1) fees and other Fund expenses. This Example is intended to help you understand your ongoing costs (in dollars) of investing in the Fund and to compare these costs with the ongoing costs of investing in other mutual funds.
The Example is based on an investment of $1,000 invested at the beginning of the period and held for the entire period (May 1, 2014 to October 31, 2014).
Actual Expenses
The first line of the accompanying table for each class of the Fund provides information about actual account values and actual expenses. You may use the information in this line, together with the amount you invested, to estimate the expenses that you paid over the period. Simply divide your account value by $1,000.00 (for example, an $8,600 account value divided by $1,000.00 = 8.6), then multiply the result by the number in the first line for a class of the Fund under the heading entitled "Expenses Paid During Period" to estimate the expenses you paid on your account during this period. A small balance maintenance fee of $12.00 that is charged once a year may apply for certain accounts with a value of less than $2,000. This fee is not included in the table below. If it was, the estimate of expenses you paid during the period would be higher, and your ending account value lower, by this amount. In addition, the Fund, as a shareholder in the underlying Fidelity Central Funds, will indirectly bear its pro-rata share of the fees and expenses incurred by the underlying Fidelity Central Funds. These fees and expenses are not included in the Fund's annualized expense ratio used to calculate the expense estimate in the table below.
Hypothetical Example for Comparison Purposes
The second line of the accompanying table for each class of the Fund provides information about hypothetical account values and hypothetical expenses based on a Class' actual expense ratio and an assumed rate of return of 5% per year before expenses, which is not the Class' actual return. The hypothetical account values and expenses may not be used to estimate the actual ending account balance or expenses you paid for the period. You may use this information to compare the ongoing costs of investing in the Fund and other funds. To do so, compare this 5% hypothetical example with the 5% hypothetical examples that appear in the shareholder reports of the other funds. A small balance maintenance fee of $12.00 that is charged once a year may apply for certain accounts with a value of less than $2,000. This fee is not included in the table below. If it was, the estimate of expenses you paid during the period would be higher, and your ending account value lower, by this amount. In addition, the Fund, as a shareholder in the underlying Fidelity Central Funds, will indirectly bear its pro-rata share of the fees and expenses incurred by the underlying Fidelity Central Funds. These fees and expenses are not included in the Fund's annualized expense ratio used to calculate the expense estimate in the table below.
Please note that the expenses shown in the table are meant to highlight your ongoing costs only and do not reflect any transaction costs. Therefore, the second line of the table is useful in comparing ongoing costs only, and will not help you determine the relative total costs of owning different funds. In addition, if these transactional costs were included, your costs would have been higher.
Annual Report
Shareholder Expense Example - continued
| Annualized
Expense Ratio B | Beginning
Account Value
May 1, 2014 | Ending
Account Value
October 31, 2014 | Expenses Paid
During Period*
May 1, 2014
to October 31, 2014 |
Class A | 1.54% | | | |
Actual | | $ 1,000.00 | $ 997.80 | $ 7.75 |
HypotheticalA | | $ 1,000.00 | $ 1,017.44 | $ 7.83 |
Class T | 1.90% | | | |
Actual | | $ 1,000.00 | $ 996.70 | $ 9.56 |
HypotheticalA | | $ 1,000.00 | $ 1,015.63 | $ 9.65 |
Class B | 2.38% | | | |
Actual | | $ 1,000.00 | $ 994.50 | $ 11.96 |
HypotheticalA | | $ 1,000.00 | $ 1,013.21 | $ 12.08 |
Class C | 2.40% | | | |
Actual | | $ 1,000.00 | $ 994.40 | $ 12.06 |
HypotheticalA | | $ 1,000.00 | $ 1,013.11 | $ 12.18 |
Emerging Europe, Middle East, Africa (EMEA) | 1.34% | | | |
Actual | | $ 1,000.00 | $ 1,000.00 | $ 6.76 |
HypotheticalA | | $ 1,000.00 | $ 1,018.45 | $ 6.82 |
Institutional Class | 1.16% | | | |
Actual | | $ 1,000.00 | $ 1,000.00 | $ 5.85 |
HypotheticalA | | $ 1,000.00 | $ 1,019.36 | $ 5.90 |
A 5% return per year before expenses
B Annualized expense ratio reflects expenses net of applicable fee waivers.
* Expenses are equal to each Class' annualized expense ratio, multiplied by the average account value over the period, multiplied by 184/365 (to reflect the one-half year period).
Annual Report
Investment Changes (Unaudited)
Geographic Diversification (% of fund's net assets) |
As of October 31, 2014 |
 | South Africa 43.1% | |
 | Russia 20.1% | |
 | Turkey 5.5% | |
 | Poland 5.1% | |
 | United Arab Emirates 4.6% | |
 | United Kingdom 4.0% | |
 | Qatar 3.0% | |
 | Romania 1.9% | |
 | Greece 1.6% | |
 | Other* 11.1% | |

* Includes Short-Term Investments and Net Other Assets (Liabilities). |
Percentages are based on country or territory of incorporation and are adjusted for the effect of futures contracts, if applicable. |
As of April 30, 2014 |
| South Africa 39.1% | |
| Russia 21.1% | |
| Poland 6.6% | |
| United Arab Emirates 5.2% | |
| United Kingdom 4.4% | |
| Qatar 2.5% | |
| United States of America* 2.3% | |
| Czech Republic 2.3% | |
| Turkey 2.3% | |
| Other 14.2% | |

* Includes Short-Term Investments and Net Other Assets (Liabilities). |
Percentages are based on country or territory of incorporation and are adjusted for the effect of futures contracts, if applicable. |
Asset Allocation as of October 31, 2014 |
| % of fund's
net assets | % of fund's net assets
6 months ago |
Stocks | 99.9 | 97.7 |
Short-Term Investments and Net Other Assets (Liabilities) | 0.1 | 2.3 |
Top Ten Stocks as of October 31, 2014 |
| % of fund's
net assets | % of fund's net assets
6 months ago |
MTN Group Ltd. (South Africa, Wireless Telecommunication Services) | 7.4 | 6.2 |
Naspers Ltd. Class N (South Africa, Media) | 5.8 | 4.4 |
Gazprom OAO sponsored ADR (Reg. S) (Russia, Oil, Gas & Consumable Fuels) | 5.3 | 5.1 |
LUKOIL Oil Co. (Russia, Oil, Gas & Consumable Fuels) | 4.3 | 4.3 |
Sasol Ltd. (South Africa, Oil, Gas & Consumable Fuels) | 3.8 | 3.4 |
Sberbank (Savings Bank of the Russian Federation) (Russia, Banks) | 3.1 | 3.6 |
FirstRand Ltd. (South Africa, Diversified Financial Services) | 2.7 | 2.2 |
Remgro Ltd. (South Africa, Diversified Financial Services) | 2.6 | 2.2 |
Bank Polska Kasa Opieki SA (Poland, Banks) | 2.6 | 3.1 |
Standard Bank Group Ltd. (South Africa, Banks) | 2.5 | 2.5 |
| 40.1 | |
Market Sectors as of October 31, 2014 |
| % of fund's
net assets | % of fund's net assets
6 months ago |
Financials | 36.4 | 36.7 |
Energy | 18.5 | 18.7 |
Consumer Discretionary | 12.6 | 9.6 |
Telecommunication Services | 10.1 | 10.8 |
Consumer Staples | 9.1 | 8.4 |
Materials | 6.2 | 8.1 |
Health Care | 3.5 | 2.6 |
Industrials | 3.2 | 2.5 |
Information Technology | 0.3 | 0.3 |
Annual Report
Investments October 31, 2014
Showing Percentage of Net Assets
Common Stocks - 96.3% |
| Shares | | Value |
Austria - 0.5% |
CA Immobilien Anlagen AG | 31,700 | | $ 606,797 |
Bermuda - 0.4% |
Aquarius Platinum Ltd. (a) | 1,967,700 | | 522,710 |
Botswana - 0.3% |
First National Bank of Botswana Ltd. | 814,358 | | 319,114 |
Canada - 0.2% |
Africa Oil Corp. (a) | 86,600 | | 275,848 |
Croatia - 0.3% |
Ledo d.d. | 263 | | 361,058 |
Czech Republic - 1.5% |
Komercni Banka A/S | 8,305 | | 1,778,933 |
Estonia - 0.4% |
Tallinna Kaubamaja AS | 70,900 | | 444,242 |
Greece - 1.6% |
Fourlis Holdings SA (a) | 130,500 | | 513,503 |
Jumbo SA | 53,036 | | 581,543 |
Karelia Tobacco Co., Inc. | 1,970 | | 481,398 |
Sarantis SA | 37,800 | | 331,583 |
TOTAL GREECE | | 1,908,027 |
Hungary - 0.3% |
FHB Land Credit & Mortgage Bank (a) | 138,000 | | 402,441 |
Kenya - 1.2% |
British American Tobacco Kenya Ltd. | 31,700 | | 371,399 |
Kenya Commercial Bank Ltd. | 756,500 | | 465,148 |
Safaricom Ltd. | 4,416,544 | | 602,368 |
TOTAL KENYA | | 1,438,915 |
Kuwait - 1.3% |
Gulf Bank (a) | 502,300 | | 588,498 |
Kuwait Food Co. (Americana) | 95,250 | | 1,010,924 |
TOTAL KUWAIT | | 1,599,422 |
Lithuania - 0.5% |
Apranga AB (a) | 163,766 | | 537,685 |
Luxembourg - 0.5% |
Pegas NONWOVENS SA | 20,400 | | 583,544 |
Common Stocks - continued |
| Shares | | Value |
Nigeria - 0.9% |
FBN Holdings PLC | 6,000,000 | | $ 419,439 |
Zenith Bank PLC | 5,284,656 | | 676,334 |
TOTAL NIGERIA | | 1,095,773 |
Oman - 1.0% |
BankMuscat SAOG (a) | 145,000 | | 265,143 |
National Bank of Oman (a) | 945,224 | | 893,666 |
TOTAL OMAN | | 1,158,809 |
Pakistan - 1.3% |
Indus Motor Co. Ltd. | 47,000 | | 373,522 |
Pak Suzuki Motors | 247,200 | | 819,695 |
United Bank Ltd. | 190,000 | | 363,436 |
TOTAL PAKISTAN | | 1,556,653 |
Poland - 5.1% |
Bank Handlowy w Warszawie SA | 62,000 | | 2,094,085 |
Bank Polska Kasa Opieki SA | 58,600 | | 3,062,790 |
Orbis SA | 40,000 | | 435,818 |
Powszechny Zaklad Ubezpieczen SA | 3,500 | | 524,590 |
TOTAL POLAND | | 6,117,283 |
Qatar - 3.0% |
Al Meera Consumer Goods Co. (a) | 7,996 | | 407,974 |
Commercial Bank of Qatar (a) | 66,748 | | 1,354,554 |
Qatar National Bank SAQ (a) | 30,850 | | 1,815,478 |
TOTAL QATAR | | 3,578,006 |
Romania - 1.9% |
Banca Transilvania SA (a) | 1,751,868 | | 897,500 |
Bursa de Valori Bucuresti (a) | 73,404 | | 619,461 |
SNP Petrom SA | 5,839,899 | | 726,803 |
TOTAL ROMANIA | | 2,243,764 |
Russia - 16.5% |
Gazprom OAO sponsored ADR (Reg. S) | 948,200 | | 6,284,670 |
LUKOIL Oil Co. | 8,300 | | 409,112 |
LUKOIL Oil Co. sponsored ADR (United Kingdom) | 96,695 | | 4,747,725 |
Magnit OJSC (a) | 6,800 | | 1,881,412 |
Megafon OJSC GDR | 38,800 | | 907,920 |
NOVATEK OAO GDR (Reg. S) | 8,325 | | 894,105 |
Common Stocks - continued |
| Shares | | Value |
Russia - continued |
Sberbank (Savings Bank of the Russian Federation) (a) | 2,109,500 | | $ 3,738,811 |
Vozrozhdenie Bank (a) | 90,200 | | 878,716 |
TOTAL RUSSIA | | 19,742,471 |
Slovenia - 0.4% |
Krka dd Novo mesto | 6,700 | | 528,955 |
South Africa - 43.1% |
AngloGold Ashanti Ltd. (a) | 191,000 | | 1,596,175 |
Ascendis Health Ltd. | 210,000 | | 313,198 |
Aspen Pharmacare Holdings Ltd. | 67,800 | | 2,418,480 |
Cashbuild Ltd. | 71,700 | | 1,007,593 |
Clicks Group Ltd. | 329,220 | | 2,241,612 |
DRDGOLD Ltd. | 3,820,214 | | 1,063,022 |
FirstRand Ltd. | 744,300 | | 3,185,109 |
Grand Parade Investments Ltd. (a) | 727,000 | | 468,639 |
Harmony Gold Mining Co. Ltd. (a) | 347,600 | | 561,510 |
Holdsport Ltd. | 165,400 | | 682,237 |
Hulamin Ltd. (a) | 896,200 | | 552,520 |
MTN Group Ltd. | 401,950 | | 8,891,935 |
Murray & Roberts Holdings Ltd. | 112,700 | | 231,434 |
Nampak Ltd. | 618,100 | | 2,520,089 |
Naspers Ltd. Class N | 56,300 | | 7,006,472 |
Pioneer Foods Ltd. | 152,200 | | 1,642,086 |
Raubex Group Ltd. | 599,600 | | 1,212,274 |
Remgro Ltd. | 134,000 | | 3,073,444 |
RMB Holdings Ltd. | 184,600 | | 1,024,444 |
Sasol Ltd. | 92,000 | | 4,594,042 |
Shoprite Holdings Ltd. | 120,100 | | 1,739,802 |
Standard Bank Group Ltd. | 239,363 | | 3,011,094 |
Telkom SA Ltd. (a) | 142,800 | | 758,165 |
Vodacom Group Ltd. | 77,200 | | 936,710 |
Zeder Investments Ltd. | 1,590,847 | | 836,548 |
TOTAL SOUTH AFRICA | | 51,568,634 |
Turkey - 5.5% |
Aselsan A/S | 219,000 | | 995,163 |
Brisa Bridgestone S.A.B. Las San | 197,000 | | 804,787 |
Gubre Fabrikalari TAS | 298,000 | | 564,452 |
Koc Holding A/S | 275,850 | | 1,408,633 |
Logo Yazilim Sanayi Ve Ticar (a) | 32,328 | | 379,619 |
Common Stocks - continued |
| Shares | | Value |
Turkey - continued |
Pinar Sut Mamulleri Sanayi A/S | 42,000 | | $ 404,382 |
Turkiye Garanti Bankasi A/S | 505,000 | | 1,970,961 |
TOTAL TURKEY | | 6,527,997 |
United Arab Emirates - 4.6% |
Agthia Group PJSC | 300,000 | | 537,435 |
Aldar Properties PJSC (a) | 1,409,585 | | 1,228,062 |
Emaar Properties PJSC (a) | 437,227 | | 1,190,381 |
First Gulf Bank PJSC | 270,138 | | 1,334,877 |
SHUAA Capital PSC (a) | 4,749,942 | | 1,269,927 |
TOTAL UNITED ARAB EMIRATES | | 5,560,682 |
United Kingdom - 4.0% |
Abdullah Al Othaim Markets Co. ELS (HSBC Warrant Program) warrants 7/31/17 (a)(c) | 14,236 | | 412,765 |
Al Noor Hospitals Group PLC | 30,100 | | 490,658 |
Alabama Khaleej Training & Education ELS (HSBC Bank Warrant Program) warrants 7/18/16 (a)(c) | 12,900 | | 230,544 |
Aldrees Petroleum & Transport ELS (HSBC Warrant Program) warrants 2/7/17 (a)(c) | 40,399 | | 581,905 |
Fawaz Abdulaziz Alhokair & Co. ELS (HSBC Warrant Program) warrants 2/23/15 (a)(c) | 10,300 | | 320,853 |
Halwani Bros. Co. ELS (HSBC Warrant Program) warrants 5/4/15 (a)(c) | 11,262 | | 236,392 |
NMC Health PLC | 68,700 | | 544,002 |
Saudi Vitrified Clay Pipe Co. ELS (HSBC Warrant Program) warrants 5/4/15 (a)(c) | 12,000 | | 333,892 |
Saudia Dairy & Foodstuff Co. ELS (HSBC Warrant Program) warrants 6/26/15 (a)(c) | 19,000 | | 617,845 |
The Savola Group ELS (HSBC Warrant Program) warrants 2/2/15 (a)(c) | 19,000 | | 432,542 |
United International Transportation Co. ELS (HSBC Warrant Program) warrants 2/23/15 (a)(c) | 30,667 | | 605,043 |
TOTAL UNITED KINGDOM | | 4,806,441 |
TOTAL COMMON STOCKS (Cost $105,022,785) |
115,264,204
|
Nonconvertible Preferred Stocks - 3.6% |
| Shares | | Value |
Russia - 3.6% |
Surgutneftegas (a) | 3,820,100 | | $ 2,619,698 |
Tatneft OAO (a) | 505,500 | | 1,695,960 |
TOTAL NONCONVERTIBLE PREFERRED STOCKS (Cost $3,855,159) |
4,315,658
|
Money Market Funds - 0.3% |
| | | |
Fidelity Cash Central Fund, 0.11% (b)
(Cost $309,902) | 309,902 | |
309,902
|
TOTAL INVESTMENT PORTFOLIO - 100.2% (Cost $109,187,846) | | 119,889,764 |
NET OTHER ASSETS (LIABILITIES) - (0.2)% | | (200,037) |
NET ASSETS - 100% | $ 119,689,727 |
Security Type Abbreviations |
ELS | - | Equity-Linked Security |
Legend |
(a) Non-income producing |
(b) Affiliated fund that is generally available only to investment companies and other accounts managed by Fidelity Investments. The rate quoted is the annualized seven-day yield of the fund at period end. A complete unaudited listing of the fund's holdings as of its most recent quarter end is available upon request. In addition, each Fidelity Central Fund's financial statements, which are not covered by the Fund's Report of Independent Registered Public Accounting Firm, are available on the SEC's website or upon request. |
(c) Security exempt from registration under Rule 144A of the Securities Act of 1933. These securities may be resold in transactions exempt from registration, normally to qualified institutional buyers. At the end of the period, the value of these securities amounted to $3,771,781, or 3.2% of net assets. |
Affiliated Central Funds |
Information regarding fiscal year to date income earned by the Fund from investments in Fidelity Central Funds is as follows: |
Fund | Income earned |
Fidelity Cash Central Fund | $ 1,968 |
Fidelity Securities Lending Cash Central Fund | 5,426 |
Total | $ 7,394 |
Other Information |
Categorizations in the Schedule of Investments are based on country or territory of incorporation. |
The following is a summary of the inputs used, as of October 31, 2014, involving the Fund's assets and liabilities carried at fair value. The inputs or methodology used for valuing securities may not be an indication of the risk associated with investing in those securities. For more information on valuation inputs, and their aggregation into the levels used in the table below, please refer to the Investment Valuation section in the accompanying Notes to Financial Statements. |
Valuation Inputs at Reporting Date: |
Description | Total | Level 1 | Level 2 | Level 3 |
Investments in Securities: | | | | |
Equities: | | | | |
Consumer Discretionary | $ 14,825,962 | $ 13,815,038 | $ - | $ 1,010,924 |
Consumer Staples | 10,844,383 | 10,844,383 | - | - |
Energy | 22,247,963 | 17,653,921 | 4,594,042 | - |
Financials | 43,661,562 | 37,918,820 | 5,742,742 | - |
Health Care | 4,295,293 | 4,295,293 | - | - |
Industrials | 3,847,504 | 3,847,504 | - | - |
Information Technology | 379,619 | 379,619 | - | - |
Materials | 7,380,478 | 4,159,771 | 3,220,707 | - |
Telecommunication Services | 12,097,098 | 12,097,098 | - | - |
Money Market Funds | 309,902 | 309,902 | - | - |
Total Investments in Securities: | $ 119,889,764 | $ 105,321,349 | $ 13,557,491 | $ 1,010,924 |
The following is a summary of transfers between Level 1 and Level 2 for the period ended October 31, 2014. Transfers are assumed to have occurred at the beginning of the period, and are primarily attributable to the valuation techniques used for foreign equity securities, as discussed in the accompanying Notes to Financial Statements: |
Transfers | Total |
Level 1 to Level 2 | $ 1,965,445 |
Level 2 to Level 1 | $ 0 |
See accompanying notes which are an integral part of the financial statements.
Annual Report
Statement of Assets and Liabilities
| October 31, 2014 |
| | |
Assets | | |
Investment in securities, at value - See accompanying schedule: Unaffiliated issuers (cost $108,877,944) | $ 119,579,862 | |
Fidelity Central Funds (cost $309,902) | 309,902 | |
Total Investments (cost $109,187,846) | | $ 119,889,764 |
Foreign currency held at value (cost $4) | | 3 |
Receivable for investments sold | | 126,670 |
Receivable for fund shares sold | | 99,736 |
Dividends receivable | | 109,030 |
Distributions receivable from Fidelity Central Funds | | 159 |
Prepaid expenses | | 310 |
Receivable from investment adviser for expense reductions | | 11 |
Other receivables | | 3 |
Total assets | | 120,225,686 |
| | |
Liabilities | | |
Payable for investments purchased | $ 141,325 | |
Payable for fund shares redeemed | 102,074 | |
Accrued management fee | 79,618 | |
Transfer agent fee payable | 28,392 | |
Distribution and service plan fees payable | 8,448 | |
Other affiliated payables | 5,157 | |
Custody fee payable | 53,865 | |
Audit fee payable | 44,097 | |
Other payables and accrued expenses | 72,983 | |
Total liabilities | | 535,959 |
| | |
Net Assets | | $ 119,689,727 |
Net Assets consist of: | | |
Paid in capital | | $ 113,793,553 |
Undistributed net investment income | | 1,899,047 |
Accumulated undistributed net realized gain (loss) on investments and foreign currency transactions | | (6,642,175) |
Net unrealized appreciation (depreciation) on investments and assets and liabilities in foreign currencies | | 10,639,302 |
Net Assets | | $ 119,689,727 |
See accompanying notes which are an integral part of the financial statements.
Annual Report
Financial Statements - continued
Statement of Assets and Liabilities - continued
| October 31, 2014 |
| | |
Calculation of Maximum Offering Price Class A:
Net Asset Value and redemption price per share ($7,888,563 ÷ 872,420 shares) | | $ 9.04 |
| | |
Maximum offering price per share (100/94.25 of $9.04) | | $ 9.59 |
Class T:
Net Asset Value and redemption price per share ($2,465,386 ÷ 273,748 shares) | | $ 9.01 |
| | |
Maximum offering price per share (100/96.50 of $9.01) | | $ 9.34 |
Class B:
Net Asset Value and offering price per share ($294,400 ÷ 32,537 shares)A | | $ 9.05 |
| | |
Class C:
Net Asset Value and offering price per share ($6,661,556 ÷ 745,824 shares)A | | $ 8.93 |
| | |
Emerging Europe, Middle East, Africa (EMEA):
Net Asset Value, offering price and redemption price per share ($96,783,557 ÷ 10,660,010 shares) | | $ 9.08 |
| | |
Institutional Class:
Net Asset Value, offering price and redemption price per share ($5,596,265 ÷ 616,521 shares) | | $ 9.08 |
A Redemption price per share is equal to net asset value less any applicable contingent deferred sales charge.
See accompanying notes which are an integral part of the financial statements.
Annual Report
Statement of Operations
| Year ended October 31, 2014 |
| | |
Investment Income | | |
Dividends | | $ 4,542,500 |
Income from Fidelity Central Funds | | 7,394 |
Income before foreign taxes withheld | | 4,549,894 |
Less foreign taxes withheld | | (564,289) |
Total income | | 3,985,605 |
| | |
Expenses | | |
Management fee | $ 1,047,346 | |
Transfer agent fees | 354,075 | |
Distribution and service plan fees | 107,916 | |
Accounting and security lending fees | 67,810 | |
Custodian fees and expenses | 166,959 | |
Independent trustees' compensation | 543 | |
Registration fees | 79,271 | |
Audit | 64,358 | |
Legal | 481 | |
Miscellaneous | 1,160 | |
Total expenses before reductions | 1,889,919 | |
Expense reductions | (1,916) | 1,888,003 |
Net investment income (loss) | | 2,097,602 |
Realized and Unrealized Gain (Loss) Net realized gain (loss) on: | | |
Investment securities: | | |
Unaffiliated issuers (net of foreign taxes of $55,716) | (4,138,146) | |
Foreign currency transactions | (96,262) | |
Total net realized gain (loss) | | (4,234,408) |
Change in net unrealized appreciation (depreciation) on: Investment securities (net of increase in deferred foreign taxes of $62,368) | (2,799,835) | |
Assets and liabilities in foreign currencies | (11,085) | |
Total change in net unrealized appreciation (depreciation) | | (2,810,920) |
Net gain (loss) | | (7,045,328) |
Net increase (decrease) in net assets resulting from operations | | $ (4,947,726) |
See accompanying notes which are an integral part of the financial statements.
Annual Report
Financial Statements - continued
Statement of Changes in Net Assets
| Year ended
October 31,
2014 | Year ended
October 31,
2013 |
Increase (Decrease) in Net Assets | | |
Operations | | |
Net investment income (loss) | $ 2,097,602 | $ 2,849,848 |
Net realized gain (loss) | (4,234,408) | 425,876 |
Change in net unrealized appreciation (depreciation) | (2,810,920) | 11,151,522 |
Net increase (decrease) in net assets resulting from operations | (4,947,726) | 14,427,246 |
Distributions to shareholders from net investment income | (1,921,556) | (2,689,985) |
Distributions to shareholders from net realized gain | - | (1,184,624) |
Total distributions | (1,921,556) | (3,874,609) |
Share transactions - net increase (decrease) | (15,497,892) | (9,097,663) |
Redemption fees | 42,040 | 52,524 |
Total increase (decrease) in net assets | (22,325,134) | 1,507,498 |
| | |
Net Assets | | |
Beginning of period | 142,014,861 | 140,507,363 |
End of period (including undistributed net investment income of $1,899,047 and undistributed net investment income of $1,897,738, respectively) | $ 119,689,727 | $ 142,014,861 |
See accompanying notes which are an integral part of the financial statements.
Annual Report
Financial Highlights - Class A
Years ended October 31, | 2014 | 2013 | 2012 | 2011 | 2010 |
Selected Per-Share Data | | | | | |
Net asset value, beginning of period | $ 9.49 | $ 8.71 | $ 8.34 | $ 8.97 | $ 7.26 |
Income from Investment Operations | | | | | |
Net investment income (loss) C | .13 | .16 | .18 | .16F | .07 |
Net realized and unrealized gain (loss) | (.46) | .85 | .34 | (.70) | 1.70 |
Total from investment operations | (.33) | 1.01 | .52 | (.54) | 1.77 |
Distributions from net investment income | (.12) | (.15) | (.15) | (.08) | (.04) |
Distributions from net realized gain | - | (.07) | - | (.02) | (.02) |
Total distributions | (.12) | (.23) I | (.15) | (.10) | (.07) J |
Redemption fees added to paid in capital C | - H | - H | - H | .01 | .01 |
Net asset value, end of period | $ 9.04 | $ 9.49 | $ 8.71 | $ 8.34 | $ 8.97 |
Total ReturnA, B | (3.48)% | 11.75% | 6.38% | (6.05)% | 24.66% |
Ratios to Average Net Assets D, G | | | | | |
Expenses before reductions | 1.60% | 1.64% | 1.62% | 1.60% | 1.69% |
Expenses net of fee waivers, if any | 1.60% | 1.63% | 1.62% | 1.56% | 1.50% |
Expenses net of all reductions | 1.60% | 1.62% | 1.60% | 1.51% | 1.38% |
Net investment income (loss) | 1.45% | 1.82% | 2.09% | 1.70% F | .95% |
Supplemental Data | | | | | |
Net assets, end of period (000 omitted) | $ 7,889 | $ 10,883 | $ 8,934 | $ 10,260 | $ 10,045 |
Portfolio turnover rateE | 38% | 64% | 30% | 53% | 96% |
A Total returns would have been lower if certain expenses had not been reduced during the applicable periods shown.
B Total returns do not include the effect of the sales charges.
C Calculated based on average shares outstanding during the period.
D Fees and expenses of any underlying Fidelity Central Funds are not included in the Fund's expense ratio. The Fund indirectly bears its proportionate share of the expenses of any underlying Fidelity Central Funds.
E Amount does not include the portfolio activity of any underlying Fidelity Central Funds.
F Investment income per share reflects a large, non-recurring dividend which amounted to $.04 per share. Excluding this non-recurring dividend, the ratio of net investment income (loss) to average net assets would have been 1.25%.
G Expense ratios reflect operating expenses of the class. Expenses before reductions do not reflect amounts reimbursed by the investment adviser or reductions from brokerage service arrangements or reductions from other expense offset arrangements and do not represent the amount paid by the class during periods when reimbursements or reductions occur. Expenses net of fee waivers reflect expenses after reimbursement by the investment adviser but prior to reductions from brokerage service arrangements or other expense offset arrangements. Expenses net of all reductions represent the net expenses paid by the class.
H Amount represents less than $.01 per share.
I Total distributions of $.23 per share is comprised of distributions from net investment income of $.151 and distributions from net realized gain of $.074 per share.
J Total distributions of $.07 per share is comprised of distributions from net investment income of $.041 and distributions from net realized gain of $.024 per share.
See accompanying notes which are an integral part of the financial statements.
Annual Report
Financial Highlights - Class T
Years ended October 31, | 2014 | 2013 | 2012 | 2011 | 2010 |
Selected Per-Share Data | | | | | |
Net asset value, beginning of period | $ 9.46 | $ 8.68 | $ 8.31 | $ 8.96 | $ 7.25 |
Income from Investment Operations | | | | | |
Net investment income (loss) C | .11 | .14 | .15 | .13F | .06 |
Net realized and unrealized gain (loss) | (.46) | .84 | .35 | (.71) | 1.69 |
Total from investment operations | (.35) | .98 | .50 | (.58) | 1.75 |
Distributions from net investment income | (.10) | (.12) | (.13) | (.07) | (.03) |
Distributions from net realized gain | - | (.07) | - | (.02) | (.02) |
Total distributions | (.10) | (.20) I | (.13) | (.08) J | (.05) |
Redemption fees added to paid in capital C | - H | - H | - H | .01 | .01 |
Net asset value, end of period | $ 9.01 | $ 9.46 | $ 8.68 | $ 8.31 | $ 8.96 |
Total ReturnA, B | (3.67)% | 11.42% | 6.14% | (6.42)% | 24.44% |
Ratios to Average Net Assets D, G | | | | | |
Expenses before reductions | 1.92% | 1.93% | 1.89% | 1.87% | 1.95% |
Expenses net of fee waivers, if any | 1.90% | 1.90% | 1.89% | 1.84% | 1.75% |
Expenses net of all reductions | 1.90% | 1.88% | 1.86% | 1.78% | 1.62% |
Net investment income (loss) | 1.15% | 1.55% | 1.82% | 1.42% F | .70% |
Supplemental Data | | | | | |
Net assets, end of period (000 omitted) | $ 2,465 | $ 3,465 | $ 3,336 | $ 3,502 | $ 3,114 |
Portfolio turnover rateE | 38% | 64% | 30% | 53% | 96% |
A Total returns would have been lower if certain expenses had not been reduced during the applicable periods shown.
B Total returns do not include the effect of the sales charges.
C Calculated based on average shares outstanding during the period.
D Fees and expenses of any underlying Fidelity Central Funds are not included in the Fund's expense ratio. The Fund indirectly bears its proportionate share of the expenses of any underlying Fidelity Central Funds.
E Amount does not include the portfolio activity of any underlying Fidelity Central Funds.
F Investment income per share reflects a large, non-recurring dividend which amounted to $.04 per share. Excluding this non-recurring dividend, the ratio of net investment income (loss) to average net assets would have been .98%.
G Expense ratios reflect operating expenses of the class. Expenses before reductions do not reflect amounts reimbursed by the investment adviser or reductions from brokerage service arrangements or reductions from other expense offset arrangements and do not represent the amount paid by the class during periods when reimbursements or reductions occur. Expenses net of fee waivers reflect expenses after reimbursement by the investment adviser but prior to reductions from brokerage service arrangements or other expense offset arrangements. Expenses net of all reductions represent the net expenses paid by the class.
H Amount represents less than $.01 per share.
I Total distributions of $.20 per share is comprised of distributions from net investment income of $.122 and distributions from net realized gain of $.074 per share.
J Total distributions of $.08 per share is comprised of distributions from net investment income of $.068 and distributions from net realized gain of $.015 per share.
See accompanying notes which are an integral part of the financial statements.
Annual Report
Financial Highlights - Class B
Years ended October 31, | 2014 | 2013 | 2012 | 2011 | 2010 |
Selected Per-Share Data | | | | | |
Net asset value, beginning of period | $ 9.50 | $ 8.69 | $ 8.29 | $ 8.93 | $ 7.23 |
Income from Investment Operations | | | | | |
Net investment income (loss) C | .06 | .09 | .11 | .09F | .02 |
Net realized and unrealized gain (loss) | (.46) | .85 | .35 | (.71) | 1.68 |
Total from investment operations | (.40) | .94 | .46 | (.62) | 1.70 |
Distributions from net investment income | (.05) | (.06) | (.06) | (.02) | - |
Distributions from net realized gain | - | (.07) | - | (.01) | (.01) |
Total distributions | (.05) | (.13) | (.06) | (.03) | (.01) |
Redemption fees added to paid in capital C | - H | - H | - H | .01 | .01 |
Net asset value, end of period | $ 9.05 | $ 9.50 | $ 8.69 | $ 8.29 | $ 8.93 |
Total ReturnA, B | (4.23)% | 10.94% | 5.56% | (6.85)% | 23.72% |
Ratios to Average Net Assets D, G | | | | | |
Expenses before reductions | 2.40% | 2.42% | 2.38% | 2.37% | 2.47% |
Expenses net of fee waivers, if any | 2.40% | 2.40% | 2.38% | 2.33% | 2.25% |
Expenses net of all reductions | 2.40% | 2.38% | 2.35% | 2.27% | 2.12% |
Net investment income (loss) | .65% | 1.05% | 1.33% | .93% F | .20% |
Supplemental Data | | | | | |
Net assets, end of period (000 omitted) | $ 294 | $ 388 | $ 441 | $ 539 | $ 822 |
Portfolio turnover rateE | 38% | 64% | 30% | 53% | 96% |
A Total returns would have been lower if certain expenses had not been reduced during the applicable periods shown.
B Total returns do not include the effect of the contingent deferred sales charge.
C Calculated based on average shares outstanding during the period.
D Fees and expenses of any underlying Fidelity Central Funds are not included in the Fund's expense ratio. The Fund indirectly bears its proportionate share of the expenses of any underlying Fidelity Central Funds.
E Amount does not include the portfolio activity of any underlying Fidelity Central Funds.
F Investment income per share reflects a large, non-recurring dividend which amounted to $.04 per share. Excluding this non-recurring dividend, the ratio of net investment income (loss) to average net assets would have been .49%.
G Expense ratios reflect operating expenses of the class. Expenses before reductions do not reflect amounts reimbursed by the investment adviser or reductions from brokerage service arrangements or reductions from other expense offset arrangements and do not represent the amount paid by the class during periods when reimbursements or reductions occur. Expenses net of fee waivers reflect expenses after reimbursement by the investment adviser but prior to reductions from brokerage service arrangements or other expense offset arrangements. Expenses net of all reductions represent the net expenses paid by the class.
H Amount represents less than $.01 per share.
See accompanying notes which are an integral part of the financial statements.
Annual Report
Financial Highlights - Class C
Years ended October 31, | 2014 | 2013 | 2012 | 2011 | 2010 |
Selected Per-Share Data | | | | | |
Net asset value, beginning of period | $ 9.39 | $ 8.62 | $ 8.24 | $ 8.90 | $ 7.23 |
Income from Investment Operations | | | | | |
Net investment income (loss) C | .06 | .09 | .11 | .08F | .02 |
Net realized and unrealized gain (loss) | (.46) | .83 | .35 | (.69) | 1.67 |
Total from investment operations | (.40) | .92 | .46 | (.61) | 1.69 |
Distributions from net investment income | (.06) | (.08) | (.08) | (.05) | (.01) |
Distributions from net realized gain | - | (.07) | - | (.02) | (.02) |
Total distributions | (.06) | (.15) | (.08) | (.06) I | (.03) |
Redemption fees added to paid in capital C | - H | - H | - H | .01 | .01 |
Net asset value, end of period | $ 8.93 | $ 9.39 | $ 8.62 | $ 8.24 | $ 8.90 |
Total ReturnA, B | (4.24)% | 10.83% | 5.68% | (6.79)% | 23.61% |
Ratios to Average Net Assets D, G | | | | | |
Expenses before reductions | 2.40% | 2.42% | 2.37% | 2.36% | 2.45% |
Expenses net of fee waivers, if any | 2.40% | 2.40% | 2.37% | 2.33% | 2.25% |
Expenses net of all reductions | 2.40% | 2.38% | 2.35% | 2.27% | 2.13% |
Net investment income (loss) | .65% | 1.05% | 1.34% | .93% F | .20% |
Supplemental Data | | | | | |
Net assets, end of period (000 omitted) | $ 6,662 | $ 6,782 | $ 7,770 | $ 6,650 | $ 5,151 |
Portfolio turnover rateE | 38% | 64% | 30% | 53% | 96% |
A Total returns would have been lower if certain expenses had not been reduced during the applicable periods shown.
B Total returns do not include the effect of the contingent deferred sales charge.
C Calculated based on average shares outstanding during the period.
D Fees and expenses of any underlying Fidelity Central Funds are not included in the Fund's expense ratio. The Fund indirectly bears its proportionate share of the expenses of any underlying Fidelity Central Funds.
E Amount does not include the portfolio activity of any underlying Fidelity Central Funds.
F Investment income per share reflects a large, non-recurring dividend which amounted to $.04 per share. Excluding this non-recurring dividend, the ratio of net investment income (loss) to average net assets would have been .49%.
G Expense ratios reflect operating expenses of the class. Expenses before reductions do not reflect amounts reimbursed by the investment adviser or reductions from brokerage service arrangements or reductions from other expense offset arrangements and do not represent the amount paid by the class during periods when reimbursements or reductions occur. Expenses net of fee waivers reflect expenses after reimbursement by the investment adviser but prior to reductions from brokerage service arrangements or other expense offset arrangements. Expenses net of all reductions represent the net expenses paid by the class.
H Amount represents less than $.01 per share.
I Total distributions of $.06 per share is comprised of distributions from net investment income of $.047 and distributions from net realized gain of $.015 per share.
See accompanying notes which are an integral part of the financial statements.
Annual Report
Financial Highlights - Emerging Europe, Middle East, Africa (EMEA)
Years ended October 31, | 2014 | 2013 | 2012 | 2011 | 2010 |
Selected Per-Share Data | | | | | |
Net asset value, beginning of period | $ 9.52 | $ 8.75 | $ 8.37 | $ 9.00 | $ 7.28 |
Income from Investment Operations | | | | | |
Net investment income (loss) B | .16 | .18 | .20 | .18E | .09 |
Net realized and unrealized gain (loss) | (.47) | .84 | .35 | (.71) | 1.70 |
Total from investment operations | (.31) | 1.02 | .55 | (.53) | 1.79 |
Distributions from net investment income | (.13) | (.18) | (.17) | (.09) | (.05) |
Distributions from net realized gain | - | (.07) | - | (.02) | (.02) |
Total distributions | (.13) | (.25) | (.17) | (.11) | (.08) H |
Redemption fees added to paid in capital B | - G | - G | - G | .01 | .01 |
Net asset value, end of period | $ 9.08 | $ 9.52 | $ 8.75 | $ 8.37 | $ 9.00 |
Total ReturnA | (3.21)% | 11.90% | 6.81% | (5.91)% | 24.92% |
Ratios to Average Net Assets C, F | | | | | |
Expenses before reductions | 1.37% | 1.40% | 1.37% | 1.35% | 1.45% |
Expenses net of fee waivers, if any | 1.37% | 1.40% | 1.37% | 1.31% | 1.25% |
Expenses net of all reductions | 1.37% | 1.38% | 1.34% | 1.25% | 1.12% |
Net investment income (loss) | 1.68% | 2.05% | 2.34% | 1.95% E | 1.21% |
Supplemental Data | | | | | |
Net assets, end of period (000 omitted) | $ 96,784 | $ 110,265 | $ 111,441 | $ 114,117 | $ 140,270 |
Portfolio turnover rateD | 38% | 64% | 30% | 53% | 96% |
A Total returns would have been lower if certain expenses had not been reduced during the applicable periods shown.
B Calculated based on average shares outstanding during the period.
C Fees and expenses of any underlying Fidelity Central Funds are not included in the Fund's expense ratio. The Fund indirectly bears its proportionate share of the expenses of any underlying Fidelity Central Funds.
D Amount does not include the portfolio activity of any underlying Fidelity Central Funds.
E Investment income per share reflects a large, non-recurring dividend which amounted to $.04 per share. Excluding this non-recurring dividend, the ratio of net investment income (loss) to average net assets would have been 1.51%.
F Expense ratios reflect operating expenses of the class. Expenses before reductions do not reflect amounts reimbursed by the investment adviser or reductions from brokerage service arrangements or reductions from other expense offset arrangements and do not represent the amount paid by the class during periods when reimbursements or reductions occur. Expenses net of fee waivers reflect expenses after reimbursement by the investment adviser but prior to reductions from brokerage service arrangements or other expense offset arrangements. Expenses net of all reductions represent the net expenses paid by the class.
G Amount represents less than $.01 per share.
H Total distributions of $.08 per share is comprised of distributions from net investment income of $.052 and distributions from net realized gain of $.024 per share.
See accompanying notes which are an integral part of the financial statements.
Annual Report
Financial Highlights - Institutional Class
Years ended October 31, | 2014 | 2013 | 2012 | 2011 | 2010 |
Selected Per-Share Data | | | | | |
Net asset value, beginning of period | $ 9.52 | $ 8.75 | $ 8.37 | $ 9.00 | $ 7.28 |
Income from Investment Operations | | | | | |
Net investment income (loss) B | .16 | .19 | .21 | .19E | .09 |
Net realized and unrealized gain (loss) | (.46) | .84 | .35 | (.72) | 1.70 |
Total from investment operations | (.30) | 1.03 | .56 | (.53) | 1.79 |
Distributions from net investment income | (.14) | (.19) | (.18) | (.09) | (.05) |
Distributions from net realized gain | - | (.07) | - | (.02) | (.02) |
Total distributions | (.14) | (.26) | (.18) | (.11) | (.08) H |
Redemption fees added to paid in capital B | - G | - G | - G | .01 | .01 |
Net asset value, end of period | $ 9.08 | $ 9.52 | $ 8.75 | $ 8.37 | $ 9.00 |
Total ReturnA | (3.09)% | 12.05% | 6.93% | (5.91)% | 24.95% |
Ratios to Average Net Assets C, F | | | | | |
Expenses before reductions | 1.26% | 1.30% | 1.28% | 1.26% | 1.34% |
Expenses net of fee waivers, if any | 1.26% | 1.30% | 1.28% | 1.24% | 1.25% |
Expenses net of all reductions | 1.26% | 1.28% | 1.25% | 1.19% | 1.13% |
Net investment income (loss) | 1.79% | 2.15% | 2.43% | 2.02% E | 1.20% |
Supplemental Data | | | | | |
Net assets, end of period (000 omitted) | $ 5,596 | $ 10,231 | $ 8,586 | $ 7,633 | $ 7,171 |
Portfolio turnover rateD | 38% | 64% | 30% | 53% | 96% |
A Total returns would have been lower if certain expenses had not been reduced during the applicable periods shown.
B Calculated based on average shares outstanding during the period.
C Fees and expenses of any underlying Fidelity Central Funds are not included in the Fund's expense ratio. The Fund indirectly bears its proportionate share of the expenses of any underlying Fidelity Central Funds.
D Amount does not include the portfolio activity of any underlying Fidelity Central Funds.
E Investment income per share reflects a large, non-recurring dividend which amounted to $.04 per share. Excluding this non-recurring dividend, the ratio of net investment income (loss) to average net assets would have been 1.58%.
F Expense ratios reflect operating expenses of the class. Expenses before reductions do not reflect amounts reimbursed by the investment adviser or reductions from brokerage service arrangements or reductions from other expense offset arrangements and do not represent the amount paid by the class during periods when reimbursements or reductions occur. Expenses net of fee waivers reflect expenses after reimbursement by the investment adviser but prior to reductions from brokerage service arrangements or other expense offset arrangements. Expenses net of all reductions represent the net expenses paid by the class.
G Amount represents less than $.01 per share.
H Total distributions of $.08 per share is comprised of distributions from net investment income of $.054 and distributions from net realized gain of $.024 per share.
See accompanying notes which are an integral part of the financial statements.
Annual Report
Notes to Financial Statements
For the period ended October 31, 2014
1. Organization.
Fidelity Emerging Europe, Middle East, Africa (EMEA) Fund (the Fund) is a fund of Fidelity Investment Trust (the Trust) and is authorized to issue an unlimited number of shares. The Trust is registered under the Investment Company Act of 1940, as amended (the 1940 Act), as an open-end management investment company organized as a Massachusetts business trust. The Fund offers Class A, Class T, Class C, Emerging Europe, Middle East, Africa (EMEA) and Institutional Class, each of which, along with Class B shares, has equal rights as to assets and voting privileges. Class B shares are closed to new accounts and additional purchases, except for exchanges and reinvestments. Each class has exclusive voting rights with respect to matters that affect that class. Class B shares will automatically convert to Class A shares after a holding period of seven years from the initial date of purchase. The Fund's investments in emerging markets can be subject to social, economic, regulatory, and political uncertainties and can be extremely volatile.
2. Investments in Fidelity Central Funds.
The Fund invests in Fidelity Central Funds, which are open-end investment companies generally available only to other investment companies and accounts managed by the investment adviser and its affiliates. The Fund's Schedule of Investments lists each of the Fidelity Central Funds held as of period end, if any, as an investment of the Fund, but does not include the underlying holdings of each Fidelity Central Fund. As an Investing Fund, the Fund indirectly bears its proportionate share of the expenses of the underlying Fidelity Central Funds.
The Money Market Central Funds seek preservation of capital and current income and are managed by Fidelity Investments Money Management, Inc. (FIMM), an affiliate of the investment adviser. Annualized expenses of the Money Market Central Funds as of their most recent shareholder report date are less than .01%.
In addition, the financial statements of the Fidelity Central Funds are available on the SEC website or upon request.
3. Significant Accounting Policies.
The financial statements have been prepared in conformity with accounting principles generally accepted in the United States of America (GAAP), which require management to make certain estimates and assumptions at the date of the financial statements. Actual results could differ from those estimates. Subsequent events, if any, through the date that the financial statements were issued have been evaluated in the preparation of
Annual Report
Notes to Financial Statements - continued
3. Significant Accounting Policies - continued
the financial statements. The following summarizes the significant accounting policies of the Fund:
Investment Valuation. Investments are valued as of 4:00 p.m. Eastern time on the last calendar day of the period. In accordance with valuation policies and procedures approved by the Board of Trustees (the Board), the Fund attempts to obtain prices from one or more third party pricing vendors or brokers to value its investments. When current market prices, quotations or currency exchange rates are not readily available or reliable, investments will be fair valued in good faith by the Fidelity Management & Research Company (FMR) Fair Value Committee (the Committee), in accordance with procedures adopted by the Board. Factors used in determining fair value vary by investment type and may include market or investment specific events. The frequency with which these procedures are used cannot be predicted and they may be utilized to a significant extent. The Committee oversees the Fund's valuation policies and procedures and is responsible for approving and reporting to the Board all fair value determinations.
The Fund categorizes the inputs to valuation techniques used to value its investments into a disclosure hierarchy consisting of three levels as shown below:
Level 1 - quoted prices in active markets for identical investments
Level 2 - other significant observable inputs (including quoted prices for similar investments, interest rates, prepayment speeds, etc.)
Level 3 - unobservable inputs (including the Fund's own assumptions based on the best information available)
Valuation techniques used to value the Fund's investments by major category are as follows:
Equity securities, including restricted securities, for which market quotations are readily available, are valued at the last reported sale price or official closing price as reported by a third party pricing vendor on the primary market or exchange on which they are traded and are categorized as Level 1 in the hierarchy. In the event there were no sales during the day or closing prices are not available, securities are valued at the last quoted bid price or may be valued using the last available price and are generally categorized as Level 2 in the hierarchy. For foreign equity securities, when market or security specific events arise, comparisons to the valuation of American Depositary Receipts (ADRs), futures contracts, Exchange-Traded Funds (ETFs) and certain indexes as well as quoted prices for similar securities may be used and would be categorized as Level 2 in the hierarchy. Utilizing these techniques may result in transfers between Level 1 and Level 2. For equity securities, including restricted securities, where observable inputs are
Annual Report
3. Significant Accounting Policies - continued
Investment Valuation - continued
limited, assumptions about market activity and risk are used and these securities may be categorized as Level 3 in the hierarchy.
Investments in open-end mutual funds, including the Fidelity Central Funds, are valued at their closing net asset value (NAV) each business day and are categorized as Level 1 in the hierarchy.
Changes in valuation techniques may result in transfers in or out of an assigned level within the disclosure hierarchy. The aggregate value of investments by input level, as of October 31, 2014, including information on transfers between Levels 1 and 2, is included at the end of the Fund's Schedule of Investments.
Foreign Currency. The Fund may use foreign currency contracts to facilitate transactions in foreign-denominated securities. Gains and losses from these transactions may arise from changes in the value of the foreign currency or if the counterparties do not perform under the contracts' terms.
Foreign-denominated assets, including investment securities, and liabilities are translated into U.S. dollars at the exchange rates at period end. Purchases and sales of investment securities, income and dividends received and expenses denominated in foreign currencies are translated into U.S. dollars at the exchange rate in effect on the transaction date.
The effects of exchange rate fluctuations on investments are included with the net realized and unrealized gain (loss) on investment securities. Other foreign currency transactions resulting in realized and unrealized gain (loss) are disclosed separately.
Investment Transactions and Income. For financial reporting purposes, the Fund's investment holdings and NAV include trades executed through the end of the last business day of the period. The NAV per share for processing shareholder transactions is calculated as of the close of business of the New York Stock Exchange (NYSE), normally 4:00 p.m. Eastern time and includes trades executed through the end of the prior business day. Gains and losses on securities sold are determined on the basis of identified cost. Dividend income is recorded on the ex-dividend date, except for certain dividends from foreign securities where the ex-dividend date may have passed, which are recorded as soon as the Fund is informed of the ex-dividend date. Non-cash dividends included in dividend income, if any, are recorded at the fair market value of the securities received. Investment income is recorded net of foreign taxes withheld where recovery of such taxes is uncertain.
Annual Report
Notes to Financial Statements - continued
3. Significant Accounting Policies - continued
Class Allocations and Expenses. Investment income, realized and unrealized capital gains and losses, common expenses of the Fund, and certain fund-level expense reductions, if any, are allocated daily on a pro-rata basis to each class based on the relative net assets of each class to the total net assets of the Fund. Each class differs with respect to transfer agent and distribution and service plan fees incurred. Certain expense reductions may also differ by class. For the reporting period, the allocated portion of income and expenses to each class as a percent of its average net assets may vary due to the timing of recording these transactions in relation to fluctuating net assets of the classes. Expenses directly attributable to a fund are charged to that fund. Expenses attributable to more than one fund are allocated among the respective funds on the basis of relative net assets or other appropriate methods. Expense estimates are accrued in the period to which they relate and adjustments are made when actual amounts are known.
Income Tax Information and Distributions to Shareholders. Each year, the Fund intends to qualify as a regulated investment company under Subchapter M of the Internal Revenue Code, including distributing substantially all of its taxable income and realized gains. As a result, no provision for U.S. Federal income taxes is required. As of October 31, 2014, the Fund did not have any unrecognized tax benefits in the financial statements; nor is the Fund aware of any tax positions for which it is reasonably possible that the total amounts of unrecognized tax benefits will significantly change in the next twelve months. The Fund files a U.S. federal tax return, in addition to state and local tax returns as required. The Fund's federal income tax returns are subject to examination by the Internal Revenue Service (IRS) for a period of three fiscal years after they are filed. State and local tax returns may be subject to examination for an additional fiscal year depending on the jurisdiction. Foreign taxes are provided for based on the Fund's understanding of the tax rules and rates that exist in the foreign markets in which it invests. The Fund is subject to a tax imposed on capital gains by certain countries in which it invests.
Distributions are declared and recorded on the ex-dividend date. Income dividends and capital gain distributions are declared separately for each class. Income and capital gain distributions are determined in accordance with income tax regulations, which may differ from GAAP. In addition, the Fund claimed a portion of the payment made to redeeming shareholders as a distribution for income tax purposes.
Capital accounts within the financial statements are adjusted for permanent book-tax differences. These adjustments have no impact on net assets or the results of operations. Capital accounts are not adjusted for temporary book-tax differences which will reverse in a subsequent period.
Book-tax differences are primarily due to foreign currency transactions, certain foreign taxes, passive foreign investment companies (PFIC), capital loss carryforwards and losses due to wash sales.
Annual Report
3. Significant Accounting Policies - continued
Income Tax Information and Distributions to Shareholders - continued
The federal tax cost of investment securities and unrealized appreciation (depreciation) as of period end were as follows:
Gross unrealized appreciation | $ 22,933,818 |
Gross unrealized depreciation | (13,301,769) |
Net unrealized appreciation (depreciation) on securities | $ 9,632,049 |
| |
Tax Cost | $ 110,257,715 |
The tax-based components of distributable earnings as of period end were as follows:
Undistributed ordinary income | $ 2,385,005 |
Capital loss carryforward | $ (6,057,255) |
Net unrealized appreciation (depreciation) on securities and other investments | $ 9,630,792 |
Capital loss carryforwards are only available to offset future capital gains of the Fund to the extent provided by regulations and may be limited. Under the Regulated Investment Company Modernization Act of 2010 (the Act), the Fund is permitted to carry forward capital losses incurred in taxable years beginning after December 22, 2010 for an unlimited period and such capital losses are required to be used prior to any losses that expire. The capital loss carryforward information presented below, including any applicable limitation, is estimated as of fiscal period end and is subject to adjustment.
Fiscal year of expiration | |
2018 | $ (1,624,705) |
No expiration | |
Short-term | (373,258) |
Long-term | (4,059,292) |
Total no expiration | (4,432,550) |
Total capital loss carryforward | $ (6,057,255) |
The tax character of distributions paid was as follows:
| October 31, 2014 | October 31, 2013 |
Ordinary Income | $ 1,921,556 | $ 3,874,609 |
Short-Term Trading (Redemption) Fees. Shares held by investors in the Fund less than 90 days may have been subject to a redemption fee equal to 1.50% of the NAV of shares redeemed. All redemption fees, which reduce the proceeds of the shareholder redemption, are retained by the Fund and accounted for as an addition to paid in capital.
Annual Report
Notes to Financial Statements - continued
3. Significant Accounting Policies - continued
Restricted Securities. The Fund may invest in securities that are subject to legal or contractual restrictions on resale. These securities generally may be resold in transactions exempt from registration or to the public if the securities are registered. Disposal of these securities may involve time-consuming negotiations and expense, and prompt sale at an acceptable price may be difficult. Information regarding restricted securities is included at the end of the Fund's Schedule of Investments.
New Accounting Pronouncement. In June 2014, the Financial Accounting Standards Board issued Accounting Standard Update No. 2014-11, Repurchase-to-Maturity Transactions, Repurchase Financings, and Disclosures. The Update amends the accounting for certain repurchase agreements and expands disclosure requirements for reverse repurchase agreements, securities lending and other similar transactions. The disclosure requirements are effective for annual and interim reporting periods beginning after December 15, 2014. Management is currently evaluating the impact of the Update on the Fund's financial statements and related disclosures.
4. Purchases and Sales of Investments.
Purchases and sales of securities, other than short-term securities, aggregated $49,109,257 and $63,629,040, respectively.
5. Fees and Other Transactions with Affiliates.
Management Fee. FMR and its affiliates provide the Fund with investment management related services for which the Fund pays a monthly management fee. The management fee is the sum of an individual fund fee rate that is based on an annual rate of .55% of the Fund's average net assets and an annualized group fee rate that averaged .25% during the period. The group fee rate is based upon the average net assets of all the mutual funds advised by the investment adviser, including any mutual funds previously advised by the investment adviser that are currently advised by Fidelity SelectCo, LLC, an affiliate of the investment adviser. The group fee rate decreases as assets under management increase and increases as assets under management decrease. For the reporting period, the total annual management fee rate was .80% of the Fund's average net assets.
Distribution and Service Plan Fees. In accordance with Rule 12b-1 of the 1940 Act, the Fund has adopted separate Distribution and Service Plans for each class of shares. Certain classes pay Fidelity Distributors Corporation (FDC), an affiliate of the investment adviser, separate Distribution and Service Fees, each of which is based on an annual percentage of each class' average net assets. In addition, FDC may pay financial intermediaries for selling shares of the Fund and providing shareholder support services.
Annual Report
5. Fees and Other Transactions with Affiliates - continued
Distribution and Service Plan Fees - continued
For the period, the Distribution and Service Fee rates, total fees and amounts retained by FDC were as follows:
| Distribution
Fee | Service
Fee | Total Fees | Retained
by FDC |
Class A | -% | .25% | $ 24,843 | $ 1,208 |
Class T | .25% | .25% | 13,280 | 23 |
Class B | .75% | .25% | 3,284 | 2,463 |
Class C | .75% | .25% | 66,509 | 10,322 |
| | | $ 107,916 | $ 14,016 |
Sales Load. FDC may receive a front-end sales charge of up to 5.75% for selling Class A shares and 3.50% for selling Class T shares, some of which is paid to financial intermediaries for selling shares of the Fund. Depending on the holding period, FDC may receive contingent deferred sales charges levied on Class A, Class T, Class B, and Class C redemptions. The deferred sales charges range from 5.00% to 1.00% for Class B shares, 1.00% for Class C shares, 1.00% for certain purchases of Class A shares and .25% for certain purchases of Class T shares.
For the period, sales charge amounts retained by FDC were as follows:
| Retained
by FDC |
Class A | $ 15,260 |
Class T | 1,500 |
Class B* | 445 |
Class C* | 319 |
| $ 17,524 |
* When Class B and Class C shares are initially sold, FDC pays commissions from its own resources to financial intermediaries through which the sales are made.
Transfer Agent Fees. Fidelity Investments Institutional Operations Company, Inc., (FIIOC), an affiliate of FMR, is the transfer, dividend disbursing and shareholder servicing agent for each class of the Fund. FIIOC receives account fees and asset-based fees that vary according to the account size and type of account of the shareholders of the respective classes of the Fund. FIIOC pays for typesetting, printing and mailing of shareholder reports, except proxy statements.
Annual Report
Notes to Financial Statements - continued
5. Fees and Other Transactions with Affiliates - continued
Transfer Agent Fees - continued
For the period, transfer agent fees for each class were as follows:
| Amount | % of
Class-Level Average
Net Assets |
Class A | $ 25,172 | .25 |
Class T | 8,709 | .33 |
Class B | 995 | .30 |
Class C | 20,260 | .30 |
Emerging Europe, Middle East, Africa (EMEA) | 287,461 | .28 |
Institutional Class | 11,478 | .17 |
| $ 354,075 | |
Accounting and Security Lending Fees. Fidelity Service Company, Inc. (FSC), an affiliate of the investment adviser, maintains the Fund's accounting records. The accounting fee is based on the level of average net assets for each month. Under a separate contract, FSC administers the security lending program. The security lending fee is based on the number and duration of lending transactions.
Brokerage Commissions. The Fund placed a portion of its portfolio transactions with brokerage firms which are affiliates of the investment. Brokerage commissions are included in net realized gain (loss) and change in net unrealized appreciation (depreciation) in the Statement of Operations. The commissions paid to these affiliated firms were $48 for the period.
Other. During the period, the investment adviser reimbursed the Fund for certain losses in the amount of $1,567.
6. Committed Line of Credit.
The Fund participates with other funds managed by the investment adviser or an affiliate in a $4.25 billion credit facility (the "line of credit") to be utilized for temporary or emergency purposes to fund shareholder redemptions or for other short-term liquidity purposes. The Fund has agreed to pay commitment fees on its pro-rata portion of the line of credit, which amounted to $215 and is reflected in Miscellaneous expenses on the Statement of Operations. During the period, the Fund did not borrow on this line of credit.
Annual Report
7. Security Lending.
The Fund lends portfolio securities through a lending agent from time to time in order to earn additional income. For equity securities, a lending agent is used and may loan securities to certain qualified borrowers, including Fidelity Capital Markets (FCM), a broker-dealer affiliated with the Fund. On the settlement date of the loan, the Fund receives collateral (in the form of U.S. Treasury obligations, letters of credit and/or cash) against the loaned securities and maintains collateral in an amount not less than 100% of the market value of the loaned securities during the period of the loan. The market value of the loaned securities is determined at the close of business of the Fund and any additional required collateral is delivered to the Fund on the next business day. If the borrower defaults on its obligation to return the securities loaned because of insolvency or other reasons, the Fund may apply collateral received from the borrower against the obligation. The Fund may experience delays and costs in recovering the securities loaned. Any cash collateral received is invested in the Fidelity Securities Lending Cash Central Fund. The value of loaned securities is disclosed on the Fund's Statement of Assets and Liabilities. At period end, there were no security loans outstanding. Security lending income represents the income earned on investing cash collateral, less rebates paid to borrowers and any lending agent fees associated with the loan, plus any premium payments received for lending certain types of securities. Security lending income is presented in the Statement of Operations as a component of income from Fidelity Central Funds. Total security lending income during the period amounted to $5,426. During the period, there were no securities loaned to FCM.
8. Expense Reductions.
The investment adviser voluntarily agreed to reimburse each class to the extent annual operating expenses exceeded certain levels of average net assets as noted in the table below. Some expenses, for example interest expense, including commitment fees, are excluded from this reimbursement.
The following classes were in reimbursement during the period:
| Expense
Limitations | Reimbursement |
Class T | 1.90% | $ 595 |
In addition, the investment adviser reimbursed a portion of the fund's operating expenses during the period in the amount of $1,064.
Commissions paid to certain brokers with whom the investment adviser, or its affiliates, places trades on behalf of the Fund include an amount in addition to trade execution, which may be rebated back to the Fund to offset certain expenses. This amount totaled $257 for the period.
Annual Report
Notes to Financial Statements - continued
9. Distributions to Shareholders.
Distributions to shareholders of each class were as follows:
Years ended October 31, | 2014 | 2013 |
From net investment income | | |
Class A | $ 138,741 | $ 155,525 |
Class T | 39,254 | 46,756 |
Class B | 1,980 | 2,757 |
Class C | 46,648 | 69,716 |
Emerging Europe, Middle East, Africa (EMEA) | 1,537,065 | 2,222,632 |
Institutional Class | 157,868 | 192,599 |
Total | $ 1,921,556 | $ 2,689,985 |
From net realized gain | | |
Class A | $ - | $ 76,218 |
Class T | - | 28,360 |
Class B | - | 3,579 |
Class C | - | 66,141 |
Emerging Europe, Middle East, Africa (EMEA) | - | 934,516 |
Institutional Class | - | 75,810 |
Total | $ - | $ 1,184,624 |
10. Share Transactions.
Share transactions for each class were as follows and may contain automatic conversions between classes or exchanges between funds:
| Shares | Dollars |
Years ended October 31, | 2014 | 2013 | 2014 | 2013 |
Class A | | | | |
Shares sold | 315,373 | 422,392 | $ 2,918,425 | $ 3,786,551 |
Reinvestment of distributions | 11,698 | 20,821 | 104,929 | 182,599 |
Shares redeemed | (601,453) | (321,728) | (5,463,762) | (2,828,311) |
Net increase (decrease) | (274,382) | 121,485 | $ (2,440,408) | $ 1,140,839 |
Class T | | | | |
Shares sold | 101,639 | 88,958 | $ 928,488 | $ 793,473 |
Reinvestment of distributions | 4,323 | 8,485 | 38,736 | 74,325 |
Shares redeemed | (198,384) | (115,399) | (1,797,181) | (1,019,893) |
Net increase (decrease) | (92,422) | (17,956) | $ (829,957) | $ (152,095) |
Class B | | | | |
Shares sold | 4,359 | 10,659 | $ 39,785 | $ 95,440 |
Reinvestment of distributions | 219 | 679 | 1,980 | 5,999 |
Shares redeemed | (12,911) | (21,228) | (117,435) | (189,688) |
Net increase (decrease) | (8,333) | (9,890) | $ (75,670) | $ (88,249) |
Annual Report
10. Share Transactions - continued
| Shares | Dollars |
Years ended October 31, | 2014 | 2013 | 2014 | 2013 |
Emerging Europe, Middle East, Africa (EMEA) | | | | |
Class C | | | | |
Shares sold | 241,646 | 249,509 | $ 2,211,783 | $ 2,176,685 |
Reinvestment of distributions | 3,905 | 12,615 | 34,875 | 110,128 |
Shares redeemed | (221,913) | (441,523) | (2,006,697) | (3,878,247) |
Net increase (decrease) | 23,638 | (179,399) | $ 239,961 | $ (1,591,434) |
Shares sold | 2,719,041 | 4,724,612 | $ 24,959,563 | $ 42,683,733 |
Reinvestment of distributions | 162,803 | 341,639 | 1,463,600 | 2,999,595 |
Shares redeemed | (3,802,325) | (6,228,497) | (34,854,232) | (55,025,066) |
Net increase (decrease) | (920,481) | (1,162,246) | $ (8,431,069) | $ (9,341,738) |
Institutional Class | | | | |
Shares sold | 374,756 | 478,817 | $ 3,428,841 | $ 4,308,546 |
Reinvestment of distributions | 8,639 | 10,415 | 77,579 | 91,338 |
Shares redeemed | (841,493) | (396,145) | (7,467,169) | (3,464,870) |
Net increase (decrease) | (458,098) | 93,087 | $ (3,960,749) | $ 935,014 |
11. Other.
The Fund's organizational documents provide former and current trustees and officers with a limited indemnification against liabilities arising in connection with the performance of their duties to the Fund. In the normal course of business, the Fund may also enter into contracts that provide general indemnifications. The Fund's maximum exposure under these arrangements is unknown as this would be dependent on future claims that may be made against the Fund. The risk of material loss from such claims is considered remote.
Annual Report
To the Trustees of Fidelity Investment Trust and Shareholders of Fidelity Emerging Europe, Middle East, Africa (EMEA) Fund:
We have audited the accompanying statement of assets and liabilities of Fidelity Emerging Europe, Middle East, Africa (EMEA) Fund (the Fund), a fund of Fidelity Investment Trust, including the schedule of investments, as of October 31, 2014, and the related statement of operations for the year then ended, the statement of changes in net assets for each of the two years in the period then ended, and the financial highlights for each of the five years in the period then ended. These financial statements and financial highlights are the responsibility of the Fund's management. Our responsibility is to express an opinion on these financial statements and financial highlights based on our audits.
We conducted our audits in accordance with the standards of the Public Company Accounting Oversight Board (United States). Those standards require that we plan and perform the audit to obtain reasonable assurance about whether the financial statements and financial highlights are free of material misstatement. The Fund is not required to have, nor were we engaged to perform, an audit of its internal control over financial reporting. Our audits included consideration of internal control over financial reporting as a basis for designing audit procedures that are appropriate in the circumstances, but not for the purpose of expressing an opinion on the effectiveness of the Fund's internal control over financial reporting. Accordingly, we express no such opinion. An audit also includes examining, on a test basis, evidence supporting the amounts and disclosures in the financial statements, assessing the accounting principles used and significant estimates made by management, as well as evaluating the overall financial statement presentation. Our procedures included confirmation of securities owned as of October 31, 2014, by correspondence with the custodians and brokers; where replies were not received from brokers, we performed other auditing procedures. We believe that our audits provide a reasonable basis for our opinion.
In our opinion, the financial statements and financial highlights referred to above present fairly, in all material respects, the financial position of Fidelity Emerging Europe, Middle East, Africa (EMEA) Fund as of October 31, 2014, the results of its operations for the year then ended, the changes in its net assets for each of the two years in the period then ended, and the financial highlights for each of the five years in the period then ended, in conformity with accounting principles generally accepted in the United States of America.
DELOITTE & TOUCHE LLP
Boston, Massachusetts
December 19, 2014
Annual Report
The Trustees, Member of the Advisory Board, and officers of the trust and fund, as applicable, are listed below. The Board of Trustees governs the fund and is responsible for protecting the interests of shareholders. The Trustees are experienced executives who meet periodically throughout the year to oversee the fund's activities, review contractual arrangements with companies that provide services to the fund, oversee management of the risks associated with such activities and contractual arrangements, and review the fund's performance. Except for James C. Curvey, each of the Trustees oversees 174 funds. Mr. Curvey oversees 407 funds.
The Trustees hold office without limit in time except that (a) any Trustee may resign; (b) any Trustee may be removed by written instrument, signed by at least two-thirds of the number of Trustees prior to such removal; (c) any Trustee who requests to be retired or who has become incapacitated by illness or injury may be retired by written instrument signed by a majority of the other Trustees; and (d) any Trustee may be removed at any special meeting of shareholders by a two-thirds vote of the outstanding voting securities of the trust. Each Trustee who is not an interested person (as defined in the 1940 Act) of the trust and the fund (Independent Trustee), shall retire not later than the last day of the calendar year in which his or her 75th birthday occurs. The Independent Trustees may waive this mandatory retirement age policy with respect to individual Trustees. The officers and Advisory Board Member hold office without limit in time, except that any officer and Advisory Board Member may resign or may be removed by a vote of a majority of the Trustees at any regular meeting or any special meeting of the Trustees. Except as indicated, each individual has held the office shown or other offices in the same company for the past five years.
Experience, Skills, Attributes, and Qualifications of the Fund's Trustees. The Governance and Nominating Committee has adopted a statement of policy that describes the experience, qualifications, attributes, and skills that are necessary and desirable for potential Independent Trustee candidates (Statement of Policy). The Board believes that each Trustee satisfied at the time he or she was initially elected or appointed a Trustee, and continues to satisfy, the standards contemplated by the Statement of Policy. The Governance and Nominating Committee also engages professional search firms to help identify potential Independent Trustee candidates who have the experience, qualifications, attributes, and skills consistent with the Statement of Policy. From time to time, additional criteria based on the composition and skills of the current Independent Trustees, as well as experience or skills that may be appropriate in light of future changes to board composition, business conditions, and regulatory or other developments, have also been considered by the professional search firms and the Governance and Nominating Committee. In addition, the Board takes into account the Trustees' commitment and participation in Board and committee meetings, as well as their leadership of standing and ad hoc committees throughout their tenure.
In determining that a particular Trustee was and continues to be qualified to serve as a Trustee, the Board has considered a variety of criteria, none of which, in isolation, was controlling. The Board believes that, collectively, the Trustees have balanced and diverse experience, qualifications, attributes, and skills, which allow the Board to operate effectively in governing the fund and protecting the interests of shareholders. Information about the specific experience, skills, attributes, and qualifications of each Trustee, which in each case led to the Board's conclusion that the Trustee should serve (or continue to serve) as a trustee of the fund, is provided below.
Annual Report
Board Structure and Oversight Function. James C. Curvey is an interested person (as defined in the 1940 Act) and currently serves as Chairman. The Trustees have determined that an interested Chairman is appropriate and benefits shareholders because an interested Chairman has a personal and professional stake in the quality and continuity of services provided to the fund. Independent Trustees exercise their informed business judgment to appoint an individual of their choosing to serve as Chairman, regardless of whether the Trustee happens to be independent or a member of management. The Independent Trustees have determined that they can act independently and effectively without having an Independent Trustee serve as Chairman and that a key structural component for assuring that they are in a position to do so is for the Independent Trustees to constitute a substantial majority for the Board. The Independent Trustees also regularly meet in executive session. Ned C. Lautenbach serves as Chairman of the Independent Trustees and as such (i) acts as a liaison between the Independent Trustees and management with respect to matters important to the Independent Trustees and (ii) with management prepares agendas for Board meetings.
Fidelity funds are overseen by different Boards of Trustees. The fund's Board oversees Fidelity's equity and high income funds and another Board oversees Fidelity's investment-grade bond, money market, and asset allocation funds. The asset allocation funds may invest in Fidelity funds overseen by the fund's Board. The use of separate Boards, each with its own committee structure, allows the Trustees of each group of Fidelity funds to focus on the unique issues of the funds they oversee, including common research, investment, and operational issues. On occasion, the separate Boards establish joint committees to address issues of overlapping consequences for the Fidelity funds overseen by each Board.
The Trustees operate using a system of committees to facilitate the timely and efficient consideration of all matters of importance to the Trustees, the fund, and fund shareholders and to facilitate compliance with legal and regulatory requirements and oversight of the fund's activities and associated risks. The Board, acting through its committees, has charged FMR and its affiliates with (i) identifying events or circumstances the occurrence of which could have demonstrably adverse effects on the fund's business and/or reputation; (ii) implementing processes and controls to lessen the possibility that such events or circumstances occur or to mitigate the effects of such events or circumstances if they do occur; and (iii) creating and maintaining a system designed to evaluate continuously business and market conditions in order to facilitate the identification and implementation processes described in (i) and (ii) above. Because the day-to-day operations and activities of the fund are carried out by or through FMR, its affiliates and other service providers, the fund's exposure to risks is mitigated but not eliminated by the processes overseen by the Trustees. While each of the Board's committees has responsibility for overseeing different aspects of the fund's activities, oversight is exercised primarily through the Operations, Audit, and Compliance Committees. In addition, the Independent Trustees have worked with FMR to enhance the Board's oversight of investment and financial risks, legal and regulatory risks, technology risks, and operational risks, including the development of additional risk reporting to the Board. For example, a working group comprised of Independent Trustees and FMR has worked and continues to work to review the Fidelity funds' valuation-related activities, reporting and risk management. Appropriate personnel, including but not limited to the fund's Chief Compliance Officer (CCO), FMR's internal auditor, the independent accountants, the fund's Treasurer and portfolio management personnel, make periodic reports to the Board's committees, as appropriate, including an annual review of FMR's risk management program for the Fidelity funds. The responsibilities of each standing committee, including their oversight responsibilities, are described further under "Standing Committees of the Fund's Trustees."
Annual Report
Trustees and Officers - continued
The fund's Statement of Additional Information (SAI) includes more information about the Trustees. To request a free copy, call Fidelity at 1-800-544-8544.
Interested Trustees*:
Correspondence intended for each Trustee who is an interested person may be sent to Fidelity Investments, 245 Summer Street, Boston, Massachusetts 02210.
Name, Year of Birth; Principal Occupations and Other Relevant Experience+ |
James C. Curvey (1935) |
Year of Election or Appointment: 2007 Trustee Chairman of the Board of Trustees |
| Mr. Curvey also serves as Trustee of other Fidelity funds. Mr. Curvey is a Director of Fidelity Research & Analysis Co. (2009-present), and Vice Chairman (2007-present) and Director of FMR LLC. In addition, Mr. Curvey serves as an Overseer for the Boston Symphony Orchestra and a member of the board of Artis-Naples, Naples, Florida, and as a Trustee for Brewster Academy, Wolfeboro, New Hampshire. Previously, Mr. Curvey served as a Director of Fidelity Investments Money Management, Inc. (2009-2014), a Director of FMR (2007-2014), and a Director of FMR Co., Inc. (2007-2014). |
Charles S. Morrison (1960) |
Year of Election or Appointment: 2014 Trustee |
| Mr. Morrison also serves as Trustee of other funds. He serves as a Director of Fidelity Investments Money Management, Inc. (FIMM) (2014-present), Director of Fidelity SelectCo, LLC (2014-present), President, Asset Management (2014-present), and is an employee of Fidelity Investments. Previously, Mr. Morrison served as Vice President of Fidelity's Fixed Income and Asset Allocation Funds (2012-2014), President, Fixed Income (2011-2014), Vice President of Fidelity's Money Market Funds (2005-2009), President, Money Market Group Leader of FMR (2009), and Senior Vice President, Money Market Group of FMR (2004-2009). Mr. Morrison also served as Vice President of Fidelity's Bond Funds (2002-2005), certain Balanced Funds (2002-2005), and certain Asset Allocation Funds (2002-2007), and as Senior Vice President (2002-2005) of Fidelity's Bond Division. |
* Trustees have been determined to be "Interested Trustees" by virtue of, among other things, their affiliation with the trust or various entities under common control with FMR.
+ The information above includes each Trustee's principal occupation during the last five years and other information relating to the experience, attributes, and skills relevant to each Trustee's qualifications to serve as a Trustee, which led to the conclusion that each Trustee should serve as a Trustee for the fund.
Annual Report
Trustees and Officers - continued
Independent Trustees:
Correspondence intended for each Independent Trustee (that is, the Trustees other than the Interested Trustees) may be sent to Fidelity Investments, P.O. Box 55235, Boston, Massachusetts 02205-5235.
Name, Year of Birth; Principal Occupations and Other Relevant Experience+ |
Dennis J. Dirks (1948) |
Year of Election or Appointment: 2005 Trustee |
| Mr. Dirks also serves as Trustee of other Fidelity funds. Prior to his retirement in May 2003, Mr. Dirks was Chief Operating Officer and a member of the Board of The Depository Trust & Clearing Corporation (DTCC). He also served as President, Chief Operating Officer, and Board member of The Depository Trust Company (DTC) and President and Board member of the National Securities Clearing Corporation (NSCC). In addition, Mr. Dirks served as Chief Executive Officer and Board member of the Government Securities Clearing Corporation, Chief Executive Officer and Board member of the Mortgage-Backed Securities Clearing Corporation, as a Trustee and a member of the Finance Committee of Manhattan College (2005-2008), and as a Trustee and a member of the Finance Committee of AHRC of Nassau County (2006-2008). Mr. Dirks is a member of the Independent Directors Council (IDC) Governing Council (2010-present) and Board of Directors for The Brookville Center for Children's Services, Inc. (2009-present). |
Alan J. Lacy (1953) |
Year of Election or Appointment: 2008 Trustee |
| Mr. Lacy also serves as Trustee of other Fidelity funds. Mr. Lacy serves as Senior Adviser (2007-present) of Oak Hill Capital Partners, L.P. (private equity). Mr. Lacy also served as Chief Executive Officer (2000-2005) and Vice Chairman (2005-2006) of Sears Holdings Corporation and Sears, Roebuck and Co. (retail). In addition, Mr. Lacy serves as a member of the Board of Directors of Dave & Buster's Entertainment, Inc. (restaurant and entertainment complexes, 2010-present), Earth Fare, Inc. (retail grocery, 2012-present), The Hillman Companies, Inc. (hardware wholesalers, 2010-present), and Bristol-Myers Squibb Company (global pharmaceuticals, 2008-present). Mr. Lacy is a member of the Board of Trustees of The National Parks Conservation Association (2006-present). Previously, Mr. Lacy served as Chairman of the Board of Trustees of the National Parks Conservation Association (2008-2011) and as a member of the Board of Directors for the Western Union Company (global money transfer, 2006-2011). |
Ned C. Lautenbach (1944) |
Year of Election or Appointment: 2000 Trustee Chairman of the Independent Trustees |
| Mr. Lautenbach also serves as Trustee of other Fidelity funds. Mr. Lautenbach currently serves as the Lead Director of the Eaton Corporation Board of Directors (diversified industrial, 1997-present). Mr. Lautenbach is Chairman of the Board of Directors of the Philharmonic Center for the Arts in Naples, Florida (2012-present) and a member of the Council on Foreign Relations (1994-present). Previously, Mr. Lautenbach was a Partner/Advisory Partner at Clayton, Dubilier & Rice, LLC (private equity investment, 1998-2010), as well as a Director of Sony Corporation (2006-2007). |
Joseph Mauriello (1944) |
Year of Election or Appointment: 2008 Trustee |
| Mr. Mauriello also serves as Trustee of other Fidelity funds. Prior to his retirement in January 2006, Mr. Mauriello served in numerous senior management positions including Deputy Chairman and Chief Operating Officer (2004-2005), and Vice Chairman of Financial Services (2002-2004) of KPMG LLP US (professional services, 1965-2005). Mr. Mauriello currently serves as a member of the Board of Directors of XL Group plc. (global insurance and re-insurance, 2006-present). Previously, Mr. Mauriello served as a Director of the Hamilton Funds of the Bank of New York (2006-2007) and of Arcadia Resources Inc. (health care services and products, 2007-2012). |
Robert W. Selander (1950) |
Year of Election or Appointment: 2011 Trustee |
| Mr. Selander also serves as Trustee of other Fidelity funds. Previously, Mr. Selander served as a Member of the Advisory Board of other Fidelity funds (2011), and Executive Vice Chairman (2010), Chief Executive Officer (2009-2010), and President and Chief Executive Officer (1997-2009) of Mastercard, Inc. |
Cornelia M. Small (1944) |
Year of Election or Appointment: 2005 Trustee |
| Ms. Small also serves as Trustee of other Fidelity funds. Ms. Small is a member of the Board of Directors (2009-present) and Chair of the Investment Committee (2010-present) of the Teagle Foundation. Ms. Small also serves on the Investment Committee of the Berkshire Taconic Community Foundation (2008-present). Previously, Ms. Small served as Chairperson (2002-2008) and a member of the Investment Committee and Chairperson (2008-2012) and a member of the Board of Trustees of Smith College. In addition, Ms. Small served as Chief Investment Officer, Director of Global Equity Investments, and a member of the Board of Directors of Scudder, Stevens & Clark and Scudder Kemper Investments. |
William S. Stavropoulos (1939) |
Year of Election or Appointment: 2001 Trustee Vice Chairman of the Independent Trustees |
| Mr. Stavropoulos also serves as Trustee of other Fidelity funds. Mr. Stavropoulos serves as President and Founder of the Michigan Baseball Foundation, the Great Lakes Loons (2007-present). Mr. Stavropoulos is Chairman Emeritus of the Board of Directors of The Dow Chemical Company, where he previously served in numerous senior management positions, including President, CEO (1995-2000; 2002-2004), Chairman of the Executive Committee (2000-2006), and as a member of the Board of Directors (1990-2006). Currently, Mr. Stavropoulos is Chairman of the Board of Directors of Univar Inc. (global distributor of commodity and specialty chemicals), a Director of Teradata Corporation (data warehousing and technology solutions), and Maersk Inc. (industrial conglomerate), and a member of the Advisory Board for Metalmark Capital LLC (private equity investment, 2005-present). Mr. Stavropoulos is an operating advisor to Clayton, Dubilier & Rice, LLC (private equity investment). In addition, Mr. Stavropoulos is a member of the University of Notre Dame Advisory Council for the College of Science, a Trustee of the Rollin L. Gerstacker Foundation, and a Director of the Naples Philharmonic Center for the Arts. Previously, Mr. Stavropoulos served as a Director of Chemical Financial Corporation (bank holding company, 1993-2012) and Tyco International, Ltd. (multinational manufacturing and services, 2007-2012). |
David M. Thomas (1949) |
Year of Election or Appointment: 2008 Trustee |
| Mr. Thomas also serves as Trustee of other Fidelity funds. Mr. Thomas serves as Non-Executive Chairman of the Board of Directors of Fortune Brands Home and Security (home and security products, 2011-present), and as a member of the Board of Directors of Interpublic Group of Companies, Inc. (marketing communication, 2004-present). Previously, Mr. Thomas served as Executive Chairman (2005-2006) and Chairman and Chief Executive Officer (2000-2005) of IMS Health, Inc. (pharmaceutical and healthcare information solutions), and a Director of Fortune Brands, Inc. (consumer products, 2000-2011). |
+ The information above includes each Trustee's principal occupation during the last five years and other information relating to the experience, attributes, and skills relevant to each Trustee's qualifications to serve as a Trustee, which led to the conclusion that each Trustee should serve as a Trustee for the fund.
Advisory Board Member and Officers:
Correspondence intended for each officer and Peter S. Lynch may be sent to Fidelity Investments, 245 Summer Street, Boston, Massachusetts 02210. Officers appear below in alphabetical order.
Name, Year of Birth; Principal Occupation |
Peter S. Lynch (1944) |
Year of Election or Appointment: 2003 Member of the Advisory Board |
| Mr. Lynch also serves as Member of the Advisory Board of other Fidelity funds. Mr. Lynch is Vice Chairman and a Director of FMR and FMR Co., Inc. In addition, Mr. Lynch serves as a Trustee of Boston College and as the Chairman of the Inner-City Scholarship Fund. Previously, Mr. Lynch served on the Special Olympics International Board of Directors (1997-2006). |
Elizabeth Paige Baumann (1968) |
Year of Election or Appointment: 2012 Anti-Money Laundering (AML) Officer |
| Ms. Baumann also serves as AML Officer of other funds. She is Chief AML Officer of FMR LLC (2012-present) and is an employee of Fidelity Investments. Previously, Ms. Baumann served as Vice President and Deputy Anti-Money Laundering Officer (2007-2012). |
William C. Coffey (1969) |
Year of Election or Appointment: 2009 Assistant Secretary |
| Mr. Coffey also serves as Assistant Secretary of other funds. He is Senior Vice President and Deputy General Counsel of FMR LLC (2010-present), and is an employee of Fidelity Investments. Previously, Mr. Coffey served as Vice President and Associate General Counsel of FMR LLC (2005-2009). |
Timothy M. Cohen (1969) |
Year of Election or Appointment: 2014 Vice President of certain Equity Funds |
| Mr. Cohen also serves as Vice President of other funds. Mr. Cohen serves as a Director and Chief Compliance Officer of Fidelity Management & Research (U.K.) Inc. (2013-present) and is an employee of Fidelity Investments. |
Jonathan Davis (1968) |
Year of Election or Appointment: 2010 Assistant Treasurer |
| Mr. Davis also serves as Assistant Treasurer of other funds. Mr. Davis is an employee of Fidelity Investments. Previously, Mr. Davis served as Vice President and Associate General Counsel of FMR LLC (2003-2010). |
Adrien E. Deberghes (1967) |
Year of Election or Appointment: 2008 Deputy Treasurer |
| Mr. Deberghes also serves as an officer of other funds. He is an employee of Fidelity Investments (2008-present). Prior to joining Fidelity Investments, Mr. Deberghes was Senior Vice President of Mutual Fund Administration at State Street Corporation (2007-2008), Senior Director of Mutual Fund Administration at Investors Bank & Trust (2005-2007), and Director of Finance for Dunkin' Brands (2000-2005). |
Stephanie J. Dorsey (1969) |
Year of Election or Appointment: 2010 Assistant Treasurer |
| Ms. Dorsey also serves as an officer of other funds. She is an employee of Fidelity Investments (2008-present) and has served in other fund officer roles. Prior to joining Fidelity Investments, Ms. Dorsey served as Treasurer (2004-2008) of the JPMorgan Mutual Funds and Vice President (2004-2008) of JPMorgan Chase Bank. |
Howard J. Galligan III (1966) |
Year of Election or Appointment: 2014 Chief Financial Officer |
| Mr. Galligan also serves as Chief Financial Officer of other funds. Mr. Galligan serves as President of Fidelity Pricing and Cash Management Services (FPCMS) (2014-present) and as a Director of Strategic Advisers, Inc. (2008-present). Previously, Mr. Galligan served as Chief Administrative Officer of Asset Management (2011-2014) and Chief Operating Officer and Senior Vice President of Investment Support for Strategic Advisers, Inc. (2003-2011). |
Scott C. Goebel (1968) |
Year of Election or Appointment: 2008 Secretary and Chief Legal Officer (CLO) |
| Mr. Goebel serves as Secretary and CLO of other funds. Mr. Goebel also serves as Secretary of Fidelity SelectCo, LLC (2013-present), Fidelity Investments Money Management, Inc. (FIMM) (2010-present) and Fidelity Research and Analysis Company (FRAC) (2010-present); General Counsel, Secretary, and Senior Vice President of FMR (2008-present) and FMR Co., Inc. (2008-present); Chief Legal Officer of Fidelity Management & Research (Hong Kong) Limited (2008-present); and Assistant Secretary of Fidelity Management & Research (Japan) Limited (2008-present) and Fidelity Management & Research (U.K.) Inc. (2008-present). Previously, Mr. Goebel served as Secretary and CLO of other Fidelity funds (2008-2013), Assistant Secretary of FIMM (2008-2010), FRAC (2008-2010), and certain funds (2007-2008); and as Vice President and Secretary of Fidelity Distributors Corporation (FDC) (2005-2007). Mr. Goebel has been employed by FMR LLC or an affiliate since 2001. |
Brian B. Hogan (1964) |
Year of Election or Appointment: 2009 Vice President |
| Mr. Hogan also serves as Trustee or Vice President of other funds. Mr. Hogan serves as a Director of Fidelity SelectCo, LLC (2014-present) and President of FMR's Equity Division (2009-present). Previously, Mr. Hogan served as Senior Vice President, Equity Research of FMR (2006-2009) and as a portfolio manager. |
Chris Maher (1972) |
Year of Election or Appointment: 2013 Assistant Treasurer |
| Mr. Maher serves as Assistant Treasurer of other funds. Mr. Maher is Vice President of Valuation Oversight and is an employee of Fidelity Investments. Previously, Mr. Maher served as Vice President of Asset Management Compliance (2013), Vice President of FMR's Program Management Group (2010-2013), and Vice President of Valuation Oversight (2008-2010). |
Kenneth B. Robins (1969) |
Year of Election or Appointment: 2008 President and Treasurer |
| Mr. Robins also serves as an officer of other funds. Mr. Robins serves as Executive Vice President of Fidelity Investments Money Management, Inc. (FIMM) (2013-present) and is an employee of Fidelity Investments (2004-present). Previously, Mr. Robins served in other fund officer roles. |
Stephen Sadoski (1971) |
Year of Election or Appointment: 2012 Deputy Treasurer |
| Mr. Sadoski also serves as Deputy Treasurer of other funds. He is an employee of Fidelity Investments (2012-present) and has served in another fund officer role. Prior to joining Fidelity Investments, Mr. Sadoski served as an assistant chief accountant in the Division of Investment Management of the Securities and Exchange Commission (SEC) (2009-2012) and as a senior manager at Deloitte & Touche LLP (1997-2009). |
Stacie M. Smith (1974) |
Year of Election or Appointment: 2013 Deputy Treasurer |
| Ms. Smith also serves as an officer of other funds. She is an employee of Fidelity Investments (2009-present) and has served in other fund officer roles. Prior to joining Fidelity Investments, Ms. Smith served as Senior Audit Manager of Ernst & Young LLP (1996-2009). |
Renee Stagnone (1975) |
Year of Election or Appointment: 2013 Deputy Treasurer |
| Ms. Stagnone also serves as Deputy Treasurer of other funds. Ms. Stagnone is an employee of Fidelity Investments. |
Linda J. Wondrack (1964) |
Year of Election or Appointment: 2014 Chief Compliance Officer |
| Ms. Wondrack also serves as Chief Compliance Officer of other funds. Ms. Wondrack is Executive Vice President and head of the Ethics Office and Asset Management Compliance for Fidelity Investments (2012-present). Ms. Wondrack also serves as Chief Compliance Officer of Fidelity SelectCo, LLC (2014-present); Chief Compliance Officer of Impresa Management LLC (2013-present); and Chief Compliance Officer of FMR Co., Inc., Fidelity Investments Money Management, Inc., Fidelity Management & Research (Japan) Limited, Fidelity Management & Research (U.K.) Inc., Fidelity Management & Research (Hong Kong), Fidelity Management & Research Company, Pyramis Global Advisors, LLC, and Strategic Advisers, Inc., Ballyrock Investment Advisors LLC, and Northern Neck Investors LLC (2012-present). Previously, Ms. Wondrack served as Senior Vice President and Chief Compliance Officer for Columbia Management Investment Advisers, LLC (2005-2012); Chief Compliance Officer for certain funds within the Columbia Family of Funds (2007-2012); and Senior Vice President of Compliance Risk Management at Bank of America (2005-2010). |
Joseph F. Zambello (1957) |
Year of Election or Appointment: 2011 Deputy Treasurer |
| Mr. Zambello also serves as Deputy Treasurer of other funds. Mr. Zambello is an employee of Fidelity Investments. Previously, Mr. Zambello served as Vice President of FMR's Program Management Group (2009-2011) and Vice President of the Transfer Agent Oversight Group (2005-2009). |
Annual Report
The Board of Trustees of Fidelity Emerging Europe, Middle East, Africa (EMEA) Fund voted to pay on December 8, 2014, to shareholders of record at the opening of business on December 5, 2014, a distribution of $0.039 per share derived from capital gains realized from sales of portfolio securities and a dividend of $0.170 per share from net investment income:
Fidelity Emerging Europe, Middle East, Africa (EMEA) Fund designates 100% of the dividends distributed during the fiscal year, as amounts which may be taken into account as a dividend for purposes of the maximum rate under section 1 (h) (11) of the Internal Revenue Code.
The amounts per share which represent income derived from sources within, and taxes paid to, foreign countries or possessions of the United States are as follows:
| Pay Date | Income | Taxes |
Fidelity Emerging Europe,
Middle East, Africa (EMEA) Fund | 12/09/13 | $0.1035 | $0.0491 |
The fund will notify shareholders in January 2015 of amounts for use in preparing 2014 income tax returns.
Annual Report
Board Approval of Investment Advisory Contracts and Management Fees
Fidelity Emerging Europe, Middle East, Africa (EMEA) Fund
Each year, the Board of Trustees, including the Independent Trustees (together, the Board), votes on the renewal of the management contract with Fidelity Management & Research Company (FMR) and the sub-advisory agreements (together, the Advisory Contracts) for the fund. The Board, assisted by the advice of fund counsel and Independent Trustees' counsel, requests and considers a broad range of information relevant to the renewal of the Advisory Contracts throughout the year.
The Board meets regularly and, at each of its meetings, covers an extensive agenda of topics and materials and considers factors that are relevant to its annual consideration of the renewal of the fund's Advisory Contracts, including the services and support provided to the fund and its shareholders. The Board has established various standing committees (Committees), each composed of and chaired by Independent Trustees with varying backgrounds, to which the Board has assigned specific subject matter responsibilities in order to enhance effective decision-making by the Board. The Board, acting directly and through its Committees, requests and receives information concerning the annual consideration of the renewal of the fund's Advisory Contracts. The Board also meets as needed to consider matters specifically related to the Board's annual consideration of the renewal of the Advisory Contracts. Members of the Board may also meet with trustees of other Fidelity funds through ad hoc joint committees to discuss certain matters relevant to the Fidelity funds.
At its July 2014 meeting, the Board, including the Independent Trustees, unanimously determined to renew the fund's Advisory Contracts. In reaching its determination, the Board considered all factors it believed relevant, including (i) the nature, extent, and quality of the services to be provided to the fund and its shareholders (including the investment performance of the fund); (ii) the competitiveness of the fund's management fee and total expense ratio relative to peer funds; (iii) the total costs of the services to be provided by and the profits to be realized by Fidelity from its relationship with the fund; (iv) the extent to which economies of scale exist and would be realized as the fund grows; and (v) whether fee levels reflect these economies of scale, if any, for the benefit of fund shareholders. In connection with separate internal corporate reorganizations involving Fidelity Management & Research (U.K.) Inc. (FMR U.K.) and Fidelity Management & Research (Japan) Inc. (FMR Japan), the Board approved certain non-material amendments to the fund's sub-advisory agreements with FMR U.K. and FMR Japan to reflect that, after these reorganizations, FMR Investment Management (UK) Limited and Fidelity Management & Research (Japan) Limited will carry on the business of FMR U.K. and FMR Japan, respectively. The Board noted that no changes to the portfolio managers or to the foreign research or investment advisory services provided to the fund were expected in connection with either reorganization and that the same personnel and resources would continue to be available to the fund at the new entities.
Annual Report
Board Approval of Investment Advisory Contracts and
Management Fees - continued
In considering whether to renew the Advisory Contracts for the fund, the Board reached a determination, with the assistance of fund counsel and Independent Trustees' counsel and through the exercise of its business judgment, that the renewal of the Advisory Contracts was in the best interests of the fund and its shareholders and that the compensation payable under the Advisory Contracts was fair and reasonable. The Board's decision to renew the Advisory Contracts was not based on any single factor, but rather was based on a comprehensive consideration of all the information provided to the Board at its meetings throughout the year. The Board, in reaching its determination to renew the Advisory Contracts, was aware that shareholders of the fund have a broad range of investment choices available to them, including a wide choice among funds offered by Fidelity's competitors, and that the fund's shareholders, who have the opportunity to review and weigh the disclosure provided by the fund in its prospectus and other public disclosures, have chosen to invest in this fund, which is part of the Fidelity family of funds.
Nature, Extent, and Quality of Services Provided. The Board considered Fidelity's staffing as it relates to the fund, including the backgrounds of investment personnel of FMR and the sub-advisers (together, the Investment Advisers), and also considered the fund's investment objective, strategies, and related investment philosophy. The Independent Trustees also had discussions with senior management of Fidelity's investment operations and investment groups. The Board considered the structure of the portfolio manager compensation program and whether this structure provides appropriate incentives to act in the best interests of the fund. Additionally, the Board considered the portfolio managers' investments, if any, in the funds that they manage.
Resources Dedicated to Investment Management and Support Services. The Board and the Fund Oversight and Research Committees reviewed the general qualifications and capabilities of Fidelity's investment staff, including its size, education, experience, and resources, as well as Fidelity's approach to recruiting, training, managing, and compensating investment personnel. The Board noted that Fidelity has continued to increase the resources devoted to non-U.S. offices, including expansion of Fidelity's global investment organization. The Board also noted that Fidelity's analysts have extensive resources, tools and capabilities that allow them to conduct sophisticated quantitative and fundamental analysis, as well as credit analysis of issuers, counterparties and guarantors. Further, the Board believes that Fidelity's investment professionals have sufficient access to global information and data so as to provide competitive investment results over time, and that those professionals also have access to sophisticated tools that permit them to assess portfolio construction and risk and performance attribution characteristics continuously, as well as to transmit new information and research conclusions rapidly around the world. Additionally, in its deliberations, the Board considered Fidelity's trading and risk management capabilities and resources and global compliance infrastructure, which are an integral part of the investment management process.
Annual Report
Shareholder and Administrative Services. The Board considered (i) the nature, extent, quality, and cost of advisory, administrative, and shareholder services performed by the Investment Advisers and their affiliates under the Advisory Contracts and under separate agreements covering transfer agency, pricing and bookkeeping, and securities lending services for the fund; (ii) the nature and extent of the supervision of third party service providers, principally custodians and subcustodians; and (iii) the resources devoted to, and the record of compliance with, the fund's compliance policies and procedures. The Board also reviewed the allocation of fund brokerage, including allocations to brokers affiliated with the Investment Advisers, the use of brokerage commissions to pay fund expenses, and the use of "soft" commission dollars to pay for research services.
The Board noted that the growth of fund assets over time across the complex allows Fidelity to reinvest in the development of services designed to enhance the value or convenience of the Fidelity funds as investment vehicles. These services include 24-hour access to account information and market information through telephone representatives and over the Internet, investor education materials and asset allocation tools, and the expanded availability of Fidelity Investor Centers.
In 2014, the Board formed an ad hoc Committee on Transfer Agency Fees to review the variety of transfer agency fee structures throughout the industry and Fidelity's competitive positioning with respect to industry participants.
Investment in a Large Fund Family. The Board considered the benefits to shareholders of investing in a Fidelity fund, including the benefits of investing in a fund that is part of a large family of funds offering a variety of investment disciplines and providing a large variety of mutual fund investor services. The Board noted that Fidelity had taken, or had made recommendations that resulted in the Fidelity funds taking, a number of actions over the previous year that benefited particular funds, including (i) continuing to dedicate additional resources to investment research and to the support of the senior management team that oversees asset management; (ii) persisting in efforts to enhance Fidelity's global research capabilities; (iii) launching new funds and making other enhancements to meet client needs for income-oriented solutions; (iv) reducing fund expenses for certain index funds; (v) continuing to launch dedicated lower cost underlying funds to meet portfolio construction needs related to expanding underlying fund options for Fidelity funds of funds, specifically for the Freedom Fund product lines; (vi) rationalizing product lines and gaining increased efficiencies through fund mergers; (vii) launching sector-based exchange-traded funds and establishing a new Fidelity adviser to manage sector-based funds and products; (viii) continuing to develop and implement technology to improve security and increase efficiency; (ix) modifying the eligibility criteria for certain share classes to increase their marketability to a portion of the defined contribution plan market; (x) waiving redemption fees for certain qualified fund-of-fund and wrap programs and certain retirement plan transactions; and (xi) launching new Institutional Class shares of certain money market funds to attract and retain assets and to fill a gap in the money market fund lineup.
Annual Report
Board Approval of Investment Advisory Contracts and
Management Fees - continued
Investment Performance. The Board considered whether the fund has operated in accordance with its investment objective, as well as its record of compliance with its investment restrictions and its performance history.
The Board took into account discussions with the Investment Advisers about fund investment performance that occur at Board meetings throughout the year. In this regard the Board noted that as part of regularly scheduled fund reviews and other reports to the Board on fund performance, the Board periodically considers annualized return information for the fund, for different time periods, measured against a securities market index ("benchmark index") and a peer group of funds with similar objectives ("peer group"). In its evaluation of fund investment performance, the Board gave particular attention to information indicating changes in performance of certain Fidelity funds for specific time periods and the Investment Advisers' explanations for any overperformance or underperformance.
In addition to reviewing absolute and relative fund performance, the Independent Trustees periodically consider the appropriateness of fund performance metrics in evaluating the results achieved. In general, the Independent Trustees believe that fund performance should be evaluated based on net performance (after fees and expenses) of both the highest performing and lowest performing classes, where applicable, compared to appropriate benchmark indices, over appropriate time periods which may include full market cycles, and compared to peer groups, as applicable, over the same periods, taking into account relevant factors including the following: general market conditions; issuer-specific information; tactical opportunities for investment; and fund cash flows and other factors.
The Independent Trustees recognize that shareholders evaluate performance on a net basis over their own holding periods, for which one-, three-, and five-year periods are often used as a proxy. For this reason, the performance information reviewed by the Board also included net cumulative calendar year total return information for the fund and an appropriate benchmark index for the most recent one-, three-, and five-year periods, as shown below. A peer group comparison is not shown below.
Annual Report
Fidelity Emerging Europe, Middle East, Africa (EMEA) Fund

Based on its review, the Board concluded that the nature, extent, and quality of services provided to the fund under the Advisory Contracts should benefit the fund's shareholders.
Competitiveness of Management Fee and Total Expense Ratio. The Board considered the fund's management fee and total expense ratio compared to "mapped groups" of competitive funds and classes. Fidelity creates "mapped groups" by combining similar Lipper investment objective categories that have comparable investment mandates. Combining Lipper investment objective categories aids the Board's management fee and total expense ratio comparisons by broadening the competitive group used for comparison and by reducing the number of universes to which various Fidelity funds are compared.
Management Fee. The Board considered two proprietary management fee comparisons for the 12-month periods shown in the chart below. The group of Lipper funds used by the Board for management fee comparisons is referred to below as the "Total Mapped Group." The Total Mapped Group comparison focuses on a fund's standing in terms of gross management fees before expense reimbursements or caps relative to the total universe of funds with comparable investment mandates, regardless of whether their management fee structures also are comparable. Funds with comparable investment mandates offer exposure to similar types of securities. Funds with comparable management fee structures have similar management fee contractual arrangements (e.g., flat rate charged for advisory services, all-inclusive fee rate, etc.). "TMG %" represents the percentage of funds in the Total Mapped Group that had management fees that were lower than the fund's. For example, a hypothetical TMG % of 20% would mean that 80% of the funds in the Total Mapped Group had higher, and 20% had lower, management fees than the fund. The fund's actual TMG %s are in the chart below. The "Asset-Size Peer Group" (ASPG) comparison focuses on a fund's standing relative to a subset of non-Fidelity funds within the Total Mapped Group that are similar in size and management fee structure. For example, if a fund is in the first quartile of the ASPG, the fund's management fee ranks in the least expensive or lowest 25% of funds in the ASPG. The ASPG represents at least 15% of the funds in the Total Mapped Group with comparable asset size and management fee structures, subject to a minimum of 50 funds (or all funds in the Total Mapped Group if fewer than 50). Additional information, such as the ASPG quartile in which the fund's management fee rate ranked, is also included in the chart and considered by the Board.
Annual Report
Board Approval of Investment Advisory Contracts and
Management Fees - continued
Fidelity Emerging Europe, Middle East, Africa (EMEA) Fund
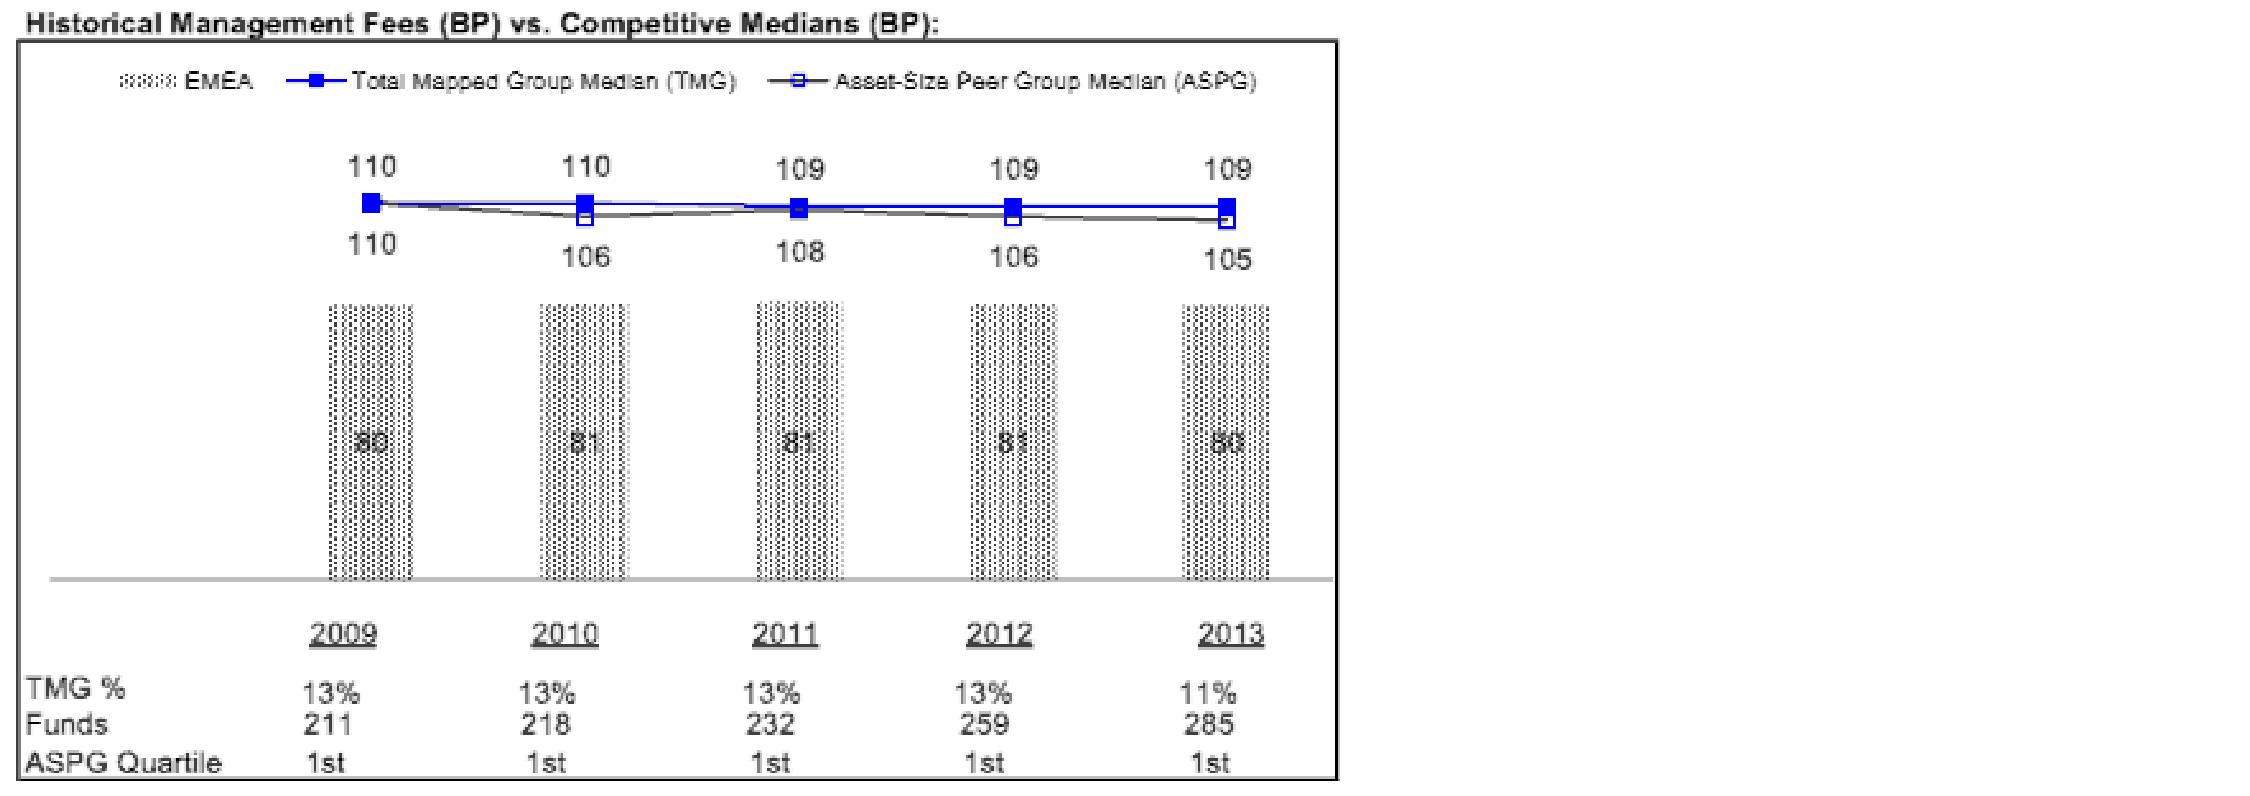
The Board noted that the fund's management fee rate ranked below the median of its Total Mapped Group and below the median of its ASPG for 2013.
The Board also noted that, in August 2013, the ad hoc Committee on Management Fees was formed to conduct an in-depth review of the management fee rates of Fidelity's active equity mutual funds. The Committee focused on the following areas: (i) standard fee structures; (ii) research consumption and trading evolution; (iii) management fee competitiveness/profitability by category; and (iv) factors that drive institutional pricing.
Based on its review, the Board concluded that the fund's management fee is fair and reasonable in light of the services that the fund receives and the other factors considered.
Annual Report
Total Expense Ratio. In its review of each class's total expense ratio, the Board considered the fund's management fee as well as other fund or class expenses, as applicable, such as transfer agent fees, pricing and bookkeeping fees, fund-paid 12b-1 fees, and custodial, legal, and audit fees. The Board also noted the effects of any waivers and reimbursements on fees and expenses. As part of its review, the Board also considered the current and historical total expense ratios of each class of the fund compared to competitive fund median expenses. Each class of the fund is compared to those funds and classes in the Total Mapped Group (used by the Board for management fee comparisons) that have a similar sales load structure.
The Board noted that the total expense ratio of each of Class A, Institutional Class, and the retail class ranked below its competitive median for 2013 and the total expense ratio of each of Class T, Class B, and Class C ranked above its competitive median for 2013. The Board considered that, in general, various factors can affect total expense ratios. The Board noted that the total expense ratio of Class T was above the competitive median primarily because of higher 12b-1 fees on Class T as compared to most competitor funds. Class T has a higher 12b-1 fee, but a lower front-end sales charge, than traditionally priced front-end sales charge classes. The Board considered that Class T is primarily sold load-waived in the retirement plan market where its 0.50% 12b-1 fee is comparable to competing no-load, higher 12b-1 fee classes designed specifically for retirement plans. The Board noted that the fund offers multiple classes, each of which has a different sales load and 12b-1 fee structure, and that the multiple structures are intended to offer a range of pricing options for the intermediary market. The Board also noted that the total expense ratios of the classes vary primarily by the level of their 12b-1 fees, although differences in transfer agent fees may also cause expenses to vary from class to class.
Fees Charged to Other Fidelity Clients. The Board also considered Fidelity fee structures and other information with respect to clients of Fidelity, such as other funds advised or subadvised by Fidelity, pension plan clients, and other institutional clients. The Board noted the findings of the 2013 ad hoc joint committee (created with the board of other Fidelity funds), which reviewed and compared Fidelity's institutional investment advisory business with its business of providing services to the Fidelity funds, including the differences in services provided, fees charged, and costs incurred, as well as competition in their respective marketplaces.
Based on its review of total expense ratios and fees charged to other Fidelity clients, the Board concluded that the total expense ratio of each class of the fund was reasonable, although in some cases above the median of the universe presented for comparison, in light of the services that the fund and its shareholders receive and the other factors considered.
Costs of the Services and Profitability. The Board considered the revenues earned and the expenses incurred by Fidelity in conducting the business of developing, marketing, distributing, managing, administering and servicing the fund and servicing the fund's shareholders. The Board also considered the level of Fidelity's profits in respect of all the Fidelity funds.
Annual Report
Board Approval of Investment Advisory Contracts and
Management Fees - continued
On an annual basis, Fidelity presents to the Board Fidelity's profitability for the fund. Fidelity calculates the profitability for each fund, as well as aggregate profitability for groups of Fidelity funds and all Fidelity funds, using a series of detailed revenue and cost allocation methodologies which originate with the books and records of Fidelity on which Fidelity's audited financial statements are based. The Audit Committee of the Board reviews any significant changes from the prior year's methodologies.
PricewaterhouseCoopers LLP (PwC), independent registered public accounting firm and auditor to Fidelity and certain Fidelity funds, has been engaged annually by the Board as part of the Board's assessment of Fidelity's profitability analysis. PwC's engagement includes the review and assessment of the methodologies used by Fidelity in determining the revenues and expenses attributable to Fidelity's mutual fund business, and completion of agreed-upon procedures in respect of the mathematical accuracy of fund profitability and its conformity to established allocation methodologies. After considering PwC's reports issued under the engagement and information provided by Fidelity, the Board concluded that while other allocation methods may also be reasonable, Fidelity's profitability methodologies are reasonable in all material respects.
The Board also reviewed Fidelity's non-fund businesses and fall-out benefits related to the mutual fund business as well as cases where Fidelity's affiliates may benefit from or be related to the fund's business.
The Board considered the costs of the services provided by and the profits realized by Fidelity in connection with the operation of the fund and was satisfied that the profitability was not excessive in the circumstances.
Economies of Scale. The Board considered whether there have been economies of scale in respect of the management of the Fidelity funds, whether the Fidelity funds (including the fund) have appropriately benefited from any such economies of scale, and whether there is potential for realization of any further economies of scale. The Board considered the extent to which the fund will benefit from economies of scale through increased services to the fund, through waivers or reimbursements, or through fee or expense ratio reductions. The Board also noted that in 2013, it and the boards of other Fidelity funds created an ad hoc committee (the Economies of Scale Committee) to analyze whether Fidelity attains economies of scale in respect of the management and servicing of the Fidelity funds, whether the Fidelity funds have appropriately benefited from such economies of scale, and whether there is potential for realization of any further economies of scale.
Annual Report
The Board recognized that the fund's management contract incorporates a "group fee" structure, which provides for lower group fee rates as total group assets increase, and for higher group fee rates as total group assets decrease (with "group assets" defined to include fund assets under FMR's management plus sector fund assets previously under FMR's management and currently managed by Fidelity SelectCo, LLC). FMR calculates the group fee rates based on a tiered asset "breakpoint" schedule that varies based on asset class. The Board considered that the group fee is designed to deliver the benefits of economies of scale to fund shareholders when total Fidelity fund assets increase, even if assets of any particular fund are unchanged or have declined, because some portion of Fidelity's costs are attributable to services provided to all Fidelity funds, and all funds benefit if those costs can be allocated among more assets. The Board concluded that, given the group fee structure, fund shareholders will benefit from lower management fees as group assets increase at the fund complex level, regardless of whether Fidelity achieves any such economies of scale.
The Board concluded, taking into account the analysis of the Economies of Scale Committee, that economies of scale, if any, are being appropriately shared between fund shareholders and Fidelity.
Additional Information Requested by the Board. In order to develop fully the factual basis for consideration of the Fidelity funds' Advisory Contracts, the Board requested and received additional information on certain topics, including: (i) fund performance trends and Fidelity's long-term strategies for certain funds; (ii) Fidelity's strategic marketing and product lineup goals; (iii) the methodology with respect to competitive fund data and peer group classifications; (iv) the arrangements with, and performance of, certain sub-advisers on behalf of the Fidelity funds, as well as certain proposed participating affiliate arrangements; (v) the realization of fall-out benefits in certain Fidelity business units; (vi) Fidelity's group fee structures, including the rationale for the individual fee rates of certain categories of funds and the definition of group assets; (vii) trends regarding industry use of performance fee structures and the performance adjustment methodologies applicable to the Fidelity funds; (viii) additional competitive analysis regarding the total expenses for certain classes; (ix) fund profitability methodology, including Fidelity's cost allocation methodology, and the impact of certain factors on fund profitability results; and (x) the process by which Fidelity determines sub-advisory fees for funds it advises.
Based on its evaluation of all of the conclusions noted above, and after considering all factors it believed relevant, the Board ultimately concluded that the advisory fee structures are fair and reasonable, and that the fund's Advisory Contracts should be renewed.
Annual Report
Investment Adviser
Fidelity Management &
Research Company
Boston, MA
Investment Sub-Advisers
FMR Co., Inc.
Fidelity Management & Research
(U.K.) Inc.
FIL Investments (Japan) Limited
FIL Investment Advisors
FIL Investment Advisors
(U.K.) Limited
Fidelity Management & Research
(Hong Kong) Limited
Fidelity Management & Research
(Japan) Limited
General Distributor
Fidelity Distributors Corporation
Smithfield, RI
Transfer and Service Agents
Fidelity Investments Institutional
Operations Company, Inc.
Boston, MA
Fidelity Service Company, Inc.
Boston, MA
Custodian
State Street Bank & Trust Company
Quincy, MA
The Fidelity Telephone Connection
Mutual Fund 24-Hour Service
Exchanges/Redemptions
and Account Assistance 1-800-544-6666
Product Information 1-800-544-6666
Retirement Accounts 1-800-544-4774
(8 a.m. - 9 p.m.)
TDD Service 1-800-544-0118
for the deaf and hearing impaired
(9 a.m. - 9 p.m. Eastern time)
Fidelity Automated Service
Telephone (FAST®)
1-800-544-5555
Automated line for quickest service
(Fidelity Investment logo)(registered trademark)
Corporate Headquarters
245 Summer St., Boston, MA 02210
www.fidelity.com
EME-UANN-1214
1.861971.106
(Fidelity Investment logo)(registered trademark)
Fidelity Advisor®
Emerging Markets Discovery
Fund - Class A, Class T,
and Class C
Annual Report
October 31, 2014
(Fidelity Cover Art)
Class A, Class T, and
Class C are classes of
Fidelity® Emerging
Markets Discovery Fund
Contents
Performance | (Click Here) | How the fund has done over time. |
Management's Discussion of Fund Performance | (Click Here) | The Portfolio Managers' review of fund performance and strategy. |
Shareholder Expense Example | (Click Here) | An example of shareholder expenses. |
Investment Changes | (Click Here) | A summary of major shifts in the fund's investments over the past six months. |
Investments | (Click Here) | A complete list of the fund's investments with their market values. |
Financial Statements | (Click Here) | Statements of assets and liabilities, operations, and changes in net assets, as well as financial highlights. |
Notes | (Click Here) | Notes to the financial statements. |
Report of Independent Registered Public Accounting Firm | (Click Here) | |
Trustees and Officers | (Click Here) | |
Distributions | (Click Here) | |
Board Approval of Investment Advisory Contracts and Management Fees | (Click Here) | |
To view a fund's proxy voting guidelines and proxy voting record for the 12-month period ended June 30, visit http://www.fidelity.com/proxyvotingresults or visit the Securities and Exchange Commission's (SEC) web site at http://www.sec.gov. You may also call 1-877-208-0098 to request a free copy of the proxy voting guidelines.
Standard & Poor's, S&P and S&P 500 are registered service marks of The McGraw-Hill Companies, Inc. and have been licensed for use by Fidelity Distributors Corporation.
Other third-party marks appearing herein are the property of their respective owners.
All other marks appearing herein are registered or unregistered trademarks or service marks of FMR LLC or an affiliated company. © 2014 FMR LLC. All rights reserved.
Annual Report
This report and the financial statements contained herein are submitted for the general information of the shareholders of the fund. This report is not authorized for distribution to prospective investors in the fund unless preceded or accompanied by an effective prospectus.
A fund files its complete schedule of portfolio holdings with the SEC for the first and third quarters of each fiscal year on Form N-Q. Forms N-Q are available on the SEC's web site at http://www.sec.gov. A fund's Forms N-Q may be reviewed and copied at the SEC's Public Reference Room in Washington, DC. Information regarding the operation of the SEC's Public Reference Room may be obtained by calling 1-800-SEC-0330. For a complete list of a fund's portfolio holdings, view the most recent holdings listing, semiannual report, or annual report on Fidelity's web site at http://www.fidelity.com, http://www.advisor.fidelity.com, or http://www.401k.com, as applicable.
NOT FDIC INSURED • MAY LOSE VALUE • NO BANK GUARANTEE
Neither the fund nor Fidelity Distributors Corporation is a bank.
Annual Report
Average annual total return reflects the change in the value of an investment, assuming reinvestment of the class' distributions from dividend income and capital gains (the profits earned upon the sale of securities that have grown in value, if any) and assuming a constant rate of performance each year. The $10,000 table and the fund's returns do not reflect the deduction of taxes that a shareholder would pay on fund distributions or the redemption of fund shares. During periods of reimbursement by Fidelity, a fund's total return will be greater than it would be had the reimbursement not occurred. How a fund did yesterday is no guarantee of how it will do tomorrow.
Average Annual Total Returns
Periods ended October 31, 2014 | Past 1
year | Life of
fund A |
Class A (incl. 5.75% sales charge) | -5.46% | 6.44% |
Class T (incl. 3.50% sales charge) | -3.45% | 7.01% |
Class C (incl. contingent deferred sales charge) B | -1.39% | 7.76% |
A From November 1, 2011
B Class C shares' contingent deferred sales charges included in the past one year and life of fund total return figures are 1% and 0%, respectively.
$10,000 Over Life of Fund
Let's say hypothetically that $10,000 was invested in Fidelity Advisor® Emerging Markets Discovery Fund - Class A on November 1, 2011, when the fund started, and the current 5.75% sales charge was paid. The chart shows how the value of your investment would have changed, and also shows how the MSCI Emerging Markets SMID Cap Index performed over the same period.
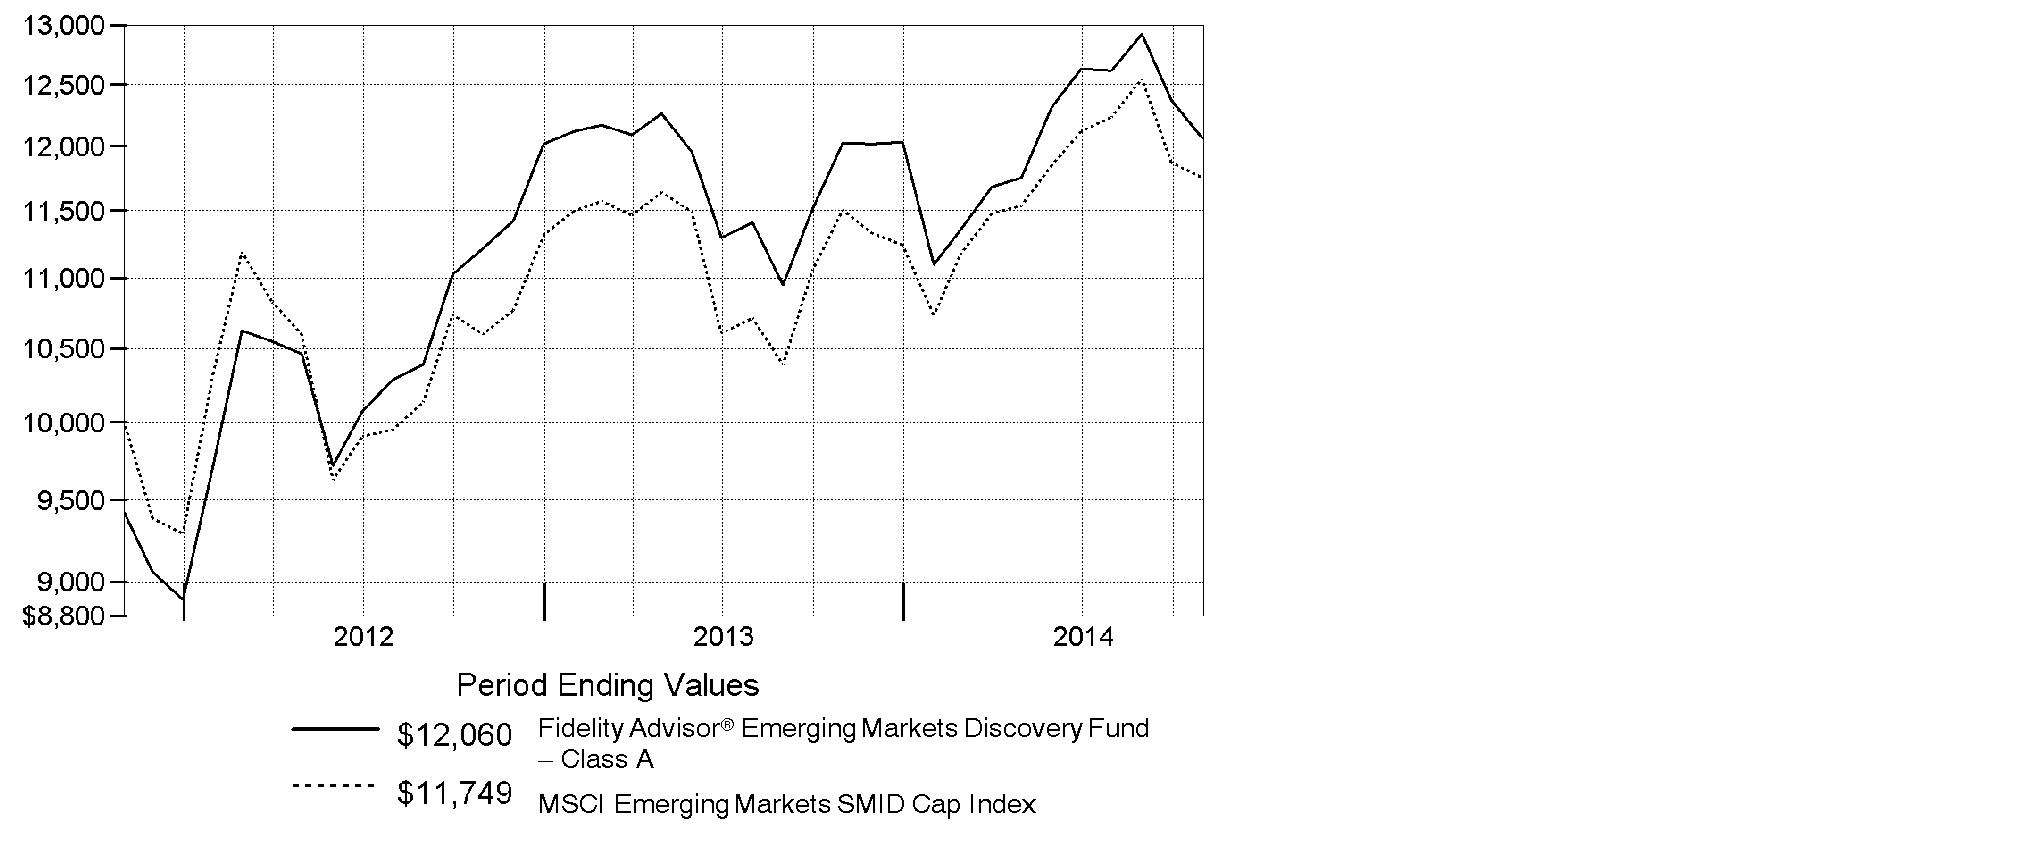
Annual Report
Market Recap: Global equities posted a healthy gain for the 12 months ending October 31, 2014, overcoming an October market decline driven by recessionary pressures in China and tepid growth in Europe. The MSCI ACWI (All Country World Index) Index rose 8.15%, helped by subdued market volatility for much of the period and supported by solid corporate earnings, especially in the United States. Stocks also benefited from easy monetary policies in Japan and the eurozone, as well as increased stimulus efforts in China. All but three of the 24 industry groups that compose the index marked a positive return. The U.S. (+17%) remained a pillar of strength, while a strongly rising dollar in the latter part of the period detracted from investors' returns in most non-U.S. markets. Canada (+5%) notched broad gains outside of its energy and materials sectors, as did Asia-Pacific ex Japan (+4%), led by investor enthusiasm for companies in India. The U.K., Europe and Japan, meanwhile, all underperformed. Among sectors, health care (+24%) led the index, with a strong contribution from the pharmaceuticals, biotechnology & life sciences industry. Information technology (+21%) also outperformed. Conversely, materials (-4%) and energy (-1%) lagged the index due to a higher supply of and lower demand for commodities.
Comments from Samuel Polyak and James Hayes, who became Co-Portfolio Managers of Fidelity Advisor® Emerging Markets Discovery Fund on June 21, 2014, as part of the Fidelity Stock Selector Emerging Markets Group: For the year, the fund's Class A, Class T and Class C shares returned 0.31%, 0.05% and -0.42%, respectively (excluding sales charges), trailing the 2.14% gain of the MSCI Emerging Markets SMID Cap Index. Versus the index, stock selection was particularly challenging in South Korea, Taiwan and China. At the stock level, it hurt to have an average overweighting in South African lender African Bank Investments Limited, which suffered amid ongoing sluggishness in South Africa's credit cycle. We sold the fund's stake during the period. Taiwan-based medical equipment supplier Pacific Hospital Supply was another big relative detractor that we sold from the fund by period end. China-based oil & gas exploration & production firm Hilong Holding hurt the most, as it missed earnings expectations. Stock selection in India by far added the most value, but as a group we reduced the fund's exposure here. A non-index stake in Punjab National Bank was the top individual contributor for the period, and we sold it by period end. Other top contributors that we sold or reduced were India-based credit rating services firm Credit Analysis & Research and KEPCO Plant Services & Engineering, a South Korean company that provides maintenance and operations services for power plants.
The views expressed above reflect those of the portfolio manager(s) only through the end of the period as stated on the cover of this report and do not necessarily represent the views of Fidelity or any other person in the Fidelity organization. Any such views are subject to change at any time based upon market or other conditions and Fidelity disclaims any responsibility to update such views. These views may not be relied on as investment advice and, because investment decisions for a Fidelity fund are based on numerous factors, may not be relied on as an indication of trading intent on behalf of any Fidelity fund.
Annual Report
Fidelity Emerging Markets Discovery Fund
Shareholder Expense Example
As a shareholder of the Fund, you incur two types of costs: (1) transaction costs, including sales charges (loads) on purchase payments or redemption proceeds, redemption fees and (2) ongoing costs, including management fees, distribution and/or service (12b-1) fees and other Fund expenses. This Example is intended to help you understand your ongoing costs (in dollars) of investing in the Fund and to compare these costs with the ongoing costs of investing in other mutual funds.
The Example is based on an investment of $1,000 invested at the beginning of the period and held for the entire period (May 1, 2014 to October 31, 2014).
Actual Expenses
The first line of the accompanying table for each class of the Fund provides information about actual account values and actual expenses. You may use the information in this line, together with the amount you invested, to estimate the expenses that you paid over the period. Simply divide your account value by $1,000.00 (for example, an $8,600 account value divided by $1,000.00 = 8.6), then multiply the result by the number in the first line for a class of the Fund under the heading entitled "Expenses Paid During Period" to estimate the expenses you paid on your account during this period. A small balance maintenance fee of $12.00 that is charged once a year may apply for certain accounts with a value of less than $2,000. This fee is not included in the table below. If it was, the estimate of expenses you paid during the period would be higher, and your ending account value lower, by this amount. In addition, the Fund, as a shareholder in the underlying Fidelity Central Funds, will indirectly bear its pro-rata share of the fees and expenses incurred by the underlying Fidelity Central Funds. These fees and expenses are not included in the Fund's annualized expense ratio used to calculate the expense estimate in the table below.
Hypothetical Example for Comparison Purposes
The second line of the accompanying table for each class of the Fund provides information about hypothetical account values and hypothetical expenses based on a Class' actual expense ratio and an assumed rate of return of 5% per year before expenses, which is not the Class' actual return. The hypothetical account values and expenses may not be used to estimate the actual ending account balance or expenses you paid for the period. You may use this information to compare the ongoing costs of investing in the Fund and other funds. To do so, compare this 5% hypothetical example with the 5% hypothetical examples that appear in the shareholder reports of the other funds. A small balance maintenance fee of $12.00 that is charged once a year may apply for certain accounts with a value of less than $2,000. This fee is not included in the table below. If it was, the estimate of expenses you paid during the period would be higher, and your ending account value lower, by this amount. In addition, the Fund, as a shareholder in the underlying Fidelity Central Funds, will indirectly bear its pro-rata share of the fees and expenses incurred by the underlying Fidelity Central Funds. These fees and expenses are not included in the Fund's annualized expense ratio used to calculate the expense estimate in the table below.
Please note that the expenses shown in the table are meant to highlight your ongoing costs only and do not reflect any transaction costs. Therefore, the second line of the table is useful in comparing ongoing costs only, and will not help you determine the relative total costs of owning different funds. In addition, if these transactional costs were included, your costs would have been higher.
Annual Report
| Annualized
Expense RatioB | Beginning
Account Value
May 1, 2014 | Ending
Account Value
October 31, 2014 | Expenses Paid
During Period*
May 1, 2014
to October 31, 2014 |
Class A | 1.70% | | | |
Actual | | $ 1,000.00 | $ 1,026.10 | $ 8.68 |
HypotheticalA | | $ 1,000.00 | $ 1,016.64 | $ 8.64 |
Class T | 1.95% | | | |
Actual | | $ 1,000.00 | $ 1,024.50 | $ 9.95 |
HypotheticalA | | $ 1,000.00 | $ 1,015.38 | $ 9.91 |
Class C | 2.45% | | | |
Actual | | $ 1,000.00 | $ 1,022.10 | $ 12.49 |
HypotheticalA | | $ 1,000.00 | $ 1,012.85 | $ 12.43 |
Emerging Markets Discovery | 1.45% | | | |
Actual | | $ 1,000.00 | $ 1,027.80 | $ 7.41 |
HypotheticalA | | $ 1,000.00 | $ 1,017.90 | $ 7.38 |
Institutional Class | 1.45% | | | |
Actual | | $ 1,000.00 | $ 1,027.70 | $ 7.41 |
HypotheticalA | | $ 1,000.00 | $ 1,017.90 | $ 7.38 |
A 5% return per year before expenses
B Annualized expense ratio reflects expenses net of applicable fee waivers.
* Expenses are equal to each Class' annualized expense ratio, multiplied by the average account value over the period, multiplied by 184/365 (to reflect the one-half year period).
Annual Report
Fidelity Emerging Markets Discovery Fund
Investment Changes (Unaudited)
Top Five Stocks as of October 31, 2014 |
| % of fund's
net assets | % of fund's net assets
6 months ago |
Quinenco SA (Chile, Industrial Conglomerates) | 2.0 | 1.2 |
Daewoo International Corp. (Korea (South), Trading Companies & Distributors) | 2.0 | 0.0 |
Techtronic Industries Co. Ltd. (Hong Kong, Household Durables) | 1.9 | 0.6 |
Yes Bank Ltd. (India, Banks) | 1.6 | 0.0 |
Robinsons Land Corp. (Philippines, Real Estate Management & Development) | 1.6 | 0.0 |
| 9.1 | |
Top Five Market Sectors as of October 31, 2014 |
| % of fund's
net assets | % of fund's net assets
6 months ago |
Financials | 18.2 | 15.9 |
Industrials | 17.4 | 20.6 |
Consumer Discretionary | 16.9 | 16.8 |
Information Technology | 13.4 | 13.4 |
Materials | 9.8 | 3.1 |
Top Five Countries as of October 31, 2014 |
(excluding cash equivalents) | % of fund's
net assets | % of fund's net assets
6 months ago |
India | 14.9 | 20.3 |
Korea (South) | 14.1 | 14.8 |
Cayman Islands | 14.1 | 10.7 |
Brazil | 7.1 | 2.4 |
Taiwan | 6.4 | 16.6 |
Percentages are adjusted for the effect of open futures contracts, if applicable. |
Asset Allocation (% of fund's net assets) |
As of October 31, 2014 | As of April 30, 2014 |
 | Stocks 94.9% | | | Stocks 97.9% | |
 | Short-Term
Investments and
Net Other Assets (Liabilities) 5.1% | | | Short-Term
Investments and
Net Other Assets (Liabilities) 2.1% | |

Annual Report
Fidelity Emerging Markets Discovery Fund
Investments October 31, 2014
Showing Percentage of Net Assets
Common Stocks - 89.6% |
| Shares | | Value |
Argentina - 0.4% |
Inversiones y Representaciones SA ADR | 26,400 | | $ 388,872 |
Bermuda - 4.6% |
Aquarius Platinum Ltd. (Australia) (a) | 2,369,945 | | 644,999 |
ChipMOS TECHNOLOGIES (Bermuda) Ltd. | 28,000 | | 601,440 |
Shangri-La Asia Ltd. | 660,000 | | 958,323 |
Vtech Holdings Ltd. | 50,100 | | 630,424 |
Yue Yuen Industrial (Holdings) Ltd. | 359,000 | | 1,205,158 |
TOTAL BERMUDA | | 4,040,344 |
Brazil - 2.3% |
Cosan SA Industria e Comercio | 20,900 | | 291,751 |
Localiza Rent A Car SA | 4,500 | | 64,869 |
Mills Estruturas e Servicos de Engenharia SA | 9,900 | | 64,524 |
Minerva SA (a) | 169,400 | | 871,645 |
QGEP Participacoes SA | 18,400 | | 66,905 |
Qualicorp SA (a) | 64,200 | | 652,908 |
TOTAL BRAZIL | | 2,012,602 |
British Virgin Islands - 0.7% |
Luxoft Holding, Inc. (a) | 15,500 | | 619,845 |
Canada - 1.0% |
Pan American Silver Corp. | 53,100 | | 490,113 |
Torex Gold Resources, Inc. (a) | 343,100 | | 365,308 |
TOTAL CANADA | | 855,421 |
Cayman Islands - 14.1% |
58.com, Inc. ADR (d) | 20,100 | | 795,357 |
Anta Sports Products Ltd. | 288,000 | | 565,283 |
China Cord Blood Corp. (a) | 125,200 | | 637,268 |
China Lodging Group Ltd. ADR (a) | 44,200 | | 1,215,058 |
China ZhengTong Auto Services Holdings Ltd. | 1,247,000 | | 706,427 |
Cimc Enric Holdings Ltd. | 714,000 | | 718,002 |
Greatview Aseptic Pack Co. Ltd. | 394,000 | | 259,380 |
Haitian International Holdings Ltd. | 350,000 | | 750,777 |
Hilong Holding Ltd. | 1,463,000 | | 475,375 |
Lee & Man Paper Manufacturing Ltd. | 1,307,000 | | 717,250 |
Lee's Pharmaceutical Holdings Ltd. | 430,500 | | 592,480 |
Leju Holdings Ltd. ADR (d) | 29,800 | | 417,200 |
Pico Far East Holdings Ltd. | 2,778,000 | | 687,969 |
Semiconductor Manufacturing International Corp. (a) | 6,178,000 | | 640,516 |
Silergy Corp. | 56,520 | | 391,373 |
SITC International Holdings Co. Ltd. | 1,888,000 | | 1,005,734 |
Common Stocks - continued |
| Shares | | Value |
Cayman Islands - continued |
Uni-President China Holdings Ltd. | 1,057,000 | | $ 982,132 |
Wisdom Holdings Group | 935,000 | | 723,655 |
TOTAL CAYMAN ISLANDS | | 12,281,236 |
Chile - 4.1% |
Embotelladora Andina SA sponsored ADR | 21,053 | | 391,796 |
Inversiones La Construccion SA | 66,001 | | 940,545 |
Quinenco SA | 852,780 | | 1,771,009 |
Vina Concha y Toro SA | 242,484 | | 463,628 |
TOTAL CHILE | | 3,566,978 |
China - 2.6% |
BBMG Corp. (H Shares) | 1,315,500 | | 930,206 |
China Suntien Green Energy Corp. Ltd. (H Shares) | 890,000 | | 236,386 |
Maanshan Iron & Steel Ltd. (H Shares) (a) | 2,064,000 | | 538,180 |
Tong Ren Tang Technologies Co. Ltd. (H Shares) | 441,000 | | 592,624 |
TOTAL CHINA | | 2,297,396 |
Colombia - 0.5% |
Organizacion Terpel SA (a) | 45,114 | | 393,802 |
Egypt - 0.9% |
Citadel Capital Corp. (a) | 1,411,500 | | 781,748 |
Greece - 0.4% |
Public Power Corp. of Greece (a) | 41,680 | | 316,522 |
Hong Kong - 3.1% |
China Power International Development Ltd. | 568,000 | | 256,578 |
Far East Horizon Ltd. | 834,000 | | 775,668 |
Techtronic Industries Co. Ltd. | 527,500 | | 1,651,393 |
TOTAL HONG KONG | | 2,683,639 |
India - 14.9% |
Adani Ports & Special Economic Zone | 146,053 | | 678,875 |
CMC Ltd. | 27,927 | | 893,604 |
Exide Industries Ltd. | 370,061 | | 948,772 |
GAIL India Ltd. | 64,387 | | 553,403 |
Grasim Industries Ltd. | 15,189 | | 911,465 |
Havells India Ltd. | 181,890 | | 845,935 |
IDFC Ltd. (a) | 199,271 | | 518,543 |
Iifl Holdings Ltd. | 239,330 | | 666,664 |
Ipca Laboratories Ltd. | 49,210 | | 587,543 |
JK Cement Ltd. | 57,507 | | 564,863 |
KPIT Cummins Infosystems Ltd. (a) | 230,698 | | 623,144 |
Common Stocks - continued |
| Shares | | Value |
India - continued |
Lupin Ltd. | 29,712 | | $ 687,933 |
Mahindra Lifespace Developers Ltd. | 75,033 | | 623,350 |
MindTree Consulting Ltd. | 22,113 | | 393,741 |
Shriram Transport Finance Co. Ltd. | 36,068 | | 557,960 |
Tech Mahindra Ltd. | 23,911 | | 980,154 |
The Jammu & Kashmir Bank Ltd. | 237,424 | | 537,872 |
Yes Bank Ltd. | 126,518 | | 1,432,651 |
TOTAL INDIA | | 13,006,472 |
Israel - 1.2% |
Bezeq The Israel Telecommunication Corp. Ltd. | 334,300 | | 565,164 |
NICE Systems Ltd. sponsored ADR | 12,800 | | 520,704 |
TOTAL ISRAEL | | 1,085,868 |
Korea (South) - 13.6% |
AMOREPACIFIC Group, Inc. | 860 | | 946,889 |
Binggrea Co. Ltd. | 5,675 | | 436,805 |
Daewoo International Corp. | 54,893 | | 1,729,384 |
DGB Financial Group Co. Ltd. | 73,881 | | 1,048,621 |
E-Mart Co. Ltd. | 3,822 | | 704,323 |
Fila Korea Ltd. | 11,372 | | 1,180,124 |
Hyundai HCN | 91,864 | | 388,593 |
Hyundai Industrial Development & Construction Co. | 27,329 | | 1,026,321 |
Hyundai Wia Corp. | 4,303 | | 738,896 |
KEPCO Plant Service & Engineering Co. Ltd. | 9,301 | | 759,181 |
Kolon Life Science, Inc. | 9,808 | | 469,201 |
Korean Reinsurance Co. | 110,469 | | 1,172,090 |
Leeno Industrial, Inc. | 18,227 | | 721,823 |
Sungshin Cement Manufacturing Co. Ltd. (a) | 69,388 | | 530,204 |
TOTAL KOREA (SOUTH) | | 11,852,455 |
Malaysia - 0.7% |
Top Glove Corp. Bhd | 409,700 | | 609,287 |
Mexico - 5.1% |
Credito Real S.A.B. de CV | 248,500 | | 638,862 |
Grupo Aeroportuario del Pacifico SA de CV Series B | 73,900 | | 502,792 |
Grupo Aeroportuario Norte S.A.B. de CV | 100,300 | | 499,703 |
Grupo Comercial Chedraui S.A.B. de CV | 158,800 | | 558,608 |
Macquarie Mexican (REIT) | 452,700 | | 822,281 |
Megacable Holdings S.A.B. de CV unit | 180,400 | | 826,427 |
Qualitas Controladora S.A.B. de CV | 238,700 | | 617,389 |
TOTAL MEXICO | | 4,466,062 |
Common Stocks - continued |
| Shares | | Value |
Nigeria - 1.6% |
Transnational Corp. of Nigeria PLC | 18,107,275 | | $ 441,614 |
Zenith Bank PLC | 7,682,382 | | 983,196 |
TOTAL NIGERIA | | 1,424,810 |
Panama - 0.5% |
Copa Holdings SA Class A | 3,600 | | 420,912 |
Philippines - 4.0% |
Alliance Global Group, Inc. | 1,642,600 | | 923,896 |
LT Group, Inc. | 2,559,600 | | 810,291 |
PNOC Energy Development Corp. | 2,149,700 | | 368,042 |
Robinsons Land Corp. | 2,454,500 | | 1,340,007 |
TOTAL PHILIPPINES | | 3,442,236 |
Poland - 1.3% |
Cyfrowy Polsat SA | 144,100 | | 1,102,145 |
Singapore - 0.5% |
First Resources Ltd. | 272,000 | | 440,663 |
South Africa - 1.1% |
Alexander Forbes Group Holding (a) | 529,819 | | 413,105 |
Blue Label Telecoms Ltd. | 572,100 | | 505,721 |
TOTAL SOUTH AFRICA | | 918,826 |
Sri Lanka - 0.9% |
John Keells Holdings Ltd. | 378,368 | | 744,150 |
Taiwan - 6.4% |
ASPEED Tech, Inc. | 5,902 | | 45,049 |
Chicony Electronics Co. Ltd. | 207,120 | | 595,521 |
Chroma ATE, Inc. | 359,000 | | 894,105 |
Cleanaway Co. Ltd. | 123,000 | | 545,948 |
Cub Elecparts, Inc. | 57,000 | | 600,398 |
EPISTAR Corp. | 216,000 | | 389,985 |
Everlight Electronics Co. Ltd. | 208,000 | | 394,031 |
GeoVision, Inc. | 8,300 | | 30,142 |
Lextar Electronics Corp. | 361,000 | | 300,830 |
MJC Probe, Inc. | 172,000 | | 513,350 |
St.Shine Optical Co. Ltd. | 31,000 | | 543,757 |
Taiwan Fertilizer Co. Ltd. | 3,000 | | 5,314 |
Universal Cement Corp. | 125,000 | | 109,865 |
Voltronic Power Technology Corp. | 69,000 | | 556,366 |
TOTAL TAIWAN | | 5,524,661 |
Common Stocks - continued |
| Shares | | Value |
Thailand - 0.6% |
Thai Union Frozen Products PCL (For. Reg.) | 232,400 | | $ 531,392 |
Turkey - 1.8% |
Aksa Akrilik Kimya Sanayii | 176,518 | | 580,544 |
Aselsan A/S | 30,000 | | 136,324 |
Aygaz A/S | 77,000 | | 324,608 |
Tupras Turkiye Petrol Rafinelleri A/S | 24,000 | | 521,000 |
TOTAL TURKEY | | 1,562,476 |
Uganda - 0.5% |
Umeme Ltd. | 2,130,383 | | 401,662 |
Vietnam - 0.2% |
FTP Corp. | 67,000 | | 160,573 |
TOTAL COMMON STOCKS (Cost $76,358,182) |
77,933,055
|
Nonconvertible Preferred Stocks - 5.3% |
| | | |
Brazil - 4.8% |
Banco do Estado Rio Grande do Sul SA | 151,800 | | 906,671 |
Bradespar SA (PN) | 108,900 | | 735,698 |
Braskem SA (PN-A) | 140,700 | | 1,029,457 |
Marcopolo SA (PN) | 425,700 | | 728,426 |
Metalurgica Gerdau SA (PN) | 150,300 | | 812,793 |
TOTAL BRAZIL | | 4,213,045 |
Korea (South) - 0.5% |
Samsung Fire & Marine Insurance Co. Ltd. | 2,451 | | 461,938 |
TOTAL NONCONVERTIBLE PREFERRED STOCKS (Cost $4,838,768) |
4,674,983
|
Money Market Funds - 7.3% |
| Shares | | Value |
Fidelity Cash Central Fund, 0.11% (b) | 5,332,684 | | $ 5,332,684 |
Fidelity Securities Lending Cash Central Fund, 0.11% (b)(c) | 1,002,600 | | 1,002,600 |
TOTAL MONEY MARKET FUNDS (Cost $6,335,284) |
6,335,284
|
TOTAL INVESTMENT PORTFOLIO - 102.2% (Cost $87,532,234) | | 88,943,322 |
NET OTHER ASSETS (LIABILITIES) - (2.2)% | | (1,942,286) |
NET ASSETS - 100% | $ 87,001,036 |
Legend |
(a) Non-income producing |
(b) Affiliated fund that is generally available only to investment companies and other accounts managed by Fidelity Investments. The rate quoted is the annualized seven-day yield of the fund at period end. A complete unaudited listing of the fund's holdings as of its most recent quarter end is available upon request. In addition, each Fidelity Central Fund's financial statements, which are not covered by the Fund's Report of Independent Registered Public Accounting Firm, are available on the SEC's website or upon request. |
(c) Investment made with cash collateral received from securities on loan. |
(d) Security or a portion of the security is on loan at period end. |
Affiliated Central Funds |
Information regarding fiscal year to date income earned by the Fund from investments in Fidelity Central Funds is as follows: |
Fund | Income earned |
Fidelity Cash Central Fund | $ 2,220 |
Fidelity Securities Lending Cash Central Fund | 22,418 |
Total | $ 24,638 |
Other Information |
Categorizations in the Schedule of Investments are based on country or territory of incorporation. |
The following is a summary of the inputs used, as of October 31, 2014, involving the Fund's assets and liabilities carried at fair value. The inputs or methodology used for valuing securities may not be an indication of the risk associated with investing in those securities. For more information on valuation inputs, and their aggregation into the levels used in the table below, please refer to the Investment Valuation section in the accompanying Notes to Financial Statements. |
Valuation Inputs at Reporting Date: |
Description | Total | Level 1 | Level 2 | Level 3 |
Investments in Securities: | | | | |
Equities: | | | | |
Consumer Discretionary | $ 14,472,967 | $ 6,425,589 | $ 8,047,378 | $ - |
Consumer Staples | 7,138,172 | 4,373,694 | 2,764,478 | - |
Energy | 1,591,417 | 879,656 | 711,761 | - |
Financials | 16,069,647 | 9,616,932 | 6,452,715 | - |
Health Care | 5,373,001 | 1,759,377 | 3,613,624 | - |
Industrials | 14,978,849 | 8,953,316 | 6,025,533 | - |
Information Technology | 11,552,911 | 3,836,942 | 7,715,969 | - |
Materials | 8,645,095 | 3,963,573 | 4,681,522 | - |
Telecommunication Services | 565,164 | 565,164 | - | - |
Utilities | 2,220,815 | 1,042,792 | 1,178,023 | - |
Money Market Funds | 6,335,284 | 6,335,284 | - | - |
Total Investments in Securities: | $ 88,943,322 | $ 47,752,319 | $ 41,191,003 | $ - |
The following is a summary of transfers between Level 1 and Level 2 for the period ended October 31, 2014. Transfers are assumed to have occurred at the beginning of the period, and are primarily attributable to the valuation techniques used for foreign equity securities, as discussed in the accompanying Notes to Financial Statements: |
Transfers | Total |
Level 1 to Level 2 | $ 10,239,253 |
Level 2 to Level 1 | $ 0 |
See accompanying notes which are an integral part of the financial statements.
Annual Report
Fidelity Emerging Markets Discovery Fund
Statement of Assets and Liabilities
| October 31, 2014 |
| | |
Assets | | |
Investment in securities, at value (including securities loaned of $1,014,000) - See accompanying schedule: Unaffiliated issuers (cost $81,196,950) | $ 82,608,038 | |
Fidelity Central Funds (cost $6,335,284) | 6,335,284 | |
Total Investments (cost $87,532,234) | | $ 88,943,322 |
Foreign currency held at value (cost $379,716) | | 380,018 |
Receivable for investments sold | | 2,029,733 |
Receivable for fund shares sold | | 98,495 |
Dividends receivable | | 95,704 |
Distributions receivable from Fidelity Central Funds | | 1,203 |
Prepaid expenses | | 349 |
Receivable from investment adviser for expense reductions | | 17,421 |
Other receivables | | 7,744 |
Total assets | | 91,573,989 |
| | |
Liabilities | | |
Payable to custodian bank | $ 249,833 | |
Payable for investments purchased | 2,581,166 | |
Payable for fund shares redeemed | 267,767 | |
Accrued management fee | 62,215 | |
Distribution and service plan fees payable | 3,392 | |
Other affiliated payables | 20,166 | |
Other payables and accrued expenses | 385,814 | |
Collateral on securities loaned, at value | 1,002,600 | |
Total liabilities | | 4,572,953 |
| | |
Net Assets | | $ 87,001,036 |
Net Assets consist of: | | |
Paid in capital | | $ 86,500,569 |
Undistributed net investment income | | 174 |
Accumulated undistributed net realized gain (loss) on investments and foreign currency transactions | | (616,536) |
Net unrealized appreciation (depreciation) on investments and assets and liabilities in foreign currencies | | 1,116,829 |
Net Assets | | $ 87,001,036 |
See accompanying notes which are an integral part of the financial statements.
Annual Report
Statement of Assets and Liabilities - continued
| October 31, 2014 |
| | |
Calculation of Maximum Offering Price Class A:
Net Asset Value and redemption price per share ($4,361,655 ÷ 358,373 shares) | | $ 12.17 |
| | |
Maximum offering price per share (100/94.25 of $12.17) | | $ 12.91 |
Class T:
Net Asset Value and redemption price per share ($2,031,326 ÷ 167,417 shares) | | $ 12.13 |
| | |
Maximum offering price per share (100/96.50 of $12.13) | | $ 12.57 |
Class C:
Net Asset Value and offering price per share ($1,750,148 ÷ 145,834 shares)A | | $ 12.00 |
| | |
Emerging Markets Discovery:
Net Asset Value, offering price and redemption price per share ($78,377,207 ÷ 6,418,342 shares) | | $ 12.21 |
| | |
Institutional Class:
Net Asset Value, offering price and redemption price per share ($480,700 ÷ 39,252 shares) | | $ 12.25 |
A Redemption price per share is equal to net asset value less any applicable contingent deferred sales charge.
See accompanying notes which are an integral part of the financial statements.
Annual Report
Fidelity Emerging Markets Discovery Fund
Financial Statements - continued
Statement of Operations
| Year ended October 31, 2014 |
| | |
Investment Income | | |
Dividends | | $ 1,943,273 |
Income from Fidelity Central Funds | | 24,638 |
Income before foreign taxes withheld | | 1,967,911 |
Less foreign taxes withheld | | (149,221) |
Total income | | 1,818,690 |
| | |
Expenses | | |
Management fee | $ 778,418 | |
Transfer agent fees | 203,003 | |
Distribution and service plan fees | 41,075 | |
Accounting and security lending fees | 47,524 | |
Custodian fees and expenses | 164,899 | |
Independent trustees' compensation | 381 | |
Registration fees | 65,316 | |
Audit | 88,577 | |
Legal | 349 | |
Interest | 79 | |
Miscellaneous | 16,702 | |
Total expenses before reductions | 1,406,323 | |
Expense reductions | (39,275) | 1,367,048 |
Net investment income (loss) | | 451,642 |
Realized and Unrealized Gain (Loss) Net realized gain (loss) on: | | |
Investment securities: | | |
Unaffiliated issuers (net of foreign taxes of $963,357) | (205,589) | |
Foreign currency transactions | (44,609) | |
Total net realized gain (loss) | | (250,198) |
Change in net unrealized appreciation (depreciation) on: Investment securities (net of increase in deferred foreign taxes of $59,002) | (686,710) | |
Assets and liabilities in foreign currencies | (15,113) | |
Total change in net unrealized appreciation (depreciation) | | (701,823) |
Net gain (loss) | | (952,021) |
Net increase (decrease) in net assets resulting from operations | | $ (500,379) |
See accompanying notes which are an integral part of the financial statements.
Annual Report
Statement of Changes in Net Assets
| Year ended
October 31,
2014 | Year ended
October 31,
2013 |
Increase (Decrease) in Net Assets | | |
Operations | | |
Net investment income (loss) | $ 451,642 | $ 931,481 |
Net realized gain (loss) | (250,198) | 2,316,300 |
Change in net unrealized appreciation (depreciation) | (701,823) | (864,876) |
Net increase (decrease) in net assets resulting
from operations | (500,379) | 2,382,905 |
Distributions to shareholders from net investment income | (676,480) | (286,293) |
Distributions to shareholders from net realized gain | (2,520,609) | (914,866) |
Total distributions | (3,197,089) | (1,201,159) |
Share transactions - net increase (decrease) | (16,216,808) | 59,689,170 |
Redemption fees | 46,780 | 191,734 |
Total increase (decrease) in net assets | (19,867,496) | 61,062,650 |
| | |
Net Assets | | |
Beginning of period | 106,868,532 | 45,805,882 |
End of period (including undistributed net investment income of $174 and undistributed net investment income of $648,420, respectively) | $ 87,001,036 | $ 106,868,532 |
See accompanying notes which are an integral part of the financial statements.
Annual Report
Financial Highlights - Class A
Years ended October 31, | 2014 | 2013 | 2012 F |
Selected Per-Share Data | | | |
Net asset value, beginning of period | $ 12.49 | $ 11.89 | $ 10.00 |
Income from Investment Operations | | | |
Net investment income (loss) C | .04 | .08 | .12 |
Net realized and unrealized gain (loss) | (.01) | .75 | 1.76 |
Total from investment operations | .03 | .83 | 1.88 |
Distributions from net investment income | (.06) | (.04) | (.01) |
Distributions from net realized gain | (.30) | (.20) | - |
Total distributions | (.36) | (.25) H | (.01) |
Redemption fees added to paid in capital C | .01 | .02 | .02 |
Net asset value, end of period | $ 12.17 | $ 12.49 | $ 11.89 |
Total ReturnA, B | .31% | 7.20% | 19.00% |
Ratios to Average Net Assets D, G | | | |
Expenses before reductions | 1.82% | 1.87% | 3.49% |
Expenses net of fee waivers, if any | 1.70% | 1.70% | 1.70% |
Expenses net of all reductions | 1.70% | 1.64% | 1.64% |
Net investment income (loss) | .29% | .62% | 1.16% |
Supplemental Data | | | |
Net assets, end of period (000 omitted) | $ 4,362 | $ 5,065 | $ 1,671 |
Portfolio turnover rate E | 148% | 179% | 83% |
A Total returns would have been lower if certain expenses had not been reduced during the applicable periods shown.
B Total returns do not include the effect of the sales charges.
C Calculated based on average shares outstanding during the period.
D Fees and expenses of any underlying Fidelity Central Funds are not included in the Fund's expense ratio. The Fund indirectly bears its proportionate share of the expenses of any underlying Fidelity Central Funds.
E Amount does not include the portfolio activity of any underlying Fidelity Central Funds.
F For the period November 1, 2011 (commencement of operations) to October 31, 2012.
G Expense ratios reflect operating expenses of the class. Expenses before reductions do not reflect amounts reimbursed by the investment adviser or reductions from brokerage service arrangements or reductions from other expense offset arrangements and do not represent the amount paid by the class during periods when reimbursements or reductions occur. Expense ratios before reductions for start-up periods may not be representative of longer-term operating periods. Expenses net of fee waivers reflect expenses after reimbursement by the investment adviser but prior to reductions from brokerage service arrangements or other expense offset arrangements. Expenses net of all reductions represent the net expenses paid by the class.
H Total distributions of $.25 per share is comprised of distributions from net investment income of $.044 and distributions from net realized gain of $.203 per share.
See accompanying notes which are an integral part of the financial statements.
Annual Report
Financial Highlights - Class T
Years ended October 31, | 2014 | 2013 | 2012 F |
Selected Per-Share Data | | | |
Net asset value, beginning of period | $ 12.44 | $ 11.87 | $ 10.00 |
Income from Investment Operations | | | |
Net investment income (loss) C | - H | .05 | .10 |
Net realized and unrealized gain (loss) | - H | .74 | 1.75 |
Total from investment operations | - H | .79 | 1.85 |
Distributions from net investment income | (.02) | (.03) | - H |
Distributions from net realized gain | (.30) | (.20) | - |
Total distributions | (.32) | (.24) I | - H |
Redemption fees added to paid in capital C | .01 | .02 | .02 |
Net asset value, end of period | $ 12.13 | $ 12.44 | $ 11.87 |
Total ReturnA, B | .05% | 6.87% | 18.75% |
Ratios to Average Net Assets D, G | | | |
Expenses before reductions | 2.10% | 2.19% | 3.77% |
Expenses net of fee waivers, if any | 1.95% | 1.95% | 1.95% |
Expenses net of all reductions | 1.95% | 1.89% | 1.89% |
Net investment income (loss) | .04% | .37% | .91% |
Supplemental Data | | | |
Net assets, end of period (000 omitted) | $ 2,031 | $ 1,914 | $ 1,700 |
Portfolio turnover rateE | 148% | 179% | 83% |
A Total returns would have been lower if certain expenses had not been reduced during the applicable periods shown.
B Total returns do not include the effect of the sales charges.
C Calculated based on average shares outstanding during the period.
D Fees and expenses of any underlying Fidelity Central Funds are not included in the Fund's expense ratio. The Fund indirectly bears its proportionate share of the expenses of any underlying Fidelity Central Funds.
E Amount does not include the portfolio activity of any underlying Fidelity Central Funds.
F For the period November 1, 2011 (commencement of operations) to October 31, 2012.
G Expense ratios reflect operating expenses of the class. Expenses before reductions do not reflect amounts reimbursed by the investment adviser or reductions from brokerage service arrangements or reductions from other expense offset arrangements and do not represent the amount paid by the class during periods when reimbursements or reductions occur. Expense ratios before reductions for start-up periods may not be representative of longer-term operating periods. Expenses net of fee waivers reflect expenses after reimbursement by the investment adviser but prior to reductions from brokerage service arrangements or other expense offset arrangements. Expenses net of all reductions represent the net expenses paid by the class.
H Amount represents less than $.01 per share.
I Total distributions of $.24 per share is comprised of distributions from net investment income of $.034 and distributions from net realized gain of $.203 per share.
See accompanying notes which are an integral part of the financial statements.
Annual Report
Financial Highlights - Class C
Years ended October 31, | 2014 | 2013 | 2012 F |
Selected Per-Share Data | | | |
Net asset value, beginning of period | $ 12.35 | $ 11.82 | $ 10.00 |
Income from Investment Operations | | | |
Net investment income (loss) C | (.06) | (.02) | .04 |
Net realized and unrealized gain (loss) | - H | .74 | 1.76 |
Total from investment operations | (.06) | .72 | 1.80 |
Distributions from net investment income | - | (.01) | - |
Distributions from net realized gain | (.30) | (.20) | - |
Total distributions | (.30) | (.21) | - |
Redemption fees added to paid in capital C | .01 | .02 | .02 |
Net asset value, end of period | $ 12.00 | $ 12.35 | $ 11.82 |
Total ReturnA, B | (.42)% | 6.32% | 18.20% |
Ratios to Average Net Assets D, G | | | |
Expenses before reductions | 2.58% | 2.70% | 4.32% |
Expenses net of fee waivers, if any | 2.45% | 2.45% | 2.45% |
Expenses net of all reductions | 2.45% | 2.39% | 2.39% |
Net investment income (loss) | (.46)% | (.13)% | .41% |
Supplemental Data | | | |
Net assets, end of period (000 omitted) | $ 1,750 | $ 2,082 | $ 1,474 |
Portfolio turnover rateE | 148% | 179% | 83% |
A Total returns would have been lower if certain expenses had not been reduced during the applicable periods shown.
B Total returns do not include the effect of the contingent deferred sales charge.
C Calculated based on average shares outstanding during the period.
D Fees and expenses of any underlying Fidelity Central Funds are not included in the Fund's expense ratio. The Fund indirectly bears its proportionate share of the expenses of any underlying Fidelity Central Funds.
E Amount does not include the portfolio activity of any underlying Fidelity Central Funds.
F For the period November 1, 2011 (commencement of operations) to October 31, 2012.
G Expense ratios reflect operating expenses of the class. Expenses before reductions do not reflect amounts reimbursed by the investment adviser or reductions from brokerage service arrangements or reductions from other expense offset arrangements and do not represent the amount paid by the class during periods when reimbursements or reductions occur. Expense ratios before reductions for start-up periods may not be representative of longer-term operating periods. Expenses net of fee waivers reflect expenses after reimbursement by the investment adviser but prior to reductions from brokerage service arrangements or other expense offset arrangements. Expenses net of all reductions represent the net expenses paid by the class.
H Amount represents less than $.01 per share.
See accompanying notes which are an integral part of the financial statements.
Annual Report
Financial Highlights - Emerging Markets Discovery
Years ended October 31, | 2014 | 2013 | 2012 E |
Selected Per-Share Data | | | |
Net asset value, beginning of period | $ 12.52 | $ 11.92 | $ 10.00 |
Income from Investment Operations | | | |
Net investment income (loss) B | .07 | .11 | .15 |
Net realized and unrealized gain (loss) | - G | .74 | 1.76 |
Total from investment operations | .07 | .85 | 1.91 |
Distributions from net investment income | (.09) | (.07) | (.01) |
Distributions from net realized gain | (.30) | (.20) | - |
Total distributions | (.39) | (.27) | (.01) |
Redemption fees added to paid in capital B | .01 | .02 | .02 |
Net asset value, end of period | $ 12.21 | $ 12.52 | $ 11.92 |
Total ReturnA | .61% | 7.37% | 19.35% |
Ratios to Average Net Assets C, F | | | |
Expenses before reductions | 1.48% | 1.57% | 3.02% |
Expenses net of fee waivers, if any | 1.45% | 1.45% | 1.45% |
Expenses net of all reductions | 1.45% | 1.39% | 1.39% |
Net investment income (loss) | .54% | .87% | 1.41% |
Supplemental Data | | | |
Net assets, end of period (000 omitted) | $ 78,377 | $ 96,731 | $ 39,135 |
Portfolio turnover rateD | 148% | 179% | 83% |
A Total returns would have been lower if certain expenses had not been reduced during the applicable periods shown.
B Calculated based on average shares outstanding during the period.
C Fees and expenses of any underlying Fidelity Central Funds are not included in the Fund's expense ratio. The Fund indirectly bears its proportionate share of the expenses of any underlying Fidelity Central Funds.
D Amount does not include the portfolio activity of any underlying Fidelity Central Funds.
E For the period November 1, 2011 (commencement of operations) to October 31, 2012.
F Expense ratios reflect operating expenses of the class. Expenses before reductions do not reflect amounts reimbursed by the investment adviser or reductions from brokerage service arrangements or reductions from other expense offset arrangements and do not represent the amount paid by the class during periods when reimbursements or reductions occur. Expense ratios before reductions for start-up periods may not be representative of longer-term operating periods. Expenses net of fee waivers reflect expenses after reimbursement by the investment adviser but prior to reductions from brokerage service arrangements or other expense offset arrangements. Expenses net of all reductions represent the net expenses paid by the class.
G Amount represents less than $.01 per share.
See accompanying notes which are an integral part of the financial statements.
Annual Report
Financial Highlights - Institutional Class
Years ended October 31, | 2014 | 2013 | 2012 E |
Selected Per-Share Data | | | |
Net asset value, beginning of period | $ 12.53 | $ 11.92 | $ 10.00 |
Income from Investment Operations | | | |
Net investment income (loss) B | .07 | .11 | .15 |
Net realized and unrealized gain (loss) | - G | .75 | 1.76 |
Total from investment operations | .07 | .86 | 1.91 |
Distributions from net investment income | (.06) | (.07) | (.01) |
Distributions from net realized gain | (.30) | (.20) | - |
Total distributions | (.36) | (.27) | (.01) |
Redemption fees added to paid in capital B | .01 | .02 | .02 |
Net asset value, end of period | $ 12.25 | $ 12.53 | $ 11.92 |
Total ReturnA | .61% | 7.45% | 19.35% |
Ratios to Average Net Assets C, F | | | |
Expenses before reductions | 1.56% | 1.60% | 3.21% |
Expenses net of fee waivers, if any | 1.45% | 1.45% | 1.45% |
Expenses net of all reductions | 1.45% | 1.39% | 1.39% |
Net investment income (loss) | .54% | .87% | 1.41% |
Supplemental Data | | | |
Net assets, end of period (000 omitted) | $ 481 | $ 1,076 | $ 1,825 |
Portfolio turnover rateD | 148% | 179% | 83% |
A Total returns would have been lower if certain expenses had not been reduced during the applicable periods shown.
B Calculated based on average shares outstanding during the period.
C Fees and expenses of any underlying Fidelity Central Funds are not included in the Fund's expense ratio. The Fund indirectly bears its proportionate share of the expenses of any underlying Fidelity Central Funds.
D Amount does not include the portfolio activity of any underlying Fidelity Central Funds.
E For the period November 1, 2011 (commencement of operations) to October 31, 2012.
F Expense ratios reflect operating expenses of the class. Expenses before reductions do not reflect amounts reimbursed by the investment adviser or reductions from brokerage service arrangements or reductions from other expense offset arrangements and do not represent the amount paid by the class during periods when reimbursements or reductions occur. Expense ratios before reductions for start-up periods may not be representative of longer-term operating periods. Expenses net of fee waivers reflect expenses after reimbursement by the investment adviser but prior to reductions from brokerage service arrangements or other expense offset arrangements. Expenses net of all reductions represent the net expenses paid by the class.
G Amount represents less than $.01 per share.
See accompanying notes which are an integral part of the financial statements.
Annual Report
Notes to Financial Statements
For the period ended October 31, 2014
1. Organization.
Fidelity Emerging Markets Discovery Fund (the Fund) is a non-diversified fund of Fidelity Investment Trust (the Trust) and is authorized to issue an unlimited number of shares. The Trust is registered under the Investment Company Act of 1940, as amended (the 1940 Act), as an open-end management investment company organized as a Massachusetts business trust. The Fund offers Class A, Class T, Class C, Emerging Markets Discovery and Institutional Class shares, each of which has equal rights as to assets and voting privileges. Each class has exclusive voting rights with respect to matters that affect that class. The Fund's investments in emerging markets can be subject to social, economic, regulatory, and political uncertainties and can be extremely volatile.
2. Investments in Fidelity Central Funds.
The Fund invests in Fidelity Central Funds, which are open-end investment companies generally available only to other investment companies and accounts managed by the investment adviser and its affiliates. The Fund's Schedule of Investments lists each of the Fidelity Central Funds held as of period end, if any, as an investment of the Fund, but does not include the underlying holdings of each Fidelity Central Fund. As an Investing Fund, the Fund indirectly bears its proportionate share of the expenses of the underlying Fidelity Central Funds.
The Money Market Central Funds seek preservation of capital and current income and are managed by Fidelity Investments Money Management, Inc. (FIMM), an affiliate of the investment adviser. Annualized expenses of the Money Market Central Funds as of their most recent shareholder report date are less than .01%.
A complete unaudited list of holdings for each Fidelity Central Fund is available upon request or at the Securities and Exchange Commission (the SEC) website at www.sec.gov. In addition, the financial statements of the Fidelity Central Funds, which are not covered by the Fund's Report of Independent Registered Public Accounting Firm, are available on the SEC website or upon request.
3. Significant Accounting Policies.
The financial statements have been prepared in conformity with accounting principles generally accepted in the United States of America (GAAP), which require management to make certain estimates and assumptions at the date of the financial statements. Actual results could differ from those estimates. Subsequent events, if any, through the date that the financial statements were issued have been evaluated in the preparation of the financial statements. The following summarizes the significant accounting policies of the Fund:
Investment Valuation. Investments are valued as of 4:00 p.m. Eastern time on the last calendar day of the period. In accordance with valuation policies and procedures
Annual Report
3. Significant Accounting Policies - continued
Investment Valuation - continued
approved by the Board of Trustees (the Board), the Fund attempts to obtain prices from one or more third party pricing vendors or brokers to value its investments. When current market prices, quotations or currency exchange rates are not readily available or reliable, investments will be fair valued in good faith by the Fidelity Management & Research Company (FMR) Fair Value Committee (the Committee), in accordance with procedures adopted by the Board. Factors used in determining fair value vary by investment type and may include market or investment specific events. The frequency with which these procedures are used cannot be predicted and they may be utilized to a significant extent. The Committee oversees the Fund's valuation policies and procedures and is responsible for approving and reporting to the Board all fair value determinations.
The Fund categorizes the inputs to valuation techniques used to value its investments into a disclosure hierarchy consisting of three levels as shown below:
Level 1 - quoted prices in active markets for identical investments
Level 2 - other significant observable inputs (including quoted prices for similar investments, interest rates, prepayment speeds, etc.)
Level 3 - unobservable inputs (including the Fund's own assumptions based on the best information available)
Valuation techniques used to value the Fund's investments by major category are as follows:
Equity securities, including restricted securities, for which market quotations are readily available, are valued at the last reported sale price or official closing price as reported by a third party pricing vendor on the primary market or exchange on which they are traded and are categorized as Level 1 in the hierarchy. In the event there were no sales during the day or closing prices are not available, securities are valued at the last quoted bid price or may be valued using the last available price and are generally categorized as Level 2 in the hierarchy. For foreign equity securities, when market or security specific events arise, comparisons to the valuation of American Depositary Receipts (ADRs), futures contracts, Exchange-Traded Funds (ETFs) and certain indexes as well as quoted prices for similar securities may be used and would be categorized as Level 2 in the hierarchy. Utilizing these techniques may result in transfers between Level 1 and Level 2. For equity securities, including restricted securities, where observable inputs are limited, assumptions about market activity and risk are used and these securities may be categorized as Level 3 in the hierarchy.
Annual Report
Notes to Financial Statements - continued
3. Significant Accounting Policies - continued
Investment Valuation - continued
Investments in open-end mutual funds, including the Fidelity Central Funds, are valued at their closing net asset value (NAV) each business day and are categorized as Level 1 in the hierarchy.
Changes in valuation techniques may result in transfers in or out of an assigned level within the disclosure hierarchy. The aggregate value of investments by input level, as of October 31, 2014, including information on transfers between Levels 1 and 2, is included at the end of the Fund's Schedule of Investments.
Foreign Currency. The Fund may use foreign currency contracts to facilitate transactions in foreign-denominated securities. Gains and losses from these transactions may arise from changes in the value of the foreign currency or if the counterparties do not perform under the contracts' terms.
Foreign-denominated assets, including investment securities, and liabilities are translated into U.S. dollars at the exchange rates at period end. Purchases and sales of investment securities, income and dividends received and expenses denominated in foreign currencies are translated into U.S. dollars at the exchange rate in effect on the transaction date.
The effects of exchange rate fluctuations on investments are included with the net realized and unrealized gain (loss) on investment securities. Other foreign currency transactions resulting in realized and unrealized gain (loss) are disclosed separately.
Investment Transactions and Income. For financial reporting purposes, the Fund's investment holdings and NAV include trades executed through the end of the last business day of the period. The NAV per share for processing shareholder transactions is calculated as of the close of business of the New York Stock Exchange (NYSE), normally 4:00 p.m. Eastern time and includes trades executed through the end of the prior business day. Gains and losses on securities sold are determined on the basis of identified cost. Dividend income is recorded on the ex-dividend date, except for certain dividends from foreign securities where the ex-dividend date may have passed, which are recorded as soon as the Fund is informed of the ex-dividend date. Non-cash dividends included in dividend income, if any, are recorded at the fair market value of the securities received. Income and capital gain distributions from Fidelity Central Funds, if any, are recorded on the ex-dividend date. Investment income is recorded net of foreign taxes withheld where recovery of such taxes is uncertain.
Class Allocations and Expenses. Investment income, realized and unrealized capital gains and losses, common expenses of the Fund, and certain fund-level expense reductions, if any, are allocated daily on a pro-rata basis to each class based on the relative net
Annual Report
3. Significant Accounting Policies - continued
Class Allocations and Expenses - continued
assets of each class to the total net assets of the Fund. Each class differs with respect to transfer agent and distribution and service plan fees incurred. Certain expense reductions may also differ by class. For the reporting period, the allocated portion of income and expenses to each class as a percent of its average net assets may vary due to the timing of recording these transactions in relation to fluctuating net assets of the classes. Expenses directly attributable to a fund are charged to that fund. Expenses attributable to more than one fund are allocated among the respective funds on the basis of relative net assets or other appropriate methods. Expense estimates are accrued in the period to which they relate and adjustments are made when actual amounts are known.
Income Tax Information and Distributions to Shareholders. Each year, the Fund intends to qualify as a regulated investment company under Subchapter M of the Internal Revenue Code, including distributing substantially all of its taxable income and realized gains. As a result, no provision for U.S. Federal income taxes is required. As of October 31, 2014, the Fund did not have any unrecognized tax benefits in the financial statements; nor is the Fund aware of any tax positions for which it is reasonably possible that the total amounts of unrecognized tax benefits will significantly change in the next twelve months. The Fund files a U.S. federal tax return, in addition to state and local tax returns as required. The Fund's federal income tax returns are subject to examination by the Internal Revenue Service (IRS) for a period of three fiscal years after they are filed. State and local tax returns may be subject to examination for an additional fiscal year depending on the jurisdiction. Foreign taxes are provided for based on the Fund's understanding of the tax rules and rates that exist in the foreign markets in which it invests. The Fund is subject to a tax imposed on capital gains by certain countries in which it invests. An estimated deferred tax liability for net unrealized appreciation on the applicable securities is included in Other payables and accrued expenses on the Statement of Assets & Liabilities.
Distributions are declared and recorded on the ex-dividend date. Income dividends and capital gain distributions are declared separately for each class. Income and capital gain distributions are determined in accordance with income tax regulations, which may differ from GAAP.
Capital accounts within the financial statements are adjusted for permanent book-tax differences. These adjustments have no impact on net assets or the results of operations. Capital accounts are not adjusted for temporary book-tax differences which will reverse in a subsequent period.
Book-tax differences are primarily due to foreign currency transactions, certain foreign taxes, passive foreign investment companies (PFIC), and losses deferred due to wash sales.
Annual Report
Notes to Financial Statements - continued
3. Significant Accounting Policies - continued
Income Tax Information and Distributions to Shareholders - continued
The federal tax cost of investment securities and unrealized appreciation (depreciation) as of period end were as follows:
Gross unrealized appreciation | $ 7,254,784 |
Gross unrealized depreciation | (6,137,587) |
Net unrealized appreciation (depreciation) on securities | $ 1,117,197 |
| |
Tax Cost | $ 87,826,125 |
The tax-based components of distributable earnings as of period end were as follows:
Capital loss carryforward | $ (322,648) |
Net unrealized appreciation (depreciation) on securities and other investments | $ 1,099,060 |
Capital loss carryforwards are only available to offset future capital gains of the Fund to the extent provided by regulations and may be limited. Under the Regulated Investment Company Modernization Act of 2010 (the Act), the Fund is permitted to carry forward capital losses incurred in taxable years beginning after December 22, 2010 for an unlimited period and such capital losses are required to be used prior to any losses that expire. The capital loss carryforward information presented below, including any applicable limitation, is estimated as of fiscal period end and is subject to adjustment.
Fiscal year of expiration | |
No expiration | |
Short-term | $ (322,648) |
The tax character of distributions paid was as follows:
| October 31, 2014 | October 31, 2013 |
Ordinary Income | $ 676,480 | $ 1,201,159 |
Long-term Capital Gains | 2,520,609 | - |
Total | $ 3,197,089 | $ 1,201,159 |
Short-Term Trading (Redemption) Fees. Shares held by investors in the Fund less than 90 days may have been subject to a redemption fee equal to 2.00% of the NAV of shares redeemed. All redemption fees, which reduce the proceeds of the shareholder redemption, are retained by the Fund and accounted for as an addition to paid in capital.
New Accounting Pronouncement. In June 2014, the Financial Accounting Standards Board issued Accounting Standard Update No. 2014-11, Repurchase-to-Maturity Transactions, Repurchase Financings, and Disclosures. The Update amends the accounting for certain repurchase agreements and expands disclosure requirements for reverse
Annual Report
3. Significant Accounting Policies - continued
New Accounting Pronouncement - continued
repurchase agreements, securities lending and other similar transactions. The disclosure requirements are effective for annual and interim reporting periods beginning after December 15, 2014. Management is currently evaluating the impact of the Update on the Fund's financial statements and related disclosures.
4. Purchases and Sales of Investments.
Purchases and sales of securities, other than short-term securities, aggregated $133,129,300 and $154,307,954, respectively.
5. Fees and Other Transactions with Affiliates.
Management Fee. Fidelity Management & Research Company (the investment adviser) and its affiliates provide the Fund with investment management related services for which the Fund pays a monthly management fee. The management fee is the sum of an individual fund fee rate that is based on an annual rate of .60% of the Fund's average net assets and an annualized group fee rate that averaged .25% during the period. The group fee rate is based upon the average net assets of all the mutual funds advised by the investment adviser, including any mutual funds previously advised by the investment adviser that are currently advised by Fidelity SelectCo, LLC, an affiliate of the investment adviser. The group fee rate decreases as assets under management increase and increases as assets under management decrease. For the reporting period, the total annual management fee rate was .85% of the Fund's average net assets.
Distribution and Service Plan Fees. In accordance with Rule 12b-1 of the 1940 Act, the Fund has adopted separate Distribution and Service Plans for each class of shares. Certain classes pay Fidelity Distributors Corporation (FDC), an affiliate of the investment adviser, separate Distribution and Service Fees, each of which is based on an annual percentage of each class' average net assets. In addition, FDC may pay financial intermediaries for selling shares of the Fund and providing shareholder support services. For the period, the Distribution and Service Fee rates, total fees and amounts retained by FDC were as follows:
| Distribution
Fee | Service
Fee | Total Fees | Retained
by FDC |
Class A | -% | .25% | $ 11,632 | $ 1,997 |
Class T | .25% | .25% | 9,422 | 384 |
Class C | .75% | .25% | 20,021 | 10,212 |
| | | $ 41,075 | $ 12,593 |
Annual Report
Notes to Financial Statements - continued
5. Fees and Other Transactions with Affiliates - continued
Sales Load. FDC may receive a front-end sales charge of up to 5.75% for selling Class A shares and 3.50% for selling Class T shares, some of which is paid to financial intermediaries for selling shares of the Fund. Depending on the holding period, FDC may receive contingent deferred sales charges levied on Class A, Class T and Class C redemptions. The deferred sales charges range from 1.00% for Class C shares, 1.00% for certain purchases of Class A shares and .25% for certain purchases of Class T shares.
For the period, sales charge amounts retained by FDC were as follows:
| Retained
by FDC |
Class A | $ 2,453 |
Class T | 1,194 |
Class C* | 2,188 |
| $ 5,835 |
* When Class C shares are initially sold, FDC pays commissions from its own resources to financial intermediaries through which the sales are made.
Transfer Agent Fees. Fidelity Investments Institutional Operations Company, Inc., (FIIOC), an affiliate of the investment adviser, is the transfer, dividend disbursing and shareholder servicing agent for each class of the Fund. FIIOC receives account fees and asset-based fees that vary according to the account size and type of account of the shareholders of the respective classes of the Fund. FIIOC pays for typesetting, printing and mailing of shareholder reports, except proxy statements.
For the period, transfer agent fees for each class were as follows:
| Amount | % of
Class-Level Average
Net Assets |
Class A | $ 14,242 | .31 |
Class T | 6,334 | .34 |
Class C | 6,270 | .31 |
Emerging Markets Discovery | 174,808 | .21 |
Institutional Class | 1,349 | .25 |
| $ 203,003 | |
Accounting and Security Lending Fees. Fidelity Service Company, Inc. (FSC), an affiliate of the investment adviser, maintains the Fund's accounting records. The accounting fee is based on the level of average net assets for each month. Under a separate contract, FSC administers the security lending program. The security lending fee is based on the number and duration of lending transactions.
Brokerage Commissions. The Fund placed a portion of its portfolio transactions with brokerage firms which are affiliates of the investment adviser. Brokerage commissions are included in net realized gain (loss) and change in net unrealized appreciation (depreciation) in the Statement of Operations. The commissions paid to these affiliated firms were $594 for the period.
Annual Report
5. Fees and Other Transactions with Affiliates - continued
Interfund Lending Program. Pursuant to an Exemptive Order issued by the SEC, the Fund, along with other registered investment companies having management contracts with FMR or other affiliated entities of FMR, may participate in an interfund lending program. This program provides an alternative credit facility allowing the funds to borrow from, or lend money to, other participating affiliated funds. At period end, there were no interfund loans outstanding. The Fund's activity in this program during the period for which loans were outstanding was as follows:
Borrower or Lender | Average Loan
Balance | Weighted Average Interest Rate | Interest Expense |
Borrower | $ 2,976,000 | .32% | $ 79 |
6. Committed Line of Credit.
The Fund participates with other funds managed by the investment adviser or an affiliate in a $4.25 billion credit facility (the "line of credit") to be utilized for temporary or emergency purposes to fund shareholder redemptions or for other short-term liquidity purposes. The Fund has agreed to pay commitment fees on its pro-rata portion of the line of credit, which amounted to $152 and is reflected in Miscellaneous expenses on the Statement of Operations. During the period, the Fund did not borrow on this line of credit.
7. Security Lending.
The Fund lends portfolio securities through a lending agent from time to time in order to earn additional income. For equity securities, a lending agent is used and may loan securities to certain qualified borrowers, including Fidelity Capital Markets (FCM), a broker-dealer affiliated with the Fund. On the settlement date of the loan, the Fund receives collateral (in the form of U.S. Treasury obligations, letters of credit and/or cash) against the loaned securities and maintains collateral in an amount not less than 100% of the market value of the loaned securities during the period of the loan. The market value of the loaned securities is determined at the close of business of the Fund and any additional required collateral is delivered to the Fund on the next business day. If the borrower defaults on its obligation to return the securities loaned because of insolvency or other reasons, the Fund may apply collateral received from the borrower against the obligation. The Fund may experience delays and costs in recovering the securities loaned. Any cash collateral received is invested in the Fidelity Securities Lending Cash Central Fund. The value of loaned securities and cash collateral at period end are disclosed on the Fund's Statement of Assets and Liabilities. Security lending income
Annual Report
Notes to Financial Statements - continued
7. Security Lending - continued
represents the income earned on investing cash collateral, less rebates paid to borrowers and any lending agent fees associated with the loan, plus any premium payments received for lending certain types of securities. Security lending income is presented in the Statement of Operations as a component of income from Fidelity Central Funds. Total security lending income during the period amounted to $22,418. During the period, there were no securities loaned to FCM.
8. Expense Reductions.
The investment adviser contractually agreed to reimburse each class to the extent annual operating expenses exceeded certain levels of average net assets as noted in the table below. This reimbursement will remain in place through December 31, 2015. Some expenses, for example interest expense, including commitment fees, are excluded from this reimbursement.
The following classes were in reimbursement during the period:
| Expense
Limitations | Reimbursement |
Class A | 1.70% | $ 5,734 |
Class T | 1.95% | 2,801 |
Class C | 2.45% | 2,643 |
Emerging Markets Discovery | 1.45% | 25,708 |
Institutional Class | 1.45% | 569 |
| | $ 37,455 |
In addition, the investment adviser reimbursed a portion of the Fund's operating expenses during the period in the amount of $1,820.
9. Distributions to Shareholders.
Distributions to shareholders of each class were as follows:
Years ended October 31, | 2014 | 2013 |
From net investment income | | |
Class A | $ 23,688 | $ 7,274 |
Class T | 2,475 | 5,643 |
Class C | - | 1,195 |
Emerging Markets Discovery | 646,254 | 259,277 |
Institutional Class | 4,063 | 12,904 |
Total | $ 676,480 | $ 286,293 |
Annual Report
9. Distributions to Shareholders - continued
Years ended October 31, | 2014 | 2013 |
From net realized gain | | |
Class A | $ 122,525 | $ 33,559 |
Class T | 43,668 | 33,691 |
Class C | 51,356 | 30,324 |
Emerging Markets Discovery | 2,280,897 | 778,518 |
Institutional Class | 22,163 | 38,774 |
Total | $ 2,520,609 | $ 914,866 |
10. Share Transactions.
Share transactions for each class were as follows and may contain automatic conversions between classes or exchanges between funds:
| Shares | Shares | Dollars | Dollars |
Years ended October 31, | 2014 | 2013 | 2014 | 2013 |
Class A | | | | |
Shares sold | 147,354 | 646,803 | $ 1,789,001 | $ 8,039,936 |
Reinvestment of distributions | 10,958 | 3,013 | 133,251 | 36,310 |
Shares redeemed | (205,580) | (384,660) | (2,490,439) | (4,712,072) |
Net increase (decrease) | (47,268) | 265,156 | $ (568,187) | $ 3,364,174 |
Class T | | | | |
Shares sold | 52,146 | 157,097 | $ 631,489 | $ 1,931,892 |
Reinvestment of distributions | 3,566 | 3,232 | 43,325 | 38,882 |
Shares redeemed | (42,178) | (149,702) | (507,088) | (1,831,906) |
Net increase (decrease) | 13,534 | 10,627 | $ 167,726 | $ 138,868 |
Class C | | | | |
Shares sold | 92,257 | 428,945 | $ 1,143,008 | $ 5,224,843 |
Reinvestment of distributions | 4,241 | 2,629 | 51,185 | 31,519 |
Shares redeemed | (119,225) | (387,768) | (1,424,170) | (4,776,955) |
Net increase (decrease) | (22,727) | 43,806 | $ (229,977) | $ 479,407 |
Emerging Markets Discovery | | | | |
Shares sold | 2,185,123 | 12,245,350 | $ 26,469,903 | $ 152,132,821 |
Reinvestment of distributions | 205,996 | 72,226 | 2,506,974 | 871,750 |
Shares redeemed | (3,696,612) | (7,876,995) | (44,026,941) | (96,541,547) |
Net increase (decrease) | (1,305,493) | 4,440,581 | $ (15,050,064) | $ 56,463,024 |
Institutional Class | | | | |
Shares sold | 25,831 | 231,788 | $ 324,477 | $ 2,857,278 |
Reinvestment of distributions | 824 | 3,612 | 10,052 | 43,597 |
Shares redeemed | (73,327) | (302,585) | (870,835) | (3,657,178) |
Net increase (decrease) | (46,672) | (67,185) | $ (536,306) | $ (756,303) |
Annual Report
Notes to Financial Statements - continued
11. Other.
The Fund's organizational documents provide former and current trustees and officers with a limited indemnification against liabilities arising in connection with the performance of their duties to the Fund. In the normal course of business, the Fund may also enter into contracts that provide general indemnifications. The Fund's maximum exposure under these arrangements is unknown as this would be dependent on future claims that may be made against the Fund. The risk of material loss from such claims is considered remote.
At the end of the period, the investment adviser or its affiliates were the owners of record of 11% of the total outstanding shares of the Fund.
Annual Report
To the Trustees of Fidelity Investment Trust and the Shareholders of Fidelity Emerging Markets Discovery Fund:
In our opinion, the accompanying statement of assets and liabilities, including the schedule of investments, and the related statements of operations and of changes in net assets and the financial highlights present fairly, in all material respects, the financial position of Fidelity Emerging Markets Discovery Fund (a fund of Fidelity Investment Trust) at October 31, 2014, the results of its operations for the year then ended, the changes in its net assets for each of the two years in the period then ended and the financial highlights for each of the periods indicated, in conformity with accounting principles generally accepted in the United States of America. These financial statements and financial highlights (hereafter referred to as "financial statements") are the responsibility of the Fidelity Emerging Markets Discovery Fund's management. Our responsibility is to express an opinion on these financial statements based on our audits. We conducted our audits of these financial statements in accordance with the standards of the Public Company Accounting Oversight Board (United States). Those standards require that we plan and perform the audit to obtain reasonable assurance about whether the financial statements are free of material misstatement. An audit includes examining, on a test basis, evidence supporting the amounts and disclosures in the financial statements, assessing the accounting principles used and significant estimates made by management, and evaluating the overall financial statement presentation. We believe that our audits, which included confirmation of securities at October 31, 2014 by correspondence with the custodian and brokers, provide a reasonable basis for our opinion.
PricewaterhouseCoopers LLP
Boston, Massachusetts
December 19, 2014
Annual Report
The Trustees, Member of the Advisory Board, and officers of the trust and fund, as applicable, are listed below. The Board of Trustees governs the fund and is responsible for protecting the interests of shareholders. The Trustees are experienced executives who meet periodically throughout the year to oversee the fund's activities, review contractual arrangements with companies that provide services to the fund, oversee management of the risks associated with such activities and contractual arrangements, and review the fund's performance. Except for James C. Curvey, each of the Trustees oversees 174 funds. Mr. Curvey oversees 407 funds.
The Trustees hold office without limit in time except that (a) any Trustee may resign; (b) any Trustee may be removed by written instrument, signed by at least two-thirds of the number of Trustees prior to such removal; (c) any Trustee who requests to be retired or who has become incapacitated by illness or injury may be retired by written instrument signed by a majority of the other Trustees; and (d) any Trustee may be removed at any special meeting of shareholders by a two-thirds vote of the outstanding voting securities of the trust. Each Trustee who is not an interested person (as defined in the 1940 Act) of the trust and the fund (Independent Trustee), shall retire not later than the last day of the calendar year in which his or her 75th birthday occurs. The Independent Trustees may waive this mandatory retirement age policy with respect to individual Trustees. The officers and Advisory Board Member hold office without limit in time, except that any officer and Advisory Board Member may resign or may be removed by a vote of a majority of the Trustees at any regular meeting or any special meeting of the Trustees. Except as indicated, each individual has held the office shown or other offices in the same company for the past five years.
Experience, Skills, Attributes, and Qualifications of the Fund's Trustees. The Governance and Nominating Committee has adopted a statement of policy that describes the experience, qualifications, attributes, and skills that are necessary and desirable for potential Independent Trustee candidates (Statement of Policy). The Board believes that each Trustee satisfied at the time he or she was initially elected or appointed a Trustee, and continues to satisfy, the standards contemplated by the Statement of Policy. The Governance and Nominating Committee also engages professional search firms to help identify potential Independent Trustee candidates who have the experience, qualifications, attributes, and skills consistent with the Statement of Policy. From time to time, additional criteria based on the composition and skills of the current Independent Trustees, as well as experience or skills that may be appropriate in light of future changes to board composition, business conditions, and regulatory or other developments, have also been considered by the professional search firms and the Governance and Nominating Committee. In addition, the Board takes into account the Trustees' commitment and participation in Board and committee meetings, as well as their leadership of standing and ad hoc committees throughout their tenure.
In determining that a particular Trustee was and continues to be qualified to serve as a Trustee, the Board has considered a variety of criteria, none of which, in isolation, was controlling. The Board believes that, collectively, the Trustees have balanced and diverse experience, qualifications, attributes, and skills, which allow the Board to operate effectively in governing the fund and protecting the interests of shareholders. Information about the specific experience, skills, attributes, and qualifications of each Trustee, which in each case led to the Board's conclusion that the Trustee should serve (or continue to serve) as a trustee of the fund, is provided below.
Annual Report
Board Structure and Oversight Function. James C. Curvey is an interested person (as defined in the 1940 Act) and currently serves as Chairman. The Trustees have determined that an interested Chairman is appropriate and benefits shareholders because an interested Chairman has a personal and professional stake in the quality and continuity of services provided to the fund. Independent Trustees exercise their informed business judgment to appoint an individual of their choosing to serve as Chairman, regardless of whether the Trustee happens to be independent or a member of management. The Independent Trustees have determined that they can act independently and effectively without having an Independent Trustee serve as Chairman and that a key structural component for assuring that they are in a position to do so is for the Independent Trustees to constitute a substantial majority for the Board. The Independent Trustees also regularly meet in executive session. Ned C. Lautenbach serves as Chairman of the Independent Trustees and as such (i) acts as a liaison between the Independent Trustees and management with respect to matters important to the Independent Trustees and (ii) with management prepares agendas for Board meetings.
Fidelity funds are overseen by different Boards of Trustees. The fund's Board oversees Fidelity's equity and high income funds and another Board oversees Fidelity's investment-grade bond, money market, and asset allocation funds. The asset allocation funds may invest in Fidelity funds overseen by the fund's Board. The use of separate Boards, each with its own committee structure, allows the Trustees of each group of Fidelity funds to focus on the unique issues of the funds they oversee, including common research, investment, and operational issues. On occasion, the separate Boards establish joint committees to address issues of overlapping consequences for the Fidelity funds overseen by each Board.
The Trustees operate using a system of committees to facilitate the timely and efficient consideration of all matters of importance to the Trustees, the fund, and fund shareholders and to facilitate compliance with legal and regulatory requirements and oversight of the fund's activities and associated risks. The Board, acting through its committees, has charged FMR and its affiliates with (i) identifying events or circumstances the occurrence of which could have demonstrably adverse effects on the fund's business and/or reputation; (ii) implementing processes and controls to lessen the possibility that such events or circumstances occur or to mitigate the effects of such events or circumstances if they do occur; and (iii) creating and maintaining a system designed to evaluate continuously business and market conditions in order to facilitate the identification and implementation processes described in (i) and (ii) above. Because the day-to-day operations and activities of the fund are carried out by or through FMR, its affiliates and other service providers, the fund's exposure to risks is mitigated but not eliminated by the processes overseen by the Trustees. While each of the Board's committees has responsibility for overseeing different aspects of the fund's activities, oversight is exercised primarily through the Operations, Audit, and Compliance Committees. In addition, the Independent Trustees have worked with FMR to enhance the Board's oversight of investment and financial risks, legal and regulatory risks, technology risks, and operational risks, including the development of additional risk reporting to the Board. For example, a working group comprised of Independent Trustees and FMR has worked and continues to work to review the Fidelity funds' valuation-related activities, reporting and risk management. Appropriate personnel, including but not limited to the fund's Chief Compliance Officer (CCO), FMR's internal auditor, the independent accountants, the fund's Treasurer and portfolio management personnel, make periodic reports to the Board's committees, as appropriate, including an annual review of FMR's risk management program for the Fidelity funds. The responsibilities of each standing committee, including their oversight responsibilities, are described further under "Standing Committees of the Fund's Trustees."
Annual Report
Trustees and Officers - continued
The fund's Statement of Additional Information (SAI) includes more information about the Trustees. To request a free copy, call Fidelity at 1-877-208-0098.
Interested Trustees*:
Correspondence intended for each Trustee who is an interested person may be sent to Fidelity Investments, 245 Summer Street, Boston, Massachusetts 02210.
Name, Year of Birth; Principal Occupations and Other Relevant Experience+ |
James C. Curvey (1935) |
Year of Election or Appointment: 2007 Trustee Chairman of the Board of Trustees |
| Mr. Curvey also serves as Trustee of other Fidelity funds. Mr. Curvey is a Director of Fidelity Research & Analysis Co. (2009-present), and Vice Chairman (2007-present) and Director of FMR LLC. In addition, Mr. Curvey serves as an Overseer for the Boston Symphony Orchestra and a member of the board of Artis-Naples, Naples, Florida, and as a Trustee for Brewster Academy, Wolfeboro, New Hampshire. Previously, Mr. Curvey served as a Director of Fidelity Investments Money Management, Inc. (2009-2014), a Director of FMR (2007-2014), and a Director of FMR Co., Inc. (2007-2014). |
Charles S. Morrison (1960) |
Year of Election or Appointment: 2014 Trustee |
| Mr. Morrison also serves as Trustee of other funds. He serves as a Director of Fidelity Investments Money Management, Inc. (FIMM) (2014-present), Director of Fidelity SelectCo, LLC (2014-present), President, Asset Management (2014-present), and is an employee of Fidelity Investments. Previously, Mr. Morrison served as Vice President of Fidelity's Fixed Income and Asset Allocation Funds (2012-2014), President, Fixed Income (2011-2014), Vice President of Fidelity's Money Market Funds (2005-2009), President, Money Market Group Leader of FMR (2009), and Senior Vice President, Money Market Group of FMR (2004-2009). Mr. Morrison also served as Vice President of Fidelity's Bond Funds (2002-2005), certain Balanced Funds (2002-2005), and certain Asset Allocation Funds (2002-2007), and as Senior Vice President (2002-2005) of Fidelity's Bond Division. |
* Trustees have been determined to be "Interested Trustees" by virtue of, among other things, their affiliation with the trust or various entities under common control with FMR.
+ The information above includes each Trustee's principal occupation during the last five years and other information relating to the experience, attributes, and skills relevant to each Trustee's qualifications to serve as a Trustee, which led to the conclusion that each Trustee should serve as a Trustee for the fund.
Annual Report
Trustees and Officers - continued
Independent Trustees:
Correspondence intended for each Independent Trustee (that is, the Trustees other than the Interested Trustees) may be sent to Fidelity Investments, P.O. Box 55235, Boston, Massachusetts 02205-5235.
Name, Year of Birth; Principal Occupations and Other Relevant Experience+ |
Dennis J. Dirks (1948) |
Year of Election or Appointment: 2005 Trustee |
| Mr. Dirks also serves as Trustee of other Fidelity funds. Prior to his retirement in May 2003, Mr. Dirks was Chief Operating Officer and a member of the Board of The Depository Trust & Clearing Corporation (DTCC). He also served as President, Chief Operating Officer, and Board member of The Depository Trust Company (DTC) and President and Board member of the National Securities Clearing Corporation (NSCC). In addition, Mr. Dirks served as Chief Executive Officer and Board member of the Government Securities Clearing Corporation, Chief Executive Officer and Board member of the Mortgage-Backed Securities Clearing Corporation, as a Trustee and a member of the Finance Committee of Manhattan College (2005-2008), and as a Trustee and a member of the Finance Committee of AHRC of Nassau County (2006-2008). Mr. Dirks is a member of the Independent Directors Council (IDC) Governing Council (2010-present) and Board of Directors for The Brookville Center for Children's Services, Inc. (2009-present). |
Alan J. Lacy (1953) |
Year of Election or Appointment: 2008 Trustee |
| Mr. Lacy also serves as Trustee of other Fidelity funds. Mr. Lacy serves as Senior Adviser (2007-present) of Oak Hill Capital Partners, L.P. (private equity). Mr. Lacy also served as Chief Executive Officer (2000-2005) and Vice Chairman (2005-2006) of Sears Holdings Corporation and Sears, Roebuck and Co. (retail). In addition, Mr. Lacy serves as a member of the Board of Directors of Dave & Buster's Entertainment, Inc. (restaurant and entertainment complexes, 2010-present), Earth Fare, Inc. (retail grocery, 2012-present), The Hillman Companies, Inc. (hardware wholesalers, 2010-present), and Bristol-Myers Squibb Company (global pharmaceuticals, 2008-present). Mr. Lacy is a member of the Board of Trustees of The National Parks Conservation Association (2006-present). Previously, Mr. Lacy served as Chairman of the Board of Trustees of the National Parks Conservation Association (2008-2011) and as a member of the Board of Directors for the Western Union Company (global money transfer, 2006-2011). |
Ned C. Lautenbach (1944) |
Year of Election or Appointment: 2000 Trustee Chairman of the Independent Trustees |
| Mr. Lautenbach also serves as Trustee of other Fidelity funds. Mr. Lautenbach currently serves as the Lead Director of the Eaton Corporation Board of Directors (diversified industrial, 1997-present). Mr. Lautenbach is Chairman of the Board of Directors of the Philharmonic Center for the Arts in Naples, Florida (2012-present) and a member of the Council on Foreign Relations (1994-present). Previously, Mr. Lautenbach was a Partner/Advisory Partner at Clayton, Dubilier & Rice, LLC (private equity investment, 1998-2010), as well as a Director of Sony Corporation (2006-2007). |
Joseph Mauriello (1944) |
Year of Election or Appointment: 2008 Trustee |
| Mr. Mauriello also serves as Trustee of other Fidelity funds. Prior to his retirement in January 2006, Mr. Mauriello served in numerous senior management positions including Deputy Chairman and Chief Operating Officer (2004-2005), and Vice Chairman of Financial Services (2002-2004) of KPMG LLP US (professional services, 1965-2005). Mr. Mauriello currently serves as a member of the Board of Directors of XL Group plc. (global insurance and re-insurance, 2006-present). Previously, Mr. Mauriello served as a Director of the Hamilton Funds of the Bank of New York (2006-2007) and of Arcadia Resources Inc. (health care services and products, 2007-2012). |
Robert W. Selander (1950) |
Year of Election or Appointment: 2011 Trustee |
| Mr. Selander also serves as Trustee of other Fidelity funds. Previously, Mr. Selander served as a Member of the Advisory Board of other Fidelity funds (2011), and Executive Vice Chairman (2010), Chief Executive Officer (2009-2010), and President and Chief Executive Officer (1997-2009) of Mastercard, Inc. |
Cornelia M. Small (1944) |
Year of Election or Appointment: 2005 Trustee |
| Ms. Small also serves as Trustee of other Fidelity funds. Ms. Small is a member of the Board of Directors (2009-present) and Chair of the Investment Committee (2010-present) of the Teagle Foundation. Ms. Small also serves on the Investment Committee of the Berkshire Taconic Community Foundation (2008-present). Previously, Ms. Small served as Chairperson (2002-2008) and a member of the Investment Committee and Chairperson (2008-2012) and a member of the Board of Trustees of Smith College. In addition, Ms. Small served as Chief Investment Officer, Director of Global Equity Investments, and a member of the Board of Directors of Scudder, Stevens & Clark and Scudder Kemper Investments. |
William S. Stavropoulos (1939) |
Year of Election or Appointment: 2001 Trustee Vice Chairman of the Independent Trustees |
| Mr. Stavropoulos also serves as Trustee of other Fidelity funds. Mr. Stavropoulos serves as President and Founder of the Michigan Baseball Foundation, the Great Lakes Loons (2007-present). Mr. Stavropoulos is Chairman Emeritus of the Board of Directors of The Dow Chemical Company, where he previously served in numerous senior management positions, including President, CEO (1995-2000; 2002-2004), Chairman of the Executive Committee (2000-2006), and as a member of the Board of Directors (1990-2006). Currently, Mr. Stavropoulos is Chairman of the Board of Directors of Univar Inc. (global distributor of commodity and specialty chemicals), a Director of Teradata Corporation (data warehousing and technology solutions), and Maersk Inc. (industrial conglomerate), and a member of the Advisory Board for Metalmark Capital LLC (private equity investment, 2005-present). Mr. Stavropoulos is an operating advisor to Clayton, Dubilier & Rice, LLC (private equity investment). In addition, Mr. Stavropoulos is a member of the University of Notre Dame Advisory Council for the College of Science, a Trustee of the Rollin L. Gerstacker Foundation, and a Director of the Naples Philharmonic Center for the Arts. Previously, Mr. Stavropoulos served as a Director of Chemical Financial Corporation (bank holding company, 1993-2012) and Tyco International, Ltd. (multinational manufacturing and services, 2007-2012). |
David M. Thomas (1949) |
Year of Election or Appointment: 2008 Trustee |
| Mr. Thomas also serves as Trustee of other Fidelity funds. Mr. Thomas serves as Non-Executive Chairman of the Board of Directors of Fortune Brands Home and Security (home and security products, 2011-present), and as a member of the Board of Directors of Interpublic Group of Companies, Inc. (marketing communication, 2004-present). Previously, Mr. Thomas served as Executive Chairman (2005-2006) and Chairman and Chief Executive Officer (2000-2005) of IMS Health, Inc. (pharmaceutical and healthcare information solutions), and a Director of Fortune Brands, Inc. (consumer products, 2000-2011). |
+ The information above includes each Trustee's principal occupation during the last five years and other information relating to the experience, attributes, and skills relevant to each Trustee's qualifications to serve as a Trustee, which led to the conclusion that each Trustee should serve as a Trustee for the fund.
Advisory Board Member and Officers:
Correspondence intended for each officer and Peter S. Lynch may be sent to Fidelity Investments, 245 Summer Street, Boston, Massachusetts 02210. Officers appear below in alphabetical order.
Name, Year of Birth; Principal Occupation |
Peter S. Lynch (1944) |
Year of Election or Appointment: 2003 Member of the Advisory Board |
| Mr. Lynch also serves as Member of the Advisory Board of other Fidelity funds. Mr. Lynch is Vice Chairman and a Director of FMR and FMR Co., Inc. In addition, Mr. Lynch serves as a Trustee of Boston College and as the Chairman of the Inner-City Scholarship Fund. Previously, Mr. Lynch served on the Special Olympics International Board of Directors (1997-2006). |
Elizabeth Paige Baumann (1968) |
Year of Election or Appointment: 2012 Anti-Money Laundering (AML) Officer |
| Ms. Baumann also serves as AML Officer of other funds. She is Chief AML Officer of FMR LLC (2012-present) and is an employee of Fidelity Investments. Previously, Ms. Baumann served as Vice President and Deputy Anti-Money Laundering Officer (2007-2012). |
William C. Coffey (1969) |
Year of Election or Appointment: 2009 Assistant Secretary |
| Mr. Coffey also serves as Assistant Secretary of other funds. He is Senior Vice President and Deputy General Counsel of FMR LLC (2010-present), and is an employee of Fidelity Investments. Previously, Mr. Coffey served as Vice President and Associate General Counsel of FMR LLC (2005-2009). |
Timothy M. Cohen (1969) |
Year of Election or Appointment: 2014 Vice President of certain Equity Funds |
| Mr. Cohen also serves as Vice President of other funds. Mr. Cohen serves as a Director and Chief Compliance Officer of Fidelity Management & Research (U.K.) Inc. (2013-present) and is an employee of Fidelity Investments. |
Jonathan Davis (1968) |
Year of Election or Appointment: 2010 Assistant Treasurer |
| Mr. Davis also serves as Assistant Treasurer of other funds. Mr. Davis is an employee of Fidelity Investments. Previously, Mr. Davis served as Vice President and Associate General Counsel of FMR LLC (2003-2010). |
Adrien E. Deberghes (1967) |
Year of Election or Appointment: 2008 Deputy Treasurer |
| Mr. Deberghes also serves as an officer of other funds. He is an employee of Fidelity Investments (2008-present). Prior to joining Fidelity Investments, Mr. Deberghes was Senior Vice President of Mutual Fund Administration at State Street Corporation (2007-2008), Senior Director of Mutual Fund Administration at Investors Bank & Trust (2005-2007), and Director of Finance for Dunkin' Brands (2000-2005). |
Stephanie J. Dorsey (1969) |
Year of Election or Appointment: 2010 Assistant Treasurer |
| Ms. Dorsey also serves as an officer of other funds. She is an employee of Fidelity Investments (2008-present) and has served in other fund officer roles. Prior to joining Fidelity Investments, Ms. Dorsey served as Treasurer (2004-2008) of the JPMorgan Mutual Funds and Vice President (2004-2008) of JPMorgan Chase Bank. |
Howard J. Galligan III (1966) |
Year of Election or Appointment: 2014 Chief Financial Officer |
| Mr. Galligan also serves as Chief Financial Officer of other funds. Mr. Galligan serves as President of Fidelity Pricing and Cash Management Services (FPCMS) (2014-present) and as a Director of Strategic Advisers, Inc. (2008-present). Previously, Mr. Galligan served as Chief Administrative Officer of Asset Management (2011-2014) and Chief Operating Officer and Senior Vice President of Investment Support for Strategic Advisers, Inc. (2003-2011). |
Scott C. Goebel (1968) |
Year of Election or Appointment: 2008 Secretary and Chief Legal Officer (CLO) |
| Mr. Goebel serves as Secretary and CLO of other funds. Mr. Goebel also serves as Secretary of Fidelity SelectCo, LLC (2013-present), Fidelity Investments Money Management, Inc. (FIMM) (2010-present) and Fidelity Research and Analysis Company (FRAC) (2010-present); General Counsel, Secretary, and Senior Vice President of FMR (2008-present) and FMR Co., Inc. (2008-present); Chief Legal Officer of Fidelity Management & Research (Hong Kong) Limited (2008-present); and Assistant Secretary of Fidelity Management & Research (Japan) Limited (2008-present) and Fidelity Management & Research (U.K.) Inc. (2008-present). Previously, Mr. Goebel served as Secretary and CLO of other Fidelity funds (2008-2013), Assistant Secretary of FIMM (2008-2010), FRAC (2008-2010), and certain funds (2007-2008); and as Vice President and Secretary of Fidelity Distributors Corporation (FDC) (2005-2007). Mr. Goebel has been employed by FMR LLC or an affiliate since 2001. |
Brian B. Hogan (1964) |
Year of Election or Appointment: 2009 Vice President |
| Mr. Hogan also serves as Trustee or Vice President of other funds. Mr. Hogan serves as a Director of Fidelity SelectCo, LLC (2014-present) and President of FMR's Equity Division (2009-present). Previously, Mr. Hogan served as Senior Vice President, Equity Research of FMR (2006-2009) and as a portfolio manager. |
Chris Maher (1972) |
Year of Election or Appointment: 2013 Assistant Treasurer |
| Mr. Maher serves as Assistant Treasurer of other funds. Mr. Maher is Vice President of Valuation Oversight and is an employee of Fidelity Investments. Previously, Mr. Maher served as Vice President of Asset Management Compliance (2013), Vice President of FMR's Program Management Group (2010-2013), and Vice President of Valuation Oversight (2008-2010). |
Kenneth B. Robins (1969) |
Year of Election or Appointment: 2008 President and Treasurer |
| Mr. Robins also serves as an officer of other funds. Mr. Robins serves as Executive Vice President of Fidelity Investments Money Management, Inc. (FIMM) (2013-present) and is an employee of Fidelity Investments (2004-present). Previously, Mr. Robins served in other fund officer roles. |
Stephen Sadoski (1971) |
Year of Election or Appointment: 2012 Deputy Treasurer |
| Mr. Sadoski also serves as Deputy Treasurer of other funds. He is an employee of Fidelity Investments (2012-present) and has served in another fund officer role. Prior to joining Fidelity Investments, Mr. Sadoski served as an assistant chief accountant in the Division of Investment Management of the Securities and Exchange Commission (SEC) (2009-2012) and as a senior manager at Deloitte & Touche LLP (1997-2009). |
Stacie M. Smith (1974) |
Year of Election or Appointment: 2013 Deputy Treasurer |
| Ms. Smith also serves as an officer of other funds. She is an employee of Fidelity Investments (2009-present) and has served in other fund officer roles. Prior to joining Fidelity Investments, Ms. Smith served as Senior Audit Manager of Ernst & Young LLP (1996-2009). |
Renee Stagnone (1975) |
Year of Election or Appointment: 2013 Deputy Treasurer |
| Ms. Stagnone also serves as Deputy Treasurer of other funds. Ms. Stagnone is an employee of Fidelity Investments. |
Linda J. Wondrack (1964) |
Year of Election or Appointment: 2014 Chief Compliance Officer |
| Ms. Wondrack also serves as Chief Compliance Officer of other funds. Ms. Wondrack is Executive Vice President and head of the Ethics Office and Asset Management Compliance for Fidelity Investments (2012-present). Ms. Wondrack also serves as Chief Compliance Officer of Fidelity SelectCo, LLC (2014-present); Chief Compliance Officer of Impresa Management LLC (2013-present); and Chief Compliance Officer of FMR Co., Inc., Fidelity Investments Money Management, Inc., Fidelity Management & Research (Japan) Limited, Fidelity Management & Research (U.K.) Inc., Fidelity Management & Research (Hong Kong), Fidelity Management & Research Company, Pyramis Global Advisors, LLC, and Strategic Advisers, Inc., Ballyrock Investment Advisors LLC, and Northern Neck Investors LLC (2012-present). Previously, Ms. Wondrack served as Senior Vice President and Chief Compliance Officer for Columbia Management Investment Advisers, LLC (2005-2012); Chief Compliance Officer for certain funds within the Columbia Family of Funds (2007-2012); and Senior Vice President of Compliance Risk Management at Bank of America (2005-2010). |
Joseph F. Zambello (1957) |
Year of Election or Appointment: 2011 Deputy Treasurer |
| Mr. Zambello also serves as Deputy Treasurer of other funds. Mr. Zambello is an employee of Fidelity Investments. Previously, Mr. Zambello served as Vice President of FMR's Program Management Group (2009-2011) and Vice President of the Transfer Agent Oversight Group (2005-2009). |
Annual Report
Class A and Class T designate 100% of the dividend distributed during the fiscal year as amounts which may be taken into account as a dividend for purposes of the maximum rate under section 1(h)(11) of the Internal Revenue Code.
The amounts per share which represent income derived from sources within, and taxes paid to, foreign countries or possessions of the United States are as follows:
| Pay Date | Income | Taxes |
Class A | 12/09/13 | $0.1002 | $0.0422 |
Class T | 12/09/13 | $0.0592 | $0.0422 |
Class C | 12/09/13 | $0.0000 | $0.0000 |
The fund will notify shareholders in January 2015 of amounts for use in preparing 2014 income tax returns.
Annual Report
Board Approval of Investment Advisory Contracts and Management Fees
Fidelity Emerging Markets Discovery Fund
Each year, the Board of Trustees, including the Independent Trustees (together, the Board), votes on the renewal of the management contract with Fidelity Management & Research Company (FMR) and the sub-advisory agreements (together, the Advisory Contracts) for the fund. The Board, assisted by the advice of fund counsel and Independent Trustees' counsel, requests and considers a broad range of information relevant to the renewal of the Advisory Contracts throughout the year.
The Board meets regularly and, at each of its meetings, covers an extensive agenda of topics and materials and considers factors that are relevant to its annual consideration of the renewal of the fund's Advisory Contracts, including the services and support provided to the fund and its shareholders. The Board has established various standing committees (Committees), each composed of and chaired by Independent Trustees with varying backgrounds, to which the Board has assigned specific subject matter responsibilities in order to enhance effective decision-making by the Board. The Board, acting directly and through its Committees, requests and receives information concerning the annual consideration of the renewal of the fund's Advisory Contracts. The Board also meets as needed to consider matters specifically related to the Board's annual consideration of the renewal of the Advisory Contracts. Members of the Board may also meet with trustees of other Fidelity funds through ad hoc joint committees to discuss certain matters relevant to the Fidelity funds.
At its July 2014 meeting, the Board, including the Independent Trustees, unanimously determined to renew the fund's Advisory Contracts. In reaching its determination, the Board considered all factors it believed relevant, including (i) the nature, extent, and quality of the services to be provided to the fund and its shareholders (including the investment performance of the fund); (ii) the competitiveness of the fund's management fee and total expense ratio relative to peer funds; (iii) the total costs of the services to be provided by and the profits to be realized by Fidelity from its relationship with the fund; (iv) the extent to which economies of scale exist and would be realized as the fund grows; and (v) whether fee levels reflect these economies of scale, if any, for the benefit of fund shareholders. In connection with separate internal corporate reorganizations involving Fidelity Management & Research (U.K.) Inc. (FMR U.K.) and Fidelity Management & Research (Japan) Inc. (FMR Japan), the Board approved certain non-material amendments to the fund's sub-advisory agreements with FMR U.K. and FMR Japan to reflect that, after these reorganizations, FMR Investment Management (UK) Limited and Fidelity Management & Research (Japan) Limited will carry on the business of FMR U.K. and FMR Japan, respectively. The Board noted that no changes to the portfolio managers or to the foreign research or investment advisory services provided to the fund were expected in connection with either reorganization and that the same personnel and resources would continue to be available to the fund at the new entities.
Annual Report
Board Approval of Investment Advisory Contracts and
Management Fees - continued
In considering whether to renew the Advisory Contracts for the fund, the Board reached a determination, with the assistance of fund counsel and Independent Trustees' counsel and through the exercise of its business judgment, that the renewal of the Advisory Contracts was in the best interests of the fund and its shareholders and that the compensation payable under the Advisory Contracts was fair and reasonable. The Board's decision to renew the Advisory Contracts was not based on any single factor, but rather was based on a comprehensive consideration of all the information provided to the Board at its meetings throughout the year. The Board, in reaching its determination to renew the Advisory Contracts, was aware that shareholders of the fund have a broad range of investment choices available to them, including a wide choice among funds offered by Fidelity's competitors, and that the fund's shareholders, who have the opportunity to review and weigh the disclosure provided by the fund in its prospectus and other public disclosures, have chosen to invest in this fund, which is part of the Fidelity family of funds.
Nature, Extent, and Quality of Services Provided. The Board considered Fidelity's staffing as it relates to the fund, including the backgrounds of investment personnel of FMR and the sub-advisers (together, the Investment Advisers), and also considered the fund's investment objective, strategies, and related investment philosophy. The Independent Trustees also had discussions with senior management of Fidelity's investment operations and investment groups. The Board considered the structure of the portfolio manager compensation program and whether this structure provides appropriate incentives to act in the best interests of the fund. Additionally, the Board considered the portfolio managers' investments, if any, in the funds that they manage.
Resources Dedicated to Investment Management and Support Services. The Board and the Fund Oversight and Research Committees reviewed the general qualifications and capabilities of Fidelity's investment staff, including its size, education, experience, and resources, as well as Fidelity's approach to recruiting, training, managing, and compensating investment personnel. The Board noted that Fidelity has continued to increase the resources devoted to non-U.S. offices, including expansion of Fidelity's global investment organization. The Board also noted that Fidelity's analysts have extensive resources, tools and capabilities that allow them to conduct sophisticated quantitative and fundamental analysis, as well as credit analysis of issuers, counterparties and guarantors. Further, the Board believes that Fidelity's investment professionals have sufficient access to global information and data so as to provide competitive investment results over time, and that those professionals also have access to sophisticated tools that permit them to assess portfolio construction and risk and performance attribution characteristics continuously, as well as to transmit new information and research conclusions rapidly around the world. Additionally, in its deliberations, the Board considered Fidelity's trading and risk management capabilities and resources and global compliance infrastructure, which are an integral part of the investment management process.
Annual Report
Shareholder and Administrative Services. The Board considered (i) the nature, extent, quality, and cost of advisory, administrative, and shareholder services performed by the Investment Advisers and their affiliates under the Advisory Contracts and under separate agreements covering transfer agency, pricing and bookkeeping, and securities lending services for the fund; (ii) the nature and extent of the supervision of third party service providers, principally custodians and subcustodians; and (iii) the resources devoted to, and the record of compliance with, the fund's compliance policies and procedures. The Board also reviewed the allocation of fund brokerage, including allocations to brokers affiliated with the Investment Advisers, the use of brokerage commissions to pay fund expenses, and the use of "soft" commission dollars to pay for research services.
The Board noted that the growth of fund assets over time across the complex allows Fidelity to reinvest in the development of services designed to enhance the value or convenience of the Fidelity funds as investment vehicles. These services include 24-hour access to account information and market information through telephone representatives and over the Internet, investor education materials and asset allocation tools, and the expanded availability of Fidelity Investor Centers.
In 2014, the Board formed an ad hoc Committee on Transfer Agency Fees to review the variety of transfer agency fee structures throughout the industry and Fidelity's competitive positioning with respect to industry participants.
Investment in a Large Fund Family. The Board considered the benefits to shareholders of investing in a Fidelity fund, including the benefits of investing in a fund that is part of a large family of funds offering a variety of investment disciplines and providing a large variety of mutual fund investor services. The Board noted that Fidelity had taken, or had made recommendations that resulted in the Fidelity funds taking, a number of actions over the previous year that benefited particular funds, including (i) continuing to dedicate additional resources to investment research and to the support of the senior management team that oversees asset management; (ii) persisting in efforts to enhance Fidelity's global research capabilities; (iii) launching new funds and making other enhancements to meet client needs for income-oriented solutions; (iv) reducing fund expenses for certain index funds; (v) continuing to launch dedicated lower cost underlying funds to meet portfolio construction needs related to expanding underlying fund options for Fidelity funds of funds, specifically for the Freedom Fund product lines; (vi) rationalizing product lines and gaining increased efficiencies through fund mergers; (vii) launching sector-based exchange-traded funds and establishing a new Fidelity adviser to manage sector-based funds and products; (viii) continuing to develop and implement technology to improve security and increase efficiency; (ix) modifying the eligibility criteria for certain share classes to increase their marketability to a portion of the defined contribution plan market; (x) waiving redemption fees for certain qualified fund-of-fund and wrap programs and certain retirement plan transactions; and (xi) launching new Institutional Class shares of certain money market funds to attract and retain assets and to fill a gap in the money market fund lineup.
Annual Report
Board Approval of Investment Advisory Contracts and
Management Fees - continued
Investment Performance. The Board considered whether the fund has operated in accordance with its investment objective, as well as its record of compliance with its investment restrictions and its performance history.
The Board took into account discussions with the Investment Advisers about fund investment performance that occur at Board meetings throughout the year. In this regard the Board noted that as part of regularly scheduled fund reviews and other reports to the Board on fund performance, the Board periodically considers annualized return information for the fund, for different time periods, measured against a securities market index ("benchmark index") and a peer group of funds with similar objectives ("peer group"). In its evaluation of fund investment performance, the Board gave particular attention to information indicating changes in performance of certain Fidelity funds for specific time periods and the Investment Advisers' explanations for any overperformance or underperformance.
In addition to reviewing absolute and relative fund performance, the Independent Trustees periodically consider the appropriateness of fund performance metrics in evaluating the results achieved. In general, the Independent Trustees believe that fund performance should be evaluated based on net performance (after fees and expenses) of both the highest performing and lowest performing classes, where applicable, compared to appropriate benchmark indices, over appropriate time periods which may include full market cycles, and compared to peer groups, as applicable, over the same periods, taking into account relevant factors including the following: general market conditions; issuer-specific information; tactical opportunities for investment; and fund cash flows and other factors.
The Independent Trustees recognize that shareholders evaluate performance on a net basis over their own holding periods, for which one-, three-, and five-year periods are often used as a proxy. For this reason, the performance information reviewed by the Board also included net cumulative calendar year total return information for the fund and an appropriate benchmark index and peer group for the most recent one-year period, as shown below. Returns are shown compared to the 25th percentile (top of box, 75% beaten) and 75th percentile (bottom of box, 25% beaten) of the peer universe.
Annual Report
Fidelity Emerging Markets Discovery Fund

Based on its review, the Board concluded that the nature, extent, and quality of services provided to the fund under the Advisory Contracts should benefit the fund's shareholders.
Competitiveness of Management Fee and Total Expense Ratio. The Board considered the fund's management fee and total expense ratio compared to "mapped groups" of competitive funds and classes. Fidelity creates "mapped groups" by combining similar Lipper investment objective categories that have comparable investment mandates. Combining Lipper investment objective categories aids the Board's management fee and total expense ratio comparisons by broadening the competitive group used for comparison and by reducing the number of universes to which various Fidelity funds are compared.
Management Fee. The Board considered two proprietary management fee comparisons for the 12-month (or shorter) periods shown in the chart below. The group of Lipper funds used by the Board for management fee comparisons is referred to below as the "Total Mapped Group." The Total Mapped Group comparison focuses on a fund's standing in terms of gross management fees before expense reimbursements or caps relative to the total universe of funds with comparable investment mandates, regardless of whether their management fee structures also are comparable. Funds with comparable investment mandates offer exposure to similar types of securities. Funds with comparable management fee structures have similar management fee contractual arrangements (e.g., flat rate charged for advisory services, all-inclusive fee rate, etc.). "TMG %" represents the percentage of funds in the Total Mapped Group that had management fees that were lower than the fund's. For example, a hypothetical TMG % of 20% would mean that 80% of the funds in the Total Mapped Group had higher, and 20% had lower, management fees than the fund. The fund's actual TMG %s are in the chart below. The "Asset-Size Peer Group" (ASPG) comparison focuses on a fund's standing relative to a subset of non-Fidelity funds within the Total Mapped Group that are similar in size and management fee structure. For example, if a fund is in the first quartile of the ASPG, the fund's management fee ranks in the least expensive or lowest 25% of funds in the ASPG. The ASPG represents at least 15% of the funds in the Total Mapped Group with comparable asset size and management fee structures, subject to a minimum of 50 funds (or all funds in the Total Mapped Group if fewer than 50). Additional information, such as the ASPG quartile in which the fund's management fee rate ranked, is also included in the chart and considered by the Board.
Annual Report
Board Approval of Investment Advisory Contracts and
Management Fees - continued
Fidelity Emerging Markets Discovery Fund
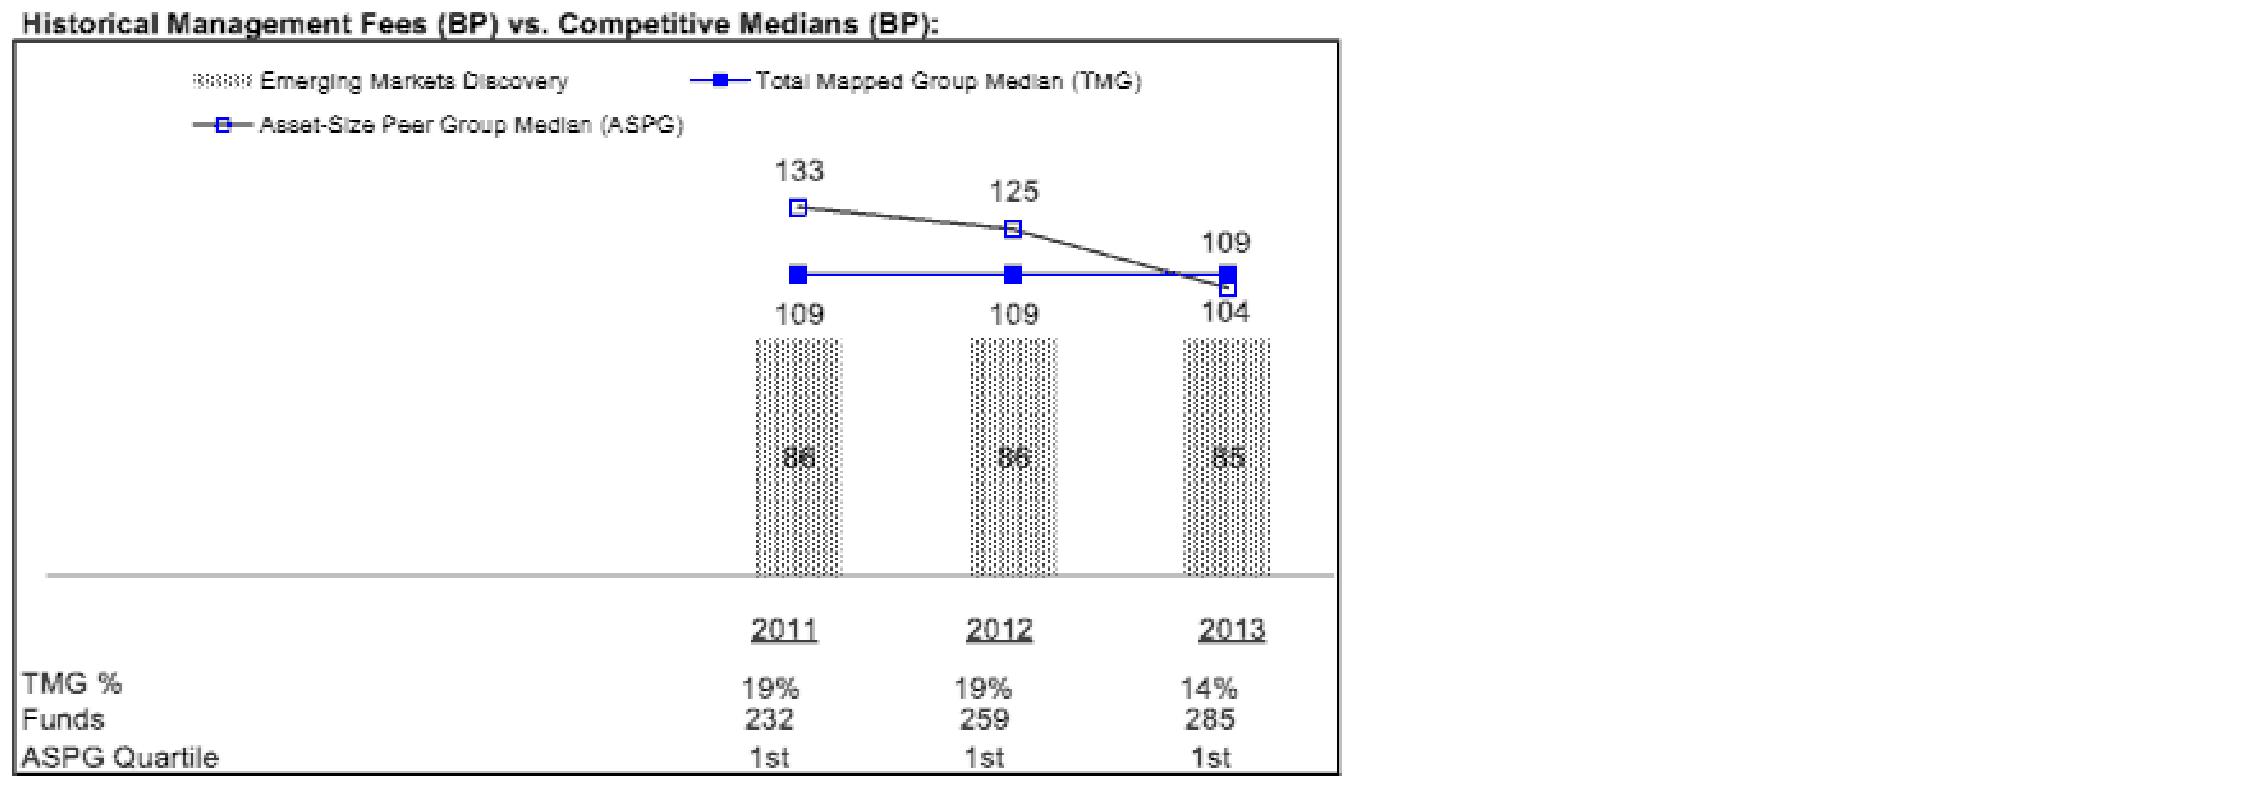
The Board noted that the fund's management fee rate ranked below the median of its Total Mapped Group and below the median of its ASPG for 2013.
The Board also noted that, in August 2013, the ad hoc Committee on Management Fees was formed to conduct an in-depth review of the management fee rates of Fidelity's active equity mutual funds. The Committee focused on the following areas: (i) standard fee structures; (ii) research consumption and trading evolution; (iii) management fee competitiveness/profitability by category; and (iv) factors that drive institutional pricing.
Based on its review, the Board concluded that the fund's management fee is fair and reasonable in light of the services that the fund receives and the other factors considered.
Annual Report
Total Expense Ratio. In its review of each class's total expense ratio the Board considered the fund's management fee as well as other fund or class expenses, as applicable, such as transfer agent fees, pricing and bookkeeping fees, fund-paid 12b-1 fees, and custodial, legal, and audit fees. The Board also noted the effects of any waivers and reimbursements on fees and expenses. As part of its review, the Board also considered the current and historical total expense ratios of each class of the fund compared to competitive fund median expenses. Each class of the fund is compared to those funds and classes in the Total Mapped Group (used by the Board for management fee comparisons) that have a similar sales load structure.
The Board noted that the total expense ratio of each of Class A and the retail class ranked equal to its competitive median for 2013 and the total expense ratio of each of Class T, Class C, and Institutional Class ranked above its competitive median for 2013. The Board considered that, in general, various factors can affect total expense ratios. The Board noted that the total expense ratio of Class T was above the competitive median primarily because of higher 12b-1 fees on Class T as compared to most competitor funds. Class T has a higher 12b-1 fee, but a lower front-end sales charge, than traditionally priced front-end sales charge classes. The Board considered that Class T is primarily sold load-waived in the retirement plan market where its 0.50% 12b-1 fee is comparable to competing no-load, higher 12b-1 fee classes designed specifically for retirement plans. The Board noted that the fund offers multiple classes, each of which has a different sales load and 12b-1 fee structure, and that the multiple structures are intended to offer a range of pricing options for the intermediary market. The Board also noted that the total expense ratios of the classes of the fund vary primarily by the level of their 12b-1 fees, although differences in transfer agent fees may also cause expenses to vary from class to class.
The Board further considered that FMR contractually agreed to reimburse Class A, Class T, Class C, Institutional Class and the retail class of the fund to the extent that total operating expenses (excluding interest, certain taxes, certain securities lending costs, brokerage commissions, extraordinary expenses, and acquired fund fees and expenses, if any), as a percentage of their respective average net assets, exceed 1.70%, 1.95%, 2.45%, 1.45%, and 1.45% through December 31, 2014.
Fees Charged to Other Fidelity Clients. The Board also considered Fidelity fee structures and other information with respect to clients of Fidelity, such as other funds advised or subadvised by Fidelity, pension plan clients, and other institutional clients. The Board noted the findings of the 2013 ad hoc joint committee (created with the board of other Fidelity funds), which reviewed and compared Fidelity's institutional investment advisory business with its business of providing services to the Fidelity funds, including the differences in services provided, fees charged, and costs incurred, as well as competition in their respective marketplaces.
Annual Report
Board Approval of Investment Advisory Contracts and
Management Fees - continued
Based on its review of total expense ratios and fees charged to other Fidelity clients, the Board concluded that the total expense ratio of each class of the fund was reasonable, although in some cases above the median of the universe presented for comparison, in light of the services that the fund and its shareholders receive and the other factors considered.
Costs of the Services and Profitability. The Board considered the revenues earned and the expenses incurred by Fidelity in conducting the business of developing, marketing, distributing, managing, administering and servicing the fund and servicing the fund's shareholders. The Board also considered the level of Fidelity's profits in respect of all the Fidelity funds.
On an annual basis, Fidelity presents to the Board Fidelity's profitability for the fund. Fidelity calculates the profitability for each fund, as well as aggregate profitability for groups of Fidelity funds and all Fidelity funds, using a series of detailed revenue and cost allocation methodologies which originate with the books and records of Fidelity on which Fidelity's audited financial statements are based. The Audit Committee of the Board reviews any significant changes from the prior year's methodologies.
PricewaterhouseCoopers LLP (PwC), independent registered public accounting firm and auditor to Fidelity and certain Fidelity funds, has been engaged annually by the Board as part of the Board's assessment of Fidelity's profitability analysis. PwC's engagement includes the review and assessment of the methodologies used by Fidelity in determining the revenues and expenses attributable to Fidelity's mutual fund business, and completion of agreed-upon procedures in respect of the mathematical accuracy of fund profitability and its conformity to established allocation methodologies. After considering PwC's reports issued under the engagement and information provided by Fidelity, the Board concluded that while other allocation methods may also be reasonable, Fidelity's profitability methodologies are reasonable in all material respects.
The Board also reviewed Fidelity's non-fund businesses and fall-out benefits related to the mutual fund business as well as cases where Fidelity's affiliates may benefit from or be related to the fund's business.
The Board considered the costs of the services provided by and the profits realized by Fidelity in connection with the operation of the fund and was satisfied that the profitability was not excessive in the circumstances.
Economies of Scale. The Board considered whether there have been economies of scale in respect of the management of the Fidelity funds, whether the Fidelity funds (including the fund) have appropriately benefited from any such economies of scale, and whether there is potential for realization of any further economies of scale. The Board considered the extent to which the fund will benefit from economies of scale through increased services to the fund, through waivers or reimbursements, or through fee or expense ratio reductions. The Board also noted that in 2013, it and the boards of other Fidelity funds created an ad hoc committee (the Economies of Scale Committee) to analyze whether Fidelity attains economies of scale in respect of the management and servicing of the Fidelity funds, whether the Fidelity funds have appropriately benefited from such economies of scale, and whether there is potential for realization of any further economies of scale.
Annual Report
The Board recognized that the fund's management contract incorporates a "group fee" structure, which provides for lower group fee rates as total group assets increase, and for higher group fee rates as total group assets decrease (with "group assets" defined to include fund assets under FMR's management plus sector fund assets previously under FMR's management and currently managed by Fidelity SelectCo, LLC). FMR calculates the group fee rates based on a tiered asset "breakpoint" schedule that varies based on asset class. The Board considered that the group fee is designed to deliver the benefits of economies of scale to fund shareholders when total Fidelity fund assets increase, even if assets of any particular fund are unchanged or have declined, because some portion of Fidelity's costs are attributable to services provided to all Fidelity funds, and all funds benefit if those costs can be allocated among more assets. The Board concluded that, given the group fee structure, fund shareholders will benefit from lower management fees as group assets increase at the fund complex level, regardless of whether Fidelity achieves any such economies of scale.
The Board concluded, taking into account the analysis of the Economies of Scale Committee, that economies of scale, if any, are being appropriately shared between fund shareholders and Fidelity.
Additional Information Requested by the Board. In order to develop fully the factual basis for consideration of the Fidelity funds' Advisory Contracts, the Board requested and received additional information on certain topics, including: (i) fund performance trends and Fidelity's long-term strategies for certain funds; (ii) the potential to further rationalize the Fidelity fund lineup with the possibility of achieving savings for the funds and Fidelity; (iii) the methodology with respect to competitive fund data and peer group classifications; (iv) the arrangements with, and performance of, certain sub-advisers on behalf of the Fidelity funds, as well as certain proposed participating affiliate arrangements; (v) the realization of fall-out benefits in certain Fidelity business units; (vi) Fidelity's group fee structures, including the rationale for the individual fee rates of certain categories of funds and the definition of group assets; (vii) trends regarding industry use of performance fee structures and the performance adjustment methodologies applicable to the Fidelity funds; (viii) additional competitive analysis regarding the total expenses for certain classes; and (ix) fund profitability methodology, including Fidelity's cost allocation methodology, and the impact of certain factors on fund profitability results.
Annual Report
Board Approval of Investment Advisory Contracts and
Management Fees - continued
Based on its evaluation of all of the conclusions noted above, and after considering all factors it believed relevant, the Board ultimately concluded that the advisory fee structures are fair and reasonable, and that the fund's Advisory Contracts should be renewed.
Annual Report
Investment Adviser
Fidelity Management & Research Company
Boston, MA
Investment Sub-Advisers
FMR Co., Inc.
Fidelity Management & Research
(U.K.) Inc.
Fidelity Management & Research
(Hong Kong) Limited
Fidelity Management & Research
(Japan) Limited
FIL Investments (Japan) Limited
FIL Investment Advisors (UK) Limited
FIL Investment Advisors
General Distributor
Fidelity Distributors Corporation
Smithfield, RI
Transfer and Service Agents
Fidelity Investments Institutional Operations Company, Inc.
Boston, MA
Fidelity Service Company, Inc.
Boston, MA
Custodian
The Northern Trust Company
Chicago, IL
(Fidelity Investment logo)(registered trademark)
AEMD-UANN-1214
1.931249.102
(Fidelity Investment logo)(registered trademark)
Fidelity Advisor®
Emerging Markets Discovery
Fund - Institutional Class
Annual Report
October 31, 2014
(Fidelity Cover Art)
Institutional Class is
a class of Fidelity®
Emerging Markets
Discovery Fund
Contents
Performance | (Click Here) | How the fund has done over time. |
Management's Discussion of Fund Performance | (Click Here) | The Portfolio Managers' review of fund performance and strategy. |
Shareholder Expense Example | (Click Here) | An example of shareholder expenses. |
Investment Changes | (Click Here) | A summary of major shifts in the fund's investments over the past six months. |
Investments | (Click Here) | A complete list of the fund's investments with their market values. |
Financial Statements | (Click Here) | Statements of assets and liabilities, operations, and changes in net assets,
as well as financial highlights. |
Notes | (Click Here) | Notes to the financial statements. |
Report of Independent Registered Public Accounting Firm | (Click Here) | |
Trustees and Officers | (Click Here) | |
Distributions | (Click Here) | |
Board Approval of Investment Advisory Contracts and Management Fees | (Click Here) | |
To view a fund's proxy voting guidelines and proxy voting record for the 12-month period ended June 30, visit http://www.fidelity.com/proxyvotingresults or visit the Securities and Exchange Commission's (SEC) web site at http://www.sec.gov. You may also call 1-877-208-0098 to request a free copy of the proxy voting guidelines.
Standard & Poor's, S&P and S&P 500 are registered service marks of The McGraw-Hill Companies, Inc. and have been licensed for use by Fidelity Distributors Corporation.
Other third-party marks appearing herein are the property of their respective owners.
All other marks appearing herein are registered or unregistered trademarks or service marks of FMR LLC or an affiliated company. © 2014 FMR LLC. All rights reserved.
Annual Report
This report and the financial statements contained herein are submitted for the general information of the shareholders of the fund. This report is not authorized for distribution to prospective investors in the fund unless preceded or accompanied by an effective prospectus.
A fund files its complete schedule of portfolio holdings with the SEC for the first and third quarters of each fiscal year on Form N-Q. Forms N-Q are available on the SEC's web site at http://www.sec.gov. A fund's Forms N-Q may be reviewed and copied at the SEC's Public Reference Room in Washington, DC. Information regarding the operation of the SEC's Public Reference Room may be obtained by calling 1-800-SEC-0330. For a complete list of a fund's portfolio holdings, view the most recent holdings listing, semiannual report, or annual report on Fidelity's web site at http://www.fidelity.com, http://www.advisor.fidelity.com, or http://www.401k.com, as applicable.
NOT FDIC INSURED • MAY LOSE VALUE • NO BANK GUARANTEE
Neither the fund nor Fidelity Distributors Corporation is a bank.
Annual Report
Average annual total return reflects the change in the value of an investment, assuming reinvestment of the class' distributions from dividend income and capital gains (the profits earned upon the sale of securities that have grown in value, if any) and assuming a constant rate of performance each year. The $10,000 table and the fund's returns do not reflect the deduction of taxes that a shareholder would pay on fund distributions or the redemption of fund shares. During periods of reimbursement by Fidelity, a fund's total return will be greater than it would be had the reimbursement not occurred. How a fund did yesterday is no guarantee of how it will do tomorrow.
Average Annual Total Returns
Periods ended October 31, 2014 | Past 1
year | Life of
fund A |
Institutional Class | 0.61% | 8.87% |
A From November 1, 2011
$10,000 Over Life of Fund
Let's say hypothetically that $10,000 was invested in Fidelity Advisor® Emerging Markets Discovery Fund - Institutional Class on November 1, 2011, when the fund started. The chart shows how the value of your investment would have changed, and also shows how the MSCI Emerging Markets SMID Cap Index performed over the same period.
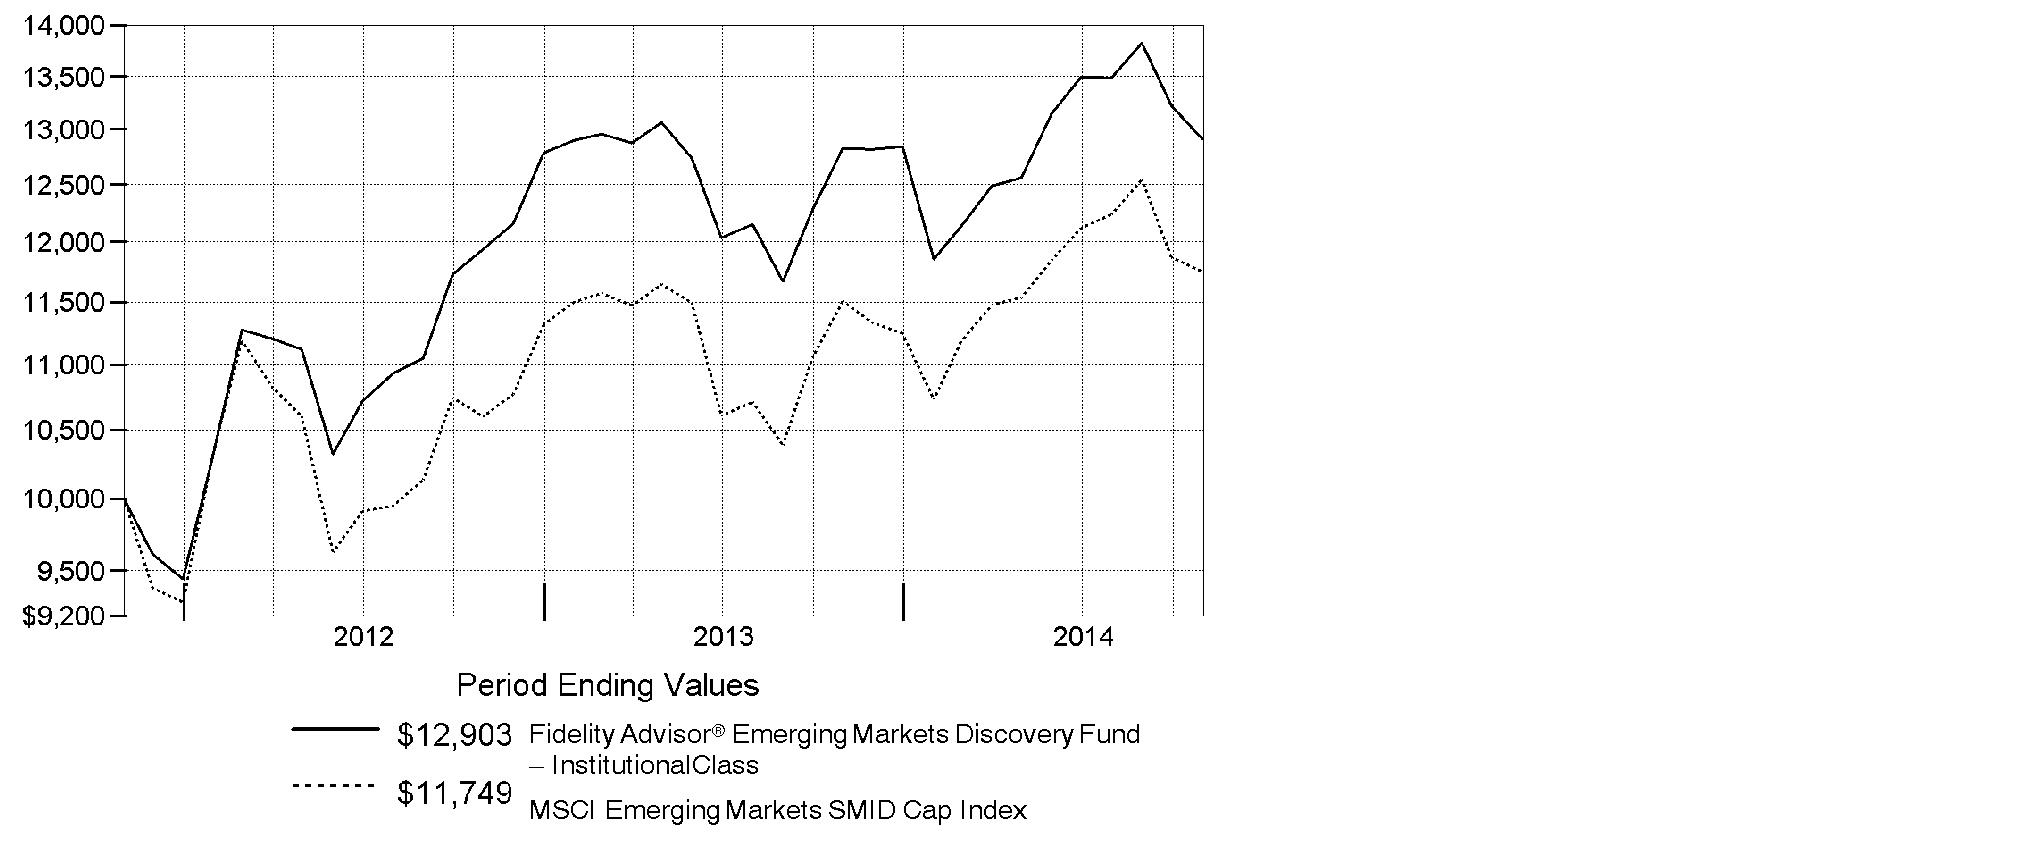
Annual Report
Market Recap: Global equities posted a healthy gain for the 12 months ending October 31, 2014, overcoming an October market decline driven by recessionary pressures in China and tepid growth in Europe. The MSCI ACWI (All Country World Index) Index rose 8.15%, helped by subdued market volatility for much of the period and supported by solid corporate earnings, especially in the United States. Stocks also benefited from easy monetary policies in Japan and the eurozone, as well as increased stimulus efforts in China. All but three of the 24 industry groups that compose the index marked a positive return. The U.S. (+17%) remained a pillar of strength, while a strongly rising dollar in the latter part of the period detracted from investors' returns in most non-U.S. markets. Canada (+5%) notched broad gains outside of its energy and materials sectors, as did Asia-Pacific ex Japan (+4%), led by investor enthusiasm for companies in India. The U.K., Europe and Japan, meanwhile, all underperformed. Among sectors, health care (+24%) led the index, with a strong contribution from the pharmaceuticals, biotechnology & life sciences industry. Information technology (+21%) also outperformed. Conversely, materials (-4%) and energy (-1%) lagged the index due to a higher supply of and lower demand for commodities.
Comments from Samuel Polyak and James Hayes, who became Co-Portfolio Managers of Fidelity Advisor® Emerging Markets Discovery Fund on June 21, 2014, as part of the Fidelity Stock Selector Emerging Markets Group: For the year, the fund's Institutional Class shares returned 0.61%, trailing the 2.14% gain of the MSCI Emerging Markets SMID Cap Index. Versus the index, stock selection was particularly challenging in South Korea, Taiwan and China. At the stock level, it hurt to have an average overweighting in South African lender African Bank Investments Limited, which suffered amid ongoing sluggishness in South Africa's credit cycle. We sold the fund's stake during the period. Taiwan-based medical equipment supplier Pacific Hospital Supply was another big relative detractor that we sold from the fund by period end. China-based oil & gas exploration & production firm Hilong Holding hurt the most, as it missed earnings expectations. Stock selection in India by far added the most value, but as a group we reduced the fund's exposure here. A non-index stake in Punjab National Bank was the top individual contributor for the period, and we sold it by period end. Other top contributors that we sold or reduced were India-based credit rating services firm Credit Analysis & Research and KEPCO Plant Services & Engineering, a South Korean company that provides maintenance and operations services for power plants.
The views expressed above reflect those of the portfolio manager(s) only through the end of the period as stated on the cover of this report and do not necessarily represent the views of Fidelity or any other person in the Fidelity organization. Any such views are subject to change at any time based upon market or other conditions and Fidelity disclaims any responsibility to update such views. These views may not be relied on as investment advice and, because investment decisions for a Fidelity fund are based on numerous factors, may not be relied on as an indication of trading intent on behalf of any Fidelity fund.
Annual Report
Fidelity Emerging Markets Discovery Fund
Shareholder Expense Example
As a shareholder of the Fund, you incur two types of costs: (1) transaction costs, including sales charges (loads) on purchase payments or redemption proceeds, redemption fees and (2) ongoing costs, including management fees, distribution and/or service (12b-1) fees and other Fund expenses. This Example is intended to help you understand your ongoing costs (in dollars) of investing in the Fund and to compare these costs with the ongoing costs of investing in other mutual funds.
The Example is based on an investment of $1,000 invested at the beginning of the period and held for the entire period (May 1, 2014 to October 31, 2014).
Actual Expenses
The first line of the accompanying table for each class of the Fund provides information about actual account values and actual expenses. You may use the information in this line, together with the amount you invested, to estimate the expenses that you paid over the period. Simply divide your account value by $1,000.00 (for example, an $8,600 account value divided by $1,000.00 = 8.6), then multiply the result by the number in the first line for a class of the Fund under the heading entitled "Expenses Paid During Period" to estimate the expenses you paid on your account during this period. A small balance maintenance fee of $12.00 that is charged once a year may apply for certain accounts with a value of less than $2,000. This fee is not included in the table below. If it was, the estimate of expenses you paid during the period would be higher, and your ending account value lower, by this amount. In addition, the Fund, as a shareholder in the underlying Fidelity Central Funds, will indirectly bear its pro-rata share of the fees and expenses incurred by the underlying Fidelity Central Funds. These fees and expenses are not included in the Fund's annualized expense ratio used to calculate the expense estimate in the table below.
Hypothetical Example for Comparison Purposes
The second line of the accompanying table for each class of the Fund provides information about hypothetical account values and hypothetical expenses based on a Class' actual expense ratio and an assumed rate of return of 5% per year before expenses, which is not the Class' actual return. The hypothetical account values and expenses may not be used to estimate the actual ending account balance or expenses you paid for the period. You may use this information to compare the ongoing costs of investing in the Fund and other funds. To do so, compare this 5% hypothetical example with the 5% hypothetical examples that appear in the shareholder reports of the other funds. A small balance maintenance fee of $12.00 that is charged once a year may apply for certain accounts with a value of less than $2,000. This fee is not included in the table below. If it was, the estimate of expenses you paid during the period would be higher, and your ending account value lower, by this amount. In addition, the Fund, as a shareholder in the underlying Fidelity Central Funds, will indirectly bear its pro-rata share of the fees and expenses incurred by the underlying Fidelity Central Funds. These fees and expenses are not included in the Fund's annualized expense ratio used to calculate the expense estimate in the table below.
Please note that the expenses shown in the table are meant to highlight your ongoing costs only and do not reflect any transaction costs. Therefore, the second line of the table is useful in comparing ongoing costs only, and will not help you determine the relative total costs of owning different funds. In addition, if these transactional costs were included, your costs would have been higher.
Annual Report
Shareholder Expense Example - continued
| Annualized
Expense RatioB | Beginning
Account Value
May 1, 2014 | Ending
Account Value
October 31, 2014 | Expenses Paid
During Period*
May 1, 2014
to October 31, 2014 |
Class A | 1.70% | | | |
Actual | | $ 1,000.00 | $ 1,026.10 | $ 8.68 |
HypotheticalA | | $ 1,000.00 | $ 1,016.64 | $ 8.64 |
Class T | 1.95% | | | |
Actual | | $ 1,000.00 | $ 1,024.50 | $ 9.95 |
HypotheticalA | | $ 1,000.00 | $ 1,015.38 | $ 9.91 |
Class C | 2.45% | | | |
Actual | | $ 1,000.00 | $ 1,022.10 | $ 12.49 |
HypotheticalA | | $ 1,000.00 | $ 1,012.85 | $ 12.43 |
Emerging Markets Discovery | 1.45% | | | |
Actual | | $ 1,000.00 | $ 1,027.80 | $ 7.41 |
HypotheticalA | | $ 1,000.00 | $ 1,017.90 | $ 7.38 |
Institutional Class | 1.45% | | | |
Actual | | $ 1,000.00 | $ 1,027.70 | $ 7.41 |
HypotheticalA | | $ 1,000.00 | $ 1,017.90 | $ 7.38 |
A 5% return per year before expenses
B Annualized expense ratio reflects expenses net of applicable fee waivers.
* Expenses are equal to each Class' annualized expense ratio, multiplied by the average account value over the period, multiplied by 184/365 (to reflect the one-half year period).
Annual Report
Fidelity Emerging Markets Discovery Fund
Investment Changes (Unaudited)
Top Five Stocks as of October 31, 2014 |
| % of fund's
net assets | % of fund's net assets
6 months ago |
Quinenco SA (Chile, Industrial Conglomerates) | 2.0 | 1.2 |
Daewoo International Corp. (Korea (South), Trading Companies & Distributors) | 2.0 | 0.0 |
Techtronic Industries Co. Ltd. (Hong Kong, Household Durables) | 1.9 | 0.6 |
Yes Bank Ltd. (India, Banks) | 1.6 | 0.0 |
Robinsons Land Corp. (Philippines, Real Estate Management & Development) | 1.6 | 0.0 |
| 9.1 | |
Top Five Market Sectors as of October 31, 2014 |
| % of fund's
net assets | % of fund's net assets
6 months ago |
Financials | 18.2 | 15.9 |
Industrials | 17.4 | 20.6 |
Consumer Discretionary | 16.9 | 16.8 |
Information Technology | 13.4 | 13.4 |
Materials | 9.8 | 3.1 |
Top Five Countries as of October 31, 2014 |
(excluding cash equivalents) | % of fund's
net assets | % of fund's net assets
6 months ago |
India | 14.9 | 20.3 |
Korea (South) | 14.1 | 14.8 |
Cayman Islands | 14.1 | 10.7 |
Brazil | 7.1 | 2.4 |
Taiwan | 6.4 | 16.6 |
Percentages are adjusted for the effect of open futures contracts, if applicable. |
Asset Allocation (% of fund's net assets) |
As of October 31, 2014 | As of April 30, 2014 |
 | Stocks 94.9% | | | Stocks 97.9% | |
 | Short-Term
Investments and
Net Other Assets (Liabilities) 5.1% | | | Short-Term
Investments and
Net Other Assets (Liabilities) 2.1% | |

Annual Report
Fidelity Emerging Markets Discovery Fund
Investments October 31, 2014
Showing Percentage of Net Assets
Common Stocks - 89.6% |
| Shares | | Value |
Argentina - 0.4% |
Inversiones y Representaciones SA ADR | 26,400 | | $ 388,872 |
Bermuda - 4.6% |
Aquarius Platinum Ltd. (Australia) (a) | 2,369,945 | | 644,999 |
ChipMOS TECHNOLOGIES (Bermuda) Ltd. | 28,000 | | 601,440 |
Shangri-La Asia Ltd. | 660,000 | | 958,323 |
Vtech Holdings Ltd. | 50,100 | | 630,424 |
Yue Yuen Industrial (Holdings) Ltd. | 359,000 | | 1,205,158 |
TOTAL BERMUDA | | 4,040,344 |
Brazil - 2.3% |
Cosan SA Industria e Comercio | 20,900 | | 291,751 |
Localiza Rent A Car SA | 4,500 | | 64,869 |
Mills Estruturas e Servicos de Engenharia SA | 9,900 | | 64,524 |
Minerva SA (a) | 169,400 | | 871,645 |
QGEP Participacoes SA | 18,400 | | 66,905 |
Qualicorp SA (a) | 64,200 | | 652,908 |
TOTAL BRAZIL | | 2,012,602 |
British Virgin Islands - 0.7% |
Luxoft Holding, Inc. (a) | 15,500 | | 619,845 |
Canada - 1.0% |
Pan American Silver Corp. | 53,100 | | 490,113 |
Torex Gold Resources, Inc. (a) | 343,100 | | 365,308 |
TOTAL CANADA | | 855,421 |
Cayman Islands - 14.1% |
58.com, Inc. ADR (d) | 20,100 | | 795,357 |
Anta Sports Products Ltd. | 288,000 | | 565,283 |
China Cord Blood Corp. (a) | 125,200 | | 637,268 |
China Lodging Group Ltd. ADR (a) | 44,200 | | 1,215,058 |
China ZhengTong Auto Services Holdings Ltd. | 1,247,000 | | 706,427 |
Cimc Enric Holdings Ltd. | 714,000 | | 718,002 |
Greatview Aseptic Pack Co. Ltd. | 394,000 | | 259,380 |
Haitian International Holdings Ltd. | 350,000 | | 750,777 |
Hilong Holding Ltd. | 1,463,000 | | 475,375 |
Lee & Man Paper Manufacturing Ltd. | 1,307,000 | | 717,250 |
Lee's Pharmaceutical Holdings Ltd. | 430,500 | | 592,480 |
Leju Holdings Ltd. ADR (d) | 29,800 | | 417,200 |
Pico Far East Holdings Ltd. | 2,778,000 | | 687,969 |
Semiconductor Manufacturing International Corp. (a) | 6,178,000 | | 640,516 |
Silergy Corp. | 56,520 | | 391,373 |
SITC International Holdings Co. Ltd. | 1,888,000 | | 1,005,734 |
Common Stocks - continued |
| Shares | | Value |
Cayman Islands - continued |
Uni-President China Holdings Ltd. | 1,057,000 | | $ 982,132 |
Wisdom Holdings Group | 935,000 | | 723,655 |
TOTAL CAYMAN ISLANDS | | 12,281,236 |
Chile - 4.1% |
Embotelladora Andina SA sponsored ADR | 21,053 | | 391,796 |
Inversiones La Construccion SA | 66,001 | | 940,545 |
Quinenco SA | 852,780 | | 1,771,009 |
Vina Concha y Toro SA | 242,484 | | 463,628 |
TOTAL CHILE | | 3,566,978 |
China - 2.6% |
BBMG Corp. (H Shares) | 1,315,500 | | 930,206 |
China Suntien Green Energy Corp. Ltd. (H Shares) | 890,000 | | 236,386 |
Maanshan Iron & Steel Ltd. (H Shares) (a) | 2,064,000 | | 538,180 |
Tong Ren Tang Technologies Co. Ltd. (H Shares) | 441,000 | | 592,624 |
TOTAL CHINA | | 2,297,396 |
Colombia - 0.5% |
Organizacion Terpel SA (a) | 45,114 | | 393,802 |
Egypt - 0.9% |
Citadel Capital Corp. (a) | 1,411,500 | | 781,748 |
Greece - 0.4% |
Public Power Corp. of Greece (a) | 41,680 | | 316,522 |
Hong Kong - 3.1% |
China Power International Development Ltd. | 568,000 | | 256,578 |
Far East Horizon Ltd. | 834,000 | | 775,668 |
Techtronic Industries Co. Ltd. | 527,500 | | 1,651,393 |
TOTAL HONG KONG | | 2,683,639 |
India - 14.9% |
Adani Ports & Special Economic Zone | 146,053 | | 678,875 |
CMC Ltd. | 27,927 | | 893,604 |
Exide Industries Ltd. | 370,061 | | 948,772 |
GAIL India Ltd. | 64,387 | | 553,403 |
Grasim Industries Ltd. | 15,189 | | 911,465 |
Havells India Ltd. | 181,890 | | 845,935 |
IDFC Ltd. (a) | 199,271 | | 518,543 |
Iifl Holdings Ltd. | 239,330 | | 666,664 |
Ipca Laboratories Ltd. | 49,210 | | 587,543 |
JK Cement Ltd. | 57,507 | | 564,863 |
KPIT Cummins Infosystems Ltd. (a) | 230,698 | | 623,144 |
Common Stocks - continued |
| Shares | | Value |
India - continued |
Lupin Ltd. | 29,712 | | $ 687,933 |
Mahindra Lifespace Developers Ltd. | 75,033 | | 623,350 |
MindTree Consulting Ltd. | 22,113 | | 393,741 |
Shriram Transport Finance Co. Ltd. | 36,068 | | 557,960 |
Tech Mahindra Ltd. | 23,911 | | 980,154 |
The Jammu & Kashmir Bank Ltd. | 237,424 | | 537,872 |
Yes Bank Ltd. | 126,518 | | 1,432,651 |
TOTAL INDIA | | 13,006,472 |
Israel - 1.2% |
Bezeq The Israel Telecommunication Corp. Ltd. | 334,300 | | 565,164 |
NICE Systems Ltd. sponsored ADR | 12,800 | | 520,704 |
TOTAL ISRAEL | | 1,085,868 |
Korea (South) - 13.6% |
AMOREPACIFIC Group, Inc. | 860 | | 946,889 |
Binggrea Co. Ltd. | 5,675 | | 436,805 |
Daewoo International Corp. | 54,893 | | 1,729,384 |
DGB Financial Group Co. Ltd. | 73,881 | | 1,048,621 |
E-Mart Co. Ltd. | 3,822 | | 704,323 |
Fila Korea Ltd. | 11,372 | | 1,180,124 |
Hyundai HCN | 91,864 | | 388,593 |
Hyundai Industrial Development & Construction Co. | 27,329 | | 1,026,321 |
Hyundai Wia Corp. | 4,303 | | 738,896 |
KEPCO Plant Service & Engineering Co. Ltd. | 9,301 | | 759,181 |
Kolon Life Science, Inc. | 9,808 | | 469,201 |
Korean Reinsurance Co. | 110,469 | | 1,172,090 |
Leeno Industrial, Inc. | 18,227 | | 721,823 |
Sungshin Cement Manufacturing Co. Ltd. (a) | 69,388 | | 530,204 |
TOTAL KOREA (SOUTH) | | 11,852,455 |
Malaysia - 0.7% |
Top Glove Corp. Bhd | 409,700 | | 609,287 |
Mexico - 5.1% |
Credito Real S.A.B. de CV | 248,500 | | 638,862 |
Grupo Aeroportuario del Pacifico SA de CV Series B | 73,900 | | 502,792 |
Grupo Aeroportuario Norte S.A.B. de CV | 100,300 | | 499,703 |
Grupo Comercial Chedraui S.A.B. de CV | 158,800 | | 558,608 |
Macquarie Mexican (REIT) | 452,700 | | 822,281 |
Megacable Holdings S.A.B. de CV unit | 180,400 | | 826,427 |
Qualitas Controladora S.A.B. de CV | 238,700 | | 617,389 |
TOTAL MEXICO | | 4,466,062 |
Common Stocks - continued |
| Shares | | Value |
Nigeria - 1.6% |
Transnational Corp. of Nigeria PLC | 18,107,275 | | $ 441,614 |
Zenith Bank PLC | 7,682,382 | | 983,196 |
TOTAL NIGERIA | | 1,424,810 |
Panama - 0.5% |
Copa Holdings SA Class A | 3,600 | | 420,912 |
Philippines - 4.0% |
Alliance Global Group, Inc. | 1,642,600 | | 923,896 |
LT Group, Inc. | 2,559,600 | | 810,291 |
PNOC Energy Development Corp. | 2,149,700 | | 368,042 |
Robinsons Land Corp. | 2,454,500 | | 1,340,007 |
TOTAL PHILIPPINES | | 3,442,236 |
Poland - 1.3% |
Cyfrowy Polsat SA | 144,100 | | 1,102,145 |
Singapore - 0.5% |
First Resources Ltd. | 272,000 | | 440,663 |
South Africa - 1.1% |
Alexander Forbes Group Holding (a) | 529,819 | | 413,105 |
Blue Label Telecoms Ltd. | 572,100 | | 505,721 |
TOTAL SOUTH AFRICA | | 918,826 |
Sri Lanka - 0.9% |
John Keells Holdings Ltd. | 378,368 | | 744,150 |
Taiwan - 6.4% |
ASPEED Tech, Inc. | 5,902 | | 45,049 |
Chicony Electronics Co. Ltd. | 207,120 | | 595,521 |
Chroma ATE, Inc. | 359,000 | | 894,105 |
Cleanaway Co. Ltd. | 123,000 | | 545,948 |
Cub Elecparts, Inc. | 57,000 | | 600,398 |
EPISTAR Corp. | 216,000 | | 389,985 |
Everlight Electronics Co. Ltd. | 208,000 | | 394,031 |
GeoVision, Inc. | 8,300 | | 30,142 |
Lextar Electronics Corp. | 361,000 | | 300,830 |
MJC Probe, Inc. | 172,000 | | 513,350 |
St.Shine Optical Co. Ltd. | 31,000 | | 543,757 |
Taiwan Fertilizer Co. Ltd. | 3,000 | | 5,314 |
Universal Cement Corp. | 125,000 | | 109,865 |
Voltronic Power Technology Corp. | 69,000 | | 556,366 |
TOTAL TAIWAN | | 5,524,661 |
Common Stocks - continued |
| Shares | | Value |
Thailand - 0.6% |
Thai Union Frozen Products PCL (For. Reg.) | 232,400 | | $ 531,392 |
Turkey - 1.8% |
Aksa Akrilik Kimya Sanayii | 176,518 | | 580,544 |
Aselsan A/S | 30,000 | | 136,324 |
Aygaz A/S | 77,000 | | 324,608 |
Tupras Turkiye Petrol Rafinelleri A/S | 24,000 | | 521,000 |
TOTAL TURKEY | | 1,562,476 |
Uganda - 0.5% |
Umeme Ltd. | 2,130,383 | | 401,662 |
Vietnam - 0.2% |
FTP Corp. | 67,000 | | 160,573 |
TOTAL COMMON STOCKS (Cost $76,358,182) |
77,933,055
|
Nonconvertible Preferred Stocks - 5.3% |
| | | |
Brazil - 4.8% |
Banco do Estado Rio Grande do Sul SA | 151,800 | | 906,671 |
Bradespar SA (PN) | 108,900 | | 735,698 |
Braskem SA (PN-A) | 140,700 | | 1,029,457 |
Marcopolo SA (PN) | 425,700 | | 728,426 |
Metalurgica Gerdau SA (PN) | 150,300 | | 812,793 |
TOTAL BRAZIL | | 4,213,045 |
Korea (South) - 0.5% |
Samsung Fire & Marine Insurance Co. Ltd. | 2,451 | | 461,938 |
TOTAL NONCONVERTIBLE PREFERRED STOCKS (Cost $4,838,768) |
4,674,983
|
Money Market Funds - 7.3% |
| Shares | | Value |
Fidelity Cash Central Fund, 0.11% (b) | 5,332,684 | | $ 5,332,684 |
Fidelity Securities Lending Cash Central Fund, 0.11% (b)(c) | 1,002,600 | | 1,002,600 |
TOTAL MONEY MARKET FUNDS (Cost $6,335,284) |
6,335,284
|
TOTAL INVESTMENT PORTFOLIO - 102.2% (Cost $87,532,234) | | 88,943,322 |
NET OTHER ASSETS (LIABILITIES) - (2.2)% | | (1,942,286) |
NET ASSETS - 100% | $ 87,001,036 |
Legend |
(a) Non-income producing |
(b) Affiliated fund that is generally available only to investment companies and other accounts managed by Fidelity Investments. The rate quoted is the annualized seven-day yield of the fund at period end. A complete unaudited listing of the fund's holdings as of its most recent quarter end is available upon request. In addition, each Fidelity Central Fund's financial statements, which are not covered by the Fund's Report of Independent Registered Public Accounting Firm, are available on the SEC's website or upon request. |
(c) Investment made with cash collateral received from securities on loan. |
(d) Security or a portion of the security is on loan at period end. |
Affiliated Central Funds |
Information regarding fiscal year to date income earned by the Fund from investments in Fidelity Central Funds is as follows: |
Fund | Income earned |
Fidelity Cash Central Fund | $ 2,220 |
Fidelity Securities Lending Cash Central Fund | 22,418 |
Total | $ 24,638 |
Other Information |
Categorizations in the Schedule of Investments are based on country or territory of incorporation. |
The following is a summary of the inputs used, as of October 31, 2014, involving the Fund's assets and liabilities carried at fair value. The inputs or methodology used for valuing securities may not be an indication of the risk associated with investing in those securities. For more information on valuation inputs, and their aggregation into the levels used in the table below, please refer to the Investment Valuation section in the accompanying Notes to Financial Statements. |
Valuation Inputs at Reporting Date: |
Description | Total | Level 1 | Level 2 | Level 3 |
Investments in Securities: | | | | |
Equities: | | | | |
Consumer Discretionary | $ 14,472,967 | $ 6,425,589 | $ 8,047,378 | $ - |
Consumer Staples | 7,138,172 | 4,373,694 | 2,764,478 | - |
Energy | 1,591,417 | 879,656 | 711,761 | - |
Financials | 16,069,647 | 9,616,932 | 6,452,715 | - |
Health Care | 5,373,001 | 1,759,377 | 3,613,624 | - |
Industrials | 14,978,849 | 8,953,316 | 6,025,533 | - |
Information Technology | 11,552,911 | 3,836,942 | 7,715,969 | - |
Materials | 8,645,095 | 3,963,573 | 4,681,522 | - |
Telecommunication Services | 565,164 | 565,164 | - | - |
Utilities | 2,220,815 | 1,042,792 | 1,178,023 | - |
Money Market Funds | 6,335,284 | 6,335,284 | - | - |
Total Investments in Securities: | $ 88,943,322 | $ 47,752,319 | $ 41,191,003 | $ - |
The following is a summary of transfers between Level 1 and Level 2 for the period ended October 31, 2014. Transfers are assumed to have occurred at the beginning of the period, and are primarily attributable to the valuation techniques used for foreign equity securities, as discussed in the accompanying Notes to Financial Statements: |
Transfers | Total |
Level 1 to Level 2 | $ 10,239,253 |
Level 2 to Level 1 | $ 0 |
See accompanying notes which are an integral part of the financial statements.
Annual Report
Fidelity Emerging Markets Discovery Fund
Statement of Assets and Liabilities
| October 31, 2014 |
| | |
Assets | | |
Investment in securities, at value (including securities loaned of $1,014,000) - See accompanying schedule: Unaffiliated issuers (cost $81,196,950) | $ 82,608,038 | |
Fidelity Central Funds (cost $6,335,284) | 6,335,284 | |
Total Investments (cost $87,532,234) | | $ 88,943,322 |
Foreign currency held at value (cost $379,716) | | 380,018 |
Receivable for investments sold | | 2,029,733 |
Receivable for fund shares sold | | 98,495 |
Dividends receivable | | 95,704 |
Distributions receivable from Fidelity Central Funds | | 1,203 |
Prepaid expenses | | 349 |
Receivable from investment adviser for expense reductions | | 17,421 |
Other receivables | | 7,744 |
Total assets | | 91,573,989 |
| | |
Liabilities | | |
Payable to custodian bank | $ 249,833 | |
Payable for investments purchased | 2,581,166 | |
Payable for fund shares redeemed | 267,767 | |
Accrued management fee | 62,215 | |
Distribution and service plan fees payable | 3,392 | |
Other affiliated payables | 20,166 | |
Other payables and accrued expenses | 385,814 | |
Collateral on securities loaned, at value | 1,002,600 | |
Total liabilities | | 4,572,953 |
| | |
Net Assets | | $ 87,001,036 |
Net Assets consist of: | | |
Paid in capital | | $ 86,500,569 |
Undistributed net investment income | | 174 |
Accumulated undistributed net realized gain (loss) on investments and foreign currency transactions | | (616,536) |
Net unrealized appreciation (depreciation) on investments and assets and liabilities in foreign currencies | | 1,116,829 |
Net Assets | | $ 87,001,036 |
See accompanying notes which are an integral part of the financial statements.
Annual Report
Fidelity Emerging Markets Discovery Fund
Financial Statements - continued
Statement of Assets and Liabilities - continued
| October 31, 2014 |
| | |
Calculation of Maximum Offering Price Class A:
Net Asset Value and redemption price per share ($4,361,655 ÷ 358,373 shares) | | $ 12.17 |
| | |
Maximum offering price per share (100/94.25 of $12.17) | | $ 12.91 |
Class T:
Net Asset Value and redemption price per share ($2,031,326 ÷ 167,417 shares) | | $ 12.13 |
| | |
Maximum offering price per share (100/96.50 of $12.13) | | $ 12.57 |
Class C:
Net Asset Value and offering price per share ($1,750,148 ÷ 145,834 shares)A | | $ 12.00 |
| | |
Emerging Markets Discovery:
Net Asset Value, offering price and redemption price per share ($78,377,207 ÷ 6,418,342 shares) | | $ 12.21 |
| | |
Institutional Class:
Net Asset Value, offering price and redemption price per share ($480,700 ÷ 39,252 shares) | | $ 12.25 |
A Redemption price per share is equal to net asset value less any applicable contingent deferred sales charge.
See accompanying notes which are an integral part of the financial statements.
Annual Report
Statement of Operations
| Year ended October 31, 2014 |
| | |
Investment Income | | |
Dividends | | $ 1,943,273 |
Income from Fidelity Central Funds | | 24,638 |
Income before foreign taxes withheld | | 1,967,911 |
Less foreign taxes withheld | | (149,221) |
Total income | | 1,818,690 |
| | |
Expenses | | |
Management fee | $ 778,418 | |
Transfer agent fees | 203,003 | |
Distribution and service plan fees | 41,075 | |
Accounting and security lending fees | 47,524 | |
Custodian fees and expenses | 164,899 | |
Independent trustees' compensation | 381 | |
Registration fees | 65,316 | |
Audit | 88,577 | |
Legal | 349 | |
Interest | 79 | |
Miscellaneous | 16,702 | |
Total expenses before reductions | 1,406,323 | |
Expense reductions | (39,275) | 1,367,048 |
Net investment income (loss) | | 451,642 |
Realized and Unrealized Gain (Loss) Net realized gain (loss) on: | | |
Investment securities: | | |
Unaffiliated issuers (net of foreign taxes of $963,357) | (205,589) | |
Foreign currency transactions | (44,609) | |
Total net realized gain (loss) | | (250,198) |
Change in net unrealized appreciation (depreciation) on: Investment securities (net of increase in deferred foreign taxes of $59,002) | (686,710) | |
Assets and liabilities in foreign currencies | (15,113) | |
Total change in net unrealized appreciation (depreciation) | | (701,823) |
Net gain (loss) | | (952,021) |
Net increase (decrease) in net assets resulting from operations | | $ (500,379) |
See accompanying notes which are an integral part of the financial statements.
Annual Report
Fidelity Emerging Markets Discovery Fund
Financial Statements - continued
Statement of Changes in Net Assets
| Year ended
October 31,
2014 | Year ended
October 31,
2013 |
Increase (Decrease) in Net Assets | | |
Operations | | |
Net investment income (loss) | $ 451,642 | $ 931,481 |
Net realized gain (loss) | (250,198) | 2,316,300 |
Change in net unrealized appreciation (depreciation) | (701,823) | (864,876) |
Net increase (decrease) in net assets resulting
from operations | (500,379) | 2,382,905 |
Distributions to shareholders from net investment income | (676,480) | (286,293) |
Distributions to shareholders from net realized gain | (2,520,609) | (914,866) |
Total distributions | (3,197,089) | (1,201,159) |
Share transactions - net increase (decrease) | (16,216,808) | 59,689,170 |
Redemption fees | 46,780 | 191,734 |
Total increase (decrease) in net assets | (19,867,496) | 61,062,650 |
| | |
Net Assets | | |
Beginning of period | 106,868,532 | 45,805,882 |
End of period (including undistributed net investment income of $174 and undistributed net investment income of $648,420, respectively) | $ 87,001,036 | $ 106,868,532 |
See accompanying notes which are an integral part of the financial statements.
Annual Report
Financial Highlights - Class A
Years ended October 31, | 2014 | 2013 | 2012 F |
Selected Per-Share Data | | | |
Net asset value, beginning of period | $ 12.49 | $ 11.89 | $ 10.00 |
Income from Investment Operations | | | |
Net investment income (loss) C | .04 | .08 | .12 |
Net realized and unrealized gain (loss) | (.01) | .75 | 1.76 |
Total from investment operations | .03 | .83 | 1.88 |
Distributions from net investment income | (.06) | (.04) | (.01) |
Distributions from net realized gain | (.30) | (.20) | - |
Total distributions | (.36) | (.25) H | (.01) |
Redemption fees added to paid in capital C | .01 | .02 | .02 |
Net asset value, end of period | $ 12.17 | $ 12.49 | $ 11.89 |
Total ReturnA, B | .31% | 7.20% | 19.00% |
Ratios to Average Net Assets D, G | | | |
Expenses before reductions | 1.82% | 1.87% | 3.49% |
Expenses net of fee waivers, if any | 1.70% | 1.70% | 1.70% |
Expenses net of all reductions | 1.70% | 1.64% | 1.64% |
Net investment income (loss) | .29% | .62% | 1.16% |
Supplemental Data | | | |
Net assets, end of period (000 omitted) | $ 4,362 | $ 5,065 | $ 1,671 |
Portfolio turnover rate E | 148% | 179% | 83% |
A Total returns would have been lower if certain expenses had not been reduced during the applicable periods shown.
B Total returns do not include the effect of the sales charges.
C Calculated based on average shares outstanding during the period.
D Fees and expenses of any underlying Fidelity Central Funds are not included in the Fund's expense ratio. The Fund indirectly bears its proportionate share of the expenses of any underlying Fidelity Central Funds.
E Amount does not include the portfolio activity of any underlying Fidelity Central Funds.
F For the period November 1, 2011 (commencement of operations) to October 31, 2012.
G Expense ratios reflect operating expenses of the class. Expenses before reductions do not reflect amounts reimbursed by the investment adviser or reductions from brokerage service arrangements or reductions from other expense offset arrangements and do not represent the amount paid by the class during periods when reimbursements or reductions occur. Expense ratios before reductions for start-up periods may not be representative of longer-term operating periods. Expenses net of fee waivers reflect expenses after reimbursement by the investment adviser but prior to reductions from brokerage service arrangements or other expense offset arrangements. Expenses net of all reductions represent the net expenses paid by the class.
H Total distributions of $.25 per share is comprised of distributions from net investment income of $.044 and distributions from net realized gain of $.203 per share.
See accompanying notes which are an integral part of the financial statements.
Annual Report
Financial Highlights - Class T
Years ended October 31, | 2014 | 2013 | 2012 F |
Selected Per-Share Data | | | |
Net asset value, beginning of period | $ 12.44 | $ 11.87 | $ 10.00 |
Income from Investment Operations | | | |
Net investment income (loss) C | - H | .05 | .10 |
Net realized and unrealized gain (loss) | - H | .74 | 1.75 |
Total from investment operations | - H | .79 | 1.85 |
Distributions from net investment income | (.02) | (.03) | - H |
Distributions from net realized gain | (.30) | (.20) | - |
Total distributions | (.32) | (.24) I | - H |
Redemption fees added to paid in capital C | .01 | .02 | .02 |
Net asset value, end of period | $ 12.13 | $ 12.44 | $ 11.87 |
Total ReturnA, B | .05% | 6.87% | 18.75% |
Ratios to Average Net Assets D, G | | | |
Expenses before reductions | 2.10% | 2.19% | 3.77% |
Expenses net of fee waivers, if any | 1.95% | 1.95% | 1.95% |
Expenses net of all reductions | 1.95% | 1.89% | 1.89% |
Net investment income (loss) | .04% | .37% | .91% |
Supplemental Data | | | |
Net assets, end of period (000 omitted) | $ 2,031 | $ 1,914 | $ 1,700 |
Portfolio turnover rateE | 148% | 179% | 83% |
A Total returns would have been lower if certain expenses had not been reduced during the applicable periods shown.
B Total returns do not include the effect of the sales charges.
C Calculated based on average shares outstanding during the period.
D Fees and expenses of any underlying Fidelity Central Funds are not included in the Fund's expense ratio. The Fund indirectly bears its proportionate share of the expenses of any underlying Fidelity Central Funds.
E Amount does not include the portfolio activity of any underlying Fidelity Central Funds.
F For the period November 1, 2011 (commencement of operations) to October 31, 2012.
G Expense ratios reflect operating expenses of the class. Expenses before reductions do not reflect amounts reimbursed by the investment adviser or reductions from brokerage service arrangements or reductions from other expense offset arrangements and do not represent the amount paid by the class during periods when reimbursements or reductions occur. Expense ratios before reductions for start-up periods may not be representative of longer-term operating periods. Expenses net of fee waivers reflect expenses after reimbursement by the investment adviser but prior to reductions from brokerage service arrangements or other expense offset arrangements. Expenses net of all reductions represent the net expenses paid by the class.
H Amount represents less than $.01 per share.
I Total distributions of $.24 per share is comprised of distributions from net investment income of $.034 and distributions from net realized gain of $.203 per share.
See accompanying notes which are an integral part of the financial statements.
Annual Report
Financial Highlights - Class C
Years ended October 31, | 2014 | 2013 | 2012 F |
Selected Per-Share Data | | | |
Net asset value, beginning of period | $ 12.35 | $ 11.82 | $ 10.00 |
Income from Investment Operations | | | |
Net investment income (loss) C | (.06) | (.02) | .04 |
Net realized and unrealized gain (loss) | - H | .74 | 1.76 |
Total from investment operations | (.06) | .72 | 1.80 |
Distributions from net investment income | - | (.01) | - |
Distributions from net realized gain | (.30) | (.20) | - |
Total distributions | (.30) | (.21) | - |
Redemption fees added to paid in capital C | .01 | .02 | .02 |
Net asset value, end of period | $ 12.00 | $ 12.35 | $ 11.82 |
Total ReturnA, B | (.42)% | 6.32% | 18.20% |
Ratios to Average Net Assets D, G | | | |
Expenses before reductions | 2.58% | 2.70% | 4.32% |
Expenses net of fee waivers, if any | 2.45% | 2.45% | 2.45% |
Expenses net of all reductions | 2.45% | 2.39% | 2.39% |
Net investment income (loss) | (.46)% | (.13)% | .41% |
Supplemental Data | | | |
Net assets, end of period (000 omitted) | $ 1,750 | $ 2,082 | $ 1,474 |
Portfolio turnover rateE | 148% | 179% | 83% |
A Total returns would have been lower if certain expenses had not been reduced during the applicable periods shown.
B Total returns do not include the effect of the contingent deferred sales charge.
C Calculated based on average shares outstanding during the period.
D Fees and expenses of any underlying Fidelity Central Funds are not included in the Fund's expense ratio. The Fund indirectly bears its proportionate share of the expenses of any underlying Fidelity Central Funds.
E Amount does not include the portfolio activity of any underlying Fidelity Central Funds.
F For the period November 1, 2011 (commencement of operations) to October 31, 2012.
G Expense ratios reflect operating expenses of the class. Expenses before reductions do not reflect amounts reimbursed by the investment adviser or reductions from brokerage service arrangements or reductions from other expense offset arrangements and do not represent the amount paid by the class during periods when reimbursements or reductions occur. Expense ratios before reductions for start-up periods may not be representative of longer-term operating periods. Expenses net of fee waivers reflect expenses after reimbursement by the investment adviser but prior to reductions from brokerage service arrangements or other expense offset arrangements. Expenses net of all reductions represent the net expenses paid by the class.
H Amount represents less than $.01 per share.
See accompanying notes which are an integral part of the financial statements.
Annual Report
Financial Highlights - Emerging Markets Discovery
Years ended October 31, | 2014 | 2013 | 2012 E |
Selected Per-Share Data | | | |
Net asset value, beginning of period | $ 12.52 | $ 11.92 | $ 10.00 |
Income from Investment Operations | | | |
Net investment income (loss) B | .07 | .11 | .15 |
Net realized and unrealized gain (loss) | - G | .74 | 1.76 |
Total from investment operations | .07 | .85 | 1.91 |
Distributions from net investment income | (.09) | (.07) | (.01) |
Distributions from net realized gain | (.30) | (.20) | - |
Total distributions | (.39) | (.27) | (.01) |
Redemption fees added to paid in capital B | .01 | .02 | .02 |
Net asset value, end of period | $ 12.21 | $ 12.52 | $ 11.92 |
Total ReturnA | .61% | 7.37% | 19.35% |
Ratios to Average Net Assets C, F | | | |
Expenses before reductions | 1.48% | 1.57% | 3.02% |
Expenses net of fee waivers, if any | 1.45% | 1.45% | 1.45% |
Expenses net of all reductions | 1.45% | 1.39% | 1.39% |
Net investment income (loss) | .54% | .87% | 1.41% |
Supplemental Data | | | |
Net assets, end of period (000 omitted) | $ 78,377 | $ 96,731 | $ 39,135 |
Portfolio turnover rateD | 148% | 179% | 83% |
A Total returns would have been lower if certain expenses had not been reduced during the applicable periods shown.
B Calculated based on average shares outstanding during the period.
C Fees and expenses of any underlying Fidelity Central Funds are not included in the Fund's expense ratio. The Fund indirectly bears its proportionate share of the expenses of any underlying Fidelity Central Funds.
D Amount does not include the portfolio activity of any underlying Fidelity Central Funds.
E For the period November 1, 2011 (commencement of operations) to October 31, 2012.
F Expense ratios reflect operating expenses of the class. Expenses before reductions do not reflect amounts reimbursed by the investment adviser or reductions from brokerage service arrangements or reductions from other expense offset arrangements and do not represent the amount paid by the class during periods when reimbursements or reductions occur. Expense ratios before reductions for start-up periods may not be representative of longer-term operating periods. Expenses net of fee waivers reflect expenses after reimbursement by the investment adviser but prior to reductions from brokerage service arrangements or other expense offset arrangements. Expenses net of all reductions represent the net expenses paid by the class.
G Amount represents less than $.01 per share.
See accompanying notes which are an integral part of the financial statements.
Annual Report
Financial Highlights - Institutional Class
Years ended October 31, | 2014 | 2013 | 2012 E |
Selected Per-Share Data | | | |
Net asset value, beginning of period | $ 12.53 | $ 11.92 | $ 10.00 |
Income from Investment Operations | | | |
Net investment income (loss) B | .07 | .11 | .15 |
Net realized and unrealized gain (loss) | - G | .75 | 1.76 |
Total from investment operations | .07 | .86 | 1.91 |
Distributions from net investment income | (.06) | (.07) | (.01) |
Distributions from net realized gain | (.30) | (.20) | - |
Total distributions | (.36) | (.27) | (.01) |
Redemption fees added to paid in capital B | .01 | .02 | .02 |
Net asset value, end of period | $ 12.25 | $ 12.53 | $ 11.92 |
Total ReturnA | .61% | 7.45% | 19.35% |
Ratios to Average Net Assets C, F | | | |
Expenses before reductions | 1.56% | 1.60% | 3.21% |
Expenses net of fee waivers, if any | 1.45% | 1.45% | 1.45% |
Expenses net of all reductions | 1.45% | 1.39% | 1.39% |
Net investment income (loss) | .54% | .87% | 1.41% |
Supplemental Data | | | |
Net assets, end of period (000 omitted) | $ 481 | $ 1,076 | $ 1,825 |
Portfolio turnover rateD | 148% | 179% | 83% |
A Total returns would have been lower if certain expenses had not been reduced during the applicable periods shown.
B Calculated based on average shares outstanding during the period.
C Fees and expenses of any underlying Fidelity Central Funds are not included in the Fund's expense ratio. The Fund indirectly bears its proportionate share of the expenses of any underlying Fidelity Central Funds.
D Amount does not include the portfolio activity of any underlying Fidelity Central Funds.
E For the period November 1, 2011 (commencement of operations) to October 31, 2012.
F Expense ratios reflect operating expenses of the class. Expenses before reductions do not reflect amounts reimbursed by the investment adviser or reductions from brokerage service arrangements or reductions from other expense offset arrangements and do not represent the amount paid by the class during periods when reimbursements or reductions occur. Expense ratios before reductions for start-up periods may not be representative of longer-term operating periods. Expenses net of fee waivers reflect expenses after reimbursement by the investment adviser but prior to reductions from brokerage service arrangements or other expense offset arrangements. Expenses net of all reductions represent the net expenses paid by the class.
G Amount represents less than $.01 per share.
See accompanying notes which are an integral part of the financial statements.
Annual Report
Notes to Financial Statements
For the period ended October 31, 2014
1. Organization.
Fidelity Emerging Markets Discovery Fund (the Fund) is a non-diversified fund of Fidelity Investment Trust (the Trust) and is authorized to issue an unlimited number of shares. The Trust is registered under the Investment Company Act of 1940, as amended (the 1940 Act), as an open-end management investment company organized as a Massachusetts business trust. The Fund offers Class A, Class T, Class C, Emerging Markets Discovery and Institutional Class shares, each of which has equal rights as to assets and voting privileges. Each class has exclusive voting rights with respect to matters that affect that class. The Fund's investments in emerging markets can be subject to social, economic, regulatory, and political uncertainties and can be extremely volatile.
2. Investments in Fidelity Central Funds.
The Fund invests in Fidelity Central Funds, which are open-end investment companies generally available only to other investment companies and accounts managed by the investment adviser and its affiliates. The Fund's Schedule of Investments lists each of the Fidelity Central Funds held as of period end, if any, as an investment of the Fund, but does not include the underlying holdings of each Fidelity Central Fund. As an Investing Fund, the Fund indirectly bears its proportionate share of the expenses of the underlying Fidelity Central Funds.
The Money Market Central Funds seek preservation of capital and current income and are managed by Fidelity Investments Money Management, Inc. (FIMM), an affiliate of the investment adviser. Annualized expenses of the Money Market Central Funds as of their most recent shareholder report date are less than .01%.
A complete unaudited list of holdings for each Fidelity Central Fund is available upon request or at the Securities and Exchange Commission (the SEC) website at www.sec.gov. In addition, the financial statements of the Fidelity Central Funds, which are not covered by the Fund's Report of Independent Registered Public Accounting Firm, are available on the SEC website or upon request.
3. Significant Accounting Policies.
The financial statements have been prepared in conformity with accounting principles generally accepted in the United States of America (GAAP), which require management to make certain estimates and assumptions at the date of the financial statements. Actual results could differ from those estimates. Subsequent events, if any, through the date that the financial statements were issued have been evaluated in the preparation of the financial statements. The following summarizes the significant accounting policies of the Fund:
Investment Valuation. Investments are valued as of 4:00 p.m. Eastern time on the last calendar day of the period. In accordance with valuation policies and procedures
Annual Report
Notes to Financial Statements - continued
3. Significant Accounting Policies - continued
Investment Valuation - continued
approved by the Board of Trustees (the Board), the Fund attempts to obtain prices from one or more third party pricing vendors or brokers to value its investments. When current market prices, quotations or currency exchange rates are not readily available or reliable, investments will be fair valued in good faith by the Fidelity Management & Research Company (FMR) Fair Value Committee (the Committee), in accordance with procedures adopted by the Board. Factors used in determining fair value vary by investment type and may include market or investment specific events. The frequency with which these procedures are used cannot be predicted and they may be utilized to a significant extent. The Committee oversees the Fund's valuation policies and procedures and is responsible for approving and reporting to the Board all fair value determinations.
The Fund categorizes the inputs to valuation techniques used to value its investments into a disclosure hierarchy consisting of three levels as shown below:
Level 1 - quoted prices in active markets for identical investments
Level 2 - other significant observable inputs (including quoted prices for similar investments, interest rates, prepayment speeds, etc.)
Level 3 - unobservable inputs (including the Fund's own assumptions based on the best information available)
Valuation techniques used to value the Fund's investments by major category are as follows:
Equity securities, including restricted securities, for which market quotations are readily available, are valued at the last reported sale price or official closing price as reported by a third party pricing vendor on the primary market or exchange on which they are traded and are categorized as Level 1 in the hierarchy. In the event there were no sales during the day or closing prices are not available, securities are valued at the last quoted bid price or may be valued using the last available price and are generally categorized as Level 2 in the hierarchy. For foreign equity securities, when market or security specific events arise, comparisons to the valuation of American Depositary Receipts (ADRs), futures contracts, Exchange-Traded Funds (ETFs) and certain indexes as well as quoted prices for similar securities may be used and would be categorized as Level 2 in the hierarchy. Utilizing these techniques may result in transfers between Level 1 and Level 2. For equity securities, including restricted securities, where observable inputs are limited, assumptions about market activity and risk are used and these securities may be categorized as Level 3 in the hierarchy.
Annual Report
3. Significant Accounting Policies - continued
Investment Valuation - continued
Investments in open-end mutual funds, including the Fidelity Central Funds, are valued at their closing net asset value (NAV) each business day and are categorized as Level 1 in the hierarchy.
Changes in valuation techniques may result in transfers in or out of an assigned level within the disclosure hierarchy. The aggregate value of investments by input level, as of October 31, 2014, including information on transfers between Levels 1 and 2, is included at the end of the Fund's Schedule of Investments.
Foreign Currency. The Fund may use foreign currency contracts to facilitate transactions in foreign-denominated securities. Gains and losses from these transactions may arise from changes in the value of the foreign currency or if the counterparties do not perform under the contracts' terms.
Foreign-denominated assets, including investment securities, and liabilities are translated into U.S. dollars at the exchange rates at period end. Purchases and sales of investment securities, income and dividends received and expenses denominated in foreign currencies are translated into U.S. dollars at the exchange rate in effect on the transaction date.
The effects of exchange rate fluctuations on investments are included with the net realized and unrealized gain (loss) on investment securities. Other foreign currency transactions resulting in realized and unrealized gain (loss) are disclosed separately.
Investment Transactions and Income. For financial reporting purposes, the Fund's investment holdings and NAV include trades executed through the end of the last business day of the period. The NAV per share for processing shareholder transactions is calculated as of the close of business of the New York Stock Exchange (NYSE), normally 4:00 p.m. Eastern time and includes trades executed through the end of the prior business day. Gains and losses on securities sold are determined on the basis of identified cost. Dividend income is recorded on the ex-dividend date, except for certain dividends from foreign securities where the ex-dividend date may have passed, which are recorded as soon as the Fund is informed of the ex-dividend date. Non-cash dividends included in dividend income, if any, are recorded at the fair market value of the securities received. Income and capital gain distributions from Fidelity Central Funds, if any, are recorded on the ex-dividend date. Investment income is recorded net of foreign taxes withheld where recovery of such taxes is uncertain.
Class Allocations and Expenses. Investment income, realized and unrealized capital gains and losses, common expenses of the Fund, and certain fund-level expense reductions, if any, are allocated daily on a pro-rata basis to each class based on the relative net
Annual Report
Notes to Financial Statements - continued
3. Significant Accounting Policies - continued
Class Allocations and Expenses - continued
assets of each class to the total net assets of the Fund. Each class differs with respect to transfer agent and distribution and service plan fees incurred. Certain expense reductions may also differ by class. For the reporting period, the allocated portion of income and expenses to each class as a percent of its average net assets may vary due to the timing of recording these transactions in relation to fluctuating net assets of the classes. Expenses directly attributable to a fund are charged to that fund. Expenses attributable to more than one fund are allocated among the respective funds on the basis of relative net assets or other appropriate methods. Expense estimates are accrued in the period to which they relate and adjustments are made when actual amounts are known.
Income Tax Information and Distributions to Shareholders. Each year, the Fund intends to qualify as a regulated investment company under Subchapter M of the Internal Revenue Code, including distributing substantially all of its taxable income and realized gains. As a result, no provision for U.S. Federal income taxes is required. As of October 31, 2014, the Fund did not have any unrecognized tax benefits in the financial statements; nor is the Fund aware of any tax positions for which it is reasonably possible that the total amounts of unrecognized tax benefits will significantly change in the next twelve months. The Fund files a U.S. federal tax return, in addition to state and local tax returns as required. The Fund's federal income tax returns are subject to examination by the Internal Revenue Service (IRS) for a period of three fiscal years after they are filed. State and local tax returns may be subject to examination for an additional fiscal year depending on the jurisdiction. Foreign taxes are provided for based on the Fund's understanding of the tax rules and rates that exist in the foreign markets in which it invests. The Fund is subject to a tax imposed on capital gains by certain countries in which it invests. An estimated deferred tax liability for net unrealized appreciation on the applicable securities is included in Other payables and accrued expenses on the Statement of Assets & Liabilities.
Distributions are declared and recorded on the ex-dividend date. Income dividends and capital gain distributions are declared separately for each class. Income and capital gain distributions are determined in accordance with income tax regulations, which may differ from GAAP.
Capital accounts within the financial statements are adjusted for permanent book-tax differences. These adjustments have no impact on net assets or the results of operations. Capital accounts are not adjusted for temporary book-tax differences which will reverse in a subsequent period.
Book-tax differences are primarily due to foreign currency transactions, certain foreign taxes, passive foreign investment companies (PFIC), and losses deferred due to wash sales.
Annual Report
3. Significant Accounting Policies - continued
Income Tax Information and Distributions to Shareholders - continued
The federal tax cost of investment securities and unrealized appreciation (depreciation) as of period end were as follows:
Gross unrealized appreciation | $ 7,254,784 |
Gross unrealized depreciation | (6,137,587) |
Net unrealized appreciation (depreciation) on securities | $ 1,117,197 |
| |
Tax Cost | $ 87,826,125 |
The tax-based components of distributable earnings as of period end were as follows:
Capital loss carryforward | $ (322,648) |
Net unrealized appreciation (depreciation) on securities and other investments | $ 1,099,060 |
Capital loss carryforwards are only available to offset future capital gains of the Fund to the extent provided by regulations and may be limited. Under the Regulated Investment Company Modernization Act of 2010 (the Act), the Fund is permitted to carry forward capital losses incurred in taxable years beginning after December 22, 2010 for an unlimited period and such capital losses are required to be used prior to any losses that expire. The capital loss carryforward information presented below, including any applicable limitation, is estimated as of fiscal period end and is subject to adjustment.
Fiscal year of expiration | |
No expiration | |
Short-term | $ (322,648) |
The tax character of distributions paid was as follows:
| October 31, 2014 | October 31, 2013 |
Ordinary Income | $ 676,480 | $ 1,201,159 |
Long-term Capital Gains | 2,520,609 | - |
Total | $ 3,197,089 | $ 1,201,159 |
Short-Term Trading (Redemption) Fees. Shares held by investors in the Fund less than 90 days may have been subject to a redemption fee equal to 2.00% of the NAV of shares redeemed. All redemption fees, which reduce the proceeds of the shareholder redemption, are retained by the Fund and accounted for as an addition to paid in capital.
New Accounting Pronouncement. In June 2014, the Financial Accounting Standards Board issued Accounting Standard Update No. 2014-11, Repurchase-to-Maturity Transactions, Repurchase Financings, and Disclosures. The Update amends the accounting for certain repurchase agreements and expands disclosure requirements for reverse
Annual Report
Notes to Financial Statements - continued
3. Significant Accounting Policies - continued
New Accounting Pronouncement - continued
repurchase agreements, securities lending and other similar transactions. The disclosure requirements are effective for annual and interim reporting periods beginning after December 15, 2014. Management is currently evaluating the impact of the Update on the Fund's financial statements and related disclosures.
4. Purchases and Sales of Investments.
Purchases and sales of securities, other than short-term securities, aggregated $133,129,300 and $154,307,954, respectively.
5. Fees and Other Transactions with Affiliates.
Management Fee. Fidelity Management & Research Company (the investment adviser) and its affiliates provide the Fund with investment management related services for which the Fund pays a monthly management fee. The management fee is the sum of an individual fund fee rate that is based on an annual rate of .60% of the Fund's average net assets and an annualized group fee rate that averaged .25% during the period. The group fee rate is based upon the average net assets of all the mutual funds advised by the investment adviser, including any mutual funds previously advised by the investment adviser that are currently advised by Fidelity SelectCo, LLC, an affiliate of the investment adviser. The group fee rate decreases as assets under management increase and increases as assets under management decrease. For the reporting period, the total annual management fee rate was .85% of the Fund's average net assets.
Distribution and Service Plan Fees. In accordance with Rule 12b-1 of the 1940 Act, the Fund has adopted separate Distribution and Service Plans for each class of shares. Certain classes pay Fidelity Distributors Corporation (FDC), an affiliate of the investment adviser, separate Distribution and Service Fees, each of which is based on an annual percentage of each class' average net assets. In addition, FDC may pay financial intermediaries for selling shares of the Fund and providing shareholder support services. For the period, the Distribution and Service Fee rates, total fees and amounts retained by FDC were as follows:
| Distribution
Fee | Service
Fee | Total Fees | Retained
by FDC |
Class A | -% | .25% | $ 11,632 | $ 1,997 |
Class T | .25% | .25% | 9,422 | 384 |
Class C | .75% | .25% | 20,021 | 10,212 |
| | | $ 41,075 | $ 12,593 |
Annual Report
5. Fees and Other Transactions with Affiliates - continued
Sales Load. FDC may receive a front-end sales charge of up to 5.75% for selling Class A shares and 3.50% for selling Class T shares, some of which is paid to financial intermediaries for selling shares of the Fund. Depending on the holding period, FDC may receive contingent deferred sales charges levied on Class A, Class T and Class C redemptions. The deferred sales charges range from 1.00% for Class C shares, 1.00% for certain purchases of Class A shares and .25% for certain purchases of Class T shares.
For the period, sales charge amounts retained by FDC were as follows:
| Retained
by FDC |
Class A | $ 2,453 |
Class T | 1,194 |
Class C* | 2,188 |
| $ 5,835 |
* When Class C shares are initially sold, FDC pays commissions from its own resources to financial intermediaries through which the sales are made.
Transfer Agent Fees. Fidelity Investments Institutional Operations Company, Inc., (FIIOC), an affiliate of the investment adviser, is the transfer, dividend disbursing and shareholder servicing agent for each class of the Fund. FIIOC receives account fees and asset-based fees that vary according to the account size and type of account of the shareholders of the respective classes of the Fund. FIIOC pays for typesetting, printing and mailing of shareholder reports, except proxy statements.
For the period, transfer agent fees for each class were as follows:
| Amount | % of
Class-Level Average
Net Assets |
Class A | $ 14,242 | .31 |
Class T | 6,334 | .34 |
Class C | 6,270 | .31 |
Emerging Markets Discovery | 174,808 | .21 |
Institutional Class | 1,349 | .25 |
| $ 203,003 | |
Accounting and Security Lending Fees. Fidelity Service Company, Inc. (FSC), an affiliate of the investment adviser, maintains the Fund's accounting records. The accounting fee is based on the level of average net assets for each month. Under a separate contract, FSC administers the security lending program. The security lending fee is based on the number and duration of lending transactions.
Brokerage Commissions. The Fund placed a portion of its portfolio transactions with brokerage firms which are affiliates of the investment adviser. Brokerage commissions are included in net realized gain (loss) and change in net unrealized appreciation (depreciation) in the Statement of Operations. The commissions paid to these affiliated firms were $594 for the period.
Annual Report
Notes to Financial Statements - continued
5. Fees and Other Transactions with Affiliates - continued
Interfund Lending Program. Pursuant to an Exemptive Order issued by the SEC, the Fund, along with other registered investment companies having management contracts with FMR or other affiliated entities of FMR, may participate in an interfund lending program. This program provides an alternative credit facility allowing the funds to borrow from, or lend money to, other participating affiliated funds. At period end, there were no interfund loans outstanding. The Fund's activity in this program during the period for which loans were outstanding was as follows:
Borrower or Lender | Average Loan
Balance | Weighted Average Interest Rate | Interest Expense |
Borrower | $ 2,976,000 | .32% | $ 79 |
6. Committed Line of Credit.
The Fund participates with other funds managed by the investment adviser or an affiliate in a $4.25 billion credit facility (the "line of credit") to be utilized for temporary or emergency purposes to fund shareholder redemptions or for other short-term liquidity purposes. The Fund has agreed to pay commitment fees on its pro-rata portion of the line of credit, which amounted to $152 and is reflected in Miscellaneous expenses on the Statement of Operations. During the period, the Fund did not borrow on this line of credit.
7. Security Lending.
The Fund lends portfolio securities through a lending agent from time to time in order to earn additional income. For equity securities, a lending agent is used and may loan securities to certain qualified borrowers, including Fidelity Capital Markets (FCM), a broker-dealer affiliated with the Fund. On the settlement date of the loan, the Fund receives collateral (in the form of U.S. Treasury obligations, letters of credit and/or cash) against the loaned securities and maintains collateral in an amount not less than 100% of the market value of the loaned securities during the period of the loan. The market value of the loaned securities is determined at the close of business of the Fund and any additional required collateral is delivered to the Fund on the next business day. If the borrower defaults on its obligation to return the securities loaned because of insolvency or other reasons, the Fund may apply collateral received from the borrower against the obligation. The Fund may experience delays and costs in recovering the securities loaned. Any cash collateral received is invested in the Fidelity Securities Lending Cash Central Fund. The value of loaned securities and cash collateral at period end are disclosed on the Fund's Statement of Assets and Liabilities. Security lending income
Annual Report
7. Security Lending - continued
represents the income earned on investing cash collateral, less rebates paid to borrowers and any lending agent fees associated with the loan, plus any premium payments received for lending certain types of securities. Security lending income is presented in the Statement of Operations as a component of income from Fidelity Central Funds. Total security lending income during the period amounted to $22,418. During the period, there were no securities loaned to FCM.
8. Expense Reductions.
The investment adviser contractually agreed to reimburse each class to the extent annual operating expenses exceeded certain levels of average net assets as noted in the table below. This reimbursement will remain in place through December 31, 2015. Some expenses, for example interest expense, including commitment fees, are excluded from this reimbursement.
The following classes were in reimbursement during the period:
| Expense
Limitations | Reimbursement |
Class A | 1.70% | $ 5,734 |
Class T | 1.95% | 2,801 |
Class C | 2.45% | 2,643 |
Emerging Markets Discovery | 1.45% | 25,708 |
Institutional Class | 1.45% | 569 |
| | $ 37,455 |
In addition, the investment adviser reimbursed a portion of the Fund's operating expenses during the period in the amount of $1,820.
9. Distributions to Shareholders.
Distributions to shareholders of each class were as follows:
Years ended October 31, | 2014 | 2013 |
From net investment income | | |
Class A | $ 23,688 | $ 7,274 |
Class T | 2,475 | 5,643 |
Class C | - | 1,195 |
Emerging Markets Discovery | 646,254 | 259,277 |
Institutional Class | 4,063 | 12,904 |
Total | $ 676,480 | $ 286,293 |
Annual Report
Notes to Financial Statements - continued
9. Distributions to Shareholders - continued
Years ended October 31, | 2014 | 2013 |
From net realized gain | | |
Class A | $ 122,525 | $ 33,559 |
Class T | 43,668 | 33,691 |
Class C | 51,356 | 30,324 |
Emerging Markets Discovery | 2,280,897 | 778,518 |
Institutional Class | 22,163 | 38,774 |
Total | $ 2,520,609 | $ 914,866 |
10. Share Transactions.
Share transactions for each class were as follows and may contain automatic conversions between classes or exchanges between funds:
| Shares | Shares | Dollars | Dollars |
Years ended October 31, | 2014 | 2013 | 2014 | 2013 |
Class A | | | | |
Shares sold | 147,354 | 646,803 | $ 1,789,001 | $ 8,039,936 |
Reinvestment of distributions | 10,958 | 3,013 | 133,251 | 36,310 |
Shares redeemed | (205,580) | (384,660) | (2,490,439) | (4,712,072) |
Net increase (decrease) | (47,268) | 265,156 | $ (568,187) | $ 3,364,174 |
Class T | | | | |
Shares sold | 52,146 | 157,097 | $ 631,489 | $ 1,931,892 |
Reinvestment of distributions | 3,566 | 3,232 | 43,325 | 38,882 |
Shares redeemed | (42,178) | (149,702) | (507,088) | (1,831,906) |
Net increase (decrease) | 13,534 | 10,627 | $ 167,726 | $ 138,868 |
Class C | | | | |
Shares sold | 92,257 | 428,945 | $ 1,143,008 | $ 5,224,843 |
Reinvestment of distributions | 4,241 | 2,629 | 51,185 | 31,519 |
Shares redeemed | (119,225) | (387,768) | (1,424,170) | (4,776,955) |
Net increase (decrease) | (22,727) | 43,806 | $ (229,977) | $ 479,407 |
Emerging Markets Discovery | | | | |
Shares sold | 2,185,123 | 12,245,350 | $ 26,469,903 | $ 152,132,821 |
Reinvestment of distributions | 205,996 | 72,226 | 2,506,974 | 871,750 |
Shares redeemed | (3,696,612) | (7,876,995) | (44,026,941) | (96,541,547) |
Net increase (decrease) | (1,305,493) | 4,440,581 | $ (15,050,064) | $ 56,463,024 |
Institutional Class | | | | |
Shares sold | 25,831 | 231,788 | $ 324,477 | $ 2,857,278 |
Reinvestment of distributions | 824 | 3,612 | 10,052 | 43,597 |
Shares redeemed | (73,327) | (302,585) | (870,835) | (3,657,178) |
Net increase (decrease) | (46,672) | (67,185) | $ (536,306) | $ (756,303) |
Annual Report
11. Other.
The Fund's organizational documents provide former and current trustees and officers with a limited indemnification against liabilities arising in connection with the performance of their duties to the Fund. In the normal course of business, the Fund may also enter into contracts that provide general indemnifications. The Fund's maximum exposure under these arrangements is unknown as this would be dependent on future claims that may be made against the Fund. The risk of material loss from such claims is considered remote.
At the end of the period, the investment adviser or its affiliates were the owners of record of 11% of the total outstanding shares of the Fund.
Annual Report
To the Trustees of Fidelity Investment Trust and the Shareholders of Fidelity Emerging Markets Discovery Fund:
In our opinion, the accompanying statement of assets and liabilities, including the schedule of investments, and the related statements of operations and of changes in net assets and the financial highlights present fairly, in all material respects, the financial position of Fidelity Emerging Markets Discovery Fund (a fund of Fidelity Investment Trust) at October 31, 2014, the results of its operations for the year then ended, the changes in its net assets for each of the two years in the period then ended and the financial highlights for each of the periods indicated, in conformity with accounting principles generally accepted in the United States of America. These financial statements and financial highlights (hereafter referred to as "financial statements") are the responsibility of the Fidelity Emerging Markets Discovery Fund's management. Our responsibility is to express an opinion on these financial statements based on our audits. We conducted our audits of these financial statements in accordance with the standards of the Public Company Accounting Oversight Board (United States). Those standards require that we plan and perform the audit to obtain reasonable assurance about whether the financial statements are free of material misstatement. An audit includes examining, on a test basis, evidence supporting the amounts and disclosures in the financial statements, assessing the accounting principles used and significant estimates made by management, and evaluating the overall financial statement presentation. We believe that our audits, which included confirmation of securities at October 31, 2014 by correspondence with the custodian and brokers, provide a reasonable basis for our opinion.
PricewaterhouseCoopers LLP
Boston, Massachusetts
December 19, 2014
Annual Report
The Trustees, Member of the Advisory Board, and officers of the trust and fund, as applicable, are listed below. The Board of Trustees governs the fund and is responsible for protecting the interests of shareholders. The Trustees are experienced executives who meet periodically throughout the year to oversee the fund's activities, review contractual arrangements with companies that provide services to the fund, oversee management of the risks associated with such activities and contractual arrangements, and review the fund's performance. Except for James C. Curvey, each of the Trustees oversees 174 funds. Mr. Curvey oversees 407 funds.
The Trustees hold office without limit in time except that (a) any Trustee may resign; (b) any Trustee may be removed by written instrument, signed by at least two-thirds of the number of Trustees prior to such removal; (c) any Trustee who requests to be retired or who has become incapacitated by illness or injury may be retired by written instrument signed by a majority of the other Trustees; and (d) any Trustee may be removed at any special meeting of shareholders by a two-thirds vote of the outstanding voting securities of the trust. Each Trustee who is not an interested person (as defined in the 1940 Act) of the trust and the fund (Independent Trustee), shall retire not later than the last day of the calendar year in which his or her 75th birthday occurs. The Independent Trustees may waive this mandatory retirement age policy with respect to individual Trustees. The officers and Advisory Board Member hold office without limit in time, except that any officer and Advisory Board Member may resign or may be removed by a vote of a majority of the Trustees at any regular meeting or any special meeting of the Trustees. Except as indicated, each individual has held the office shown or other offices in the same company for the past five years.
Experience, Skills, Attributes, and Qualifications of the Fund's Trustees. The Governance and Nominating Committee has adopted a statement of policy that describes the experience, qualifications, attributes, and skills that are necessary and desirable for potential Independent Trustee candidates (Statement of Policy). The Board believes that each Trustee satisfied at the time he or she was initially elected or appointed a Trustee, and continues to satisfy, the standards contemplated by the Statement of Policy. The Governance and Nominating Committee also engages professional search firms to help identify potential Independent Trustee candidates who have the experience, qualifications, attributes, and skills consistent with the Statement of Policy. From time to time, additional criteria based on the composition and skills of the current Independent Trustees, as well as experience or skills that may be appropriate in light of future changes to board composition, business conditions, and regulatory or other developments, have also been considered by the professional search firms and the Governance and Nominating Committee. In addition, the Board takes into account the Trustees' commitment and participation in Board and committee meetings, as well as their leadership of standing and ad hoc committees throughout their tenure.
In determining that a particular Trustee was and continues to be qualified to serve as a Trustee, the Board has considered a variety of criteria, none of which, in isolation, was controlling. The Board believes that, collectively, the Trustees have balanced and diverse experience, qualifications, attributes, and skills, which allow the Board to operate effectively in governing the fund and protecting the interests of shareholders. Information about the specific experience, skills, attributes, and qualifications of each Trustee, which in each case led to the Board's conclusion that the Trustee should serve (or continue to serve) as a trustee of the fund, is provided below.
Annual Report
Board Structure and Oversight Function. James C. Curvey is an interested person (as defined in the 1940 Act) and currently serves as Chairman. The Trustees have determined that an interested Chairman is appropriate and benefits shareholders because an interested Chairman has a personal and professional stake in the quality and continuity of services provided to the fund. Independent Trustees exercise their informed business judgment to appoint an individual of their choosing to serve as Chairman, regardless of whether the Trustee happens to be independent or a member of management. The Independent Trustees have determined that they can act independently and effectively without having an Independent Trustee serve as Chairman and that a key structural component for assuring that they are in a position to do so is for the Independent Trustees to constitute a substantial majority for the Board. The Independent Trustees also regularly meet in executive session. Ned C. Lautenbach serves as Chairman of the Independent Trustees and as such (i) acts as a liaison between the Independent Trustees and management with respect to matters important to the Independent Trustees and (ii) with management prepares agendas for Board meetings.
Fidelity funds are overseen by different Boards of Trustees. The fund's Board oversees Fidelity's equity and high income funds and another Board oversees Fidelity's investment-grade bond, money market, and asset allocation funds. The asset allocation funds may invest in Fidelity funds overseen by the fund's Board. The use of separate Boards, each with its own committee structure, allows the Trustees of each group of Fidelity funds to focus on the unique issues of the funds they oversee, including common research, investment, and operational issues. On occasion, the separate Boards establish joint committees to address issues of overlapping consequences for the Fidelity funds overseen by each Board.
The Trustees operate using a system of committees to facilitate the timely and efficient consideration of all matters of importance to the Trustees, the fund, and fund shareholders and to facilitate compliance with legal and regulatory requirements and oversight of the fund's activities and associated risks. The Board, acting through its committees, has charged FMR and its affiliates with (i) identifying events or circumstances the occurrence of which could have demonstrably adverse effects on the fund's business and/or reputation; (ii) implementing processes and controls to lessen the possibility that such events or circumstances occur or to mitigate the effects of such events or circumstances if they do occur; and (iii) creating and maintaining a system designed to evaluate continuously business and market conditions in order to facilitate the identification and implementation processes described in (i) and (ii) above. Because the day-to-day operations and activities of the fund are carried out by or through FMR, its affiliates and other service providers, the fund's exposure to risks is mitigated but not eliminated by the processes overseen by the Trustees. While each of the Board's committees has responsibility for overseeing different aspects of the fund's activities, oversight is exercised primarily through the Operations, Audit, and Compliance Committees. In addition, the Independent Trustees have worked with FMR to enhance the Board's oversight of investment and financial risks, legal and regulatory risks, technology risks, and operational risks, including the development of additional risk reporting to the Board. For example, a working group comprised of Independent Trustees and FMR has worked and continues to work to review the Fidelity funds' valuation-related activities, reporting and risk management. Appropriate personnel, including but not limited to the fund's Chief Compliance Officer (CCO), FMR's internal auditor, the independent accountants, the fund's Treasurer and portfolio management personnel, make periodic reports to the Board's committees, as appropriate, including an annual review of FMR's risk management program for the Fidelity funds. The responsibilities of each standing committee, including their oversight responsibilities, are described further under "Standing Committees of the Fund's Trustees."
Annual Report
Trustees and Officers - continued
The fund's Statement of Additional Information (SAI) includes more information about the Trustees. To request a free copy, call Fidelity at 1-877-208-0098.
Interested Trustees*:
Correspondence intended for each Trustee who is an interested person may be sent to Fidelity Investments, 245 Summer Street, Boston, Massachusetts 02210.
Name, Year of Birth; Principal Occupations and Other Relevant Experience+ |
James C. Curvey (1935) |
Year of Election or Appointment: 2007 Trustee Chairman of the Board of Trustees |
| Mr. Curvey also serves as Trustee of other Fidelity funds. Mr. Curvey is a Director of Fidelity Research & Analysis Co. (2009-present), and Vice Chairman (2007-present) and Director of FMR LLC. In addition, Mr. Curvey serves as an Overseer for the Boston Symphony Orchestra and a member of the board of Artis-Naples, Naples, Florida, and as a Trustee for Brewster Academy, Wolfeboro, New Hampshire. Previously, Mr. Curvey served as a Director of Fidelity Investments Money Management, Inc. (2009-2014), a Director of FMR (2007-2014), and a Director of FMR Co., Inc. (2007-2014). |
Charles S. Morrison (1960) |
Year of Election or Appointment: 2014 Trustee |
| Mr. Morrison also serves as Trustee of other funds. He serves as a Director of Fidelity Investments Money Management, Inc. (FIMM) (2014-present), Director of Fidelity SelectCo, LLC (2014-present), President, Asset Management (2014-present), and is an employee of Fidelity Investments. Previously, Mr. Morrison served as Vice President of Fidelity's Fixed Income and Asset Allocation Funds (2012-2014), President, Fixed Income (2011-2014), Vice President of Fidelity's Money Market Funds (2005-2009), President, Money Market Group Leader of FMR (2009), and Senior Vice President, Money Market Group of FMR (2004-2009). Mr. Morrison also served as Vice President of Fidelity's Bond Funds (2002-2005), certain Balanced Funds (2002-2005), and certain Asset Allocation Funds (2002-2007), and as Senior Vice President (2002-2005) of Fidelity's Bond Division. |
* Trustees have been determined to be "Interested Trustees" by virtue of, among other things, their affiliation with the trust or various entities under common control with FMR.
+ The information above includes each Trustee's principal occupation during the last five years and other information relating to the experience, attributes, and skills relevant to each Trustee's qualifications to serve as a Trustee, which led to the conclusion that each Trustee should serve as a Trustee for the fund.
Annual Report
Trustees and Officers - continued
Independent Trustees:
Correspondence intended for each Independent Trustee (that is, the Trustees other than the Interested Trustees) may be sent to Fidelity Investments, P.O. Box 55235, Boston, Massachusetts 02205-5235.
Name, Year of Birth; Principal Occupations and Other Relevant Experience+ |
Dennis J. Dirks (1948) |
Year of Election or Appointment: 2005 Trustee |
| Mr. Dirks also serves as Trustee of other Fidelity funds. Prior to his retirement in May 2003, Mr. Dirks was Chief Operating Officer and a member of the Board of The Depository Trust & Clearing Corporation (DTCC). He also served as President, Chief Operating Officer, and Board member of The Depository Trust Company (DTC) and President and Board member of the National Securities Clearing Corporation (NSCC). In addition, Mr. Dirks served as Chief Executive Officer and Board member of the Government Securities Clearing Corporation, Chief Executive Officer and Board member of the Mortgage-Backed Securities Clearing Corporation, as a Trustee and a member of the Finance Committee of Manhattan College (2005-2008), and as a Trustee and a member of the Finance Committee of AHRC of Nassau County (2006-2008). Mr. Dirks is a member of the Independent Directors Council (IDC) Governing Council (2010-present) and Board of Directors for The Brookville Center for Children's Services, Inc. (2009-present). |
Alan J. Lacy (1953) |
Year of Election or Appointment: 2008 Trustee |
| Mr. Lacy also serves as Trustee of other Fidelity funds. Mr. Lacy serves as Senior Adviser (2007-present) of Oak Hill Capital Partners, L.P. (private equity). Mr. Lacy also served as Chief Executive Officer (2000-2005) and Vice Chairman (2005-2006) of Sears Holdings Corporation and Sears, Roebuck and Co. (retail). In addition, Mr. Lacy serves as a member of the Board of Directors of Dave & Buster's Entertainment, Inc. (restaurant and entertainment complexes, 2010-present), Earth Fare, Inc. (retail grocery, 2012-present), The Hillman Companies, Inc. (hardware wholesalers, 2010-present), and Bristol-Myers Squibb Company (global pharmaceuticals, 2008-present). Mr. Lacy is a member of the Board of Trustees of The National Parks Conservation Association (2006-present). Previously, Mr. Lacy served as Chairman of the Board of Trustees of the National Parks Conservation Association (2008-2011) and as a member of the Board of Directors for the Western Union Company (global money transfer, 2006-2011). |
Ned C. Lautenbach (1944) |
Year of Election or Appointment: 2000 Trustee Chairman of the Independent Trustees |
| Mr. Lautenbach also serves as Trustee of other Fidelity funds. Mr. Lautenbach currently serves as the Lead Director of the Eaton Corporation Board of Directors (diversified industrial, 1997-present). Mr. Lautenbach is Chairman of the Board of Directors of the Philharmonic Center for the Arts in Naples, Florida (2012-present) and a member of the Council on Foreign Relations (1994-present). Previously, Mr. Lautenbach was a Partner/Advisory Partner at Clayton, Dubilier & Rice, LLC (private equity investment, 1998-2010), as well as a Director of Sony Corporation (2006-2007). |
Joseph Mauriello (1944) |
Year of Election or Appointment: 2008 Trustee |
| Mr. Mauriello also serves as Trustee of other Fidelity funds. Prior to his retirement in January 2006, Mr. Mauriello served in numerous senior management positions including Deputy Chairman and Chief Operating Officer (2004-2005), and Vice Chairman of Financial Services (2002-2004) of KPMG LLP US (professional services, 1965-2005). Mr. Mauriello currently serves as a member of the Board of Directors of XL Group plc. (global insurance and re-insurance, 2006-present). Previously, Mr. Mauriello served as a Director of the Hamilton Funds of the Bank of New York (2006-2007) and of Arcadia Resources Inc. (health care services and products, 2007-2012). |
Robert W. Selander (1950) |
Year of Election or Appointment: 2011 Trustee |
| Mr. Selander also serves as Trustee of other Fidelity funds. Previously, Mr. Selander served as a Member of the Advisory Board of other Fidelity funds (2011), and Executive Vice Chairman (2010), Chief Executive Officer (2009-2010), and President and Chief Executive Officer (1997-2009) of Mastercard, Inc. |
Cornelia M. Small (1944) |
Year of Election or Appointment: 2005 Trustee |
| Ms. Small also serves as Trustee of other Fidelity funds. Ms. Small is a member of the Board of Directors (2009-present) and Chair of the Investment Committee (2010-present) of the Teagle Foundation. Ms. Small also serves on the Investment Committee of the Berkshire Taconic Community Foundation (2008-present). Previously, Ms. Small served as Chairperson (2002-2008) and a member of the Investment Committee and Chairperson (2008-2012) and a member of the Board of Trustees of Smith College. In addition, Ms. Small served as Chief Investment Officer, Director of Global Equity Investments, and a member of the Board of Directors of Scudder, Stevens & Clark and Scudder Kemper Investments. |
William S. Stavropoulos (1939) |
Year of Election or Appointment: 2001 Trustee Vice Chairman of the Independent Trustees |
| Mr. Stavropoulos also serves as Trustee of other Fidelity funds. Mr. Stavropoulos serves as President and Founder of the Michigan Baseball Foundation, the Great Lakes Loons (2007-present). Mr. Stavropoulos is Chairman Emeritus of the Board of Directors of The Dow Chemical Company, where he previously served in numerous senior management positions, including President, CEO (1995-2000; 2002-2004), Chairman of the Executive Committee (2000-2006), and as a member of the Board of Directors (1990-2006). Currently, Mr. Stavropoulos is Chairman of the Board of Directors of Univar Inc. (global distributor of commodity and specialty chemicals), a Director of Teradata Corporation (data warehousing and technology solutions), and Maersk Inc. (industrial conglomerate), and a member of the Advisory Board for Metalmark Capital LLC (private equity investment, 2005-present). Mr. Stavropoulos is an operating advisor to Clayton, Dubilier & Rice, LLC (private equity investment). In addition, Mr. Stavropoulos is a member of the University of Notre Dame Advisory Council for the College of Science, a Trustee of the Rollin L. Gerstacker Foundation, and a Director of the Naples Philharmonic Center for the Arts. Previously, Mr. Stavropoulos served as a Director of Chemical Financial Corporation (bank holding company, 1993-2012) and Tyco International, Ltd. (multinational manufacturing and services, 2007-2012). |
David M. Thomas (1949) |
Year of Election or Appointment: 2008 Trustee |
| Mr. Thomas also serves as Trustee of other Fidelity funds. Mr. Thomas serves as Non-Executive Chairman of the Board of Directors of Fortune Brands Home and Security (home and security products, 2011-present), and as a member of the Board of Directors of Interpublic Group of Companies, Inc. (marketing communication, 2004-present). Previously, Mr. Thomas served as Executive Chairman (2005-2006) and Chairman and Chief Executive Officer (2000-2005) of IMS Health, Inc. (pharmaceutical and healthcare information solutions), and a Director of Fortune Brands, Inc. (consumer products, 2000-2011). |
+ The information above includes each Trustee's principal occupation during the last five years and other information relating to the experience, attributes, and skills relevant to each Trustee's qualifications to serve as a Trustee, which led to the conclusion that each Trustee should serve as a Trustee for the fund.
Advisory Board Member and Officers:
Correspondence intended for each officer and Peter S. Lynch may be sent to Fidelity Investments, 245 Summer Street, Boston, Massachusetts 02210. Officers appear below in alphabetical order.
Name, Year of Birth; Principal Occupation |
Peter S. Lynch (1944) |
Year of Election or Appointment: 2003 Member of the Advisory Board |
| Mr. Lynch also serves as Member of the Advisory Board of other Fidelity funds. Mr. Lynch is Vice Chairman and a Director of FMR and FMR Co., Inc. In addition, Mr. Lynch serves as a Trustee of Boston College and as the Chairman of the Inner-City Scholarship Fund. Previously, Mr. Lynch served on the Special Olympics International Board of Directors (1997-2006). |
Elizabeth Paige Baumann (1968) |
Year of Election or Appointment: 2012 Anti-Money Laundering (AML) Officer |
| Ms. Baumann also serves as AML Officer of other funds. She is Chief AML Officer of FMR LLC (2012-present) and is an employee of Fidelity Investments. Previously, Ms. Baumann served as Vice President and Deputy Anti-Money Laundering Officer (2007-2012). |
William C. Coffey (1969) |
Year of Election or Appointment: 2009 Assistant Secretary |
| Mr. Coffey also serves as Assistant Secretary of other funds. He is Senior Vice President and Deputy General Counsel of FMR LLC (2010-present), and is an employee of Fidelity Investments. Previously, Mr. Coffey served as Vice President and Associate General Counsel of FMR LLC (2005-2009). |
Timothy M. Cohen (1969) |
Year of Election or Appointment: 2014 Vice President of certain Equity Funds |
| Mr. Cohen also serves as Vice President of other funds. Mr. Cohen serves as a Director and Chief Compliance Officer of Fidelity Management & Research (U.K.) Inc. (2013-present) and is an employee of Fidelity Investments. |
Jonathan Davis (1968) |
Year of Election or Appointment: 2010 Assistant Treasurer |
| Mr. Davis also serves as Assistant Treasurer of other funds. Mr. Davis is an employee of Fidelity Investments. Previously, Mr. Davis served as Vice President and Associate General Counsel of FMR LLC (2003-2010). |
Adrien E. Deberghes (1967) |
Year of Election or Appointment: 2008 Deputy Treasurer |
| Mr. Deberghes also serves as an officer of other funds. He is an employee of Fidelity Investments (2008-present). Prior to joining Fidelity Investments, Mr. Deberghes was Senior Vice President of Mutual Fund Administration at State Street Corporation (2007-2008), Senior Director of Mutual Fund Administration at Investors Bank & Trust (2005-2007), and Director of Finance for Dunkin' Brands (2000-2005). |
Stephanie J. Dorsey (1969) |
Year of Election or Appointment: 2010 Assistant Treasurer |
| Ms. Dorsey also serves as an officer of other funds. She is an employee of Fidelity Investments (2008-present) and has served in other fund officer roles. Prior to joining Fidelity Investments, Ms. Dorsey served as Treasurer (2004-2008) of the JPMorgan Mutual Funds and Vice President (2004-2008) of JPMorgan Chase Bank. |
Howard J. Galligan III (1966) |
Year of Election or Appointment: 2014 Chief Financial Officer |
| Mr. Galligan also serves as Chief Financial Officer of other funds. Mr. Galligan serves as President of Fidelity Pricing and Cash Management Services (FPCMS) (2014-present) and as a Director of Strategic Advisers, Inc. (2008-present). Previously, Mr. Galligan served as Chief Administrative Officer of Asset Management (2011-2014) and Chief Operating Officer and Senior Vice President of Investment Support for Strategic Advisers, Inc. (2003-2011). |
Scott C. Goebel (1968) |
Year of Election or Appointment: 2008 Secretary and Chief Legal Officer (CLO) |
| Mr. Goebel serves as Secretary and CLO of other funds. Mr. Goebel also serves as Secretary of Fidelity SelectCo, LLC (2013-present), Fidelity Investments Money Management, Inc. (FIMM) (2010-present) and Fidelity Research and Analysis Company (FRAC) (2010-present); General Counsel, Secretary, and Senior Vice President of FMR (2008-present) and FMR Co., Inc. (2008-present); Chief Legal Officer of Fidelity Management & Research (Hong Kong) Limited (2008-present); and Assistant Secretary of Fidelity Management & Research (Japan) Limited (2008-present) and Fidelity Management & Research (U.K.) Inc. (2008-present). Previously, Mr. Goebel served as Secretary and CLO of other Fidelity funds (2008-2013), Assistant Secretary of FIMM (2008-2010), FRAC (2008-2010), and certain funds (2007-2008); and as Vice President and Secretary of Fidelity Distributors Corporation (FDC) (2005-2007). Mr. Goebel has been employed by FMR LLC or an affiliate since 2001. |
Brian B. Hogan (1964) |
Year of Election or Appointment: 2009 Vice President |
| Mr. Hogan also serves as Trustee or Vice President of other funds. Mr. Hogan serves as a Director of Fidelity SelectCo, LLC (2014-present) and President of FMR's Equity Division (2009-present). Previously, Mr. Hogan served as Senior Vice President, Equity Research of FMR (2006-2009) and as a portfolio manager. |
Chris Maher (1972) |
Year of Election or Appointment: 2013 Assistant Treasurer |
| Mr. Maher serves as Assistant Treasurer of other funds. Mr. Maher is Vice President of Valuation Oversight and is an employee of Fidelity Investments. Previously, Mr. Maher served as Vice President of Asset Management Compliance (2013), Vice President of FMR's Program Management Group (2010-2013), and Vice President of Valuation Oversight (2008-2010). |
Kenneth B. Robins (1969) |
Year of Election or Appointment: 2008 President and Treasurer |
| Mr. Robins also serves as an officer of other funds. Mr. Robins serves as Executive Vice President of Fidelity Investments Money Management, Inc. (FIMM) (2013-present) and is an employee of Fidelity Investments (2004-present). Previously, Mr. Robins served in other fund officer roles. |
Stephen Sadoski (1971) |
Year of Election or Appointment: 2012 Deputy Treasurer |
| Mr. Sadoski also serves as Deputy Treasurer of other funds. He is an employee of Fidelity Investments (2012-present) and has served in another fund officer role. Prior to joining Fidelity Investments, Mr. Sadoski served as an assistant chief accountant in the Division of Investment Management of the Securities and Exchange Commission (SEC) (2009-2012) and as a senior manager at Deloitte & Touche LLP (1997-2009). |
Stacie M. Smith (1974) |
Year of Election or Appointment: 2013 Deputy Treasurer |
| Ms. Smith also serves as an officer of other funds. She is an employee of Fidelity Investments (2009-present) and has served in other fund officer roles. Prior to joining Fidelity Investments, Ms. Smith served as Senior Audit Manager of Ernst & Young LLP (1996-2009). |
Renee Stagnone (1975) |
Year of Election or Appointment: 2013 Deputy Treasurer |
| Ms. Stagnone also serves as Deputy Treasurer of other funds. Ms. Stagnone is an employee of Fidelity Investments. |
Linda J. Wondrack (1964) |
Year of Election or Appointment: 2014 Chief Compliance Officer |
| Ms. Wondrack also serves as Chief Compliance Officer of other funds. Ms. Wondrack is Executive Vice President and head of the Ethics Office and Asset Management Compliance for Fidelity Investments (2012-present). Ms. Wondrack also serves as Chief Compliance Officer of Fidelity SelectCo, LLC (2014-present); Chief Compliance Officer of Impresa Management LLC (2013-present); and Chief Compliance Officer of FMR Co., Inc., Fidelity Investments Money Management, Inc., Fidelity Management & Research (Japan) Limited, Fidelity Management & Research (U.K.) Inc., Fidelity Management & Research (Hong Kong), Fidelity Management & Research Company, Pyramis Global Advisors, LLC, and Strategic Advisers, Inc., Ballyrock Investment Advisors LLC, and Northern Neck Investors LLC (2012-present). Previously, Ms. Wondrack served as Senior Vice President and Chief Compliance Officer for Columbia Management Investment Advisers, LLC (2005-2012); Chief Compliance Officer for certain funds within the Columbia Family of Funds (2007-2012); and Senior Vice President of Compliance Risk Management at Bank of America (2005-2010). |
Joseph F. Zambello (1957) |
Year of Election or Appointment: 2011 Deputy Treasurer |
| Mr. Zambello also serves as Deputy Treasurer of other funds. Mr. Zambello is an employee of Fidelity Investments. Previously, Mr. Zambello served as Vice President of FMR's Program Management Group (2009-2011) and Vice President of the Transfer Agent Oversight Group (2005-2009). |
Annual Report
Institutional Class designates 100% of the dividend distributed during the fiscal year as amounts which may be taken into account as a dividend for purposes of the maximum rate under section 1(h)(11) of the Internal Revenue Code.
The amounts per share which represent income derived from sources within, and taxes paid to, foreign countries or possessions of the United States are as follows:
| Pay Date | Income | Taxes |
Institutional Class | 12/09/13 | $0.0972 | $0.0422 |
The fund will notify shareholders in January 2015 of amounts for use in preparing 2014 income tax returns.
Annual Report
Board Approval of Investment Advisory Contracts and Management Fees
Fidelity Emerging Markets Discovery Fund
Each year, the Board of Trustees, including the Independent Trustees (together, the Board), votes on the renewal of the management contract with Fidelity Management & Research Company (FMR) and the sub-advisory agreements (together, the Advisory Contracts) for the fund. The Board, assisted by the advice of fund counsel and Independent Trustees' counsel, requests and considers a broad range of information relevant to the renewal of the Advisory Contracts throughout the year.
The Board meets regularly and, at each of its meetings, covers an extensive agenda of topics and materials and considers factors that are relevant to its annual consideration of the renewal of the fund's Advisory Contracts, including the services and support provided to the fund and its shareholders. The Board has established various standing committees (Committees), each composed of and chaired by Independent Trustees with varying backgrounds, to which the Board has assigned specific subject matter responsibilities in order to enhance effective decision-making by the Board. The Board, acting directly and through its Committees, requests and receives information concerning the annual consideration of the renewal of the fund's Advisory Contracts. The Board also meets as needed to consider matters specifically related to the Board's annual consideration of the renewal of the Advisory Contracts. Members of the Board may also meet with trustees of other Fidelity funds through ad hoc joint committees to discuss certain matters relevant to the Fidelity funds.
At its July 2014 meeting, the Board, including the Independent Trustees, unanimously determined to renew the fund's Advisory Contracts. In reaching its determination, the Board considered all factors it believed relevant, including (i) the nature, extent, and quality of the services to be provided to the fund and its shareholders (including the investment performance of the fund); (ii) the competitiveness of the fund's management fee and total expense ratio relative to peer funds; (iii) the total costs of the services to be provided by and the profits to be realized by Fidelity from its relationship with the fund; (iv) the extent to which economies of scale exist and would be realized as the fund grows; and (v) whether fee levels reflect these economies of scale, if any, for the benefit of fund shareholders. In connection with separate internal corporate reorganizations involving Fidelity Management & Research (U.K.) Inc. (FMR U.K.) and Fidelity Management & Research (Japan) Inc. (FMR Japan), the Board approved certain non-material amendments to the fund's sub-advisory agreements with FMR U.K. and FMR Japan to reflect that, after these reorganizations, FMR Investment Management (UK) Limited and Fidelity Management & Research (Japan) Limited will carry on the business of FMR U.K. and FMR Japan, respectively. The Board noted that no changes to the portfolio managers or to the foreign research or investment advisory services provided to the fund were expected in connection with either reorganization and that the same personnel and resources would continue to be available to the fund at the new entities.
Annual Report
Board Approval of Investment Advisory Contracts and
Management Fees - continued
In considering whether to renew the Advisory Contracts for the fund, the Board reached a determination, with the assistance of fund counsel and Independent Trustees' counsel and through the exercise of its business judgment, that the renewal of the Advisory Contracts was in the best interests of the fund and its shareholders and that the compensation payable under the Advisory Contracts was fair and reasonable. The Board's decision to renew the Advisory Contracts was not based on any single factor, but rather was based on a comprehensive consideration of all the information provided to the Board at its meetings throughout the year. The Board, in reaching its determination to renew the Advisory Contracts, was aware that shareholders of the fund have a broad range of investment choices available to them, including a wide choice among funds offered by Fidelity's competitors, and that the fund's shareholders, who have the opportunity to review and weigh the disclosure provided by the fund in its prospectus and other public disclosures, have chosen to invest in this fund, which is part of the Fidelity family of funds.
Nature, Extent, and Quality of Services Provided. The Board considered Fidelity's staffing as it relates to the fund, including the backgrounds of investment personnel of FMR and the sub-advisers (together, the Investment Advisers), and also considered the fund's investment objective, strategies, and related investment philosophy. The Independent Trustees also had discussions with senior management of Fidelity's investment operations and investment groups. The Board considered the structure of the portfolio manager compensation program and whether this structure provides appropriate incentives to act in the best interests of the fund. Additionally, the Board considered the portfolio managers' investments, if any, in the funds that they manage.
Resources Dedicated to Investment Management and Support Services. The Board and the Fund Oversight and Research Committees reviewed the general qualifications and capabilities of Fidelity's investment staff, including its size, education, experience, and resources, as well as Fidelity's approach to recruiting, training, managing, and compensating investment personnel. The Board noted that Fidelity has continued to increase the resources devoted to non-U.S. offices, including expansion of Fidelity's global investment organization. The Board also noted that Fidelity's analysts have extensive resources, tools and capabilities that allow them to conduct sophisticated quantitative and fundamental analysis, as well as credit analysis of issuers, counterparties and guarantors. Further, the Board believes that Fidelity's investment professionals have sufficient access to global information and data so as to provide competitive investment results over time, and that those professionals also have access to sophisticated tools that permit them to assess portfolio construction and risk and performance attribution characteristics continuously, as well as to transmit new information and research conclusions rapidly around the world. Additionally, in its deliberations, the Board considered Fidelity's trading and risk management capabilities and resources and global compliance infrastructure, which are an integral part of the investment management process.
Annual Report
Shareholder and Administrative Services. The Board considered (i) the nature, extent, quality, and cost of advisory, administrative, and shareholder services performed by the Investment Advisers and their affiliates under the Advisory Contracts and under separate agreements covering transfer agency, pricing and bookkeeping, and securities lending services for the fund; (ii) the nature and extent of the supervision of third party service providers, principally custodians and subcustodians; and (iii) the resources devoted to, and the record of compliance with, the fund's compliance policies and procedures. The Board also reviewed the allocation of fund brokerage, including allocations to brokers affiliated with the Investment Advisers, the use of brokerage commissions to pay fund expenses, and the use of "soft" commission dollars to pay for research services.
The Board noted that the growth of fund assets over time across the complex allows Fidelity to reinvest in the development of services designed to enhance the value or convenience of the Fidelity funds as investment vehicles. These services include 24-hour access to account information and market information through telephone representatives and over the Internet, investor education materials and asset allocation tools, and the expanded availability of Fidelity Investor Centers.
In 2014, the Board formed an ad hoc Committee on Transfer Agency Fees to review the variety of transfer agency fee structures throughout the industry and Fidelity's competitive positioning with respect to industry participants.
Investment in a Large Fund Family. The Board considered the benefits to shareholders of investing in a Fidelity fund, including the benefits of investing in a fund that is part of a large family of funds offering a variety of investment disciplines and providing a large variety of mutual fund investor services. The Board noted that Fidelity had taken, or had made recommendations that resulted in the Fidelity funds taking, a number of actions over the previous year that benefited particular funds, including (i) continuing to dedicate additional resources to investment research and to the support of the senior management team that oversees asset management; (ii) persisting in efforts to enhance Fidelity's global research capabilities; (iii) launching new funds and making other enhancements to meet client needs for income-oriented solutions; (iv) reducing fund expenses for certain index funds; (v) continuing to launch dedicated lower cost underlying funds to meet portfolio construction needs related to expanding underlying fund options for Fidelity funds of funds, specifically for the Freedom Fund product lines; (vi) rationalizing product lines and gaining increased efficiencies through fund mergers; (vii) launching sector-based exchange-traded funds and establishing a new Fidelity adviser to manage sector-based funds and products; (viii) continuing to develop and implement technology to improve security and increase efficiency; (ix) modifying the eligibility criteria for certain share classes to increase their marketability to a portion of the defined contribution plan market; (x) waiving redemption fees for certain qualified fund-of-fund and wrap programs and certain retirement plan transactions; and (xi) launching new Institutional Class shares of certain money market funds to attract and retain assets and to fill a gap in the money market fund lineup.
Annual Report
Board Approval of Investment Advisory Contracts and
Management Fees - continued
Investment Performance. The Board considered whether the fund has operated in accordance with its investment objective, as well as its record of compliance with its investment restrictions and its performance history.
The Board took into account discussions with the Investment Advisers about fund investment performance that occur at Board meetings throughout the year. In this regard the Board noted that as part of regularly scheduled fund reviews and other reports to the Board on fund performance, the Board periodically considers annualized return information for the fund, for different time periods, measured against a securities market index ("benchmark index") and a peer group of funds with similar objectives ("peer group"). In its evaluation of fund investment performance, the Board gave particular attention to information indicating changes in performance of certain Fidelity funds for specific time periods and the Investment Advisers' explanations for any overperformance or underperformance.
In addition to reviewing absolute and relative fund performance, the Independent Trustees periodically consider the appropriateness of fund performance metrics in evaluating the results achieved. In general, the Independent Trustees believe that fund performance should be evaluated based on net performance (after fees and expenses) of both the highest performing and lowest performing classes, where applicable, compared to appropriate benchmark indices, over appropriate time periods which may include full market cycles, and compared to peer groups, as applicable, over the same periods, taking into account relevant factors including the following: general market conditions; issuer-specific information; tactical opportunities for investment; and fund cash flows and other factors.
The Independent Trustees recognize that shareholders evaluate performance on a net basis over their own holding periods, for which one-, three-, and five-year periods are often used as a proxy. For this reason, the performance information reviewed by the Board also included net cumulative calendar year total return information for the fund and an appropriate benchmark index and peer group for the most recent one-year period, as shown below. Returns are shown compared to the 25th percentile (top of box, 75% beaten) and 75th percentile (bottom of box, 25% beaten) of the peer universe.
Annual Report
Fidelity Emerging Markets Discovery Fund

Based on its review, the Board concluded that the nature, extent, and quality of services provided to the fund under the Advisory Contracts should benefit the fund's shareholders.
Competitiveness of Management Fee and Total Expense Ratio. The Board considered the fund's management fee and total expense ratio compared to "mapped groups" of competitive funds and classes. Fidelity creates "mapped groups" by combining similar Lipper investment objective categories that have comparable investment mandates. Combining Lipper investment objective categories aids the Board's management fee and total expense ratio comparisons by broadening the competitive group used for comparison and by reducing the number of universes to which various Fidelity funds are compared.
Management Fee. The Board considered two proprietary management fee comparisons for the 12-month (or shorter) periods shown in the chart below. The group of Lipper funds used by the Board for management fee comparisons is referred to below as the "Total Mapped Group." The Total Mapped Group comparison focuses on a fund's standing in terms of gross management fees before expense reimbursements or caps relative to the total universe of funds with comparable investment mandates, regardless of whether their management fee structures also are comparable. Funds with comparable investment mandates offer exposure to similar types of securities. Funds with comparable management fee structures have similar management fee contractual arrangements (e.g., flat rate charged for advisory services, all-inclusive fee rate, etc.). "TMG %" represents the percentage of funds in the Total Mapped Group that had management fees that were lower than the fund's. For example, a hypothetical TMG % of 20% would mean that 80% of the funds in the Total Mapped Group had higher, and 20% had lower, management fees than the fund. The fund's actual TMG %s are in the chart below. The "Asset-Size Peer Group" (ASPG) comparison focuses on a fund's standing relative to a subset of non-Fidelity funds within the Total Mapped Group that are similar in size and management fee structure. For example, if a fund is in the first quartile of the ASPG, the fund's management fee ranks in the least expensive or lowest 25% of funds in the ASPG. The ASPG represents at least 15% of the funds in the Total Mapped Group with comparable asset size and management fee structures, subject to a minimum of 50 funds (or all funds in the Total Mapped Group if fewer than 50). Additional information, such as the ASPG quartile in which the fund's management fee rate ranked, is also included in the chart and considered by the Board.
Annual Report
Board Approval of Investment Advisory Contracts and
Management Fees - continued
Fidelity Emerging Markets Discovery Fund

The Board noted that the fund's management fee rate ranked below the median of its Total Mapped Group and below the median of its ASPG for 2013.
The Board also noted that, in August 2013, the ad hoc Committee on Management Fees was formed to conduct an in-depth review of the management fee rates of Fidelity's active equity mutual funds. The Committee focused on the following areas: (i) standard fee structures; (ii) research consumption and trading evolution; (iii) management fee competitiveness/profitability by category; and (iv) factors that drive institutional pricing.
Based on its review, the Board concluded that the fund's management fee is fair and reasonable in light of the services that the fund receives and the other factors considered.
Annual Report
Total Expense Ratio. In its review of each class's total expense ratio the Board considered the fund's management fee as well as other fund or class expenses, as applicable, such as transfer agent fees, pricing and bookkeeping fees, fund-paid 12b-1 fees, and custodial, legal, and audit fees. The Board also noted the effects of any waivers and reimbursements on fees and expenses. As part of its review, the Board also considered the current and historical total expense ratios of each class of the fund compared to competitive fund median expenses. Each class of the fund is compared to those funds and classes in the Total Mapped Group (used by the Board for management fee comparisons) that have a similar sales load structure.
The Board noted that the total expense ratio of each of Class A and the retail class ranked equal to its competitive median for 2013 and the total expense ratio of each of Class T, Class C, and Institutional Class ranked above its competitive median for 2013. The Board considered that, in general, various factors can affect total expense ratios. The Board noted that the total expense ratio of Class T was above the competitive median primarily because of higher 12b-1 fees on Class T as compared to most competitor funds. Class T has a higher 12b-1 fee, but a lower front-end sales charge, than traditionally priced front-end sales charge classes. The Board considered that Class T is primarily sold load-waived in the retirement plan market where its 0.50% 12b-1 fee is comparable to competing no-load, higher 12b-1 fee classes designed specifically for retirement plans. The Board noted that the fund offers multiple classes, each of which has a different sales load and 12b-1 fee structure, and that the multiple structures are intended to offer a range of pricing options for the intermediary market. The Board also noted that the total expense ratios of the classes of the fund vary primarily by the level of their 12b-1 fees, although differences in transfer agent fees may also cause expenses to vary from class to class.
The Board further considered that FMR contractually agreed to reimburse Class A, Class T, Class C, Institutional Class and the retail class of the fund to the extent that total operating expenses (excluding interest, certain taxes, certain securities lending costs, brokerage commissions, extraordinary expenses, and acquired fund fees and expenses, if any), as a percentage of their respective average net assets, exceed 1.70%, 1.95%, 2.45%, 1.45%, and 1.45% through December 31, 2014.
Fees Charged to Other Fidelity Clients. The Board also considered Fidelity fee structures and other information with respect to clients of Fidelity, such as other funds advised or subadvised by Fidelity, pension plan clients, and other institutional clients. The Board noted the findings of the 2013 ad hoc joint committee (created with the board of other Fidelity funds), which reviewed and compared Fidelity's institutional investment advisory business with its business of providing services to the Fidelity funds, including the differences in services provided, fees charged, and costs incurred, as well as competition in their respective marketplaces.
Annual Report
Board Approval of Investment Advisory Contracts and
Management Fees - continued
Based on its review of total expense ratios and fees charged to other Fidelity clients, the Board concluded that the total expense ratio of each class of the fund was reasonable, although in some cases above the median of the universe presented for comparison, in light of the services that the fund and its shareholders receive and the other factors considered.
Costs of the Services and Profitability. The Board considered the revenues earned and the expenses incurred by Fidelity in conducting the business of developing, marketing, distributing, managing, administering and servicing the fund and servicing the fund's shareholders. The Board also considered the level of Fidelity's profits in respect of all the Fidelity funds.
On an annual basis, Fidelity presents to the Board Fidelity's profitability for the fund. Fidelity calculates the profitability for each fund, as well as aggregate profitability for groups of Fidelity funds and all Fidelity funds, using a series of detailed revenue and cost allocation methodologies which originate with the books and records of Fidelity on which Fidelity's audited financial statements are based. The Audit Committee of the Board reviews any significant changes from the prior year's methodologies.
PricewaterhouseCoopers LLP (PwC), independent registered public accounting firm and auditor to Fidelity and certain Fidelity funds, has been engaged annually by the Board as part of the Board's assessment of Fidelity's profitability analysis. PwC's engagement includes the review and assessment of the methodologies used by Fidelity in determining the revenues and expenses attributable to Fidelity's mutual fund business, and completion of agreed-upon procedures in respect of the mathematical accuracy of fund profitability and its conformity to established allocation methodologies. After considering PwC's reports issued under the engagement and information provided by Fidelity, the Board concluded that while other allocation methods may also be reasonable, Fidelity's profitability methodologies are reasonable in all material respects.
The Board also reviewed Fidelity's non-fund businesses and fall-out benefits related to the mutual fund business as well as cases where Fidelity's affiliates may benefit from or be related to the fund's business.
The Board considered the costs of the services provided by and the profits realized by Fidelity in connection with the operation of the fund and was satisfied that the profitability was not excessive in the circumstances.
Economies of Scale. The Board considered whether there have been economies of scale in respect of the management of the Fidelity funds, whether the Fidelity funds (including the fund) have appropriately benefited from any such economies of scale, and whether there is potential for realization of any further economies of scale. The Board considered the extent to which the fund will benefit from economies of scale through increased services to the fund, through waivers or reimbursements, or through fee or expense ratio reductions. The Board also noted that in 2013, it and the boards of other Fidelity funds created an ad hoc committee (the Economies of Scale Committee) to analyze whether Fidelity attains economies of scale in respect of the management and servicing of the Fidelity funds, whether the Fidelity funds have appropriately benefited from such economies of scale, and whether there is potential for realization of any further economies of scale.
Annual Report
The Board recognized that the fund's management contract incorporates a "group fee" structure, which provides for lower group fee rates as total group assets increase, and for higher group fee rates as total group assets decrease (with "group assets" defined to include fund assets under FMR's management plus sector fund assets previously under FMR's management and currently managed by Fidelity SelectCo, LLC). FMR calculates the group fee rates based on a tiered asset "breakpoint" schedule that varies based on asset class. The Board considered that the group fee is designed to deliver the benefits of economies of scale to fund shareholders when total Fidelity fund assets increase, even if assets of any particular fund are unchanged or have declined, because some portion of Fidelity's costs are attributable to services provided to all Fidelity funds, and all funds benefit if those costs can be allocated among more assets. The Board concluded that, given the group fee structure, fund shareholders will benefit from lower management fees as group assets increase at the fund complex level, regardless of whether Fidelity achieves any such economies of scale.
The Board concluded, taking into account the analysis of the Economies of Scale Committee, that economies of scale, if any, are being appropriately shared between fund shareholders and Fidelity.
Additional Information Requested by the Board. In order to develop fully the factual basis for consideration of the Fidelity funds' Advisory Contracts, the Board requested and received additional information on certain topics, including: (i) fund performance trends and Fidelity's long-term strategies for certain funds; (ii) the potential to further rationalize the Fidelity fund lineup with the possibility of achieving savings for the funds and Fidelity; (iii) the methodology with respect to competitive fund data and peer group classifications; (iv) the arrangements with, and performance of, certain sub-advisers on behalf of the Fidelity funds, as well as certain proposed participating affiliate arrangements; (v) the realization of fall-out benefits in certain Fidelity business units; (vi) Fidelity's group fee structures, including the rationale for the individual fee rates of certain categories of funds and the definition of group assets; (vii) trends regarding industry use of performance fee structures and the performance adjustment methodologies applicable to the Fidelity funds; (viii) additional competitive analysis regarding the total expenses for certain classes; and (ix) fund profitability methodology, including Fidelity's cost allocation methodology, and the impact of certain factors on fund profitability results.
Annual Report
Board Approval of Investment Advisory Contracts and
Management Fees - continued
Based on its evaluation of all of the conclusions noted above, and after considering all factors it believed relevant, the Board ultimately concluded that the advisory fee structures are fair and reasonable, and that the fund's Advisory Contracts should be renewed.
Annual Report
Investment Adviser
Fidelity Management & Research Company
Boston, MA
Investment Sub-Advisers
FMR Co., Inc.
Fidelity Management & Research
(U.K.) Inc.
Fidelity Management & Research
(Hong Kong) Limited
Fidelity Management & Research
(Japan) Limited
FIL Investments (Japan) Limited
FIL Investment Advisors (UK) Limited
FIL Investment Advisors
General Distributor
Fidelity Distributors Corporation
Smithfield, RI
Transfer and Service Agents
Fidelity Investments Institutional Operations Company, Inc.
Boston, MA
Fidelity Service Company, Inc.
Boston, MA
Custodian
The Northern Trust Company
Chicago, IL
(Fidelity Investment logo)(registered trademark)
AEMDI-UANN-1214
1.931242.102
Fidelity®
Emerging Markets Discovery
Fund
and Fidelity®
Total Emerging Markets
Fund
Annual Report
October 31, 2014
(Fidelity Cover Art)
Contents
Fidelity® Emerging Markets Discovery Fund |
Performance | (Click Here) | How the fund has done over time. |
Management's Discussion of Fund Performance | (Click Here) | The Portfolio Managers' review of fund performance and strategy. |
Shareholder Expense Example | (Click Here) | An example of shareholder expenses. |
Investment Changes | (Click Here) | A summary of major shifts in the fund's investments over the past six months. |
Investments | (Click Here) | A complete list of the fund's investments with their market values. |
Financial Statements | (Click Here) | Statements of assets and liabilities, operations, and changes in net assets, as well as financial highlights. |
Notes | (Click Here) | Notes to the Financial Statements. |
Fidelity Total Emerging Markets Fund |
Performance | (Click Here) | How the fund has done over time. |
Management's Discussion of Fund Performance | (Click Here) | The Portfolio Manager's review of fund performance and strategy. |
Shareholder Expense Example | (Click Here) | An example of shareholder expenses. |
Investment Changes | (Click Here) | A summary of major shifts in the fund's investments over the past six months. |
Investments | (Click Here) | A complete list of the fund's investments with their market values. |
Financial Statements | (Click Here) | Statements of assets and liabilities, operations, and changes in net assets, as well as financial highlights. |
Notes | (Click Here) | Notes to the Financial Statements. |
Report of Independent Registered Public Accounting Firm | (Click Here) | |
Trustees and Officers | (Click Here) | |
Distributions | (Click Here) | |
Board Approval of Investment Advisory Contracts and Management Fees | (Click Here) | |
Annual Report
To view a fund's proxy voting guidelines and proxy voting record for the 12-month period ended June 30, visit http://www.fidelity.com/proxyvotingresults or visit the Securities and Exchange Commission's (SEC) web site at http://www.sec.gov. You may also call 1-800-544-8544 to request a free copy of the proxy voting guidelines.
Standard & Poor's, S&P and S&P 500 are registered service marks of The McGraw-Hill Companies, Inc. and have been licensed for use by Fidelity Distributors Corporation.
Other third-party marks appearing herein are the property of their respective owners.
All other marks appearing herein are registered or unregistered trademarks or service marks of FMR LLC or an affiliated company. © 2014 FMR LLC. All rights reserved.
This report and the financial statements contained herein are submitted for the general information of the shareholders of the funds. This report is not authorized for distribution to prospective investors in the funds unless preceded or accompanied by an effective prospectus.
A fund files its complete schedule of portfolio holdings with the SEC for the first and third quarters of each fiscal year on Form N-Q. Forms N-Q are available on the SEC's web site at http://www.sec.gov. A fund's Forms N-Q may be reviewed and copied at the SEC's Public Reference Room in Washington, DC. Information regarding the operation of the SEC's Public Reference Room may be obtained by calling 1-800-SEC-0330. For a complete list of a fund's portfolio holdings, view the most recent holdings listing, semiannual report, or annual report on Fidelity's web site at http://www.fidelity.com, http://www.advisor.fidelity.com, or http://www.401k.com, as applicable.
NOT FDIC INSURED • MAY LOSE VALUE • NO BANK GUARANTEE
Neither the funds nor Fidelity Distributors Corporation is a bank.
Annual Report
Fidelity Emerging Markets Discovery Fund
Average annual total return reflects the change in the value of an investment, assuming reinvestment of the fund's distributions from dividend income and capital gains (the profits earned upon the sale of securities that have grown in value, if any) and assuming a constant rate of performance each year. The $10,000 table and the fund's returns do not reflect the deduction of taxes that a shareholder would pay on fund distributions or the redemption of fund shares. During periods of reimbursement by Fidelity, a fund's total return will be greater than it would be had the reimbursement not occurred. How a fund did yesterday is no guarantee of how it will do tomorrow.
Average Annual Total Returns
Periods ended October 31, 2014 | Past 1
year | Life of
fund A |
Fidelity® Emerging Markets Discovery Fund | 0.61% | 8.84% |
A From November 1, 2011
$10,000 Over Life of Fund
Let's say hypothetically that $10,000 was invested in Fidelity® Emerging Markets Discovery Fund, a class of the fund, on November 1, 2011, when the fund started. The chart shows how the value of your investment would have changed, and also shows how the MSCI Emerging Markets SMID Cap Index performed over the same period.
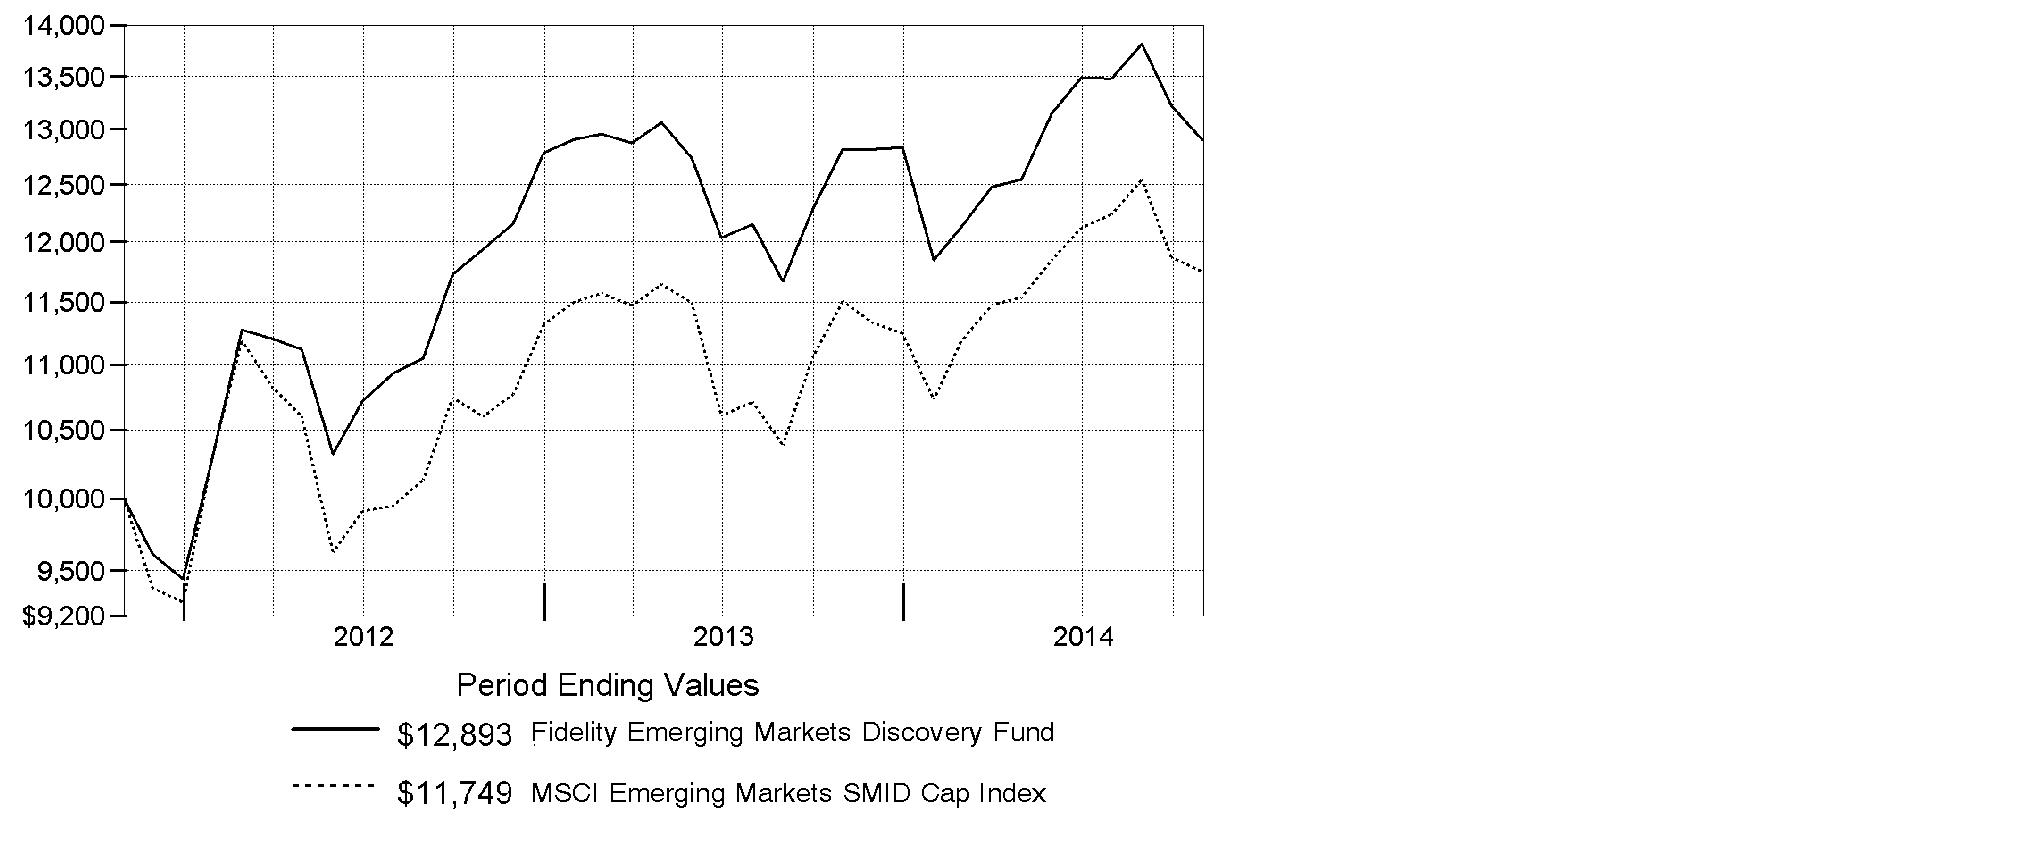
Annual Report
Fidelity Emerging Markets Discovery Fund
Market Recap: Global equities posted a healthy gain for the 12 months ending October 31, 2014, overcoming an October market decline driven by recessionary pressures in China and tepid growth in Europe. The MSCI ACWI (All Country World Index) Index rose 8.15%, helped by subdued market volatility for much of the period and supported by solid corporate earnings, especially in the United States. Stocks also benefited from easy monetary policies in Japan and the eurozone, as well as increased stimulus efforts in China. All but three of the 24 industry groups that compose the index marked a positive return. The U.S. (+17%) remained a pillar of strength, while a strongly rising dollar in the latter part of the period detracted from investors' returns in most non-U.S. markets. Canada (+5%) notched broad gains outside of its energy and materials sectors, as did Asia-Pacific ex Japan (+4%), led by investor enthusiasm for companies in India. The U.K., Europe and Japan, meanwhile, all underperformed. Among sectors, health care (+24%) led the index, with a strong contribution from the pharmaceuticals, biotechnology & life sciences industry. Information technology (+21%) also outperformed. Conversely, materials (-4%) and energy (-1%) lagged the index due to a higher supply of and lower demand for commodities.
Comments from Sam Polyak and James Hayes, who became Co-Portfolio Managers of Fidelity® Emerging Markets Discovery Fund on June 21, 2014, as part of the Fidelity Stock Selector Emerging Markets Group: For the year, the fund's Retail Class shares returned 0.61%, trailing the 2.14% gain of the MSCI Emerging Markets SMID Cap Index. Versus the index, stock selection was particularly challenging in South Korea, Taiwan and China. At the stock level, it hurt to have an average overweighting in South African lender African Bank Investments Limited, which suffered amid ongoing sluggishness in South Africa's credit cycle. We sold the fund's stake during the period. Taiwan-based medical equipment supplier Pacific Hospital Supply was another big relative detractor that we sold from the fund by period end. China-based oil & gas exploration & production firm Hilong Holding hurt the most, as it missed earnings expectations. Stock selection in India by far added the most value, but as a group we reduced the fund's exposure here. A non-index stake in Punjab National Bank was the top individual contributor for the period, and we sold it by period end. Other top contributors that we sold or reduced were India-based credit rating services firm Credit Analysis & Research and KEPCO Plant Services & Engineering, a South Korean company that provides maintenance and operations services for power plants.
The views expressed above reflect those of the portfolio manager(s) only through the end of the period as stated on the cover of this report and do not necessarily represent the views of Fidelity or any other person in the Fidelity organization. Any such views are subject to change at any time based upon market or other conditions and Fidelity disclaims any responsibility to update such views. These views may not be relied on as investment advice and, because investment decisions for a Fidelity fund are based on numerous factors, may not be relied on as an indication of trading intent on behalf of any Fidelity fund.
Annual Report
Fidelity Emerging Markets Discovery Fund
Shareholder Expense Example
As a shareholder of the Fund, you incur two types of costs: (1) transaction costs, including sales charges (loads) on purchase payments or redemption proceeds, redemption fees and (2) ongoing costs, including management fees, distribution and/or service (12b-1) fees and other Fund expenses. This Example is intended to help you understand your ongoing costs (in dollars) of investing in the Fund and to compare these costs with the ongoing costs of investing in other mutual funds.
The Example is based on an investment of $1,000 invested at the beginning of the period and held for the entire period (May 1, 2014 to October 31, 2014).
Actual Expenses
The first line of the accompanying table for each class of the Fund provides information about actual account values and actual expenses. You may use the information in this line, together with the amount you invested, to estimate the expenses that you paid over the period. Simply divide your account value by $1,000.00 (for example, an $8,600 account value divided by $1,000.00 = 8.6), then multiply the result by the number in the first line for a class of the Fund under the heading entitled "Expenses Paid During Period" to estimate the expenses you paid on your account during this period. A small balance maintenance fee of $12.00 that is charged once a year may apply for certain accounts with a value of less than $2,000. This fee is not included in the table below. If it was, the estimate of expenses you paid during the period would be higher, and your ending account value lower, by this amount. In addition, the Fund, as a shareholder in the underlying Fidelity Central Funds, will indirectly bear its pro-rata share of the fees and expenses incurred by the underlying Fidelity Central Funds. These fees and expenses are not included in the Fund's annualized expense ratio used to calculate the expense estimate in the table below.
Hypothetical Example for Comparison Purposes
The second line of the accompanying table for each class of the Fund provides information about hypothetical account values and hypothetical expenses based on a Class' actual expense ratio and an assumed rate of return of 5% per year before expenses, which is not the Class' actual return. The hypothetical account values and expenses may not be used to estimate the actual ending account balance or expenses you paid for the period. You may use this information to compare the ongoing costs of investing in the Fund and other funds. To do so, compare this 5% hypothetical example with the 5% hypothetical examples that appear in the shareholder reports of the other funds. A small balance maintenance fee of $12.00 that is charged once a year may apply for certain accounts with a value of less than $2,000. This fee is not included in the table below. If it was, the estimate of expenses you paid during the period would be higher, and your ending account value lower, by this amount. In addition, the Fund, as a shareholder in the underlying Fidelity Central Funds, will indirectly bear its pro-rata share of the fees and expenses incurred by the underlying Fidelity Central Funds. These fees and expenses are not included in the Fund's annualized expense ratio used to calculate the expense estimate in the table below.
Please note that the expenses shown in the table are meant to highlight your ongoing costs only and do not reflect any transaction costs. Therefore, the second line of the table is useful in comparing ongoing costs only, and will not help you determine the relative total costs of owning different funds. In addition, if these transactional costs were included, your costs would have been higher.
Annual Report
| Annualized
Expense RatioB | Beginning
Account Value
May 1, 2014 | Ending
Account Value
October 31, 2014 | Expenses Paid
During Period*
May 1, 2014
to October 31, 2014 |
Class A | 1.70% | | | |
Actual | | $ 1,000.00 | $ 1,026.10 | $ 8.68 |
HypotheticalA | | $ 1,000.00 | $ 1,016.64 | $ 8.64 |
Class T | 1.95% | | | |
Actual | | $ 1,000.00 | $ 1,024.50 | $ 9.95 |
HypotheticalA | | $ 1,000.00 | $ 1,015.38 | $ 9.91 |
Class C | 2.45% | | | |
Actual | | $ 1,000.00 | $ 1,022.10 | $ 12.49 |
HypotheticalA | | $ 1,000.00 | $ 1,012.85 | $ 12.43 |
Emerging Markets Discovery | 1.45% | | | |
Actual | | $ 1,000.00 | $ 1,027.80 | $ 7.41 |
HypotheticalA | | $ 1,000.00 | $ 1,017.90 | $ 7.38 |
Institutional Class | 1.45% | | | |
Actual | | $ 1,000.00 | $ 1,027.70 | $ 7.41 |
HypotheticalA | | $ 1,000.00 | $ 1,017.90 | $ 7.38 |
A 5% return per year before expenses
B Annualized expense ratio reflects expenses net of applicable fee waivers.
* Expenses are equal to each Class' annualized expense ratio, multiplied by the average account value over the period, multiplied by 184/365 (to reflect the one-half year period).
Annual Report
Fidelity Emerging Markets Discovery Fund
Investment Changes (Unaudited)
Top Five Stocks as of October 31, 2014 |
| % of fund's
net assets | % of fund's net assets
6 months ago |
Quinenco SA (Chile, Industrial Conglomerates) | 2.0 | 1.2 |
Daewoo International Corp. (Korea (South), Trading Companies & Distributors) | 2.0 | 0.0 |
Techtronic Industries Co. Ltd. (Hong Kong, Household Durables) | 1.9 | 0.6 |
Yes Bank Ltd. (India, Banks) | 1.6 | 0.0 |
Robinsons Land Corp. (Philippines, Real Estate Management & Development) | 1.6 | 0.0 |
| 9.1 | |
Top Five Market Sectors as of October 31, 2014 |
| % of fund's
net assets | % of fund's net assets
6 months ago |
Financials | 18.2 | 15.9 |
Industrials | 17.4 | 20.6 |
Consumer Discretionary | 16.9 | 16.8 |
Information Technology | 13.4 | 13.4 |
Materials | 9.8 | 3.1 |
Top Five Countries as of October 31, 2014 |
(excluding cash equivalents) | % of fund's
net assets | % of fund's net assets
6 months ago |
India | 14.9 | 20.3 |
Korea (South) | 14.1 | 14.8 |
Cayman Islands | 14.1 | 10.7 |
Brazil | 7.1 | 2.4 |
Taiwan | 6.4 | 16.6 |
Percentages are adjusted for the effect of open futures contracts, if applicable. |
Asset Allocation (% of fund's net assets) |
As of October 31, 2014 | As of April 30, 2014 |
 | Stocks 94.9% | | | Stocks 97.9% | |
 | Short-Term
Investments and
Net Other Assets (Liabilities) 5.1% | | | Short-Term
Investments and
Net Other Assets (Liabilities) 2.1% | |

Annual Report
Fidelity Emerging Markets Discovery Fund
Investments October 31, 2014
Showing Percentage of Net Assets
Common Stocks - 89.6% |
| Shares | | Value |
Argentina - 0.4% |
Inversiones y Representaciones SA ADR | 26,400 | | $ 388,872 |
Bermuda - 4.6% |
Aquarius Platinum Ltd. (Australia) (a) | 2,369,945 | | 644,999 |
ChipMOS TECHNOLOGIES (Bermuda) Ltd. | 28,000 | | 601,440 |
Shangri-La Asia Ltd. | 660,000 | | 958,323 |
Vtech Holdings Ltd. | 50,100 | | 630,424 |
Yue Yuen Industrial (Holdings) Ltd. | 359,000 | | 1,205,158 |
TOTAL BERMUDA | | 4,040,344 |
Brazil - 2.3% |
Cosan SA Industria e Comercio | 20,900 | | 291,751 |
Localiza Rent A Car SA | 4,500 | | 64,869 |
Mills Estruturas e Servicos de Engenharia SA | 9,900 | | 64,524 |
Minerva SA (a) | 169,400 | | 871,645 |
QGEP Participacoes SA | 18,400 | | 66,905 |
Qualicorp SA (a) | 64,200 | | 652,908 |
TOTAL BRAZIL | | 2,012,602 |
British Virgin Islands - 0.7% |
Luxoft Holding, Inc. (a) | 15,500 | | 619,845 |
Canada - 1.0% |
Pan American Silver Corp. | 53,100 | | 490,113 |
Torex Gold Resources, Inc. (a) | 343,100 | | 365,308 |
TOTAL CANADA | | 855,421 |
Cayman Islands - 14.1% |
58.com, Inc. ADR (d) | 20,100 | | 795,357 |
Anta Sports Products Ltd. | 288,000 | | 565,283 |
China Cord Blood Corp. (a) | 125,200 | | 637,268 |
China Lodging Group Ltd. ADR (a) | 44,200 | | 1,215,058 |
China ZhengTong Auto Services Holdings Ltd. | 1,247,000 | | 706,427 |
Cimc Enric Holdings Ltd. | 714,000 | | 718,002 |
Greatview Aseptic Pack Co. Ltd. | 394,000 | | 259,380 |
Haitian International Holdings Ltd. | 350,000 | | 750,777 |
Hilong Holding Ltd. | 1,463,000 | | 475,375 |
Lee & Man Paper Manufacturing Ltd. | 1,307,000 | | 717,250 |
Lee's Pharmaceutical Holdings Ltd. | 430,500 | | 592,480 |
Leju Holdings Ltd. ADR (d) | 29,800 | | 417,200 |
Pico Far East Holdings Ltd. | 2,778,000 | | 687,969 |
Semiconductor Manufacturing International Corp. (a) | 6,178,000 | | 640,516 |
Silergy Corp. | 56,520 | | 391,373 |
SITC International Holdings Co. Ltd. | 1,888,000 | | 1,005,734 |
Common Stocks - continued |
| Shares | | Value |
Cayman Islands - continued |
Uni-President China Holdings Ltd. | 1,057,000 | | $ 982,132 |
Wisdom Holdings Group | 935,000 | | 723,655 |
TOTAL CAYMAN ISLANDS | | 12,281,236 |
Chile - 4.1% |
Embotelladora Andina SA sponsored ADR | 21,053 | | 391,796 |
Inversiones La Construccion SA | 66,001 | | 940,545 |
Quinenco SA | 852,780 | | 1,771,009 |
Vina Concha y Toro SA | 242,484 | | 463,628 |
TOTAL CHILE | | 3,566,978 |
China - 2.6% |
BBMG Corp. (H Shares) | 1,315,500 | | 930,206 |
China Suntien Green Energy Corp. Ltd. (H Shares) | 890,000 | | 236,386 |
Maanshan Iron & Steel Ltd. (H Shares) (a) | 2,064,000 | | 538,180 |
Tong Ren Tang Technologies Co. Ltd. (H Shares) | 441,000 | | 592,624 |
TOTAL CHINA | | 2,297,396 |
Colombia - 0.5% |
Organizacion Terpel SA (a) | 45,114 | | 393,802 |
Egypt - 0.9% |
Citadel Capital Corp. (a) | 1,411,500 | | 781,748 |
Greece - 0.4% |
Public Power Corp. of Greece (a) | 41,680 | | 316,522 |
Hong Kong - 3.1% |
China Power International Development Ltd. | 568,000 | | 256,578 |
Far East Horizon Ltd. | 834,000 | | 775,668 |
Techtronic Industries Co. Ltd. | 527,500 | | 1,651,393 |
TOTAL HONG KONG | | 2,683,639 |
India - 14.9% |
Adani Ports & Special Economic Zone | 146,053 | | 678,875 |
CMC Ltd. | 27,927 | | 893,604 |
Exide Industries Ltd. | 370,061 | | 948,772 |
GAIL India Ltd. | 64,387 | | 553,403 |
Grasim Industries Ltd. | 15,189 | | 911,465 |
Havells India Ltd. | 181,890 | | 845,935 |
IDFC Ltd. (a) | 199,271 | | 518,543 |
Iifl Holdings Ltd. | 239,330 | | 666,664 |
Ipca Laboratories Ltd. | 49,210 | | 587,543 |
JK Cement Ltd. | 57,507 | | 564,863 |
KPIT Cummins Infosystems Ltd. (a) | 230,698 | | 623,144 |
Common Stocks - continued |
| Shares | | Value |
India - continued |
Lupin Ltd. | 29,712 | | $ 687,933 |
Mahindra Lifespace Developers Ltd. | 75,033 | | 623,350 |
MindTree Consulting Ltd. | 22,113 | | 393,741 |
Shriram Transport Finance Co. Ltd. | 36,068 | | 557,960 |
Tech Mahindra Ltd. | 23,911 | | 980,154 |
The Jammu & Kashmir Bank Ltd. | 237,424 | | 537,872 |
Yes Bank Ltd. | 126,518 | | 1,432,651 |
TOTAL INDIA | | 13,006,472 |
Israel - 1.2% |
Bezeq The Israel Telecommunication Corp. Ltd. | 334,300 | | 565,164 |
NICE Systems Ltd. sponsored ADR | 12,800 | | 520,704 |
TOTAL ISRAEL | | 1,085,868 |
Korea (South) - 13.6% |
AMOREPACIFIC Group, Inc. | 860 | | 946,889 |
Binggrea Co. Ltd. | 5,675 | | 436,805 |
Daewoo International Corp. | 54,893 | | 1,729,384 |
DGB Financial Group Co. Ltd. | 73,881 | | 1,048,621 |
E-Mart Co. Ltd. | 3,822 | | 704,323 |
Fila Korea Ltd. | 11,372 | | 1,180,124 |
Hyundai HCN | 91,864 | | 388,593 |
Hyundai Industrial Development & Construction Co. | 27,329 | | 1,026,321 |
Hyundai Wia Corp. | 4,303 | | 738,896 |
KEPCO Plant Service & Engineering Co. Ltd. | 9,301 | | 759,181 |
Kolon Life Science, Inc. | 9,808 | | 469,201 |
Korean Reinsurance Co. | 110,469 | | 1,172,090 |
Leeno Industrial, Inc. | 18,227 | | 721,823 |
Sungshin Cement Manufacturing Co. Ltd. (a) | 69,388 | | 530,204 |
TOTAL KOREA (SOUTH) | | 11,852,455 |
Malaysia - 0.7% |
Top Glove Corp. Bhd | 409,700 | | 609,287 |
Mexico - 5.1% |
Credito Real S.A.B. de CV | 248,500 | | 638,862 |
Grupo Aeroportuario del Pacifico SA de CV Series B | 73,900 | | 502,792 |
Grupo Aeroportuario Norte S.A.B. de CV | 100,300 | | 499,703 |
Grupo Comercial Chedraui S.A.B. de CV | 158,800 | | 558,608 |
Macquarie Mexican (REIT) | 452,700 | | 822,281 |
Megacable Holdings S.A.B. de CV unit | 180,400 | | 826,427 |
Qualitas Controladora S.A.B. de CV | 238,700 | | 617,389 |
TOTAL MEXICO | | 4,466,062 |
Common Stocks - continued |
| Shares | | Value |
Nigeria - 1.6% |
Transnational Corp. of Nigeria PLC | 18,107,275 | | $ 441,614 |
Zenith Bank PLC | 7,682,382 | | 983,196 |
TOTAL NIGERIA | | 1,424,810 |
Panama - 0.5% |
Copa Holdings SA Class A | 3,600 | | 420,912 |
Philippines - 4.0% |
Alliance Global Group, Inc. | 1,642,600 | | 923,896 |
LT Group, Inc. | 2,559,600 | | 810,291 |
PNOC Energy Development Corp. | 2,149,700 | | 368,042 |
Robinsons Land Corp. | 2,454,500 | | 1,340,007 |
TOTAL PHILIPPINES | | 3,442,236 |
Poland - 1.3% |
Cyfrowy Polsat SA | 144,100 | | 1,102,145 |
Singapore - 0.5% |
First Resources Ltd. | 272,000 | | 440,663 |
South Africa - 1.1% |
Alexander Forbes Group Holding (a) | 529,819 | | 413,105 |
Blue Label Telecoms Ltd. | 572,100 | | 505,721 |
TOTAL SOUTH AFRICA | | 918,826 |
Sri Lanka - 0.9% |
John Keells Holdings Ltd. | 378,368 | | 744,150 |
Taiwan - 6.4% |
ASPEED Tech, Inc. | 5,902 | | 45,049 |
Chicony Electronics Co. Ltd. | 207,120 | | 595,521 |
Chroma ATE, Inc. | 359,000 | | 894,105 |
Cleanaway Co. Ltd. | 123,000 | | 545,948 |
Cub Elecparts, Inc. | 57,000 | | 600,398 |
EPISTAR Corp. | 216,000 | | 389,985 |
Everlight Electronics Co. Ltd. | 208,000 | | 394,031 |
GeoVision, Inc. | 8,300 | | 30,142 |
Lextar Electronics Corp. | 361,000 | | 300,830 |
MJC Probe, Inc. | 172,000 | | 513,350 |
St.Shine Optical Co. Ltd. | 31,000 | | 543,757 |
Taiwan Fertilizer Co. Ltd. | 3,000 | | 5,314 |
Universal Cement Corp. | 125,000 | | 109,865 |
Voltronic Power Technology Corp. | 69,000 | | 556,366 |
TOTAL TAIWAN | | 5,524,661 |
Common Stocks - continued |
| Shares | | Value |
Thailand - 0.6% |
Thai Union Frozen Products PCL (For. Reg.) | 232,400 | | $ 531,392 |
Turkey - 1.8% |
Aksa Akrilik Kimya Sanayii | 176,518 | | 580,544 |
Aselsan A/S | 30,000 | | 136,324 |
Aygaz A/S | 77,000 | | 324,608 |
Tupras Turkiye Petrol Rafinelleri A/S | 24,000 | | 521,000 |
TOTAL TURKEY | | 1,562,476 |
Uganda - 0.5% |
Umeme Ltd. | 2,130,383 | | 401,662 |
Vietnam - 0.2% |
FTP Corp. | 67,000 | | 160,573 |
TOTAL COMMON STOCKS (Cost $76,358,182) |
77,933,055
|
Nonconvertible Preferred Stocks - 5.3% |
| | | |
Brazil - 4.8% |
Banco do Estado Rio Grande do Sul SA | 151,800 | | 906,671 |
Bradespar SA (PN) | 108,900 | | 735,698 |
Braskem SA (PN-A) | 140,700 | | 1,029,457 |
Marcopolo SA (PN) | 425,700 | | 728,426 |
Metalurgica Gerdau SA (PN) | 150,300 | | 812,793 |
TOTAL BRAZIL | | 4,213,045 |
Korea (South) - 0.5% |
Samsung Fire & Marine Insurance Co. Ltd. | 2,451 | | 461,938 |
TOTAL NONCONVERTIBLE PREFERRED STOCKS (Cost $4,838,768) |
4,674,983
|
Money Market Funds - 7.3% |
| Shares | | Value |
Fidelity Cash Central Fund, 0.11% (b) | 5,332,684 | | $ 5,332,684 |
Fidelity Securities Lending Cash Central Fund, 0.11% (b)(c) | 1,002,600 | | 1,002,600 |
TOTAL MONEY MARKET FUNDS (Cost $6,335,284) |
6,335,284
|
TOTAL INVESTMENT PORTFOLIO - 102.2% (Cost $87,532,234) | | 88,943,322 |
NET OTHER ASSETS (LIABILITIES) - (2.2)% | | (1,942,286) |
NET ASSETS - 100% | $ 87,001,036 |
Legend |
(a) Non-income producing |
(b) Affiliated fund that is generally available only to investment companies and other accounts managed by Fidelity Investments. The rate quoted is the annualized seven-day yield of the fund at period end. A complete unaudited listing of the fund's holdings as of its most recent quarter end is available upon request. In addition, each Fidelity Central Fund's financial statements, which are not covered by the Fund's Report of Independent Registered Public Accounting Firm, are available on the SEC's website or upon request. |
(c) Investment made with cash collateral received from securities on loan. |
(d) Security or a portion of the security is on loan at period end. |
Affiliated Central Funds |
Information regarding fiscal year to date income earned by the Fund from investments in Fidelity Central Funds is as follows: |
Fund | Income earned |
Fidelity Cash Central Fund | $ 2,220 |
Fidelity Securities Lending Cash Central Fund | 22,418 |
Total | $ 24,638 |
Other Information |
Categorizations in the Schedule of Investments are based on country or territory of incorporation. |
The following is a summary of the inputs used, as of October 31, 2014, involving the Fund's assets and liabilities carried at fair value. The inputs or methodology used for valuing securities may not be an indication of the risk associated with investing in those securities. For more information on valuation inputs, and their aggregation into the levels used in the table below, please refer to the Investment Valuation section in the accompanying Notes to Financial Statements. |
Valuation Inputs at Reporting Date: |
Description | Total | Level 1 | Level 2 | Level 3 |
Investments in Securities: | | | | |
Equities: | | | | |
Consumer Discretionary | $ 14,472,967 | $ 6,425,589 | $ 8,047,378 | $ - |
Consumer Staples | 7,138,172 | 4,373,694 | 2,764,478 | - |
Energy | 1,591,417 | 879,656 | 711,761 | - |
Financials | 16,069,647 | 9,616,932 | 6,452,715 | - |
Health Care | 5,373,001 | 1,759,377 | 3,613,624 | - |
Industrials | 14,978,849 | 8,953,316 | 6,025,533 | - |
Information Technology | 11,552,911 | 3,836,942 | 7,715,969 | - |
Materials | 8,645,095 | 3,963,573 | 4,681,522 | - |
Telecommunication Services | 565,164 | 565,164 | - | - |
Utilities | 2,220,815 | 1,042,792 | 1,178,023 | - |
Money Market Funds | 6,335,284 | 6,335,284 | - | - |
Total Investments in Securities: | $ 88,943,322 | $ 47,752,319 | $ 41,191,003 | $ - |
The following is a summary of transfers between Level 1 and Level 2 for the period ended October 31, 2014. Transfers are assumed to have occurred at the beginning of the period, and are primarily attributable to the valuation techniques used for foreign equity securities, as discussed in the accompanying Notes to Financial Statements: |
Transfers | Total |
Level 1 to Level 2 | $ 10,239,253 |
Level 2 to Level 1 | $ 0 |
See accompanying notes which are an integral part of the financial statements.
Annual Report
Fidelity Emerging Markets Discovery Fund
Statement of Assets and Liabilities
| October 31, 2014 |
| | |
Assets | | |
Investment in securities, at value (including securities loaned of $1,014,000) - See accompanying schedule: Unaffiliated issuers (cost $81,196,950) | $ 82,608,038 | |
Fidelity Central Funds (cost $6,335,284) | 6,335,284 | |
Total Investments (cost $87,532,234) | | $ 88,943,322 |
Foreign currency held at value (cost $379,716) | | 380,018 |
Receivable for investments sold | | 2,029,733 |
Receivable for fund shares sold | | 98,495 |
Dividends receivable | | 95,704 |
Distributions receivable from Fidelity Central Funds | | 1,203 |
Prepaid expenses | | 349 |
Receivable from investment adviser for expense reductions | | 17,421 |
Other receivables | | 7,744 |
Total assets | | 91,573,989 |
| | |
Liabilities | | |
Payable to custodian bank | $ 249,833 | |
Payable for investments purchased | 2,581,166 | |
Payable for fund shares redeemed | 267,767 | |
Accrued management fee | 62,215 | |
Distribution and service plan fees payable | 3,392 | |
Other affiliated payables | 20,166 | |
Other payables and accrued expenses | 385,814 | |
Collateral on securities loaned, at value | 1,002,600 | |
Total liabilities | | 4,572,953 |
| | |
Net Assets | | $ 87,001,036 |
Net Assets consist of: | | |
Paid in capital | | $ 86,500,569 |
Undistributed net investment income | | 174 |
Accumulated undistributed net realized gain (loss) on investments and foreign currency transactions | | (616,536) |
Net unrealized appreciation (depreciation) on investments and assets and liabilities in foreign currencies | | 1,116,829 |
Net Assets | | $ 87,001,036 |
See accompanying notes which are an integral part of the financial statements.
Annual Report
Statement of Assets and Liabilities - continued
| October 31, 2014 |
| | |
Calculation of Maximum Offering Price Class A:
Net Asset Value and redemption price per share ($4,361,655 ÷ 358,373 shares) | | $ 12.17 |
| | |
Maximum offering price per share (100/94.25 of $12.17) | | $ 12.91 |
Class T:
Net Asset Value and redemption price per share ($2,031,326 ÷ 167,417 shares) | | $ 12.13 |
| | |
Maximum offering price per share (100/96.50 of $12.13) | | $ 12.57 |
Class C:
Net Asset Value and offering price per share ($1,750,148 ÷ 145,834 shares)A | | $ 12.00 |
| | |
Emerging Markets Discovery:
Net Asset Value, offering price and redemption price per share ($78,377,207 ÷ 6,418,342 shares) | | $ 12.21 |
| | |
Institutional Class:
Net Asset Value, offering price and redemption price per share ($480,700 ÷ 39,252 shares) | | $ 12.25 |
A Redemption price per share is equal to net asset value less any applicable contingent deferred sales charge.
See accompanying notes which are an integral part of the financial statements.
Annual Report
Fidelity Emerging Markets Discovery Fund
Financial Statements - continued
Statement of Operations
| Year ended October 31, 2014 |
| | |
Investment Income | | |
Dividends | | $ 1,943,273 |
Income from Fidelity Central Funds | | 24,638 |
Income before foreign taxes withheld | | 1,967,911 |
Less foreign taxes withheld | | (149,221) |
Total income | | 1,818,690 |
| | |
Expenses | | |
Management fee | $ 778,418 | |
Transfer agent fees | 203,003 | |
Distribution and service plan fees | 41,075 | |
Accounting and security lending fees | 47,524 | |
Custodian fees and expenses | 164,899 | |
Independent trustees' compensation | 381 | |
Registration fees | 65,316 | |
Audit | 88,577 | |
Legal | 349 | |
Interest | 79 | |
Miscellaneous | 16,702 | |
Total expenses before reductions | 1,406,323 | |
Expense reductions | (39,275) | 1,367,048 |
Net investment income (loss) | | 451,642 |
Realized and Unrealized Gain (Loss) Net realized gain (loss) on: | | |
Investment securities: | | |
Unaffiliated issuers (net of foreign taxes of $963,357) | (205,589) | |
Foreign currency transactions | (44,609) | |
Total net realized gain (loss) | | (250,198) |
Change in net unrealized appreciation (depreciation) on: Investment securities (net of increase in deferred foreign taxes of $59,002) | (686,710) | |
Assets and liabilities in foreign currencies | (15,113) | |
Total change in net unrealized appreciation (depreciation) | | (701,823) |
Net gain (loss) | | (952,021) |
Net increase (decrease) in net assets resulting from operations | | $ (500,379) |
See accompanying notes which are an integral part of the financial statements.
Annual Report
Statement of Changes in Net Assets
| Year ended
October 31,
2014 | Year ended
October 31,
2013 |
Increase (Decrease) in Net Assets | | |
Operations | | |
Net investment income (loss) | $ 451,642 | $ 931,481 |
Net realized gain (loss) | (250,198) | 2,316,300 |
Change in net unrealized appreciation (depreciation) | (701,823) | (864,876) |
Net increase (decrease) in net assets resulting
from operations | (500,379) | 2,382,905 |
Distributions to shareholders from net investment income | (676,480) | (286,293) |
Distributions to shareholders from net realized gain | (2,520,609) | (914,866) |
Total distributions | (3,197,089) | (1,201,159) |
Share transactions - net increase (decrease) | (16,216,808) | 59,689,170 |
Redemption fees | 46,780 | 191,734 |
Total increase (decrease) in net assets | (19,867,496) | 61,062,650 |
| | |
Net Assets | | |
Beginning of period | 106,868,532 | 45,805,882 |
End of period (including undistributed net investment income of $174 and undistributed net investment income of $648,420, respectively) | $ 87,001,036 | $ 106,868,532 |
See accompanying notes which are an integral part of the financial statements.
Annual Report
Financial Highlights - Class A
Years ended October 31, | 2014 | 2013 | 2012 F |
Selected Per-Share Data | | | |
Net asset value, beginning of period | $ 12.49 | $ 11.89 | $ 10.00 |
Income from Investment Operations | | | |
Net investment income (loss) C | .04 | .08 | .12 |
Net realized and unrealized gain (loss) | (.01) | .75 | 1.76 |
Total from investment operations | .03 | .83 | 1.88 |
Distributions from net investment income | (.06) | (.04) | (.01) |
Distributions from net realized gain | (.30) | (.20) | - |
Total distributions | (.36) | (.25) H | (.01) |
Redemption fees added to paid in capital C | .01 | .02 | .02 |
Net asset value, end of period | $ 12.17 | $ 12.49 | $ 11.89 |
Total ReturnA, B | .31% | 7.20% | 19.00% |
Ratios to Average Net Assets D, G | | | |
Expenses before reductions | 1.82% | 1.87% | 3.49% |
Expenses net of fee waivers, if any | 1.70% | 1.70% | 1.70% |
Expenses net of all reductions | 1.70% | 1.64% | 1.64% |
Net investment income (loss) | .29% | .62% | 1.16% |
Supplemental Data | | | |
Net assets, end of period (000 omitted) | $ 4,362 | $ 5,065 | $ 1,671 |
Portfolio turnover rate E | 148% | 179% | 83% |
A Total returns would have been lower if certain expenses had not been reduced during the applicable periods shown.
B Total returns do not include the effect of the sales charges.
C Calculated based on average shares outstanding during the period.
D Fees and expenses of any underlying Fidelity Central Funds are not included in the Fund's expense ratio. The Fund indirectly bears its proportionate share of the expenses of any underlying Fidelity Central Funds.
E Amount does not include the portfolio activity of any underlying Fidelity Central Funds.
F For the period November 1, 2011 (commencement of operations) to October 31, 2012.
G Expense ratios reflect operating expenses of the class. Expenses before reductions do not reflect amounts reimbursed by the investment adviser or reductions from brokerage service arrangements or reductions from other expense offset arrangements and do not represent the amount paid by the class during periods when reimbursements or reductions occur. Expense ratios before reductions for start-up periods may not be representative of longer-term operating periods. Expenses net of fee waivers reflect expenses after reimbursement by the investment adviser but prior to reductions from brokerage service arrangements or other expense offset arrangements. Expenses net of all reductions represent the net expenses paid by the class.
H Total distributions of $.25 per share is comprised of distributions from net investment income of $.044 and distributions from net realized gain of $.203 per share.
See accompanying notes which are an integral part of the financial statements.
Annual Report
Financial Highlights - Class T
Years ended October 31, | 2014 | 2013 | 2012 F |
Selected Per-Share Data | | | |
Net asset value, beginning of period | $ 12.44 | $ 11.87 | $ 10.00 |
Income from Investment Operations | | | |
Net investment income (loss) C | - H | .05 | .10 |
Net realized and unrealized gain (loss) | - H | .74 | 1.75 |
Total from investment operations | - H | .79 | 1.85 |
Distributions from net investment income | (.02) | (.03) | - H |
Distributions from net realized gain | (.30) | (.20) | - |
Total distributions | (.32) | (.24) I | - H |
Redemption fees added to paid in capital C | .01 | .02 | .02 |
Net asset value, end of period | $ 12.13 | $ 12.44 | $ 11.87 |
Total ReturnA, B | .05% | 6.87% | 18.75% |
Ratios to Average Net Assets D, G | | | |
Expenses before reductions | 2.10% | 2.19% | 3.77% |
Expenses net of fee waivers, if any | 1.95% | 1.95% | 1.95% |
Expenses net of all reductions | 1.95% | 1.89% | 1.89% |
Net investment income (loss) | .04% | .37% | .91% |
Supplemental Data | | | |
Net assets, end of period (000 omitted) | $ 2,031 | $ 1,914 | $ 1,700 |
Portfolio turnover rateE | 148% | 179% | 83% |
A Total returns would have been lower if certain expenses had not been reduced during the applicable periods shown.
B Total returns do not include the effect of the sales charges.
C Calculated based on average shares outstanding during the period.
D Fees and expenses of any underlying Fidelity Central Funds are not included in the Fund's expense ratio. The Fund indirectly bears its proportionate share of the expenses of any underlying Fidelity Central Funds.
E Amount does not include the portfolio activity of any underlying Fidelity Central Funds.
F For the period November 1, 2011 (commencement of operations) to October 31, 2012.
G Expense ratios reflect operating expenses of the class. Expenses before reductions do not reflect amounts reimbursed by the investment adviser or reductions from brokerage service arrangements or reductions from other expense offset arrangements and do not represent the amount paid by the class during periods when reimbursements or reductions occur. Expense ratios before reductions for start-up periods may not be representative of longer-term operating periods. Expenses net of fee waivers reflect expenses after reimbursement by the investment adviser but prior to reductions from brokerage service arrangements or other expense offset arrangements. Expenses net of all reductions represent the net expenses paid by the class.
H Amount represents less than $.01 per share.
I Total distributions of $.24 per share is comprised of distributions from net investment income of $.034 and distributions from net realized gain of $.203 per share.
See accompanying notes which are an integral part of the financial statements.
Annual Report
Financial Highlights - Class C
Years ended October 31, | 2014 | 2013 | 2012 F |
Selected Per-Share Data | | | |
Net asset value, beginning of period | $ 12.35 | $ 11.82 | $ 10.00 |
Income from Investment Operations | | | |
Net investment income (loss) C | (.06) | (.02) | .04 |
Net realized and unrealized gain (loss) | - H | .74 | 1.76 |
Total from investment operations | (.06) | .72 | 1.80 |
Distributions from net investment income | - | (.01) | - |
Distributions from net realized gain | (.30) | (.20) | - |
Total distributions | (.30) | (.21) | - |
Redemption fees added to paid in capital C | .01 | .02 | .02 |
Net asset value, end of period | $ 12.00 | $ 12.35 | $ 11.82 |
Total ReturnA, B | (.42)% | 6.32% | 18.20% |
Ratios to Average Net Assets D, G | | | |
Expenses before reductions | 2.58% | 2.70% | 4.32% |
Expenses net of fee waivers, if any | 2.45% | 2.45% | 2.45% |
Expenses net of all reductions | 2.45% | 2.39% | 2.39% |
Net investment income (loss) | (.46)% | (.13)% | .41% |
Supplemental Data | | | |
Net assets, end of period (000 omitted) | $ 1,750 | $ 2,082 | $ 1,474 |
Portfolio turnover rateE | 148% | 179% | 83% |
A Total returns would have been lower if certain expenses had not been reduced during the applicable periods shown.
B Total returns do not include the effect of the contingent deferred sales charge.
C Calculated based on average shares outstanding during the period.
D Fees and expenses of any underlying Fidelity Central Funds are not included in the Fund's expense ratio. The Fund indirectly bears its proportionate share of the expenses of any underlying Fidelity Central Funds.
E Amount does not include the portfolio activity of any underlying Fidelity Central Funds.
F For the period November 1, 2011 (commencement of operations) to October 31, 2012.
G Expense ratios reflect operating expenses of the class. Expenses before reductions do not reflect amounts reimbursed by the investment adviser or reductions from brokerage service arrangements or reductions from other expense offset arrangements and do not represent the amount paid by the class during periods when reimbursements or reductions occur. Expense ratios before reductions for start-up periods may not be representative of longer-term operating periods. Expenses net of fee waivers reflect expenses after reimbursement by the investment adviser but prior to reductions from brokerage service arrangements or other expense offset arrangements. Expenses net of all reductions represent the net expenses paid by the class.
H Amount represents less than $.01 per share.
See accompanying notes which are an integral part of the financial statements.
Annual Report
Financial Highlights - Emerging Markets Discovery
Years ended October 31, | 2014 | 2013 | 2012 E |
Selected Per-Share Data | | | |
Net asset value, beginning of period | $ 12.52 | $ 11.92 | $ 10.00 |
Income from Investment Operations | | | |
Net investment income (loss) B | .07 | .11 | .15 |
Net realized and unrealized gain (loss) | - G | .74 | 1.76 |
Total from investment operations | .07 | .85 | 1.91 |
Distributions from net investment income | (.09) | (.07) | (.01) |
Distributions from net realized gain | (.30) | (.20) | - |
Total distributions | (.39) | (.27) | (.01) |
Redemption fees added to paid in capital B | .01 | .02 | .02 |
Net asset value, end of period | $ 12.21 | $ 12.52 | $ 11.92 |
Total ReturnA | .61% | 7.37% | 19.35% |
Ratios to Average Net Assets C, F | | | |
Expenses before reductions | 1.48% | 1.57% | 3.02% |
Expenses net of fee waivers, if any | 1.45% | 1.45% | 1.45% |
Expenses net of all reductions | 1.45% | 1.39% | 1.39% |
Net investment income (loss) | .54% | .87% | 1.41% |
Supplemental Data | | | |
Net assets, end of period (000 omitted) | $ 78,377 | $ 96,731 | $ 39,135 |
Portfolio turnover rateD | 148% | 179% | 83% |
A Total returns would have been lower if certain expenses had not been reduced during the applicable periods shown.
B Calculated based on average shares outstanding during the period.
C Fees and expenses of any underlying Fidelity Central Funds are not included in the Fund's expense ratio. The Fund indirectly bears its proportionate share of the expenses of any underlying Fidelity Central Funds.
D Amount does not include the portfolio activity of any underlying Fidelity Central Funds.
E For the period November 1, 2011 (commencement of operations) to October 31, 2012.
F Expense ratios reflect operating expenses of the class. Expenses before reductions do not reflect amounts reimbursed by the investment adviser or reductions from brokerage service arrangements or reductions from other expense offset arrangements and do not represent the amount paid by the class during periods when reimbursements or reductions occur. Expense ratios before reductions for start-up periods may not be representative of longer-term operating periods. Expenses net of fee waivers reflect expenses after reimbursement by the investment adviser but prior to reductions from brokerage service arrangements or other expense offset arrangements. Expenses net of all reductions represent the net expenses paid by the class.
G Amount represents less than $.01 per share.
See accompanying notes which are an integral part of the financial statements.
Annual Report
Financial Highlights - Institutional Class
Years ended October 31, | 2014 | 2013 | 2012 E |
Selected Per-Share Data | | | |
Net asset value, beginning of period | $ 12.53 | $ 11.92 | $ 10.00 |
Income from Investment Operations | | | |
Net investment income (loss) B | .07 | .11 | .15 |
Net realized and unrealized gain (loss) | - G | .75 | 1.76 |
Total from investment operations | .07 | .86 | 1.91 |
Distributions from net investment income | (.06) | (.07) | (.01) |
Distributions from net realized gain | (.30) | (.20) | - |
Total distributions | (.36) | (.27) | (.01) |
Redemption fees added to paid in capital B | .01 | .02 | .02 |
Net asset value, end of period | $ 12.25 | $ 12.53 | $ 11.92 |
Total ReturnA | .61% | 7.45% | 19.35% |
Ratios to Average Net Assets C, F | | | |
Expenses before reductions | 1.56% | 1.60% | 3.21% |
Expenses net of fee waivers, if any | 1.45% | 1.45% | 1.45% |
Expenses net of all reductions | 1.45% | 1.39% | 1.39% |
Net investment income (loss) | .54% | .87% | 1.41% |
Supplemental Data | | | |
Net assets, end of period (000 omitted) | $ 481 | $ 1,076 | $ 1,825 |
Portfolio turnover rateD | 148% | 179% | 83% |
A Total returns would have been lower if certain expenses had not been reduced during the applicable periods shown.
B Calculated based on average shares outstanding during the period.
C Fees and expenses of any underlying Fidelity Central Funds are not included in the Fund's expense ratio. The Fund indirectly bears its proportionate share of the expenses of any underlying Fidelity Central Funds.
D Amount does not include the portfolio activity of any underlying Fidelity Central Funds.
E For the period November 1, 2011 (commencement of operations) to October 31, 2012.
F Expense ratios reflect operating expenses of the class. Expenses before reductions do not reflect amounts reimbursed by the investment adviser or reductions from brokerage service arrangements or reductions from other expense offset arrangements and do not represent the amount paid by the class during periods when reimbursements or reductions occur. Expense ratios before reductions for start-up periods may not be representative of longer-term operating periods. Expenses net of fee waivers reflect expenses after reimbursement by the investment adviser but prior to reductions from brokerage service arrangements or other expense offset arrangements. Expenses net of all reductions represent the net expenses paid by the class.
G Amount represents less than $.01 per share.
See accompanying notes which are an integral part of the financial statements.
Annual Report
Notes to Financial Statements
For the period ended October 31, 2014
1. Organization.
Fidelity Emerging Markets Discovery Fund (the Fund) is a non-diversified fund of Fidelity Investment Trust (the Trust) and is authorized to issue an unlimited number of shares. The Trust is registered under the Investment Company Act of 1940, as amended (the 1940 Act), as an open-end management investment company organized as a Massachusetts business trust. The Fund offers Class A, Class T, Class C, Emerging Markets Discovery and Institutional Class shares, each of which has equal rights as to assets and voting privileges. Each class has exclusive voting rights with respect to matters that affect that class. The Fund's investments in emerging markets can be subject to social, economic, regulatory, and political uncertainties and can be extremely volatile.
2. Investments in Fidelity Central Funds.
The Fund invests in Fidelity Central Funds, which are open-end investment companies generally available only to other investment companies and accounts managed by the investment adviser and its affiliates. The Fund's Schedule of Investments lists each of the Fidelity Central Funds held as of period end, if any, as an investment of the Fund, but does not include the underlying holdings of each Fidelity Central Fund. As an Investing Fund, the Fund indirectly bears its proportionate share of the expenses of the underlying Fidelity Central Funds.
The Money Market Central Funds seek preservation of capital and current income and are managed by Fidelity Investments Money Management, Inc. (FIMM), an affiliate of the investment adviser. Annualized expenses of the Money Market Central Funds as of their most recent shareholder report date are less than .01%.
A complete unaudited list of holdings for each Fidelity Central Fund is available upon request or at the Securities and Exchange Commission (the SEC) website at www.sec.gov. In addition, the financial statements of the Fidelity Central Funds, which are not covered by the Fund's Report of Independent Registered Public Accounting Firm, are available on the SEC website or upon request.
3. Significant Accounting Policies.
The financial statements have been prepared in conformity with accounting principles generally accepted in the United States of America (GAAP), which require management to make certain estimates and assumptions at the date of the financial statements. Actual results could differ from those estimates. Subsequent events, if any, through the date that the financial statements were issued have been evaluated in the preparation of the financial statements. The following summarizes the significant accounting policies of the Fund:
Investment Valuation. Investments are valued as of 4:00 p.m. Eastern time on the last calendar day of the period. In accordance with valuation policies and procedures
Annual Report
3. Significant Accounting Policies - continued
Investment Valuation - continued
approved by the Board of Trustees (the Board), the Fund attempts to obtain prices from one or more third party pricing vendors or brokers to value its investments. When current market prices, quotations or currency exchange rates are not readily available or reliable, investments will be fair valued in good faith by the Fidelity Management & Research Company (FMR) Fair Value Committee (the Committee), in accordance with procedures adopted by the Board. Factors used in determining fair value vary by investment type and may include market or investment specific events. The frequency with which these procedures are used cannot be predicted and they may be utilized to a significant extent. The Committee oversees the Fund's valuation policies and procedures and is responsible for approving and reporting to the Board all fair value determinations.
The Fund categorizes the inputs to valuation techniques used to value its investments into a disclosure hierarchy consisting of three levels as shown below:
Level 1 - quoted prices in active markets for identical investments
Level 2 - other significant observable inputs (including quoted prices for similar investments, interest rates, prepayment speeds, etc.)
Level 3 - unobservable inputs (including the Fund's own assumptions based on the best information available)
Valuation techniques used to value the Fund's investments by major category are as follows:
Equity securities, including restricted securities, for which market quotations are readily available, are valued at the last reported sale price or official closing price as reported by a third party pricing vendor on the primary market or exchange on which they are traded and are categorized as Level 1 in the hierarchy. In the event there were no sales during the day or closing prices are not available, securities are valued at the last quoted bid price or may be valued using the last available price and are generally categorized as Level 2 in the hierarchy. For foreign equity securities, when market or security specific events arise, comparisons to the valuation of American Depositary Receipts (ADRs), futures contracts, Exchange-Traded Funds (ETFs) and certain indexes as well as quoted prices for similar securities may be used and would be categorized as Level 2 in the hierarchy. Utilizing these techniques may result in transfers between Level 1 and Level 2. For equity securities, including restricted securities, where observable inputs are limited, assumptions about market activity and risk are used and these securities may be categorized as Level 3 in the hierarchy.
Annual Report
Notes to Financial Statements - continued
3. Significant Accounting Policies - continued
Investment Valuation - continued
Investments in open-end mutual funds, including the Fidelity Central Funds, are valued at their closing net asset value (NAV) each business day and are categorized as Level 1 in the hierarchy.
Changes in valuation techniques may result in transfers in or out of an assigned level within the disclosure hierarchy. The aggregate value of investments by input level, as of October 31, 2014, including information on transfers between Levels 1 and 2, is included at the end of the Fund's Schedule of Investments.
Foreign Currency. The Fund may use foreign currency contracts to facilitate transactions in foreign-denominated securities. Gains and losses from these transactions may arise from changes in the value of the foreign currency or if the counterparties do not perform under the contracts' terms.
Foreign-denominated assets, including investment securities, and liabilities are translated into U.S. dollars at the exchange rates at period end. Purchases and sales of investment securities, income and dividends received and expenses denominated in foreign currencies are translated into U.S. dollars at the exchange rate in effect on the transaction date.
The effects of exchange rate fluctuations on investments are included with the net realized and unrealized gain (loss) on investment securities. Other foreign currency transactions resulting in realized and unrealized gain (loss) are disclosed separately.
Investment Transactions and Income. For financial reporting purposes, the Fund's investment holdings and NAV include trades executed through the end of the last business day of the period. The NAV per share for processing shareholder transactions is calculated as of the close of business of the New York Stock Exchange (NYSE), normally 4:00 p.m. Eastern time and includes trades executed through the end of the prior business day. Gains and losses on securities sold are determined on the basis of identified cost. Dividend income is recorded on the ex-dividend date, except for certain dividends from foreign securities where the ex-dividend date may have passed, which are recorded as soon as the Fund is informed of the ex-dividend date. Non-cash dividends included in dividend income, if any, are recorded at the fair market value of the securities received. Income and capital gain distributions from Fidelity Central Funds, if any, are recorded on the ex-dividend date. Investment income is recorded net of foreign taxes withheld where recovery of such taxes is uncertain.
Class Allocations and Expenses. Investment income, realized and unrealized capital gains and losses, common expenses of the Fund, and certain fund-level expense reductions, if any, are allocated daily on a pro-rata basis to each class based on the relative net
Annual Report
3. Significant Accounting Policies - continued
Class Allocations and Expenses - continued
assets of each class to the total net assets of the Fund. Each class differs with respect to transfer agent and distribution and service plan fees incurred. Certain expense reductions may also differ by class. For the reporting period, the allocated portion of income and expenses to each class as a percent of its average net assets may vary due to the timing of recording these transactions in relation to fluctuating net assets of the classes. Expenses directly attributable to a fund are charged to that fund. Expenses attributable to more than one fund are allocated among the respective funds on the basis of relative net assets or other appropriate methods. Expense estimates are accrued in the period to which they relate and adjustments are made when actual amounts are known.
Income Tax Information and Distributions to Shareholders. Each year, the Fund intends to qualify as a regulated investment company under Subchapter M of the Internal Revenue Code, including distributing substantially all of its taxable income and realized gains. As a result, no provision for U.S. Federal income taxes is required. As of October 31, 2014, the Fund did not have any unrecognized tax benefits in the financial statements; nor is the Fund aware of any tax positions for which it is reasonably possible that the total amounts of unrecognized tax benefits will significantly change in the next twelve months. The Fund files a U.S. federal tax return, in addition to state and local tax returns as required. The Fund's federal income tax returns are subject to examination by the Internal Revenue Service (IRS) for a period of three fiscal years after they are filed. State and local tax returns may be subject to examination for an additional fiscal year depending on the jurisdiction. Foreign taxes are provided for based on the Fund's understanding of the tax rules and rates that exist in the foreign markets in which it invests. The Fund is subject to a tax imposed on capital gains by certain countries in which it invests. An estimated deferred tax liability for net unrealized appreciation on the applicable securities is included in Other payables and accrued expenses on the Statement of Assets & Liabilities.
Distributions are declared and recorded on the ex-dividend date. Income dividends and capital gain distributions are declared separately for each class. Income and capital gain distributions are determined in accordance with income tax regulations, which may differ from GAAP.
Capital accounts within the financial statements are adjusted for permanent book-tax differences. These adjustments have no impact on net assets or the results of operations. Capital accounts are not adjusted for temporary book-tax differences which will reverse in a subsequent period.
Book-tax differences are primarily due to foreign currency transactions, certain foreign taxes, passive foreign investment companies (PFIC), and losses deferred due to wash sales.
Annual Report
Notes to Financial Statements - continued
3. Significant Accounting Policies - continued
Income Tax Information and Distributions to Shareholders - continued
The federal tax cost of investment securities and unrealized appreciation (depreciation) as of period end were as follows:
Gross unrealized appreciation | $ 7,254,784 |
Gross unrealized depreciation | (6,137,587) |
Net unrealized appreciation (depreciation) on securities | $ 1,117,197 |
| |
Tax Cost | $ 87,826,125 |
The tax-based components of distributable earnings as of period end were as follows:
Capital loss carryforward | $ (322,648) |
Net unrealized appreciation (depreciation) on securities and other investments | $ 1,099,060 |
Capital loss carryforwards are only available to offset future capital gains of the Fund to the extent provided by regulations and may be limited. Under the Regulated Investment Company Modernization Act of 2010 (the Act), the Fund is permitted to carry forward capital losses incurred in taxable years beginning after December 22, 2010 for an unlimited period and such capital losses are required to be used prior to any losses that expire. The capital loss carryforward information presented below, including any applicable limitation, is estimated as of fiscal period end and is subject to adjustment.
Fiscal year of expiration | |
No expiration | |
Short-term | $ (322,648) |
The tax character of distributions paid was as follows:
| October 31, 2014 | October 31, 2013 |
Ordinary Income | $ 676,480 | $ 1,201,159 |
Long-term Capital Gains | 2,520,609 | - |
Total | $ 3,197,089 | $ 1,201,159 |
Short-Term Trading (Redemption) Fees. Shares held by investors in the Fund less than 90 days may have been subject to a redemption fee equal to 2.00% of the NAV of shares redeemed. All redemption fees, which reduce the proceeds of the shareholder redemption, are retained by the Fund and accounted for as an addition to paid in capital.
New Accounting Pronouncement. In June 2014, the Financial Accounting Standards Board issued Accounting Standard Update No. 2014-11, Repurchase-to-Maturity Transactions, Repurchase Financings, and Disclosures. The Update amends the accounting for certain repurchase agreements and expands disclosure requirements for reverse
Annual Report
3. Significant Accounting Policies - continued
New Accounting Pronouncement - continued
repurchase agreements, securities lending and other similar transactions. The disclosure requirements are effective for annual and interim reporting periods beginning after December 15, 2014. Management is currently evaluating the impact of the Update on the Fund's financial statements and related disclosures.
4. Purchases and Sales of Investments.
Purchases and sales of securities, other than short-term securities, aggregated $133,129,300 and $154,307,954, respectively.
5. Fees and Other Transactions with Affiliates.
Management Fee. Fidelity Management & Research Company (the investment adviser) and its affiliates provide the Fund with investment management related services for which the Fund pays a monthly management fee. The management fee is the sum of an individual fund fee rate that is based on an annual rate of .60% of the Fund's average net assets and an annualized group fee rate that averaged .25% during the period. The group fee rate is based upon the average net assets of all the mutual funds advised by the investment adviser, including any mutual funds previously advised by the investment adviser that are currently advised by Fidelity SelectCo, LLC, an affiliate of the investment adviser. The group fee rate decreases as assets under management increase and increases as assets under management decrease. For the reporting period, the total annual management fee rate was .85% of the Fund's average net assets.
Distribution and Service Plan Fees. In accordance with Rule 12b-1 of the 1940 Act, the Fund has adopted separate Distribution and Service Plans for each class of shares. Certain classes pay Fidelity Distributors Corporation (FDC), an affiliate of the investment adviser, separate Distribution and Service Fees, each of which is based on an annual percentage of each class' average net assets. In addition, FDC may pay financial intermediaries for selling shares of the Fund and providing shareholder support services. For the period, the Distribution and Service Fee rates, total fees and amounts retained by FDC were as follows:
| Distribution
Fee | Service
Fee | Total Fees | Retained
by FDC |
Class A | -% | .25% | $ 11,632 | $ 1,997 |
Class T | .25% | .25% | 9,422 | 384 |
Class C | .75% | .25% | 20,021 | 10,212 |
| | | $ 41,075 | $ 12,593 |
Annual Report
Notes to Financial Statements - continued
5. Fees and Other Transactions with Affiliates - continued
Sales Load. FDC may receive a front-end sales charge of up to 5.75% for selling Class A shares and 3.50% for selling Class T shares, some of which is paid to financial intermediaries for selling shares of the Fund. Depending on the holding period, FDC may receive contingent deferred sales charges levied on Class A, Class T and Class C redemptions. The deferred sales charges range from 1.00% for Class C shares, 1.00% for certain purchases of Class A shares and .25% for certain purchases of Class T shares.
For the period, sales charge amounts retained by FDC were as follows:
| Retained
by FDC |
Class A | $ 2,453 |
Class T | 1,194 |
Class C* | 2,188 |
| $ 5,835 |
* When Class C shares are initially sold, FDC pays commissions from its own resources to financial intermediaries through which the sales are made.
Transfer Agent Fees. Fidelity Investments Institutional Operations Company, Inc., (FIIOC), an affiliate of the investment adviser, is the transfer, dividend disbursing and shareholder servicing agent for each class of the Fund. FIIOC receives account fees and asset-based fees that vary according to the account size and type of account of the shareholders of the respective classes of the Fund. FIIOC pays for typesetting, printing and mailing of shareholder reports, except proxy statements.
For the period, transfer agent fees for each class were as follows:
| Amount | % of
Class-Level Average
Net Assets |
Class A | $ 14,242 | .31 |
Class T | 6,334 | .34 |
Class C | 6,270 | .31 |
Emerging Markets Discovery | 174,808 | .21 |
Institutional Class | 1,349 | .25 |
| $ 203,003 | |
Accounting and Security Lending Fees. Fidelity Service Company, Inc. (FSC), an affiliate of the investment adviser, maintains the Fund's accounting records. The accounting fee is based on the level of average net assets for each month. Under a separate contract, FSC administers the security lending program. The security lending fee is based on the number and duration of lending transactions.
Brokerage Commissions. The Fund placed a portion of its portfolio transactions with brokerage firms which are affiliates of the investment adviser. Brokerage commissions are included in net realized gain (loss) and change in net unrealized appreciation (depreciation) in the Statement of Operations. The commissions paid to these affiliated firms were $594 for the period.
Annual Report
5. Fees and Other Transactions with Affiliates - continued
Interfund Lending Program. Pursuant to an Exemptive Order issued by the SEC, the Fund, along with other registered investment companies having management contracts with FMR or other affiliated entities of FMR, may participate in an interfund lending program. This program provides an alternative credit facility allowing the funds to borrow from, or lend money to, other participating affiliated funds. At period end, there were no interfund loans outstanding. The Fund's activity in this program during the period for which loans were outstanding was as follows:
Borrower or Lender | Average Loan
Balance | Weighted Average Interest Rate | Interest Expense |
Borrower | $ 2,976,000 | .32% | $ 79 |
6. Committed Line of Credit.
The Fund participates with other funds managed by the investment adviser or an affiliate in a $4.25 billion credit facility (the "line of credit") to be utilized for temporary or emergency purposes to fund shareholder redemptions or for other short-term liquidity purposes. The Fund has agreed to pay commitment fees on its pro-rata portion of the line of credit, which amounted to $152 and is reflected in Miscellaneous expenses on the Statement of Operations. During the period, the Fund did not borrow on this line of credit.
7. Security Lending.
The Fund lends portfolio securities through a lending agent from time to time in order to earn additional income. For equity securities, a lending agent is used and may loan securities to certain qualified borrowers, including Fidelity Capital Markets (FCM), a broker-dealer affiliated with the Fund. On the settlement date of the loan, the Fund receives collateral (in the form of U.S. Treasury obligations, letters of credit and/or cash) against the loaned securities and maintains collateral in an amount not less than 100% of the market value of the loaned securities during the period of the loan. The market value of the loaned securities is determined at the close of business of the Fund and any additional required collateral is delivered to the Fund on the next business day. If the borrower defaults on its obligation to return the securities loaned because of insolvency or other reasons, the Fund may apply collateral received from the borrower against the obligation. The Fund may experience delays and costs in recovering the securities loaned. Any cash collateral received is invested in the Fidelity Securities Lending Cash Central Fund. The value of loaned securities and cash collateral at period end are disclosed on the Fund's Statement of Assets and Liabilities. Security lending income
Annual Report
Notes to Financial Statements - continued
7. Security Lending - continued
represents the income earned on investing cash collateral, less rebates paid to borrowers and any lending agent fees associated with the loan, plus any premium payments received for lending certain types of securities. Security lending income is presented in the Statement of Operations as a component of income from Fidelity Central Funds. Total security lending income during the period amounted to $22,418. During the period, there were no securities loaned to FCM.
8. Expense Reductions.
The investment adviser contractually agreed to reimburse each class to the extent annual operating expenses exceeded certain levels of average net assets as noted in the table below. This reimbursement will remain in place through December 31, 2015. Some expenses, for example interest expense, including commitment fees, are excluded from this reimbursement.
The following classes were in reimbursement during the period:
| Expense
Limitations | Reimbursement |
Class A | 1.70% | $ 5,734 |
Class T | 1.95% | 2,801 |
Class C | 2.45% | 2,643 |
Emerging Markets Discovery | 1.45% | 25,708 |
Institutional Class | 1.45% | 569 |
| | $ 37,455 |
In addition, the investment adviser reimbursed a portion of the Fund's operating expenses during the period in the amount of $1,820.
9. Distributions to Shareholders.
Distributions to shareholders of each class were as follows:
Years ended October 31, | 2014 | 2013 |
From net investment income | | |
Class A | $ 23,688 | $ 7,274 |
Class T | 2,475 | 5,643 |
Class C | - | 1,195 |
Emerging Markets Discovery | 646,254 | 259,277 |
Institutional Class | 4,063 | 12,904 |
Total | $ 676,480 | $ 286,293 |
Annual Report
9. Distributions to Shareholders - continued
Years ended October 31, | 2014 | 2013 |
From net realized gain | | |
Class A | $ 122,525 | $ 33,559 |
Class T | 43,668 | 33,691 |
Class C | 51,356 | 30,324 |
Emerging Markets Discovery | 2,280,897 | 778,518 |
Institutional Class | 22,163 | 38,774 |
Total | $ 2,520,609 | $ 914,866 |
10. Share Transactions.
Share transactions for each class were as follows and may contain automatic conversions between classes or exchanges between funds:
| Shares | Shares | Dollars | Dollars |
Years ended October 31, | 2014 | 2013 | 2014 | 2013 |
Class A | | | | |
Shares sold | 147,354 | 646,803 | $ 1,789,001 | $ 8,039,936 |
Reinvestment of distributions | 10,958 | 3,013 | 133,251 | 36,310 |
Shares redeemed | (205,580) | (384,660) | (2,490,439) | (4,712,072) |
Net increase (decrease) | (47,268) | 265,156 | $ (568,187) | $ 3,364,174 |
Class T | | | | |
Shares sold | 52,146 | 157,097 | $ 631,489 | $ 1,931,892 |
Reinvestment of distributions | 3,566 | 3,232 | 43,325 | 38,882 |
Shares redeemed | (42,178) | (149,702) | (507,088) | (1,831,906) |
Net increase (decrease) | 13,534 | 10,627 | $ 167,726 | $ 138,868 |
Class C | | | | |
Shares sold | 92,257 | 428,945 | $ 1,143,008 | $ 5,224,843 |
Reinvestment of distributions | 4,241 | 2,629 | 51,185 | 31,519 |
Shares redeemed | (119,225) | (387,768) | (1,424,170) | (4,776,955) |
Net increase (decrease) | (22,727) | 43,806 | $ (229,977) | $ 479,407 |
Emerging Markets Discovery | | | | |
Shares sold | 2,185,123 | 12,245,350 | $ 26,469,903 | $ 152,132,821 |
Reinvestment of distributions | 205,996 | 72,226 | 2,506,974 | 871,750 |
Shares redeemed | (3,696,612) | (7,876,995) | (44,026,941) | (96,541,547) |
Net increase (decrease) | (1,305,493) | 4,440,581 | $ (15,050,064) | $ 56,463,024 |
Institutional Class | | | | |
Shares sold | 25,831 | 231,788 | $ 324,477 | $ 2,857,278 |
Reinvestment of distributions | 824 | 3,612 | 10,052 | 43,597 |
Shares redeemed | (73,327) | (302,585) | (870,835) | (3,657,178) |
Net increase (decrease) | (46,672) | (67,185) | $ (536,306) | $ (756,303) |
Annual Report
Notes to Financial Statements - continued
11. Other.
The Fund's organizational documents provide former and current trustees and officers with a limited indemnification against liabilities arising in connection with the performance of their duties to the Fund. In the normal course of business, the Fund may also enter into contracts that provide general indemnifications. The Fund's maximum exposure under these arrangements is unknown as this would be dependent on future claims that may be made against the Fund. The risk of material loss from such claims is considered remote.
At the end of the period, the investment adviser or its affiliates were the owners of record of 11% of the total outstanding shares of the Fund.
Annual Report
Fidelity Total Emerging Markets Fund
Average annual total return reflects the change in the value of an investment, assuming reinvestment of the fund's distributions from dividend income and capital gains (the profits earned upon the sale of securities that have grown in value, if any) and assuming a constant rate of performance each year. The $10,000 table and the fund's returns do not reflect the deduction of taxes that a shareholder would pay on fund distributions or the redemption of fund shares. During periods of reimbursement by Fidelity, a fund's total return will be greater than it would be had the reimbursement not occurred. How a fund did yesterday is no guarantee of how it will do tomorrow.
Average Annual Total Returns
Periods ended October 31, 2014 | Past 1
year | Life of
fund A |
Fidelity Total Emerging Markets Fund | 3.56% | 6.36% |
A From November 1, 2011
$10,000 Over Life of Fund
Let's say hypothetically that $10,000 was invested in Fidelity Total Emerging Markets Fund, a class of the fund, on November 1, 2011, when the fund started. The chart shows how the value of your investment would have changed, and also shows how the MSCI Emerging Markets Index performed over the same period.
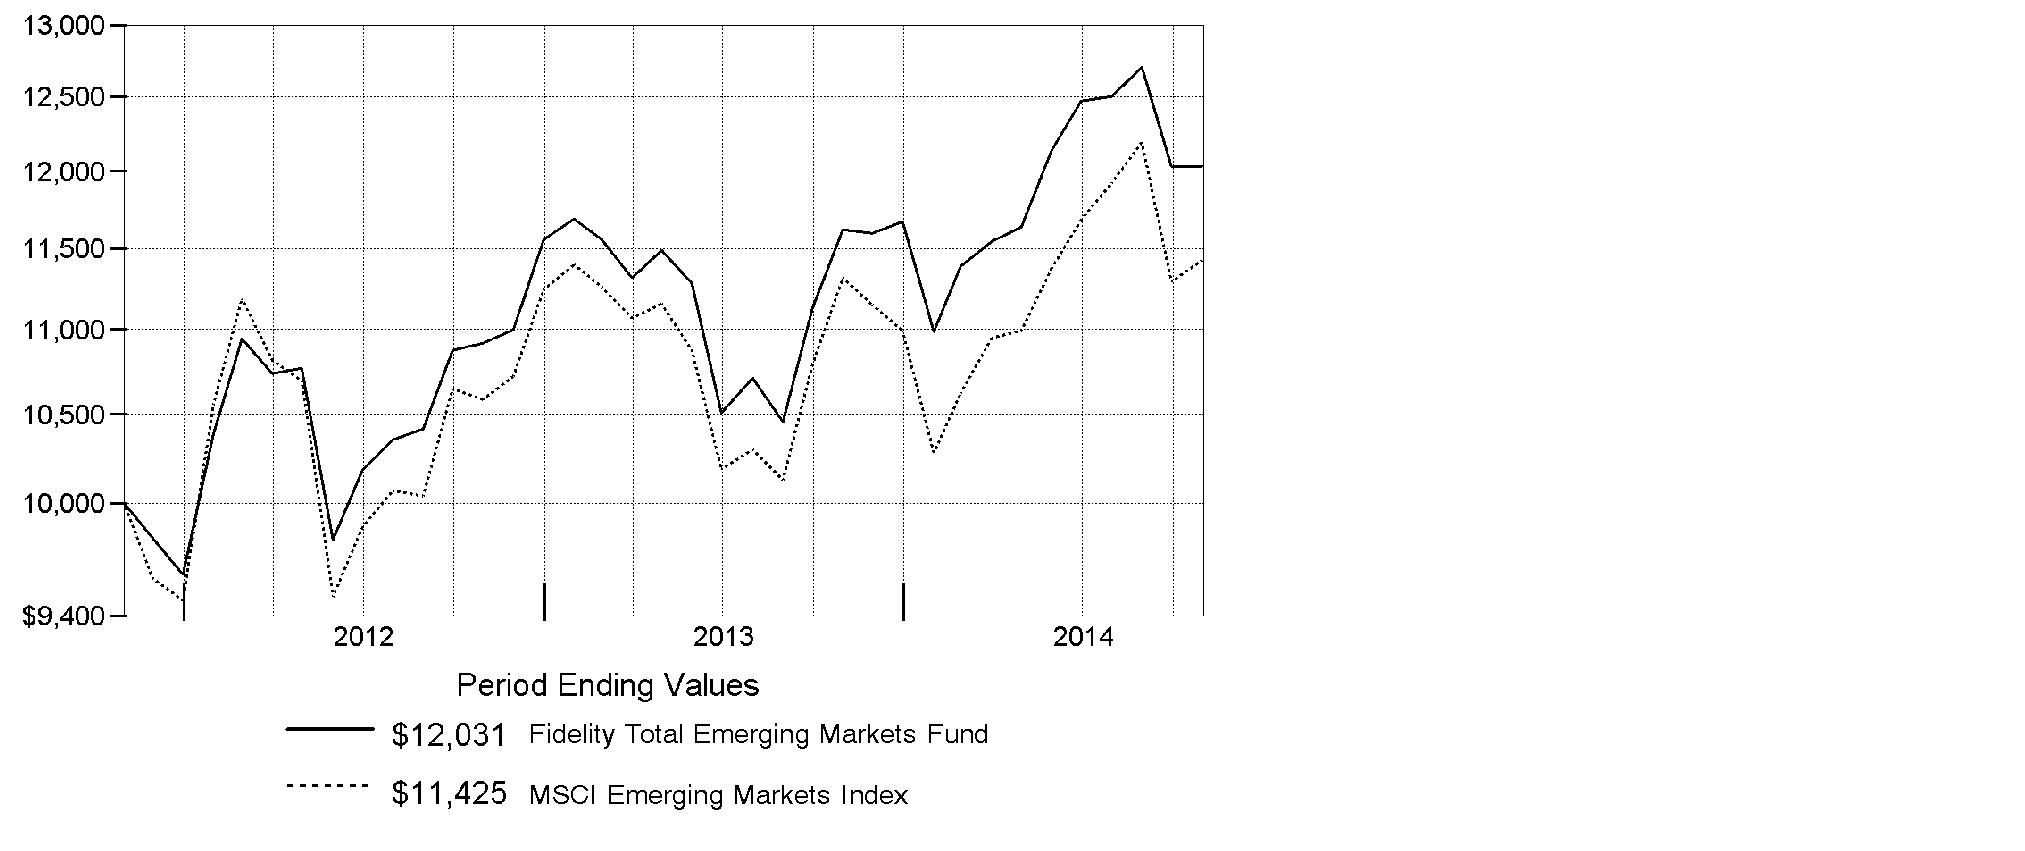
Annual Report
Fidelity Total Emerging Markets Fund
Market Recap: Global equities posted a healthy gain for the 12 months ending October 31, 2014, overcoming an October decline driven by recessionary pressures in China and tepid growth in Europe. The MSCI ACWI (All Country World Index) Index rose 8.15%, helped by investors' risk-taking and subdued market volatility for much of the period and supported by solid corporate earnings, especially in the United States. Stocks also benefited from easy monetary policies in Japan and the eurozone, as well as increased stimulus efforts in China. All but three of the 24 industry groups that compose the index marked a positive return. The U.S. (+17%) remained a pillar of strength, while a strongly rising dollar in the latter part of the period detracted from investors' returns in most non-U.S. markets. Canada (+5%) notched broad gains outside of its energy and materials sectors, as did Asia-Pacific ex Japan (+4%), led by investor enthusiasm for companies in India. The U.K., Europe and Japan, meanwhile, all underperformed. Turning to bonds, late-period strength in the U.S. dollar took its toll on performance: The Barclays® Global Aggregate GDP Weighted Index gained 1.09% for the year, lagging the 4.14% return of the Barclays® U.S. Aggregate Bond Index. Global corporate debt (+3%) fared relatively better, but still lagged the broad U.S. bond market.
Comments from John Carlson, Lead Portfolio Manager of Fidelity® Total Emerging Markets Fund: For the year, the fund's Retail Class shares gained 3.56%, compared with 0.98% for the MSCI Emerging Markets Index and 3.53% for the Fidelity Total Emerging Markets Composite IndexSM. Versus the Composite index, the fund's overweighting in equities, which underperformed, and underweighting in strong-performing EM debt detracted. However, the biggest contribution came from security selection among equities. Here, the equity sleeve's top individual contributor was South Korean cosmetics firm AMOREPACIFIC Group. Over the past year, the stock price tripled, benefiting from rapidly increasing demand for makeup among Chinese consumers, especially via e-commerce and duty-free sales. Conversely, positioning in Russia hurt results, including an investment in market-leading bank Sberbank. Turning to EM debt, underweighting Russia helped. We notably reduced exposure here in the first half of the period amid rising geopolitical uncertainty that caused a steep sell-off, although we added to our position shortly after that happened. On the flip side, it hurt to largely avoid Argentina.
Note to shareholders: Effective October 1, 2014, Per Johansson and Douglas Chow were no longer Co-Portfolio Managers of the fund, and Co-Portfolio Managers Gregory Lee and Tim Gannon became responsible for the energy and information technology subportfolios, respectively.
The views expressed above reflect those of the portfolio manager(s) only through the end of the period as stated on the cover of this report and do not necessarily represent the views of Fidelity or any other person in the Fidelity organization. Any such views are subject to change at any time based upon market or other conditions and Fidelity disclaims any responsibility to update such views. These views may not be relied on as investment advice and, because investment decisions for a Fidelity fund are based on numerous factors, may not be relied on as an indication of trading intent on behalf of any Fidelity fund.
Annual Report
Fidelity Total Emerging Markets Fund
Shareholder Expense Example
As a shareholder of the Fund, you incur two types of costs: (1) transaction costs, including sales charges (loads) on purchase payments or redemption proceeds, redemption fees and (2) ongoing costs, including management fees, distribution and/or service (12b-1) fees and other Fund expenses. This Example is intended to help you understand your ongoing costs (in dollars) of investing in the Fund and to compare these costs with the ongoing costs of investing in other mutual funds.
The Example is based on an investment of $1,000 invested at the beginning of the period and held for the entire period (May 1, 2014 to October 31, 2014).
Actual Expenses
The first line of the accompanying table for each class of the Fund provides information about actual account values and actual expenses. You may use the information in this line, together with the amount you invested, to estimate the expenses that you paid over the period. Simply divide your account value by $1,000.00 (for example, an $8,600 account value divided by $1,000.00 = 8.6), then multiply the result by the number in the first line for a class of the Fund under the heading entitled "Expenses Paid During Period" to estimate the expenses you paid on your account during this period. A small balance maintenance fee of $12.00 that is charged once a year may apply for certain accounts with a value of less than $2,000. This fee is not included in the table below. If it was, the estimate of expenses you paid during the period would be higher, and your ending account value lower, by this amount. In addition, the Fund, as a shareholder in the underlying Fidelity Central Funds, will indirectly bear its pro-rata share of the fees and expenses incurred by the underlying Fidelity Central Funds. These fees and expenses are not included in the Fund's annualized expense ratio used to calculate the expense estimate in the table below.
Hypothetical Example for Comparison Purposes
The second line of the accompanying table for each class of the Fund provides information about hypothetical account values and hypothetical expenses based on a Class' actual expense ratio and an assumed rate of return of 5% per year before expenses, which is not the Class' actual return. The hypothetical account values and expenses may not be used to estimate the actual ending account balance or expenses you paid for the period. You may use this information to compare the ongoing costs of investing in the Fund and other funds. To do so, compare this 5% hypothetical example with the 5% hypothetical examples that appear in the shareholder reports of the other funds. A small balance maintenance fee of $12.00 that is charged once a year may apply for certain accounts with a value of less than $2,000. This fee is not included in the table below. If it was, the estimate of expenses you paid during the period would be higher, and your ending account value lower, by this amount. In addition, the Fund, as a shareholder in the underlying Fidelity Central Funds, will indirectly bear its pro-rata share of the fees and expenses incurred by the underlying Fidelity Central Funds. These fees and expenses are not included in the Fund's annualized expense ratio used to calculate the expense estimate in the table below.
Please note that the expenses shown in the table are meant to highlight your ongoing costs only and do not reflect any transaction costs. Therefore, the second line of the table is useful in comparing ongoing costs only, and will not help you determine the relative total costs of owning different funds. In addition, if these transactional costs were included, your costs would have been higher.
Annual Report
Shareholder Expense Example - continued
| Annualized
Expense RatioB | Beginning
Account Value
May 1, 2014 | Ending
Account Value
October 31, 2014 | Expenses Paid
During Period*
May 1, 2014
to October 31, 2014 |
Class A | 1.65% | | | |
Actual | | $ 1,000.00 | $ 1,033.10 | $ 8.46 |
HypotheticalA | | $ 1,000.00 | $ 1,016.89 | $ 8.39 |
Class T | 1.90% | | | |
Actual | | $ 1,000.00 | $ 1,031.30 | $ 9.73 |
HypotheticalA | | $ 1,000.00 | $ 1,015.63 | $ 9.65 |
Class C | 2.40% | | | |
Actual | | $ 1,000.00 | $ 1,028.70 | $ 12.27 |
HypotheticalA | | $ 1,000.00 | $ 1,013.11 | $ 12.18 |
Total Emerging Markets | 1.40% | | | |
Actual | | $ 1,000.00 | $ 1,033.90 | $ 7.18 |
HypotheticalA | | $ 1,000.00 | $ 1,018.15 | $ 7.12 |
Institutional Class | 1.40% | | | |
Actual | | $ 1,000.00 | $ 1,033.90 | $ 7.18 |
HypotheticalA | | $ 1,000.00 | $ 1,018.15 | $ 7.12 |
A 5% return per year before expenses
B Annualized expense ratio reflects expenses net of applicable fee waivers.
* Expenses are equal to each Class' annualized expense ratio, multiplied by the average account value over the period, multiplied by 184/365 (to reflect the one-half year period).
Annual Report
Fidelity Total Emerging Markets Fund
Investment Changes (Unaudited)
Top Five Stocks as of October 31, 2014 |
| % of fund's
net assets | % of fund's net assets
6 months ago |
Samsung Electronics Co. Ltd. (Korea (South), Technology Hardware, Storage & Peripherals) | 2.9 | 3.1 |
Taiwan Semiconductor Manufacturing Co. Ltd. (Taiwan, Semiconductors & Semiconductor Equipment) | 2.3 | 2.6 |
Tencent Holdings Ltd. (Cayman Islands, Internet Software & Services) | 1.5 | 1.7 |
Naspers Ltd. Class N (South Africa, Media) | 1.3 | 0.9 |
Industrial & Commercial Bank of China Ltd. (H Shares) (China, Banks) | 1.1 | 1.2 |
| 9.1 | |
Top Five Market Sectors as of October 31, 2014 |
| % of fund's
net assets | % of fund's net assets
6 months ago |
Financials | 22.6 | 20.1 |
Information Technology | 13.8 | 12.5 |
Energy | 9.4 | 11.9 |
Consumer Discretionary | 6.8 | 5.9 |
Consumer Staples | 6.5 | 6.3 |
Top Five Countries as of October 31, 2014 |
(excluding cash equivalents) | % of fund's
net assets | % of fund's net assets
6 months ago |
Korea (South) | 13.5 | 13.7 |
India | 8.5 | 5.2 |
Brazil | 7.1 | 7.9 |
Taiwan | 6.3 | 5.5 |
China | 5.9 | 4.7 |
Percentages are adjusted for the effect of open futures contracts, if applicable. |
Asset Allocation (% of fund's net assets) |
As of October 31, 2014 | As of April 30, 2014 |
| Stocks and
Equity Futures 75.6% | | | Stocks and
Equity Futures 70.1% | |
 | Bonds 22.9% | | | Bonds 27.3% | |
| Short-Term
Investments and
Net Other Assets (Liabilities) 1.5% | | | Short-Term
Investments and
Net Other Assets (Liabilities) 2.6% | |

Annual Report
Fidelity Total Emerging Markets Fund
Investments October 31, 2014
Showing Percentage of Net Assets
Common Stocks - 69.0% |
| Shares | | Value |
Argentina - 0.5% |
Grupo Financiero Galicia SA sponsored ADR | 7,910 | | $ 116,277 |
YPF SA Class D sponsored ADR | 7,637 | | 268,593 |
TOTAL ARGENTINA | | 384,870 |
Austria - 0.2% |
C.A.T. oil AG (Bearer) | 6,531 | | 124,402 |
Bermuda - 1.2% |
Aquarius Platinum Ltd. (Australia) (a) | 440,582 | | 119,908 |
Cosan Ltd. Class A | 11,963 | | 126,688 |
Credicorp Ltd. (United States) | 200 | | 32,200 |
GP Investments Ltd. Class A (depositary receipt) (a) | 76,222 | | 154,111 |
Hoegh LNG Holdings Ltd. (a) | 664 | | 8,565 |
Shangri-La Asia Ltd. | 150,000 | | 217,801 |
Yue Yuen Industrial (Holdings) Ltd. | 95,500 | | 320,592 |
TOTAL BERMUDA | | 979,865 |
Brazil - 2.2% |
BM&F BOVESPA SA | 52,970 | | 233,009 |
BR Properties SA | 27,480 | | 138,847 |
CCR SA | 5,100 | | 37,974 |
Cielo SA | 15,200 | | 249,602 |
Cosan SA Industria e Comercio | 6,639 | | 92,676 |
Fibria Celulose SA (a) | 17,500 | | 211,944 |
Localiza Rent A Car SA | 900 | | 12,974 |
Mills Estruturas e Servicos de Engenharia SA | 3,000 | | 19,553 |
Minerva SA (a) | 61,900 | | 318,506 |
Qualicorp SA (a) | 2,750 | | 27,967 |
Smiles SA | 13,200 | | 228,000 |
T4F Entretenimento SA (a) | 31,500 | | 35,595 |
Ultrapar Participacoes SA | 6,900 | | 150,509 |
TOTAL BRAZIL | | 1,757,156 |
British Virgin Islands - 0.1% |
Mail.Ru Group Ltd. GDR (Reg. S) (a) | 3,251 | | 78,804 |
Canada - 0.6% |
First Quantum Minerals Ltd. | 5,700 | | 85,977 |
Goldcorp, Inc. | 8,700 | | 163,263 |
Pan American Silver Corp. | 14,500 | | 133,835 |
Torex Gold Resources, Inc. (a) | 49,200 | | 52,385 |
TOTAL CANADA | | 435,460 |
Common Stocks - continued |
| Shares | | Value |
Cayman Islands - 5.5% |
58.com, Inc. ADR | 5,950 | | $ 235,442 |
Alibaba Group Holding Ltd. sponsored ADR | 1,100 | | 108,460 |
Anta Sports Products Ltd. | 121,000 | | 237,497 |
China Lodging Group Ltd. ADR (a) | 9,800 | | 269,402 |
China ZhengTong Auto Services Holdings Ltd. | 357,400 | | 202,468 |
Cimc Enric Holdings Ltd. | 132,000 | | 132,740 |
E-House China Holdings Ltd. ADR | 13,460 | | 134,465 |
Eurasia Drilling Co. Ltd. GDR (Reg. S) | 6,534 | | 163,350 |
GCL-Poly Energy Holdings Ltd. (a) | 234,000 | | 78,863 |
Greatview Aseptic Pack Co. Ltd. | 211,000 | | 138,906 |
Haitian International Holdings Ltd. | 59,000 | | 126,560 |
Hengan International Group Co. Ltd. | 28,000 | | 295,141 |
SINA Corp. (a) | 2,801 | | 114,757 |
Tencent Holdings Ltd. | 76,700 | | 1,232,743 |
Tingyi (Cayman Islands) Holding Corp. | 180,000 | | 447,794 |
Uni-President China Holdings Ltd. | 329,600 | | 306,254 |
Xueda Education Group sponsored ADR | 8,700 | | 24,447 |
Yingde Gases Group Co. Ltd. | 134,500 | | 105,023 |
TOTAL CAYMAN ISLANDS | | 4,354,312 |
Chile - 0.7% |
Embotelladora Andina SA ADR | 1,700 | | 26,350 |
Empresa Nacional de Electricidad SA | 75,303 | | 117,256 |
Inversiones La Construccion SA | 14,226 | | 202,727 |
Vina Concha y Toro SA | 120,325 | | 230,061 |
TOTAL CHILE | | 576,394 |
China - 5.9% |
Anhui Conch Cement Co. Ltd. (H Shares) | 46,000 | | 150,644 |
BBMG Corp. (H Shares) | 265,000 | | 187,385 |
China Life Insurance Co. Ltd. (H Shares) | 232,170 | | 692,789 |
China Pacific Insurance Group Co. Ltd. (H Shares) | 140,400 | | 525,399 |
China Shenhua Energy Co. Ltd. (H Shares) | 83,000 | | 233,939 |
China Suntien Green Energy Corp. Ltd. (H Shares) | 358,350 | | 95,179 |
China Telecom Corp. Ltd. (H Shares) | 788,357 | | 502,542 |
Industrial & Commercial Bank of China Ltd. (H Shares) | 1,324,500 | | 879,415 |
Maanshan Iron & Steel Ltd. (H Shares) (a) | 778,000 | | 202,861 |
PetroChina Co. Ltd.: | | | |
(H Shares) | 460,000 | | 575,894 |
sponsored ADR | 500 | | 62,750 |
Common Stocks - continued |
| Shares | | Value |
China - continued |
PICC Property & Casualty Co. Ltd. (H Shares) | 269,500 | | $ 494,381 |
Sinopec Engineering Group Co. Ltd. (H Shares) (d) | 88,500 | | 85,595 |
TOTAL CHINA | | 4,688,773 |
Colombia - 0.5% |
BanColombia SA sponsored ADR | 7,141 | | 403,966 |
Denmark - 0.0% |
Auriga Industries A/S Series B (a) | 681 | | 35,142 |
Egypt - 0.2% |
Citadel Capital Corp. (a) | 307,200 | | 170,140 |
Greece - 0.4% |
National Bank of Greece SA (a) | 79,160 | | 190,942 |
Public Power Corp. of Greece (a) | 12,794 | | 97,159 |
TOTAL GREECE | | 288,101 |
Hong Kong - 2.5% |
China Power International Development Ltd. | 321,600 | | 145,274 |
China Resources Power Holdings Co. Ltd. | 64,535 | | 187,838 |
China Unicom Ltd. | 147,400 | | 221,471 |
CNOOC Ltd. | 322,000 | | 504,216 |
CNOOC Ltd. sponsored ADR | 400 | | 62,548 |
Far East Horizon Ltd. | 255,000 | | 237,165 |
Lenovo Group Ltd. | 162,000 | | 238,789 |
Sinotruk Hong Kong Ltd. | 227,000 | | 117,664 |
Techtronic Industries Co. Ltd. | 97,000 | | 303,668 |
TOTAL HONG KONG | | 2,018,633 |
India - 8.5% |
Adani Ports & Special Economic Zone | 53,689 | | 249,554 |
Axis Bank Ltd. (a) | 103,278 | | 761,183 |
Bharti Airtel Ltd. (a) | 49,801 | | 323,605 |
Bharti Infratel Ltd. | 81,123 | | 388,777 |
Coal India Ltd. | 69,344 | | 418,138 |
Eicher Motors Ltd. | 1,733 | | 359,959 |
GAIL India Ltd. | 25,361 | | 217,976 |
Grasim Industries Ltd. | 4,012 | | 240,753 |
HCL Technologies Ltd. | 4,819 | | 126,384 |
Infosys Ltd. | 8,364 | | 554,409 |
ITC Ltd. (a) | 75,310 | | 435,436 |
JK Cement Ltd. | 17,887 | | 175,695 |
Larsen & Toubro Ltd. (a) | 7,434 | | 200,341 |
LIC Housing Finance Ltd. | 29,517 | | 173,818 |
Common Stocks - continued |
| Shares | | Value |
India - continued |
Lupin Ltd. | 14,411 | | $ 333,663 |
Petronet LNG Ltd. (a) | 71,884 | | 233,384 |
Phoenix Mills Ltd. | 40,098 | | 252,445 |
Power Grid Corp. of India Ltd. | 57,775 | | 137,082 |
SREI Infrastructure Finance Ltd. | 313,747 | | 242,544 |
State Bank of India | 4,956 | | 218,096 |
Tata Consultancy Services Ltd. | 7,001 | | 297,875 |
Wipro Ltd. | 14,659 | | 135,407 |
Yes Bank Ltd. | 26,641 | | 301,674 |
TOTAL INDIA | | 6,778,198 |
Indonesia - 1.1% |
PT AKR Corporindo Tbk | 171,200 | | 69,750 |
PT Bakrieland Development Tbk (a) | 17,571,300 | | 73,717 |
PT Bank Rakyat Indonesia Tbk | 574,900 | | 526,836 |
PT Kalbe Farma Tbk | 1,651,600 | | 233,194 |
TOTAL INDONESIA | | 903,497 |
Israel - 0.4% |
Bezeq The Israel Telecommunication Corp. Ltd. | 192,650 | | 325,692 |
Kenya - 0.2% |
Equity Bank Ltd. (a) | 311,500 | | 177,602 |
Korea (South) - 12.0% |
AMOREPACIFIC Group, Inc. | 385 | | 423,898 |
Daewoo International Corp. | 25,428 | | 801,100 |
E-Mart Co. Ltd. | 1,898 | | 349,766 |
Fila Korea Ltd. | 2,076 | | 215,436 |
Hana Financial Group, Inc. | 14,815 | | 510,864 |
Hankook Shell Oil Co. Ltd. | 149 | | 67,813 |
Hyundai Industrial Development & Construction Co. | 8,576 | | 322,065 |
Hyundai Mobis | 2,545 | | 592,166 |
KB Financial Group, Inc. | 13,310 | | 518,974 |
KEPCO Plant Service & Engineering Co. Ltd. | 1,557 | | 127,088 |
Korea Electric Power Corp. | 4,800 | | 209,579 |
Korea Zinc Co. Ltd. | 492 | | 184,309 |
Korean Reinsurance Co. | 32,699 | | 346,941 |
LG Chemical Ltd. | 1,204 | | 224,116 |
LG Corp. | 3,739 | | 221,324 |
NAVER Corp. | 439 | | 308,072 |
POSCO | 927 | | 266,328 |
Samsung C&T Corp. | 4,609 | | 310,142 |
Samsung Electronics Co. Ltd. | 1,995 | | 2,309,819 |
Common Stocks - continued |
| Shares | | Value |
Korea (South) - continued |
Shinhan Financial Group Co. Ltd. | 14,859 | | $ 695,622 |
SK Hynix, Inc. (a) | 8,762 | | 386,950 |
SK Telecom Co. Ltd. sponsored ADR | 5,006 | | 139,117 |
TOTAL KOREA (SOUTH) | | 9,531,489 |
Luxembourg - 0.5% |
Globant SA (a) | 4,840 | | 62,630 |
Tenaris SA sponsored ADR | 8,800 | | 348,832 |
TOTAL LUXEMBOURG | | 411,462 |
Mexico - 4.9% |
America Movil S.A.B. de CV Series L sponsored ADR | 29,973 | | 731,641 |
Banregio Grupo Financiero S.A.B. de CV | 18,969 | | 109,704 |
CEMEX S.A.B. de CV sponsored ADR | 25,808 | | 317,438 |
El Puerto de Liverpool S.A.B. de CV Class C | 21,400 | | 251,071 |
Fomento Economico Mexicano S.A.B. de CV sponsored ADR | 3,950 | | 380,148 |
Grupo Aeroportuario del Pacifico SA de CV Series B | 28,000 | | 190,503 |
Grupo Aeroportuario Norte S.A.B. de CV | 19,700 | | 98,147 |
Grupo Comercial Chedraui S.A.B. de CV | 83,376 | | 293,290 |
Grupo Financiero Banorte S.A.B. de CV Series O | 49,560 | | 317,942 |
Grupo Televisa SA de CV (CPO) sponsored ADR | 23,900 | | 863,746 |
Macquarie Mexican (REIT) | 165,870 | | 301,285 |
TOTAL MEXICO | | 3,854,915 |
Nigeria - 1.3% |
Guaranty Trust Bank PLC | 556,759 | | 84,026 |
Guaranty Trust Bank PLC GDR (Reg. S) | 37,730 | | 290,521 |
Transnational Corp. of Nigeria PLC | 3,207,008 | | 78,215 |
Zenith Bank PLC | 4,383,603 | | 561,017 |
TOTAL NIGERIA | | 1,013,779 |
Panama - 0.2% |
Copa Holdings SA Class A | 1,200 | | 140,304 |
Philippines - 1.9% |
Alliance Global Group, Inc. | 513,700 | | 288,935 |
LT Group, Inc. | 436,400 | | 138,151 |
Metropolitan Bank & Trust Co. | 215,484 | | 395,376 |
PNOC Energy Development Corp. | 644,500 | | 110,343 |
Robinsons Land Corp. | 980,100 | | 535,075 |
TOTAL PHILIPPINES | | 1,467,880 |
Common Stocks - continued |
| Shares | | Value |
Poland - 0.6% |
Cyfrowy Polsat SA | 35,000 | | $ 267,697 |
Powszechny Zaklad Ubezpieczen SA | 1,598 | | 239,513 |
TOTAL POLAND | | 507,210 |
Puerto Rico - 0.1% |
Popular, Inc. (a) | 3,430 | | 109,348 |
Romania - 0.0% |
SNGN Romgaz SA GDR (d) | 1,769 | | 16,682 |
Russia - 2.2% |
Bashneft OJSC rights (a) | 150 | | 0 |
E.ON Russia JSC (a) | 2,321,800 | | 134,902 |
LUKOIL Oil Co. sponsored ADR (United Kingdom) | 8,700 | | 427,170 |
Mobile TeleSystems OJSC (a) | 29,411 | | 174,373 |
NOVATEK OAO GDR (Reg. S) | 4,100 | | 440,340 |
Sberbank (Savings Bank of the Russian Federation) (a) | 289,250 | | 512,658 |
TMK OAO GDR (Reg. S) | 11,400 | | 89,262 |
TOTAL RUSSIA | | 1,778,705 |
Singapore - 0.6% |
Ezion Holdings Ltd. | 83,040 | | 97,787 |
First Resources Ltd. | 213,000 | | 345,078 |
TOTAL SINGAPORE | | 442,865 |
South Africa - 4.6% |
Alexander Forbes Group Holding (a) | 137,755 | | 107,409 |
Aspen Pharmacare Holdings Ltd. | 14,338 | | 511,448 |
Barclays Africa Group Ltd. | 17,953 | | 283,478 |
Bidvest Group Ltd. | 11,856 | | 326,096 |
Blue Label Telecoms Ltd. | 134,400 | | 118,806 |
Impala Platinum Holdings Ltd. (a) | 22,700 | | 165,242 |
JSE Ltd. | 16,790 | | 163,489 |
Life Healthcare Group Holdings Ltd. | 65,700 | | 248,391 |
MTN Group Ltd. | 30,427 | | 673,106 |
Naspers Ltd. Class N | 8,300 | | 1,032,926 |
TOTAL SOUTH AFRICA | | 3,630,391 |
Taiwan - 6.3% |
Catcher Technology Co. Ltd. | 23,000 | | 193,857 |
Cathay Financial Holding Co. Ltd. | 50,600 | | 83,277 |
E.SUN Financial Holdings Co. Ltd. | 270,697 | | 171,188 |
Hon Hai Precision Industry Co. Ltd. (Foxconn) | 255,624 | | 807,788 |
Inotera Memories, Inc. (a) | 95,000 | | 146,591 |
Common Stocks - continued |
| Shares | | Value |
Taiwan - continued |
King's Town Bank | 33,000 | | $ 36,035 |
Largan Precision Co. Ltd. | 3,000 | | 210,419 |
MediaTek, Inc. | 29,000 | | 413,560 |
Pegatron Corp. | 76,000 | | 138,294 |
Radiant Opto-Electronics Corp. | 30,000 | | 104,666 |
Taiwan Fertilizer Co. Ltd. | 122,000 | | 216,104 |
Taiwan Semiconductor Manufacturing Co. Ltd. | 380,000 | | 1,644,683 |
Taiwan Semiconductor Manufacturing Co. Ltd. sponsored ADR | 5,442 | | 119,833 |
Unified-President Enterprises Corp. | 295,243 | | 506,876 |
Universal Cement Corp. | 109,740 | | 96,452 |
Vanguard International Semiconductor Corp. | 69,000 | | 103,502 |
Voltronic Power Technology Corp. | 50 | | 403 |
TOTAL TAIWAN | | 4,993,528 |
Thailand - 1.0% |
Intouch Holdings PCL NVDR | 80,300 | | 182,306 |
Kasikornbank PCL (For. Reg.) | 57,860 | | 419,066 |
Thai Union Frozen Products PCL (For. Reg.) | 94,100 | | 215,163 |
TOTAL THAILAND | | 816,535 |
Turkey - 1.5% |
Aksa Akrilik Kimya Sanayii | 3,000 | | 9,867 |
Aselsan A/S | 25,000 | | 113,603 |
Aygaz A/S | 21,647 | | 91,257 |
Tupras Turkiye Petrol Rafinelleri A/S | 12,200 | | 264,842 |
Turkcell Iletisim Hizmet A/S (a) | 5,240 | | 30,462 |
Turkcell Iletisim Hizmet A/S sponsored ADR (a) | 14,440 | | 211,257 |
Turkiye Garanti Bankasi A/S | 81,250 | | 317,110 |
Turkiye Halk Bankasi A/S | 26,240 | | 175,315 |
TOTAL TURKEY | | 1,213,713 |
United Arab Emirates - 0.4% |
DP World Ltd. | 6,124 | | 117,336 |
First Gulf Bank PJSC | 41,207 | | 203,623 |
TOTAL UNITED ARAB EMIRATES | | 320,959 |
United Kingdom - 0.0% |
China Pacific Insurance Group Co. Ltd. (UBS Warrant Programme) warrants ELS 6/29/15 (a)(d) | 8,100 | | 26,833 |
United States of America - 0.2% |
Cognizant Technology Solutions Corp. Class A (a) | 3,020 | | 147,527 |
TOTAL COMMON STOCKS (Cost $47,476,311) |
54,905,132
|
Nonconvertible Preferred Stocks - 6.5% |
| Shares | | Value |
Brazil - 4.7% |
Ambev SA sponsored ADR | 49,000 | | $ 327,320 |
Banco do Estado Rio Grande do Sul SA | 59,130 | | 353,172 |
Braskem SA (PN-A) | 30,500 | | 223,159 |
Companhia Paranaense de Energia-Copel: | | | |
(PN-B) | 815 | | 11,383 |
(PN-B) sponsored | 6,811 | | 96,035 |
Gerdau SA sponsored ADR | 51,211 | | 231,986 |
Itau Unibanco Holding SA sponsored ADR | 57,978 | | 855,755 |
Marcopolo SA (PN) | 85,100 | | 145,617 |
Petroleo Brasileiro SA - Petrobras: | | | |
(PN) sponsored (non-vtg.) | 2,806 | | 34,317 |
sponsored ADR | 51,921 | | 607,476 |
TIM Participacoes SA sponsored ADR | 6,104 | | 167,982 |
Vale SA (PN-A) sponsored ADR | 78,100 | | 684,156 |
TOTAL BRAZIL | | 3,738,358 |
Chile - 0.1% |
Embotelladora Andina SA Class A | 38,679 | | 99,148 |
Korea (South) - 1.5% |
Hyundai Motor Co. Series 2 | 3,017 | | 359,419 |
Samsung Electronics Co. Ltd. | 446 | | 408,872 |
Samsung Fire & Marine Insurance Co. Ltd. | 2,070 | | 390,132 |
TOTAL KOREA (SOUTH) | | 1,158,423 |
Russia - 0.2% |
Surgutneftegas (a) | 292,550 | | 200,621 |
TOTAL NONCONVERTIBLE PREFERRED STOCKS (Cost $5,815,014) |
5,196,550
|
Nonconvertible Bonds - 4.2% |
| Principal Amount | | |
Azerbaijan - 0.3% |
International Bank of Azerbaijan OJSC 5.625% 6/11/19 (Reg. S) | | $ 200,000 | | 198,200 |
Georgia - 0.4% |
Georgia Bank Joint Stock Co. 7.75% 7/5/17 (d) | | 300,000 | | 317,481 |
Indonesia - 0.2% |
PT Pertamina Persero 5.625% 5/20/43 (d) | | 200,000 | | 191,500 |
Nonconvertible Bonds - continued |
| Principal Amount | | Value |
Ireland - 0.1% |
Vnesheconombank Via VEB Finance PLC 6.8% 11/22/25 (d) | | $ 100,000 | | $ 98,875 |
Kazakhstan - 0.4% |
KazMunaiGaz National Co. 5.75% 4/30/43 (d) | | 300,000 | | 291,750 |
Luxembourg - 0.6% |
RSHB Capital SA: | | | | |
5.1% 7/25/18 (d) | | 400,000 | | 383,020 |
6.299% 5/15/17 (Reg. S) | | 100,000 | | 100,250 |
TOTAL LUXEMBOURG | | 483,270 |
Mexico - 0.3% |
Petroleos Mexicanos 6.375% 1/23/45 | | 175,000 | | 200,795 |
Netherlands - 0.4% |
Indosat Palapa Co. BV 7.375% 7/29/20 (d) | | 100,000 | | 106,250 |
Mozambique Ematum Finance 2020 6.305% 9/11/20 (Reg. S) | | 200,000 | | 199,750 |
TOTAL NETHERLANDS | | 306,000 |
Trinidad & Tobago - 0.2% |
Petroleum Co. of Trinidad & Tobago Ltd. 9.75% 8/14/19 (d) | | 150,000 | | 187,500 |
Venezuela - 1.3% |
Petroleos de Venezuela SA: | | | | |
5.5% 4/12/37 | | 500,000 | | 232,500 |
6% 11/15/26 (Reg. S) | | 700,000 | | 342,300 |
8.5% 11/2/17 (d) | | 250,000 | | 189,350 |
9% 11/17/21 (Reg. S) | | 150,000 | | 95,063 |
9.75% 5/17/35 (d) | | 300,000 | | 183,150 |
TOTAL VENEZUELA | | 1,042,363 |
TOTAL NONCONVERTIBLE BONDS (Cost $3,390,824) |
3,317,734
|
Government Obligations - 18.8% |
|
Armenia - 0.5% |
Republic of Armenia 6% 9/30/20 (d) | | 400,000 | | 418,000 |
Government Obligations - continued |
| Principal Amount | | Value |
Azerbaijan - 0.7% |
Azerbaijan Republic 4.75% 3/18/24 (d) | | $ 200,000 | | $ 208,250 |
State Oil Co. of Azerbaijan Republic 4.75% 3/13/23 (Reg. S) | | 325,000 | | 322,758 |
TOTAL AZERBAIJAN | | 531,008 |
Barbados - 0.4% |
Barbados Government 7% 8/4/22 (d) | | 350,000 | | 326,375 |
Belarus - 0.4% |
Belarus Republic 8.75% 8/3/15 (Reg. S) | | 325,000 | | 331,565 |
Belize - 0.3% |
Belize Government 5% 2/20/38 (c)(d) | | 332,500 | | 251,038 |
Bolivia - 0.2% |
Plurinational State of Bolivia 4.875% 10/29/22 (d) | | 200,000 | | 205,250 |
Brazil - 0.2% |
Brazilian Federative Republic 5% 1/27/45 | | 200,000 | | 196,000 |
Colombia - 0.3% |
Colombian Republic 11.75% 2/25/20 | | 150,000 | | 213,375 |
Congo - 0.3% |
Congo Republic 3.5% 6/30/29 (c) | | 312,550 | | 285,564 |
Costa Rica - 0.3% |
Costa Rican Republic 7% 4/4/44 (d) | | 200,000 | | 206,500 |
Croatia - 0.3% |
Croatia Republic 6% 1/26/24 (d) | | 250,000 | | 270,313 |
Dominican Republic - 0.5% |
Dominican Republic: | | | | |
5.875% 4/18/24 (d) | | 150,000 | | 158,250 |
7.45% 4/30/44 (d) | | 200,000 | | 223,500 |
TOTAL DOMINICAN REPUBLIC | | 381,750 |
El Salvador - 0.5% |
El Salvador Republic: | | | | |
6.375% 1/18/27 (d) | | 200,000 | | 205,000 |
7.625% 2/1/41 (d) | | 150,000 | | 162,000 |
TOTAL EL SALVADOR | | 367,000 |
Gabon - 0.3% |
Gabonese Republic 6.375% 12/12/24 (d) | | 200,000 | | 212,000 |
Georgia - 0.3% |
Georgia Republic 6.875% 4/12/21 (d) | | 200,000 | | 225,540 |
Government Obligations - continued |
| Principal Amount | | Value |
Ghana - 0.5% |
Ghana Republic: | | | | |
7.875% 8/7/23 (Reg.S) | | $ 200,000 | | $ 201,300 |
8.125% 1/18/26 (d) | | 200,000 | | 201,000 |
TOTAL GHANA | | 402,300 |
Guatemala - 0.2% |
Guatemalan Republic 4.875% 2/13/28 (d) | | 200,000 | | 204,500 |
Hungary - 0.6% |
Hungarian Republic 7.625% 3/29/41 | | 350,000 | | 452,375 |
Indonesia - 0.9% |
Indonesian Republic: | | | | |
5.875% 1/15/24 (d) | | 400,000 | | 455,000 |
6.75% 1/15/44 (d) | | 200,000 | | 245,250 |
TOTAL INDONESIA | | 700,250 |
Ivory Coast - 0.6% |
Ivory Coast: | | | | |
5.375% 7/23/24 (d) | | 200,000 | | 191,500 |
7.7743% 12/31/32 | | 275,000 | | 265,430 |
TOTAL IVORY COAST | | 456,930 |
Jamaica - 0.2% |
Jamaican Government 8% 6/24/19 | | 150,000 | | 162,000 |
Jordan - 0.4% |
Jordanian Kingdom 3.875% 11/12/15 | | 300,000 | | 303,450 |
Kenya - 0.3% |
Republic of Kenya 6.875% 6/24/24 (d) | | 200,000 | | 213,000 |
Lebanon - 0.3% |
Lebanese Republic 11.625% 5/11/16 (Reg. S) | | 250,000 | | 278,750 |
Mexico - 0.7% |
United Mexican States 5.75% 10/12/2110 | | 500,000 | | 529,418 |
Mongolia - 0.2% |
Mongolian People's Republic 5.125% 12/5/22 (Reg. S) | | 200,000 | | 178,000 |
Morocco - 0.2% |
Moroccan Kingdom 5.5% 12/11/42 (d) | | 200,000 | | 203,500 |
Namibia - 0.3% |
Republic of Namibia 5.5% 11/3/21 (d) | | 200,000 | | 216,000 |
Netherlands - 0.3% |
Republic of Angola 7% 8/16/19 (Issued by Northern Lights III BV for Republic of Angola) (Reg. S) | | 250,000 | | 267,188 |
Government Obligations - continued |
| Principal Amount | | Value |
Nigeria - 0.3% |
Republic of Nigeria 6.375% 7/12/23 | | $ 200,000 | | $ 212,000 |
Pakistan - 0.3% |
Islamic Republic of Pakistan 7.25% 4/15/19 (d) | | 200,000 | | 206,500 |
Panama - 0.2% |
Panamanian Republic 4.3% 4/29/53 | | 200,000 | | 180,000 |
Philippines - 0.5% |
Philippine Republic: | | | | |
9.5% 2/2/30 | | 150,000 | | 239,438 |
10.625% 3/16/25 | | 100,000 | | 158,250 |
TOTAL PHILIPPINES | | 397,688 |
Romania - 0.3% |
Romanian Republic 6.125% 1/22/44 (d) | | 200,000 | | 234,250 |
Russia - 1.6% |
Russian Federation: | | | | |
4.875% 9/16/23 (d) | | 200,000 | | 200,290 |
5.625% 4/4/42 (d) | | 200,000 | | 201,834 |
5.875% 9/16/43 (d) | | 200,000 | | 209,000 |
7.5% 3/31/30 (Reg. S) | | 245,625 | | 278,659 |
12.75% 6/24/28 (Reg. S) | | 225,000 | | 370,733 |
TOTAL RUSSIA | | 1,260,516 |
Senegal - 0.3% |
Republic of Senegal 8.75% 5/13/21 (d) | | 200,000 | | 229,000 |
Serbia - 0.4% |
Republic of Serbia 7.25% 9/28/21 (d) | | 260,000 | | 298,870 |
Sri Lanka - 0.4% |
Democratic Socialist Republic of Sri Lanka 6.25% 10/4/20 (d) | | 300,000 | | 319,500 |
Tanzania - 0.3% |
United Republic of Tanzania 6.3289% 3/9/20 (f) | | 200,000 | | 216,250 |
Turkey - 1.1% |
Turkish Republic: | | | | |
6.625% 2/17/45 | | 200,000 | | 239,560 |
7.375% 2/5/25 | | 300,000 | | 370,785 |
11.875% 1/15/30 | | 165,000 | | 287,925 |
TOTAL TURKEY | | 898,270 |
Government Obligations - continued |
| Principal Amount | | Value |
Ukraine - 0.5% |
Ukraine Government: | | | | |
6.58% 11/21/16 (d) | | $ 250,000 | | $ 220,050 |
6.75% 11/14/17 (d) | | 200,000 | | 174,500 |
TOTAL UKRAINE | | 394,550 |
United States of America - 0.1% |
U.S. Treasury Bills, yield at date of purchase 0.01% to 0.02% 12/11/14 to 12/18/14 (e) | | 80,000 | | 79,999 |
Venezuela - 0.8% |
Venezuelan Republic: | | | | |
7% 3/31/38 | | 650,000 | | 373,750 |
8.25% 10/13/24 | | 300,000 | | 181,200 |
9% 5/7/23 (Reg. S) | | 100,000 | | 64,250 |
TOTAL VENEZUELA | | 619,200 |
Vietnam - 0.3% |
Vietnamese Socialist Republic 6.75% 1/29/20 (d) | | 200,000 | | 224,000 |
Zambia - 0.2% |
Republic of Zambia 5.375% 9/20/22 (d) | | 200,000 | | 191,420 |
TOTAL GOVERNMENT OBLIGATIONS (Cost $14,511,051) |
14,950,952
|
Money Market Funds - 1.6% |
| Shares | | |
Fidelity Cash Central Fund, 0.11% (b)
(Cost $1,289,861) | 1,289,861 | |
1,289,861
|
TOTAL INVESTMENT PORTFOLIO - 100.1% (Cost $72,483,061) | | 79,660,229 |
NET OTHER ASSETS (LIABILITIES) - (0.1)% | | (116,546) |
NET ASSETS - 100% | $ 79,543,683 |
Futures Contracts |
| Expiration Date | | Underlying Face Amount at Value | | Unrealized
Appreciation/
(Depreciation) |
Purchased |
Equity Index Contracts |
2 NYSE E-mini MSCI EAFE Index Contracts (United States) | Dec. 2014 | | $ 101,360 | | $ 134 |
|
The face value of futures purchased as a percentage of net assets is 0.1% |
Security Type Abbreviations |
ELS | - | Equity-Linked Security |
Legend |
(a) Non-income producing |
(b) Affiliated fund that is generally available only to investment companies and other accounts managed by Fidelity Investments. The rate quoted is the annualized seven-day yield of the fund at period end. A complete unaudited listing of the fund's holdings as of its most recent quarter end is available upon request. In addition, each Fidelity Central Fund's financial statements, which are not covered by the Fund's Report of Independent Registered Public Accounting Firm, are available on the SEC's website or upon request. |
(c) Security initially issued at one coupon which converts to a higher coupon at a specified date. The rate shown is the rate at period end. |
(d) Security exempt from registration under Rule 144A of the Securities Act of 1933. These securities may be resold in transactions exempt from registration, normally to qualified institutional buyers. At the end of the period, the value of these securities amounted to $9,788,966 or 12.3% of net assets. |
(e) Security or a portion of the security was pledged to cover margin requirements for futures contracts. At period end, the value of securities pledged amounted to $10,000. |
(f) Coupon rates for floating and adjustable rate securities reflect the rates in effect at period end. |
Affiliated Central Funds |
Information regarding fiscal year to date income earned by the Fund from investments in Fidelity Central Funds is as follows: |
Fund | Income earned |
Fidelity Cash Central Fund | $ 1,867 |
Fidelity Securities Lending Cash Central Fund | 202 |
Total | $ 2,069 |
Other Information |
Categorizations in the Schedule of Investments are based on country or territory of incorporation. |
The following is a summary of the inputs used, as of October 31, 2014, involving the Fund's assets and liabilities carried at fair value. The inputs or methodology used for valuing securities may not be an indication of the risk associated with investing in those securities. For more information on valuation inputs, and their aggregation into the levels used in the table below, please refer to the Investment Valuation section in the accompanying Notes to Financial Statements. |
Valuation Inputs at Reporting Date: |
Description | Total | Level 1 | Level 2 | Level 3 |
Investments in Securities: | | | | |
Equities: | | | | |
Consumer Discretionary | $ 5,431,798 | $ 4,149,772 | $ 1,282,026 | $ - |
Consumer Staples | 5,138,380 | 2,448,487 | 2,689,893 | - |
Energy | 5,715,973 | 3,557,436 | 2,158,537 | - |
Financials | 16,526,711 | 8,453,373 | 8,073,338 | - |
Health Care | 1,354,663 | 787,806 | 566,857 | - |
Industrials | 4,734,133 | 3,102,632 | 1,631,501 | - |
Information Technology | 10,958,598 | 4,530,768 | 6,427,830 | - |
Materials | 4,613,011 | 2,712,952 | 1,900,059 | - |
Telecommunication Services | 4,072,331 | 2,423,168 | 1,649,163 | - |
Utilities | 1,556,084 | 547,992 | 1,008,092 | - |
Corporate Bonds | 3,317,734 | - | 3,317,734 | - |
Government Obligations | 14,950,952 | - | 14,950,952 | - |
Money Market Funds | 1,289,861 | 1,289,861 | - | - |
Total Investments in Securities: | $ 79,660,229 | $ 34,004,247 | $ 45,655,982 | $ - |
Derivative Instruments: | | | | |
Assets | | | | |
Futures Contracts | $ 134 | $ 134 | $ - | $ - |
The following is a summary of transfers between Level 1 and Level 2 for the period ended October 31, 2014. Transfers are assumed to have occurred at the beginning of the period, and are primarily attributable to the valuation techniques used for foreign equity securities, as discussed in the accompanying Notes to Financial Statements: |
Transfers | Total |
Level 1 to Level 2 | $ 14,745,499 |
Level 2 to Level 1 | $ 0 |
Value of Derivative Instruments |
The following table is a summary of the Fund's value of derivative instruments by primary risk exposure as of October 31, 2014. For additional information on derivative instruments, please refer to the Derivative Instruments section in the accompanying Notes to Financial Statements. |
Primary Risk Exposure /
Derivative Type | Value |
| Asset | Liability |
Equity Risk | | |
Futures Contracts (a) | $ 134 | $ - |
Total Value of Derivatives | $ 134 | $ - |
(a) Reflects gross cumulative appreciation (depreciation) on futures contracts as presented in the Schedule of Investments. Only the period end receivable or payable for daily variation margin and net unrealized appreciation (depreciation) are presented in the Statement of Assets and Liabilities. |
Other Information |
The composition of credit quality ratings as a percentage of net assets is as follows (Unaudited): |
AAA,AA,A | 1.0% |
BBB | 6.8% |
BB | 6.0% |
B | 4.8% |
CCC,CC,C | 3.4% |
Not Rated | 0.9% |
Equities | 75.5% |
Short-Term Investments and Net Other Assets | 1.6% |
| 100.0% |
We have used ratings from Moody's Investors Service, Inc. Where Moody's® ratings are not available, we have used S&P® ratings. All ratings are as of the date indicated and do not reflect subsequent changes. |
See accompanying notes which are an integral part of the financial statements.
Annual Report
Fidelity Total Emerging Markets Fund
Statement of Assets and Liabilities
| October 31, 2014 |
| | |
Assets | | |
Investment in securities, at value - See accompanying schedule: Unaffiliated issuers (cost $71,193,200) | $ 78,370,368 | |
Fidelity Central Funds (cost $1,289,861) | 1,289,861 | |
Total Investments (cost $72,483,061) | | $ 79,660,229 |
Cash | | 438,649 |
Foreign currency held at value (cost $102,812) | | 102,789 |
Receivable for investments sold | | 860,000 |
Receivable for fund shares sold | | 33,205 |
Dividends receivable | | 67,683 |
Interest receivable | | 309,501 |
Distributions receivable from Fidelity Central Funds | | 102 |
Receivable for daily variation margin for derivative instruments | | 134 |
Prepaid expenses | | 165 |
Receivable from investment adviser for expense reductions | | 56,666 |
Other receivables | | 23,555 |
Total assets | | 81,552,678 |
| | |
Liabilities | | |
Payable for investments purchased | $ 1,640,340 | |
Payable for fund shares redeemed | 4,963 | |
Accrued management fee | 52,153 | |
Distribution and service plan fees payable | 13,150 | |
Other affiliated payables | 21,763 | |
Other payables and accrued expenses | 276,626 | |
Total liabilities | | 2,008,995 |
| | |
Net Assets | | $ 79,543,683 |
Net Assets consist of: | | |
Paid in capital | | $ 71,679,847 |
Undistributed net investment income | | 1,150,725 |
Accumulated undistributed net realized gain (loss) on investments and foreign currency transactions | | (362,249) |
Net unrealized appreciation (depreciation) on investments and assets and liabilities in foreign currencies | | 7,075,360 |
Net Assets | | $ 79,543,683 |
See accompanying notes which are an integral part of the financial statements.
Annual Report
Statement of Assets and Liabilities - continued
| October 31, 2014 |
| | |
Calculation of Maximum Offering Price Class A:
Net Asset Value and redemption price per share ($13,627,168 ÷ 1,179,223 shares) | | $ 11.56 |
| | |
Maximum offering price per share (100/94.25 of $11.56) | | $ 12.27 |
Class T:
Net Asset Value and redemption price per share ($5,276,506 ÷ 457,380 shares) | | $ 11.54 |
| | |
Maximum offering price per share (100/96.50 of $11.54) | | $ 11.96 |
Class C:
Net Asset Value and offering price per share ($10,103,945 ÷ 881,138 shares)A | | $ 11.47 |
| | |
Total Emerging Markets:
Net Asset Value, offering price and redemption price per share ($45,763,108 ÷ 3,946,439 shares) | | $ 11.60 |
| | |
Institutional Class:
Net Asset Value, offering price and redemption price per share ($4,772,956 ÷ 411,824 shares) | | $ 11.59 |
A Redemption price per share is equal to net asset value less any applicable contingent deferred sales charge.
See accompanying notes which are an integral part of the financial statements.
Annual Report
Fidelity Total Emerging Markets Fund
Financial Statements - continued
Statement of Operations
| Year ended October 31, 2014 |
| | |
Investment Income | | |
Dividends | | $ 1,495,470 |
Interest | | 1,253,596 |
Income from Fidelity Central Funds | | 2,069 |
Income before foreign taxes withheld | | 2,751,135 |
Less foreign taxes withheld | | (173,322) |
Total income | | 2,577,813 |
| | |
Expenses | | |
Management fee | $ 633,325 | |
Transfer agent fees | 176,181 | |
Distribution and service plan fees | 153,365 | |
Accounting and security lending fees | 40,995 | |
Custodian fees and expenses | 355,802 | |
Independent trustees' compensation | 327 | |
Registration fees | 64,678 | |
Audit | 98,715 | |
Legal | 301 | |
Miscellaneous | 3,723 | |
Total expenses before reductions | 1,527,412 | |
Expense reductions | (265,974) | 1,261,438 |
Net investment income (loss) | | 1,316,375 |
Realized and Unrealized Gain (Loss) Net realized gain (loss) on: | | |
Investment securities: | | |
Unaffiliated issuers (net of foreign taxes of $11,196) | 3,174,799 | |
Foreign currency transactions | (75,868) | |
Futures contracts | 42,055 | |
Total net realized gain (loss) | | 3,140,986 |
Change in net unrealized appreciation (depreciation) on: Investment securities (net of increase in deferred foreign taxes of $89,295) | (2,661,136) | |
Assets and liabilities in foreign currencies | (4,394) | |
Futures contracts | 9,141 | |
Total change in net unrealized appreciation (depreciation) | | (2,656,389) |
Net gain (loss) | | 484,597 |
Net increase (decrease) in net assets resulting from operations | | $ 1,800,972 |
See accompanying notes which are an integral part of the financial statements.
Annual Report
Statement of Changes in Net Assets
| Year ended
October 31,
2014 | Year ended
October 31,
2013 |
Increase (Decrease) in Net Assets | | |
Operations | | |
Net investment income (loss) | $ 1,316,375 | $ 1,900,179 |
Net realized gain (loss) | 3,140,986 | (1,878,240) |
Change in net unrealized appreciation (depreciation) | (2,656,389) | 1,872,247 |
Net increase (decrease) in net assets resulting
from operations | 1,800,972 | 1,894,186 |
Distributions to shareholders from net investment income | (1,381,318) | (1,561,667) |
Distributions to shareholders from net realized gain | - | (137,352) |
Total distributions | (1,381,318) | (1,699,019) |
Share transactions - net increase (decrease) | (8,457,450) | (15,755,086) |
Redemption fees | 27,840 | 87,191 |
Total increase (decrease) in net assets | (8,009,956) | (15,472,728) |
| | |
Net Assets | | |
Beginning of period | 87,553,639 | 103,026,367 |
End of period (including undistributed net investment income of $1,150,725 and undistributed net investment income of $1,219,736, respectively) | $ 79,543,683 | $ 87,553,639 |
See accompanying notes which are an integral part of the financial statements.
Annual Report
Financial Highlights - Class A
Years ended October 31, | 2014 | 2013 | 2012 G |
Selected Per-Share Data | | | |
Net asset value, beginning of period | $ 11.37 | $ 10.86 | $ 10.00 |
Income from Investment Operations | | | |
Net investment income (loss) C | .18 | .18 | .20 |
Net realized and unrealized gain (loss) | .19 | .48 F | .68 |
Total from investment operations | .37 | .66 | .88 |
Distributions from net investment income | (.18) | (.15) | (.02) |
Distributions from net realized gain | - | (.01) | - |
Total distributions | (.18) | (.16) | (.02) |
Redemption fees added to paid in capital C | - I | .01 | - I |
Net asset value, end of period | $ 11.56 | $ 11.37 | $ 10.86 |
Total ReturnA, B | 3.30% | 6.23% | 8.80% |
Ratios to Average Net Assets D, H | | | |
Expenses before reductions | 1.98% | 1.89% | 1.87% |
Expenses net of fee waivers, if any | 1.65% | 1.65% | 1.65% |
Expenses net of all reductions | 1.65% | 1.62% | 1.62% |
Net investment income (loss) | 1.61% | 1.61% | 1.92% |
Supplemental Data | | | |
Net assets, end of period (000 omitted) | $ 13,627 | $ 18,837 | $ 7,675 |
Portfolio turnover rate E | 102% | 120% | 70% |
A Total returns would have been lower if certain expenses had not been reduced during the applicable periods shown.
B Total returns do not include the effect of the sales charges.
C Calculated based on average shares outstanding during the period.
D Fees and expenses of any underlying Fidelity Central Funds are not included in the Fund's expense ratio. The Fund indirectly bears its proportionate share of the expenses of any underlying Fidelity Central Funds.
E Amount does not include the portfolio activity of any underlying Fidelity Central Funds.
F The amount shown for a share outstanding does not correspond with the aggregate net gain (loss) on investments for the period due to the timing of sales and repurchases of shares in relation to fluctuating market values of the investments of the Fund.
G For the period November 1, 2011 (commencement of operations) to October 31, 2012.
H Expense ratios reflect operating expenses of the class. Expenses before reductions do not reflect amounts reimbursed by the investment adviser or reductions from brokerage service arrangements or reductions from other expense offset arrangements and do not represent the amount paid by the class during periods when reimbursements or reductions occur. Expense ratios before reductions for start-up periods may not be representative of longer-term operating periods. Expenses net of fee waivers reflect expenses after reimbursement by the investment adviser but prior to reductions from brokerage service arrangements or other expense offset arrangements. Expenses net of all reductions represent the net expenses paid by the class.
I Amount represents less than $.01 per share.
See accompanying notes which are an integral part of the financial statements.
Annual Report
Financial Highlights - Class T
Years ended October 31, | 2014 | 2013 | 2012 G |
Selected Per-Share Data | | | |
Net asset value, beginning of period | $ 11.34 | $ 10.84 | $ 10.00 |
Income from Investment Operations | | | |
Net investment income (loss) C | .15 | .15 | .17 |
Net realized and unrealized gain (loss) | .19 | .48 F | .68 |
Total from investment operations | .34 | .63 | .85 |
Distributions from net investment income | (.14) | (.12) | (.01) |
Distributions from net realized gain | - | (.01) | - |
Total distributions | (.14) | (.14) J | (.01) |
Redemption fees added to paid in capital C | - I | .01 | - I |
Net asset value, end of period | $ 11.54 | $ 11.34 | $ 10.84 |
Total ReturnA, B | 3.04% | 5.93% | 8.56% |
Ratios to Average Net Assets D, H | | | |
Expenses before reductions | 2.32% | 2.13% | 2.10% |
Expenses net of fee waivers, if any | 1.90% | 1.90% | 1.90% |
Expenses net of all reductions | 1.90% | 1.88% | 1.87% |
Net investment income (loss) | 1.36% | 1.36% | 1.67% |
Supplemental Data | | | |
Net assets, end of period (000 omitted) | $ 5,277 | $ 5,967 | $ 5,823 |
Portfolio turnover rateE | 102% | 120% | 70% |
A Total returns would have been lower if certain expenses had not been reduced during the applicable periods shown.
B Total returns do not include the effect of the sales charges.
C Calculated based on average shares outstanding during the period.
D Fees and expenses of any underlying Fidelity Central Funds are not included in the Fund's expense ratio. The Fund indirectly bears its proportionate share of the expenses of any underlying Fidelity Central Funds.
E Amount does not include the portfolio activity of any underlying Fidelity Central Funds.
F The amount shown for a share outstanding does not correspond with the aggregate net gain (loss) on investments for the period due to the timing of sales and repurchases of shares in relation to fluctuating market values of the investments of the Fund.
G For the period November 1, 2011 (commencement of operations) to October 31, 2012.
H Expense ratios reflect operating expenses of the class. Expenses before reductions do not reflect amounts reimbursed by the investment adviser or reductions from brokerage service arrangements or reductions from other expense offset arrangements and do not represent the amount paid by the class during periods when reimbursements or reductions occur. Expense ratios before reductions for start-up periods may not be representative of longer-term operating periods. Expenses net of fee waivers reflect expenses after reimbursement by the investment adviser but prior to reductions from brokerage service arrangements or other expense offset arrangements. Expenses net of all reductions represent the net expenses paid by the class.
I Amount represents less than $.01 per share.
J Total distributions of $.14 per share is comprised of distributions from net investment income of $.124 and distributions from net realized gain of $.014 per share.
See accompanying notes which are an integral part of the financial statements.
Annual Report
Financial Highlights - Class C
Years ended October 31, | 2014 | 2013 | 2012 G |
Selected Per-Share Data | | | |
Net asset value, beginning of period | $ 11.29 | $ 10.80 | $ 10.00 |
Income from Investment Operations | | | |
Net investment income (loss) C | .10 | .09 | .12 |
Net realized and unrealized gain (loss) | .19 | .47 F | .69 |
Total from investment operations | .29 | .56 | .81 |
Distributions from net investment income | (.11) | (.07) | (.01) |
Distributions from net realized gain | - | (.01) | - |
Total distributions | (.11) | (.08) | (.01) |
Redemption fees added to paid in capital C | - I | .01 | - I |
Net asset value, end of period | $ 11.47 | $ 11.29 | $ 10.80 |
Total ReturnA, B | 2.56% | 5.31% | 8.07% |
Ratios to Average Net Assets D, H | | | |
Expenses before reductions | 2.72% | 2.65% | 2.63% |
Expenses net of fee waivers, if any | 2.40% | 2.40% | 2.40% |
Expenses net of all reductions | 2.40% | 2.37% | 2.37% |
Net investment income (loss) | .86% | .86% | 1.17% |
Supplemental Data | | | |
Net assets, end of period (000 omitted) | $ 10,104 | $ 7,436 | $ 5,824 |
Portfolio turnover rateE | 102% | 120% | 70% |
A Total returns would have been lower if certain expenses had not been reduced during the applicable periods shown.
B Total returns do not include the effect of the contingent deferred sales charge.
C Calculated based on average shares outstanding during the period.
D Fees and expenses of any underlying Fidelity Central Funds are not included in the Fund's expense ratio. The Fund indirectly bears its proportionate share of the expenses of any underlying Fidelity Central Funds.
E Amount does not include the portfolio activity of any underlying Fidelity Central Funds.
F The amount shown for a share outstanding does not correspond with the aggregate net gain (loss) on investments for the period due to the timing of sales and repurchases of shares in relation to fluctuating market values of the investments of the Fund.
G For the period November 1, 2011 (commencement of operations) to October 31, 2012.
H Expense ratios reflect operating expenses of the class. Expenses before reductions do not reflect amounts reimbursed by the investment adviser or reductions from brokerage service arrangements or reductions from other expense offset arrangements and do not represent the amount paid by the class during periods when reimbursements or reductions occur. Expense ratios before reductions for start-up periods may not be representative of longer-term operating periods. Expenses net of fee waivers reflect expenses after reimbursement by the investment adviser but prior to reductions from brokerage service arrangements or other expense offset arrangements. Expenses net of all reductions represent the net expenses paid by the class.
I Amount represents less than $.01 per share.
See accompanying notes which are an integral part of the financial statements.
Annual Report
Financial Highlights - Total Emerging Markets
Years ended October 31, | 2014 | 2013 | 2012 F |
Selected Per-Share Data | | | |
Net asset value, beginning of period | $ 11.40 | $ 10.89 | $ 10.00 |
Income from Investment Operations | | | |
Net investment income (loss) B | .21 | .21 | .22 |
Net realized and unrealized gain (loss) | .19 | .47 E | .69 |
Total from investment operations | .40 | .68 | .91 |
Distributions from net investment income | (.20) | (.17) | (.02) |
Distributions from net realized gain | - | (.01) | - |
Total distributions | (.20) | (.18) | (.02) |
Redemption fees added to paid in capital B | - H | .01 | - H |
Net asset value, end of period | $ 11.60 | $ 11.40 | $ 10.89 |
Total ReturnA | 3.56% | 6.44% | 9.15% |
Ratios to Average Net Assets C, G | | | |
Expenses before reductions | 1.73% | 1.56% | 1.60% |
Expenses net of fee waivers, if any | 1.40% | 1.40% | 1.40% |
Expenses net of all reductions | 1.40% | 1.38% | 1.38% |
Net investment income (loss) | 1.86% | 1.85% | 2.16% |
Supplemental Data | | | |
Net assets, end of period (000 omitted) | $ 45,763 | $ 49,959 | $ 81,416 |
Portfolio turnover rateD | 102% | 120% | 70% |
A Total returns would have been lower if certain expenses had not been reduced during the applicable periods shown.
B Calculated based on average shares outstanding during the period.
C Fees and expenses of any underlying Fidelity Central Funds are not included in the Fund's expense ratio. The Fund indirectly bears its proportionate share of the expenses of any underlying Fidelity Central Funds.
D Amount does not include the portfolio activity of any underlying Fidelity Central Funds.
E The amount shown for a share outstanding does not correspond with the aggregate net gain (loss) on investments for the period due to the timing of sales and repurchases of shares in relation to fluctuating market values of the investments of the Fund.
F For the period November 1, 2011 (commencement of operations) to October 31, 2012.
G Expense ratios reflect operating expenses of the class. Expenses before reductions do not reflect amounts reimbursed by the investment adviser or reductions from brokerage service arrangements or reductions from other expense offset arrangements and do not represent the amount paid by the class during periods when reimbursements or reductions occur. Expense ratios before reductions for start-up periods may not be representative of longer-term operating periods. Expenses net of fee waivers reflect expenses after reimbursement by the investment adviser but prior to reductions from brokerage service arrangements or other expense offset arrangements. Expenses net of all reductions represent the net expenses paid by the class.
H Amount represents less than $.01 per share.
See accompanying notes which are an integral part of the financial statements.
Annual Report
Financial Highlights - Institutional Class
Years ended October 31, | 2014 | 2013 | 2012 F |
Selected Per-Share Data | | | |
Net asset value, beginning of period | $ 11.40 | $ 10.89 | $ 10.00 |
Income from Investment Operations | | | |
Net investment income (loss) B | .21 | .20 | .22 |
Net realized and unrealized gain (loss) | .18 | .48 E | .69 |
Total from investment operations | .39 | .68 | .91 |
Distributions from net investment income | (.20) | (.17) | (.02) |
Distributions from net realized gain | - | (.01) | - |
Total distributions | (.20) | (.18) | (.02) |
Redemption fees added to paid in capital B | - H | .01 | - H |
Net asset value, end of period | $ 11.59 | $ 11.40 | $ 10.89 |
Total ReturnA | 3.51% | 6.44% | 9.15% |
Ratios to Average Net Assets C, G | | | |
Expenses before reductions | 1.71% | 1.63% | 1.62% |
Expenses net of fee waivers, if any | 1.40% | 1.40% | 1.40% |
Expenses net of all reductions | 1.40% | 1.37% | 1.37% |
Net investment income (loss) | 1.86% | 1.86% | 2.17% |
Supplemental Data | | | |
Net assets, end of period (000 omitted) | $ 4,773 | $ 5,354 | $ 2,287 |
Portfolio turnover rateD | 102% | 120% | 70% |
A Total returns would have been lower if certain expenses had not been reduced during the applicable periods shown.
B Calculated based on average shares outstanding during the period.
C Fees and expenses of any underlying Fidelity Central Funds are not included in the Fund's expense ratio. The Fund indirectly bears its proportionate share of the expenses of any underlying Fidelity Central Funds.
D Amount does not include the portfolio activity of any underlying Fidelity Central Funds.
E The amount shown for a share outstanding does not correspond with the aggregate net gain (loss) on investments for the period due to the timing of sales and repurchases of shares in relation to fluctuating market values of the investments of the Fund.
F For the period November 1, 2011 (commencement of operations) to October 31, 2012.
G Expense ratios reflect operating expenses of the class. Expenses before reductions do not reflect amounts reimbursed by the investment adviser or reductions from brokerage service arrangements or reductions from other expense offset arrangements and do not represent the amount paid by the class during periods when reimbursements or reductions occur. Expense ratios before reductions for start-up periods may not be representative of longer-term operating periods. Expenses net of fee waivers reflect expenses after reimbursement by the investment adviser but prior to reductions from brokerage service arrangements or other expense offset arrangements. Expenses net of all reductions represent the net expenses paid by the class.
H Amount represents less than $.01 per share.
See accompanying notes which are an integral part of the financial statements.
Annual Report
Notes to Financial Statements
For the period ended October 31, 2014
1. Organization.
Fidelity Total Emerging Markets Fund (the Fund) is a fund of Fidelity Investment Trust (the Trust) and is authorized to issue an unlimited number of shares. The Trust is registered under the Investment Company Act of 1940, as amended (the 1940 Act), as an open-end management investment company organized as a Massachusetts business trust. The Fund offers Class A, Class T, Class C, Total Emerging Markets and Institutional Class shares, each of which has equal rights as to assets and voting privileges. Each class has exclusive voting rights with respect to matters that affect that class. The Fund's investments in emerging markets can be subject to social, economic, regulatory, and political uncertainties and can be extremely volatile.
2. Investments in Fidelity Central Funds.
The Fund invests in Fidelity Central Funds, which are open-end investment companies generally available only to other investment companies and accounts managed by the investment adviser and its affiliates. The Fund's Schedule of Investments lists each of the Fidelity Central Funds held as of period end, if any, as an investment of the Fund, but does not include the underlying holdings of each Fidelity Central Fund. As an Investing Fund, the Fund indirectly bears its proportionate share of the expenses of the underlying Fidelity Central Funds.
The Money Market Central Funds seek preservation of capital and current income and are managed by Fidelity Investments Money Management, Inc. (FIMM), an affiliate of the investment adviser. Annualized expenses of the Money Market Central Funds as of their most recent shareholder report date are less than .01%.
A complete unaudited list of holdings for each Fidelity Central Fund is available upon request or at the Securities and Exchange Commission (the SEC) website at www.sec.gov. In addition, the financial statements of the Fidelity Central Funds, which are not covered by the Fund's Report of Independent Registered Public Accounting Firm, are available on the SEC website or upon request.
3. Significant Accounting Policies.
The financial statements have been prepared in conformity with accounting principles generally accepted in the United States of America (GAAP), which require management to make certain estimates and assumptions at the date of the financial statements. Actual results could differ from those estimates. Subsequent events, if any, through the date that the financial statements were issued have been evaluated in the preparation of the financial statements. The following summarizes the significant accounting policies of the Fund:
Investment Valuation. Investments are valued as of 4:00 p.m. Eastern time on the last calendar day of the period. In accordance with valuation policies and procedures
Annual Report
3. Significant Accounting Policies - continued
Investment Valuation - continued
approved by the Board of Trustees (the Board), the Fund attempts to obtain prices from one or more third party pricing vendors or brokers to value its investments. When current market prices, quotations or currency exchange rates are not readily available or reliable, investments will be fair valued in good faith by the Fidelity Management & Research Company (FMR) Fair Value Committee (the Committee), in accordance with procedures adopted by the Board. Factors used in determining fair value vary by investment type and may include market or investment specific events, changes in interest rates and credit quality. The frequency with which these procedures are used cannot be predicted and they may be utilized to a significant extent. The Committee oversees the Fund's valuation policies and procedures and is responsible for approving and reporting to the Board all fair value determinations.
The Fund categorizes the inputs to valuation techniques used to value its investments into a disclosure hierarchy consisting of three levels as shown below:
Level 1 - quoted prices in active markets for identical investments
Level 2 - other significant observable inputs (including quoted prices for similar investments, interest rates, prepayment speeds, etc.)
Level 3 - unobservable inputs (including the Fund's own assumptions based on the best information available)
Valuation techniques used to value the Fund's investments by major category are as follows:
Equity securities, including restricted securities, for which market quotations are readily available, are valued at the last reported sale price or official closing price as reported by a third party pricing vendor on the primary market or exchange on which they are traded and are categorized as Level 1 in the hierarchy. In the event there were no sales during the day or closing prices are not available, securities are valued at the last quoted bid price or may be valued using the last available price and are generally categorized as Level 2 in the hierarchy. For foreign equity securities, when market or security specific events arise, comparisons to the valuation of American Depositary Receipts (ADRs), futures contracts, Exchange-Traded Funds (ETFs) and certain indexes as well as quoted prices for similar securities may be used and would be categorized as Level 2 in the hierarchy. Utilizing these techniques may result in transfers between Level 1 and Level 2. For equity securities, including restricted securities, where observable inputs are limited, assumptions about market activity and risk are used and these securities may be categorized as Level 3 in the hierarchy.
Annual Report
Notes to Financial Statements - continued
3. Significant Accounting Policies - continued
Investment Valuation - continued
Debt securities, including restricted securities, are valued based on evaluated prices received from third party pricing vendors or from brokers who make markets in such securities. Corporate bonds, foreign government and government agency obligations and U.S. government and government agency obligations are valued by pricing vendors who utilize matrix pricing which considers yield or price of bonds of comparable quality, coupon, maturity and type or by broker-supplied prices. When independent prices are unavailable or unreliable, debt securities may be valued utilizing pricing methodologies which consider similar factors that would be used by third party pricing vendors. Debt securities are generally categorized as Level 2 in the hierarchy but may be Level 3 depending on the circumstances.
Futures contracts are valued at the settlement price established each day by the board of trade or exchange on which they are traded and are categorized as Level 1 in the hierarchy. Investments in open-end mutual funds, including the Fidelity Central Funds, are valued at their closing net asset value (NAV) each business day and are categorized as Level 1 in the hierarchy.
Changes in valuation techniques may result in transfers in or out of an assigned level within the disclosure hierarchy. The aggregate value of investments by input level, as of October 31, 2014, including information on transfers between Levels 1 and 2, is included at the end of the Fund's Schedule of Investments.
Foreign Currency. The Fund may use foreign currency contracts to facilitate transactions in foreign-denominated securities. Gains and losses from these transactions may arise from changes in the value of the foreign currency or if the counterparties do not perform under the contracts' terms.
Foreign-denominated assets, including investment securities, and liabilities are translated into U.S. dollars at the exchange rates at period end. Purchases and sales of investment securities, income and dividends received and expenses denominated in foreign currencies are translated into U.S. dollars at the exchange rate in effect on the transaction date.
The effects of exchange rate fluctuations on investments are included with the net realized and unrealized gain (loss) on investment securities. Other foreign currency transactions resulting in realized and unrealized gain (loss) are disclosed separately.
Investment Transactions and Income. For financial reporting purposes, the Fund's investment holdings and NAV include trades executed through the end of the last business day of the period. The NAV per share for processing shareholder transactions is calculated as of the close of business of the New York Stock Exchange (NYSE), normally
Annual Report
3. Significant Accounting Policies - continued
Investment Transactions and Income - continued
4:00 p.m. Eastern time and includes trades executed through the end of the prior business day. Gains and losses on securities sold are determined on the basis of identified cost. Dividend income is recorded on the ex-dividend date, except for certain dividends from foreign securities where the ex-dividend date may have passed, which are recorded as soon as the Fund is informed of the ex-dividend date. Non-cash dividends included in dividend income, if any, are recorded at the fair market value of the securities received. Income and capital gain distributions from Fidelity Central Funds, if any, are recorded on the ex-dividend date. Distributions received on securities that represent a return of capital or capital gain are recorded as a reduction of cost of investments and/or as a realized gain. Subsequent to ex-dividend date the Fund determines the components of these distributions, based upon receipt of tax filings or other correspondence relating to the underlying investment. Interest income is accrued as earned and includes coupon interest and amortization of premium and accretion of discount on debt securities as applicable. Investment income is recorded net of foreign taxes withheld where recovery of such taxes is uncertain.
Class Allocations and Expenses. Investment income, realized and unrealized capital gains and losses, common expenses of the Fund, and certain fund-level expense reductions, if any, are allocated daily on a pro-rata basis to each class based on the relative net assets of each class to the total net assets of the Fund. Each class differs with respect to transfer agent and distribution and service plan fees incurred. Certain expense reductions may also differ by class. For the reporting period, the allocated portion of income and expenses to each class as a percent of its average net assets may vary due to the timing of recording these transactions in relation to fluctuating net assets of the classes. Expenses directly attributable to a fund are charged to that fund. Expenses attributable to more than one fund are allocated among the respective funds on the basis of relative net assets or other appropriate methods. Expense estimates are accrued in the period to which they relate and adjustments are made when actual amounts are known.
Income Tax Information and Distributions to Shareholders. Each year, the Fund intends to qualify as a regulated investment company under Subchapter M of the Internal Revenue Code, including distributing substantially all of its taxable income and realized gains. As a result, no provision for U.S. Federal income taxes is required. As of October 31, 2014, the Fund did not have any unrecognized tax benefits in the financial statements; nor is the Fund aware of any tax positions for which it is reasonably possible that the total amounts of unrecognized tax benefits will significantly change in the next twelve months. The Fund files a U.S. federal tax return, in addition to state and local tax returns as required. The Fund's federal income tax returns are subject to examination by the Internal Revenue Service (IRS) for a period of three fiscal years after they are filed. State and local tax returns may be subject to examination for an additional fiscal year
Annual Report
Notes to Financial Statements - continued
3. Significant Accounting Policies - continued
Income Tax Information and Distributions to Shareholders - continued
depending on the jurisdiction. Foreign taxes are provided for based on the Fund's understanding of the tax rules and rates that exist in the foreign markets in which it invests. The Fund is subject to a tax imposed on capital gains by certain countries in which it invests. An estimated deferred tax liability for net unrealized appreciation on the applicable securities is included in Other payables and accrued expenses on the Statement of Assets & Liabilities.
Distributions are declared and recorded on the ex-dividend date. Income dividends and capital gain distributions are declared separately for each class. Income and capital gain distributions are determined in accordance with income tax regulations, which may differ from GAAP. In addition, the Fund claimed a portion of the payment made to redeeming shareholders as a distribution for income tax purposes.
Capital accounts within the financial statements are adjusted for permanent book-tax differences. These adjustments have no impact on net assets or the results of operations. Capital accounts are not adjusted for temporary book-tax differences which will reverse in a subsequent period.
Book-tax differences are primarily due to futures contracts, foreign currency transactions, certain foreign taxes, passive foreign investment companies (PFIC), market discount, capital loss carryforwards and losses deferred due to wash sales.
The federal tax cost of investment securities and unrealized appreciation (depreciation) as of period end were as follows:
Gross unrealized appreciation | $ 10,884,326 |
Gross unrealized depreciation | (4,096,936) |
Net unrealized appreciation (depreciation) on securities | $ 6,787,390 |
| |
Tax Cost | $ 72,872,839 |
The tax-based components of distributable earnings as of period end were as follows:
Undistributed ordinary income | $ 1,043,841 |
Undistributed long-term capital gain | $ 134,651 |
Net unrealized appreciation (depreciation) on securities and other investments | $ 6,784,523 |
The tax character of distributions paid was as follows:
| October 31, 2014 | October 31, 2013 |
Ordinary Income | $ 1,381,318 | $ 1,699,019 |
Annual Report
3. Significant Accounting Policies - continued
Short-Term Trading (Redemption) Fees. Shares held by investors in the Fund less than 90 days may have been subject to a redemption fee equal to 1.50% of the NAV of shares redeemed. All redemption fees, which reduce the proceeds of the shareholder redemption, are retained by the Fund and accounted for as an addition to paid in capital.
Restricted Securities. The Fund may invest in securities that are subject to legal or contractual restrictions on resale. These securities generally may be resold in transactions exempt from registration or to the public if the securities are registered. Disposal of these securities may involve time-consuming negotiations and expense, and prompt sale at an acceptable price may be difficult. Information regarding restricted securities is included at the end of the Fund's Schedule of Investments.
New Accounting Pronouncement. In June 2014, the Financial Accounting Standards Board issued Accounting Standard Update No. 2014-11, Repurchase-to-Maturity Transactions, Repurchase Financings, and Disclosures. The Update amends the accounting for certain repurchase agreements and expands disclosure requirements for reverse repurchase agreements, securities lending and other similar transactions. The disclosure requirements are effective for annual and interim reporting periods beginning after December 15, 2014. Management is currently evaluating the impact of the Update on the Fund's financial statements and related disclosures.
4. Derivative Instruments.
Risk Exposures and the Use of Derivative Instruments. The Fund's investment objective allows the Fund to enter into various types of derivative contracts, including futures contracts. Derivatives are investments whose value is primarily derived from underlying assets, indices or reference rates and may be transacted on an exchange or over-the-counter (OTC). Derivatives may involve a future commitment to buy or sell a specified asset based on specified terms, to exchange future cash flows at periodic intervals based on a notional principal amount, or for one party to make one or more payments upon the occurrence of specified events in exchange for periodic payments from the other party.
The Fund used derivatives to increase returns and to manage exposure to certain risks as defined below. The success of any strategy involving derivatives depends on analysis of numerous economic factors, and if the strategies for investment do not work as intended, the Fund may not achieve its objectives.
The Fund's use of derivatives increased or decreased its exposure to the following risk:
Equity Risk | Equity risk relates to the fluctuations in the value of financial instruments as a result of changes in market prices (other than those arising from interest rate risk or foreign exchange risk), whether caused by factors specific to an individual investment, its issuer, or all factors affecting all instruments traded in a market or market segment. |
Annual Report
Notes to Financial Statements - continued
4. Derivative Instruments - continued
Risk Exposures and the Use of Derivative Instruments - continued
The Fund is also exposed to additional risks from investing in derivatives, such as liquidity risk and counterparty credit risk. Liquidity risk is the risk that the Fund will be unable to close out the derivative in the open market in a timely manner. Counterparty credit risk is the risk that the counterparty will not be able to fulfill its obligation to the Fund. Counterparty credit risk related to exchange-traded futures contracts may be mitigated by the protection provided by the exchange on which they trade.
Investing in derivatives may involve greater risks than investing in the underlying assets directly and, to varying degrees, may involve risk of loss in excess of any initial investment and collateral received and amounts recognized in the Statement of Assets and Liabilities. In addition, there may be the risk that the change in value of the derivative contract does not correspond to the change in value of the underlying instrument.
Futures Contracts. A futures contract is an agreement between two parties to buy or sell a specified underlying instrument for a fixed price at a specified future date. The Fund used futures contracts to manage its exposure to the stock market.
Upon entering into a futures contract, a fund is required to deposit either cash or securities (initial margin) with a clearing broker in an amount equal to a certain percentage of the face value of the contract. Futures contracts are marked-to-market daily and subsequent daily payments (variation margin) are made or received by a fund depending on the daily fluctuations in the value of the futures contracts and are recorded as unrealized appreciation or (depreciation). This receivable and/or payable, if any, is included in daily variation margin for derivative instruments in the Statement of Assets and Liabilities. Realized gain or (loss) is recorded upon the expiration or closing of a futures contract.
Any open futures contracts at period end are presented in the Schedule of Investments under the caption "Futures Contracts." The underlying face amount at value reflects each contract's exposure to the underlying instrument or index at period end and is representative of volume of activity during the period. Securities deposited to meet initial margin requirements are identified in the Schedule of Investments.
During the period the Fund recognized net realized gain (loss) of $42,055 and a change in net unrealized appreciation (depreciation) of $9,141 related to its investment in futures contracts. These amounts are included in the Statement of Operations.
5. Purchases and Sales of Investments.
Purchases and sales of securities, other than short-term securities, aggregated $78,871,035 and $87,196,124, respectively.
Annual Report
6. Fees and Other Transactions with Affiliates.
Management Fee. Fidelity Management & Research Company (the investment adviser) and its affiliates provide the Fund with investment management related services for which the Fund pays a monthly management fee. The management fee is the sum of an individual fund fee rate that is based on an annual rate of .55% of the Fund's average net assets and an annualized group fee rate that averaged .25% during the period. The group fee rate is based upon the average net assets of all the mutual funds advised by the investment adviser, including any mutual funds previously advised by the investment adviser that are currently advised by Fidelity SelectCo, LLC, an affiliate of the investment adviser. The group fee rate decreases as assets under management increase and increases as assets under management decrease. For the reporting period, the total annual management fee rate was .80% of the Fund's average net assets.
Distribution and Service Plan Fees. In accordance with Rule 12b-1 of the 1940 Act, the Fund has adopted separate Distribution and Service Plans for each class of shares. Certain classes pay Fidelity Distributors Corporation (FDC), an affiliate of the investment adviser, separate Distribution and Service Fees, each of which is based on an annual percentage of each class' average net assets. In addition, FDC may pay financial intermediaries for selling shares of the Fund and providing shareholder support services. For the period, the Distribution and Service Fee rates, total fees and amounts retained by FDC were as follows:
| Distribution
Fee | Service
Fee | Total Fees | Retained
by FDC |
Class A | -% | .25% | $ 37,836 | $ 14,585 |
Class T | .25% | .25% | 27,474 | 10,294 |
Class C | .75% | .25% | 88,055 | 66,764 |
| | | $ 153,365 | $ 91,643 |
Sales Load. FDC may receive a front-end sales charge of up to 5.75% for selling Class A shares and 3.50% for selling Class T shares, some of which is paid to financial intermediaries for selling shares of the Fund. Depending on the holding period, FDC may receive contingent deferred sales charges levied on Class A, Class T, and Class C redemptions. The deferred sales charges range from 1.00% for Class C shares, 1.00% for certain purchases of Class A shares and .25% for certain purchases of Class T shares.
For the period, sales charge amounts retained by FDC were as follows:
| Retained
by FDC |
Class A | $ 5,093 |
Class T | 1,444 |
Class C* | 1,370 |
| $ 7,907 |
* When Class C shares are initially sold, FDC pays commissions from its own resources to financial intermediaries through which the sales are made.
Annual Report
Notes to Financial Statements - continued
6. Fees and Other Transactions with Affiliates - continued
Transfer Agent Fees. Fidelity Investments Institutional Operations Company, Inc., (FIIOC), an affiliate of the investment adviser, is the transfer, dividend disbursing and shareholder servicing agent for each class of the Fund. FIIOC receives account fees and asset-based fees that vary according to the account size and type of account of the shareholders of the respective classes of the Fund. FIIOC pays for typesetting, printing and mailing of shareholder reports, except proxy statements.
For the period, transfer agent fees for each class were as follows:
| Amount | % of
Class-Level Average
Net Assets |
Class A | $ 32,080 | .21 |
Class T | 16,754 | .31 |
Class C | 19,208 | .22 |
Total Emerging Markets | 99,220 | .22 |
Institutional Class | 8,919 | .19 |
| $ 176,181 | |
Accounting and Security Lending Fees. Fidelity Service Company, Inc. (FSC), an affiliate of the investment adviser, maintains the Fund's accounting records. The accounting fee is based on the level of average net assets for each month. Under a separate contract, FSC administers the security lending program. The security lending fee is based on the number and duration of lending transactions.
Brokerage Commissions. The Fund placed a portion of its portfolio transactions with brokerage firms which are affiliates of the investment adviser. Brokerage commissions are included in net realized gain (loss) and change in net unrealized appreciation (depreciation) in the Statement of Operations. The commissions paid to these affiliated firms were $699 for the period.
7. Committed Line of Credit.
The Fund participates with other funds managed by the investment adviser or an affiliate in a $4.25 billion credit facility (the "line of credit") to be utilized for temporary or emergency purposes to fund shareholder redemptions or for other short-term liquidity purposes. The Fund has agreed to pay commitment fees on its pro-rata portion of the line of credit, which amounted to $130 and is reflected in Miscellaneous expenses on the Statement of Operations. During the period, the Fund did not borrow on this line of credit.
Annual Report
8. Security Lending.
The Fund lends portfolio securities through a lending agent from time to time in order to earn additional income. For equity securities, a lending agent is used and may loan securities to certain qualified borrowers, including Fidelity Capital Markets (FCM), a broker-dealer affiliated with the Fund. On the settlement date of the loan, the Fund receives collateral (in the form of U.S. Treasury obligations, letters of credit and/or cash) against the loaned securities and maintains collateral in an amount not less than 100% of the market value of the loaned securities during the period of the loan. The market value of the loaned securities is determined at the close of business of the Fund and any additional required collateral is delivered to the Fund on the next business day. If the borrower defaults on its obligation to return the securities loaned because of insolvency or other reasons, the Fund may apply collateral received from the borrower against the obligation. The Fund may experience delays and costs in recovering the securities loaned. Any cash collateral received is invested in the Fidelity Securities Lending Cash Central Fund. At period end, there were no security loans outstanding. Security lending income represents the income earned on investing cash collateral, less rebates paid to borrowers and any lending agent fees associated with the loan, plus any premium payments received for lending certain types of securities. Security lending income is presented in the Statement of Operations as a component of income from Fidelity Central Funds. Total security lending income during the period amounted to $202. During the period, there were no securities loaned to FCM.
9. Expense Reductions.
The investment adviser contractually agreed to reimburse each class to the extent annual operating expenses exceeded certain levels of average net assets as noted in the table below. This reimbursement will remain in place through December 31, 2015. Some expenses, for example interest expense, including commitment fees, are excluded from this reimbursement.
The following classes were in reimbursement during the period:
| Expense
Limitations | Reimbursement |
Class A | 1.65% | $ 49,666 |
Class T | 1.90% | 22,953 |
Class C | 2.40% | 28,693 |
Total Emerging Markets | 1.40% | 149,847 |
Institutional Class | 1.40% | 14,635 |
| | $ 265,794 |
In addition, the investment adviser reimbursed a portion of the Fund's operating expenses during the period in the amount of $180.
Annual Report
Notes to Financial Statements - continued
10. Distributions to Shareholders.
Distributions to shareholders of each class were as follows:
Years ended October 31, | 2014 | 2013 |
From net investment income | | |
Class A | $ 298,475 | $ 104,565 |
Class T | 72,882 | 69,282 |
Class C | 71,691 | 35,970 |
Total Emerging Markets | 837,446 | 1,316,259 |
Institutional Class | 100,824 | 35,591 |
Total | $ 1,381,318 | $ 1,561,667 |
From net realized gain | | |
Class A | $ - | $ 10,027 |
Class T | - | 7,822 |
Class C | - | 7,516 |
Total Emerging Markets | - | 109,039 |
Institutional Class | - | 2,948 |
Total | $ - | $ 137,352 |
11. Share Transactions.
Share transactions for each class were as follows and may contain automatic conversions between classes or exchanges between funds:
| Shares | Shares | Dollars | Dollars |
Years ended October 31, | 2014 | 2013 | 2014 | 2013 |
Class A | | | | |
Shares sold | 374,099 | 1,550,621 | $ 4,265,512 | $ 17,267,543 |
Reinvestment of distributions | 24,147 | 9,656 | 267,553 | 105,541 |
Shares redeemed | (876,261) | (609,546) | (9,758,391) | (6,666,165) |
Net increase (decrease) | (478,015) | 950,731 | $ (5,225,326) | $ 10,706,919 |
Class T | | | | |
Shares sold | 73,071 | 277,882 | $ 838,229 | $ 3,114,089 |
Reinvestment of distributions | 6,487 | 7,041 | 71,875 | 76,883 |
Shares redeemed | (148,531) | (295,695) | (1,659,489) | (3,268,261) |
Net increase (decrease) | (68,973) | (10,772) | $ (749,385) | $ (77,289) |
Class C | | | | |
Shares sold | 312,027 | 431,831 | $ 3,545,260 | $ 4,824,945 |
Reinvestment of distributions | 6,236 | 3,973 | 69,031 | 43,420 |
Shares redeemed | (95,617) | (316,804) | (1,079,948) | (3,521,280) |
Net increase (decrease) | 222,646 | 119,000 | $ 2,534,343 | $ 1,347,085 |
Annual Report
11. Share Transactions - continued
| Shares | Shares | Dollars | Dollars |
Years ended October 31, | 2014 | 2013 | 2014 | 2013 |
Total Emerging Markets | | | | |
Shares sold | 1,227,986 | 5,085,608 | $ 14,240,572 | $ 57,439,168 |
Reinvestment of distributions | 69,851 | 113,766 | 774,644 | 1,243,462 |
Shares redeemed | (1,734,596) | (8,294,710) | (19,517,156) | (89,232,029) |
Net increase (decrease) | (436,759) | (3,095,336) | $ (4,501,940) | $ (30,549,399) |
Institutional Class | | | | |
Shares sold | 216,506 | 491,268 | $ 2,508,322 | $ 5,357,985 |
Reinvestment of distributions | 8,910 | 3,526 | 98,814 | 38,539 |
Shares redeemed | (283,392) | (235,091) | (3,122,278) | (2,578,926) |
Net increase (decrease) | (57,976) | 259,703 | $ (515,142) | $ 2,817,598 |
12. Other.
The Fund's organizational documents provide former and current trustees and officers with a limited indemnification against liabilities arising in connection with the performance of their duties to the Fund. In the normal course of business, the Fund may also enter into contracts that provide general indemnifications. The Fund's maximum exposure under these arrangements is unknown as this would be dependent on future claims that may be made against the Fund. The risk of material loss from such claims is considered remote.
At the end of the period, the investment adviser or its affiliates were the owners of record of 29% of the total outstanding shares of the Fund.
Annual Report
To the Trustees of Fidelity Investment Trust and the Shareholders of Fidelity Emerging Markets Discovery Fund:
In our opinion, the accompanying statement of assets and liabilities, including the schedule of investments, and the related statements of operations and of changes in net assets and the financial highlights present fairly, in all material respects, the financial position of Fidelity Emerging Markets Discovery Fund (a fund of Fidelity Investment Trust) at October 31, 2014, the results of its operations for the year then ended, the changes in its net assets for each of the two years in the period then ended and the financial highlights for each of the periods indicated, in conformity with accounting principles generally accepted in the United States of America. These financial statements and financial highlights (hereafter referred to as "financial statements") are the responsibility of the Fidelity Emerging Markets Discovery Fund's management. Our responsibility is to express an opinion on these financial statements based on our audits. We conducted our audits of these financial statements in accordance with the standards of the Public Company Accounting Oversight Board (United States). Those standards require that we plan and perform the audit to obtain reasonable assurance about whether the financial statements are free of material misstatement. An audit includes examining, on a test basis, evidence supporting the amounts and disclosures in the financial statements, assessing the accounting principles used and significant estimates made by management, and evaluating the overall financial statement presentation. We believe that our audits, which included confirmation of securities at October 31, 2014 by correspondence with the custodian and brokers, provide a reasonable basis for our opinion.
PricewaterhouseCoopers LLP
Boston, Massachusetts
December 19, 2014
Annual Report
Report of Independent Registered Public Accounting Firm
To the Trustees of Fidelity Investment Trust and the Shareholders of Fidelity Total Emerging Markets Fund:
In our opinion, the accompanying statement of assets and liabilities, including the schedule of investments, and the related statements of operations and of changes in net assets and the financial highlights present fairly, in all material respects, the financial position of Fidelity Total Emerging Markets Fund (a fund of Fidelity Investment Trust) at October 31, 2014, the results of its operations for the year then ended, the changes in its net assets for each of the two years in the period then ended and the financial highlights for each of the five years in the periods indicated, in conformity with accounting principles generally accepted in the United States of America. These financial statements and financial highlights (hereafter referred to as "financial statements") are the responsibility of the Fidelity Total Emerging Markets Fund's management. Our responsibility is to express an opinion on these financial statements based on our audits. We conducted our audits of these financial statements in accordance with the standards of the Public Company Accounting Oversight Board (United States). Those standards require that we plan and perform the audit to obtain reasonable assurance about whether the financial statements are free of material misstatement. An audit includes examining, on a test basis, evidence supporting the amounts and disclosures in the financial statements, assessing the accounting principles used and significant estimates made by management, and evaluating the overall financial statement presentation. We believe that our audits, which included confirmation of securities at October 31, 2014 by correspondence with the custodian and brokers, provide a reasonable basis for our opinion.
PricewaterhouseCoopers LLP
Boston, Massachusetts
December 19, 2014
Annual Report
The Trustees, Member of the Advisory Board, and officers of the trust and funds, as applicable, are listed below. The Board of Trustees governs each fund and is responsible for protecting the interests of shareholders. The Trustees are experienced executives who meet periodically throughout the year to oversee each fund's activities, review contractual arrangements with companies that provide services to each fund, oversee management of the risks associated with such activities and contractual arrangements, and review each fund's performance. Except for James C. Curvey, each of the Trustees oversees 174 funds. Mr. Curvey oversees 407 funds.
The Trustees hold office without limit in time except that (a) any Trustee may resign; (b) any Trustee may be removed by written instrument, signed by at least two-thirds of the number of Trustees prior to such removal; (c) any Trustee who requests to be retired or who has become incapacitated by illness or injury may be retired by written instrument signed by a majority of the other Trustees; and (d) any Trustee may be removed at any special meeting of shareholders by a two-thirds vote of the outstanding voting securities of the trust. Each Trustee who is not an interested person (as defined in the 1940 Act) of the trust and the funds (Independent Trustee), shall retire not later than the last day of the calendar year in which his or her 75th birthday occurs. The Independent Trustees may waive this mandatory retirement age policy with respect to individual Trustees. The officers and Advisory Board Member hold office without limit in time, except that any officer and Advisory Board Member may resign or may be removed by a vote of a majority of the Trustees at any regular meeting or any special meeting of the Trustees. Except as indicated, each individual has held the office shown or other offices in the same company for the past five years.
Experience, Skills, Attributes, and Qualifications of the Funds' Trustees. The Governance and Nominating Committee has adopted a statement of policy that describes the experience, qualifications, attributes, and skills that are necessary and desirable for potential Independent Trustee candidates (Statement of Policy). The Board believes that each Trustee satisfied at the time he or she was initially elected or appointed a Trustee, and continues to satisfy, the standards contemplated by the Statement of Policy. The Governance and Nominating Committee also engages professional search firms to help identify potential Independent Trustee candidates who have the experience, qualifications, attributes, and skills consistent with the Statement of Policy. From time to time, additional criteria based on the composition and skills of the current Independent Trustees, as well as experience or skills that may be appropriate in light of future changes to board composition, business conditions, and regulatory or other developments, have also been considered by the professional search firms and the Governance and Nominating Committee. In addition, the Board takes into account the Trustees' commitment and participation in Board and committee meetings, as well as their leadership of standing and ad hoc committees throughout their tenure.
In determining that a particular Trustee was and continues to be qualified to serve as a Trustee, the Board has considered a variety of criteria, none of which, in isolation, was controlling. The Board believes that, collectively, the Trustees have balanced and diverse experience, qualifications, attributes, and skills, which allow the Board to operate effectively in governing each fund and protecting the interests of shareholders. Information about the specific experience, skills, attributes, and qualifications of each Trustee, which in each case led to the Board's conclusion that the Trustee should serve (or continue to serve) as a trustee of the funds, is provided below.
Annual Report
Trustees and Officers - continued
Board Structure and Oversight Function. James C. Curvey is an interested person (as defined in the 1940 Act) and currently serves as Chairman. The Trustees have determined that an interested Chairman is appropriate and benefits shareholders because an interested Chairman has a personal and professional stake in the quality and continuity of services provided to the funds. Independent Trustees exercise their informed business judgment to appoint an individual of their choosing to serve as Chairman, regardless of whether the Trustee happens to be independent or a member of management. The Independent Trustees have determined that they can act independently and effectively without having an Independent Trustee serve as Chairman and that a key structural component for assuring that they are in a position to do so is for the Independent Trustees to constitute a substantial majority for the Board. The Independent Trustees also regularly meet in executive session. Ned C. Lautenbach serves as Chairman of the Independent Trustees and as such (i) acts as a liaison between the Independent Trustees and management with respect to matters important to the Independent Trustees and (ii) with management prepares agendas for Board meetings.
Fidelity funds are overseen by different Boards of Trustees. The funds' Board oversees Fidelity's equity and high income funds and another Board oversees Fidelity's investment-grade bond, money market, and asset allocation funds. The asset allocation funds may invest in Fidelity funds overseen by the funds' Board. The use of separate Boards, each with its own committee structure, allows the Trustees of each group of Fidelity funds to focus on the unique issues of the funds they oversee, including common research, investment, and operational issues. On occasion, the separate Boards establish joint committees to address issues of overlapping consequences for the Fidelity funds overseen by each Board.
The Trustees operate using a system of committees to facilitate the timely and efficient consideration of all matters of importance to the Trustees, each fund, and fund shareholders and to facilitate compliance with legal and regulatory requirements and oversight of the funds' activities and associated risks. The Board, acting through its committees, has charged FMR and its affiliates with (i) identifying events or circumstances the occurrence of which could have demonstrably adverse effects on the funds' business and/or reputation; (ii) implementing processes and controls to lessen the possibility that such events or circumstances occur or to mitigate the effects of such events or circumstances if they do occur; and (iii) creating and maintaining a system designed to evaluate continuously business and market conditions in order to facilitate the identification and implementation processes described in (i) and (ii) above. Because the day-to-day operations and activities of the funds are carried out by or through FMR, its affiliates and other service providers, the funds' exposure to risks is mitigated but not eliminated by the processes overseen by the Trustees. While each of the Board's committees has responsibility for overseeing different aspects of the funds' activities, oversight is exercised primarily through the Operations, Audit, and Compliance Committees. In addition, the Independent Trustees have worked with FMR to enhance the Board's oversight of investment and financial risks, legal and regulatory risks, technology risks, and operational risks, including the development of additional risk reporting to the Board. For example, a working group comprised of Independent Trustees and FMR has worked and continues to work to review the Fidelity funds' valuation-related activities, reporting and risk management. Appropriate personnel, including but not limited to the funds' Chief Compliance Officer (CCO), FMR's internal auditor, the independent accountants, the funds' Treasurer and portfolio management personnel, make periodic reports to the Board's committees, as appropriate, including an annual review of FMR's risk management program for the Fidelity funds. The responsibilities of each standing committee, including their oversight responsibilities, are described further under "Standing Committees of the Funds' Trustees."
Annual Report
The fund's Statement of Additional Information (SAI) includes more information about the Trustees. To request a free copy, call Fidelity at 1-800-544-8544.
Interested Trustees*:
Correspondence intended for each Trustee who is an interested person may be sent to Fidelity Investments, 245 Summer Street, Boston, Massachusetts 02210.
Name, Year of Birth; Principal Occupations and Other Relevant Experience+ |
James C. Curvey (1935) |
Year of Election or Appointment: 2007 Trustee Chairman of the Board of Trustees |
| Mr. Curvey also serves as Trustee of other Fidelity funds. Mr. Curvey is a Director of Fidelity Research & Analysis Co. (2009-present), and Vice Chairman (2007-present) and Director of FMR LLC. In addition, Mr. Curvey serves as an Overseer for the Boston Symphony Orchestra and a member of the board of Artis-Naples, Naples, Florida, and as a Trustee for Brewster Academy, Wolfeboro, New Hampshire. Previously, Mr. Curvey served as a Director of Fidelity Investments Money Management, Inc. (2009-2014), and a Director of FMR (2007-2014), a Director of FMR Co., Inc. (2007-2014). |
Charles S. Morrison (1960) |
Year of Election or Appointment: 2014 Trustee |
| Mr. Morrison also serves as Trustee of other funds. He serves as a Director of Fidelity Investments Money Management, Inc. (FIMM) (2014-present), Director of Fidelity SelectCo, LLC (2014-present), President, Asset Management (2014-present), and is an employee of Fidelity Investments. Previously, Mr. Morrison served as Vice President of Fidelity's Fixed Income and Asset Allocation Funds (2012-2014), President, Fixed Income (2011-2014), Vice President of Fidelity's Money Market Funds (2005-2009), President, Money Market Group Leader of FMR (2009), and Senior Vice President, Money Market Group of FMR (2004-2009). Mr. Morrison also served as Vice President of Fidelity's Bond Funds (2002-2005), certain Balanced Funds (2002-2005), and certain Asset Allocation Funds (2002-2007), and as Senior Vice President (2002-2005) of Fidelity's Bond Division. |
* Trustees have been determined to be "Interested Trustees" by virtue of, among other things, their affiliation with the trust or various entities under common control with FMR.
+ The information above includes each Trustee's principal occupation during the last five years and other information relating to the experience, attributes, and skills relevant to each Trustee's qualifications to serve as a Trustee, which led to the conclusion that each Trustee should serve as a Trustee for each fund.
Annual Report
Independent Trustees:
Correspondence intended for each Independent Trustee (that is, the Trustees other than the Interested Trustees) may be sent to Fidelity Investments, P.O. Box 55235, Boston, Massachusetts 02205-5235.
Name, Year of Birth; Principal Occupations and Other Relevant Experience+ |
Dennis J. Dirks (1948) |
Year of Election or Appointment: 2005 Trustee |
| Mr. Dirks also serves as Trustee of other Fidelity funds. Prior to his retirement in May 2003, Mr. Dirks was Chief Operating Officer and a member of the Board of The Depository Trust & Clearing Corporation (DTCC). He also served as President, Chief Operating Officer, and Board member of The Depository Trust Company (DTC) and President and Board member of the National Securities Clearing Corporation (NSCC). In addition, Mr. Dirks served as Chief Executive Officer and Board member of the Government Securities Clearing Corporation, Chief Executive Officer and Board member of the Mortgage-Backed Securities Clearing Corporation, as a Trustee and a member of the Finance Committee of Manhattan College (2005-2008), and as a Trustee and a member of the Finance Committee of AHRC of Nassau County (2006-2008). Mr. Dirks is a member of the Independent Directors Council (IDC) Governing Council (2010-present) and Board of Directors for The Brookville Center for Children's Services, Inc. (2009-present). |
Alan J. Lacy (1953) |
Year of Election or Appointment: 2008 Trustee |
| Mr. Lacy also serves as Trustee of other Fidelity funds. Mr. Lacy serves as Senior Adviser (2007-present) of Oak Hill Capital Partners, L.P. (private equity). Mr. Lacy also served as Chief Executive Officer (2000-2005) and Vice Chairman (2005-2006) of Sears Holdings Corporation and Sears, Roebuck and Co. (retail). In addition, Mr. Lacy serves as a member of the Board of Directors of Dave & Buster's Entertainment, Inc. (restaurant and entertainment complexes, 2010-present), Earth Fare, Inc. (retail grocery, 2012-present), The Hillman Companies, Inc. (hardware wholesalers, 2010-present), and Bristol-Myers Squibb Company (global pharmaceuticals, 2008-present). Mr. Lacy is a member of the Board of Trustees of The National Parks Conservation Association (2006-present). Previously, Mr. Lacy served as Chairman of the Board of Trustees of the National Parks Conservation Association (2008-2011) and as a member of the Board of Directors for the Western Union Company (global money transfer, 2006-2011). |
Ned C. Lautenbach (1944) |
Year of Election or Appointment: 2000 Trustee Chairman of the Independent Trustees |
| Mr. Lautenbach also serves as Trustee of other Fidelity funds. Mr. Lautenbach currently serves as the Lead Director of the Eaton Corporation Board of Directors (diversified industrial, 1997-present). Mr. Lautenbach is Chairman of the Board of Directors of the Philharmonic Center for the Arts in Naples, Florida (2012-present) and a member of the Council on Foreign Relations (1994-present). Previously, Mr. Lautenbach was a Partner/Advisory Partner at Clayton, Dubilier & Rice, LLC (private equity investment, 1998-2010), as well as a Director of Sony Corporation (2006-2007). |
Joseph Mauriello (1944) |
Year of Election or Appointment: 2008 Trustee |
| Mr. Mauriello also serves as Trustee of other Fidelity funds. Prior to his retirement in January 2006, Mr. Mauriello served in numerous senior management positions including Deputy Chairman and Chief Operating Officer (2004-2005), and Vice Chairman of Financial Services (2002-2004) of KPMG LLP US (professional services, 1965-2005). Mr. Mauriello currently serves as a member of the Board of Directors of XL Group plc. (global insurance and re-insurance, 2006-present). Previously, Mr. Mauriello served as a Director of the Hamilton Funds of the Bank of New York (2006-2007) and of Arcadia Resources Inc. (health care services and products, 2007-2012). |
Robert W. Selander (1950) |
Year of Election or Appointment: 2011 Trustee |
| Mr. Selander also serves as Trustee of other Fidelity funds. Previously, Mr. Selander served as a Member of the Advisory Board of other Fidelity funds (2011), and Executive Vice Chairman (2010), Chief Executive Officer (2009-2010), and President and Chief Executive Officer (1997-2009) of Mastercard, Inc. |
Cornelia M. Small (1944) |
Year of Election or Appointment: 2005 Trustee |
| Ms. Small also serves as Trustee of other Fidelity funds. Ms. Small is a member of the Board of Directors (2009-present) and Chair of the Investment Committee (2010-present) of the Teagle Foundation. Ms. Small also serves on the Investment Committee of the Berkshire Taconic Community Foundation (2008-present). Previously, Ms. Small served as Chairperson (2002-2008) and a member of the Investment Committee and Chairperson (2008-2012) and a member of the Board of Trustees of Smith College. In addition, Ms. Small served as Chief Investment Officer, Director of Global Equity Investments, and a member of the Board of Directors of Scudder, Stevens & Clark and Scudder Kemper Investments. |
William S. Stavropoulos (1939) |
Year of Election or Appointment: 2001 Trustee Vice Chairman of the Independent Trustees |
| Mr. Stavropoulos also serves as Trustee of other Fidelity funds. Mr. Stavropoulos serves as President and Founder of the Michigan Baseball Foundation, the Great Lakes Loons (2007-present). Mr. Stavropoulos is Chairman Emeritus of the Board of Directors of The Dow Chemical Company, where he previously served in numerous senior management positions, including President, CEO (1995-2000; 2002-2004), Chairman of the Executive Committee (2000-2006), and as a member of the Board of Directors (1990-2006). Currently, Mr. Stavropoulos is Chairman of the Board of Directors of Univar Inc. (global distributor of commodity and specialty chemicals), a Director of Teradata Corporation (data warehousing and technology solutions), and Maersk Inc. (industrial conglomerate), and a member of the Advisory Board for Metalmark Capital LLC (private equity investment, 2005-present). Mr. Stavropoulos is an operating advisor to Clayton, Dubilier & Rice, LLC (private equity investment). In addition, Mr. Stavropoulos is a member of the University of Notre Dame Advisory Council for the College of Science, a Trustee of the Rollin L. Gerstacker Foundation, and a Director of the Naples Philharmonic Center for the Arts. Previously, Mr. Stavropoulos served as a Director of Chemical Financial Corporation (bank holding company, 1993-2012) and Tyco International, Ltd. (multinational manufacturing and services, 2007-2012). |
David M. Thomas (1949) |
Year of Election or Appointment: 2008 Trustee |
| Mr. Thomas also serves as Trustee of other Fidelity funds. Mr. Thomas serves as Non-Executive Chairman of the Board of Directors of Fortune Brands Home and Security (home and security products, 2011-present), and as a member of the Board of Directors of Interpublic Group of Companies, Inc. (marketing communication, 2004-present). Previously, Mr. Thomas served as Executive Chairman (2005-2006) and Chairman and Chief Executive Officer (2000-2005) of IMS Health, Inc. (pharmaceutical and healthcare information solutions), and a Director of Fortune Brands, Inc. (consumer products, 2000-2011). |
+ The information above includes each Trustee's principal occupation during the last five years and other information relating to the experience, attributes, and skills relevant to each Trustee's qualifications to serve as a Trustee, which led to the conclusion that each Trustee should serve as a Trustee for each fund.
Advisory Board Member and Officers:
Correspondence intended for each officer and Peter S. Lynch may be sent to Fidelity Investments, 245 Summer Street, Boston, Massachusetts 02210. Officers appear below in alphabetical order.
Name, Year of Birth; Principal Occupation |
Peter S. Lynch (1944) |
Year of Election or Appointment: 2003 Member of the Advisory Board |
| Mr. Lynch also serves as Member of the Advisory Board of other Fidelity funds. Mr. Lynch is Vice Chairman and a Director of FMR and FMR Co., Inc. In addition, Mr. Lynch serves as a Trustee of Boston College and as the Chairman of the Inner-City Scholarship Fund. Previously, Mr. Lynch served on the Special Olympics International Board of Directors (1997-2006). |
Elizabeth Paige Baumann (1968) |
Year of Election or Appointment: 2012 Anti-Money Laundering (AML) Officer |
| Ms. Baumann also serves as AML Officer of other funds. She is Chief AML Officer of FMR LLC (2012-present) and is an employee of Fidelity Investments. Previously, Ms. Baumann served as Vice President and Deputy Anti-Money Laundering Officer (2007-2012). |
William C. Coffey (1969) |
Year of Election or Appointment: 2009 Assistant Secretary |
| Mr. Coffey also serves as Assistant Secretary of other funds. He is Senior Vice President and Deputy General Counsel of FMR LLC (2010-present), and is an employee of Fidelity Investments. Previously, Mr. Coffey served as Vice President and Associate General Counsel of FMR LLC (2005-2009). |
Timothy M. Cohen (1969) |
Year of Election or Appointment: 2014 Vice President of certain Equity Funds |
| Mr. Cohen also serves as Vice President of other funds. Mr. Cohen serves as a Director and Chief Compliance Officer of Fidelity Management & Research (U.K.) Inc. (2013-present) and is an employee of Fidelity Investments. |
Jonathan Davis (1968) |
Year of Election or Appointment: 2010 Assistant Treasurer |
| Mr. Davis also serves as Assistant Treasurer of other funds. Mr. Davis is an employee of Fidelity Investments. Previously, Mr. Davis served as Vice President and Associate General Counsel of FMR LLC (2003-2010). |
Adrien E. Deberghes (1967) |
Year of Election or Appointment: 2008 Deputy Treasurer |
| Mr. Deberghes also serves as an officer of other funds. He is an employee of Fidelity Investments (2008-present). Prior to joining Fidelity Investments, Mr. Deberghes was Senior Vice President of Mutual Fund Administration at State Street Corporation (2007-2008), Senior Director of Mutual Fund Administration at Investors Bank & Trust (2005-2007), and Director of Finance for Dunkin' Brands (2000-2005). |
Stephanie J. Dorsey (1969) |
Year of Election or Appointment: 2010 Assistant Treasurer |
| Ms. Dorsey also serves as an officer of other funds. She is an employee of Fidelity Investments (2008-present) and has served in other fund officer roles. Prior to joining Fidelity Investments, Ms. Dorsey served as Treasurer (2004-2008) of the JPMorgan Mutual Funds and Vice President (2004-2008) of JPMorgan Chase Bank. |
Howard J. Galligan III (1966) |
Year of Election or Appointment: 2014 Chief Financial Officer |
| Mr. Galligan also serves as Chief Financial Officer of other funds. Mr. Galligan serves as President of Fidelity Pricing and Cash Management Services (FPCMS) (2014-present) and as a Director of Strategic Advisers, Inc. (2008-present). Previously, Mr. Galligan served as Chief Administrative Officer of Asset Management (2011-2014) and Chief Operating Officer and Senior Vice President of Investment Support for Strategic Advisers, Inc. (2003-2011). |
Scott C. Goebel (1968) |
Year of Election or Appointment: 2008 Secretary and Chief Legal Officer (CLO) |
| Mr. Goebel serves as Secretary and CLO of other funds. Mr. Goebel also serves as Secretary of Fidelity SelectCo, LLC (2013-present), Fidelity Investments Money Management, Inc. (FIMM) (2010-present) and Fidelity Research and Analysis Company (FRAC) (2010-present); General Counsel, Secretary, and Senior Vice President of FMR (2008-present) and FMR Co., Inc. (2008-present); Chief Legal Officer of Fidelity Management & Research (Hong Kong) Limited (2008-present); and Assistant Secretary of Fidelity Management & Research (Japan) Limited (2008-present) and Fidelity Management & Research (U.K.) Inc. (2008-present). Previously, Mr. Goebel served as Secretary and CLO of other Fidelity funds (2008-2013), Assistant Secretary of FIMM (2008-2010), FRAC (2008-2010), and certain funds (2007-2008); and as Vice President and Secretary of Fidelity Distributors Corporation (FDC) (2005-2007). Mr. Goebel has been employed by FMR LLC or an affiliate since 2001. |
Brian B. Hogan (1964) |
Year of Election or Appointment: 2009 Vice President |
| Mr. Hogan also serves as Trustee or Vice President of other funds. Mr. Hogan serves as a Director of Fidelity SelectCo, LLC (2014-present) and President of FMR's Equity Division (2009-present). Previously, Mr. Hogan served as Senior Vice President, Equity Research of FMR (2006-2009) and as a portfolio manager. |
Chris Maher (1972) |
Year of Election or Appointment: 2013 Assistant Treasurer |
| Mr. Maher serves as Assistant Treasurer of other funds. Mr. Maher is Vice President of Valuation Oversight and is an employee of Fidelity Investments. Previously, Mr. Maher served as Vice President of Asset Management Compliance (2013), Vice President of FMR's Program Management Group (2010-2013), and Vice President of Valuation Oversight (2008-2010). |
Kenneth B. Robins (1969) |
Year of Election or Appointment: 2008 President and Treasurer |
| Mr. Robins also serves as an officer of other funds. Mr. Robins serves as Executive Vice President of Fidelity Investments Money Management, Inc. (FIMM) (2013-present) and is an employee of Fidelity Investments (2004-present). Previously, Mr. Robins served in other fund officer roles. |
Stephen Sadoski (1971) |
Year of Election or Appointment: 2012 Deputy Treasurer |
| Mr. Sadoski also serves as Deputy Treasurer of other funds. He is an employee of Fidelity Investments (2012-present) and has served in another fund officer role. Prior to joining Fidelity Investments, Mr. Sadoski served as an assistant chief accountant in the Division of Investment Management of the Securities and Exchange Commission (SEC) (2009-2012) and as a senior manager at Deloitte & Touche LLP (1997-2009). |
Stacie M. Smith (1974) |
Year of Election or Appointment: 2013 Deputy Treasurer |
| Ms. Smith also serves as an officer of other funds. She is an employee of Fidelity Investments (2009-present) and has served in other fund officer roles. Prior to joining Fidelity Investments, Ms. Smith served as Senior Audit Manager of Ernst & Young LLP (1996-2009). |
Renee Stagnone (1975) |
Year of Election or Appointment: 2013 Deputy Treasurer |
| Ms. Stagnone also serves as Deputy Treasurer of other funds. Ms. Stagnone is an employee of Fidelity Investments. |
Linda J. Wondrack (1964) |
Year of Election or Appointment: 2014 Chief Compliance Officer |
| Ms. Wondrack also serves as Chief Compliance Officer of other funds. Ms. Wondrack is Executive Vice President and head of the Ethics Office and Asset Management Compliance for Fidelity Investments (2012-present). Ms. Wondrack also serves as Chief Compliance Officer of Fidelity SelectCo, LLC (2014-present); Chief Compliance Officer of Impresa Management LLC (2013-present); and Chief Compliance Officer of FMR Co., Inc., Fidelity Investments Money Management, Inc., Fidelity Management & Research (Japan) Limited, Fidelity Management & Research (U.K.) Inc., Fidelity Management & Research (Hong Kong), Fidelity Management & Research Company, Pyramis Global Advisors, LLC, and Strategic Advisers, Inc., Ballyrock Investment Advisors LLC, and Northern Neck Investors LLC (2012-present). Previously, Ms. Wondrack served as Senior Vice President and Chief Compliance Officer for Columbia Management Investment Advisers, LLC (2005-2012); Chief Compliance Officer for certain funds within the Columbia Family of Funds (2007-2012); and Senior Vice President of Compliance Risk Management at Bank of America (2005-2010). |
Joseph F. Zambello (1957) |
Year of Election or Appointment: 2011 Deputy Treasurer |
| Mr. Zambello also serves as Deputy Treasurer of other funds. Mr. Zambello is an employee of Fidelity Investments. Previously, Mr. Zambello served as Vice President of FMR's Program Management Group (2009-2011) and Vice President of the Transfer Agent Oversight Group (2005-2009). |
Annual Report
The Board of Trustees of each fund voted to pay to shareholders of record at the opening of business on record date, the following distributions per share derived from capital gains realized from sales of portfolio securities and dividends derived from net investment income:
| Pay Date | Record Date | Dividends | Capital Gains |
Emerging Markets Discovery | | | | |
| 12/08/14 | 12/05/14 | $0.000 | $0.000 |
Total Emerging Markets | | | | |
| 12/08/14 | 12/05/14 | $0.199 | $0.020 |
Total Emerging Markets fund hereby designates as a capital gain dividend with respect to the taxable year ended October 31, 2014, $135,843 or, if subsequently determined to be different, the net capital gain of such year.
A percentage of the dividends distributed during the fiscal year for the following funds may be taken into account as a dividend for purposes of the maximum rate under section 1(h)(11) of the Internal Revenue Code.
| December 2013 | | |
Emerging Markets Discovery | 85% | | |
Total Emerging Markets | 93% | | |
The amounts per share which represent income derived from sources within, and taxes paid to, foreign countries or possessions of the United States are as follows:
| Pay Date | Income | Taxes |
Emerging Markets Discovery | | | |
| 12/09/13 | $0.1272 | $0.0422 |
| | | |
| Pay Date | Income | Taxes |
Total Emerging Markets | | | |
| 12/09/13 | $0.2319 | $0.0349 |
The funds will notify shareholders in January 2015 of amounts for use in preparing 2014 income tax returns.
Annual Report
Board Approval of Investment Advisory Contracts and Management Fees
Fidelity Emerging Markets Discovery Fund
Fidelity Total Emerging Markets Fund
Each year, the Board of Trustees, including the Independent Trustees (together, the Board), votes on the renewal of the management contract with Fidelity Management & Research Company (FMR) and the sub-advisory agreements (together, the Advisory Contracts) for each fund. The Board, assisted by the advice of fund counsel and Independent Trustees' counsel, requests and considers a broad range of information relevant to the renewal of the Advisory Contracts throughout the year.
The Board meets regularly and, at each of its meetings, covers an extensive agenda of topics and materials and considers factors that are relevant to its annual consideration of the renewal of each fund's Advisory Contracts, including the services and support provided to each fund and its shareholders. The Board has established various standing committees (Committees), each composed of and chaired by Independent Trustees with varying backgrounds, to which the Board has assigned specific subject matter responsibilities in order to enhance effective decision-making by the Board. The Board, acting directly and through its Committees, requests and receives information concerning the annual consideration of the renewal of each fund's Advisory Contracts. The Board also meets as needed to consider matters specifically related to the Board's annual consideration of the renewal of the Advisory Contracts. Members of the Board may also meet with trustees of other Fidelity funds through ad hoc joint committees to discuss certain matters relevant to the Fidelity funds.
At its July 2014 meeting, the Board, including the Independent Trustees, unanimously determined to renew each fund's Advisory Contracts. In reaching its determination, the Board considered all factors it believed relevant, including (i) the nature, extent, and quality of the services to be provided to each fund and its shareholders (including the investment performance of each fund); (ii) the competitiveness of each fund's management fee and total expense ratio relative to peer funds; (iii) the total costs of the services to be provided by and the profits to be realized by Fidelity from its relationship with each fund; (iv) the extent to which economies of scale exist and would be realized as each fund grows; and (v) whether fee levels reflect these economies of scale, if any, for the benefit of fund shareholders. In connection with separate internal corporate reorganizations involving Fidelity Management & Research (U.K.) Inc. (FMR U.K.) and Fidelity Management & Research (Japan) Inc. (FMR Japan), the Board approved certain non-material amendments to the funds' sub-advisory agreements with FMR U.K. and FMR Japan to reflect that, after these reorganizations, FMR Investment Management (UK) Limited and Fidelity Management & Research (Japan) Limited will carry on the business of FMR U.K. and FMR Japan, respectively. The Board noted that no changes to the portfolio managers or to the foreign research or investment advisory services provided to the funds were expected in connection with either reorganization and that the same personnel and resources would continue to be available to the funds at the new entities.
Annual Report
In considering whether to renew the Advisory Contracts for each fund, the Board reached a determination, with the assistance of fund counsel and Independent Trustees' counsel and through the exercise of its business judgment, that the renewal of the Advisory Contracts was in the best interests of each fund and its shareholders and that the compensation payable under the Advisory Contracts was fair and reasonable. The Board's decision to renew the Advisory Contracts was not based on any single factor, but rather was based on a comprehensive consideration of all the information provided to the Board at its meetings throughout the year. The Board, in reaching its determination to renew the Advisory Contracts, was aware that shareholders of each fund have a broad range of investment choices available to them, including a wide choice among funds offered by Fidelity's competitors, and that each fund's shareholders, who have the opportunity to review and weigh the disclosure provided by the fund in its prospectus and other public disclosures, have chosen to invest in that fund, which is part of the Fidelity family of funds.
Nature, Extent, and Quality of Services Provided. The Board considered Fidelity's staffing as it relates to the funds, including the backgrounds of investment personnel of FMR and the sub-advisers (together, the Investment Advisers), and also considered the funds' investment objectives, strategies, and related investment philosophies. The Independent Trustees also had discussions with senior management of Fidelity's investment operations and investment groups. The Board considered the structure of the portfolio manager compensation program and whether this structure provides appropriate incentives to act in the best interests of each fund. Additionally, the Board considered the portfolio managers' investments, if any, in the funds that they manage.
Resources Dedicated to Investment Management and Support Services. The Board and the Fund Oversight and Research Committees reviewed the general qualifications and capabilities of Fidelity's investment staff, including its size, education, experience, and resources, as well as Fidelity's approach to recruiting, training, managing, and compensating investment personnel. The Board noted that Fidelity has continued to increase the resources devoted to non-U.S. offices, including expansion of Fidelity's global investment organization. The Board also noted that Fidelity's analysts have extensive resources, tools and capabilities that allow them to conduct sophisticated quantitative and fundamental analysis, as well as credit analysis of issuers, counterparties and guarantors. Further, the Board believes that Fidelity's investment professionals have sufficient access to global information and data so as to provide competitive investment results over time, and that those professionals also have access to sophisticated tools that permit them to assess portfolio construction and risk and performance attribution characteristics continuously, as well as to transmit new information and research conclusions rapidly around the world. Additionally, in its deliberations, the Board considered Fidelity's trading and risk management capabilities and resources and global compliance infrastructure, which are an integral part of the investment management process.
Annual Report
Board Approval of Investment Advisory Contracts and
Management Fees - continued
Shareholder and Administrative Services. The Board considered (i) the nature, extent, quality, and cost of advisory, administrative, and shareholder services performed by the Investment Advisers and their affiliates under the Advisory Contracts and under separate agreements covering transfer agency, pricing and bookkeeping, and securities lending services for each fund; (ii) the nature and extent of the supervision of third party service providers, principally custodians and subcustodians; and (iii) the resources devoted to, and the record of compliance with, each fund's compliance policies and procedures. The Board also reviewed the allocation of fund brokerage, including allocations to brokers affiliated with the Investment Advisers, the use of brokerage commissions to pay fund expenses, and the use of "soft" commission dollars to pay for research services.
The Board noted that the growth of fund assets over time across the complex allows Fidelity to reinvest in the development of services designed to enhance the value or convenience of the Fidelity funds as investment vehicles. These services include 24-hour access to account information and market information through telephone representatives and over the Internet, investor education materials and asset allocation tools, and the expanded availability of Fidelity Investor Centers.
In 2014, the Board formed an ad hoc Committee on Transfer Agency Fees to review the variety of transfer agency fee structures throughout the industry and Fidelity's competitive positioning with respect to industry participants.
Investment in a Large Fund Family. The Board considered the benefits to shareholders of investing in a Fidelity fund, including the benefits of investing in a fund that is part of a large family of funds offering a variety of investment disciplines and providing a large variety of mutual fund investor services. The Board noted that Fidelity had taken, or had made recommendations that resulted in the Fidelity funds taking, a number of actions over the previous year that benefited particular funds, including (i) continuing to dedicate additional resources to investment research and to the support of the senior management team that oversees asset management; (ii) persisting in efforts to enhance Fidelity's global research capabilities; (iii) launching new funds and making other enhancements to meet client needs for income-oriented solutions; (iv) reducing fund expenses for certain index funds; (v) continuing to launch dedicated lower cost underlying funds to meet portfolio construction needs related to expanding underlying fund options for Fidelity funds of funds, specifically for the Freedom Fund product lines; (vi) rationalizing product lines and gaining increased efficiencies through fund mergers; (vii) launching sector-based exchange-traded funds and establishing a new Fidelity adviser to manage sector-based funds and products; (viii) continuing to develop and implement technology to improve security and increase efficiency; (ix) modifying the eligibility criteria for certain share classes to increase their marketability to a portion of the defined contribution plan market; (x) waiving redemption fees for certain qualified fund-of-fund and wrap programs and certain retirement plan transactions; and (xi) launching new Institutional Class shares of certain money market funds to attract and retain assets and to fill a gap in the money market fund lineup.
Annual Report
Investment Performance. The Board considered whether each fund has operated in accordance with its investment objective, as well as its record of compliance with its investment restrictions and its performance history.
The Board took into account discussions with the Investment Advisers about fund investment performance that occur at Board meetings throughout the year. In this regard the Board noted that as part of regularly scheduled fund reviews and other reports to the Board on fund performance, the Board periodically considers annualized return information for each fund, for different time periods, measured against a securities market index ("benchmark index") and a peer group of funds with similar objectives ("peer group"). In its evaluation of fund investment performance, the Board gave particular attention to information indicating changes in performance of certain Fidelity funds for specific time periods and the Investment Advisers' explanations for any overperformance or underperformance.
In addition to reviewing absolute and relative fund performance, the Independent Trustees periodically consider the appropriateness of fund performance metrics in evaluating the results achieved. In general, the Independent Trustees believe that fund performance should be evaluated based on net performance (after fees and expenses) of both the highest performing and lowest performing classes, where applicable, compared to appropriate benchmark indices, over appropriate time periods which may include full market cycles, and compared to peer groups, as applicable, over the same periods, taking into account relevant factors including the following: general market conditions; issuer-specific information; tactical opportunities for investment; and fund cash flows and other factors.
The Independent Trustees recognize that shareholders evaluate performance on a net basis over their own holding periods, for which one-, three-, and five-year periods are often used as a proxy. For this reason, the performance information reviewed by the Board also included net cumulative calendar year total return information for each fund and an appropriate benchmark index and, in the case of Fidelity Emerging Markets Discovery Fund, peer group for the most recent one-year period, as shown below. Returns are shown compared to the 25th percentile (top of box, 75% beaten) and 75th percentile (bottom of box, 25% beaten) of the peer universe. For Fidelity Total Emerging Markets Fund, a peer group comparison is not shown below.
Annual Report
Board Approval of Investment Advisory Contracts and
Management Fees - continued
Fidelity Emerging Markets Discovery Fund
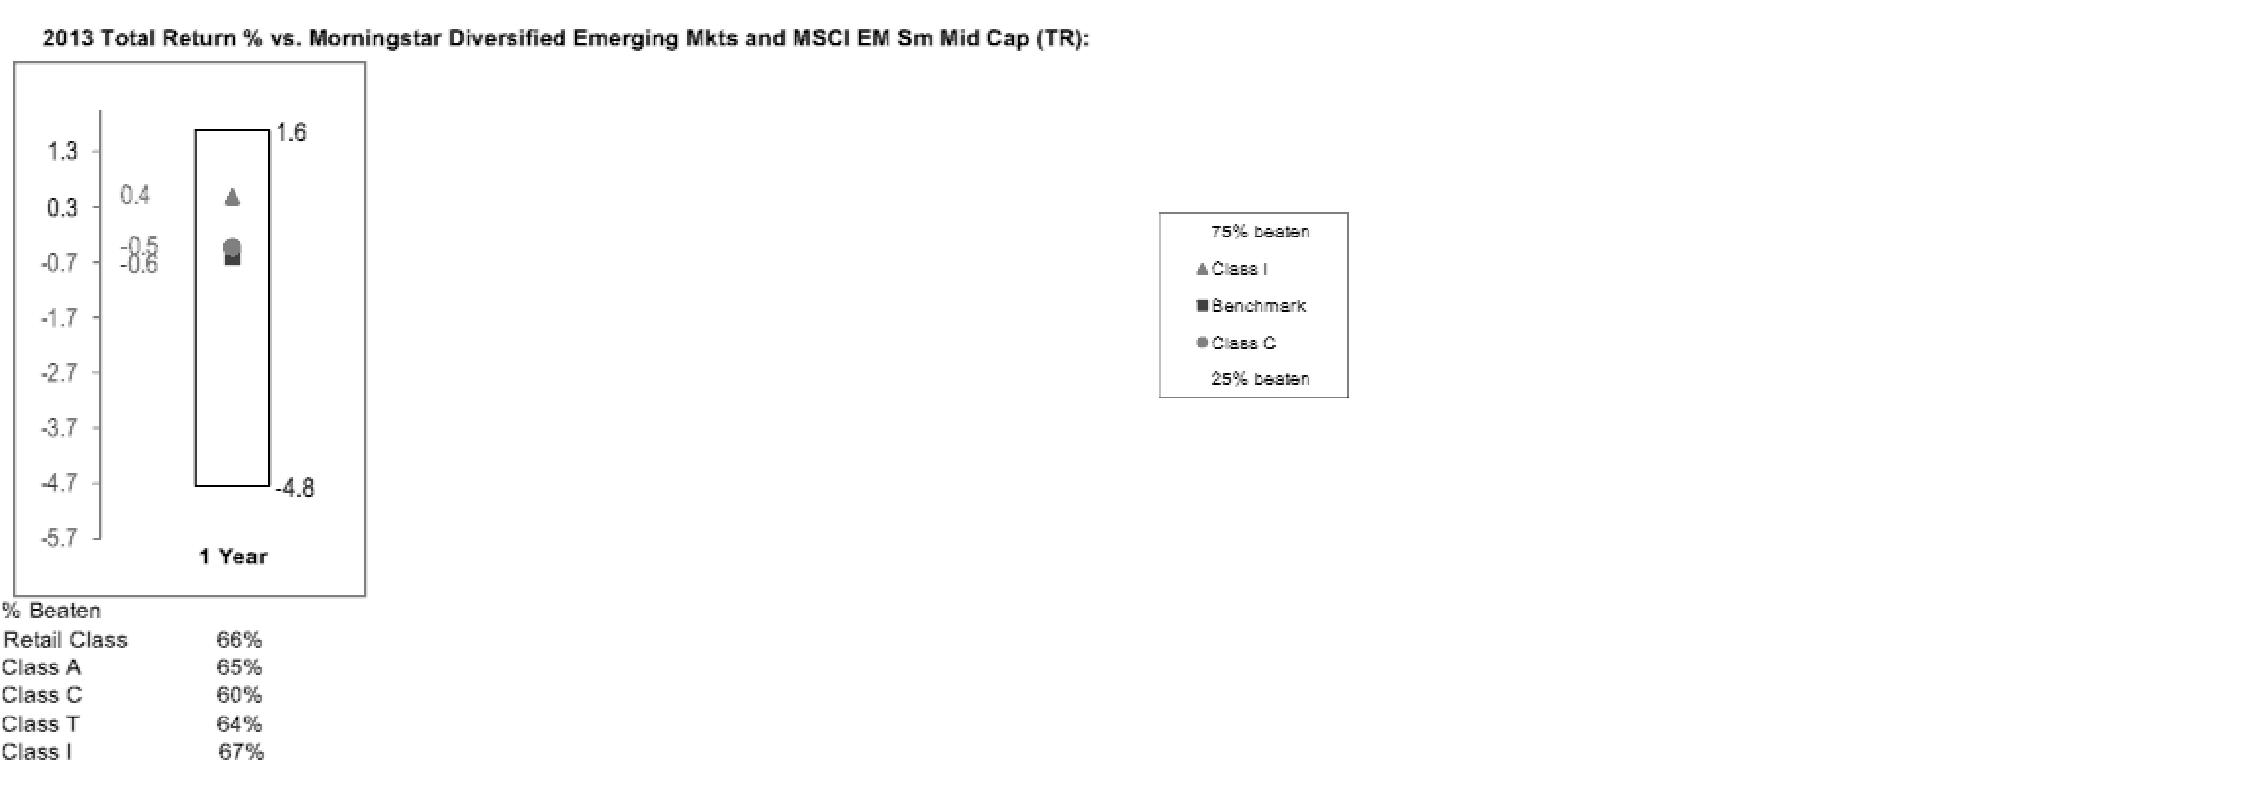
Fidelity Total Emerging Markets Fund
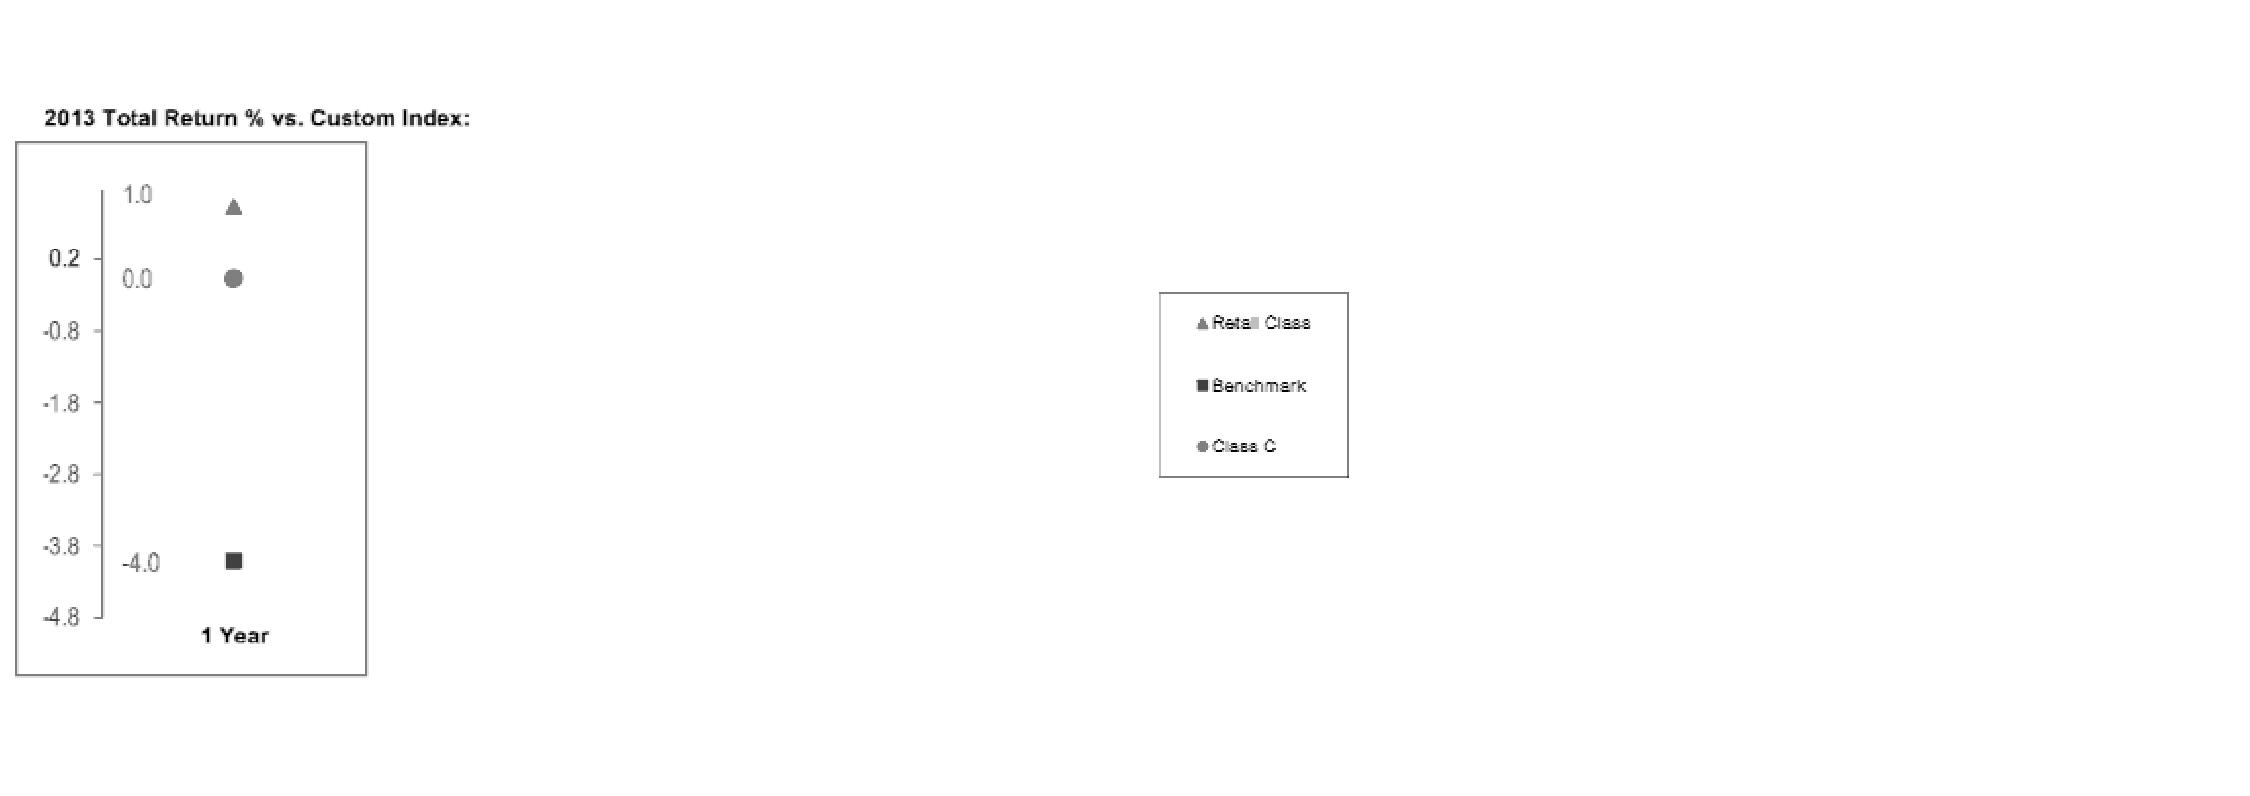
Based on its review, the Board concluded that the nature, extent, and quality of services provided to each fund under the Advisory Contracts should benefit each fund's shareholders.
Competitiveness of Management Fee and Total Expense Ratio. The Board considered each fund's management fee and total expense ratio compared to "mapped groups" of competitive funds and classes. Fidelity creates "mapped groups" by combining similar Lipper investment objective categories that have comparable investment mandates. Combining Lipper investment objective categories aids the Board's management fee and total expense ratio comparisons by broadening the competitive group used for comparison and by reducing the number of universes to which various Fidelity funds are compared.
Annual Report
Management Fee. The Board considered two proprietary management fee comparisons for the 12-month (or shorter) periods shown in the charts below. The group of Lipper funds used by the Board for management fee comparisons is referred to below as the "Total Mapped Group." The Total Mapped Group comparison focuses on a fund's standing in terms of gross management fees before expense reimbursements or caps relative to the total universe of funds with comparable investment mandates, regardless of whether their management fee structures also are comparable. Funds with comparable investment mandates offer exposure to similar types of securities. Funds with comparable management fee structures have similar management fee contractual arrangements (e.g., flat rate charged for advisory services, all-inclusive fee rate, etc.). "TMG %" represents the percentage of funds in the Total Mapped Group that had management fees that were lower than a fund's. For example, a hypothetical TMG % of 20% would mean that 80% of the funds in the Total Mapped Group had higher, and 20% had lower, management fees than a fund. The funds' actual TMG %s are in the charts below. The "Asset-Size Peer Group" (ASPG) comparison focuses on a fund's standing relative to a subset of non-Fidelity funds within the Total Mapped Group that are similar in size and management fee structure. For example, if a fund is in the first quartile of the ASPG, the fund's management fee ranks in the least expensive or lowest 25% of funds in the ASPG. The ASPG represents at least 15% of the funds in the Total Mapped Group with comparable asset size and management fee structures, subject to a minimum of 50 funds (or all funds in the Total Mapped Group if fewer than 50). Additional information, such as the ASPG quartile in which a fund's management fee rate ranked, is also included in the charts and considered by the Board.
Annual Report
Board Approval of Investment Advisory Contracts and
Management Fees - continued
Fidelity Emerging Markets Discovery Fund
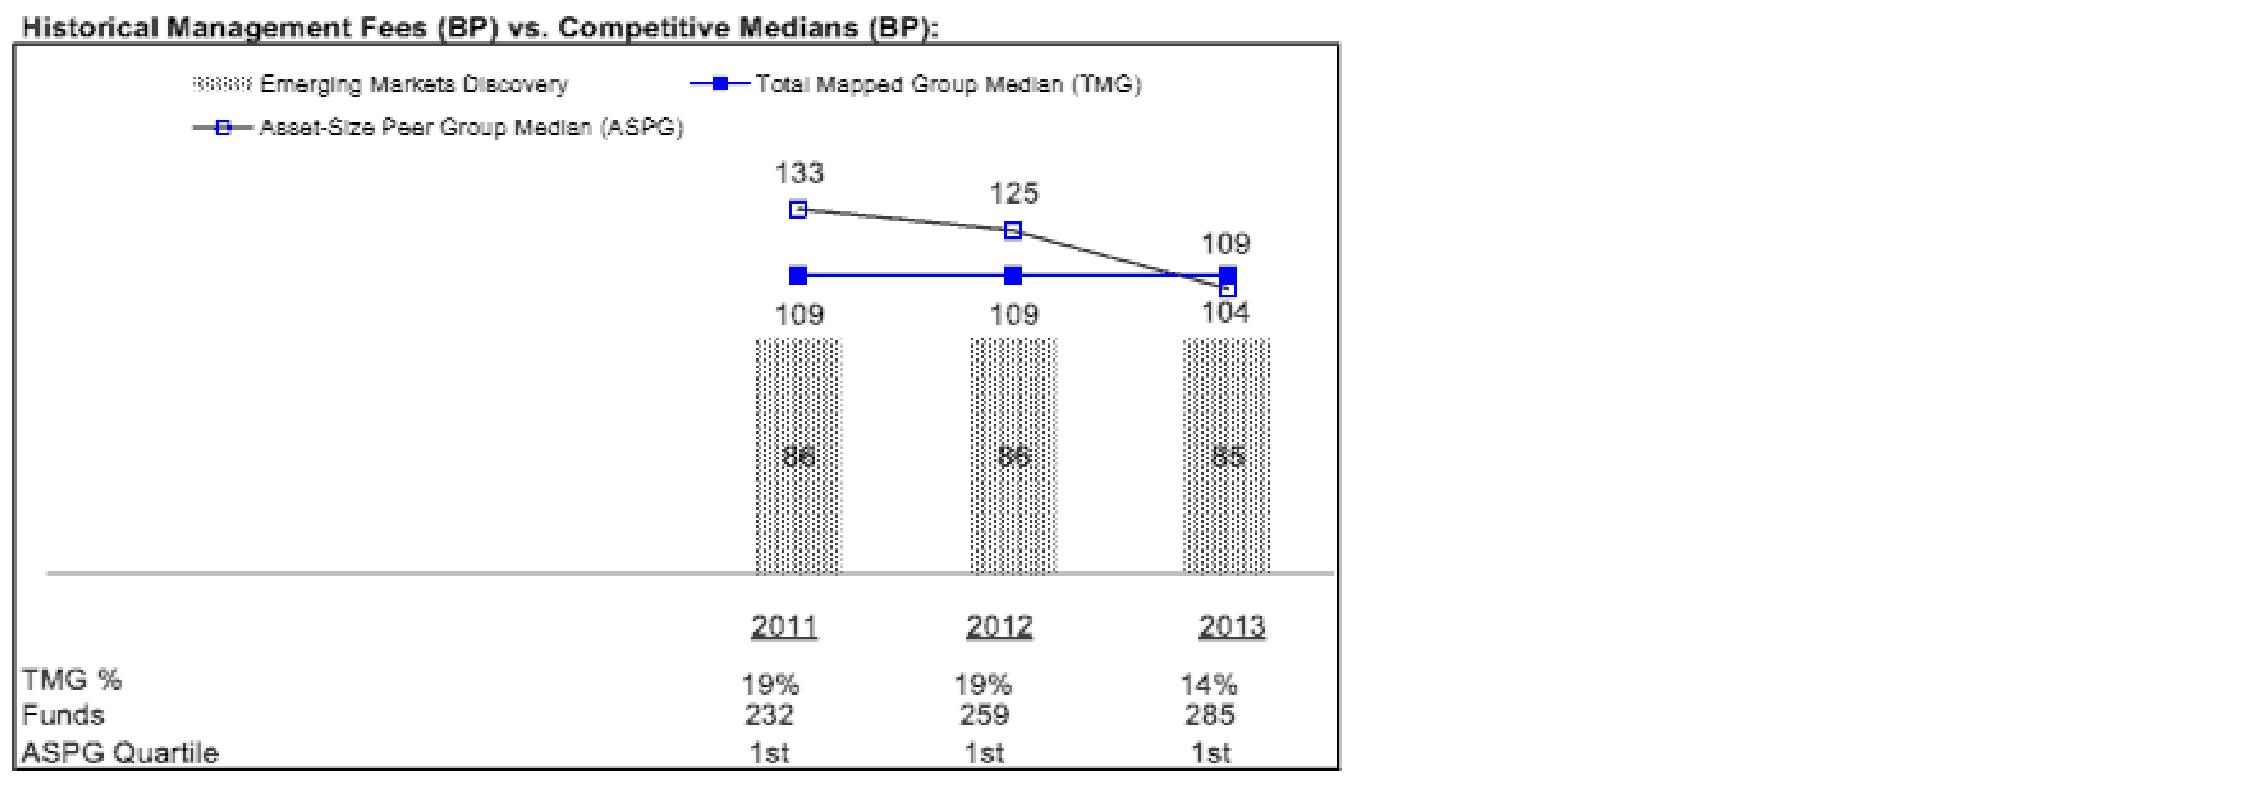
Fidelity Total Emerging Markets Fund
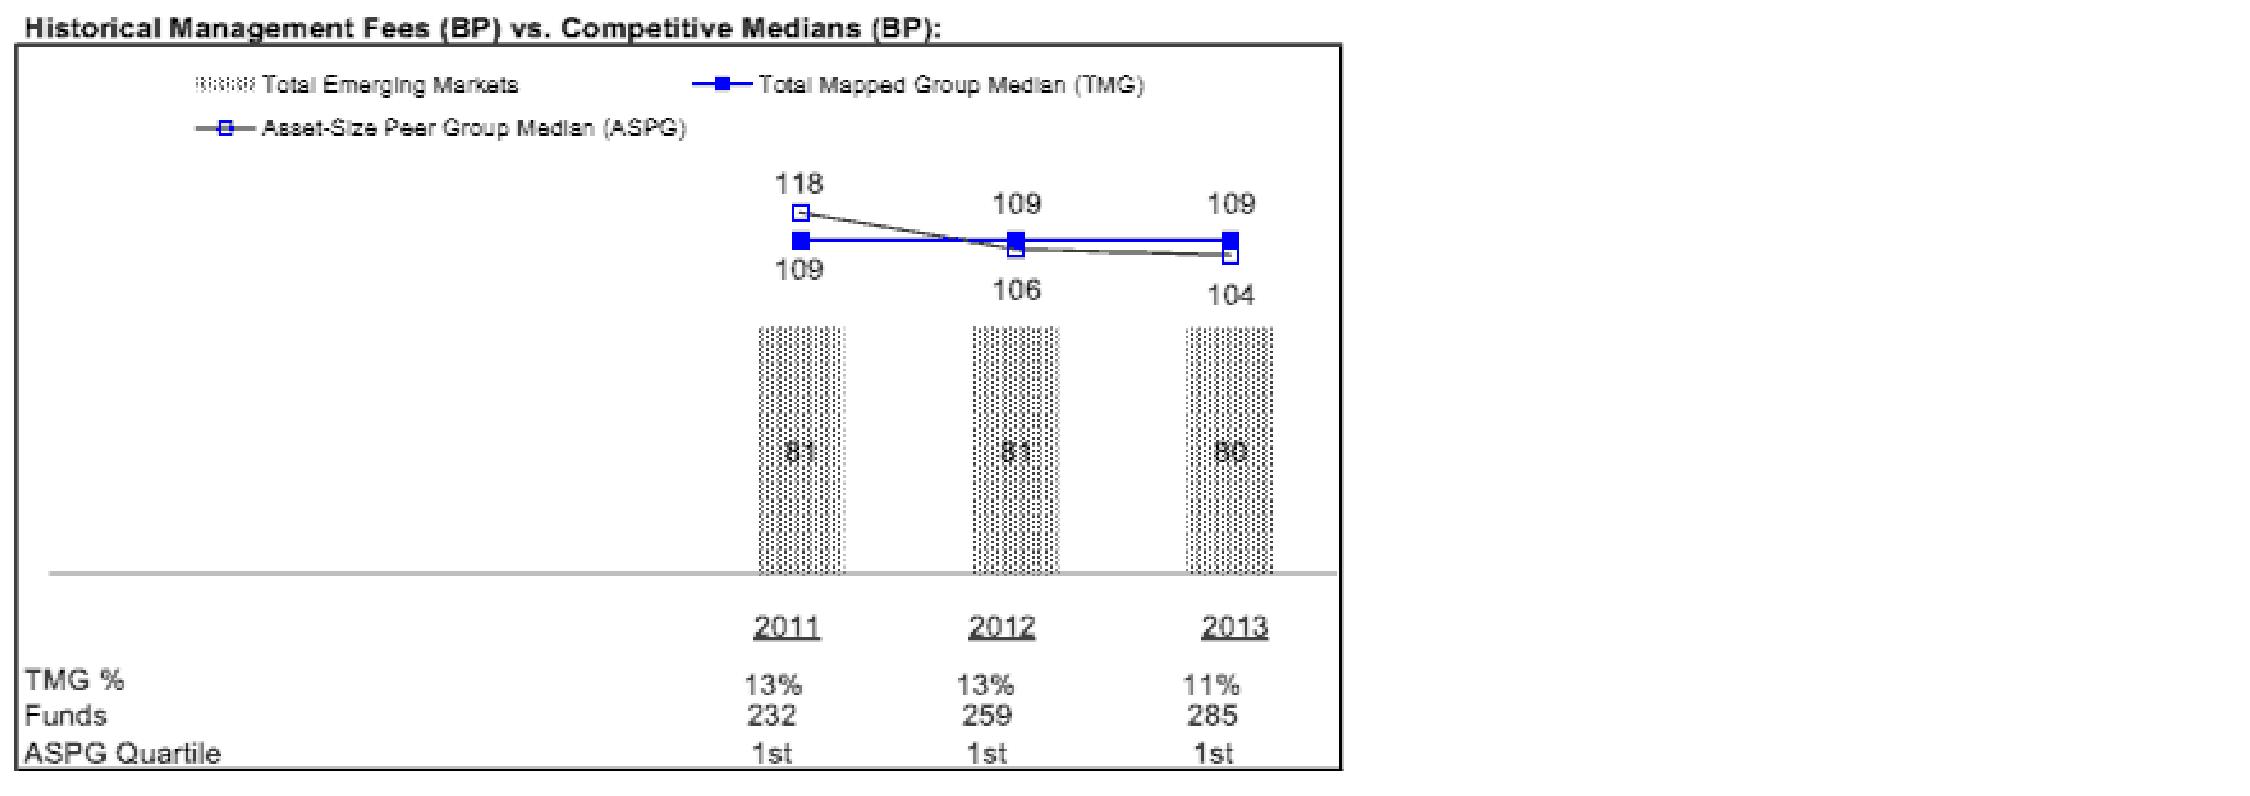
The Board noted that each fund's management fee rate ranked below the median of its Total Mapped Group and below the median of its ASPG for 2013.
The Board also noted that, in August 2013, the ad hoc Committee on Management Fees was formed to conduct an in-depth review of the management fee rates of Fidelity's active equity mutual funds. The Committee focused on the following areas: (i) standard fee structures; (ii) research consumption and trading evolution; (iii) management fee competitiveness/profitability by category; and (iv) factors that drive institutional pricing.
Annual Report
Based on its review, the Board concluded that each fund's management fee is fair and reasonable in light of the services that the fund receives and the other factors considered.
Total Expense Ratio. In its review of the total expense ratio of each class of each fund, the Board considered the fund's management fee as well as other fund or class expenses, as applicable, such as transfer agent fees, pricing and bookkeeping fees, fund-paid 12b-1 fees, and custodial, legal, and audit fees. The Board also noted the effects of any waivers and reimbursements on fees and expenses. As part of its review, the Board also considered the current and historical total expense ratios of each class of each fund compared to competitive fund median expenses. Each class of each fund is compared to those funds and classes in the Total Mapped Group (used by the Board for management fee comparisons) that have a similar sales load structure.
The Board noted that each fund offers multiple classes, each of which has a different sales load and 12b-1 fee structure, and that the multiple structures are intended to offer a range of pricing options for the intermediary market. The Board also noted that the total expense ratios of the classes of each fund vary primarily by the level of their 12b-1 fees, although differences in transfer agent fees may also cause expenses to vary from class to class.
The Board noted that the total expense ratio of each of Class A and the retail class of Fidelity Emerging Markets Discovery Fund ranked equal to its competitive median for 2013 and the total expense ratio of each of Class T, Class C, and Institutional Class ranked above its competitive median for 2013. The Board considered that, in general, various factors can affect total expense ratios. The Board noted that the total expense ratio of Class T was above the competitive median primarily because of higher 12b-1 fees on Class T as compared to most competitor funds. Class T has a higher 12b-1 fee, but a lower front-end sales charge, than traditionally priced front-end sales charge classes. The Board considered that Class T is primarily sold load-waived in the retirement plan market where its 0.50% 12b-1 fee is comparable to competing no-load, higher 12b-1 fee classes designed specifically for retirement plans.
The Board noted that the total expense ratio of each of Class A and the retail class of Fidelity Total Emerging Markets Fund ranked below its competitive median for 2013 and the total expense ratio of each of Class T, Class C, and Institutional Class ranked above its competitive median for 2013. The Board considered that, in general, various factors can affect total expense ratios. The Board noted that the total expense ratio of Class T was above the competitive median primarily because of higher 12b-1 fees on Class T as compared to most competitor funds. Class T has a higher 12b-1 fee, but a lower front-end sales charge, than traditionally priced front-end sales charge classes. The Board considered that Class T is primarily sold load-waived in the retirement plan market where its 0.50% 12b-1 fee is comparable to competing no-load, higher 12b-1 fee classes designed specifically for retirement plans.
Annual Report
Board Approval of Investment Advisory Contracts and
Management Fees - continued
The Board further considered that FMR contractually agreed to reimburse Class A, Class T, Class C, Institutional Class and the retail class of Fidelity Emerging Markets Discovery Fund to the extent that total operating expenses (excluding interest, certain taxes, certain securities lending costs, brokerage commissions, extraordinary expenses, and acquired fund fees and expenses, if any), as a percentage of their respective average net assets, exceed 1.70%, 1.95%, 2.45%, 1.45%, and 1.45% through December 31, 2014.
The Board further considered that FMR contractually agreed to reimburse Class A, Class T, Class C, Institutional Class, and the retail class of Fidelity Total Emerging Markets Fund to the extent that total operating expenses (excluding interest, certain taxes, certain securities lending costs, brokerage commissions, extraordinary expenses, and acquired fund fees and expenses, if any), as a percentage of their respective average net assets, exceed 1.65%, 1.90%, 2.40%, 1.40%, and 1.40% through December 31, 2014.
Fees Charged to Other Fidelity Clients. The Board also considered Fidelity fee structures and other information with respect to clients of Fidelity, such as other funds advised or subadvised by Fidelity, pension plan clients, and other institutional clients. The Board noted the findings of the 2013 ad hoc joint committee (created with the board of other Fidelity funds), which reviewed and compared Fidelity's institutional investment advisory business with its business of providing services to the Fidelity funds, including the differences in services provided, fees charged, and costs incurred, as well as competition in their respective marketplaces.
Based on its review of total expense ratios and fees charged to other Fidelity clients, the Board concluded that the total expense ratio of each class of each fund was reasonable, although in some cases above the median of the universe presented for comparison, in light of the services that the fund and its shareholders receive and the other factors considered.
Costs of the Services and Profitability. The Board considered the revenues earned and the expenses incurred by Fidelity in conducting the business of developing, marketing, distributing, managing, administering and servicing each fund and servicing each fund's shareholders. The Board also considered the level of Fidelity's profits in respect of all the Fidelity funds.
On an annual basis, Fidelity presents to the Board Fidelity's profitability for each fund. Fidelity calculates the profitability for each fund, as well as aggregate profitability for groups of Fidelity funds and all Fidelity funds, using a series of detailed revenue and cost allocation methodologies which originate with the books and records of Fidelity on which Fidelity's audited financial statements are based. The Audit Committee of the Board reviews any significant changes from the prior year's methodologies.
Annual Report
PricewaterhouseCoopers LLP (PwC), independent registered public accounting firm and auditor to Fidelity and certain Fidelity funds, has been engaged annually by the Board as part of the Board's assessment of Fidelity's profitability analysis. PwC's engagement includes the review and assessment of the methodologies used by Fidelity in determining the revenues and expenses attributable to Fidelity's mutual fund business, and completion of agreed-upon procedures in respect of the mathematical accuracy of fund profitability and its conformity to established allocation methodologies. After considering PwC's reports issued under the engagement and information provided by Fidelity, the Board concluded that while other allocation methods may also be reasonable, Fidelity's profitability methodologies are reasonable in all material respects.
The Board also reviewed Fidelity's non-fund businesses and fall-out benefits related to the mutual fund business as well as cases where Fidelity's affiliates may benefit from or be related to the funds' business.
The Board considered the costs of the services provided by and the profits realized by Fidelity in connection with the operation of each fund and was satisfied that the profitability was not excessive in the circumstances.
Economies of Scale. The Board considered whether there have been economies of scale in respect of the management of the Fidelity funds, whether the Fidelity funds (including each fund) have appropriately benefited from any such economies of scale, and whether there is potential for realization of any further economies of scale. The Board considered the extent to which each fund will benefit from economies of scale through increased services to the fund, through waivers or reimbursements, or through fee or expense ratio reductions. The Board also noted that in 2013, it and the boards of other Fidelity funds created an ad hoc committee (the Economies of Scale Committee) to analyze whether Fidelity attains economies of scale in respect of the management and servicing of the Fidelity funds, whether the Fidelity funds have appropriately benefited from such economies of scale, and whether there is potential for realization of any further economies of scale.
The Board recognized that each fund's management contract incorporates a "group fee" structure, which provides for lower group fee rates as total group assets increase, and for higher group fee rates as total group assets decrease (with "group assets" defined to include fund assets under FMR's management plus sector fund assets previously under FMR's management and currently managed by Fidelity SelectCo, LLC). FMR calculates the group fee rates based on a tiered asset "breakpoint" schedule that varies based on asset class. The Board considered that the group fee is designed to deliver the benefits of economies of scale to fund shareholders when total Fidelity fund assets increase, even if assets of any particular fund are unchanged or have declined, because some portion of Fidelity's costs are attributable to services provided to all Fidelity funds, and all funds benefit if those costs can be allocated among more assets. The Board concluded that, given the group fee structure, fund shareholders will benefit from lower management fees as group assets increase at the fund complex level, regardless of whether Fidelity achieves any such economies of scale.
Annual Report
Board Approval of Investment Advisory Contracts and
Management Fees - continued
The Board concluded, taking into account the analysis of the Economies of Scale Committee, that economies of scale, if any, are being appropriately shared between fund shareholders and Fidelity.
Additional Information Requested by the Board. In order to develop fully the factual basis for consideration of the Fidelity funds' Advisory Contracts, the Board requested and received additional information on certain topics, including: (i) fund performance trends and Fidelity's long-term strategies for certain funds; (ii) Fidelity's strategic marketing and product lineup goals; (iii) the methodology with respect to competitive fund data and peer group classifications; (iv) the arrangements with, and performance of, certain sub-advisers on behalf of the Fidelity funds, as well as certain proposed participating affiliate arrangements; (v) the realization of fall-out benefits in certain Fidelity business units; (vi) Fidelity's group fee structures, including the rationale for the individual fee rates of certain categories of funds and the definition of group assets; (vii) trends regarding industry use of performance fee structures and the performance adjustment methodologies applicable to the Fidelity funds; (viii) additional competitive analysis regarding the total expenses for certain classes; (ix) fund profitability methodology, including Fidelity's cost allocation methodology, and the impact of certain factors on fund profitability results; and (x) the process by which Fidelity determines sub-advisory fees for funds it advises.
Based on its evaluation of all of the conclusions noted above, and after considering all factors it believed relevant, the Board ultimately concluded that the advisory fee structures are fair and reasonable, and that each fund's Advisory Contracts should be renewed.
Annual Report
Investment Adviser
Fidelity Management &
Research Company
Boston, MA
Investment Sub-Advisers
FMR Co., Inc.
Fidelity Management & Research
(U.K.) Inc.
Fidelity Management & Research
(Hong Kong) Limited
Fidelity Management & Research
(Japan) Limited
FIL Investments (Japan) Limited
FIL Investment Advisors
FIL Investment Advisors
(UK) Limited
General Distributor
Fidelity Distributors Corporation
Smithfield, RI
Transfer and Service Agents
Fidelity Investments Institutional
Operations Company, Inc.
Boston, MA
Fidelity Service Company, Inc.
Boston, MA
Custodian
The Northern Trust Company
Chicago, IL
The Fidelity Telephone Connection
Mutual Fund 24-Hour Service
Exchanges/Redemptions
and Account Assistance 1-800-544-6666
Product Information 1-800-544-6666
Retirement Accounts 1-800-544-4774
(8 a.m. - 9 p.m.)
TDD Service 1-800-544-0118
for the deaf and hearing impaired
(9 a.m. - 9 p.m. Eastern time)
Fidelity Automated Service
Telephone (FAST®)
1-800-544-5555
Automated line for quickest service
(Fidelity Investment logo)(registered trademark)
Corporate Headquarters
245 Summer St., Boston, MA 02210
www.fidelity.com
EMD-TEK-UANN-1214
1.931236.102
(Fidelity Investment logo)(registered trademark)
Fidelity Advisor®
Global Commodity Stock
Fund - Class A, Class T, Class B
and Class C
Annual Report
October 31, 2014
(Fidelity Cover Art)
Class A, Class T, Class B,
and Class C are classes
of Fidelity® Global Commodity
Stock Fund
Contents
Performance | (Click Here) | How the fund has done over time. |
Management's Discussion of Fund Performance | (Click Here) | The Portfolio Manager's review of fund performance and strategy. |
Shareholder Expense Example | (Click Here) | An example of shareholder expenses. |
Investment Changes | (Click Here) | A summary of major shifts in the fund's investments over the past six months. |
Investments | (Click Here) | A complete list of the fund's investments with their market values. |
Financial Statements | (Click Here) | Statements of assets and liabilities, operations, and changes in net assets, as well as financial highlights. |
Notes | (Click Here) | Notes to the financial statements. |
Report of Independent Registered Public Accounting Firm | (Click Here) | |
Trustees and Officers | (Click Here) | |
Distributions | (Click Here) | |
Board Approval of Investment Advisory Contracts and Management Fees | (Click Here) | |
To view a fund's proxy voting guidelines and proxy voting record for the 12-month period ended June 30, visit http://www.fidelity.com/proxyvotingresults or visit the Securities and Exchange Commission's (SEC) web site at http://www.sec.gov. You may also call 1-877-208-0098 to request a free copy of the proxy voting guidelines.
Standard & Poor's, S&P and S&P 500 are registered service marks of The McGraw-Hill Companies, Inc. and have been licensed for use by Fidelity Distributors Corporation.
Other third-party marks appearing herein are the property of their respective owners.
All other marks appearing herein are registered or unregistered trademarks or service marks of FMR LLC or an affiliated company. © 2014 FMR LLC. All rights reserved.
Annual Report
This report and the financial statements contained herein are submitted for the general information of the shareholders of the fund. This report is not authorized for distribution to prospective investors in the fund unless preceded or accompanied by an effective prospectus.
A fund files its complete schedule of portfolio holdings with the SEC for the first and third quarters of each fiscal year on Form N-Q. Forms N-Q are available on the SEC's web site at http://www.sec.gov. A fund's Forms N-Q may be reviewed and copied at the SEC's Public Reference Room in Washington, DC. Information regarding the operation of the SEC's Public Reference Room may be obtained by calling 1-800-SEC-0330. For a complete list of a fund's portfolio holdings, view the most recent holdings listing, semiannual report, or annual report on Fidelity's web site at http://www.fidelity.com, http://www.advisor.fidelity.com, or http://www.401k.com, as applicable.
NOT FDIC INSURED • MAY LOSE VALUE • NO BANK GUARANTEE
Neither the fund nor Fidelity Distributors Corporation is a bank.
Annual Report
Average annual total return reflects the change in the value of an investment, assuming reinvestment of the class' distributions from dividend income and capital gains (the profits earned upon the sale of securities that have grown in value, if any) and assuming a constant rate of performance each year. The $10,000 table and the fund's returns do not reflect the deduction of taxes that a shareholder would pay on fund distributions or the redemption of fund shares. During periods of reimbursement by Fidelity, a fund's total return will be greater than it would be had the reimbursement not occurred. How a fund did yesterday is no guarantee of how it will do tomorrow.
Average Annual Total Returns
Periods ended October 31, 2014 | Past 1
year | Past 5
years | Life of
fund A |
Class A (incl. 5.75% sales charge) | -10.84% | -0.39% | 4.84% |
Class T (incl. 3.50% sales charge) | -8.95% | -0.19% | 5.00% |
Class B (incl. contingent deferred sales charge) B | -10.75% | -0.36% | 5.00% |
Class C (incl. contingent deferred sales charge) C | -7.07% | 0.04% | 5.14% |
A From March 25, 2009.
B Class B shares' contingent deferred sales charges included in the past one year, past 5 years, and life of fund total return figures are 5%, 2%, and 1%, respectively.
C Class C shares' contingent deferred sales charges included in the past one year, past 5 years, and life of fund total return figures are 1%, 0%, and 0%, respectively.
Annual Report
$10,000 Over Life of Fund
Let's say hypothetically that $10,000 was invested in Fidelity Advisor® Global Commodity Stock Fund - Class A on March 25, 2009, when the fund started, and the current 5.75% sales charge was paid. The chart shows how the value of your investment would have changed, and also shows how the MSCI ACWI (All Country World Index) Index performed over the same period.

Annual Report
Market Recap: Global equities posted a healthy gain for the 12 months ending October 31, 2014, overcoming an October market decline driven by recessionary pressures in China and tepid growth in Europe. The MSCI ACWI (All Country World Index) Index rose 8.15%, helped by subdued market volatility for much of the period and supported by solid corporate earnings, especially in the United States. Stocks also benefited from easy monetary policies in Japan and the eurozone, as well as increased stimulus efforts in China. All but three of the 24 industry groups that compose the index marked a positive return. The U.S. (+17%) remained a pillar of strength, while a strongly rising dollar in the latter part of the period detracted from investors' returns in most non-U.S. markets. Canada (+5%) notched broad gains outside of its energy and materials sectors, as did Asia-Pacific ex Japan (+4%), led by investor enthusiasm for companies in India. The U.K., Europe and Japan, meanwhile, all underperformed. Among sectors, health care (+24%) led the index, with a strong contribution from the pharmaceuticals, biotechnology & life sciences industry. Information technology (+21%) also outperformed. Conversely, materials (-4%) and energy (-1%) lagged the index due to a higher supply of and lower demand for commodities.
Comments from S. Joseph Wickwire II, Portfolio Manager of Fidelity Advisor® Global Commodity Stock Fund: For the year, the fund's Class A, Class T, Class B and Class C shares returned -5.41%, -5.65%, -6.06% and -6.13%, respectively (excluding sales charges), underperforming the -4.55% return of the equity benchmark, the MSCI ACWI (All Country World Index) Commodity Producers Sector Capped Index, and the broader global equity market, as measured by the MSCI ACWI (All Country World Index) Index. Commodity stocks saw broadly positive and negative periods during the year. In August, we entered a period where concerns about China, Europe and the Middle East drove broader commodity prices down, and that negative sentiment persisted into period end. Versus the industry benchmark, the largest detractor was within the challenged coal industry, where it was costly to hang with Peabody Energy. Stock picking in aluminum, steel and energy-industry drillers also detracted. On the positive side, good stock picks in fertilizers, energy exploration & production, construction machinery were relative positives. The largest contribution came from fertilizers, especially overweightings in CF Industries Holdings and Potash Corporation of Saskatchewan.
The views expressed above reflect those of the portfolio manager(s) only through the end of the period as stated on the cover of this report and do not necessarily represent the views of Fidelity or any other person in the Fidelity organization. Any such views are subject to change at any time based upon market or other conditions and Fidelity disclaims any responsibility to update such views. These views may not be relied on as investment advice and, because investment decisions for a Fidelity fund are based on numerous factors, may not be relied on as an indication of trading intent on behalf of any Fidelity fund.
Annual Report
Shareholder Expense Example
As a shareholder of the Fund, you incur two types of costs: (1) transaction costs, including sales charges (loads) on purchase payments or redemption proceeds, redemption fees and (2) ongoing costs, including management fees, distribution and/or service (12b-1) fees and other Fund expenses. This Example is intended to help you understand your ongoing costs (in dollars) of investing in the Fund and to compare these costs with the ongoing costs of investing in other mutual funds.
The Example is based on an investment of $1,000 invested at the beginning of the period and held for the entire period (May 1, 2014 to October 31, 2014).
Actual Expenses
The first line of the accompanying table for each class of the Fund provides information about actual account values and actual expenses. You may use the information in this line, together with the amount you invested, to estimate the expenses that you paid over the period. Simply divide your account value by $1,000.00 (for example, an $8,600 account value divided by $1,000.00 = 8.6), then multiply the result by the number in the first line for a class of the Fund under the heading entitled "Expenses Paid During Period" to estimate the expenses you paid on your account during this period. A small balance maintenance fee of $12.00 that is charged once a year may apply for certain accounts with a value of less than $2,000. This fee is not included in the table below. If it was, the estimate of expenses you paid during the period would be higher, and your ending account value lower, by this amount. In addition, the Fund, as a shareholder in the underlying Fidelity Central Funds, will indirectly bear its pro-rata share of the fees and expenses incurred by the underlying Fidelity Central Funds. These fees and expenses are not included in the Fund's annualized expense ratio used to calculate the expense estimate in the table below.
Hypothetical Example for Comparison Purposes
The second line of the accompanying table for each class of the Fund provides information about hypothetical account values and hypothetical expenses based on a Class' actual expense ratio and an assumed rate of return of 5% per year before expenses, which is not the Class' actual return. The hypothetical account values and expenses may not be used to estimate the actual ending account balance or expenses you paid for the period. You may use this information to compare the ongoing costs of investing in the Fund and other funds. To do so, compare this 5% hypothetical example with the 5% hypothetical examples that appear in the shareholder reports of the other funds. A small balance maintenance fee of $12.00 that is charged once a year may apply for certain accounts with a value of less than $2,000. This fee is not included in the table below. If it was, the estimate of expenses you paid during the period would be higher, and your ending account value lower, by this amount. In addition, the Fund, as a shareholder in the underlying Fidelity Central Funds, will indirectly bear its pro-rata share of the fees and expenses incurred by the underlying Fidelity Central Funds. These fees and expenses are not included in the Fund's annualized expense ratio used to calculate the expense estimate in the table below.
Please note that the expenses shown in the table are meant to highlight your ongoing costs only and do not reflect any transaction costs. Therefore, the second line of the table is useful in comparing ongoing costs only, and will not help you determine the relative total costs of owning different funds. In addition, if these transactional costs were included, your costs would have been higher.
Annual Report
| Annualized
Expense Ratio B | Beginning
Account Value
May 1, 2014 | Ending
Account Value
October 31, 2014 | Expenses Paid
During Period*
May 1, 2014
to October 31, 2014 |
Class A | 1.33% | | | |
Actual | | $ 1,000.00 | $ 905.70 | $ 6.39 |
HypotheticalA | | $ 1,000.00 | $ 1,018.50 | $ 6.77 |
Class T | 1.60% | | | |
Actual | | $ 1,000.00 | $ 904.20 | $ 7.68 |
HypotheticalA | | $ 1,000.00 | $ 1,017.14 | $ 8.13 |
Class B | 2.09% | | | |
Actual | | $ 1,000.00 | $ 902.30 | $ 10.02 |
HypotheticalA | | $ 1,000.00 | $ 1,014.67 | $ 10.61 |
Class C | 2.09% | | | |
Actual | | $ 1,000.00 | $ 901.90 | $ 10.02 |
HypotheticalA | | $ 1,000.00 | $ 1,014.67 | $ 10.61 |
Global Commodity Stock | 1.10% | | | |
Actual | | $ 1,000.00 | $ 906.70 | $ 5.29 |
HypotheticalA | | $ 1,000.00 | $ 1,019.66 | $ 5.60 |
Institutional Class | 1.05% | | | |
Actual | | $ 1,000.00 | $ 906.70 | $ 5.05 |
HypotheticalA | | $ 1,000.00 | $ 1,019.91 | $ 5.35 |
A 5% return per year before expenses
B Annualized expense ratio reflects expenses net of applicable fee waivers.
* Expenses are equal to each Class' annualized expense ratio, multiplied by the average account value over the period, multiplied by 184/365 (to reflect the one-half year period).
Annual Report
Investment Changes (Unaudited)
Top Ten Stocks as of October 31, 2014 |
| % of fund's
net assets | % of fund's net assets
6 months ago |
Monsanto Co. | 7.4 | 7.4 |
Potash Corp. of Saskatchewan, Inc. | 6.1 | 3.4 |
BHP Billiton PLC | 6.0 | 7.0 |
Syngenta AG (Switzerland) | 3.6 | 4.0 |
Rio Tinto PLC | 3.3 | 3.6 |
Chevron Corp. | 3.3 | 3.2 |
Anadarko Petroleum Corp. | 3.3 | 2.4 |
Archer Daniels Midland Co. | 2.9 | 3.0 |
CF Industries Holdings, Inc. | 2.9 | 1.8 |
EOG Resources, Inc. | 2.6 | 1.1 |
| 41.4 | |
Top Sectors (% of fund's net assets) |
As of October 31, 2014 |
 | Agriculture 36.9% | |
 | Energy 30.0% | |
 | Metals 29.2% | |
 | Other 3.3% | |
 | Short-Term
Investments and
Net Other Assets 0.6% | |

As of April 30, 2014 |
| Agriculture 33.1% | |
| Energy 32.2% | |
| Metals 31.3% | |
| Other 2.6% | |
| Short-Term
Investments and
Net Other Assets 0.8% | |

Annual Report
Investments October 31, 2014
Showing Percentage of Net Assets
Common Stocks - 97.4% |
| Shares | | Value |
CHEMICALS - 27.7% |
Commodity Chemicals - 0.1% |
Cabot Corp. | 7,700 | | $ 357,511 |
Westlake Chemical Corp. | 500 | | 35,275 |
| | 392,786 |
Diversified Chemicals - 0.6% |
Eastman Chemical Co. | 6,800 | | 549,304 |
FMC Corp. | 11,300 | | 648,055 |
Huntsman Corp. | 27,700 | | 675,880 |
| | 1,873,239 |
Fertilizers & Agricultural Chemicals - 27.0% |
Agrium, Inc. | 70,500 | | 6,897,684 |
CF Industries Holdings, Inc. | 35,772 | | 9,300,720 |
China BlueChemical Ltd. (H Shares) | 966,000 | | 343,038 |
Intrepid Potash, Inc. (a)(d) | 240,700 | | 3,237,415 |
K&S AG | 21,300 | | 594,299 |
Monsanto Co. | 211,200 | | 24,296,448 |
Potash Corp. of Saskatchewan, Inc. (d) | 580,400 | | 19,811,000 |
Syngenta AG (Switzerland) | 38,487 | | 11,902,397 |
The Mosaic Co. | 171,159 | | 7,584,055 |
Uralkali OJSC GDR (Reg. S) | 96,100 | | 1,717,307 |
Yara International ASA | 57,300 | | 2,630,977 |
| | 88,315,340 |
TOTAL CHEMICALS | | 90,581,365 |
CONSTRUCTION & ENGINEERING - 0.2% |
Construction & Engineering - 0.2% |
Chiyoda Corp. | 34,000 | | 350,262 |
Jacobs Engineering Group, Inc. (a) | 7,500 | | 355,875 |
| | 706,137 |
CONTAINERS & PACKAGING - 1.2% |
Paper Packaging - 1.2% |
Rock-Tenn Co. Class A | 74,200 | | 3,795,330 |
ELECTRICAL EQUIPMENT - 0.4% |
Electrical Components & Equipment - 0.3% |
OSRAM Licht AG (a) | 22,545 | | 789,933 |
Common Stocks - continued |
| Shares | | Value |
ELECTRICAL EQUIPMENT - CONTINUED |
Heavy Electrical Equipment - 0.1% |
Vestas Wind Systems A/S (a) | 13,600 | | $ 455,203 |
TOTAL ELECTRICAL EQUIPMENT | | 1,245,136 |
ENERGY EQUIPMENT & SERVICES - 0.9% |
Oil & Gas Drilling - 0.4% |
Ocean Rig UDW, Inc. (United States) | 21,947 | | 301,771 |
Odfjell Drilling A/S | 112,932 | | 333,190 |
Vantage Drilling Co. (a) | 634,982 | | 614,345 |
| | 1,249,306 |
Oil & Gas Equipment & Services - 0.5% |
Dril-Quip, Inc. (a) | 3,326 | | 299,174 |
Ezion Holdings Ltd. | 288,000 | | 339,146 |
Halliburton Co. | 12,100 | | 667,194 |
SBM Offshore NV (a)(d) | 43,200 | | 540,332 |
| | 1,845,846 |
TOTAL ENERGY EQUIPMENT & SERVICES | | 3,095,152 |
FOOD PRODUCTS - 5.7% |
Agricultural Products - 5.7% |
Archer Daniels Midland Co. | 204,700 | | 9,620,900 |
Bunge Ltd. | 65,200 | | 5,779,980 |
China Agri-Industries Holdings Ltd. | 930,300 | | 355,415 |
First Resources Ltd. | 911,000 | | 1,475,898 |
Golden Agri-Resources Ltd. | 2,756,000 | | 1,116,874 |
SLC Agricola SA | 47,800 | | 325,817 |
| | 18,674,884 |
INDEPENDENT POWER PRODUCERS & ENERGY TRADERS - 0.2% |
Independent Power Producers & Energy Traders - 0.2% |
Dynegy, Inc. (a) | 23,200 | | 707,600 |
MACHINERY - 0.8% |
Agricultural & Farm Machinery - 0.6% |
AGCO Corp. | 10,700 | | 474,117 |
Deere & Co. | 19,400 | | 1,659,476 |
| | 2,133,593 |
Common Stocks - continued |
| Shares | | Value |
MACHINERY - CONTINUED |
Construction Machinery & Heavy Trucks - 0.2% |
Cummins, Inc. | 2,300 | | $ 336,214 |
Manitowoc Co., Inc. | 12,000 | | 250,080 |
| | 586,294 |
TOTAL MACHINERY | | 2,719,887 |
METALS & MINING - 27.6% |
Aluminum - 0.2% |
Alcoa, Inc. | 20,000 | | 335,200 |
Constellium NV (a) | 15,600 | | 315,900 |
| | 651,100 |
Diversified Metals & Mining - 17.3% |
Anglo American PLC (United Kingdom) | 235,151 | | 4,964,871 |
BHP Billiton PLC | 758,164 | | 19,588,385 |
First Quantum Minerals Ltd. | 179,724 | | 2,710,889 |
Freeport-McMoRan, Inc. | 172,000 | | 4,902,000 |
Glencore Xstrata PLC | 1,455,999 | | 7,450,988 |
Grupo Mexico SA de CV Series B | 416,211 | | 1,430,100 |
Ivanhoe Mines Ltd. (a) | 709,500 | | 535,092 |
Ivanhoe Mines Ltd. Class A warrants 12/10/15 (a)(e) | 422,500 | | 18,744 |
Norilsk Nickel OJSC sponsored ADR | 80,000 | | 1,495,200 |
Rio Tinto PLC | 229,587 | | 10,924,079 |
Sesa Sterlite Ltd. | 200,897 | | 838,196 |
Sumitomo Metal Mining Co. Ltd. | 45,000 | | 624,264 |
Teck Resources Ltd. Class B (sub. vtg.) | 74,800 | | 1,182,013 |
| | 56,664,821 |
Gold - 5.6% |
Agnico Eagle Mines Ltd. (Canada) | 36,500 | | 860,157 |
AngloGold Ashanti Ltd. sponsored ADR (a) | 49,300 | | 407,711 |
Argonaut Gold, Inc. (a) | 201,500 | | 429,085 |
B2Gold Corp. (a) | 1,476,180 | | 2,462,374 |
Barrick Gold Corp. | 151,800 | | 1,802,124 |
Compania de Minas Buenaventura SA sponsored ADR | 30,700 | | 282,440 |
Continental Gold Ltd. (a) | 184,500 | | 309,396 |
Detour Gold Corp. (a) | 50,100 | | 293,385 |
Eldorado Gold Corp. | 201,850 | | 1,103,231 |
Franco-Nevada Corp. | 22,900 | | 1,072,006 |
Gold Fields Ltd. sponsored ADR | 88,200 | | 281,358 |
Goldcorp, Inc. | 125,610 | | 2,357,173 |
Kinross Gold Corp. (a) | 130,405 | | 278,848 |
Common Stocks - continued |
| Shares | | Value |
METALS & MINING - CONTINUED |
Gold - continued |
New Gold, Inc. (a) | 110,500 | | $ 400,998 |
Newcrest Mining Ltd. (a) | 109,024 | | 906,690 |
Newmont Mining Corp. | 72,800 | | 1,365,728 |
Premier Gold Mines Ltd. (a) | 368,900 | | 592,440 |
Pretium Resources, Inc. (a) | 70,800 | | 324,145 |
Randgold Resources Ltd. sponsored ADR | 22,600 | | 1,315,546 |
Royal Gold, Inc. | 10,700 | | 611,505 |
Torex Gold Resources, Inc. (a) | 290,500 | | 309,303 |
Yamana Gold, Inc. | 121,700 | | 484,835 |
| | 18,250,478 |
Precious Metals & Minerals - 0.4% |
Aquarius Platinum Ltd. (United Kingdom) (a) | 1,164,300 | | 307,318 |
Fresnillo PLC | 37,100 | | 413,958 |
Impala Platinum Holdings Ltd. (a) | 44,000 | | 320,294 |
Tahoe Resources, Inc. (a) | 18,053 | | 312,830 |
| | 1,354,400 |
Silver - 0.4% |
Silver Wheaton Corp. | 74,200 | | 1,289,719 |
Steel - 3.7% |
ArcelorMittal SA Class A unit (d) | 160,100 | | 2,106,916 |
Fortescue Metals Group Ltd. (d) | 228,996 | | 706,759 |
Hyundai Steel Co. | 8,527 | | 540,455 |
JFE Holdings, Inc. | 67,600 | | 1,341,182 |
Maanshan Iron & Steel Ltd. (H Shares) (a) | 1,470,000 | | 383,297 |
Nippon Steel & Sumitomo Metal Corp. | 994,000 | | 2,623,013 |
POSCO | 9,852 | | 2,830,487 |
Steel Dynamics, Inc. | 27,400 | | 630,474 |
Tata Steel Ltd. | 39,717 | | 317,003 |
Thyssenkrupp AG (a) | 26,400 | | 634,370 |
| | 12,113,956 |
TOTAL METALS & MINING | | 90,324,474 |
OIL, GAS & CONSUMABLE FUELS - 28.7% |
Coal & Consumable Fuels - 1.5% |
Cameco Corp. | 19,600 | | 340,333 |
China Shenhua Energy Co. Ltd. (H Shares) | 160,500 | | 452,375 |
Cloud Peak Energy, Inc. (a) | 28,700 | | 343,539 |
Common Stocks - continued |
| Shares | | Value |
OIL, GAS & CONSUMABLE FUELS - CONTINUED |
Coal & Consumable Fuels - continued |
CONSOL Energy, Inc. | 12,300 | | $ 452,640 |
Peabody Energy Corp. (d) | 327,798 | | 3,418,933 |
| | 5,007,820 |
Integrated Oil & Gas - 12.6% |
BG Group PLC | 234,950 | | 3,915,684 |
Cenovus Energy, Inc. | 36,700 | | 908,179 |
Chevron Corp. | 90,100 | | 10,807,495 |
Exxon Mobil Corp. | 33,261 | | 3,216,671 |
Gazprom OAO sponsored ADR | 131,100 | | 864,998 |
Hess Corp. | 12,800 | | 1,085,568 |
Imperial Oil Ltd. | 9,600 | | 461,921 |
LUKOIL Oil Co. sponsored ADR (United Kingdom) | 6,600 | | 324,060 |
Occidental Petroleum Corp. | 31,200 | | 2,774,616 |
PetroChina Co. Ltd. (H Shares) | 1,040,000 | | 1,302,022 |
Royal Dutch Shell PLC Class A (United Kingdom) | 32,250 | | 1,152,027 |
Suncor Energy, Inc. | 224,732 | | 7,979,925 |
Total SA | 96,400 | | 5,755,399 |
YPF SA Class D sponsored ADR | 20,600 | | 724,502 |
| | 41,273,067 |
Oil & Gas Exploration & Production - 14.4% |
Anadarko Petroleum Corp. | 117,500 | | 10,784,150 |
Apache Corp. | 12,700 | | 980,440 |
Bonanza Creek Energy, Inc. (a) | 7,900 | | 357,396 |
Cabot Oil & Gas Corp. | 112,100 | | 3,486,310 |
Cairn Energy PLC (a) | 135,199 | | 313,819 |
Canadian Natural Resources Ltd. | 84,400 | | 2,945,257 |
Chesapeake Energy Corp. | 23,000 | | 510,140 |
Cimarex Energy Co. | 16,100 | | 1,830,087 |
Cobalt International Energy, Inc. (a) | 50,400 | | 590,184 |
Concho Resources, Inc. (a) | 7,300 | | 795,919 |
ConocoPhillips Co. | 56,300 | | 4,062,045 |
Continental Resources, Inc. (a) | 6,600 | | 372,042 |
Denbury Resources, Inc. | 27,800 | | 344,720 |
Devon Energy Corp. | 18,300 | | 1,098,000 |
Encana Corp. | 27,600 | | 514,263 |
Energen Corp. | 4,600 | | 311,420 |
EOG Resources, Inc. | 88,300 | | 8,392,915 |
EQT Corp. | 7,400 | | 695,896 |
Kosmos Energy Ltd. (a) | 73,100 | | 682,023 |
Marathon Oil Corp. | 30,200 | | 1,069,080 |
Common Stocks - continued |
| Shares | | Value |
OIL, GAS & CONSUMABLE FUELS - CONTINUED |
Oil & Gas Exploration & Production - continued |
Murphy Oil Corp. | 9,200 | | $ 491,188 |
Noble Energy, Inc. | 24,000 | | 1,383,120 |
NOVATEK OAO GDR (Reg. S) | 3,100 | | 332,940 |
Ophir Energy PLC (a) | 174,800 | | 518,150 |
Pioneer Natural Resources Co. | 6,760 | | 1,278,046 |
QEP Resources, Inc. | 13,400 | | 335,938 |
Range Resources Corp. | 9,000 | | 615,600 |
Southwestern Energy Co. (a) | 17,400 | | 565,674 |
Talisman Energy, Inc. | 53,000 | | 338,113 |
Tullow Oil PLC | 97,100 | | 754,597 |
Whiting Petroleum Corp. (a) | 5,800 | | 355,192 |
| | 47,104,664 |
Oil & Gas Refining & Marketing - 0.1% |
Valero Energy Corp. | 7,700 | | 385,693 |
Oil & Gas Storage & Transport - 0.1% |
Golar LNG Ltd. | 6,200 | | 347,882 |
TOTAL OIL, GAS & CONSUMABLE FUELS | | 94,119,126 |
PAPER & FOREST PRODUCTS - 3.6% |
Paper Products - 3.6% |
Empresas CMPC SA | 418,880 | | 1,022,777 |
International Paper Co. | 156,300 | | 7,911,906 |
Stora Enso Oyj (R Shares) | 137,900 | | 1,136,222 |
UPM-Kymmene Corp. | 99,600 | | 1,575,149 |
| | 11,646,054 |
SPECIALTY RETAIL - 0.3% |
Specialty Stores - 0.3% |
Tsutsumi Jewelry Co. Ltd. | 41,900 | | 1,030,593 |
TRADING COMPANIES & DISTRIBUTORS - 0.1% |
Trading Companies & Distributors - 0.1% |
Noble Group Ltd. | 499,000 | | 464,498 |
TOTAL COMMON STOCKS (Cost $379,587,457) |
319,110,236
|
Nonconvertible Preferred Stocks - 2.0% |
| Shares | | Value |
METALS & MINING - 1.7% |
Steel - 1.7% |
Bradespar SA (PN) | 54,600 | | $ 368,862 |
Gerdau SA sponsored ADR | 258,500 | | 1,171,005 |
Vale SA (PN-A) sponsored ADR | 430,000 | | 3,766,800 |
| | 5,306,667 |
OIL, GAS & CONSUMABLE FUELS - 0.3% |
Integrated Oil & Gas - 0.3% |
Petroleo Brasileiro SA - Petrobras (PN) sponsored (non-vtg.) | 85,100 | | 1,040,773 |
TOTAL NONCONVERTIBLE PREFERRED STOCKS (Cost $13,672,822) |
6,347,440
|
Money Market Funds - 4.7% |
| | | |
Fidelity Securities Lending Cash Central Fund, 0.11% (b)(c)
(Cost $15,443,448) | 15,443,448 | |
15,443,448
|
TOTAL INVESTMENT PORTFOLIO - 104.1% (Cost $408,703,727) | | 340,901,124 |
NET OTHER ASSETS (LIABILITIES) - (4.1)% | | (13,281,248) |
NET ASSETS - 100% | $ 327,619,876 |
Legend |
(a) Non-income producing |
(b) Affiliated fund that is generally available only to investment companies and other accounts managed by Fidelity Investments. The rate quoted is the annualized seven-day yield of the fund at period end. A complete unaudited listing of the fund's holdings as of its most recent quarter end is available upon request. In addition, each Fidelity Central Fund's financial statements, which are not covered by the Fund's Report of Independent Registered Public Accounting Firm, are available on the SEC's website or upon request. |
(c) Investment made with cash collateral received from securities on loan. |
(d) Security or a portion of the security is on loan at period end. |
(e) Security exempt from registration under Rule 144A of the Securities Act of 1933. These securities may be resold in transactions exempt from registration, normally to qualified institutional buyers. At the end of the period, the value of these securities amounted to $18,744 or 0.0% of net assets. |
Affiliated Central Funds |
Information regarding fiscal year to date income earned by the Fund from investments in Fidelity Central Funds is as follows: |
Fund | Income earned |
Fidelity Cash Central Fund | $ 539 |
Fidelity Securities Lending Cash Central Fund | 180,323 |
Total | $ 180,862 |
Other Information |
The following is a summary of the inputs used, as of October 31, 2014, involving the Fund's assets and liabilities carried at fair value. The inputs or methodology used for valuing securities may not be an indication of the risk associated with investing in those securities. For more information on valuation inputs, and their aggregation into the levels used in the table below, please refer to the Investment Valuation section in the accompanying Notes to Financial Statements. |
Valuation Inputs at Reporting Date: |
Description | Total | Level 1 | Level 2 | Level 3 |
Investments in Securities: | | | | |
Common Stocks | $ 319,110,236 | $ 243,106,382 | $ 76,003,854 | $ - |
Nonconvertible Preferred Stocks | 6,347,440 | 6,347,440 | - | - |
Money Market Funds | 15,443,448 | 15,443,448 | - | - |
Total Investments in Securities: | $ 340,901,124 | $ 264,897,270 | $ 76,003,854 | $ - |
The following is a summary of transfers between Level 1 and Level 2 for the period ended October 31, 2014. Transfers are assumed to have occurred at the beginning of the period, and are primarily attributable to the valuation techniques used for foreign equity securities, as discussed in the accompanying Notes to Financial Statements: |
Transfers | Total |
Level 1 to Level 2 | $ 17,170,440 |
Level 2 to Level 1 | $ 0 |
Distribution of investments by country or territory of incorporation, as a percentage of total net assets, is as follows (Unaudited): |
United States of America | 44.4% |
Canada | 18.1% |
United Kingdom | 13.0% |
Switzerland | 3.6% |
Bailiwick of Jersey | 2.7% |
Bermuda | 2.5% |
Brazil | 2.1% |
Japan | 1.8% |
France | 1.8% |
Russia | 1.5% |
Korea (South) | 1.1% |
Others (Individually Less Than 1%) | 7.4% |
| 100.0% |
See accompanying notes which are an integral part of the financial statements.
Annual Report
Statement of Assets and Liabilities
| October 31, 2014 |
| | |
Assets | | |
Investment in securities, at value (including securities loaned of $15,099,435) - See accompanying schedule: Unaffiliated issuers (cost $393,260,279) | $ 325,457,676 | |
Fidelity Central Funds (cost $15,443,448) | 15,443,448 | |
Total Investments (cost $408,703,727) | | $ 340,901,124 |
Receivable for investments sold | | 4,867,696 |
Receivable for fund shares sold | | 312,550 |
Dividends receivable | | 736,381 |
Distributions receivable from Fidelity Central Funds | | 15,237 |
Prepaid expenses | | 567 |
Other receivables | | 5,797 |
Total assets | | 346,839,352 |
| | |
Liabilities | | |
Payable to custodian bank | $ 116,463 | |
Payable for investments purchased | 2,758,995 | |
Payable for fund shares redeemed | 518,466 | |
Accrued management fee | 192,660 | |
Distribution and service plan fees payable | 31,254 | |
Other affiliated payables | 104,668 | |
Other payables and accrued expenses | 53,522 | |
Collateral on securities loaned, at value | 15,443,448 | |
Total liabilities | | 19,219,476 |
| | |
Net Assets | | $ 327,619,876 |
Net Assets consist of: | | |
Paid in capital | | $ 437,681,967 |
Undistributed net investment income | | 3,567,856 |
Accumulated undistributed net realized gain (loss) on investments and foreign currency transactions | | (45,809,703) |
Net unrealized appreciation (depreciation) on investments and assets and liabilities in foreign currencies | | (67,820,244) |
Net Assets | | $ 327,619,876 |
See accompanying notes which are an integral part of the financial statements.
Annual Report
Statement of Assets and Liabilities - continued
| October 31, 2014 |
| | |
Calculation of Maximum Offering Price Class A:
Net Asset Value and redemption price per share ($51,586,180 ÷ 3,893,125 shares) | | $ 13.25 |
| | |
Maximum offering price per share (100/94.25 of $13.25) | | $ 14.06 |
Class T:
Net Asset Value and redemption price per share ($9,866,622 ÷ 746,868 shares) | | $ 13.21 |
| | |
Maximum offering price per share (100/96.50 of $13.21) | | $ 13.69 |
Class B:
Net Asset Value and offering price per share ($1,584,114 ÷ 120,777 shares)A | | $ 13.12 |
| | |
Class C:
Net Asset Value and offering price per share ($17,658,820 ÷ 1,352,048 shares)A | | $ 13.06 |
| | |
Global Commodity Stock:
Net Asset Value, offering price and redemption price per share ($223,083,774 ÷ 16,762,098 shares) | | $ 13.31 |
| | |
Institutional Class:
Net Asset Value, offering price and redemption price per share ($23,840,366 ÷ 1,790,808 shares) | | $ 13.31 |
A Redemption price per share is equal to net asset value less any applicable contingent deferred sales charge.
See accompanying notes which are an integral part of the financial statements.
Annual Report
Financial Statements - continued
Statement of Operations
| Year ended October 31, 2014 |
| | |
Investment Income | | |
Dividends | | $ 9,555,544 |
Income from Fidelity Central Funds | | 180,862 |
Income before foreign taxes withheld | | 9,736,406 |
Less foreign taxes withheld | | (590,900) |
Total income | | 9,145,506 |
| | |
Expenses | | |
Management fee | $ 2,673,662 | |
Transfer agent fees | 1,134,113 | |
Distribution and service plan fees | 447,025 | |
Accounting and security lending fees | 201,778 | |
Custodian fees and expenses | 55,282 | |
Independent trustees' compensation | 1,596 | |
Registration fees | 87,169 | |
Audit | 56,364 | |
Legal | 1,405 | |
Miscellaneous | 3,267 | |
Total expenses before reductions | 4,661,661 | |
Expense reductions | (11,330) | 4,650,331 |
Net investment income (loss) | | 4,495,175 |
Realized and Unrealized Gain (Loss) Net realized gain (loss) on: | | |
Investment securities: | | |
Unaffiliated issuers | (3,578,242) | |
Foreign currency transactions | (103,036) | |
Total net realized gain (loss) | | (3,681,278) |
Change in net unrealized appreciation (depreciation) on: Investment securities | (18,616,435) | |
Assets and liabilities in foreign currencies | (28,605) | |
Total change in net unrealized appreciation (depreciation) | | (18,645,040) |
Net gain (loss) | | (22,326,318) |
Net increase (decrease) in net assets resulting from operations | | $ (17,831,143) |
See accompanying notes which are an integral part of the financial statements.
Annual Report
Statement of Changes in Net Assets
| Year ended
October 31,
2014 | Year ended
October 31,
2013 |
Increase (Decrease) in Net Assets | | |
Operations | | |
Net investment income (loss) | $ 4,495,175 | $ 6,058,817 |
Net realized gain (loss) | (3,681,278) | (772,445) |
Change in net unrealized appreciation (depreciation) | (18,645,040) | (21,248,344) |
Net increase (decrease) in net assets resulting
from operations | (17,831,143) | (15,961,972) |
Distributions to shareholders from net investment income | (4,765,250) | (5,697,049) |
Distributions to shareholders from net realized gain | (367,709) | - |
Total distributions | (5,132,959) | (5,697,049) |
Share transactions - net increase (decrease) | (64,489,864) | (152,423,209) |
Redemption fees | 7,328 | 18,199 |
Total increase (decrease) in net assets | (87,446,638) | (174,064,031) |
| | |
Net Assets | | |
Beginning of period | 415,066,514 | 589,130,545 |
End of period (including undistributed net investment income of $3,567,856 and undistributed net investment income of $4,309,466, respectively) | $ 327,619,876 | $ 415,066,514 |
See accompanying notes which are an integral part of the financial statements.
Annual Report
Financial Highlights - Class A
Years ended October 31, | 2014 | 2013 | 2012 | 2011 | 2010 |
Selected Per-Share Data | | | | | |
Net asset value, beginning of period | $ 14.17 | $ 14.59 | $ 15.14 | $ 15.60 | $ 13.29 |
Income from Investment Operations | | | | | |
Net investment income (loss) C | .15 | .16 | .11 | .12 | .19 F |
Net realized and unrealized gain (loss) | (.91) | (.45) | (.59) | (.38) | 2.20 |
Total from investment operations | (.76) | (.29) | (.48) | (.26) | 2.39 |
Distributions from net investment income | (.15) | (.13) | (.05) | (.13) | - H |
Distributions from net realized gain | (.01) | - | (.01) | (.06) | (.08) |
Total distributions | (.16) | (.13) | (.07) J | (.20) I | (.08) |
Redemption fees added to paid in capital C, H | - | - | - | - | - |
Net asset value, end of period | $ 13.25 | $ 14.17 | $ 14.59 | $ 15.14 | $ 15.60 |
Total ReturnA, B | (5.41)% | (2.00)% | (3.19)% | (1.80)% | 18.04% |
Ratios to Average Net Assets D, G | | | | | |
Expenses before reductions | 1.35% | 1.36% | 1.34% | 1.32% | 1.37% |
Expenses net of fee waivers, if any | 1.35% | 1.35% | 1.34% | 1.32% | 1.37% |
Expenses net of all reductions | 1.35% | 1.34% | 1.33% | 1.31% | 1.36% |
Net investment income (loss) | 1.05% | 1.12% | .80% | .71% | 1.35% F |
Supplemental Data | | | | | |
Net assets, end of period (000 omitted) | $ 51,586 | $ 71,293 | $ 99,694 | $ 127,979 | $ 60,370 |
Portfolio turnover rateE | 75% | 65% | 91% | 71% | 54% |
A Total returns would have been lower if certain expenses had not been reduced during the applicable periods shown.
B Total returns do not include the effect of the sales charges.
C Calculated based on average shares outstanding during the period.
D Fees and expenses of any underlying Fidelity Central Funds are not included in the Fund's expense ratio. The Fund indirectly bears its proportionate share of the expenses of any underlying Fidelity Central Funds.
E Amount does not include the portfolio activity of any underlying Fidelity Central Funds.
F Investment income per share reflects a large, non-recurring dividend which amounted to $.13 per share. Excluding this non-recurring dividend, the ratio of net investment income (loss) to average net assets would have been .42%.
G Expense ratios reflect operating expenses of the class. Expenses before reductions do not reflect amounts reimbursed by the investment adviser or reductions from brokerage service arrangements or reductions from other expense offset arrangements and do not represent the amount paid by the class during periods when reimbursements or reductions occur. Expenses net of fee waivers reflect expenses after reimbursement by the investment adviser but prior to reductions from brokerage service arrangements or other expense offset arrangements. Expenses net of all reductions represent the net expenses paid by the class.
H Amount represents less than $.01 per share.
I Total distributions of $.20 per share is comprised of distributions from net investment income of $.133 and distributions from net realized gain of $.062 per share.
J Total distributions of $.07 per share is comprised of distributions from net investment income of $.052 and distributions from net realized gain of $.014 per share.
See accompanying notes which are an integral part of the financial statements.
Annual Report
Financial Highlights - Class T
Years ended October 31, | 2014 | 2013 | 2012 | 2011 | 2010 |
Selected Per-Share Data | | | | | |
Net asset value, beginning of period | $ 14.13 | $ 14.54 | $ 15.08 | $ 15.55 | $ 13.27 |
Income from Investment Operations | | | | | |
Net investment income (loss) C | .11 | .12 | .08 | .07 | .16 F |
Net realized and unrealized gain (loss) | (.90) | (.45) | (.60) | (.38) | 2.19 |
Total from investment operations | (.79) | (.33) | (.52) | (.31) | 2.35 |
Distributions from net investment income | (.11) | (.08) | (.01) | (.10) | - |
Distributions from net realized gain | (.01) | - | (.01) | (.06) | (.07) |
Total distributions | (.13) I | (.08) | (.02) | (.16) | (.07) |
Redemption fees added to paid in capital C, H | - | - | - | - | - |
Net asset value, end of period | $ 13.21 | $ 14.13 | $ 14.54 | $ 15.08 | $ 15.55 |
Total ReturnA, B | (5.65)% | (2.26)% | (3.43)% | (2.09)% | 17.73% |
Ratios to Average Net Assets D, G | | | | | |
Expenses before reductions | 1.62% | 1.62% | 1.61% | 1.60% | 1.63% |
Expenses net of fee waivers, if any | 1.62% | 1.61% | 1.61% | 1.60% | 1.63% |
Expenses net of all reductions | 1.62% | 1.60% | 1.60% | 1.59% | 1.61% |
Net investment income (loss) | .78% | .86% | .53% | .43% | 1.10% F |
Supplemental Data | | | | | |
Net assets, end of period (000 omitted) | $ 9,867 | $ 12,551 | $ 16,692 | $ 20,831 | $ 11,762 |
Portfolio turnover rateE | 75% | 65% | 91% | 71% | 54% |
A Total returns would have been lower if certain expenses had not been reduced during the applicable periods shown.
B Total returns do not include the effect of the sales charges.
C Calculated based on average shares outstanding during the period.
D Fees and expenses of any underlying Fidelity Central Funds are not included in the Fund's expense ratio. The Fund indirectly bears its proportionate share of the expenses of any underlying Fidelity Central Funds.
E Amount does not include the portfolio activity of any underlying Fidelity Central Funds.
F Investment income per share reflects a large, non-recurring dividend which amounted to $.13 per share. Excluding this non-recurring dividend, the ratio of net investment income (loss) to average net assets would have been .17%.
G Expense ratios reflect operating expenses of the class. Expenses before reductions do not reflect amounts reimbursed by the investment adviser or reductions from brokerage service arrangements or reductions from other expense offset arrangements and do not represent the amount paid by the class during periods when reimbursements or reductions occur. Expenses net of fee waivers reflect expenses after reimbursement by the investment adviser but prior to reductions from brokerage service arrangements or other expense offset arrangements. Expenses net of all reductions represent the net expenses paid by the class.
H Amount represents less than $.01 per share.
I Total distributions of $.13 per share is comprised of distributions from net investment income of $.113 and distributions from net realized gain of $.013 per share.
See accompanying notes which are an integral part of the financial statements.
Annual Report
Financial Highlights - Class B
Years ended October 31, | 2014 | 2013 | 2012 | 2011 | 2010 |
Selected Per-Share Data | | | | | |
Net asset value, beginning of period | $ 14.01 | $ 14.41 | $ 15.00 | $ 15.46 | $ 13.22 |
Income from Investment Operations | | | | | |
Net investment income (loss) C | .04 | .05 | - H | (.01) | .08 F |
Net realized and unrealized gain (loss) | (.89) | (.45) | (.59) | (.39) | 2.20 |
Total from investment operations | (.85) | (.40) | (.59) | (.40) | 2.28 |
Distributions from net investment income | (.03) | - H | - | - | - |
Distributions from net realized gain | (.01) | - | - | (.06) | (.04) |
Total distributions | (.04) | - H | - | (.06) | (.04) |
Redemption fees added to paid in capital C, H | - | - | - | - | - |
Net asset value, end of period | $ 13.12 | $ 14.01 | $ 14.41 | $ 15.00 | $ 15.46 |
Total ReturnA, B | (6.06)% | (2.75)% | (3.93)% | (2.62)% | 17.23% |
Ratios to Average Net Assets D, G | | | | | |
Expenses before reductions | 2.11% | 2.11% | 2.10% | 2.11% | 2.16% |
Expenses net of fee waivers, if any | 2.11% | 2.11% | 2.10% | 2.11% | 2.16% |
Expenses net of all reductions | 2.11% | 2.10% | 2.10% | 2.10% | 2.15% |
Net investment income (loss) | .29% | .36% | .03% | (.09)% | .56% F |
Supplemental Data | | | | | |
Net assets, end of period (000 omitted) | $ 1,584 | $ 2,303 | $ 3,097 | $ 4,324 | $ 4,348 |
Portfolio turnover rateE | 75% | 65% | 91% | 71% | 54% |
A Total returns would have been lower if certain expenses had not been reduced during the applicable periods shown.
B Total returns do not include the effect of the contingent deferred sales charge.
C Calculated based on average shares outstanding during the period.
D Fees and expenses of any underlying Fidelity Central Funds are not included in the Fund's expense ratio. The Fund indirectly bears its proportionate share of the expenses of any underlying Fidelity Central Funds.
E Amount does not include the portfolio activity of any underlying Fidelity Central Funds.
F Investment income per share reflects a large, non-recurring dividend which amounted to $.13 per share. Excluding this non-recurring dividend, the ratio of net investment income (loss) to average net assets would have been (.37)%.
G Expense ratios reflect operating expenses of the class. Expenses before reductions do not reflect amounts reimbursed by the investment adviser or reductions from brokerage service arrangements or reductions from other expense offset arrangements and do not represent the amount paid by the class during periods when reimbursements or reductions occur. Expenses net of fee waivers reflect expenses after reimbursement by the investment adviser but prior to reductions from brokerage service arrangements or other expense offset arrangements. Expenses net of all reductions represent the net expenses paid by the class.
H Amount represents less than $.01 per share.
See accompanying notes which are an integral part of the financial statements.
Annual Report
Financial Highlights - Class C
Years ended October 31, | 2014 | 2013 | 2012 | 2011 | 2010 |
Selected Per-Share Data | | | | | |
Net asset value, beginning of period | $ 13.96 | $ 14.37 | $ 14.95 | $ 15.45 | $ 13.22 |
Income from Investment Operations | | | | | |
Net investment income (loss) C | .04 | .05 | .01 | (.01) | .08 F |
Net realized and unrealized gain (loss) | (.89) | (.44) | (.59) | (.38) | 2.19 |
Total from investment operations | (.85) | (.39) | (.58) | (.39) | 2.27 |
Distributions from net investment income | (.03) | (.02) | - | (.05) | - |
Distributions from net realized gain | (.01) | - | - | (.06) | (.04) |
Total distributions | (.05) I | (.02) | - | (.11) | (.04) |
Redemption fees added to paid in capital C, H | - | - | - | - | - |
Net asset value, end of period | $ 13.06 | $ 13.96 | $ 14.37 | $ 14.95 | $ 15.45 |
Total ReturnA, B | (6.13)% | (2.75)% | (3.88)% | (2.58)% | 17.21% |
Ratios to Average Net Assets D, G | | | | | |
Expenses before reductions | 2.11% | 2.11% | 2.10% | 2.09% | 2.14% |
Expenses net of fee waivers, if any | 2.11% | 2.11% | 2.10% | 2.09% | 2.14% |
Expenses net of all reductions | 2.11% | 2.10% | 2.09% | 2.08% | 2.13% |
Net investment income (loss) | .29% | .36% | .03% | (.07)% | .58% F |
Supplemental Data | | | | | |
Net assets, end of period (000 omitted) | $ 17,659 | $ 23,830 | $ 31,865 | $ 37,185 | $ 14,338 |
Portfolio turnover rateE | 75% | 65% | 91% | 71% | 54% |
A Total returns would have been lower if certain expenses had not been reduced during the applicable periods shown.
B Total returns do not include the effect of the contingent deferred sales charge.
C Calculated based on average shares outstanding during the period.
D Fees and expenses of any underlying Fidelity Central Funds are not included in the Fund's expense ratio. The Fund indirectly bears its proportionate share of the expenses of any underlying Fidelity Central Funds.
E Amount does not include the portfolio activity of any underlying Fidelity Central Funds.
F Investment income per share reflects a large, non-recurring dividend which amounted to $.13 per share. Excluding this non-recurring dividend, the ratio of net investment income (loss) to average net assets would have been (.34)%.
G Expense ratios reflect operating expenses of the class. Expenses before reductions do not reflect amounts reimbursed by the investment adviser or reductions from brokerage service arrangements or reductions from other expense offset arrangements and do not represent the amount paid by the class during periods when reimbursements or reductions occur. Expenses net of fee waivers reflect expenses after reimbursement by the investment adviser but prior to reductions from brokerage service arrangements or other expense offset arrangements. Expenses net of all reductions represent the net expenses paid by the class.
H Amount represents less than $.01 per share.
I Total distributions of $.05 per share is comprised of distributions from net investment income of $.033 and distributions from net realized gain of $.013 per share.
See accompanying notes which are an integral part of the financial statements.
Annual Report
Financial Highlights - Global Commodity Stock
Years ended October 31, | 2014 | 2013 | 2012 | 2011 | 2010 |
Selected Per-Share Data | | | | | |
Net asset value, beginning of period | $ 14.24 | $ 14.66 | $ 15.21 | $ 15.66 | $ 13.31 |
Income from Investment Operations | | | | | |
Net investment income (loss) B | .19 | .19 | .15 | .16 | .23 E |
Net realized and unrealized gain (loss) | (.92) | (.45) | (.60) | (.39) | 2.21 |
Total from investment operations | (.73) | (.26) | (.45) | (.23) | 2.44 |
Distributions from net investment income | (.19) | (.16) | (.08) | (.16) | (.01) |
Distributions from net realized gain | (.01) | - | (.01) | (.06) | (.08) |
Total distributions | (.20) | (.16) | (.10) H | (.22) | (.09) |
Redemption fees added to paid in capital B, G | - | - | - | - | - |
Net asset value, end of period | $ 13.31 | $ 14.24 | $ 14.66 | $ 15.21 | $ 15.66 |
Total ReturnA | (5.16)% | (1.75)% | (2.96)% | (1.59)% | 18.38% |
Ratios to Average Net Assets C, F | | | | | |
Expenses before reductions | 1.11% | 1.11% | 1.10% | 1.08% | 1.10% |
Expenses net of fee waivers, if any | 1.11% | 1.11% | 1.10% | 1.08% | 1.10% |
Expenses net of all reductions | 1.11% | 1.09% | 1.09% | 1.07% | 1.09% |
Net investment income (loss) | 1.29% | 1.37% | 1.04% | .95% | 1.62% E |
Supplemental Data | | | | | |
Net assets, end of period (000 omitted) | $ 223,084 | $ 273,476 | $ 387,242 | $ 531,224 | $ 310,186 |
Portfolio turnover rateD | 75% | 65% | 91% | 71% | 54% |
A Total returns would have been lower if certain expenses had not been reduced during the applicable periods shown.
B Calculated based on average shares outstanding during the period.
C Fees and expenses of any underlying Fidelity Central Funds are not included in the Fund's expense ratio. The Fund indirectly bears its proportionate share of the expenses of any underlying Fidelity Central Funds.
D Amount does not include the portfolio activity of any underlying Fidelity Central Funds.
E Investment income per share reflects a large, non-recurring dividend which amounted to $.13 per share. Excluding this non-recurring dividend, the ratio of net investment income (loss) to average net assets would have been .69%.
F Expense ratios reflect operating expenses of the class. Expenses before reductions do not reflect amounts reimbursed by the investment adviser or reductions from brokerage service arrangements or reductions from other expense offset arrangements and do not represent the amount paid by the class during periods when reimbursements or reductions occur. Expenses net of fee waivers reflect expenses after reimbursement by the investment adviser but prior to reductions from brokerage service arrangements or other expense offset arrangements. Expenses net of all reductions represent the net expenses paid by the class.
G Amount represents less than $.01 per share.
H Total distributions of $.10 per share is comprised of distributions from net investment income of $.084 and distributions from net realized gain of $.014 per share.
See accompanying notes which are an integral part of the financial statements.
Annual Report
Financial Highlights - Institutional Class
Years ended October 31, | 2014 | 2013 | 2012 | 2011 | 2010 |
Selected Per-Share Data | | | | | |
Net asset value, beginning of period | $ 14.24 | $ 14.67 | $ 15.22 | $ 15.66 | $ 13.31 |
Income from Investment Operations | | | | | |
Net investment income (loss) B | .19 | .20 | .16 | .16 | .23 E |
Net realized and unrealized gain (loss) | (.92) | (.45) | (.60) | (.38) | 2.21 |
Total from investment operations | (.73) | (.25) | (.44) | (.22) | 2.44 |
Distributions from net investment income | (.19) | (.18) | (.09) | (.16) | (.01) |
Distributions from net realized gain | (.01) | - | (.01) | (.06) | (.08) |
Total distributions | (.20) | (.18) | (.11) H | (.22) | (.09) |
Redemption fees added to paid in capital B, G | - | - | - | - | - |
Net asset value, end of period | $ 13.31 | $ 14.24 | $ 14.67 | $ 15.22 | $ 15.66 |
Total ReturnA | (5.16)% | (1.71)% | (2.90)% | (1.50)% | 18.39% |
Ratios to Average Net Assets C, F | | | | | |
Expenses before reductions | 1.06% | 1.04% | 1.04% | 1.03% | 1.09% |
Expenses net of fee waivers, if any | 1.06% | 1.04% | 1.04% | 1.03% | 1.09% |
Expenses net of all reductions | 1.06% | 1.03% | 1.03% | 1.03% | 1.07% |
Net investment income (loss) | 1.34% | 1.43% | 1.10% | .99% | 1.64% E |
Supplemental Data | | | | | |
Net assets, end of period (000 omitted) | $ 23,840 | $ 31,613 | $ 50,540 | $ 58,925 | $ 35,739 |
Portfolio turnover rateD | 75% | 65% | 91% | 71% | 54% |
A Total returns would have been lower if certain expenses had not been reduced during the applicable periods shown.
B Calculated based on average shares outstanding during the period.
C Fees and expenses of any underlying Fidelity Central Funds are not included in the Fund's expense ratio. The Fund indirectly bears its proportionate share of the expenses of any underlying Fidelity Central Funds.
D Amount does not include the portfolio activity of any underlying Fidelity Central Funds.
E Investment income per share reflects a large, non-recurring dividend which amounted to $.13 per share. Excluding this non-recurring dividend, the ratio of net investment income (loss) to average net assets would have been .71%.
F Expense ratios reflect operating expenses of the class. Expenses before reductions do not reflect amounts reimbursed by the investment adviser or reductions from brokerage service arrangements or reductions from other expense offset arrangements and do not represent the amount paid by the class during periods when reimbursements or reductions occur. Expenses net of fee waivers reflect expenses after reimbursement by the investment adviser but prior to reductions from brokerage service arrangements or other expense offset arrangements. Expenses net of all reductions represent the net expenses paid by the class.
G Amount represents less than $.01 per share.
H Total distributions of $.11 per share is comprised of distributions from net investment income of $.093 and distributions from net realized gain of $.014 per share.
See accompanying notes which are an integral part of the financial statements.
Annual Report
Notes to Financial Statements
For the period ended October 31, 2014
1. Organization.
Fidelity Global Commodity Stock Fund (the Fund) is a non-diversified fund of Fidelity Investment Trust (the Trust) and is authorized to issue an unlimited number of shares. The Trust is registered under the Investment Company Act of 1940, as amended (the 1940 Act), as an open-end management investment company organized as a Massachusetts business trust. The Fund offers Class A, Class T, Class C, Global Commodity Stock and Institutional Class shares, each of which, along with Class B shares, has equal rights as to assets and voting privileges. Class B shares are closed to new accounts and additional purchases, except for exchanges and reinvestments. Each class has exclusive voting rights with respect to matters that affect that class. Class B shares will automatically convert to Class A shares after a holding period of seven years from the initial date of purchase. The Fund's investments in emerging markets can be subject to social, economic, regulatory, and political uncertainties and can be extremely volatile.
2. Investments in Fidelity Central Funds.
The Fund invests in Fidelity Central Funds, which are open-end investment companies generally available only to other investment companies and accounts managed by the investment adviser and its affiliates. The Fund's Schedule of Investments lists each of the Fidelity Central Funds held as of period end, if any, as an investment of the Fund, but does not include the underlying holdings of each Fidelity Central Fund. As an Investing Fund, the Fund indirectly bears its proportionate share of the expenses of the underlying Fidelity Central Funds.
The Money Market Central Funds seek preservation of capital and current income and are managed by Fidelity Investments Money Management, Inc. (FIMM), an affiliate of the investment adviser. Annualized expenses of the Money Market Central Funds as of their most recent shareholder report date are less than .01%.
A complete unaudited list of holdings for each Fidelity Central Fund is available upon request or at the Securities and Exchange Commission (the SEC) website at www.sec.gov. In addition, the financial statements of the Fidelity Central Funds, which are not covered by the Fund's Report of Independent Registered Public Accounting Firm, are available on the SEC website or upon request.
3. Significant Accounting Policies.
The financial statements have been prepared in conformity with accounting principles generally accepted in the United States of America (GAAP), which require management to make certain estimates and assumptions at the date of the financial statements. Actual results could differ from those estimates. Subsequent events, if any, through the date that the financial statements were issued have been evaluated in the preparation of
Annual Report
Notes to Financial Statements - continued
3. Significant Accounting Policies - continued
the financial statements. The following summarizes the significant accounting policies of the Fund:
Investment Valuation. Investments are valued as of 4:00 p.m. Eastern time on the last calendar day of the period. In accordance with valuation policies and procedures approved by the Board of Trustees (the Board), the Fund attempts to obtain prices from one or more third party pricing vendors or brokers to value its investments. When current market prices, quotations or currency exchange rates are not readily available or reliable, investments will be fair valued in good faith by the Fidelity Management & Research Company (FMR) Fair Value Committee (the Committee), in accordance with procedures adopted by the Board. Factors used in determining fair value vary by investment type and may include market or investment specific events. The frequency with which these procedures are used cannot be predicted and they may be utilized to a significant extent. The Committee oversees the Fund's valuation policies and procedures and is responsible for approving and reporting to the Board all fair value determinations.
The Fund categorizes the inputs to valuation techniques used to value its investments into a disclosure hierarchy consisting of three levels as shown below:
Level 1 - quoted prices in active markets for identical investments
Level 2 - other significant observable inputs (including quoted prices for similar investments, interest rates, prepayment speeds, etc.)
Level 3 - unobservable inputs (including the Fund's own assumptions based on the best information available)
Valuation techniques used to value the Fund's investments by major category are as follows:
Equity securities, including restricted securities, for which market quotations are readily available, are valued at the last reported sale price or official closing price as reported by a third party pricing vendor on the primary market or exchange on which they are traded and are categorized as Level 1 in the hierarchy. In the event there were no sales during the day or closing prices are not available, securities are valued at the last quoted bid price or may be valued using the last available price and are generally categorized as Level 2 in the hierarchy. For foreign equity securities, when market or security specific events arise, comparisons to the valuation of American Depositary Receipts (ADRs), futures contracts, Exchange-Traded Funds (ETFs) and certain indexes as well as quoted prices for similar securities may be used and would be categorized as Level 2 in the hierarchy. Utilizing these techniques may result in transfers between Level 1 and Level 2. For equity securities, including restricted securities, where observable inputs are
Annual Report
3. Significant Accounting Policies - continued
Investment Valuation - continued
limited, assumptions about market activity and risk are used and these securities may be categorized as Level 3 in the hierarchy.
Investments in open-end mutual funds, including the Fidelity Central Funds, are valued at their closing net asset value (NAV) each business day and are categorized as Level 1 in the hierarchy.
Changes in valuation techniques may result in transfers in or out of an assigned level within the disclosure hierarchy. The aggregate value of investments by input level, as of October 31, 2014, including information on transfers between Levels 1 and 2, is included at the end of the Fund's Schedule of Investments.
Foreign Currency. The Fund may use foreign currency contracts to facilitate transactions in foreign-denominated securities. Gains and losses from these transactions may arise from changes in the value of the foreign currency or if the counterparties do not perform under the contracts' terms.
Foreign-denominated assets, including investment securities, and liabilities are translated into U.S. dollars at the exchange rates at period end. Purchases and sales of investment securities, income and dividends received and expenses denominated in foreign currencies are translated into U.S. dollars at the exchange rate in effect on the transaction date.
The effects of exchange rate fluctuations on investments are included with the net realized and unrealized gain (loss) on investment securities. Other foreign currency transactions resulting in realized and unrealized gain (loss) are disclosed separately.
Investment Transactions and Income. For financial reporting purposes, the Fund's investment holdings and NAV include trades executed through the end of the last business day of the period. The NAV per share for processing shareholder transactions is calculated as of the close of business of the New York Stock Exchange (NYSE), normally 4:00 p.m. Eastern time and includes trades executed through the end of the prior business day. Gains and losses on securities sold are determined on the basis of identified cost and may include proceeds received from litigation. Dividend income is recorded on the ex-dividend date, except for certain dividends from foreign securities where the ex-dividend date may have passed, which are recorded as soon as the Fund is informed of the ex-dividend date. Non-cash dividends included in dividend income, if any, are recorded at the fair market value of the securities received. Income and capital gain distributions from Fidelity Central Funds, if any, are recorded on the ex-dividend date. Distributions received on securities that represent a return of capital or capital gain are recorded as a reduction of cost of investments and/or as a realized gain. Subsequent to
Annual Report
Notes to Financial Statements - continued
3. Significant Accounting Policies - continued
Investment Transactions and Income - continued
ex-dividend date the Fund determines the components of these distributions, based upon receipt of tax filings or other correspondence relating to the underlying investment. Investment income is recorded net of foreign taxes withheld where recovery of such taxes is uncertain.
Class Allocations and Expenses. Investment income, realized and unrealized capital gains and losses, common expenses of the Fund, and certain fund-level expense reductions, if any, are allocated daily on a pro-rata basis to each class based on the relative net assets of each class to the total net assets of the Fund. Each class differs with respect to transfer agent and distribution and service plan fees incurred. Certain expense reductions may also differ by class. For the reporting period, the allocated portion of income and expenses to each class as a percent of its average net assets may vary due to the timing of recording these transactions in relation to fluctuating net assets of the classes. Expenses directly attributable to a fund are charged to that fund. Expenses attributable to more than one fund are allocated among the respective funds on the basis of relative net assets or other appropriate methods. Expense estimates are accrued in the period to which they relate and adjustments are made when actual amounts are known.
Income Tax Information and Distributions to Shareholders. Each year, the Fund intends to qualify as a regulated investment company under Subchapter M of the Internal Revenue Code, including distributing substantially all of its taxable income and realized gains. As a result, no provision for U.S. Federal income taxes is required. As of October 31, 2014, the Fund did not have any unrecognized tax benefits in the financial statements; nor is the Fund aware of any tax positions for which it is reasonably possible that the total amounts of unrecognized tax benefits will significantly change in the next twelve months. The Fund files a U.S. federal tax return, in addition to state and local tax returns as required. The Fund's federal income tax returns are subject to examination by the Internal Revenue Service (IRS) for a period of three fiscal years after they are filed. State and local tax returns may be subject to examination for an additional fiscal year depending on the jurisdiction. Foreign taxes are provided for based on the Fund's understanding of the tax rules and rates that exist in the foreign markets in which it invests.
Distributions are declared and recorded on the ex-dividend date. Income dividends and capital gain distributions are declared separately for each class. Income and capital gain distributions are determined in accordance with income tax regulations, which may differ from GAAP. In addition, the Fund claimed a portion of the payment made to redeeming shareholders as a distribution for income tax purposes.
Annual Report
3. Significant Accounting Policies - continued
Income Tax Information and Distributions to Shareholders - continued
Capital accounts within the financial statements are adjusted for permanent book-tax differences. These adjustments have no impact on net assets or the results of operations.
Capital accounts are not adjusted for temporary book-tax differences which will reverse in a subsequent period.
Book-tax differences are primarily due to foreign currency transactions, passive foreign investment companies (PFIC), partnerships, capital loss carryforwards and losses deferred due to wash sales.
The federal tax cost of investment securities and unrealized appreciation (depreciation) as of period end were as follows:
Gross unrealized appreciation | $ 16,755,440 |
Gross unrealized depreciation | (89,430,462) |
Net unrealized appreciation (depreciation) on securities | $ (72,675,022) |
| |
Tax Cost | $ 413,576,146 |
The tax-based components of distributable earnings as of period end were as follows:
Undistributed ordinary income | $ 4,143,532 |
Capital loss carryforward | $ (41,514,178) |
Net unrealized appreciation (depreciation) on securities and other investments | $ (72,691,445) |
Capital loss carryforwards are only available to offset future capital gains of the Fund to the extent provided by regulations and may be limited. Under the Regulated Investment Company Modernization Act of 2010 (the Act), the Fund is permitted to carry forward capital losses incurred in taxable years beginning after December 22, 2010 for an unlimited period and such capital losses are required to be used prior to any losses that expire. The capital loss carryforward information presented below, including any applicable limitation, is estimated as of fiscal period end and is subject to adjustment.
Fiscal year of expiration | |
2019 | $ (6,952,413) |
No expiration | |
Short-term | (14,785,479) |
Long-term | (19,776,286) |
Total no expiration | (34,561,765) |
Total capital loss carryforward | $ (41,514,178) |
The tax character of distributions paid was as follows:
| October 31, 2014 | October 31, 2013 |
Ordinary Income | $ 5,132,959 | $ 5,697,049 |
Annual Report
Notes to Financial Statements - continued
3. Significant Accounting Policies - continued
Short-Term Trading (Redemption) Fees. Shares held by investors in the Fund less than 30 days may have been subject to a redemption fee equal to 1.00% of the NAV of shares redeemed. All redemption fees, which reduce the proceeds of the shareholder redemption, are retained by the Fund and accounted for as an addition to paid in capital.
Restricted Securities. The Fund may invest in securities that are subject to legal or contractual restrictions on resale. These securities generally may be resold in transactions exempt from registration or to the public if the securities are registered. Disposal of these securities may involve time-consuming negotiations and expense, and prompt sale at an acceptable price may be difficult. Information regarding restricted securities is included at the end of the Fund's Schedule of Investments.
New Accounting Pronouncement. In June 2014, the Financial Accounting Standards Board issued Accounting Standard Update No. 2014-11, Repurchase-to-Maturity Transactions, Repurchase Financings, and Disclosures. The Update amends the accounting for certain repurchase agreements and expands disclosure requirements for reverse repurchase agreements, securities lending and other similar transactions. The disclosure requirements are effective for annual and interim reporting periods beginning after December 15, 2014. Management is currently evaluating the impact of the Update on the Fund's financial statements and related disclosures.
4. Purchases and Sales of Investments.
Purchases and sales of securities, other than short-term securities, aggregated $284,939,275 and $349,828,265, respectively.
5. Fees and Other Transactions with Affiliates.
Management Fee. Fidelity Management & Research Company (the investment adviser) and its affiliates provide the Fund with investment management related services for which the Fund pays a monthly management fee. The management fee is the sum of an individual fund fee rate that is based on an annual rate of .45% of the Fund's average net assets and an annualized group fee rate that averaged .25% during the period. The group fee rate is based upon the average net assets of all the mutual funds advised by the investment adviser, including any mutual funds previously advised by the investment adviser that are currently advised by Fidelity SelectCo, LLC, an affiliate of the investment adviser. The group fee rate decreases as assets under management increase and increases as assets under management decrease. For the reporting period, the total annual management fee rate was .70% of the Fund's average net assets.
Annual Report
5. Fees and Other Transactions with Affiliates - continued
Distribution and Service Plan Fees. In accordance with Rule 12b-1 of the 1940 Act, the Fund has adopted separate Distribution and Service Plans for each class of shares. Certain classes pay Fidelity Distributors Corporation (FDC), an affiliate of the investment adviser, separate Distribution and Service Fees, each of which is based on an annual percentage of each class' average net assets. In addition, FDC may pay financial intermediaries for selling shares of the Fund and providing shareholder support services.
For the period, the Distribution and Service Fee rates, total fees and amounts retained by FDC were as follows:
| Distribution
Fee | Service
Fee | Total Fees | Retained
by FDC |
Class A | -% | .25% | $ 157,900 | $ 965 |
Class T | .25% | .25% | 58,696 | - |
Class B | .75% | .25% | 19,785 | 14,850 |
Class C | .75% | .25% | 210,644 | 22,837 |
| | | $ 447,025 | $ 38,652 |
Sales Load. FDC may receive a front-end sales charge of up to 5.75% for selling Class A shares and 3.50% for selling Class T shares, some of which is paid to financial intermediaries for selling shares of the Fund. Depending on the holding period, FDC may receive contingent deferred sales charges levied on Class A, Class T, Class B, and Class C redemptions. The deferred sales charges range from 5.00% to 1.00% for Class B shares, 1.00% for Class C shares, 1.00% for certain purchases of Class A shares and .25% for certain purchases of Class T shares.
For the period, sales charge amounts retained by FDC were as follows:
| Retained
by FDC |
Class A | $ 22,642 |
Class T | 2,275 |
Class B* | 4,584 |
Class C* | 1,773 |
| $ 31,274 |
* When Class B and Class C shares are initially sold, FDC pays commissions from its own resources to financial intermediaries through which the sales are made.
Transfer Agent Fees. Fidelity Investments Institutional Operations Company, Inc., (FIIOC), an affiliate of the investment adviser, is the transfer, dividend disbursing and shareholder servicing agent for each class of the Fund. FIIOC receives account fees and asset-based fees that vary according to the account size and type of account of the shareholders of the respective classes of the Fund. FIIOC pays for typesetting, printing and mailing of shareholder reports, except proxy statements.
Annual Report
Notes to Financial Statements - continued
5. Fees and Other Transactions with Affiliates - continued
Transfer Agent Fees - continued
For the period, transfer agent fees for each class were as follows:
| Amount | % of
Class-Level Average
Net Assets |
Class A | $ 183,297 | .29 |
Class T | 36,439 | .31 |
Class B | 5,992 | .30 |
Class C | 63,653 | .30 |
Global Commodity Stock | 776,461 | .30 |
Institutional Class | 68,271 | .25 |
| $ 1,134,113 | |
Accounting and Security Lending Fees. Fidelity Service Company, Inc. (FSC), an affiliate of the investment adviser, maintains the Fund's accounting records. The accounting fee is based on the level of average net assets for each month. Under a separate contract, FSC administers the security lending program. The security lending fee is based on the number and duration of lending transactions.
Brokerage Commissions. The Fund placed a portion of its portfolio transactions with brokerage firms which are affiliates of the investment adviser. Brokerage commissions are included in net realized gain (loss) and change in net unrealized appreciation (depreciation) in the Statement of Operations. The commissions paid to these affiliated firms were $12,848 for the period.
6. Committed Line of Credit.
The Fund participates with other funds managed by the investment adviser or an affiliate in a $4.25 billion credit facility (the "line of credit") to be utilized for temporary or emergency purposes to fund shareholder redemptions or for other short-term liquidity purposes. The Fund has agreed to pay commitment fees on its pro-rata portion of the line of credit, which amounted to $630 and is reflected in Miscellaneous expenses on the Statement of Operations. During the period, the Fund did not borrow on this line of credit.
7. Security Lending.
The Fund lends portfolio securities through a lending agent from time to time in order to earn additional income. For equity securities, a lending agent is used and may loan securities to certain qualified borrowers, including Fidelity Capital Markets (FCM), a broker-dealer affiliated with the Fund. On the settlement date of the loan, the Fund receives collateral (in the form of U.S. Treasury obligations, letters of credit and/or cash)
Annual Report
7. Security Lending - continued
against the loaned securities and maintains collateral in an amount not less than 100% of the market value of the loaned securities during the period of the loan. The market value of the loaned securities is determined at the close of business of the Fund and any additional required collateral is delivered to the Fund on the next business day. If the borrower defaults on its obligation to return the securities loaned because of insolvency or other reasons, the Fund may apply collateral received from the borrower against the obligation. The Fund may experience delays and costs in recovering the securities loaned. Any cash collateral received is invested in the Fidelity Securities Lending Cash Central Fund. The value of loaned securities and cash collateral at period end are disclosed on the Fund's Statement of Assets and Liabilities. Security lending income represents the income earned on investing cash collateral, less rebates paid to borrowers and any lending agent fees associated with the loan, plus any premium payments received for lending certain types of securities. Security lending income is presented in the Statement of Operations as a component of income from Fidelity Central Funds. Total security lending income during the period amounted to $180,323. During the period, there were no securities loaned to FCM.
8. Expense Reductions.
Commissions paid to certain brokers with whom the investment adviser, or its affiliates, places trades on behalf of the Fund include an amount in addition to trade execution, which may be rebated back to the Fund to offset certain expenses. This amount totaled $8,577 for the period.
In addition, the investment adviser reimbursed a portion of the Fund's operating expenses during the period in the amount of $2,753.
9. Distributions to Shareholders.
Distributions to shareholders of each class were as follows:
Years ended October 31, | 2014 | 2013 |
From net investment income | | |
Class A | $ 708,856 | $ 864,701 |
Class T | 98,770 | 89,063 |
Class B | 4,646 | 847 |
Class C | 54,810 | 32,277 |
Global Commodity Stock | 3,531,196 | 4,073,304 |
Institutional Class | 366,972 | 636,857 |
Total | $ 4,765,250 | $ 5,697,049 |
Annual Report
Notes to Financial Statements - continued
9. Distributions to Shareholders - continued
Years ended October 31, | 2014 | 2013 |
From net realized gain | | |
Class A | $ 63,118 | $ - |
Class T | 11,363 | - |
Class B | 2,083 | - |
Class C | 21,591 | - |
Global Commodity Stock | 244,178 | - |
Institutional Class | 25,376 | - |
Total | $ 367,709 | $ - |
10. Share Transactions.
Share transactions for each class were as follows and may contain automatic conversions between classes or exchanges between funds:
| Shares | Shares | Dollars | Dollars |
Years ended October 31, | 2014 | 2013 | 2014 | 2013 |
Class A | | | | |
Shares sold | 686,605 | 1,201,755 | $ 9,882,029 | $ 16,769,552 |
Reinvestment of distributions | 49,529 | 52,559 | 677,563 | 744,754 |
Shares redeemed | (1,874,574) | (3,054,897) | (26,738,279) | (42,479,556) |
Net increase (decrease) | (1,138,440) | (1,800,583) | $ (16,178,687) | $ (24,965,250) |
Class T | | | | |
Shares sold | 67,497 | 130,604 | $ 970,700 | $ 1,791,142 |
Reinvestment of distributions | 7,867 | 5,824 | 107,538 | 82,471 |
Shares redeemed | (216,700) | (396,060) | (3,112,471) | (5,490,961) |
Net increase (decrease) | (141,336) | (259,632) | $ (2,034,233) | $ (3,617,348) |
Class B | | | | |
Shares sold | 2,197 | 7,047 | $ 29,999 | $ 98,902 |
Reinvestment of distributions | 453 | 54 | 6,179 | 758 |
Shares redeemed | (46,232) | (57,569) | (649,491) | (793,852) |
Net increase (decrease) | (43,582) | (50,468) | $ (613,313) | $ (694,192) |
Class C | | | | |
Shares sold | 167,515 | 368,295 | $ 2,371,848 | $ 5,059,285 |
Reinvestment of distributions | 4,980 | 1,963 | 67,632 | 27,576 |
Shares redeemed | (527,630) | (880,659) | (7,391,284) | (12,048,987) |
Net increase (decrease) | (355,135) | (510,401) | $ (4,951,804) | $ (6,962,126) |
Global Commodity Stock | | | | |
Shares sold | 3,796,689 | 5,296,700 | $ 54,637,922 | $ 74,369,495 |
Reinvestment of distributions | 246,397 | 264,635 | 3,378,098 | 3,760,465 |
Shares redeemed | (6,485,397) | (12,764,042) | (92,819,253) | (177,408,171) |
Net increase (decrease) | (2,442,311) | (7,202,707) | $ (34,803,233) | $ (99,278,211) |
Annual Report
10. Share Transactions - continued
| Shares | Shares | Dollars | Dollars |
Years ended October 31, | 2014 | 2013 | 2014 | 2013 |
Institutional Class | | | | |
Shares sold | 912,359 | 1,153,936 | $ 13,219,634 | $ 16,235,437 |
Reinvestment of distributions | 20,652 | 25,953 | 283,141 | 368,529 |
Shares redeemed | (1,362,707) | (2,405,021) | (19,411,369) | (33,510,048) |
Net increase (decrease) | (429,696) | (1,225,132) | $ (5,908,594) | $ (16,906,082) |
11. Other.
The Fund's organizational documents provide former and current trustees and officers with a limited indemnification against liabilities arising in connection with the performance of their duties to the Fund. In the normal course of business, the Fund may also enter into contracts that provide general indemnifications. The Fund's maximum exposure under these arrangements is unknown as this would be dependent on future claims that may be made against the Fund. The risk of material loss from such claims is considered remote.
At the end of the period, the investment adviser or its affiliates were the owners of record of 13% of the total outstanding shares of the Fund.
Annual Report
To the Trustees of Fidelity Investment Trust and the Shareholders of Fidelity Global Commodity Stock Fund:
In our opinion, the accompanying statement of assets and liabilities, including the schedule of investments, and the related statements of operations and of changes in net assets and the financial highlights present fairly, in all material respects, the financial position of Fidelity Global Commodity Stock Fund (a fund of Fidelity Investment Trust) at October 31, 2014, the results of its operations for the year then ended, the changes in its net assets for each of the two years in the period then ended and the financial highlights for each of the five years in the period then ended, in conformity with accounting principles generally accepted in the United States of America. These financial statements and financial highlights (hereafter referred to as "financial statements") are the responsibility of the Fidelity Global Commodity Stock Fund's management. Our responsibility is to express an opinion on these financial statements based on our audits. We conducted our audits of these financial statements in accordance with the standards of the Public Company Accounting Oversight Board (United States). Those standards require that we plan and perform the audit to obtain reasonable assurance about whether the financial statements are free of material misstatement. An audit includes examining, on a test basis, evidence supporting the amounts and disclosures in the financial statements, assessing the accounting principles used and significant estimates made by management, and evaluating the overall financial statement presentation. We believe that our audits, which included confirmation of securities at October 31, 2014 by correspondence with the custodian and brokers, provide a reasonable basis for our opinion.
PricewaterhouseCoopers LLP
Boston, Massachusetts
December 19, 2014
Annual Report
The Trustees, Member of the Advisory Board, and officers of the trusts and fund, as applicable, are listed below. The Board of Trustees governs the fund and is responsible for protecting the interests of shareholders. The Trustees are experienced executives who meet periodically throughout the year to oversee the fund's activities, review contractual arrangements with companies that provide services to the fund, oversee management of the risks associated with such activities and contractual arrangements, and review the fund's performance. Except for James C. Curvey, each of the Trustees oversees 174 funds. Mr. Curvey oversees 407 funds.
The Trustees hold office without limit in time except that (a) any Trustee may resign; (b) any Trustee may be removed by written instrument, signed by at least two-thirds of the number of Trustees prior to such removal; (c) any Trustee who requests to be retired or who has become incapacitated by illness or injury may be retired by written instrument signed by a majority of the other Trustees; and (d) any Trustee may be removed at any special meeting of shareholders by a two-thirds vote of the outstanding voting securities of the trust. Each Trustee who is not an interested person (as defined in the 1940 Act) of the trust and the fund (Independent Trustee), shall retire not later than the last day of the calendar year in which his or her 75th birthday occurs. The Independent Trustees may waive this mandatory retirement age policy with respect to individual Trustees. The officers and Advisory Board Member hold office without limit in time, except that any officer and Advisory Board Member may resign or may be removed by a vote of a majority of the Trustees at any regular meeting or any special meeting of the Trustees. Except as indicated, each individual has held the office shown or other offices in the same company for the past five years.
Experience, Skills, Attributes, and Qualifications of the Fund's Trustees. The Governance and Nominating Committee has adopted a statement of policy that describes the experience, qualifications, attributes, and skills that are necessary and desirable for potential Independent Trustee candidates (Statement of Policy). The Board believes that each Trustee satisfied at the time he or she was initially elected or appointed a Trustee, and continues to satisfy, the standards contemplated by the Statement of Policy. The Governance and Nominating Committee also engages professional search firms to help identify potential Independent Trustee candidates who have the experience, qualifications, attributes, and skills consistent with the Statement of Policy. From time to time, additional criteria based on the composition and skills of the current Independent Trustees, as well as experience or skills that may be appropriate in light of future changes to board composition, business conditions, and regulatory or other developments, have also been considered by the professional search firms and the Governance and Nominating Committee. In addition, the Board takes into account the Trustees' commitment and participation in Board and committee meetings, as well as their leadership of standing and ad hoc committees throughout their tenure.
In determining that a particular Trustee was and continues to be qualified to serve as a Trustee, the Board has considered a variety of criteria, none of which, in isolation, was controlling. The Board believes that, collectively, the Trustees have balanced and diverse experience, qualifications, attributes, and skills, which allow the Board to operate effectively in governing the fund and protecting the interests of shareholders. Information about the specific experience, skills, attributes, and qualifications of each Trustee, which in each case led to the Board's conclusion that the Trustee should serve (or continue to serve) as a trustee of the fund, is provided below.
Annual Report
Board Structure and Oversight Function. James C. Curvey is an interested person (as defined in the 1940 Act) and currently serves as Chairman. The Trustees have determined that an interested Chairman is appropriate and benefits shareholders because an interested Chairman has a personal and professional stake in the quality and continuity of services provided to the fund. Independent Trustees exercise their informed business judgment to appoint an individual of their choosing to serve as Chairman, regardless of whether the Trustee happens to be independent or a member of management. The Independent Trustees have determined that they can act independently and effectively without having an Independent Trustee serve as Chairman and that a key structural component for assuring that they are in a position to do so is for the Independent Trustees to constitute a substantial majority for the Board. The Independent Trustees also regularly meet in executive session. Ned C. Lautenbach serves as Chairman of the Independent Trustees and as such (i) acts as a liaison between the Independent Trustees and management with respect to matters important to the Independent Trustees and (ii) with management prepares agendas for Board meetings.
Fidelity funds are overseen by different Boards of Trustees. The fund's Board oversees Fidelity's equity and high income funds and another Board oversees Fidelity's investment-grade bond, money market, and asset allocation funds. The asset allocation funds may invest in Fidelity funds overseen by the fund's Board. The use of separate Boards, each with its own committee structure, allows the Trustees of each group of Fidelity funds to focus on the unique issues of the funds they oversee, including common research, investment, and operational issues. On occasion, the separate Boards establish joint committees to address issues of overlapping consequences for the Fidelity funds overseen by each Board.
The Trustees operate using a system of committees to facilitate the timely and efficient consideration of all matters of importance to the Trustees, the fund, and fund shareholders and to facilitate compliance with legal and regulatory requirements and oversight of the fund's activities and associated risks. The Board, acting through its committees, has charged FMR and its affiliates with (i) identifying events or circumstances the occurrence of which could have demonstrably adverse effects on the fund's business and/or reputation; (ii) implementing processes and controls to lessen the possibility that such events or circumstances occur or to mitigate the effects of such events or circumstances if they do occur; and (iii) creating and maintaining a system designed to evaluate continuously business and market conditions in order to facilitate the identification and implementation processes described in (i) and (ii) above. Because the day-to-day operations and activities of the fund are carried out by or through FMR, its affiliates and other service providers, the fund's exposure to risks is mitigated but not eliminated by the processes overseen by the Trustees. While each of the Board's committees has responsibility for overseeing different aspects of the fund's activities, oversight is exercised primarily through the Operations, Audit, and Compliance Committees. In addition, the Independent Trustees have worked with FMR to enhance the Board's oversight of investment and financial risks, legal and regulatory risks, technology risks, and operational risks, including the development of additional risk reporting to the Board. For example, a working group comprised of Independent Trustees and FMR has worked and continues to work to review the Fidelity funds' valuation-related activities, reporting and risk management. Appropriate personnel, including but not limited to the fund's Chief Compliance Officer (CCO), FMR's internal auditor, the independent accountants, the fund's Treasurer and portfolio management personnel, make periodic reports to the Board's committees, as appropriate, including an annual review of FMR's risk management program for the Fidelity funds. The responsibilities of each standing committee, including their oversight responsibilities, are described further under "Standing Committees of the Fund's Trustees."
Annual Report
Trustees and Officers - continued
The fund's Statement of Additional Information (SAI) includes more information about the Trustees. To request a free copy, call Fidelity at 1-877-208-0098.
Interested Trustees*:
Correspondence intended for each Trustee who is an interested person may be sent to Fidelity Investments, 245 Summer Street, Boston, Massachusetts 02210.
Name, Year of Birth; Principal Occupations and Other Relevant Experience+ |
James C. Curvey (1935) |
Year of Election or Appointment: 2007 Trustee Chairman of the Board of Trustees |
| Mr. Curvey also serves as Trustee of other Fidelity funds. Mr. Curvey is a Director of Fidelity Research & Analysis Co. (2009-present), and Vice Chairman (2007-present) and Director of FMR LLC. In addition, Mr. Curvey serves as an Overseer for the Boston Symphony Orchestra and a member of the board of Artis-Naples, Naples, Florida, and as a Trustee for Brewster Academy, Wolfeboro, New Hampshire. Previously, Mr. Curvey served as a Director of Fidelity Investments Money Management, Inc. (2009-2014), a Director of FMR (2007-2014) and a Director of FMR Co., Inc. (2007-2014). |
Charles S. Morrison (1960) |
Year of Election or Appointment: 2014 Trustee |
| Mr. Morrison also serves as Trustee of other funds. He serves as a Director of Fidelity Investments Money Management, Inc. (FIMM) (2014-present), Director of Fidelity SelectCo, LLC (2014-present), President, Asset Management (2014-present) and is an employee of Fidelity Investments. Previously, Mr. Morrison served as Vice President of Fidelity's Fixed Income and Asset Allocation Funds (2012-2014), President, Fixed Income (2011-2014), Vice President of Fidelity's Money Market Funds (2005-2009), President, Money Market Group Leader of FMR (2009), and Senior Vice President, Money Market Group of FMR (2004-2009). Mr. Morrison also served as Vice President of Fidelity's Bond Funds (2002-2005), certain Balanced Funds (2002-2005), and certain Asset Allocation Funds (2002-2007), and as Senior Vice President (2002-2005) of Fidelity's Bond Division. |
* Trustees have been determined to be "Interested Trustees" by virtue of, among other things, their affiliation with the trust or various entities under common control with FMR.
+ The information above includes each Trustee's principal occupation during the last five years and other information relating to the experience, attributes, and skills relevant to each Trustee's qualifications to serve as a Trustee, which led to the conclusion that each Trustee should serve as a Trustee for the fund.
Annual Report
Trustees and Officers - continued
Independent Trustees:
Correspondence intended for each Independent Trustee (that is, the Trustees other than the Interested Trustees) may be sent to Fidelity Investments, P.O. Box 55235, Boston, Massachusetts 02205-5235.
Name, Year of Birth; Principal Occupations and Other Relevant Experience+ |
Dennis J. Dirks (1948) |
Year of Election or Appointment: 2005 Trustee |
| Mr. Dirks also serves as Trustee of other Fidelity funds. Prior to his retirement in May 2003, Mr. Dirks was Chief Operating Officer and a member of the Board of The Depository Trust & Clearing Corporation (DTCC). He also served as President, Chief Operating Officer, and Board member of The Depository Trust Company (DTC) and President and Board member of the National Securities Clearing Corporation (NSCC). In addition, Mr. Dirks served as Chief Executive Officer and Board member of the Government Securities Clearing Corporation, Chief Executive Officer and Board member of the Mortgage-Backed Securities Clearing Corporation, as a Trustee and a member of the Finance Committee of Manhattan College (2005-2008), and as a Trustee and a member of the Finance Committee of AHRC of Nassau County (2006-2008). Mr. Dirks is a member of the Independent Directors Council (IDC) Governing Council (2010-present) and Board of Directors for The Brookville Center for Children's Services, Inc. (2009-present). |
Alan J. Lacy (1953) |
Year of Election or Appointment: 2008 Trustee |
| Mr. Lacy also serves as Trustee of other Fidelity funds. Mr. Lacy serves as Senior Adviser (2007-present) of Oak Hill Capital Partners, L.P. (private equity). Mr. Lacy also served as Chief Executive Officer (2000-2005) and Vice Chairman (2005-2006) of Sears Holdings Corporation and Sears, Roebuck and Co. (retail). In addition, Mr. Lacy serves as a member of the Board of Directors of Dave & Buster's Entertainment, Inc. (restaurant and entertainment complexes, 2010-present), Earth Fare, Inc. (retail grocery, 2012-present), The Hillman Companies, Inc. (hardware wholesalers, 2010-present), and Bristol-Myers Squibb Company (global pharmaceuticals, 2008-present). Mr. Lacy is a member of the Board of Trustees of The National Parks Conservation Association (2006-present). Previously, Mr. Lacy served as Chairman of the Board of Trustees of the National Parks Conservation Association (2008-2011) and as a member of the Board of Directors for the Western Union Company (global money transfer, 2006-2011). |
Ned C. Lautenbach (1944) |
Year of Election or Appointment: 2000 Trustee Chairman of the Independent Trustees |
| Mr. Lautenbach also serves as Trustee of other Fidelity funds. Mr. Lautenbach currently serves as the Lead Director of the Eaton Corporation Board of Directors (diversified industrial, 1997-present). Mr. Lautenbach is Chairman of the Board of Directors of the Philharmonic Center for the Arts in Naples, Florida (2012-present) and a member of the Council on Foreign Relations (1994-present). Previously, Mr. Lautenbach was a Partner/Advisory Partner at Clayton, Dubilier & Rice, LLC (private equity investment, 1998-2010), as well as a Director of Sony Corporation (2006-2007). |
Joseph Mauriello (1944) |
Year of Election or Appointment: 2008 Trustee |
| Mr. Mauriello also serves as Trustee of other Fidelity funds. Prior to his retirement in January 2006, Mr. Mauriello served in numerous senior management positions including Deputy Chairman and Chief Operating Officer (2004-2005), and Vice Chairman of Financial Services (2002-2004) of KPMG LLP US (professional services, 1965-2005). Mr. Mauriello currently serves as a member of the Board of Directors of XL Group plc. (global insurance and re-insurance, 2006-present). Previously, Mr. Mauriello served as a Director of the Hamilton Funds of the Bank of New York (2006-2007) and of Arcadia Resources Inc. (health care services and products, 2007-2012). |
Robert W. Selander (1950) |
Year of Election or Appointment: 2011 Trustee |
| Mr. Selander also serves as Trustee of other Fidelity funds. Previously, Mr. Selander served as a Member of the Advisory Board of other Fidelity funds (2011), and Executive Vice Chairman (2010), Chief Executive Officer (2009-2010), and President and Chief Executive Officer (1997-2009) of Mastercard, Inc. |
Cornelia M. Small (1944) |
Year of Election or Appointment: 2005 Trustee |
| Ms. Small also serves as Trustee of other Fidelity funds. Ms. Small is a member of the Board of Directors (2009-present) and Chair of the Investment Committee (2010-present) of the Teagle Foundation. Ms. Small also serves on the Investment Committee of the Berkshire Taconic Community Foundation (2008-present). Previously, Ms. Small served as Chairperson (2002-2008) and a member of the Investment Committee and Chairperson (2008-2012) and a member of the Board of Trustees of Smith College. In addition, Ms. Small served as Chief Investment Officer, Director of Global Equity Investments, and a member of the Board of Directors of Scudder, Stevens & Clark and Scudder Kemper Investments. |
William S. Stavropoulos (1939) |
Year of Election or Appointment: 2001 Trustee Vice Chairman of the Independent Trustees |
| Mr. Stavropoulos also serves as Trustee of other Fidelity funds. Mr. Stavropoulos serves as President and Founder of the Michigan Baseball Foundation, the Great Lakes Loons (2007-present). Mr. Stavropoulos is Chairman Emeritus of the Board of Directors of The Dow Chemical Company, where he previously served in numerous senior management positions, including President, CEO (1995-2000; 2002-2004), Chairman of the Executive Committee (2000-2006), and as a member of the Board of Directors (1990-2006). Currently, Mr. Stavropoulos is Chairman of the Board of Directors of Univar Inc. (global distributor of commodity and specialty chemicals), a Director of Teradata Corporation (data warehousing and technology solutions), and Maersk Inc. (industrial conglomerate), and a member of the Advisory Board for Metalmark Capital LLC (private equity investment, 2005-present). Mr. Stavropoulos is an operating advisor to Clayton, Dubilier & Rice, LLC (private equity investment). In addition, Mr. Stavropoulos is a member of the University of Notre Dame Advisory Council for the College of Science, a Trustee of the Rollin L. Gerstacker Foundation, and a Director of the Naples Philharmonic Center for the Arts. Previously, Mr. Stavropoulos served as a Director of Chemical Financial Corporation (bank holding company, 1993-2012) and Tyco International, Ltd. (multinational manufacturing and services, 2007-2012). |
David M. Thomas (1949) |
Year of Election or Appointment: 2008 Trustee |
| Mr. Thomas also serves as Trustee of other Fidelity funds. Mr. Thomas serves as Non-Executive Chairman of the Board of Directors of Fortune Brands Home and Security (home and security products, 2011-present), and as a member of the Board of Directors of Interpublic Group of Companies, Inc. (marketing communication, 2004-present). Previously, Mr. Thomas served as Executive Chairman (2005-2006) and Chairman and Chief Executive Officer (2000-2005) of IMS Health, Inc. (pharmaceutical and healthcare information solutions), and a Director of Fortune Brands, Inc. (consumer products, 2000-2011). |
+ The information above includes each Trustee's principal occupation during the last five years and other information relating to the experience, attributes, and skills relevant to each Trustee's qualifications to serve as a Trustee, which led to the conclusion that each Trustee should serve as a Trustee for the fund.
Advisory Board Member and Officers:
Correspondence intended for each officer and Peter S. Lynch may be sent to Fidelity Investments, 245 Summer Street, Boston, Massachusetts 02210. Officers appear below in alphabetical order.
Name, Year of Birth; Principal Occupation |
Peter S. Lynch (1944) |
Year of Election or Appointment: 2003 Member of the Advisory Board |
| Mr. Lynch also serves as Member of the Advisory Board of other Fidelity funds. Mr. Lynch is Vice Chairman and a Director of FMR and FMR Co., Inc. In addition, Mr. Lynch serves as a Trustee of Boston College and as the Chairman of the Inner-City Scholarship Fund. Previously, Mr. Lynch served on the Special Olympics International Board of Directors (1997-2006). |
Elizabeth Paige Baumann (1968) |
Year of Election or Appointment: 2012 Anti-Money Laundering (AML) Officer |
| Ms. Baumann also serves as AML Officer of other funds. She is Chief AML Officer of FMR LLC (2012-present) and is an employee of Fidelity Investments. Previously, Ms. Baumann served as Vice President and Deputy Anti-Money Laundering Officer (2007-2012). |
William C. Coffey (1969) |
Year of Election or Appointment: 2009 Assistant Secretary |
| Mr. Coffey also serves as Assistant Secretary of other funds. He is Senior Vice President and Deputy General Counsel of FMR LLC (2010-present), and is an employee of Fidelity Investments. Previously, Mr. Coffey served as Vice President and Associate General Counsel of FMR LLC (2005-2009). |
Timothy M. Cohen (1969) |
Year of Election or Appointment: 2014 Vice President of certain Equity Funds |
| Mr. Cohen also serves as Vice President of other funds. Mr. Cohen serves as a Director and Chief Compliance Officer of Fidelity Management & Research (U.K.) Inc. (2013-present) and is an employee of Fidelity Investments. |
Jonathan Davis (1968) |
Year of Election or Appointment: 2010 Assistant Treasurer |
| Mr. Davis also serves as Assistant Treasurer of other funds. Mr. Davis is an employee of Fidelity Investments. Previously, Mr. Davis served as Vice President and Associate General Counsel of FMR LLC (2003-2010). |
Adrien E. Deberghes (1967) |
Year of Election or Appointment: 2008 Deputy Treasurer |
| Mr. Deberghes also serves as an officer of other funds. He is an employee of Fidelity Investments (2008-present). Prior to joining Fidelity Investments, Mr. Deberghes was Senior Vice President of Mutual Fund Administration at State Street Corporation (2007-2008), Senior Director of Mutual Fund Administration at Investors Bank & Trust (2005-2007), and Director of Finance for Dunkin' Brands (2000-2005). |
Stephanie J. Dorsey (1969) |
Year of Election or Appointment: 2010 Assistant Treasurer |
| Ms. Dorsey also serves as an officer of other funds. She is an employee of Fidelity Investments (2008-present) and has served in other fund officer roles. Prior to joining Fidelity Investments, Ms. Dorsey served as Treasurer (2004-2008) of the JPMorgan Mutual Funds and Vice President (2004-2008) of JPMorgan Chase Bank. |
Howard J. Galligan III (1966) |
Year of Election or Appointment: 2014 Chief Financial Officer |
| Mr. Galligan also serves as Chief Financial Officer of other funds. Mr. Galligan serves as President of Fidelity Pricing and Cash Management Services (FPCMS) (2014-present) and as a Director of Strategic Advisers, Inc. (2008-present). Previously, Mr. Galligan served as Chief Administrative Officer of Asset Management (2011-2014) and Chief Operating Officer and Senior Vice President of Investment Support for Strategic Advisers, Inc. (2003-2011). |
Scott C. Goebel (1968) |
Year of Election or Appointment: 2008 Secretary and Chief Legal Officer (CLO) |
| Mr. Goebel serves as Secretary and CLO of other funds. Mr. Goebel also serves as Secretary of Fidelity SelectCo, LLC (2013-present), Fidelity Investments Money Management, Inc. (FIMM) (2010-present) and Fidelity Research and Analysis Company (FRAC) (2010-present); General Counsel, Secretary, and Senior Vice President of FMR (2008-present) and FMR Co., Inc. (2008-present); Chief Legal Officer of Fidelity Management & Research (Hong Kong) Limited (2008-present); and Assistant Secretary of Fidelity Management & Research (Japan) Limited (2008-present) and Fidelity Management & Research (U.K.) Inc. (2008-present). Previously, Mr. Goebel served as Secretary and CLO of other Fidelity funds (2008-2013), Assistant Secretary of FIMM (2008-2010), FRAC (2008-2010), and certain funds (2007-2008); and as Vice President and Secretary of Fidelity Distributors Corporation (FDC) (2005-2007). Mr. Goebel has been employed by FMR LLC or an affiliate since 2001. |
Brian B. Hogan (1964) |
Year of Election or Appointment: 2009 Vice President |
| Mr. Hogan also serves as Trustee or Vice President of other funds. Mr. Hogan serves as a Director of Fidelity SelectCo, LLC (2014-present) and President of FMR's Equity Division (2009-present). Previously, Mr. Hogan served as Senior Vice President, Equity Research of FMR (2006-2009) and as a portfolio manager. |
Chris Maher (1972) |
Year of Election or Appointment: 2013 Assistant Treasurer |
| Mr. Maher serves as Assistant Treasurer of other funds. Mr. Maher is Vice President of Valuation Oversight and is an employee of Fidelity Investments. Previously, Mr. Maher served as Vice President of Asset Management Compliance (2013), Vice President of FMR's Program Management Group (2010-2013), and Vice President of Valuation Oversight (2008-2010). |
Kenneth B. Robins (1969) |
Year of Election or Appointment: 2008 President and Treasurer |
| Mr. Robins also serves as an officer of other funds. Mr. Robins serves as Executive Vice President of Fidelity Investments Money Management, Inc. (FIMM) (2013-present) and is an employee of Fidelity Investments (2004-present). Previously, Mr. Robins served in other fund officer roles. |
Stephen Sadoski (1971) |
Year of Election or Appointment: 2012 Deputy Treasurer |
| Mr. Sadoski also serves as Deputy Treasurer of other funds. He is an employee of Fidelity Investments (2012-present) and has served in another fund officer role. Prior to joining Fidelity Investments, Mr. Sadoski served as an assistant chief accountant in the Division of Investment Management of the Securities and Exchange Commission (SEC) (2009-2012) and as a senior manager at Deloitte & Touche LLP (1997-2009). |
Stacie M. Smith (1974) |
Year of Election or Appointment: 2013 Deputy Treasurer |
| Ms. Smith also serves as an officer of other funds. She is an employee of Fidelity Investments (2009-present) and has served in other fund officer roles. Prior to joining Fidelity Investments, Ms. Smith served as Senior Audit Manager of Ernst & Young LLP (1996-2009). |
Renee Stagnone (1975) |
Year of Election or Appointment: 2013 Deputy Treasurer |
| Ms. Stagnone also serves as Deputy Treasurer of other funds. Ms. Stagnone is an employee of Fidelity Investments. |
Linda J. Wondrack (1964) |
Year of Election or Appointment: 2014 Chief Compliance Officer |
| Ms. Wondrack also serves as Chief Compliance Officer of other funds. Ms. Wondrack is Executive Vice President and head of the Ethics Office and Asset Management Compliance for Fidelity Investments (2012-present). Ms. Wondrack also serves as Chief Compliance Officer of Fidelity SelectCo, LLC (2014-present); Chief Compliance Officer of Impresa Management LLC (2013-present); and Chief Compliance Officer of FMR Co., Inc., Fidelity Investments Money Management, Inc., Fidelity Management & Research (Japan) Limited, Fidelity Management & Research (U.K.) Inc., Fidelity Management & Research (Hong Kong), Fidelity Management & Research Company, Pyramis Global Advisors, LLC, and Strategic Advisers, Inc., Ballyrock Investment Advisors LLC, and Northern Neck Investors LLC (2012-present). Previously, Ms. Wondrack served as Senior Vice President and Chief Compliance Officer for Columbia Management Investment Advisers, LLC (2005-2012); Chief Compliance Officer for certain funds within the Columbia Family of Funds (2007-2012); and Senior Vice President of Compliance Risk Management at Bank of America (2005-2010). |
Joseph F. Zambello (1957) |
Year of Election or Appointment: 2011 Deputy Treasurer |
| Mr. Zambello also serves as Deputy Treasurer of other funds. Mr. Zambello is an employee of Fidelity Investments. Previously, Mr. Zambello served as Vice President of FMR's Program Management Group (2009-2011) and Vice President of the Transfer Agent Oversight Group (2005-2009). |
Annual Report
The Board of Trustees of Fidelity Global Commodity Stock Fund voted to pay to shareholders of record at the opening of business on record date, the following distributions per share derived from capital gains realized from sales of portfolio securities, and dividends derived from net investment income:
| Pay Date | Record Date | Dividends | Capital Gains |
Class A | 12/08/14 | 12/05/14 | $0.139 | $0.026 |
Class T | 12/08/14 | 12/05/14 | $0.099 | $0.026 |
Class B | 12/08/14 | 12/05/14 | $0.016 | $0.026 |
Class C | 12/08/14 | 12/05/14 | $0.025 | $0.026 |
Class A designates 54%, Class T designates 66%, Class B designates 100%, and Class C designates 100% of the dividend distributed during the fiscal year as qualifying for the dividends-received deduction for corporate shareholders.
Class A, Class T, Class B and Class C designate 100% of the dividend distributed during the fiscal year as amounts which may be taken into account as a dividend for purposes of the maximum rate under section 1(h)(11) of the Internal Revenue Code.
The amounts per share which represent income derived from sources within, and taxes paid to, foreign countries or possessions of the United States are as follows:
| Pay Date | Income | Taxes |
Class A | 12/09/13 | $0.1610 | $0.0155 |
Class T | 12/09/13 | $0.1305 | $0.0155 |
Class B | 12/09/13 | $0.0531 | $0.0155 |
Class C | 12/09/13 | $0.0568 | $0.0155 |
The fund will notify shareholders in January 2015 of amounts for use in preparing 2014 income tax returns.
Annual Report
Board Approval of Investment Advisory Contracts and Management Fees
Fidelity Global Commodity Stock Fund
Each year, the Board of Trustees, including the Independent Trustees (together, the Board), votes on the renewal of the management contract with Fidelity Management & Research Company (FMR) and the sub-advisory agreements (together, the Advisory Contracts) for the fund. The Board, assisted by the advice of fund counsel and Independent Trustees' counsel, requests and considers a broad range of information relevant to the renewal of the Advisory Contracts throughout the year.
The Board meets regularly and, at each of its meetings, covers an extensive agenda of topics and materials and considers factors that are relevant to its annual consideration of the renewal of the fund's Advisory Contracts, including the services and support provided to the fund and its shareholders. The Board has established various standing committees (Committees), each composed of and chaired by Independent Trustees with varying backgrounds, to which the Board has assigned specific subject matter responsibilities in order to enhance effective decision-making by the Board. The Board, acting directly and through its Committees, requests and receives information concerning the annual consideration of the renewal of the fund's Advisory Contracts. The Board also meets as needed to consider matters specifically related to the Board's annual consideration of the renewal of the Advisory Contracts. Members of the Board may also meet with trustees of other Fidelity funds through ad hoc joint committees to discuss certain matters relevant to the Fidelity funds.
At its July 2014 meeting, the Board, including the Independent Trustees, unanimously determined to renew the fund's Advisory Contracts. In reaching its determination, the Board considered all factors it believed relevant, including (i) the nature, extent, and quality of the services to be provided to the fund and its shareholders (including the investment performance of the fund); (ii) the competitiveness of the fund's management fee and total expense ratio relative to peer funds; (iii) the total costs of the services to be provided by and the profits to be realized by Fidelity from its relationship with the fund; (iv) the extent to which economies of scale exist and would be realized as the fund grows; and (v) whether fee levels reflect these economies of scale, if any, for the benefit of fund shareholders. In connection with separate internal corporate reorganizations involving Fidelity Management & Research (U.K.) Inc. (FMR U.K.) and Fidelity Management & Research (Japan) Inc. (FMR Japan), the Board approved certain non-material amendments to the fund's sub-advisory agreements with FMR U.K. and FMR Japan to reflect that, after these reorganizations, FMR Investment Management (UK) Limited and Fidelity Management & Research (Japan) Limited will carry on the business of FMR U.K. and FMR Japan, respectively. The Board noted that no changes to the portfolio managers or to the foreign research or investment advisory services provided to the fund were expected in connection with either reorganization and that the same personnel and resources would continue to be available to the fund at the new entities.
Annual Report
Board Approval of Investment Advisory Contracts and
Management Fees - continued
In considering whether to renew the Advisory Contracts for the fund, the Board reached a determination, with the assistance of fund counsel and Independent Trustees' counsel and through the exercise of its business judgment, that the renewal of the Advisory Contracts was in the best interests of the fund and its shareholders and that the compensation payable under the Advisory Contracts was fair and reasonable. The Board's decision to renew the Advisory Contracts was not based on any single factor, but rather was based on a comprehensive consideration of all the information provided to the Board at its meetings throughout the year. The Board, in reaching its determination to renew the Advisory Contracts, was aware that shareholders of the fund have a broad range of investment choices available to them, including a wide choice among funds offered by Fidelity's competitors, and that the fund's shareholders, who have the opportunity to review and weigh the disclosure provided by the fund in its prospectus and other public disclosures, have chosen to invest in this fund, which is part of the Fidelity family of funds.
Nature, Extent, and Quality of Services Provided. The Board considered Fidelity's staffing as it relates to the fund, including the backgrounds of investment personnel of FMR and the sub-advisers (together, the Investment Advisers), and also considered the fund's investment objective, strategies, and related investment philosophy. The Independent Trustees also had discussions with senior management of Fidelity's investment operations and investment groups. The Board considered the structure of the portfolio manager compensation program and whether this structure provides appropriate incentives to act in the best interests of the fund. Additionally, the Board considered the portfolio managers' investments, if any, in the funds that they manage.
Resources Dedicated to Investment Management and Support Services. The Board and the Fund Oversight and Research Committees reviewed the general qualifications and capabilities of Fidelity's investment staff, including its size, education, experience, and resources, as well as Fidelity's approach to recruiting, training, managing, and compensating investment personnel. The Board noted that Fidelity has continued to increase the resources devoted to non-U.S. offices, including expansion of Fidelity's global investment organization. The Board also noted that Fidelity's analysts have extensive resources, tools and capabilities that allow them to conduct sophisticated quantitative and fundamental analysis, as well as credit analysis of issuers, counterparties and guarantors. Further, the Board believes that Fidelity's investment professionals have sufficient access to global information and data so as to provide competitive investment results over time, and that those professionals also have access to sophisticated tools that permit them to assess portfolio construction and risk and performance attribution characteristics continuously, as well as to transmit new information and research conclusions rapidly around the world. Additionally, in its deliberations, the Board considered Fidelity's trading and risk management capabilities and resources and global compliance infrastructure, which are an integral part of the investment management process.
Annual Report
Shareholder and Administrative Services. The Board considered (i) the nature, extent, quality, and cost of advisory, administrative, and shareholder services performed by the Investment Advisers and their affiliates under the Advisory Contracts and under separate agreements covering transfer agency, pricing and bookkeeping, and securities lending services for the fund; (ii) the nature and extent of the supervision of third party service providers, principally custodians and subcustodians; and (iii) the resources devoted to, and the record of compliance with, the fund's compliance policies and procedures. The Board also reviewed the allocation of fund brokerage, including allocations to brokers affiliated with the Investment Advisers, the use of brokerage commissions to pay fund expenses, and the use of "soft" commission dollars to pay for research services.
The Board noted that the growth of fund assets over time across the complex allows Fidelity to reinvest in the development of services designed to enhance the value or convenience of the Fidelity funds as investment vehicles. These services include 24-hour access to account information and market information through telephone representatives and over the Internet, investor education materials and asset allocation tools, and the expanded availability of Fidelity Investor Centers.
In 2014, the Board formed an ad hoc Committee on Transfer Agency Fees to review the variety of transfer agency fee structures throughout the industry and Fidelity's competitive positioning with respect to industry participants.
Investment in a Large Fund Family. The Board considered the benefits to shareholders of investing in a Fidelity fund, including the benefits of investing in a fund that is part of a large family of funds offering a variety of investment disciplines and providing a large variety of mutual fund investor services. The Board noted that Fidelity had taken, or had made recommendations that resulted in the Fidelity funds taking, a number of actions over the previous year that benefited particular funds, including (i) continuing to dedicate additional resources to investment research and to the support of the senior management team that oversees asset management; (ii) persisting in efforts to enhance Fidelity's global research capabilities; (iii) launching new funds and making other enhancements to meet client needs for income-oriented solutions; (iv) reducing fund expenses for certain index funds; (v) continuing to launch dedicated lower cost underlying funds to meet portfolio construction needs related to expanding underlying fund options for Fidelity funds of funds, specifically for the Freedom Fund product lines; (vi) rationalizing product lines and gaining increased efficiencies through fund mergers; (vii) launching sector-based exchange-traded funds and establishing a new Fidelity adviser to manage sector-based funds and products; (viii) continuing to develop and implement technology to improve security and increase efficiency; (ix) modifying the eligibility criteria for certain share classes to increase their marketability to a portion of the defined contribution plan market; (x) waiving redemption fees for certain qualified fund-of-fund and wrap programs and certain retirement plan transactions; and (xi) launching new Institutional Class shares of certain money market funds to attract and retain assets and to fill a gap in the money market fund lineup.
Annual Report
Board Approval of Investment Advisory Contracts and
Management Fees - continued
Investment Performance. The Board considered whether the fund has operated in accordance with its investment objective, as well as its record of compliance with its investment restrictions and its performance history.
The Board took into account discussions with the Investment Advisers about fund investment performance that occur at Board meetings throughout the year. In this regard the Board noted that as part of regularly scheduled fund reviews and other reports to the Board on fund performance, the Board periodically considers annualized return information for the fund, for different time periods, measured against a securities market index ("benchmark index") and a peer group of funds with similar objectives ("peer group"). In its evaluation of fund investment performance, the Board gave particular attention to information indicating changes in performance of certain Fidelity funds for specific time periods and the Investment Advisers' explanations for any overperformance or underperformance.
In addition to reviewing absolute and relative fund performance, the Independent Trustees periodically consider the appropriateness of fund performance metrics in evaluating the results achieved. In general, the Independent Trustees believe that fund performance should be evaluated based on net performance (after fees and expenses) of both the highest performing and lowest performing classes, where applicable, compared to appropriate benchmark indices, over appropriate time periods which may include full market cycles, and compared to peer groups, as applicable, over the same periods, taking into account relevant factors including the following: general market conditions; issuer-specific information; tactical opportunities for investment; and fund cash flows and other factors.
The Independent Trustees recognize that shareholders evaluate performance on a net basis over their own holding periods, for which one-, three-, and five-year periods are often used as a proxy. For this reason, the performance information reviewed by the Board also included net cumulative calendar year total return information for the fund and an appropriate benchmark index for the most recent one- and three-year periods, as shown below. A peer group comparison is not shown below.
Annual Report
Fidelity Global Commodity Stock Fund

The Board has discussed with FMR the fund's underperformance (based on the December 31, 2013 data presented herein) and has engaged with FMR to consider what steps might be taken to remediate the fund's underperformance. The Board noted that the fund's performance has improved for more recent periods.
Based on its review, the Board concluded that the nature, extent, and quality of services provided to the fund under the Advisory Contracts should benefit the fund's shareholders.
Competitiveness of Management Fee and Total Expense Ratio. The Board considered the fund's management fee and total expense ratio compared to "mapped groups" of competitive funds and classes. Fidelity creates "mapped groups" by combining similar Lipper investment objective categories that have comparable investment mandates. Combining Lipper investment objective categories aids the Board's management fee and total expense ratio comparisons by broadening the competitive group used for comparison and by reducing the number of universes to which various Fidelity funds are compared.
Management Fee. The Board considered two proprietary management fee comparisons for the 12-month (or shorter) periods shown in the chart below. The group of Lipper funds used by the Board for management fee comparisons is referred to below as the "Total Mapped Group." The Total Mapped Group comparison focuses on a fund's standing in terms of gross management fees before expense reimbursements or caps relative to the total universe of funds with comparable investment mandates, regardless of whether their management fee structures also are comparable. Funds with comparable investment mandates offer exposure to similar types of securities. Funds with comparable management fee structures have similar management fee contractual arrangements (e.g., flat rate charged for advisory services, all-inclusive fee rate, etc.). "TMG %" represents the percentage of funds in the Total Mapped Group that had management fees that were lower than the fund's. For example, a hypothetical TMG % of 20% would mean that 80% of the funds in the Total Mapped Group had higher, and 20% had lower, management fees than the fund. The fund's actual TMG %s are in the chart below. The "Asset-Size Peer Group" (ASPG) comparison focuses on a fund's standing relative to a subset of non-Fidelity funds within the Total Mapped Group that are similar in size and management fee structure. For example, if a fund is in the first quartile of the ASPG, the fund's management fee ranks in the least expensive or lowest 25% of funds in the ASPG. The ASPG represents at least 15% of the funds in the Total Mapped Group with comparable asset size and management fee structures, subject to a minimum of 50 funds (or all funds in the Total Mapped Group if fewer than 50). Additional information, such as the ASPG quartile in which the fund's management fee rate ranked, is also included in the chart and considered by the Board.
Annual Report
Board Approval of Investment Advisory Contracts and
Management Fees - continued
Fidelity Global Commodity Stock Fund

The Board noted that the fund's management fee rate ranked below the median of its Total Mapped Group and below the median of its ASPG for 2013.
The Board also noted that, in August 2013, the ad hoc Committee on Management Fees was formed to conduct an in-depth review of the management fee rates of Fidelity's active equity mutual funds. The Committee focused on the following areas: (i) standard fee structures; (ii) research consumption and trading evolution; (iii) management fee competitiveness/profitability by category; and (iv) factors that drive institutional pricing.
Annual Report
Based on its review, the Board concluded that the fund's management fee is fair and reasonable in light of the services that the fund receives and the other factors considered.
Total Expense Ratio. In its review of each class's total expense ratio, the Board considered the fund's management fee as well as other fund or class expenses, as applicable, such as transfer agent fees, pricing and bookkeeping fees, fund-paid 12b-1 fees, and custodial, legal, and audit fees. The Board also noted the effects of any waivers and reimbursements on fees and expenses. As part of its review, the Board also considered the current and historical total expense ratios of each class of the fund compared to competitive fund median expenses. Each class of the fund is compared to those funds and classes in the Total Mapped Group (used by the Board for management fee comparisons) that have a similar sales load structure.
The Board noted that the total expense ratio of each of Class A, Institutional Class, and the retail class ranked below its competitive median for 2013, the total expense ratio of Class C ranked equal to its competitive median for 2013, and the total expense ratio of each of Class T and Class B ranked above its competitive median for 2013. The Board considered that, in general, various factors can affect total expense ratios. The Board noted that the total expense ratio of Class T was above the competitive median primarily because of higher 12b-1 fees on Class T as compared to most competitor funds. Class T has a higher 12b-1 fee, but a lower front-end sales charge, than traditionally priced front-end sales charge classes. The Board considered that Class T is primarily sold load-waived in the retirement plan market where its 0.50% 12b-1 fee is comparable to competing no-load, higher 12b-1 fee classes designed specifically for retirement plans. The Board noted that the fund offers multiple classes, each of which has a different sales load and 12b-1 fee structure, and that the multiple structures are intended to offer a range of pricing options for the intermediary market. The Board also noted that the total expense ratios of the classes vary primarily by the level of their 12b-1 fees, although differences in transfer agent fees may also cause expenses to vary from class to class.
Fees Charged to Other Fidelity Clients. The Board also considered Fidelity fee structures and other information with respect to clients of Fidelity, such as other funds advised or subadvised by Fidelity, pension plan clients, and other institutional clients. The Board noted the findings of the 2013 ad hoc joint committee (created with the board of other Fidelity funds), which reviewed and compared Fidelity's institutional investment advisory business with its business of providing services to the Fidelity funds, including the differences in services provided, fees charged, and costs incurred, as well as competition in their respective marketplaces.
Based on its review of total expense ratios and fees charged to other Fidelity clients, the Board concluded that the total expense ratio of each class of the fund was reasonable, although in some cases above the median of the universe presented for comparison, in light of the services that the fund and its shareholders receive and the other factors considered.
Annual Report
Board Approval of Investment Advisory Contracts and
Management Fees - continued
Costs of the Services and Profitability. The Board considered the revenues earned and the expenses incurred by Fidelity in conducting the business of developing, marketing, distributing, managing, administering and servicing the fund and servicing the fund's shareholders. The Board also considered the level of Fidelity's profits in respect of all the Fidelity funds.
On an annual basis, Fidelity presents to the Board Fidelity's profitability for the fund. Fidelity calculates the profitability for each fund, as well as aggregate profitability for groups of Fidelity funds and all Fidelity funds, using a series of detailed revenue and cost allocation methodologies which originate with the books and records of Fidelity on which Fidelity's audited financial statements are based. The Audit Committee of the Board reviews any significant changes from the prior year's methodologies.
PricewaterhouseCoopers LLP (PwC), independent registered public accounting firm and auditor to Fidelity and certain Fidelity funds, has been engaged annually by the Board as part of the Board's assessment of Fidelity's profitability analysis. PwC's engagement includes the review and assessment of the methodologies used by Fidelity in determining the revenues and expenses attributable to Fidelity's mutual fund business, and completion of agreed-upon procedures in respect of the mathematical accuracy of fund profitability and its conformity to established allocation methodologies. After considering PwC's reports issued under the engagement and information provided by Fidelity, the Board concluded that while other allocation methods may also be reasonable, Fidelity's profitability methodologies are reasonable in all material respects.
The Board also reviewed Fidelity's non-fund businesses and fall-out benefits related to the mutual fund business as well as cases where Fidelity's affiliates may benefit from or be related to the fund's business.
The Board considered the costs of the services provided by and the profits realized by Fidelity in connection with the operation of the fund and was satisfied that the profitability was not excessive in the circumstances.
Economies of Scale. The Board considered whether there have been economies of scale in respect of the management of the Fidelity funds, whether the Fidelity funds (including the fund) have appropriately benefited from any such economies of scale, and whether there is potential for realization of any further economies of scale. The Board considered the extent to which the fund will benefit from economies of scale through increased services to the fund, through waivers or reimbursements, or through fee or expense ratio reductions. The Board also noted that in 2013, it and the boards of other Fidelity funds created an ad hoc committee (the Economies of Scale Committee) to analyze whether Fidelity attains economies of scale in respect of the management and servicing of the Fidelity funds, whether the Fidelity funds have appropriately benefited from such economies of scale, and whether there is potential for realization of any further economies of scale.
Annual Report
The Board recognized that the fund's management contract incorporates a "group fee" structure, which provides for lower group fee rates as total group assets increase, and for higher group fee rates as total group assets decrease (with "group assets" defined to include fund assets under FMR's management plus sector fund assets previously under FMR's management and currently managed by Fidelity SelectCo, LLC). FMR calculates the group fee rates based on a tiered asset "breakpoint" schedule that varies based on asset class. The Board considered that the group fee is designed to deliver the benefits of economies of scale to fund shareholders when total Fidelity fund assets increase, even if assets of any particular fund are unchanged or have declined, because some portion of Fidelity's costs are attributable to services provided to all Fidelity funds, and all funds benefit if those costs can be allocated among more assets. The Board concluded that, given the group fee structure, fund shareholders will benefit from lower management fees as group assets increase at the fund complex level, regardless of whether Fidelity achieves any such economies of scale.
The Board concluded, taking into account the analysis of the Economies of Scale Committee, that economies of scale, if any, are being appropriately shared between fund shareholders and Fidelity.
Additional Information Requested by the Board. In order to develop fully the factual basis for consideration of the Fidelity funds' Advisory Contracts, the Board requested and received additional information on certain topics, including: (i) fund performance trends and Fidelity's long-term strategies for certain funds; (ii) Fidelity's strategic marketing and product lineup goals; (iii) the methodology with respect to competitive fund data and peer group classifications; (iv) the arrangements with, and performance of, certain sub-advisers on behalf of the Fidelity funds, as well as certain proposed participating affiliate arrangements; (v) the realization of fall-out benefits in certain Fidelity business units; (vi) Fidelity's group fee structures, including the rationale for the individual fee rates of certain categories of funds and the definition of group assets; (vii) trends regarding industry use of performance fee structures and the performance adjustment methodologies applicable to the Fidelity funds; (viii) additional competitive analysis regarding the total expenses for certain classes; (ix) fund profitability methodology, including Fidelity's cost allocation methodology, and the impact of certain factors on fund profitability results; and (x) the process by which Fidelity determines sub-advisory fees for funds it advises.
Based on its evaluation of all of the conclusions noted above, and after considering all factors it believed relevant, the Board ultimately concluded that the advisory fee structures are fair and reasonable, and that the fund's Advisory Contracts should be renewed.
Annual Report
Investment Adviser
Fidelity Management & Research Company
Boston, MA
Investment Sub-Advisers
FMR Co., Inc.
Fidelity Management & Research
(U.K.) Inc.
FIL Investment Advisors
FIL Investments (Japan) Limited
FIL Investment Advisors (U.K.) Limited
Fidelity Management & Research
(Hong Kong) Limited
Fidelity Management & Research
(Japan) Limited
General Distributor
Fidelity Distributors Corporation
Smithfield, RI
Transfer and Service Agents
Fidelity Investments Institutional
Operations Company, Inc.
Boston, MA
Fidelity Service Company, Inc.
Boston, MA
Custodian
State Street Bank and Trust Company
Quincy, MA
(Fidelity Investment logo)(registered trademark)
AGCS-UANN-1214
1.879395.105
(Fidelity Investment logo)(registered trademark)
Fidelity Advisor®
Global Commodity Stock
Fund - Institutional Class
Annual Report
October 31, 2014
(Fidelity Cover Art)
Institutional Class is a
class of Fidelity® Global
Commodity Stock Fund
Contents
Performance | (Click Here) | How the fund has done over time. |
Management's Discussion of Fund Performance | (Click Here) | The Portfolio Manager's review of fund performance and strategy. |
Shareholder Expense Example | (Click Here) | An example of shareholder expenses. |
Investment Changes | (Click Here) | A summary of major shifts in the fund's investments over the past six months. |
Investments | (Click Here) | A complete list of the fund's investments with their market values. |
Financial Statements | (Click Here) | Statements of assets and liabilities, operations, and changes in net assets, as well as financial highlights. |
Notes | (Click Here) | Notes to the financial statements. |
Report of Independent Registered Public Accounting Firm | (Click Here) | |
Trustees and Officers | (Click Here) | |
Distributions | (Click Here) | |
Board Approval of Investment Advisory Contracts and Management Fees | (Click Here) | |
To view a fund's proxy voting guidelines and proxy voting record for the 12-month period ended June 30, visit http://www.fidelity.com/proxyvotingresults or visit the Securities and Exchange Commission's (SEC) web site at http://www.sec.gov. You may also call 1-877-208-0098 to request a free copy of the proxy voting guidelines.
Standard & Poor's, S&P and S&P 500 are registered service marks of The McGraw-Hill Companies, Inc. and have been licensed for use by Fidelity Distributors Corporation.
Other third-party marks appearing herein are the property of their respective owners.
All other marks appearing herein are registered or unregistered trademarks or service marks of FMR LLC or an affiliated company. © 2014 FMR LLC. All rights reserved.
Annual Report
This report and the financial statements contained herein are submitted for the general information of the shareholders of the fund. This report is not authorized for distribution to prospective investors in the fund unless preceded or accompanied by an effective prospectus.
A fund files its complete schedule of portfolio holdings with the SEC for the first and third quarters of each fiscal year on Form N-Q. Forms N-Q are available on the SEC's web site at http://www.sec.gov. A fund's Forms N-Q may be reviewed and copied at the SEC's Public Reference Room in Washington, DC. Information regarding the operation of the SEC's Public Reference Room may be obtained by calling 1-800-SEC-0330. For a complete list of a fund's portfolio holdings, view the most recent holdings listing, semiannual report, or annual report on Fidelity's web site at http://www.fidelity.com, http://www.advisor.fidelity.com, or http://www.401k.com, as applicable.
NOT FDIC INSURED • MAY LOSE VALUE • NO BANK GUARANTEE
Neither the fund nor Fidelity Distributors Corporation is a bank.
Annual Report
Average annual total return reflects the change in the value of an investment, assuming reinvestment of the class' distributions from dividend income and capital gains (the profits earned upon the sale of securities that have grown in value, if any) and assuming a constant rate of performance each year. The $10,000 table and the fund's returns do not reflect the deduction of taxes that a shareholder would pay on fund distributions or the redemption of fund shares. During periods of reimbursement by Fidelity, a fund's total return will be greater than it would be had the reimbursement not occurred. How a fund did yesterday is no guarantee of how it will do tomorrow.
Average Annual Total Returns
Periods ended October 31, 2014 | Past 1
year | Past 5
years | Life of
fund A |
Institutional Class | -5.16% | 1.09% | 6.25% |
A From March 25, 2009.
$10,000 Over Life of Fund
Let's say hypothetically that $10,000 was invested in Fidelity Advisor® Global Commodity Stock Fund - Institutional Class on March 25, 2009, when the fund started. The chart shows how the value of your investment would have changed, and also shows how the MSCI ACWI (All Country World Index) Index performed over the same period.
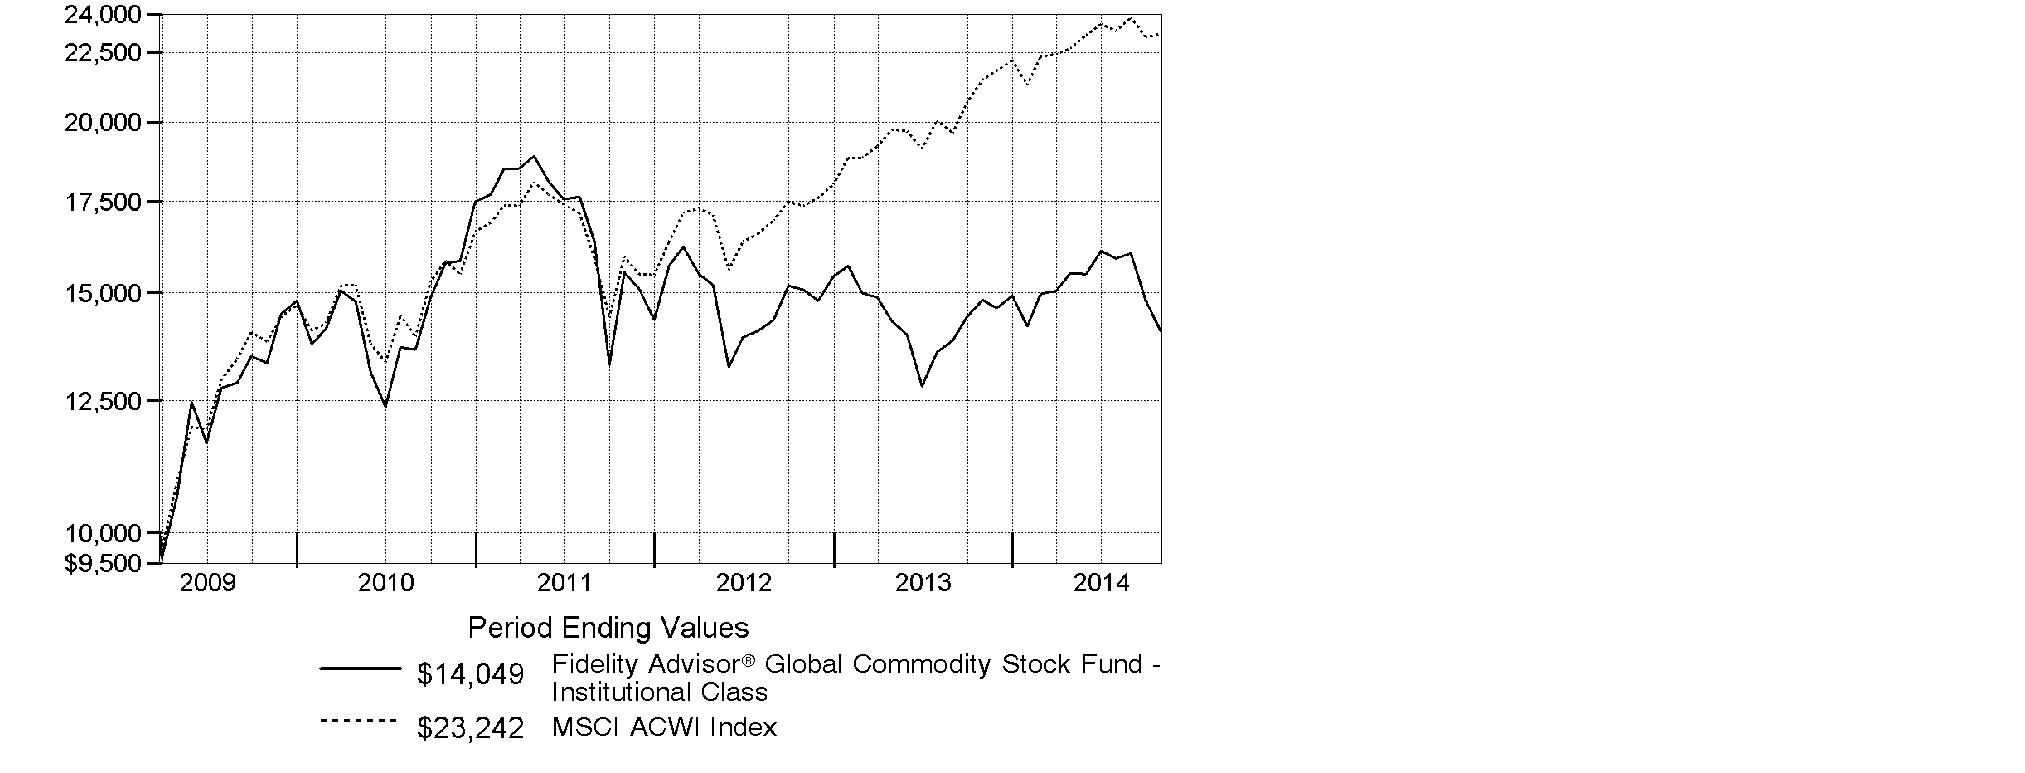
Annual Report
Market Recap: Global equities posted a healthy gain for the 12 months ending October 31, 2014, overcoming an October market decline driven by recessionary pressures in China and tepid growth in Europe. The MSCI ACWI (All Country World Index) Index rose 8.15%, helped by subdued market volatility for much of the period and supported by solid corporate earnings, especially in the United States. Stocks also benefited from easy monetary policies in Japan and the eurozone, as well as increased stimulus efforts in China. All but three of the 24 industry groups that compose the index marked a positive return. The U.S. (+17%) remained a pillar of strength, while a strongly rising dollar in the latter part of the period detracted from investors' returns in most non-U.S. markets. Canada (+5%) notched broad gains outside of its energy and materials sectors, as did Asia-Pacific ex Japan (+4%), led by investor enthusiasm for companies in India. The U.K., Europe and Japan, meanwhile, all underperformed. Among sectors, health care (+24%) led the index, with a strong contribution from the pharmaceuticals, biotechnology & life sciences industry. Information technology (+21%) also outperformed. Conversely, materials (-4%) and energy (-1%) lagged the index due to a higher supply of and lower demand for commodities.
Comments from S. Joseph Wickwire II, Portfolio Manager of Fidelity Advisor® Global Commodity Stock Fund: For the year, the fund's Institutional Class shares returned -5.16%, underperforming the -4.55% return of the equity benchmark, the MSCI ACWI (All Country World Index) Commodity Producers Sector Capped Index, and the broader global equity market, as measured by the MSCI ACWI (All Country World Index) Index. Commodity stocks saw broadly positive and negative periods during the year. In August, we entered a period where concerns about China, Europe and the Middle East drove broader commodity prices down, and that negative sentiment persisted into period end. Versus the industry benchmark, the largest detractor was within the challenged coal industry, where it was costly to hang with Peabody Energy. Stock picking in aluminum, steel and energy-industry drillers also detracted. On the positive side, good stock picks in fertilizers, energy exploration & production, construction machinery were relative positives. The largest contribution came from fertilizers, especially overweightings in CF Industries Holdings and Potash Corporation of Saskatchewan.
The views expressed above reflect those of the portfolio manager(s) only through the end of the period as stated on the cover of this report and do not necessarily represent the views of Fidelity or any other person in the Fidelity organization. Any such views are subject to change at any time based upon market or other conditions and Fidelity disclaims any responsibility to update such views. These views may not be relied on as investment advice and, because investment decisions for a Fidelity fund are based on numerous factors, may not be relied on as an indication of trading intent on behalf of any Fidelity fund.
Annual Report
Shareholder Expense Example
As a shareholder of the Fund, you incur two types of costs: (1) transaction costs, including sales charges (loads) on purchase payments or redemption proceeds, redemption fees and (2) ongoing costs, including management fees, distribution and/or service (12b-1) fees and other Fund expenses. This Example is intended to help you understand your ongoing costs (in dollars) of investing in the Fund and to compare these costs with the ongoing costs of investing in other mutual funds.
The Example is based on an investment of $1,000 invested at the beginning of the period and held for the entire period (May 1, 2014 to October 31, 2014).
Actual Expenses
The first line of the accompanying table for each class of the Fund provides information about actual account values and actual expenses. You may use the information in this line, together with the amount you invested, to estimate the expenses that you paid over the period. Simply divide your account value by $1,000.00 (for example, an $8,600 account value divided by $1,000.00 = 8.6), then multiply the result by the number in the first line for a class of the Fund under the heading entitled "Expenses Paid During Period" to estimate the expenses you paid on your account during this period. A small balance maintenance fee of $12.00 that is charged once a year may apply for certain accounts with a value of less than $2,000. This fee is not included in the table below. If it was, the estimate of expenses you paid during the period would be higher, and your ending account value lower, by this amount. In addition, the Fund, as a shareholder in the underlying Fidelity Central Funds, will indirectly bear its pro-rata share of the fees and expenses incurred by the underlying Fidelity Central Funds. These fees and expenses are not included in the Fund's annualized expense ratio used to calculate the expense estimate in the table below.
Hypothetical Example for Comparison Purposes
The second line of the accompanying table for each class of the Fund provides information about hypothetical account values and hypothetical expenses based on a Class' actual expense ratio and an assumed rate of return of 5% per year before expenses, which is not the Class' actual return. The hypothetical account values and expenses may not be used to estimate the actual ending account balance or expenses you paid for the period. You may use this information to compare the ongoing costs of investing in the Fund and other funds. To do so, compare this 5% hypothetical example with the 5% hypothetical examples that appear in the shareholder reports of the other funds. A small balance maintenance fee of $12.00 that is charged once a year may apply for certain accounts with a value of less than $2,000. This fee is not included in the table below. If it was, the estimate of expenses you paid during the period would be higher, and your ending account value lower, by this amount. In addition, the Fund, as a shareholder in the underlying Fidelity Central Funds, will indirectly bear its pro-rata share of the fees and expenses incurred by the underlying Fidelity Central Funds. These fees and expenses are not included in the Fund's annualized expense ratio used to calculate the expense estimate in the table below.
Please note that the expenses shown in the table are meant to highlight your ongoing costs only and do not reflect any transaction costs. Therefore, the second line of the table is useful in comparing ongoing costs only, and will not help you determine the relative total costs of owning different funds. In addition, if these transactional costs were included, your costs would have been higher.
Annual Report
Shareholder Expense Example - continued
| Annualized
Expense Ratio B | Beginning
Account Value
May 1, 2014 | Ending
Account Value
October 31, 2014 | Expenses Paid
During Period*
May 1, 2014
to October 31, 2014 |
Class A | 1.33% | | | |
Actual | | $ 1,000.00 | $ 905.70 | $ 6.39 |
HypotheticalA | | $ 1,000.00 | $ 1,018.50 | $ 6.77 |
Class T | 1.60% | | | |
Actual | | $ 1,000.00 | $ 904.20 | $ 7.68 |
HypotheticalA | | $ 1,000.00 | $ 1,017.14 | $ 8.13 |
Class B | 2.09% | | | |
Actual | | $ 1,000.00 | $ 902.30 | $ 10.02 |
HypotheticalA | | $ 1,000.00 | $ 1,014.67 | $ 10.61 |
Class C | 2.09% | | | |
Actual | | $ 1,000.00 | $ 901.90 | $ 10.02 |
HypotheticalA | | $ 1,000.00 | $ 1,014.67 | $ 10.61 |
Global Commodity Stock | 1.10% | | | |
Actual | | $ 1,000.00 | $ 906.70 | $ 5.29 |
HypotheticalA | | $ 1,000.00 | $ 1,019.66 | $ 5.60 |
Institutional Class | 1.05% | | | |
Actual | | $ 1,000.00 | $ 906.70 | $ 5.05 |
HypotheticalA | | $ 1,000.00 | $ 1,019.91 | $ 5.35 |
A 5% return per year before expenses
B Annualized expense ratio reflects expenses net of applicable fee waivers.
* Expenses are equal to each Class' annualized expense ratio, multiplied by the average account value over the period, multiplied by 184/365 (to reflect the one-half year period).
Annual Report
Investment Changes (Unaudited)
Top Ten Stocks as of October 31, 2014 |
| % of fund's
net assets | % of fund's net assets
6 months ago |
Monsanto Co. | 7.4 | 7.4 |
Potash Corp. of Saskatchewan, Inc. | 6.1 | 3.4 |
BHP Billiton PLC | 6.0 | 7.0 |
Syngenta AG (Switzerland) | 3.6 | 4.0 |
Rio Tinto PLC | 3.3 | 3.6 |
Chevron Corp. | 3.3 | 3.2 |
Anadarko Petroleum Corp. | 3.3 | 2.4 |
Archer Daniels Midland Co. | 2.9 | 3.0 |
CF Industries Holdings, Inc. | 2.9 | 1.8 |
EOG Resources, Inc. | 2.6 | 1.1 |
| 41.4 | |
Top Sectors (% of fund's net assets) |
As of October 31, 2014 |
 | Agriculture 36.9% | |
 | Energy 30.0% | |
 | Metals 29.2% | |
 | Other 3.3% | |
 | Short-Term
Investments and
Net Other Assets 0.6% | |

As of April 30, 2014 |
| Agriculture 33.1% | |
| Energy 32.2% | |
| Metals 31.3% | |
| Other 2.6% | |
| Short-Term
Investments and
Net Other Assets 0.8% | |

Annual Report
Investments October 31, 2014
Showing Percentage of Net Assets
Common Stocks - 97.4% |
| Shares | | Value |
CHEMICALS - 27.7% |
Commodity Chemicals - 0.1% |
Cabot Corp. | 7,700 | | $ 357,511 |
Westlake Chemical Corp. | 500 | | 35,275 |
| | 392,786 |
Diversified Chemicals - 0.6% |
Eastman Chemical Co. | 6,800 | | 549,304 |
FMC Corp. | 11,300 | | 648,055 |
Huntsman Corp. | 27,700 | | 675,880 |
| | 1,873,239 |
Fertilizers & Agricultural Chemicals - 27.0% |
Agrium, Inc. | 70,500 | | 6,897,684 |
CF Industries Holdings, Inc. | 35,772 | | 9,300,720 |
China BlueChemical Ltd. (H Shares) | 966,000 | | 343,038 |
Intrepid Potash, Inc. (a)(d) | 240,700 | | 3,237,415 |
K&S AG | 21,300 | | 594,299 |
Monsanto Co. | 211,200 | | 24,296,448 |
Potash Corp. of Saskatchewan, Inc. (d) | 580,400 | | 19,811,000 |
Syngenta AG (Switzerland) | 38,487 | | 11,902,397 |
The Mosaic Co. | 171,159 | | 7,584,055 |
Uralkali OJSC GDR (Reg. S) | 96,100 | | 1,717,307 |
Yara International ASA | 57,300 | | 2,630,977 |
| | 88,315,340 |
TOTAL CHEMICALS | | 90,581,365 |
CONSTRUCTION & ENGINEERING - 0.2% |
Construction & Engineering - 0.2% |
Chiyoda Corp. | 34,000 | | 350,262 |
Jacobs Engineering Group, Inc. (a) | 7,500 | | 355,875 |
| | 706,137 |
CONTAINERS & PACKAGING - 1.2% |
Paper Packaging - 1.2% |
Rock-Tenn Co. Class A | 74,200 | | 3,795,330 |
ELECTRICAL EQUIPMENT - 0.4% |
Electrical Components & Equipment - 0.3% |
OSRAM Licht AG (a) | 22,545 | | 789,933 |
Common Stocks - continued |
| Shares | | Value |
ELECTRICAL EQUIPMENT - CONTINUED |
Heavy Electrical Equipment - 0.1% |
Vestas Wind Systems A/S (a) | 13,600 | | $ 455,203 |
TOTAL ELECTRICAL EQUIPMENT | | 1,245,136 |
ENERGY EQUIPMENT & SERVICES - 0.9% |
Oil & Gas Drilling - 0.4% |
Ocean Rig UDW, Inc. (United States) | 21,947 | | 301,771 |
Odfjell Drilling A/S | 112,932 | | 333,190 |
Vantage Drilling Co. (a) | 634,982 | | 614,345 |
| | 1,249,306 |
Oil & Gas Equipment & Services - 0.5% |
Dril-Quip, Inc. (a) | 3,326 | | 299,174 |
Ezion Holdings Ltd. | 288,000 | | 339,146 |
Halliburton Co. | 12,100 | | 667,194 |
SBM Offshore NV (a)(d) | 43,200 | | 540,332 |
| | 1,845,846 |
TOTAL ENERGY EQUIPMENT & SERVICES | | 3,095,152 |
FOOD PRODUCTS - 5.7% |
Agricultural Products - 5.7% |
Archer Daniels Midland Co. | 204,700 | | 9,620,900 |
Bunge Ltd. | 65,200 | | 5,779,980 |
China Agri-Industries Holdings Ltd. | 930,300 | | 355,415 |
First Resources Ltd. | 911,000 | | 1,475,898 |
Golden Agri-Resources Ltd. | 2,756,000 | | 1,116,874 |
SLC Agricola SA | 47,800 | | 325,817 |
| | 18,674,884 |
INDEPENDENT POWER PRODUCERS & ENERGY TRADERS - 0.2% |
Independent Power Producers & Energy Traders - 0.2% |
Dynegy, Inc. (a) | 23,200 | | 707,600 |
MACHINERY - 0.8% |
Agricultural & Farm Machinery - 0.6% |
AGCO Corp. | 10,700 | | 474,117 |
Deere & Co. | 19,400 | | 1,659,476 |
| | 2,133,593 |
Common Stocks - continued |
| Shares | | Value |
MACHINERY - CONTINUED |
Construction Machinery & Heavy Trucks - 0.2% |
Cummins, Inc. | 2,300 | | $ 336,214 |
Manitowoc Co., Inc. | 12,000 | | 250,080 |
| | 586,294 |
TOTAL MACHINERY | | 2,719,887 |
METALS & MINING - 27.6% |
Aluminum - 0.2% |
Alcoa, Inc. | 20,000 | | 335,200 |
Constellium NV (a) | 15,600 | | 315,900 |
| | 651,100 |
Diversified Metals & Mining - 17.3% |
Anglo American PLC (United Kingdom) | 235,151 | | 4,964,871 |
BHP Billiton PLC | 758,164 | | 19,588,385 |
First Quantum Minerals Ltd. | 179,724 | | 2,710,889 |
Freeport-McMoRan, Inc. | 172,000 | | 4,902,000 |
Glencore Xstrata PLC | 1,455,999 | | 7,450,988 |
Grupo Mexico SA de CV Series B | 416,211 | | 1,430,100 |
Ivanhoe Mines Ltd. (a) | 709,500 | | 535,092 |
Ivanhoe Mines Ltd. Class A warrants 12/10/15 (a)(e) | 422,500 | | 18,744 |
Norilsk Nickel OJSC sponsored ADR | 80,000 | | 1,495,200 |
Rio Tinto PLC | 229,587 | | 10,924,079 |
Sesa Sterlite Ltd. | 200,897 | | 838,196 |
Sumitomo Metal Mining Co. Ltd. | 45,000 | | 624,264 |
Teck Resources Ltd. Class B (sub. vtg.) | 74,800 | | 1,182,013 |
| | 56,664,821 |
Gold - 5.6% |
Agnico Eagle Mines Ltd. (Canada) | 36,500 | | 860,157 |
AngloGold Ashanti Ltd. sponsored ADR (a) | 49,300 | | 407,711 |
Argonaut Gold, Inc. (a) | 201,500 | | 429,085 |
B2Gold Corp. (a) | 1,476,180 | | 2,462,374 |
Barrick Gold Corp. | 151,800 | | 1,802,124 |
Compania de Minas Buenaventura SA sponsored ADR | 30,700 | | 282,440 |
Continental Gold Ltd. (a) | 184,500 | | 309,396 |
Detour Gold Corp. (a) | 50,100 | | 293,385 |
Eldorado Gold Corp. | 201,850 | | 1,103,231 |
Franco-Nevada Corp. | 22,900 | | 1,072,006 |
Gold Fields Ltd. sponsored ADR | 88,200 | | 281,358 |
Goldcorp, Inc. | 125,610 | | 2,357,173 |
Kinross Gold Corp. (a) | 130,405 | | 278,848 |
Common Stocks - continued |
| Shares | | Value |
METALS & MINING - CONTINUED |
Gold - continued |
New Gold, Inc. (a) | 110,500 | | $ 400,998 |
Newcrest Mining Ltd. (a) | 109,024 | | 906,690 |
Newmont Mining Corp. | 72,800 | | 1,365,728 |
Premier Gold Mines Ltd. (a) | 368,900 | | 592,440 |
Pretium Resources, Inc. (a) | 70,800 | | 324,145 |
Randgold Resources Ltd. sponsored ADR | 22,600 | | 1,315,546 |
Royal Gold, Inc. | 10,700 | | 611,505 |
Torex Gold Resources, Inc. (a) | 290,500 | | 309,303 |
Yamana Gold, Inc. | 121,700 | | 484,835 |
| | 18,250,478 |
Precious Metals & Minerals - 0.4% |
Aquarius Platinum Ltd. (United Kingdom) (a) | 1,164,300 | | 307,318 |
Fresnillo PLC | 37,100 | | 413,958 |
Impala Platinum Holdings Ltd. (a) | 44,000 | | 320,294 |
Tahoe Resources, Inc. (a) | 18,053 | | 312,830 |
| | 1,354,400 |
Silver - 0.4% |
Silver Wheaton Corp. | 74,200 | | 1,289,719 |
Steel - 3.7% |
ArcelorMittal SA Class A unit (d) | 160,100 | | 2,106,916 |
Fortescue Metals Group Ltd. (d) | 228,996 | | 706,759 |
Hyundai Steel Co. | 8,527 | | 540,455 |
JFE Holdings, Inc. | 67,600 | | 1,341,182 |
Maanshan Iron & Steel Ltd. (H Shares) (a) | 1,470,000 | | 383,297 |
Nippon Steel & Sumitomo Metal Corp. | 994,000 | | 2,623,013 |
POSCO | 9,852 | | 2,830,487 |
Steel Dynamics, Inc. | 27,400 | | 630,474 |
Tata Steel Ltd. | 39,717 | | 317,003 |
Thyssenkrupp AG (a) | 26,400 | | 634,370 |
| | 12,113,956 |
TOTAL METALS & MINING | | 90,324,474 |
OIL, GAS & CONSUMABLE FUELS - 28.7% |
Coal & Consumable Fuels - 1.5% |
Cameco Corp. | 19,600 | | 340,333 |
China Shenhua Energy Co. Ltd. (H Shares) | 160,500 | | 452,375 |
Cloud Peak Energy, Inc. (a) | 28,700 | | 343,539 |
Common Stocks - continued |
| Shares | | Value |
OIL, GAS & CONSUMABLE FUELS - CONTINUED |
Coal & Consumable Fuels - continued |
CONSOL Energy, Inc. | 12,300 | | $ 452,640 |
Peabody Energy Corp. (d) | 327,798 | | 3,418,933 |
| | 5,007,820 |
Integrated Oil & Gas - 12.6% |
BG Group PLC | 234,950 | | 3,915,684 |
Cenovus Energy, Inc. | 36,700 | | 908,179 |
Chevron Corp. | 90,100 | | 10,807,495 |
Exxon Mobil Corp. | 33,261 | | 3,216,671 |
Gazprom OAO sponsored ADR | 131,100 | | 864,998 |
Hess Corp. | 12,800 | | 1,085,568 |
Imperial Oil Ltd. | 9,600 | | 461,921 |
LUKOIL Oil Co. sponsored ADR (United Kingdom) | 6,600 | | 324,060 |
Occidental Petroleum Corp. | 31,200 | | 2,774,616 |
PetroChina Co. Ltd. (H Shares) | 1,040,000 | | 1,302,022 |
Royal Dutch Shell PLC Class A (United Kingdom) | 32,250 | | 1,152,027 |
Suncor Energy, Inc. | 224,732 | | 7,979,925 |
Total SA | 96,400 | | 5,755,399 |
YPF SA Class D sponsored ADR | 20,600 | | 724,502 |
| | 41,273,067 |
Oil & Gas Exploration & Production - 14.4% |
Anadarko Petroleum Corp. | 117,500 | | 10,784,150 |
Apache Corp. | 12,700 | | 980,440 |
Bonanza Creek Energy, Inc. (a) | 7,900 | | 357,396 |
Cabot Oil & Gas Corp. | 112,100 | | 3,486,310 |
Cairn Energy PLC (a) | 135,199 | | 313,819 |
Canadian Natural Resources Ltd. | 84,400 | | 2,945,257 |
Chesapeake Energy Corp. | 23,000 | | 510,140 |
Cimarex Energy Co. | 16,100 | | 1,830,087 |
Cobalt International Energy, Inc. (a) | 50,400 | | 590,184 |
Concho Resources, Inc. (a) | 7,300 | | 795,919 |
ConocoPhillips Co. | 56,300 | | 4,062,045 |
Continental Resources, Inc. (a) | 6,600 | | 372,042 |
Denbury Resources, Inc. | 27,800 | | 344,720 |
Devon Energy Corp. | 18,300 | | 1,098,000 |
Encana Corp. | 27,600 | | 514,263 |
Energen Corp. | 4,600 | | 311,420 |
EOG Resources, Inc. | 88,300 | | 8,392,915 |
EQT Corp. | 7,400 | | 695,896 |
Kosmos Energy Ltd. (a) | 73,100 | | 682,023 |
Marathon Oil Corp. | 30,200 | | 1,069,080 |
Common Stocks - continued |
| Shares | | Value |
OIL, GAS & CONSUMABLE FUELS - CONTINUED |
Oil & Gas Exploration & Production - continued |
Murphy Oil Corp. | 9,200 | | $ 491,188 |
Noble Energy, Inc. | 24,000 | | 1,383,120 |
NOVATEK OAO GDR (Reg. S) | 3,100 | | 332,940 |
Ophir Energy PLC (a) | 174,800 | | 518,150 |
Pioneer Natural Resources Co. | 6,760 | | 1,278,046 |
QEP Resources, Inc. | 13,400 | | 335,938 |
Range Resources Corp. | 9,000 | | 615,600 |
Southwestern Energy Co. (a) | 17,400 | | 565,674 |
Talisman Energy, Inc. | 53,000 | | 338,113 |
Tullow Oil PLC | 97,100 | | 754,597 |
Whiting Petroleum Corp. (a) | 5,800 | | 355,192 |
| | 47,104,664 |
Oil & Gas Refining & Marketing - 0.1% |
Valero Energy Corp. | 7,700 | | 385,693 |
Oil & Gas Storage & Transport - 0.1% |
Golar LNG Ltd. | 6,200 | | 347,882 |
TOTAL OIL, GAS & CONSUMABLE FUELS | | 94,119,126 |
PAPER & FOREST PRODUCTS - 3.6% |
Paper Products - 3.6% |
Empresas CMPC SA | 418,880 | | 1,022,777 |
International Paper Co. | 156,300 | | 7,911,906 |
Stora Enso Oyj (R Shares) | 137,900 | | 1,136,222 |
UPM-Kymmene Corp. | 99,600 | | 1,575,149 |
| | 11,646,054 |
SPECIALTY RETAIL - 0.3% |
Specialty Stores - 0.3% |
Tsutsumi Jewelry Co. Ltd. | 41,900 | | 1,030,593 |
TRADING COMPANIES & DISTRIBUTORS - 0.1% |
Trading Companies & Distributors - 0.1% |
Noble Group Ltd. | 499,000 | | 464,498 |
TOTAL COMMON STOCKS (Cost $379,587,457) |
319,110,236
|
Nonconvertible Preferred Stocks - 2.0% |
| Shares | | Value |
METALS & MINING - 1.7% |
Steel - 1.7% |
Bradespar SA (PN) | 54,600 | | $ 368,862 |
Gerdau SA sponsored ADR | 258,500 | | 1,171,005 |
Vale SA (PN-A) sponsored ADR | 430,000 | | 3,766,800 |
| | 5,306,667 |
OIL, GAS & CONSUMABLE FUELS - 0.3% |
Integrated Oil & Gas - 0.3% |
Petroleo Brasileiro SA - Petrobras (PN) sponsored (non-vtg.) | 85,100 | | 1,040,773 |
TOTAL NONCONVERTIBLE PREFERRED STOCKS (Cost $13,672,822) |
6,347,440
|
Money Market Funds - 4.7% |
| | | |
Fidelity Securities Lending Cash Central Fund, 0.11% (b)(c)
(Cost $15,443,448) | 15,443,448 | |
15,443,448
|
TOTAL INVESTMENT PORTFOLIO - 104.1% (Cost $408,703,727) | | 340,901,124 |
NET OTHER ASSETS (LIABILITIES) - (4.1)% | | (13,281,248) |
NET ASSETS - 100% | $ 327,619,876 |
Legend |
(a) Non-income producing |
(b) Affiliated fund that is generally available only to investment companies and other accounts managed by Fidelity Investments. The rate quoted is the annualized seven-day yield of the fund at period end. A complete unaudited listing of the fund's holdings as of its most recent quarter end is available upon request. In addition, each Fidelity Central Fund's financial statements, which are not covered by the Fund's Report of Independent Registered Public Accounting Firm, are available on the SEC's website or upon request. |
(c) Investment made with cash collateral received from securities on loan. |
(d) Security or a portion of the security is on loan at period end. |
(e) Security exempt from registration under Rule 144A of the Securities Act of 1933. These securities may be resold in transactions exempt from registration, normally to qualified institutional buyers. At the end of the period, the value of these securities amounted to $18,744 or 0.0% of net assets. |
Affiliated Central Funds |
Information regarding fiscal year to date income earned by the Fund from investments in Fidelity Central Funds is as follows: |
Fund | Income earned |
Fidelity Cash Central Fund | $ 539 |
Fidelity Securities Lending Cash Central Fund | 180,323 |
Total | $ 180,862 |
Other Information |
The following is a summary of the inputs used, as of October 31, 2014, involving the Fund's assets and liabilities carried at fair value. The inputs or methodology used for valuing securities may not be an indication of the risk associated with investing in those securities. For more information on valuation inputs, and their aggregation into the levels used in the table below, please refer to the Investment Valuation section in the accompanying Notes to Financial Statements. |
Valuation Inputs at Reporting Date: |
Description | Total | Level 1 | Level 2 | Level 3 |
Investments in Securities: | | | | |
Common Stocks | $ 319,110,236 | $ 243,106,382 | $ 76,003,854 | $ - |
Nonconvertible Preferred Stocks | 6,347,440 | 6,347,440 | - | - |
Money Market Funds | 15,443,448 | 15,443,448 | - | - |
Total Investments in Securities: | $ 340,901,124 | $ 264,897,270 | $ 76,003,854 | $ - |
The following is a summary of transfers between Level 1 and Level 2 for the period ended October 31, 2014. Transfers are assumed to have occurred at the beginning of the period, and are primarily attributable to the valuation techniques used for foreign equity securities, as discussed in the accompanying Notes to Financial Statements: |
Transfers | Total |
Level 1 to Level 2 | $ 17,170,440 |
Level 2 to Level 1 | $ 0 |
Distribution of investments by country or territory of incorporation, as a percentage of total net assets, is as follows (Unaudited): |
United States of America | 44.4% |
Canada | 18.1% |
United Kingdom | 13.0% |
Switzerland | 3.6% |
Bailiwick of Jersey | 2.7% |
Bermuda | 2.5% |
Brazil | 2.1% |
Japan | 1.8% |
France | 1.8% |
Russia | 1.5% |
Korea (South) | 1.1% |
Others (Individually Less Than 1%) | 7.4% |
| 100.0% |
See accompanying notes which are an integral part of the financial statements.
Annual Report
Statement of Assets and Liabilities
| October 31, 2014 |
| | |
Assets | | |
Investment in securities, at value (including securities loaned of $15,099,435) - See accompanying schedule: Unaffiliated issuers (cost $393,260,279) | $ 325,457,676 | |
Fidelity Central Funds (cost $15,443,448) | 15,443,448 | |
Total Investments (cost $408,703,727) | | $ 340,901,124 |
Receivable for investments sold | | 4,867,696 |
Receivable for fund shares sold | | 312,550 |
Dividends receivable | | 736,381 |
Distributions receivable from Fidelity Central Funds | | 15,237 |
Prepaid expenses | | 567 |
Other receivables | | 5,797 |
Total assets | | 346,839,352 |
| | |
Liabilities | | |
Payable to custodian bank | $ 116,463 | |
Payable for investments purchased | 2,758,995 | |
Payable for fund shares redeemed | 518,466 | |
Accrued management fee | 192,660 | |
Distribution and service plan fees payable | 31,254 | |
Other affiliated payables | 104,668 | |
Other payables and accrued expenses | 53,522 | |
Collateral on securities loaned, at value | 15,443,448 | |
Total liabilities | | 19,219,476 |
| | |
Net Assets | | $ 327,619,876 |
Net Assets consist of: | | |
Paid in capital | | $ 437,681,967 |
Undistributed net investment income | | 3,567,856 |
Accumulated undistributed net realized gain (loss) on investments and foreign currency transactions | | (45,809,703) |
Net unrealized appreciation (depreciation) on investments and assets and liabilities in foreign currencies | | (67,820,244) |
Net Assets | | $ 327,619,876 |
See accompanying notes which are an integral part of the financial statements.
Annual Report
Financial Statements - continued
Statement of Assets and Liabilities - continued
| October 31, 2014 |
| | |
Calculation of Maximum Offering Price Class A:
Net Asset Value and redemption price per share ($51,586,180 ÷ 3,893,125 shares) | | $ 13.25 |
| | |
Maximum offering price per share (100/94.25 of $13.25) | | $ 14.06 |
Class T:
Net Asset Value and redemption price per share ($9,866,622 ÷ 746,868 shares) | | $ 13.21 |
| | |
Maximum offering price per share (100/96.50 of $13.21) | | $ 13.69 |
Class B:
Net Asset Value and offering price per share ($1,584,114 ÷ 120,777 shares)A | | $ 13.12 |
| | |
Class C:
Net Asset Value and offering price per share ($17,658,820 ÷ 1,352,048 shares)A | | $ 13.06 |
| | |
Global Commodity Stock:
Net Asset Value, offering price and redemption price per share ($223,083,774 ÷ 16,762,098 shares) | | $ 13.31 |
| | |
Institutional Class:
Net Asset Value, offering price and redemption price per share ($23,840,366 ÷ 1,790,808 shares) | | $ 13.31 |
A Redemption price per share is equal to net asset value less any applicable contingent deferred sales charge.
See accompanying notes which are an integral part of the financial statements.
Annual Report
Statement of Operations
| Year ended October 31, 2014 |
| | |
Investment Income | | |
Dividends | | $ 9,555,544 |
Income from Fidelity Central Funds | | 180,862 |
Income before foreign taxes withheld | | 9,736,406 |
Less foreign taxes withheld | | (590,900) |
Total income | | 9,145,506 |
| | |
Expenses | | |
Management fee | $ 2,673,662 | |
Transfer agent fees | 1,134,113 | |
Distribution and service plan fees | 447,025 | |
Accounting and security lending fees | 201,778 | |
Custodian fees and expenses | 55,282 | |
Independent trustees' compensation | 1,596 | |
Registration fees | 87,169 | |
Audit | 56,364 | |
Legal | 1,405 | |
Miscellaneous | 3,267 | |
Total expenses before reductions | 4,661,661 | |
Expense reductions | (11,330) | 4,650,331 |
Net investment income (loss) | | 4,495,175 |
Realized and Unrealized Gain (Loss) Net realized gain (loss) on: | | |
Investment securities: | | |
Unaffiliated issuers | (3,578,242) | |
Foreign currency transactions | (103,036) | |
Total net realized gain (loss) | | (3,681,278) |
Change in net unrealized appreciation (depreciation) on: Investment securities | (18,616,435) | |
Assets and liabilities in foreign currencies | (28,605) | |
Total change in net unrealized appreciation (depreciation) | | (18,645,040) |
Net gain (loss) | | (22,326,318) |
Net increase (decrease) in net assets resulting from operations | | $ (17,831,143) |
See accompanying notes which are an integral part of the financial statements.
Annual Report
Financial Statements - continued
Statement of Changes in Net Assets
| Year ended
October 31,
2014 | Year ended
October 31,
2013 |
Increase (Decrease) in Net Assets | | |
Operations | | |
Net investment income (loss) | $ 4,495,175 | $ 6,058,817 |
Net realized gain (loss) | (3,681,278) | (772,445) |
Change in net unrealized appreciation (depreciation) | (18,645,040) | (21,248,344) |
Net increase (decrease) in net assets resulting
from operations | (17,831,143) | (15,961,972) |
Distributions to shareholders from net investment income | (4,765,250) | (5,697,049) |
Distributions to shareholders from net realized gain | (367,709) | - |
Total distributions | (5,132,959) | (5,697,049) |
Share transactions - net increase (decrease) | (64,489,864) | (152,423,209) |
Redemption fees | 7,328 | 18,199 |
Total increase (decrease) in net assets | (87,446,638) | (174,064,031) |
| | |
Net Assets | | |
Beginning of period | 415,066,514 | 589,130,545 |
End of period (including undistributed net investment income of $3,567,856 and undistributed net investment income of $4,309,466, respectively) | $ 327,619,876 | $ 415,066,514 |
See accompanying notes which are an integral part of the financial statements.
Annual Report
Financial Highlights - Class A
Years ended October 31, | 2014 | 2013 | 2012 | 2011 | 2010 |
Selected Per-Share Data | | | | | |
Net asset value, beginning of period | $ 14.17 | $ 14.59 | $ 15.14 | $ 15.60 | $ 13.29 |
Income from Investment Operations | | | | | |
Net investment income (loss) C | .15 | .16 | .11 | .12 | .19 F |
Net realized and unrealized gain (loss) | (.91) | (.45) | (.59) | (.38) | 2.20 |
Total from investment operations | (.76) | (.29) | (.48) | (.26) | 2.39 |
Distributions from net investment income | (.15) | (.13) | (.05) | (.13) | - H |
Distributions from net realized gain | (.01) | - | (.01) | (.06) | (.08) |
Total distributions | (.16) | (.13) | (.07) J | (.20) I | (.08) |
Redemption fees added to paid in capital C, H | - | - | - | - | - |
Net asset value, end of period | $ 13.25 | $ 14.17 | $ 14.59 | $ 15.14 | $ 15.60 |
Total ReturnA, B | (5.41)% | (2.00)% | (3.19)% | (1.80)% | 18.04% |
Ratios to Average Net Assets D, G | | | | | |
Expenses before reductions | 1.35% | 1.36% | 1.34% | 1.32% | 1.37% |
Expenses net of fee waivers, if any | 1.35% | 1.35% | 1.34% | 1.32% | 1.37% |
Expenses net of all reductions | 1.35% | 1.34% | 1.33% | 1.31% | 1.36% |
Net investment income (loss) | 1.05% | 1.12% | .80% | .71% | 1.35% F |
Supplemental Data | | | | | |
Net assets, end of period (000 omitted) | $ 51,586 | $ 71,293 | $ 99,694 | $ 127,979 | $ 60,370 |
Portfolio turnover rateE | 75% | 65% | 91% | 71% | 54% |
A Total returns would have been lower if certain expenses had not been reduced during the applicable periods shown.
B Total returns do not include the effect of the sales charges.
C Calculated based on average shares outstanding during the period.
D Fees and expenses of any underlying Fidelity Central Funds are not included in the Fund's expense ratio. The Fund indirectly bears its proportionate share of the expenses of any underlying Fidelity Central Funds.
E Amount does not include the portfolio activity of any underlying Fidelity Central Funds.
F Investment income per share reflects a large, non-recurring dividend which amounted to $.13 per share. Excluding this non-recurring dividend, the ratio of net investment income (loss) to average net assets would have been .42%.
G Expense ratios reflect operating expenses of the class. Expenses before reductions do not reflect amounts reimbursed by the investment adviser or reductions from brokerage service arrangements or reductions from other expense offset arrangements and do not represent the amount paid by the class during periods when reimbursements or reductions occur. Expenses net of fee waivers reflect expenses after reimbursement by the investment adviser but prior to reductions from brokerage service arrangements or other expense offset arrangements. Expenses net of all reductions represent the net expenses paid by the class.
H Amount represents less than $.01 per share.
I Total distributions of $.20 per share is comprised of distributions from net investment income of $.133 and distributions from net realized gain of $.062 per share.
J Total distributions of $.07 per share is comprised of distributions from net investment income of $.052 and distributions from net realized gain of $.014 per share.
See accompanying notes which are an integral part of the financial statements.
Annual Report
Financial Highlights - Class T
Years ended October 31, | 2014 | 2013 | 2012 | 2011 | 2010 |
Selected Per-Share Data | | | | | |
Net asset value, beginning of period | $ 14.13 | $ 14.54 | $ 15.08 | $ 15.55 | $ 13.27 |
Income from Investment Operations | | | | | |
Net investment income (loss) C | .11 | .12 | .08 | .07 | .16 F |
Net realized and unrealized gain (loss) | (.90) | (.45) | (.60) | (.38) | 2.19 |
Total from investment operations | (.79) | (.33) | (.52) | (.31) | 2.35 |
Distributions from net investment income | (.11) | (.08) | (.01) | (.10) | - |
Distributions from net realized gain | (.01) | - | (.01) | (.06) | (.07) |
Total distributions | (.13) I | (.08) | (.02) | (.16) | (.07) |
Redemption fees added to paid in capital C, H | - | - | - | - | - |
Net asset value, end of period | $ 13.21 | $ 14.13 | $ 14.54 | $ 15.08 | $ 15.55 |
Total ReturnA, B | (5.65)% | (2.26)% | (3.43)% | (2.09)% | 17.73% |
Ratios to Average Net Assets D, G | | | | | |
Expenses before reductions | 1.62% | 1.62% | 1.61% | 1.60% | 1.63% |
Expenses net of fee waivers, if any | 1.62% | 1.61% | 1.61% | 1.60% | 1.63% |
Expenses net of all reductions | 1.62% | 1.60% | 1.60% | 1.59% | 1.61% |
Net investment income (loss) | .78% | .86% | .53% | .43% | 1.10% F |
Supplemental Data | | | | | |
Net assets, end of period (000 omitted) | $ 9,867 | $ 12,551 | $ 16,692 | $ 20,831 | $ 11,762 |
Portfolio turnover rateE | 75% | 65% | 91% | 71% | 54% |
A Total returns would have been lower if certain expenses had not been reduced during the applicable periods shown.
B Total returns do not include the effect of the sales charges.
C Calculated based on average shares outstanding during the period.
D Fees and expenses of any underlying Fidelity Central Funds are not included in the Fund's expense ratio. The Fund indirectly bears its proportionate share of the expenses of any underlying Fidelity Central Funds.
E Amount does not include the portfolio activity of any underlying Fidelity Central Funds.
F Investment income per share reflects a large, non-recurring dividend which amounted to $.13 per share. Excluding this non-recurring dividend, the ratio of net investment income (loss) to average net assets would have been .17%.
G Expense ratios reflect operating expenses of the class. Expenses before reductions do not reflect amounts reimbursed by the investment adviser or reductions from brokerage service arrangements or reductions from other expense offset arrangements and do not represent the amount paid by the class during periods when reimbursements or reductions occur. Expenses net of fee waivers reflect expenses after reimbursement by the investment adviser but prior to reductions from brokerage service arrangements or other expense offset arrangements. Expenses net of all reductions represent the net expenses paid by the class.
H Amount represents less than $.01 per share.
I Total distributions of $.13 per share is comprised of distributions from net investment income of $.113 and distributions from net realized gain of $.013 per share.
See accompanying notes which are an integral part of the financial statements.
Annual Report
Financial Highlights - Class B
Years ended October 31, | 2014 | 2013 | 2012 | 2011 | 2010 |
Selected Per-Share Data | | | | | |
Net asset value, beginning of period | $ 14.01 | $ 14.41 | $ 15.00 | $ 15.46 | $ 13.22 |
Income from Investment Operations | | | | | |
Net investment income (loss) C | .04 | .05 | - H | (.01) | .08 F |
Net realized and unrealized gain (loss) | (.89) | (.45) | (.59) | (.39) | 2.20 |
Total from investment operations | (.85) | (.40) | (.59) | (.40) | 2.28 |
Distributions from net investment income | (.03) | - H | - | - | - |
Distributions from net realized gain | (.01) | - | - | (.06) | (.04) |
Total distributions | (.04) | - H | - | (.06) | (.04) |
Redemption fees added to paid in capital C, H | - | - | - | - | - |
Net asset value, end of period | $ 13.12 | $ 14.01 | $ 14.41 | $ 15.00 | $ 15.46 |
Total ReturnA, B | (6.06)% | (2.75)% | (3.93)% | (2.62)% | 17.23% |
Ratios to Average Net Assets D, G | | | | | |
Expenses before reductions | 2.11% | 2.11% | 2.10% | 2.11% | 2.16% |
Expenses net of fee waivers, if any | 2.11% | 2.11% | 2.10% | 2.11% | 2.16% |
Expenses net of all reductions | 2.11% | 2.10% | 2.10% | 2.10% | 2.15% |
Net investment income (loss) | .29% | .36% | .03% | (.09)% | .56% F |
Supplemental Data | | | | | |
Net assets, end of period (000 omitted) | $ 1,584 | $ 2,303 | $ 3,097 | $ 4,324 | $ 4,348 |
Portfolio turnover rateE | 75% | 65% | 91% | 71% | 54% |
A Total returns would have been lower if certain expenses had not been reduced during the applicable periods shown.
B Total returns do not include the effect of the contingent deferred sales charge.
C Calculated based on average shares outstanding during the period.
D Fees and expenses of any underlying Fidelity Central Funds are not included in the Fund's expense ratio. The Fund indirectly bears its proportionate share of the expenses of any underlying Fidelity Central Funds.
E Amount does not include the portfolio activity of any underlying Fidelity Central Funds.
F Investment income per share reflects a large, non-recurring dividend which amounted to $.13 per share. Excluding this non-recurring dividend, the ratio of net investment income (loss) to average net assets would have been (.37)%.
G Expense ratios reflect operating expenses of the class. Expenses before reductions do not reflect amounts reimbursed by the investment adviser or reductions from brokerage service arrangements or reductions from other expense offset arrangements and do not represent the amount paid by the class during periods when reimbursements or reductions occur. Expenses net of fee waivers reflect expenses after reimbursement by the investment adviser but prior to reductions from brokerage service arrangements or other expense offset arrangements. Expenses net of all reductions represent the net expenses paid by the class.
H Amount represents less than $.01 per share.
See accompanying notes which are an integral part of the financial statements.
Annual Report
Financial Highlights - Class C
Years ended October 31, | 2014 | 2013 | 2012 | 2011 | 2010 |
Selected Per-Share Data | | | | | |
Net asset value, beginning of period | $ 13.96 | $ 14.37 | $ 14.95 | $ 15.45 | $ 13.22 |
Income from Investment Operations | | | | | |
Net investment income (loss) C | .04 | .05 | .01 | (.01) | .08 F |
Net realized and unrealized gain (loss) | (.89) | (.44) | (.59) | (.38) | 2.19 |
Total from investment operations | (.85) | (.39) | (.58) | (.39) | 2.27 |
Distributions from net investment income | (.03) | (.02) | - | (.05) | - |
Distributions from net realized gain | (.01) | - | - | (.06) | (.04) |
Total distributions | (.05) I | (.02) | - | (.11) | (.04) |
Redemption fees added to paid in capital C, H | - | - | - | - | - |
Net asset value, end of period | $ 13.06 | $ 13.96 | $ 14.37 | $ 14.95 | $ 15.45 |
Total ReturnA, B | (6.13)% | (2.75)% | (3.88)% | (2.58)% | 17.21% |
Ratios to Average Net Assets D, G | | | | | |
Expenses before reductions | 2.11% | 2.11% | 2.10% | 2.09% | 2.14% |
Expenses net of fee waivers, if any | 2.11% | 2.11% | 2.10% | 2.09% | 2.14% |
Expenses net of all reductions | 2.11% | 2.10% | 2.09% | 2.08% | 2.13% |
Net investment income (loss) | .29% | .36% | .03% | (.07)% | .58% F |
Supplemental Data | | | | | |
Net assets, end of period (000 omitted) | $ 17,659 | $ 23,830 | $ 31,865 | $ 37,185 | $ 14,338 |
Portfolio turnover rateE | 75% | 65% | 91% | 71% | 54% |
A Total returns would have been lower if certain expenses had not been reduced during the applicable periods shown.
B Total returns do not include the effect of the contingent deferred sales charge.
C Calculated based on average shares outstanding during the period.
D Fees and expenses of any underlying Fidelity Central Funds are not included in the Fund's expense ratio. The Fund indirectly bears its proportionate share of the expenses of any underlying Fidelity Central Funds.
E Amount does not include the portfolio activity of any underlying Fidelity Central Funds.
F Investment income per share reflects a large, non-recurring dividend which amounted to $.13 per share. Excluding this non-recurring dividend, the ratio of net investment income (loss) to average net assets would have been (.34)%.
G Expense ratios reflect operating expenses of the class. Expenses before reductions do not reflect amounts reimbursed by the investment adviser or reductions from brokerage service arrangements or reductions from other expense offset arrangements and do not represent the amount paid by the class during periods when reimbursements or reductions occur. Expenses net of fee waivers reflect expenses after reimbursement by the investment adviser but prior to reductions from brokerage service arrangements or other expense offset arrangements. Expenses net of all reductions represent the net expenses paid by the class.
H Amount represents less than $.01 per share.
I Total distributions of $.05 per share is comprised of distributions from net investment income of $.033 and distributions from net realized gain of $.013 per share.
See accompanying notes which are an integral part of the financial statements.
Annual Report
Financial Highlights - Global Commodity Stock
Years ended October 31, | 2014 | 2013 | 2012 | 2011 | 2010 |
Selected Per-Share Data | | | | | |
Net asset value, beginning of period | $ 14.24 | $ 14.66 | $ 15.21 | $ 15.66 | $ 13.31 |
Income from Investment Operations | | | | | |
Net investment income (loss) B | .19 | .19 | .15 | .16 | .23 E |
Net realized and unrealized gain (loss) | (.92) | (.45) | (.60) | (.39) | 2.21 |
Total from investment operations | (.73) | (.26) | (.45) | (.23) | 2.44 |
Distributions from net investment income | (.19) | (.16) | (.08) | (.16) | (.01) |
Distributions from net realized gain | (.01) | - | (.01) | (.06) | (.08) |
Total distributions | (.20) | (.16) | (.10) H | (.22) | (.09) |
Redemption fees added to paid in capital B, G | - | - | - | - | - |
Net asset value, end of period | $ 13.31 | $ 14.24 | $ 14.66 | $ 15.21 | $ 15.66 |
Total ReturnA | (5.16)% | (1.75)% | (2.96)% | (1.59)% | 18.38% |
Ratios to Average Net Assets C, F | | | | | |
Expenses before reductions | 1.11% | 1.11% | 1.10% | 1.08% | 1.10% |
Expenses net of fee waivers, if any | 1.11% | 1.11% | 1.10% | 1.08% | 1.10% |
Expenses net of all reductions | 1.11% | 1.09% | 1.09% | 1.07% | 1.09% |
Net investment income (loss) | 1.29% | 1.37% | 1.04% | .95% | 1.62% E |
Supplemental Data | | | | | |
Net assets, end of period (000 omitted) | $ 223,084 | $ 273,476 | $ 387,242 | $ 531,224 | $ 310,186 |
Portfolio turnover rateD | 75% | 65% | 91% | 71% | 54% |
A Total returns would have been lower if certain expenses had not been reduced during the applicable periods shown.
B Calculated based on average shares outstanding during the period.
C Fees and expenses of any underlying Fidelity Central Funds are not included in the Fund's expense ratio. The Fund indirectly bears its proportionate share of the expenses of any underlying Fidelity Central Funds.
D Amount does not include the portfolio activity of any underlying Fidelity Central Funds.
E Investment income per share reflects a large, non-recurring dividend which amounted to $.13 per share. Excluding this non-recurring dividend, the ratio of net investment income (loss) to average net assets would have been .69%.
F Expense ratios reflect operating expenses of the class. Expenses before reductions do not reflect amounts reimbursed by the investment adviser or reductions from brokerage service arrangements or reductions from other expense offset arrangements and do not represent the amount paid by the class during periods when reimbursements or reductions occur. Expenses net of fee waivers reflect expenses after reimbursement by the investment adviser but prior to reductions from brokerage service arrangements or other expense offset arrangements. Expenses net of all reductions represent the net expenses paid by the class.
G Amount represents less than $.01 per share.
H Total distributions of $.10 per share is comprised of distributions from net investment income of $.084 and distributions from net realized gain of $.014 per share.
See accompanying notes which are an integral part of the financial statements.
Annual Report
Financial Highlights - Institutional Class
Years ended October 31, | 2014 | 2013 | 2012 | 2011 | 2010 |
Selected Per-Share Data | | | | | |
Net asset value, beginning of period | $ 14.24 | $ 14.67 | $ 15.22 | $ 15.66 | $ 13.31 |
Income from Investment Operations | | | | | |
Net investment income (loss) B | .19 | .20 | .16 | .16 | .23 E |
Net realized and unrealized gain (loss) | (.92) | (.45) | (.60) | (.38) | 2.21 |
Total from investment operations | (.73) | (.25) | (.44) | (.22) | 2.44 |
Distributions from net investment income | (.19) | (.18) | (.09) | (.16) | (.01) |
Distributions from net realized gain | (.01) | - | (.01) | (.06) | (.08) |
Total distributions | (.20) | (.18) | (.11) H | (.22) | (.09) |
Redemption fees added to paid in capital B, G | - | - | - | - | - |
Net asset value, end of period | $ 13.31 | $ 14.24 | $ 14.67 | $ 15.22 | $ 15.66 |
Total ReturnA | (5.16)% | (1.71)% | (2.90)% | (1.50)% | 18.39% |
Ratios to Average Net Assets C, F | | | | | |
Expenses before reductions | 1.06% | 1.04% | 1.04% | 1.03% | 1.09% |
Expenses net of fee waivers, if any | 1.06% | 1.04% | 1.04% | 1.03% | 1.09% |
Expenses net of all reductions | 1.06% | 1.03% | 1.03% | 1.03% | 1.07% |
Net investment income (loss) | 1.34% | 1.43% | 1.10% | .99% | 1.64% E |
Supplemental Data | | | | | |
Net assets, end of period (000 omitted) | $ 23,840 | $ 31,613 | $ 50,540 | $ 58,925 | $ 35,739 |
Portfolio turnover rateD | 75% | 65% | 91% | 71% | 54% |
A Total returns would have been lower if certain expenses had not been reduced during the applicable periods shown.
B Calculated based on average shares outstanding during the period.
C Fees and expenses of any underlying Fidelity Central Funds are not included in the Fund's expense ratio. The Fund indirectly bears its proportionate share of the expenses of any underlying Fidelity Central Funds.
D Amount does not include the portfolio activity of any underlying Fidelity Central Funds.
E Investment income per share reflects a large, non-recurring dividend which amounted to $.13 per share. Excluding this non-recurring dividend, the ratio of net investment income (loss) to average net assets would have been .71%.
F Expense ratios reflect operating expenses of the class. Expenses before reductions do not reflect amounts reimbursed by the investment adviser or reductions from brokerage service arrangements or reductions from other expense offset arrangements and do not represent the amount paid by the class during periods when reimbursements or reductions occur. Expenses net of fee waivers reflect expenses after reimbursement by the investment adviser but prior to reductions from brokerage service arrangements or other expense offset arrangements. Expenses net of all reductions represent the net expenses paid by the class.
G Amount represents less than $.01 per share.
H Total distributions of $.11 per share is comprised of distributions from net investment income of $.093 and distributions from net realized gain of $.014 per share.
See accompanying notes which are an integral part of the financial statements.
Annual Report
Notes to Financial Statements
For the period ended October 31, 2014
1. Organization.
Fidelity Global Commodity Stock Fund (the Fund) is a non-diversified fund of Fidelity Investment Trust (the Trust) and is authorized to issue an unlimited number of shares. The Trust is registered under the Investment Company Act of 1940, as amended (the 1940 Act), as an open-end management investment company organized as a Massachusetts business trust. The Fund offers Class A, Class T, Class C, Global Commodity Stock and Institutional Class shares, each of which, along with Class B shares, has equal rights as to assets and voting privileges. Class B shares are closed to new accounts and additional purchases, except for exchanges and reinvestments. Each class has exclusive voting rights with respect to matters that affect that class. Class B shares will automatically convert to Class A shares after a holding period of seven years from the initial date of purchase. The Fund's investments in emerging markets can be subject to social, economic, regulatory, and political uncertainties and can be extremely volatile.
2. Investments in Fidelity Central Funds.
The Fund invests in Fidelity Central Funds, which are open-end investment companies generally available only to other investment companies and accounts managed by the investment adviser and its affiliates. The Fund's Schedule of Investments lists each of the Fidelity Central Funds held as of period end, if any, as an investment of the Fund, but does not include the underlying holdings of each Fidelity Central Fund. As an Investing Fund, the Fund indirectly bears its proportionate share of the expenses of the underlying Fidelity Central Funds.
The Money Market Central Funds seek preservation of capital and current income and are managed by Fidelity Investments Money Management, Inc. (FIMM), an affiliate of the investment adviser. Annualized expenses of the Money Market Central Funds as of their most recent shareholder report date are less than .01%.
A complete unaudited list of holdings for each Fidelity Central Fund is available upon request or at the Securities and Exchange Commission (the SEC) website at www.sec.gov. In addition, the financial statements of the Fidelity Central Funds, which are not covered by the Fund's Report of Independent Registered Public Accounting Firm, are available on the SEC website or upon request.
3. Significant Accounting Policies.
The financial statements have been prepared in conformity with accounting principles generally accepted in the United States of America (GAAP), which require management to make certain estimates and assumptions at the date of the financial statements. Actual results could differ from those estimates. Subsequent events, if any, through the date that the financial statements were issued have been evaluated in the preparation of
Annual Report
3. Significant Accounting Policies - continued
the financial statements. The following summarizes the significant accounting policies of the Fund:
Investment Valuation. Investments are valued as of 4:00 p.m. Eastern time on the last calendar day of the period. In accordance with valuation policies and procedures approved by the Board of Trustees (the Board), the Fund attempts to obtain prices from one or more third party pricing vendors or brokers to value its investments. When current market prices, quotations or currency exchange rates are not readily available or reliable, investments will be fair valued in good faith by the Fidelity Management & Research Company (FMR) Fair Value Committee (the Committee), in accordance with procedures adopted by the Board. Factors used in determining fair value vary by investment type and may include market or investment specific events. The frequency with which these procedures are used cannot be predicted and they may be utilized to a significant extent. The Committee oversees the Fund's valuation policies and procedures and is responsible for approving and reporting to the Board all fair value determinations.
The Fund categorizes the inputs to valuation techniques used to value its investments into a disclosure hierarchy consisting of three levels as shown below:
Level 1 - quoted prices in active markets for identical investments
Level 2 - other significant observable inputs (including quoted prices for similar investments, interest rates, prepayment speeds, etc.)
Level 3 - unobservable inputs (including the Fund's own assumptions based on the best information available)
Valuation techniques used to value the Fund's investments by major category are as follows:
Equity securities, including restricted securities, for which market quotations are readily available, are valued at the last reported sale price or official closing price as reported by a third party pricing vendor on the primary market or exchange on which they are traded and are categorized as Level 1 in the hierarchy. In the event there were no sales during the day or closing prices are not available, securities are valued at the last quoted bid price or may be valued using the last available price and are generally categorized as Level 2 in the hierarchy. For foreign equity securities, when market or security specific events arise, comparisons to the valuation of American Depositary Receipts (ADRs), futures contracts, Exchange-Traded Funds (ETFs) and certain indexes as well as quoted prices for similar securities may be used and would be categorized as Level 2 in the hierarchy. Utilizing these techniques may result in transfers between Level 1 and Level 2. For equity securities, including restricted securities, where observable inputs are
Annual Report
Notes to Financial Statements - continued
3. Significant Accounting Policies - continued
Investment Valuation - continued
limited, assumptions about market activity and risk are used and these securities may be categorized as Level 3 in the hierarchy.
Investments in open-end mutual funds, including the Fidelity Central Funds, are valued at their closing net asset value (NAV) each business day and are categorized as Level 1 in the hierarchy.
Changes in valuation techniques may result in transfers in or out of an assigned level within the disclosure hierarchy. The aggregate value of investments by input level, as of October 31, 2014, including information on transfers between Levels 1 and 2, is included at the end of the Fund's Schedule of Investments.
Foreign Currency. The Fund may use foreign currency contracts to facilitate transactions in foreign-denominated securities. Gains and losses from these transactions may arise from changes in the value of the foreign currency or if the counterparties do not perform under the contracts' terms.
Foreign-denominated assets, including investment securities, and liabilities are translated into U.S. dollars at the exchange rates at period end. Purchases and sales of investment securities, income and dividends received and expenses denominated in foreign currencies are translated into U.S. dollars at the exchange rate in effect on the transaction date.
The effects of exchange rate fluctuations on investments are included with the net realized and unrealized gain (loss) on investment securities. Other foreign currency transactions resulting in realized and unrealized gain (loss) are disclosed separately.
Investment Transactions and Income. For financial reporting purposes, the Fund's investment holdings and NAV include trades executed through the end of the last business day of the period. The NAV per share for processing shareholder transactions is calculated as of the close of business of the New York Stock Exchange (NYSE), normally 4:00 p.m. Eastern time and includes trades executed through the end of the prior business day. Gains and losses on securities sold are determined on the basis of identified cost and may include proceeds received from litigation. Dividend income is recorded on the ex-dividend date, except for certain dividends from foreign securities where the ex-dividend date may have passed, which are recorded as soon as the Fund is informed of the ex-dividend date. Non-cash dividends included in dividend income, if any, are recorded at the fair market value of the securities received. Income and capital gain distributions from Fidelity Central Funds, if any, are recorded on the ex-dividend date. Distributions received on securities that represent a return of capital or capital gain are recorded as a reduction of cost of investments and/or as a realized gain. Subsequent to
Annual Report
3. Significant Accounting Policies - continued
Investment Transactions and Income - continued
ex-dividend date the Fund determines the components of these distributions, based upon receipt of tax filings or other correspondence relating to the underlying investment. Investment income is recorded net of foreign taxes withheld where recovery of such taxes is uncertain.
Class Allocations and Expenses. Investment income, realized and unrealized capital gains and losses, common expenses of the Fund, and certain fund-level expense reductions, if any, are allocated daily on a pro-rata basis to each class based on the relative net assets of each class to the total net assets of the Fund. Each class differs with respect to transfer agent and distribution and service plan fees incurred. Certain expense reductions may also differ by class. For the reporting period, the allocated portion of income and expenses to each class as a percent of its average net assets may vary due to the timing of recording these transactions in relation to fluctuating net assets of the classes. Expenses directly attributable to a fund are charged to that fund. Expenses attributable to more than one fund are allocated among the respective funds on the basis of relative net assets or other appropriate methods. Expense estimates are accrued in the period to which they relate and adjustments are made when actual amounts are known.
Income Tax Information and Distributions to Shareholders. Each year, the Fund intends to qualify as a regulated investment company under Subchapter M of the Internal Revenue Code, including distributing substantially all of its taxable income and realized gains. As a result, no provision for U.S. Federal income taxes is required. As of October 31, 2014, the Fund did not have any unrecognized tax benefits in the financial statements; nor is the Fund aware of any tax positions for which it is reasonably possible that the total amounts of unrecognized tax benefits will significantly change in the next twelve months. The Fund files a U.S. federal tax return, in addition to state and local tax returns as required. The Fund's federal income tax returns are subject to examination by the Internal Revenue Service (IRS) for a period of three fiscal years after they are filed. State and local tax returns may be subject to examination for an additional fiscal year depending on the jurisdiction. Foreign taxes are provided for based on the Fund's understanding of the tax rules and rates that exist in the foreign markets in which it invests.
Distributions are declared and recorded on the ex-dividend date. Income dividends and capital gain distributions are declared separately for each class. Income and capital gain distributions are determined in accordance with income tax regulations, which may differ from GAAP. In addition, the Fund claimed a portion of the payment made to redeeming shareholders as a distribution for income tax purposes.
Annual Report
Notes to Financial Statements - continued
3. Significant Accounting Policies - continued
Income Tax Information and Distributions to Shareholders - continued
Capital accounts within the financial statements are adjusted for permanent book-tax differences. These adjustments have no impact on net assets or the results of operations.
Capital accounts are not adjusted for temporary book-tax differences which will reverse in a subsequent period.
Book-tax differences are primarily due to foreign currency transactions, passive foreign investment companies (PFIC), partnerships, capital loss carryforwards and losses deferred due to wash sales.
The federal tax cost of investment securities and unrealized appreciation (depreciation) as of period end were as follows:
Gross unrealized appreciation | $ 16,755,440 |
Gross unrealized depreciation | (89,430,462) |
Net unrealized appreciation (depreciation) on securities | $ (72,675,022) |
| |
Tax Cost | $ 413,576,146 |
The tax-based components of distributable earnings as of period end were as follows:
Undistributed ordinary income | $ 4,143,532 |
Capital loss carryforward | $ (41,514,178) |
Net unrealized appreciation (depreciation) on securities and other investments | $ (72,691,445) |
Capital loss carryforwards are only available to offset future capital gains of the Fund to the extent provided by regulations and may be limited. Under the Regulated Investment Company Modernization Act of 2010 (the Act), the Fund is permitted to carry forward capital losses incurred in taxable years beginning after December 22, 2010 for an unlimited period and such capital losses are required to be used prior to any losses that expire. The capital loss carryforward information presented below, including any applicable limitation, is estimated as of fiscal period end and is subject to adjustment.
Fiscal year of expiration | |
2019 | $ (6,952,413) |
No expiration | |
Short-term | (14,785,479) |
Long-term | (19,776,286) |
Total no expiration | (34,561,765) |
Total capital loss carryforward | $ (41,514,178) |
The tax character of distributions paid was as follows:
| October 31, 2014 | October 31, 2013 |
Ordinary Income | $ 5,132,959 | $ 5,697,049 |
Annual Report
3. Significant Accounting Policies - continued
Short-Term Trading (Redemption) Fees. Shares held by investors in the Fund less than 30 days may have been subject to a redemption fee equal to 1.00% of the NAV of shares redeemed. All redemption fees, which reduce the proceeds of the shareholder redemption, are retained by the Fund and accounted for as an addition to paid in capital.
Restricted Securities. The Fund may invest in securities that are subject to legal or contractual restrictions on resale. These securities generally may be resold in transactions exempt from registration or to the public if the securities are registered. Disposal of these securities may involve time-consuming negotiations and expense, and prompt sale at an acceptable price may be difficult. Information regarding restricted securities is included at the end of the Fund's Schedule of Investments.
New Accounting Pronouncement. In June 2014, the Financial Accounting Standards Board issued Accounting Standard Update No. 2014-11, Repurchase-to-Maturity Transactions, Repurchase Financings, and Disclosures. The Update amends the accounting for certain repurchase agreements and expands disclosure requirements for reverse repurchase agreements, securities lending and other similar transactions. The disclosure requirements are effective for annual and interim reporting periods beginning after December 15, 2014. Management is currently evaluating the impact of the Update on the Fund's financial statements and related disclosures.
4. Purchases and Sales of Investments.
Purchases and sales of securities, other than short-term securities, aggregated $284,939,275 and $349,828,265, respectively.
5. Fees and Other Transactions with Affiliates.
Management Fee. Fidelity Management & Research Company (the investment adviser) and its affiliates provide the Fund with investment management related services for which the Fund pays a monthly management fee. The management fee is the sum of an individual fund fee rate that is based on an annual rate of .45% of the Fund's average net assets and an annualized group fee rate that averaged .25% during the period. The group fee rate is based upon the average net assets of all the mutual funds advised by the investment adviser, including any mutual funds previously advised by the investment adviser that are currently advised by Fidelity SelectCo, LLC, an affiliate of the investment adviser. The group fee rate decreases as assets under management increase and increases as assets under management decrease. For the reporting period, the total annual management fee rate was .70% of the Fund's average net assets.
Annual Report
Notes to Financial Statements - continued
5. Fees and Other Transactions with Affiliates - continued
Distribution and Service Plan Fees. In accordance with Rule 12b-1 of the 1940 Act, the Fund has adopted separate Distribution and Service Plans for each class of shares. Certain classes pay Fidelity Distributors Corporation (FDC), an affiliate of the investment adviser, separate Distribution and Service Fees, each of which is based on an annual percentage of each class' average net assets. In addition, FDC may pay financial intermediaries for selling shares of the Fund and providing shareholder support services.
For the period, the Distribution and Service Fee rates, total fees and amounts retained by FDC were as follows:
| Distribution
Fee | Service
Fee | Total Fees | Retained
by FDC |
Class A | -% | .25% | $ 157,900 | $ 965 |
Class T | .25% | .25% | 58,696 | - |
Class B | .75% | .25% | 19,785 | 14,850 |
Class C | .75% | .25% | 210,644 | 22,837 |
| | | $ 447,025 | $ 38,652 |
Sales Load. FDC may receive a front-end sales charge of up to 5.75% for selling Class A shares and 3.50% for selling Class T shares, some of which is paid to financial intermediaries for selling shares of the Fund. Depending on the holding period, FDC may receive contingent deferred sales charges levied on Class A, Class T, Class B, and Class C redemptions. The deferred sales charges range from 5.00% to 1.00% for Class B shares, 1.00% for Class C shares, 1.00% for certain purchases of Class A shares and .25% for certain purchases of Class T shares.
For the period, sales charge amounts retained by FDC were as follows:
| Retained
by FDC |
Class A | $ 22,642 |
Class T | 2,275 |
Class B* | 4,584 |
Class C* | 1,773 |
| $ 31,274 |
* When Class B and Class C shares are initially sold, FDC pays commissions from its own resources to financial intermediaries through which the sales are made.
Transfer Agent Fees. Fidelity Investments Institutional Operations Company, Inc., (FIIOC), an affiliate of the investment adviser, is the transfer, dividend disbursing and shareholder servicing agent for each class of the Fund. FIIOC receives account fees and asset-based fees that vary according to the account size and type of account of the shareholders of the respective classes of the Fund. FIIOC pays for typesetting, printing and mailing of shareholder reports, except proxy statements.
Annual Report
5. Fees and Other Transactions with Affiliates - continued
Transfer Agent Fees - continued
For the period, transfer agent fees for each class were as follows:
| Amount | % of
Class-Level Average
Net Assets |
Class A | $ 183,297 | .29 |
Class T | 36,439 | .31 |
Class B | 5,992 | .30 |
Class C | 63,653 | .30 |
Global Commodity Stock | 776,461 | .30 |
Institutional Class | 68,271 | .25 |
| $ 1,134,113 | |
Accounting and Security Lending Fees. Fidelity Service Company, Inc. (FSC), an affiliate of the investment adviser, maintains the Fund's accounting records. The accounting fee is based on the level of average net assets for each month. Under a separate contract, FSC administers the security lending program. The security lending fee is based on the number and duration of lending transactions.
Brokerage Commissions. The Fund placed a portion of its portfolio transactions with brokerage firms which are affiliates of the investment adviser. Brokerage commissions are included in net realized gain (loss) and change in net unrealized appreciation (depreciation) in the Statement of Operations. The commissions paid to these affiliated firms were $12,848 for the period.
6. Committed Line of Credit.
The Fund participates with other funds managed by the investment adviser or an affiliate in a $4.25 billion credit facility (the "line of credit") to be utilized for temporary or emergency purposes to fund shareholder redemptions or for other short-term liquidity purposes. The Fund has agreed to pay commitment fees on its pro-rata portion of the line of credit, which amounted to $630 and is reflected in Miscellaneous expenses on the Statement of Operations. During the period, the Fund did not borrow on this line of credit.
7. Security Lending.
The Fund lends portfolio securities through a lending agent from time to time in order to earn additional income. For equity securities, a lending agent is used and may loan securities to certain qualified borrowers, including Fidelity Capital Markets (FCM), a broker-dealer affiliated with the Fund. On the settlement date of the loan, the Fund receives collateral (in the form of U.S. Treasury obligations, letters of credit and/or cash)
Annual Report
Notes to Financial Statements - continued
7. Security Lending - continued
against the loaned securities and maintains collateral in an amount not less than 100% of the market value of the loaned securities during the period of the loan. The market value of the loaned securities is determined at the close of business of the Fund and any additional required collateral is delivered to the Fund on the next business day. If the borrower defaults on its obligation to return the securities loaned because of insolvency or other reasons, the Fund may apply collateral received from the borrower against the obligation. The Fund may experience delays and costs in recovering the securities loaned. Any cash collateral received is invested in the Fidelity Securities Lending Cash Central Fund. The value of loaned securities and cash collateral at period end are disclosed on the Fund's Statement of Assets and Liabilities. Security lending income represents the income earned on investing cash collateral, less rebates paid to borrowers and any lending agent fees associated with the loan, plus any premium payments received for lending certain types of securities. Security lending income is presented in the Statement of Operations as a component of income from Fidelity Central Funds. Total security lending income during the period amounted to $180,323. During the period, there were no securities loaned to FCM.
8. Expense Reductions.
Commissions paid to certain brokers with whom the investment adviser, or its affiliates, places trades on behalf of the Fund include an amount in addition to trade execution, which may be rebated back to the Fund to offset certain expenses. This amount totaled $8,577 for the period.
In addition, the investment adviser reimbursed a portion of the Fund's operating expenses during the period in the amount of $2,753.
9. Distributions to Shareholders.
Distributions to shareholders of each class were as follows:
Years ended October 31, | 2014 | 2013 |
From net investment income | | |
Class A | $ 708,856 | $ 864,701 |
Class T | 98,770 | 89,063 |
Class B | 4,646 | 847 |
Class C | 54,810 | 32,277 |
Global Commodity Stock | 3,531,196 | 4,073,304 |
Institutional Class | 366,972 | 636,857 |
Total | $ 4,765,250 | $ 5,697,049 |
Annual Report
9. Distributions to Shareholders - continued
Years ended October 31, | 2014 | 2013 |
From net realized gain | | |
Class A | $ 63,118 | $ - |
Class T | 11,363 | - |
Class B | 2,083 | - |
Class C | 21,591 | - |
Global Commodity Stock | 244,178 | - |
Institutional Class | 25,376 | - |
Total | $ 367,709 | $ - |
10. Share Transactions.
Share transactions for each class were as follows and may contain automatic conversions between classes or exchanges between funds:
| Shares | Shares | Dollars | Dollars |
Years ended October 31, | 2014 | 2013 | 2014 | 2013 |
Class A | | | | |
Shares sold | 686,605 | 1,201,755 | $ 9,882,029 | $ 16,769,552 |
Reinvestment of distributions | 49,529 | 52,559 | 677,563 | 744,754 |
Shares redeemed | (1,874,574) | (3,054,897) | (26,738,279) | (42,479,556) |
Net increase (decrease) | (1,138,440) | (1,800,583) | $ (16,178,687) | $ (24,965,250) |
Class T | | | | |
Shares sold | 67,497 | 130,604 | $ 970,700 | $ 1,791,142 |
Reinvestment of distributions | 7,867 | 5,824 | 107,538 | 82,471 |
Shares redeemed | (216,700) | (396,060) | (3,112,471) | (5,490,961) |
Net increase (decrease) | (141,336) | (259,632) | $ (2,034,233) | $ (3,617,348) |
Class B | | | | |
Shares sold | 2,197 | 7,047 | $ 29,999 | $ 98,902 |
Reinvestment of distributions | 453 | 54 | 6,179 | 758 |
Shares redeemed | (46,232) | (57,569) | (649,491) | (793,852) |
Net increase (decrease) | (43,582) | (50,468) | $ (613,313) | $ (694,192) |
Class C | | | | |
Shares sold | 167,515 | 368,295 | $ 2,371,848 | $ 5,059,285 |
Reinvestment of distributions | 4,980 | 1,963 | 67,632 | 27,576 |
Shares redeemed | (527,630) | (880,659) | (7,391,284) | (12,048,987) |
Net increase (decrease) | (355,135) | (510,401) | $ (4,951,804) | $ (6,962,126) |
Global Commodity Stock | | | | |
Shares sold | 3,796,689 | 5,296,700 | $ 54,637,922 | $ 74,369,495 |
Reinvestment of distributions | 246,397 | 264,635 | 3,378,098 | 3,760,465 |
Shares redeemed | (6,485,397) | (12,764,042) | (92,819,253) | (177,408,171) |
Net increase (decrease) | (2,442,311) | (7,202,707) | $ (34,803,233) | $ (99,278,211) |
Annual Report
Notes to Financial Statements - continued
10. Share Transactions - continued
| Shares | Shares | Dollars | Dollars |
Years ended October 31, | 2014 | 2013 | 2014 | 2013 |
Institutional Class | | | | |
Shares sold | 912,359 | 1,153,936 | $ 13,219,634 | $ 16,235,437 |
Reinvestment of distributions | 20,652 | 25,953 | 283,141 | 368,529 |
Shares redeemed | (1,362,707) | (2,405,021) | (19,411,369) | (33,510,048) |
Net increase (decrease) | (429,696) | (1,225,132) | $ (5,908,594) | $ (16,906,082) |
11. Other.
The Fund's organizational documents provide former and current trustees and officers with a limited indemnification against liabilities arising in connection with the performance of their duties to the Fund. In the normal course of business, the Fund may also enter into contracts that provide general indemnifications. The Fund's maximum exposure under these arrangements is unknown as this would be dependent on future claims that may be made against the Fund. The risk of material loss from such claims is considered remote.
At the end of the period, the investment adviser or its affiliates were the owners of record of 13% of the total outstanding shares of the Fund.
Annual Report
To the Trustees of Fidelity Investment Trust and the Shareholders of Fidelity Global Commodity Stock Fund:
In our opinion, the accompanying statement of assets and liabilities, including the schedule of investments, and the related statements of operations and of changes in net assets and the financial highlights present fairly, in all material respects, the financial position of Fidelity Global Commodity Stock Fund (a fund of Fidelity Investment Trust) at October 31, 2014, the results of its operations for the year then ended, the changes in its net assets for each of the two years in the period then ended and the financial highlights for each of the five years in the period then ended, in conformity with accounting principles generally accepted in the United States of America. These financial statements and financial highlights (hereafter referred to as "financial statements") are the responsibility of the Fidelity Global Commodity Stock Fund's management. Our responsibility is to express an opinion on these financial statements based on our audits. We conducted our audits of these financial statements in accordance with the standards of the Public Company Accounting Oversight Board (United States). Those standards require that we plan and perform the audit to obtain reasonable assurance about whether the financial statements are free of material misstatement. An audit includes examining, on a test basis, evidence supporting the amounts and disclosures in the financial statements, assessing the accounting principles used and significant estimates made by management, and evaluating the overall financial statement presentation. We believe that our audits, which included confirmation of securities at October 31, 2014 by correspondence with the custodian and brokers, provide a reasonable basis for our opinion.
PricewaterhouseCoopers LLP
Boston, Massachusetts
December 19, 2014
Annual Report
The Trustees, Member of the Advisory Board, and officers of the trusts and fund, as applicable, are listed below. The Board of Trustees governs the fund and is responsible for protecting the interests of shareholders. The Trustees are experienced executives who meet periodically throughout the year to oversee the fund's activities, review contractual arrangements with companies that provide services to the fund, oversee management of the risks associated with such activities and contractual arrangements, and review the fund's performance. Except for James C. Curvey, each of the Trustees oversees 174 funds. Mr. Curvey oversees 407 funds.
The Trustees hold office without limit in time except that (a) any Trustee may resign; (b) any Trustee may be removed by written instrument, signed by at least two-thirds of the number of Trustees prior to such removal; (c) any Trustee who requests to be retired or who has become incapacitated by illness or injury may be retired by written instrument signed by a majority of the other Trustees; and (d) any Trustee may be removed at any special meeting of shareholders by a two-thirds vote of the outstanding voting securities of the trust. Each Trustee who is not an interested person (as defined in the 1940 Act) of the trust and the fund (Independent Trustee), shall retire not later than the last day of the calendar year in which his or her 75th birthday occurs. The Independent Trustees may waive this mandatory retirement age policy with respect to individual Trustees. The officers and Advisory Board Member hold office without limit in time, except that any officer and Advisory Board Member may resign or may be removed by a vote of a majority of the Trustees at any regular meeting or any special meeting of the Trustees. Except as indicated, each individual has held the office shown or other offices in the same company for the past five years.
Experience, Skills, Attributes, and Qualifications of the Fund's Trustees. The Governance and Nominating Committee has adopted a statement of policy that describes the experience, qualifications, attributes, and skills that are necessary and desirable for potential Independent Trustee candidates (Statement of Policy). The Board believes that each Trustee satisfied at the time he or she was initially elected or appointed a Trustee, and continues to satisfy, the standards contemplated by the Statement of Policy. The Governance and Nominating Committee also engages professional search firms to help identify potential Independent Trustee candidates who have the experience, qualifications, attributes, and skills consistent with the Statement of Policy. From time to time, additional criteria based on the composition and skills of the current Independent Trustees, as well as experience or skills that may be appropriate in light of future changes to board composition, business conditions, and regulatory or other developments, have also been considered by the professional search firms and the Governance and Nominating Committee. In addition, the Board takes into account the Trustees' commitment and participation in Board and committee meetings, as well as their leadership of standing and ad hoc committees throughout their tenure.
In determining that a particular Trustee was and continues to be qualified to serve as a Trustee, the Board has considered a variety of criteria, none of which, in isolation, was controlling. The Board believes that, collectively, the Trustees have balanced and diverse experience, qualifications, attributes, and skills, which allow the Board to operate effectively in governing the fund and protecting the interests of shareholders. Information about the specific experience, skills, attributes, and qualifications of each Trustee, which in each case led to the Board's conclusion that the Trustee should serve (or continue to serve) as a trustee of the fund, is provided below.
Annual Report
Trustees and Officers - continued
Board Structure and Oversight Function. James C. Curvey is an interested person (as defined in the 1940 Act) and currently serves as Chairman. The Trustees have determined that an interested Chairman is appropriate and benefits shareholders because an interested Chairman has a personal and professional stake in the quality and continuity of services provided to the fund. Independent Trustees exercise their informed business judgment to appoint an individual of their choosing to serve as Chairman, regardless of whether the Trustee happens to be independent or a member of management. The Independent Trustees have determined that they can act independently and effectively without having an Independent Trustee serve as Chairman and that a key structural component for assuring that they are in a position to do so is for the Independent Trustees to constitute a substantial majority for the Board. The Independent Trustees also regularly meet in executive session. Ned C. Lautenbach serves as Chairman of the Independent Trustees and as such (i) acts as a liaison between the Independent Trustees and management with respect to matters important to the Independent Trustees and (ii) with management prepares agendas for Board meetings.
Fidelity funds are overseen by different Boards of Trustees. The fund's Board oversees Fidelity's equity and high income funds and another Board oversees Fidelity's investment-grade bond, money market, and asset allocation funds. The asset allocation funds may invest in Fidelity funds overseen by the fund's Board. The use of separate Boards, each with its own committee structure, allows the Trustees of each group of Fidelity funds to focus on the unique issues of the funds they oversee, including common research, investment, and operational issues. On occasion, the separate Boards establish joint committees to address issues of overlapping consequences for the Fidelity funds overseen by each Board.
The Trustees operate using a system of committees to facilitate the timely and efficient consideration of all matters of importance to the Trustees, the fund, and fund shareholders and to facilitate compliance with legal and regulatory requirements and oversight of the fund's activities and associated risks. The Board, acting through its committees, has charged FMR and its affiliates with (i) identifying events or circumstances the occurrence of which could have demonstrably adverse effects on the fund's business and/or reputation; (ii) implementing processes and controls to lessen the possibility that such events or circumstances occur or to mitigate the effects of such events or circumstances if they do occur; and (iii) creating and maintaining a system designed to evaluate continuously business and market conditions in order to facilitate the identification and implementation processes described in (i) and (ii) above. Because the day-to-day operations and activities of the fund are carried out by or through FMR, its affiliates and other service providers, the fund's exposure to risks is mitigated but not eliminated by the processes overseen by the Trustees. While each of the Board's committees has responsibility for overseeing different aspects of the fund's activities, oversight is exercised primarily through the Operations, Audit, and Compliance Committees. In addition, the Independent Trustees have worked with FMR to enhance the Board's oversight of investment and financial risks, legal and regulatory risks, technology risks, and operational risks, including the development of additional risk reporting to the Board. For example, a working group comprised of Independent Trustees and FMR has worked and continues to work to review the Fidelity funds' valuation-related activities, reporting and risk management. Appropriate personnel, including but not limited to the fund's Chief Compliance Officer (CCO), FMR's internal auditor, the independent accountants, the fund's Treasurer and portfolio management personnel, make periodic reports to the Board's committees, as appropriate, including an annual review of FMR's risk management program for the Fidelity funds. The responsibilities of each standing committee, including their oversight responsibilities, are described further under "Standing Committees of the Fund's Trustees."
Annual Report
The fund's Statement of Additional Information (SAI) includes more information about the Trustees. To request a free copy, call Fidelity at 1-877-208-0098.
Interested Trustees*:
Correspondence intended for each Trustee who is an interested person may be sent to Fidelity Investments, 245 Summer Street, Boston, Massachusetts 02210.
Name, Year of Birth; Principal Occupations and Other Relevant Experience+ |
James C. Curvey (1935) |
Year of Election or Appointment: 2007 Trustee Chairman of the Board of Trustees |
| Mr. Curvey also serves as Trustee of other Fidelity funds. Mr. Curvey is a Director of Fidelity Research & Analysis Co. (2009-present), and Vice Chairman (2007-present) and Director of FMR LLC. In addition, Mr. Curvey serves as an Overseer for the Boston Symphony Orchestra and a member of the board of Artis-Naples, Naples, Florida, and as a Trustee for Brewster Academy, Wolfeboro, New Hampshire. Previously, Mr. Curvey served as a Director of Fidelity Investments Money Management, Inc. (2009-2014), a Director of FMR (2007-2014) and a Director of FMR Co., Inc. (2007-2014). |
Charles S. Morrison (1960) |
Year of Election or Appointment: 2014 Trustee |
| Mr. Morrison also serves as Trustee of other funds. He serves as a Director of Fidelity Investments Money Management, Inc. (FIMM) (2014-present), Director of Fidelity SelectCo, LLC (2014-present), President, Asset Management (2014-present) and is an employee of Fidelity Investments. Previously, Mr. Morrison served as Vice President of Fidelity's Fixed Income and Asset Allocation Funds (2012-2014), President, Fixed Income (2011-2014), Vice President of Fidelity's Money Market Funds (2005-2009), President, Money Market Group Leader of FMR (2009), and Senior Vice President, Money Market Group of FMR (2004-2009). Mr. Morrison also served as Vice President of Fidelity's Bond Funds (2002-2005), certain Balanced Funds (2002-2005), and certain Asset Allocation Funds (2002-2007), and as Senior Vice President (2002-2005) of Fidelity's Bond Division. |
* Trustees have been determined to be "Interested Trustees" by virtue of, among other things, their affiliation with the trust or various entities under common control with FMR.
+ The information above includes each Trustee's principal occupation during the last five years and other information relating to the experience, attributes, and skills relevant to each Trustee's qualifications to serve as a Trustee, which led to the conclusion that each Trustee should serve as a Trustee for the fund.
Annual Report
Independent Trustees:
Correspondence intended for each Independent Trustee (that is, the Trustees other than the Interested Trustees) may be sent to Fidelity Investments, P.O. Box 55235, Boston, Massachusetts 02205-5235.
Name, Year of Birth; Principal Occupations and Other Relevant Experience+ |
Dennis J. Dirks (1948) |
Year of Election or Appointment: 2005 Trustee |
| Mr. Dirks also serves as Trustee of other Fidelity funds. Prior to his retirement in May 2003, Mr. Dirks was Chief Operating Officer and a member of the Board of The Depository Trust & Clearing Corporation (DTCC). He also served as President, Chief Operating Officer, and Board member of The Depository Trust Company (DTC) and President and Board member of the National Securities Clearing Corporation (NSCC). In addition, Mr. Dirks served as Chief Executive Officer and Board member of the Government Securities Clearing Corporation, Chief Executive Officer and Board member of the Mortgage-Backed Securities Clearing Corporation, as a Trustee and a member of the Finance Committee of Manhattan College (2005-2008), and as a Trustee and a member of the Finance Committee of AHRC of Nassau County (2006-2008). Mr. Dirks is a member of the Independent Directors Council (IDC) Governing Council (2010-present) and Board of Directors for The Brookville Center for Children's Services, Inc. (2009-present). |
Alan J. Lacy (1953) |
Year of Election or Appointment: 2008 Trustee |
| Mr. Lacy also serves as Trustee of other Fidelity funds. Mr. Lacy serves as Senior Adviser (2007-present) of Oak Hill Capital Partners, L.P. (private equity). Mr. Lacy also served as Chief Executive Officer (2000-2005) and Vice Chairman (2005-2006) of Sears Holdings Corporation and Sears, Roebuck and Co. (retail). In addition, Mr. Lacy serves as a member of the Board of Directors of Dave & Buster's Entertainment, Inc. (restaurant and entertainment complexes, 2010-present), Earth Fare, Inc. (retail grocery, 2012-present), The Hillman Companies, Inc. (hardware wholesalers, 2010-present), and Bristol-Myers Squibb Company (global pharmaceuticals, 2008-present). Mr. Lacy is a member of the Board of Trustees of The National Parks Conservation Association (2006-present). Previously, Mr. Lacy served as Chairman of the Board of Trustees of the National Parks Conservation Association (2008-2011) and as a member of the Board of Directors for the Western Union Company (global money transfer, 2006-2011). |
Ned C. Lautenbach (1944) |
Year of Election or Appointment: 2000 Trustee Chairman of the Independent Trustees |
| Mr. Lautenbach also serves as Trustee of other Fidelity funds. Mr. Lautenbach currently serves as the Lead Director of the Eaton Corporation Board of Directors (diversified industrial, 1997-present). Mr. Lautenbach is Chairman of the Board of Directors of the Philharmonic Center for the Arts in Naples, Florida (2012-present) and a member of the Council on Foreign Relations (1994-present). Previously, Mr. Lautenbach was a Partner/Advisory Partner at Clayton, Dubilier & Rice, LLC (private equity investment, 1998-2010), as well as a Director of Sony Corporation (2006-2007). |
Joseph Mauriello (1944) |
Year of Election or Appointment: 2008 Trustee |
| Mr. Mauriello also serves as Trustee of other Fidelity funds. Prior to his retirement in January 2006, Mr. Mauriello served in numerous senior management positions including Deputy Chairman and Chief Operating Officer (2004-2005), and Vice Chairman of Financial Services (2002-2004) of KPMG LLP US (professional services, 1965-2005). Mr. Mauriello currently serves as a member of the Board of Directors of XL Group plc. (global insurance and re-insurance, 2006-present). Previously, Mr. Mauriello served as a Director of the Hamilton Funds of the Bank of New York (2006-2007) and of Arcadia Resources Inc. (health care services and products, 2007-2012). |
Robert W. Selander (1950) |
Year of Election or Appointment: 2011 Trustee |
| Mr. Selander also serves as Trustee of other Fidelity funds. Previously, Mr. Selander served as a Member of the Advisory Board of other Fidelity funds (2011), and Executive Vice Chairman (2010), Chief Executive Officer (2009-2010), and President and Chief Executive Officer (1997-2009) of Mastercard, Inc. |
Cornelia M. Small (1944) |
Year of Election or Appointment: 2005 Trustee |
| Ms. Small also serves as Trustee of other Fidelity funds. Ms. Small is a member of the Board of Directors (2009-present) and Chair of the Investment Committee (2010-present) of the Teagle Foundation. Ms. Small also serves on the Investment Committee of the Berkshire Taconic Community Foundation (2008-present). Previously, Ms. Small served as Chairperson (2002-2008) and a member of the Investment Committee and Chairperson (2008-2012) and a member of the Board of Trustees of Smith College. In addition, Ms. Small served as Chief Investment Officer, Director of Global Equity Investments, and a member of the Board of Directors of Scudder, Stevens & Clark and Scudder Kemper Investments. |
William S. Stavropoulos (1939) |
Year of Election or Appointment: 2001 Trustee Vice Chairman of the Independent Trustees |
| Mr. Stavropoulos also serves as Trustee of other Fidelity funds. Mr. Stavropoulos serves as President and Founder of the Michigan Baseball Foundation, the Great Lakes Loons (2007-present). Mr. Stavropoulos is Chairman Emeritus of the Board of Directors of The Dow Chemical Company, where he previously served in numerous senior management positions, including President, CEO (1995-2000; 2002-2004), Chairman of the Executive Committee (2000-2006), and as a member of the Board of Directors (1990-2006). Currently, Mr. Stavropoulos is Chairman of the Board of Directors of Univar Inc. (global distributor of commodity and specialty chemicals), a Director of Teradata Corporation (data warehousing and technology solutions), and Maersk Inc. (industrial conglomerate), and a member of the Advisory Board for Metalmark Capital LLC (private equity investment, 2005-present). Mr. Stavropoulos is an operating advisor to Clayton, Dubilier & Rice, LLC (private equity investment). In addition, Mr. Stavropoulos is a member of the University of Notre Dame Advisory Council for the College of Science, a Trustee of the Rollin L. Gerstacker Foundation, and a Director of the Naples Philharmonic Center for the Arts. Previously, Mr. Stavropoulos served as a Director of Chemical Financial Corporation (bank holding company, 1993-2012) and Tyco International, Ltd. (multinational manufacturing and services, 2007-2012). |
David M. Thomas (1949) |
Year of Election or Appointment: 2008 Trustee |
| Mr. Thomas also serves as Trustee of other Fidelity funds. Mr. Thomas serves as Non-Executive Chairman of the Board of Directors of Fortune Brands Home and Security (home and security products, 2011-present), and as a member of the Board of Directors of Interpublic Group of Companies, Inc. (marketing communication, 2004-present). Previously, Mr. Thomas served as Executive Chairman (2005-2006) and Chairman and Chief Executive Officer (2000-2005) of IMS Health, Inc. (pharmaceutical and healthcare information solutions), and a Director of Fortune Brands, Inc. (consumer products, 2000-2011). |
+ The information above includes each Trustee's principal occupation during the last five years and other information relating to the experience, attributes, and skills relevant to each Trustee's qualifications to serve as a Trustee, which led to the conclusion that each Trustee should serve as a Trustee for the fund.
Advisory Board Member and Officers:
Correspondence intended for each officer and Peter S. Lynch may be sent to Fidelity Investments, 245 Summer Street, Boston, Massachusetts 02210. Officers appear below in alphabetical order.
Name, Year of Birth; Principal Occupation |
Peter S. Lynch (1944) |
Year of Election or Appointment: 2003 Member of the Advisory Board |
| Mr. Lynch also serves as Member of the Advisory Board of other Fidelity funds. Mr. Lynch is Vice Chairman and a Director of FMR and FMR Co., Inc. In addition, Mr. Lynch serves as a Trustee of Boston College and as the Chairman of the Inner-City Scholarship Fund. Previously, Mr. Lynch served on the Special Olympics International Board of Directors (1997-2006). |
Elizabeth Paige Baumann (1968) |
Year of Election or Appointment: 2012 Anti-Money Laundering (AML) Officer |
| Ms. Baumann also serves as AML Officer of other funds. She is Chief AML Officer of FMR LLC (2012-present) and is an employee of Fidelity Investments. Previously, Ms. Baumann served as Vice President and Deputy Anti-Money Laundering Officer (2007-2012). |
William C. Coffey (1969) |
Year of Election or Appointment: 2009 Assistant Secretary |
| Mr. Coffey also serves as Assistant Secretary of other funds. He is Senior Vice President and Deputy General Counsel of FMR LLC (2010-present), and is an employee of Fidelity Investments. Previously, Mr. Coffey served as Vice President and Associate General Counsel of FMR LLC (2005-2009). |
Timothy M. Cohen (1969) |
Year of Election or Appointment: 2014 Vice President of certain Equity Funds |
| Mr. Cohen also serves as Vice President of other funds. Mr. Cohen serves as a Director and Chief Compliance Officer of Fidelity Management & Research (U.K.) Inc. (2013-present) and is an employee of Fidelity Investments. |
Jonathan Davis (1968) |
Year of Election or Appointment: 2010 Assistant Treasurer |
| Mr. Davis also serves as Assistant Treasurer of other funds. Mr. Davis is an employee of Fidelity Investments. Previously, Mr. Davis served as Vice President and Associate General Counsel of FMR LLC (2003-2010). |
Adrien E. Deberghes (1967) |
Year of Election or Appointment: 2008 Deputy Treasurer |
| Mr. Deberghes also serves as an officer of other funds. He is an employee of Fidelity Investments (2008-present). Prior to joining Fidelity Investments, Mr. Deberghes was Senior Vice President of Mutual Fund Administration at State Street Corporation (2007-2008), Senior Director of Mutual Fund Administration at Investors Bank & Trust (2005-2007), and Director of Finance for Dunkin' Brands (2000-2005). |
Stephanie J. Dorsey (1969) |
Year of Election or Appointment: 2010 Assistant Treasurer |
| Ms. Dorsey also serves as an officer of other funds. She is an employee of Fidelity Investments (2008-present) and has served in other fund officer roles. Prior to joining Fidelity Investments, Ms. Dorsey served as Treasurer (2004-2008) of the JPMorgan Mutual Funds and Vice President (2004-2008) of JPMorgan Chase Bank. |
Howard J. Galligan III (1966) |
Year of Election or Appointment: 2014 Chief Financial Officer |
| Mr. Galligan also serves as Chief Financial Officer of other funds. Mr. Galligan serves as President of Fidelity Pricing and Cash Management Services (FPCMS) (2014-present) and as a Director of Strategic Advisers, Inc. (2008-present). Previously, Mr. Galligan served as Chief Administrative Officer of Asset Management (2011-2014) and Chief Operating Officer and Senior Vice President of Investment Support for Strategic Advisers, Inc. (2003-2011). |
Scott C. Goebel (1968) |
Year of Election or Appointment: 2008 Secretary and Chief Legal Officer (CLO) |
| Mr. Goebel serves as Secretary and CLO of other funds. Mr. Goebel also serves as Secretary of Fidelity SelectCo, LLC (2013-present), Fidelity Investments Money Management, Inc. (FIMM) (2010-present) and Fidelity Research and Analysis Company (FRAC) (2010-present); General Counsel, Secretary, and Senior Vice President of FMR (2008-present) and FMR Co., Inc. (2008-present); Chief Legal Officer of Fidelity Management & Research (Hong Kong) Limited (2008-present); and Assistant Secretary of Fidelity Management & Research (Japan) Limited (2008-present) and Fidelity Management & Research (U.K.) Inc. (2008-present). Previously, Mr. Goebel served as Secretary and CLO of other Fidelity funds (2008-2013), Assistant Secretary of FIMM (2008-2010), FRAC (2008-2010), and certain funds (2007-2008); and as Vice President and Secretary of Fidelity Distributors Corporation (FDC) (2005-2007). Mr. Goebel has been employed by FMR LLC or an affiliate since 2001. |
Brian B. Hogan (1964) |
Year of Election or Appointment: 2009 Vice President |
| Mr. Hogan also serves as Trustee or Vice President of other funds. Mr. Hogan serves as a Director of Fidelity SelectCo, LLC (2014-present) and President of FMR's Equity Division (2009-present). Previously, Mr. Hogan served as Senior Vice President, Equity Research of FMR (2006-2009) and as a portfolio manager. |
Chris Maher (1972) |
Year of Election or Appointment: 2013 Assistant Treasurer |
| Mr. Maher serves as Assistant Treasurer of other funds. Mr. Maher is Vice President of Valuation Oversight and is an employee of Fidelity Investments. Previously, Mr. Maher served as Vice President of Asset Management Compliance (2013), Vice President of FMR's Program Management Group (2010-2013), and Vice President of Valuation Oversight (2008-2010). |
Kenneth B. Robins (1969) |
Year of Election or Appointment: 2008 President and Treasurer |
| Mr. Robins also serves as an officer of other funds. Mr. Robins serves as Executive Vice President of Fidelity Investments Money Management, Inc. (FIMM) (2013-present) and is an employee of Fidelity Investments (2004-present). Previously, Mr. Robins served in other fund officer roles. |
Stephen Sadoski (1971) |
Year of Election or Appointment: 2012 Deputy Treasurer |
| Mr. Sadoski also serves as Deputy Treasurer of other funds. He is an employee of Fidelity Investments (2012-present) and has served in another fund officer role. Prior to joining Fidelity Investments, Mr. Sadoski served as an assistant chief accountant in the Division of Investment Management of the Securities and Exchange Commission (SEC) (2009-2012) and as a senior manager at Deloitte & Touche LLP (1997-2009). |
Stacie M. Smith (1974) |
Year of Election or Appointment: 2013 Deputy Treasurer |
| Ms. Smith also serves as an officer of other funds. She is an employee of Fidelity Investments (2009-present) and has served in other fund officer roles. Prior to joining Fidelity Investments, Ms. Smith served as Senior Audit Manager of Ernst & Young LLP (1996-2009). |
Renee Stagnone (1975) |
Year of Election or Appointment: 2013 Deputy Treasurer |
| Ms. Stagnone also serves as Deputy Treasurer of other funds. Ms. Stagnone is an employee of Fidelity Investments. |
Linda J. Wondrack (1964) |
Year of Election or Appointment: 2014 Chief Compliance Officer |
| Ms. Wondrack also serves as Chief Compliance Officer of other funds. Ms. Wondrack is Executive Vice President and head of the Ethics Office and Asset Management Compliance for Fidelity Investments (2012-present). Ms. Wondrack also serves as Chief Compliance Officer of Fidelity SelectCo, LLC (2014-present); Chief Compliance Officer of Impresa Management LLC (2013-present); and Chief Compliance Officer of FMR Co., Inc., Fidelity Investments Money Management, Inc., Fidelity Management & Research (Japan) Limited, Fidelity Management & Research (U.K.) Inc., Fidelity Management & Research (Hong Kong), Fidelity Management & Research Company, Pyramis Global Advisors, LLC, and Strategic Advisers, Inc., Ballyrock Investment Advisors LLC, and Northern Neck Investors LLC (2012-present). Previously, Ms. Wondrack served as Senior Vice President and Chief Compliance Officer for Columbia Management Investment Advisers, LLC (2005-2012); Chief Compliance Officer for certain funds within the Columbia Family of Funds (2007-2012); and Senior Vice President of Compliance Risk Management at Bank of America (2005-2010). |
Joseph F. Zambello (1957) |
Year of Election or Appointment: 2011 Deputy Treasurer |
| Mr. Zambello also serves as Deputy Treasurer of other funds. Mr. Zambello is an employee of Fidelity Investments. Previously, Mr. Zambello served as Vice President of FMR's Program Management Group (2009-2011) and Vice President of the Transfer Agent Oversight Group (2005-2009). |
Annual Report
The Board of Trustees of Fidelity Global Commodity Stock Fund voted to pay to shareholders of record at the opening of business on record date, the following distributions per share derived from capital gains realized from sales of portfolio securities, and dividends derived from net investment income:
| Pay Date | Record Date | Dividends | Capital Gains |
Institutional Class | 12/08/14 | 12/05/14 | $0.186 | $0.026 |
Institutional Class designates 43% of the dividend distributed during the fiscal year as qualifying for the dividends-received deduction for corporate shareholders.
Institutional Class designates 100% of the dividend distributed during the fiscal year as amounts which may be taken into account as a dividend for the purposes of the maximum rate under section 1(h)(11) of the Internal Revenue Code.
The amounts per share which represent income derived from sources within, and taxes paid to, foreign countries or possessions of the United States are as follows:
| Pay Date | Income | Taxes |
Institutional Class | 12/09/13 | $0.1997 | $0.0155 |
The fund will notify shareholders in January 2015 of amounts for use in preparing 2014 income tax returns.
Annual Report
Board Approval of Investment Advisory Contracts and Management Fees
Fidelity Global Commodity Stock Fund
Each year, the Board of Trustees, including the Independent Trustees (together, the Board), votes on the renewal of the management contract with Fidelity Management & Research Company (FMR) and the sub-advisory agreements (together, the Advisory Contracts) for the fund. The Board, assisted by the advice of fund counsel and Independent Trustees' counsel, requests and considers a broad range of information relevant to the renewal of the Advisory Contracts throughout the year.
The Board meets regularly and, at each of its meetings, covers an extensive agenda of topics and materials and considers factors that are relevant to its annual consideration of the renewal of the fund's Advisory Contracts, including the services and support provided to the fund and its shareholders. The Board has established various standing committees (Committees), each composed of and chaired by Independent Trustees with varying backgrounds, to which the Board has assigned specific subject matter responsibilities in order to enhance effective decision-making by the Board. The Board, acting directly and through its Committees, requests and receives information concerning the annual consideration of the renewal of the fund's Advisory Contracts. The Board also meets as needed to consider matters specifically related to the Board's annual consideration of the renewal of the Advisory Contracts. Members of the Board may also meet with trustees of other Fidelity funds through ad hoc joint committees to discuss certain matters relevant to the Fidelity funds.
At its July 2014 meeting, the Board, including the Independent Trustees, unanimously determined to renew the fund's Advisory Contracts. In reaching its determination, the Board considered all factors it believed relevant, including (i) the nature, extent, and quality of the services to be provided to the fund and its shareholders (including the investment performance of the fund); (ii) the competitiveness of the fund's management fee and total expense ratio relative to peer funds; (iii) the total costs of the services to be provided by and the profits to be realized by Fidelity from its relationship with the fund; (iv) the extent to which economies of scale exist and would be realized as the fund grows; and (v) whether fee levels reflect these economies of scale, if any, for the benefit of fund shareholders. In connection with separate internal corporate reorganizations involving Fidelity Management & Research (U.K.) Inc. (FMR U.K.) and Fidelity Management & Research (Japan) Inc. (FMR Japan), the Board approved certain non-material amendments to the fund's sub-advisory agreements with FMR U.K. and FMR Japan to reflect that, after these reorganizations, FMR Investment Management (UK) Limited and Fidelity Management & Research (Japan) Limited will carry on the business of FMR U.K. and FMR Japan, respectively. The Board noted that no changes to the portfolio managers or to the foreign research or investment advisory services provided to the fund were expected in connection with either reorganization and that the same personnel and resources would continue to be available to the fund at the new entities.
Annual Report
In considering whether to renew the Advisory Contracts for the fund, the Board reached a determination, with the assistance of fund counsel and Independent Trustees' counsel and through the exercise of its business judgment, that the renewal of the Advisory Contracts was in the best interests of the fund and its shareholders and that the compensation payable under the Advisory Contracts was fair and reasonable. The Board's decision to renew the Advisory Contracts was not based on any single factor, but rather was based on a comprehensive consideration of all the information provided to the Board at its meetings throughout the year. The Board, in reaching its determination to renew the Advisory Contracts, was aware that shareholders of the fund have a broad range of investment choices available to them, including a wide choice among funds offered by Fidelity's competitors, and that the fund's shareholders, who have the opportunity to review and weigh the disclosure provided by the fund in its prospectus and other public disclosures, have chosen to invest in this fund, which is part of the Fidelity family of funds.
Nature, Extent, and Quality of Services Provided. The Board considered Fidelity's staffing as it relates to the fund, including the backgrounds of investment personnel of FMR and the sub-advisers (together, the Investment Advisers), and also considered the fund's investment objective, strategies, and related investment philosophy. The Independent Trustees also had discussions with senior management of Fidelity's investment operations and investment groups. The Board considered the structure of the portfolio manager compensation program and whether this structure provides appropriate incentives to act in the best interests of the fund. Additionally, the Board considered the portfolio managers' investments, if any, in the funds that they manage.
Resources Dedicated to Investment Management and Support Services. The Board and the Fund Oversight and Research Committees reviewed the general qualifications and capabilities of Fidelity's investment staff, including its size, education, experience, and resources, as well as Fidelity's approach to recruiting, training, managing, and compensating investment personnel. The Board noted that Fidelity has continued to increase the resources devoted to non-U.S. offices, including expansion of Fidelity's global investment organization. The Board also noted that Fidelity's analysts have extensive resources, tools and capabilities that allow them to conduct sophisticated quantitative and fundamental analysis, as well as credit analysis of issuers, counterparties and guarantors. Further, the Board believes that Fidelity's investment professionals have sufficient access to global information and data so as to provide competitive investment results over time, and that those professionals also have access to sophisticated tools that permit them to assess portfolio construction and risk and performance attribution characteristics continuously, as well as to transmit new information and research conclusions rapidly around the world. Additionally, in its deliberations, the Board considered Fidelity's trading and risk management capabilities and resources and global compliance infrastructure, which are an integral part of the investment management process.
Annual Report
Board Approval of Investment Advisory Contracts and
Management Fees - continued
Shareholder and Administrative Services. The Board considered (i) the nature, extent, quality, and cost of advisory, administrative, and shareholder services performed by the Investment Advisers and their affiliates under the Advisory Contracts and under separate agreements covering transfer agency, pricing and bookkeeping, and securities lending services for the fund; (ii) the nature and extent of the supervision of third party service providers, principally custodians and subcustodians; and (iii) the resources devoted to, and the record of compliance with, the fund's compliance policies and procedures. The Board also reviewed the allocation of fund brokerage, including allocations to brokers affiliated with the Investment Advisers, the use of brokerage commissions to pay fund expenses, and the use of "soft" commission dollars to pay for research services.
The Board noted that the growth of fund assets over time across the complex allows Fidelity to reinvest in the development of services designed to enhance the value or convenience of the Fidelity funds as investment vehicles. These services include 24-hour access to account information and market information through telephone representatives and over the Internet, investor education materials and asset allocation tools, and the expanded availability of Fidelity Investor Centers.
In 2014, the Board formed an ad hoc Committee on Transfer Agency Fees to review the variety of transfer agency fee structures throughout the industry and Fidelity's competitive positioning with respect to industry participants.
Investment in a Large Fund Family. The Board considered the benefits to shareholders of investing in a Fidelity fund, including the benefits of investing in a fund that is part of a large family of funds offering a variety of investment disciplines and providing a large variety of mutual fund investor services. The Board noted that Fidelity had taken, or had made recommendations that resulted in the Fidelity funds taking, a number of actions over the previous year that benefited particular funds, including (i) continuing to dedicate additional resources to investment research and to the support of the senior management team that oversees asset management; (ii) persisting in efforts to enhance Fidelity's global research capabilities; (iii) launching new funds and making other enhancements to meet client needs for income-oriented solutions; (iv) reducing fund expenses for certain index funds; (v) continuing to launch dedicated lower cost underlying funds to meet portfolio construction needs related to expanding underlying fund options for Fidelity funds of funds, specifically for the Freedom Fund product lines; (vi) rationalizing product lines and gaining increased efficiencies through fund mergers; (vii) launching sector-based exchange-traded funds and establishing a new Fidelity adviser to manage sector-based funds and products; (viii) continuing to develop and implement technology to improve security and increase efficiency; (ix) modifying the eligibility criteria for certain share classes to increase their marketability to a portion of the defined contribution plan market; (x) waiving redemption fees for certain qualified fund-of-fund and wrap programs and certain retirement plan transactions; and (xi) launching new Institutional Class shares of certain money market funds to attract and retain assets and to fill a gap in the money market fund lineup.
Annual Report
Investment Performance. The Board considered whether the fund has operated in accordance with its investment objective, as well as its record of compliance with its investment restrictions and its performance history.
The Board took into account discussions with the Investment Advisers about fund investment performance that occur at Board meetings throughout the year. In this regard the Board noted that as part of regularly scheduled fund reviews and other reports to the Board on fund performance, the Board periodically considers annualized return information for the fund, for different time periods, measured against a securities market index ("benchmark index") and a peer group of funds with similar objectives ("peer group"). In its evaluation of fund investment performance, the Board gave particular attention to information indicating changes in performance of certain Fidelity funds for specific time periods and the Investment Advisers' explanations for any overperformance or underperformance.
In addition to reviewing absolute and relative fund performance, the Independent Trustees periodically consider the appropriateness of fund performance metrics in evaluating the results achieved. In general, the Independent Trustees believe that fund performance should be evaluated based on net performance (after fees and expenses) of both the highest performing and lowest performing classes, where applicable, compared to appropriate benchmark indices, over appropriate time periods which may include full market cycles, and compared to peer groups, as applicable, over the same periods, taking into account relevant factors including the following: general market conditions; issuer-specific information; tactical opportunities for investment; and fund cash flows and other factors.
The Independent Trustees recognize that shareholders evaluate performance on a net basis over their own holding periods, for which one-, three-, and five-year periods are often used as a proxy. For this reason, the performance information reviewed by the Board also included net cumulative calendar year total return information for the fund and an appropriate benchmark index for the most recent one- and three-year periods, as shown below. A peer group comparison is not shown below.
Annual Report
Board Approval of Investment Advisory Contracts and
Management Fees - continued
Fidelity Global Commodity Stock Fund

The Board has discussed with FMR the fund's underperformance (based on the December 31, 2013 data presented herein) and has engaged with FMR to consider what steps might be taken to remediate the fund's underperformance. The Board noted that the fund's performance has improved for more recent periods.
Based on its review, the Board concluded that the nature, extent, and quality of services provided to the fund under the Advisory Contracts should benefit the fund's shareholders.
Competitiveness of Management Fee and Total Expense Ratio. The Board considered the fund's management fee and total expense ratio compared to "mapped groups" of competitive funds and classes. Fidelity creates "mapped groups" by combining similar Lipper investment objective categories that have comparable investment mandates. Combining Lipper investment objective categories aids the Board's management fee and total expense ratio comparisons by broadening the competitive group used for comparison and by reducing the number of universes to which various Fidelity funds are compared.
Management Fee. The Board considered two proprietary management fee comparisons for the 12-month (or shorter) periods shown in the chart below. The group of Lipper funds used by the Board for management fee comparisons is referred to below as the "Total Mapped Group." The Total Mapped Group comparison focuses on a fund's standing in terms of gross management fees before expense reimbursements or caps relative to the total universe of funds with comparable investment mandates, regardless of whether their management fee structures also are comparable. Funds with comparable investment mandates offer exposure to similar types of securities. Funds with comparable management fee structures have similar management fee contractual arrangements (e.g., flat rate charged for advisory services, all-inclusive fee rate, etc.). "TMG %" represents the percentage of funds in the Total Mapped Group that had management fees that were lower than the fund's. For example, a hypothetical TMG % of 20% would mean that 80% of the funds in the Total Mapped Group had higher, and 20% had lower, management fees than the fund. The fund's actual TMG %s are in the chart below. The "Asset-Size Peer Group" (ASPG) comparison focuses on a fund's standing relative to a subset of non-Fidelity funds within the Total Mapped Group that are similar in size and management fee structure. For example, if a fund is in the first quartile of the ASPG, the fund's management fee ranks in the least expensive or lowest 25% of funds in the ASPG. The ASPG represents at least 15% of the funds in the Total Mapped Group with comparable asset size and management fee structures, subject to a minimum of 50 funds (or all funds in the Total Mapped Group if fewer than 50). Additional information, such as the ASPG quartile in which the fund's management fee rate ranked, is also included in the chart and considered by the Board.
Annual Report
Fidelity Global Commodity Stock Fund
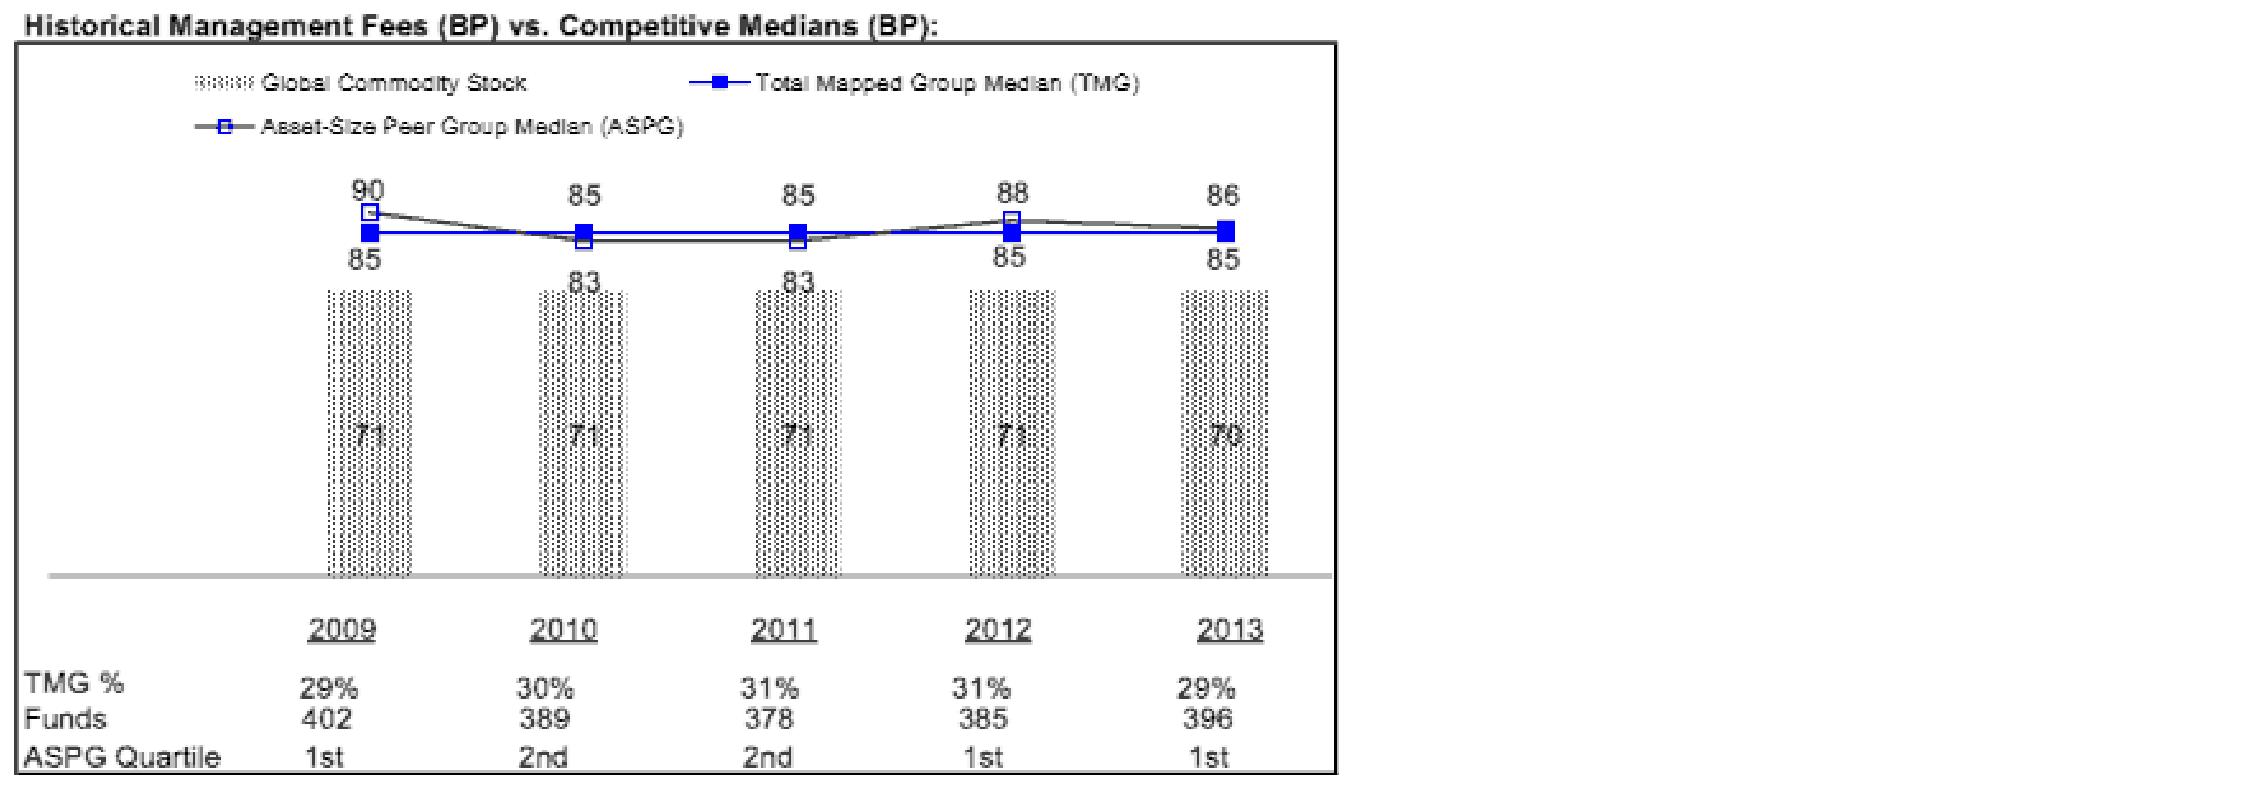
The Board noted that the fund's management fee rate ranked below the median of its Total Mapped Group and below the median of its ASPG for 2013.
The Board also noted that, in August 2013, the ad hoc Committee on Management Fees was formed to conduct an in-depth review of the management fee rates of Fidelity's active equity mutual funds. The Committee focused on the following areas: (i) standard fee structures; (ii) research consumption and trading evolution; (iii) management fee competitiveness/profitability by category; and (iv) factors that drive institutional pricing.
Annual Report
Board Approval of Investment Advisory Contracts and
Management Fees - continued
Based on its review, the Board concluded that the fund's management fee is fair and reasonable in light of the services that the fund receives and the other factors considered.
Total Expense Ratio. In its review of each class's total expense ratio, the Board considered the fund's management fee as well as other fund or class expenses, as applicable, such as transfer agent fees, pricing and bookkeeping fees, fund-paid 12b-1 fees, and custodial, legal, and audit fees. The Board also noted the effects of any waivers and reimbursements on fees and expenses. As part of its review, the Board also considered the current and historical total expense ratios of each class of the fund compared to competitive fund median expenses. Each class of the fund is compared to those funds and classes in the Total Mapped Group (used by the Board for management fee comparisons) that have a similar sales load structure.
The Board noted that the total expense ratio of each of Class A, Institutional Class, and the retail class ranked below its competitive median for 2013, the total expense ratio of Class C ranked equal to its competitive median for 2013, and the total expense ratio of each of Class T and Class B ranked above its competitive median for 2013. The Board considered that, in general, various factors can affect total expense ratios. The Board noted that the total expense ratio of Class T was above the competitive median primarily because of higher 12b-1 fees on Class T as compared to most competitor funds. Class T has a higher 12b-1 fee, but a lower front-end sales charge, than traditionally priced front-end sales charge classes. The Board considered that Class T is primarily sold load-waived in the retirement plan market where its 0.50% 12b-1 fee is comparable to competing no-load, higher 12b-1 fee classes designed specifically for retirement plans. The Board noted that the fund offers multiple classes, each of which has a different sales load and 12b-1 fee structure, and that the multiple structures are intended to offer a range of pricing options for the intermediary market. The Board also noted that the total expense ratios of the classes vary primarily by the level of their 12b-1 fees, although differences in transfer agent fees may also cause expenses to vary from class to class.
Fees Charged to Other Fidelity Clients. The Board also considered Fidelity fee structures and other information with respect to clients of Fidelity, such as other funds advised or subadvised by Fidelity, pension plan clients, and other institutional clients. The Board noted the findings of the 2013 ad hoc joint committee (created with the board of other Fidelity funds), which reviewed and compared Fidelity's institutional investment advisory business with its business of providing services to the Fidelity funds, including the differences in services provided, fees charged, and costs incurred, as well as competition in their respective marketplaces.
Based on its review of total expense ratios and fees charged to other Fidelity clients, the Board concluded that the total expense ratio of each class of the fund was reasonable, although in some cases above the median of the universe presented for comparison, in light of the services that the fund and its shareholders receive and the other factors considered.
Annual Report
Costs of the Services and Profitability. The Board considered the revenues earned and the expenses incurred by Fidelity in conducting the business of developing, marketing, distributing, managing, administering and servicing the fund and servicing the fund's shareholders. The Board also considered the level of Fidelity's profits in respect of all the Fidelity funds.
On an annual basis, Fidelity presents to the Board Fidelity's profitability for the fund. Fidelity calculates the profitability for each fund, as well as aggregate profitability for groups of Fidelity funds and all Fidelity funds, using a series of detailed revenue and cost allocation methodologies which originate with the books and records of Fidelity on which Fidelity's audited financial statements are based. The Audit Committee of the Board reviews any significant changes from the prior year's methodologies.
PricewaterhouseCoopers LLP (PwC), independent registered public accounting firm and auditor to Fidelity and certain Fidelity funds, has been engaged annually by the Board as part of the Board's assessment of Fidelity's profitability analysis. PwC's engagement includes the review and assessment of the methodologies used by Fidelity in determining the revenues and expenses attributable to Fidelity's mutual fund business, and completion of agreed-upon procedures in respect of the mathematical accuracy of fund profitability and its conformity to established allocation methodologies. After considering PwC's reports issued under the engagement and information provided by Fidelity, the Board concluded that while other allocation methods may also be reasonable, Fidelity's profitability methodologies are reasonable in all material respects.
The Board also reviewed Fidelity's non-fund businesses and fall-out benefits related to the mutual fund business as well as cases where Fidelity's affiliates may benefit from or be related to the fund's business.
The Board considered the costs of the services provided by and the profits realized by Fidelity in connection with the operation of the fund and was satisfied that the profitability was not excessive in the circumstances.
Economies of Scale. The Board considered whether there have been economies of scale in respect of the management of the Fidelity funds, whether the Fidelity funds (including the fund) have appropriately benefited from any such economies of scale, and whether there is potential for realization of any further economies of scale. The Board considered the extent to which the fund will benefit from economies of scale through increased services to the fund, through waivers or reimbursements, or through fee or expense ratio reductions. The Board also noted that in 2013, it and the boards of other Fidelity funds created an ad hoc committee (the Economies of Scale Committee) to analyze whether Fidelity attains economies of scale in respect of the management and servicing of the Fidelity funds, whether the Fidelity funds have appropriately benefited from such economies of scale, and whether there is potential for realization of any further economies of scale.
Annual Report
Board Approval of Investment Advisory Contracts and
Management Fees - continued
The Board recognized that the fund's management contract incorporates a "group fee" structure, which provides for lower group fee rates as total group assets increase, and for higher group fee rates as total group assets decrease (with "group assets" defined to include fund assets under FMR's management plus sector fund assets previously under FMR's management and currently managed by Fidelity SelectCo, LLC). FMR calculates the group fee rates based on a tiered asset "breakpoint" schedule that varies based on asset class. The Board considered that the group fee is designed to deliver the benefits of economies of scale to fund shareholders when total Fidelity fund assets increase, even if assets of any particular fund are unchanged or have declined, because some portion of Fidelity's costs are attributable to services provided to all Fidelity funds, and all funds benefit if those costs can be allocated among more assets. The Board concluded that, given the group fee structure, fund shareholders will benefit from lower management fees as group assets increase at the fund complex level, regardless of whether Fidelity achieves any such economies of scale.
The Board concluded, taking into account the analysis of the Economies of Scale Committee, that economies of scale, if any, are being appropriately shared between fund shareholders and Fidelity.
Additional Information Requested by the Board. In order to develop fully the factual basis for consideration of the Fidelity funds' Advisory Contracts, the Board requested and received additional information on certain topics, including: (i) fund performance trends and Fidelity's long-term strategies for certain funds; (ii) Fidelity's strategic marketing and product lineup goals; (iii) the methodology with respect to competitive fund data and peer group classifications; (iv) the arrangements with, and performance of, certain sub-advisers on behalf of the Fidelity funds, as well as certain proposed participating affiliate arrangements; (v) the realization of fall-out benefits in certain Fidelity business units; (vi) Fidelity's group fee structures, including the rationale for the individual fee rates of certain categories of funds and the definition of group assets; (vii) trends regarding industry use of performance fee structures and the performance adjustment methodologies applicable to the Fidelity funds; (viii) additional competitive analysis regarding the total expenses for certain classes; (ix) fund profitability methodology, including Fidelity's cost allocation methodology, and the impact of certain factors on fund profitability results; and (x) the process by which Fidelity determines sub-advisory fees for funds it advises.
Based on its evaluation of all of the conclusions noted above, and after considering all factors it believed relevant, the Board ultimately concluded that the advisory fee structures are fair and reasonable, and that the fund's Advisory Contracts should be renewed.
Annual Report
Investment Adviser
Fidelity Management & Research Company
Boston, MA
Investment Sub-Advisers
FMR Co., Inc.
Fidelity Management & Research
(U.K.) Inc.
FIL Investment Advisors
FIL Investments (Japan) Limited
FIL Investment Advisors
(U.K.) Limited
Fidelity Management & Research
(Hong Kong) Limited
Fidelity Management & Research
(Japan) Limited
General Distributor
Fidelity Distributors Corporation
Smithfield, RI
Transfer and Service Agents
Fidelity Investments Institutional
Operations Company, Inc.
Boston, MA
Fidelity Service Company, Inc.
Boston, MA
Custodian
State Street Bank and Trust Company
Quincy, MA
(Fidelity Investment logo)(registered trademark)
AGCSI-UANN-1214
1.879388.105
Fidelity®
Global Commodity Stock
Fund
Annual Report
October 31, 2014
(Fidelity Cover Art)
Contents
Performance | (Click Here) | How the fund has done over time. |
Management's Discussion of Fund Performance | (Click Here) | The Portfolio Manager's review of fund performance and strategy. |
Shareholder Expense Example | (Click Here) | An example of shareholder expenses. |
Investment Changes | (Click Here) | A summary of major shifts in the fund's investments over the past six months. |
Investments | (Click Here) | A complete list of the fund's investments with their market values. |
Financial Statements | (Click Here) | Statements of assets and liabilities, operations, and changes in net assets, as well as financial highlights. |
Notes | (Click Here) | Notes to the financial statements. |
Report of Independent Registered Public Accounting Firm | (Click Here) | |
Trustees and Officers | (Click Here) | |
Distributions | (Click Here) | |
Board Approval of Investment Advisory Contracts and Management Fees | (Click Here) | |
To view a fund's proxy voting guidelines and proxy voting record for the 12-month period ended June 30, visit http://www.fidelity.com/proxyvotingresults or visit the Securities and Exchange Commission's (SEC) web site at http://www.sec.gov. You may also call 1-800-544-8544 to request a free copy of the proxy voting guidelines.
Standard & Poor's, S&P and S&P 500 are registered service marks of The McGraw-Hill Companies, Inc. and have been licensed for use by Fidelity Distributors Corporation.
Other third-party marks appearing herein are the property of their respective owners.
All other marks appearing herein are registered or unregistered trademarks or service marks of FMR LLC or an affiliated company. © 2014 FMR LLC. All rights reserved.
Annual Report
This report and the financial statements contained herein are submitted for the general information of the shareholders of the fund. This report is not authorized for distribution to prospective investors in the fund unless preceded or accompanied by an effective prospectus.
A fund files its complete schedule of portfolio holdings with the SEC for the first and third quarters of each fiscal year on Form N-Q. Forms N-Q are available on the SEC's web site at http://www.sec.gov. A fund's Forms N-Q may be reviewed and copied at the SEC's Public Reference Room in Washington, DC. Information regarding the operation of the SEC's Public Reference Room may be obtained by calling 1-800-SEC-0330. For a complete list of a fund's portfolio holdings, view the most recent holdings listing, semiannual report, or annual report on Fidelity's web site at http://www.fidelity.com, http://www.advisor.fidelity.com, or http://www.401k.com, as applicable.
NOT FDIC INSURED • MAY LOSE VALUE • NO BANK GUARANTEE
Neither the fund nor Fidelity Distributors Corporation is a bank.
Annual Report
Average annual total return reflects the change in the value of an investment, assuming reinvestment of the class' distributions from dividend income and capital gains (the profits earned upon the sale of securities that have grown in value, if any) and assuming a constant rate of performance each year. The $10,000 table and the fund's returns do not reflect the deduction of taxes that a shareholder would pay on fund distributions or the redemption of fund shares. During periods of reimbursement by Fidelity, a fund's total return will be greater than it would be had the reimbursement not occurred. How a fund did yesterday is no guarantee of how it will do tomorrow.
Average Annual Total Returns
Periods ended October 31, 2014 | Past 1
year | Past 5
years | Life of
fund A |
Fidelity® Global Commodity Stock Fund | -5.16% | 1.05% | 6.21% |
A From March 25, 2009
$10,000 Over Life of Fund
Let's say hypothetically that $10,000 was invested in Fidelity® Global Commodity Stock Fund, a class of the fund, on March 25, 2009, when the fund started. The chart shows how the value of your investment would have changed, and also shows how the MSCI ACWI (All Country World Index) Index performed over the same period.
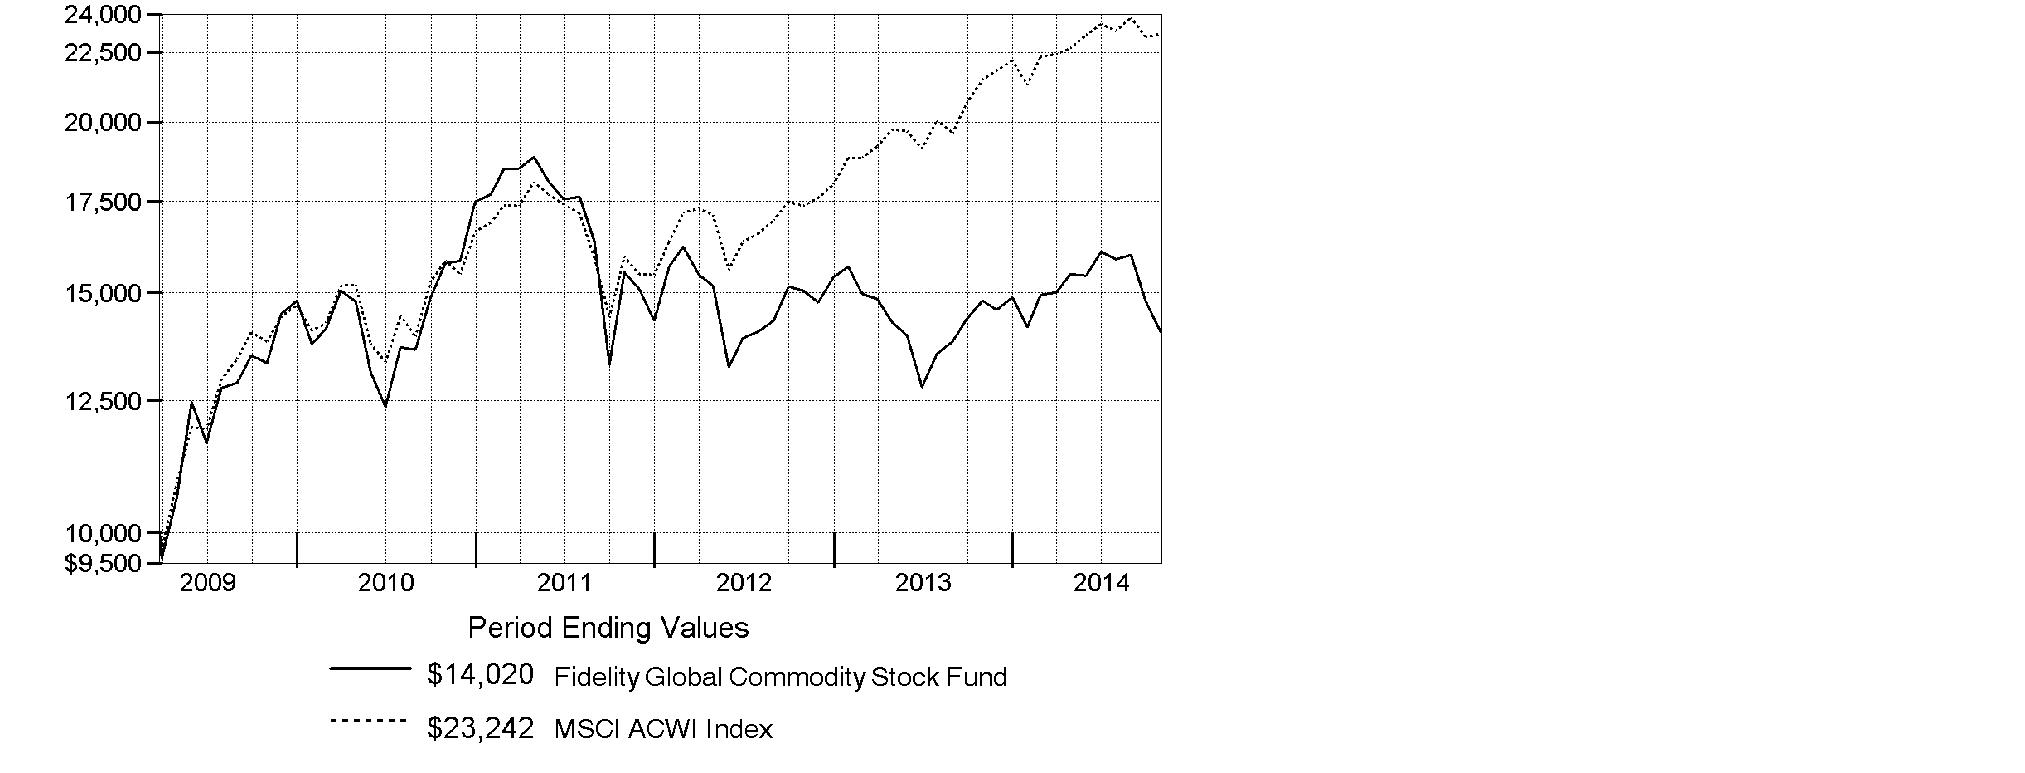
Annual Report
Market Recap: Global equities posted a healthy gain for the 12 months ending October 31, 2014, overcoming an October market decline driven by recessionary pressures in China and tepid growth in Europe. The MSCI ACWI (All Country World Index) Index rose 8.15%, helped by subdued market volatility for much of the period and supported by solid corporate earnings, especially in the United States. Stocks also benefited from easy monetary policies in Japan and the eurozone, as well as increased stimulus efforts in China. All but three of the 24 industry groups that compose the index marked a positive return. The U.S. (+17%) remained a pillar of strength, while a strongly rising dollar in the latter part of the period detracted from investors' returns in most non-U.S. markets. Canada (+5%) notched broad gains outside of its energy and materials sectors, as did Asia-Pacific ex Japan (+4%), led by investor enthusiasm for companies in India. The U.K., Europe and Japan, meanwhile, all underperformed. Among sectors, health care (+24%) led the index, with a strong contribution from the pharmaceuticals, biotechnology & life sciences industry. Information technology (+21%) also outperformed. Conversely, materials (-4%) and energy (-1%) lagged the index due to a higher supply of and lower demand for commodities.
Comments from S. Joseph Wickwire II, Portfolio Manager of Fidelity® Global Commodity Stock Fund: For the year, the fund's Retail Class shares returned -5.16%, underperforming the -4.55% return of the equity benchmark, the MSCI ACWI (All Country World Index) Commodity Producers Sector Capped Index, and the broader global equity market, as measured by the MSCI ACWI (All Country World Index) Index. Commodity stocks saw broadly positive and negative periods during the year. In August, we entered a period where concerns about China, Europe and the Middle East drove broader commodity prices down, and that negative sentiment persisted into period end. Versus the industry benchmark, the largest detractor was within the challenged coal industry, where it was costly to hang with Peabody Energy. Stock picking in aluminum, steel and energy-industry drillers also detracted. On the positive side, good stock picks in fertilizers, energy exploration & production, construction machinery were relative positives. The largest contribution came from fertilizers, especially overweightings in CF Industries Holdings and Potash Corporation of Saskatchewan.
The views expressed above reflect those of the portfolio manager(s) only through the end of the period as stated on the cover of this report and do not necessarily represent the views of Fidelity or any other person in the Fidelity organization. Any such views are subject to change at any time based upon market or other conditions and Fidelity disclaims any responsibility to update such views. These views may not be relied on as investment advice and, because investment decisions for a Fidelity fund are based on numerous factors, may not be relied on as an indication of trading intent on behalf of any Fidelity fund.
Annual Report
Shareholder Expense Example
As a shareholder of the Fund, you incur two types of costs: (1) transaction costs, including sales charges (loads) on purchase payments or redemption proceeds, redemption fees and (2) ongoing costs, including management fees, distribution and/or service (12b-1) fees and other Fund expenses. This Example is intended to help you understand your ongoing costs (in dollars) of investing in the Fund and to compare these costs with the ongoing costs of investing in other mutual funds.
The Example is based on an investment of $1,000 invested at the beginning of the period and held for the entire period (May 1, 2014 to October 31, 2014).
Actual Expenses
The first line of the accompanying table for each class of the Fund provides information about actual account values and actual expenses. You may use the information in this line, together with the amount you invested, to estimate the expenses that you paid over the period. Simply divide your account value by $1,000.00 (for example, an $8,600 account value divided by $1,000.00 = 8.6), then multiply the result by the number in the first line for a class of the Fund under the heading entitled "Expenses Paid During Period" to estimate the expenses you paid on your account during this period. A small balance maintenance fee of $12.00 that is charged once a year may apply for certain accounts with a value of less than $2,000. This fee is not included in the table below. If it was, the estimate of expenses you paid during the period would be higher, and your ending account value lower, by this amount. In addition, the Fund, as a shareholder in the underlying Fidelity Central Funds, will indirectly bear its pro-rata share of the fees and expenses incurred by the underlying Fidelity Central Funds. These fees and expenses are not included in the Fund's annualized expense ratio used to calculate the expense estimate in the table below.
Hypothetical Example for Comparison Purposes
The second line of the accompanying table for each class of the Fund provides information about hypothetical account values and hypothetical expenses based on a Class' actual expense ratio and an assumed rate of return of 5% per year before expenses, which is not the Class' actual return. The hypothetical account values and expenses may not be used to estimate the actual ending account balance or expenses you paid for the period. You may use this information to compare the ongoing costs of investing in the Fund and other funds. To do so, compare this 5% hypothetical example with the 5% hypothetical examples that appear in the shareholder reports of the other funds. A small balance maintenance fee of $12.00 that is charged once a year may apply for certain accounts with a value of less than $2,000. This fee is not included in the table below. If it was, the estimate of expenses you paid during the period would be higher, and your ending account value lower, by this amount. In addition, the Fund, as a shareholder in the underlying Fidelity Central Funds, will indirectly bear its pro-rata share of the fees and expenses incurred by the underlying Fidelity Central Funds. These fees and expenses are not included in the Fund's annualized expense ratio used to calculate the expense estimate in the table below.
Please note that the expenses shown in the table are meant to highlight your ongoing costs only and do not reflect any transaction costs. Therefore, the second line of the table is useful in comparing ongoing costs only, and will not help you determine the relative total costs of owning different funds. In addition, if these transactional costs were included, your costs would have been higher.
Annual Report
| Annualized
Expense Ratio B | Beginning
Account Value
May 1, 2014 | Ending
Account Value
October 31, 2014 | Expenses Paid
During Period*
May 1, 2014
to October 31, 2014 |
Class A | 1.33% | | | |
Actual | | $ 1,000.00 | $ 905.70 | $ 6.39 |
HypotheticalA | | $ 1,000.00 | $ 1,018.50 | $ 6.77 |
Class T | 1.60% | | | |
Actual | | $ 1,000.00 | $ 904.20 | $ 7.68 |
HypotheticalA | | $ 1,000.00 | $ 1,017.14 | $ 8.13 |
Class B | 2.09% | | | |
Actual | | $ 1,000.00 | $ 902.30 | $ 10.02 |
HypotheticalA | | $ 1,000.00 | $ 1,014.67 | $ 10.61 |
Class C | 2.09% | | | |
Actual | | $ 1,000.00 | $ 901.90 | $ 10.02 |
HypotheticalA | | $ 1,000.00 | $ 1,014.67 | $ 10.61 |
Global Commodity Stock | 1.10% | | | |
Actual | | $ 1,000.00 | $ 906.70 | $ 5.29 |
HypotheticalA | | $ 1,000.00 | $ 1,019.66 | $ 5.60 |
Institutional Class | 1.05% | | | |
Actual | | $ 1,000.00 | $ 906.70 | $ 5.05 |
HypotheticalA | | $ 1,000.00 | $ 1,019.91 | $ 5.35 |
A 5% return per year before expenses
B Annualized expense ratio reflects expenses net of applicable fee waivers.
* Expenses are equal to each Class' annualized expense ratio, multiplied by the average account value over the period, multiplied by 184/365 (to reflect the one-half year period).
Annual Report
Investment Changes (Unaudited)
Top Ten Stocks as of October 31, 2014 |
| % of fund's
net assets | % of fund's net assets
6 months ago |
Monsanto Co. | 7.4 | 7.4 |
Potash Corp. of Saskatchewan, Inc. | 6.1 | 3.4 |
BHP Billiton PLC | 6.0 | 7.0 |
Syngenta AG (Switzerland) | 3.6 | 4.0 |
Rio Tinto PLC | 3.3 | 3.6 |
Chevron Corp. | 3.3 | 3.2 |
Anadarko Petroleum Corp. | 3.3 | 2.4 |
Archer Daniels Midland Co. | 2.9 | 3.0 |
CF Industries Holdings, Inc. | 2.9 | 1.8 |
EOG Resources, Inc. | 2.6 | 1.1 |
| 41.4 | |
Top Sectors (% of fund's net assets) |
As of October 31, 2014 |
 | Agriculture 36.9% | |
 | Energy 30.0% | |
 | Metals 29.2% | |
 | Other 3.3% | |
 | Short-Term
Investments and
Net Other Assets 0.6% | |

As of April 30, 2014 |
| Agriculture 33.1% | |
| Energy 32.2% | |
| Metals 31.3% | |
| Other 2.6% | |
| Short-Term
Investments and
Net Other Assets 0.8% | |

Annual Report
Investments October 31, 2014
Showing Percentage of Net Assets
Common Stocks - 97.4% |
| Shares | | Value |
CHEMICALS - 27.7% |
Commodity Chemicals - 0.1% |
Cabot Corp. | 7,700 | | $ 357,511 |
Westlake Chemical Corp. | 500 | | 35,275 |
| | 392,786 |
Diversified Chemicals - 0.6% |
Eastman Chemical Co. | 6,800 | | 549,304 |
FMC Corp. | 11,300 | | 648,055 |
Huntsman Corp. | 27,700 | | 675,880 |
| | 1,873,239 |
Fertilizers & Agricultural Chemicals - 27.0% |
Agrium, Inc. | 70,500 | | 6,897,684 |
CF Industries Holdings, Inc. | 35,772 | | 9,300,720 |
China BlueChemical Ltd. (H Shares) | 966,000 | | 343,038 |
Intrepid Potash, Inc. (a)(d) | 240,700 | | 3,237,415 |
K&S AG | 21,300 | | 594,299 |
Monsanto Co. | 211,200 | | 24,296,448 |
Potash Corp. of Saskatchewan, Inc. (d) | 580,400 | | 19,811,000 |
Syngenta AG (Switzerland) | 38,487 | | 11,902,397 |
The Mosaic Co. | 171,159 | | 7,584,055 |
Uralkali OJSC GDR (Reg. S) | 96,100 | | 1,717,307 |
Yara International ASA | 57,300 | | 2,630,977 |
| | 88,315,340 |
TOTAL CHEMICALS | | 90,581,365 |
CONSTRUCTION & ENGINEERING - 0.2% |
Construction & Engineering - 0.2% |
Chiyoda Corp. | 34,000 | | 350,262 |
Jacobs Engineering Group, Inc. (a) | 7,500 | | 355,875 |
| | 706,137 |
CONTAINERS & PACKAGING - 1.2% |
Paper Packaging - 1.2% |
Rock-Tenn Co. Class A | 74,200 | | 3,795,330 |
ELECTRICAL EQUIPMENT - 0.4% |
Electrical Components & Equipment - 0.3% |
OSRAM Licht AG (a) | 22,545 | | 789,933 |
Common Stocks - continued |
| Shares | | Value |
ELECTRICAL EQUIPMENT - CONTINUED |
Heavy Electrical Equipment - 0.1% |
Vestas Wind Systems A/S (a) | 13,600 | | $ 455,203 |
TOTAL ELECTRICAL EQUIPMENT | | 1,245,136 |
ENERGY EQUIPMENT & SERVICES - 0.9% |
Oil & Gas Drilling - 0.4% |
Ocean Rig UDW, Inc. (United States) | 21,947 | | 301,771 |
Odfjell Drilling A/S | 112,932 | | 333,190 |
Vantage Drilling Co. (a) | 634,982 | | 614,345 |
| | 1,249,306 |
Oil & Gas Equipment & Services - 0.5% |
Dril-Quip, Inc. (a) | 3,326 | | 299,174 |
Ezion Holdings Ltd. | 288,000 | | 339,146 |
Halliburton Co. | 12,100 | | 667,194 |
SBM Offshore NV (a)(d) | 43,200 | | 540,332 |
| | 1,845,846 |
TOTAL ENERGY EQUIPMENT & SERVICES | | 3,095,152 |
FOOD PRODUCTS - 5.7% |
Agricultural Products - 5.7% |
Archer Daniels Midland Co. | 204,700 | | 9,620,900 |
Bunge Ltd. | 65,200 | | 5,779,980 |
China Agri-Industries Holdings Ltd. | 930,300 | | 355,415 |
First Resources Ltd. | 911,000 | | 1,475,898 |
Golden Agri-Resources Ltd. | 2,756,000 | | 1,116,874 |
SLC Agricola SA | 47,800 | | 325,817 |
| | 18,674,884 |
INDEPENDENT POWER PRODUCERS & ENERGY TRADERS - 0.2% |
Independent Power Producers & Energy Traders - 0.2% |
Dynegy, Inc. (a) | 23,200 | | 707,600 |
MACHINERY - 0.8% |
Agricultural & Farm Machinery - 0.6% |
AGCO Corp. | 10,700 | | 474,117 |
Deere & Co. | 19,400 | | 1,659,476 |
| | 2,133,593 |
Common Stocks - continued |
| Shares | | Value |
MACHINERY - CONTINUED |
Construction Machinery & Heavy Trucks - 0.2% |
Cummins, Inc. | 2,300 | | $ 336,214 |
Manitowoc Co., Inc. | 12,000 | | 250,080 |
| | 586,294 |
TOTAL MACHINERY | | 2,719,887 |
METALS & MINING - 27.6% |
Aluminum - 0.2% |
Alcoa, Inc. | 20,000 | | 335,200 |
Constellium NV (a) | 15,600 | | 315,900 |
| | 651,100 |
Diversified Metals & Mining - 17.3% |
Anglo American PLC (United Kingdom) | 235,151 | | 4,964,871 |
BHP Billiton PLC | 758,164 | | 19,588,385 |
First Quantum Minerals Ltd. | 179,724 | | 2,710,889 |
Freeport-McMoRan, Inc. | 172,000 | | 4,902,000 |
Glencore Xstrata PLC | 1,455,999 | | 7,450,988 |
Grupo Mexico SA de CV Series B | 416,211 | | 1,430,100 |
Ivanhoe Mines Ltd. (a) | 709,500 | | 535,092 |
Ivanhoe Mines Ltd. Class A warrants 12/10/15 (a)(e) | 422,500 | | 18,744 |
Norilsk Nickel OJSC sponsored ADR | 80,000 | | 1,495,200 |
Rio Tinto PLC | 229,587 | | 10,924,079 |
Sesa Sterlite Ltd. | 200,897 | | 838,196 |
Sumitomo Metal Mining Co. Ltd. | 45,000 | | 624,264 |
Teck Resources Ltd. Class B (sub. vtg.) | 74,800 | | 1,182,013 |
| | 56,664,821 |
Gold - 5.6% |
Agnico Eagle Mines Ltd. (Canada) | 36,500 | | 860,157 |
AngloGold Ashanti Ltd. sponsored ADR (a) | 49,300 | | 407,711 |
Argonaut Gold, Inc. (a) | 201,500 | | 429,085 |
B2Gold Corp. (a) | 1,476,180 | | 2,462,374 |
Barrick Gold Corp. | 151,800 | | 1,802,124 |
Compania de Minas Buenaventura SA sponsored ADR | 30,700 | | 282,440 |
Continental Gold Ltd. (a) | 184,500 | | 309,396 |
Detour Gold Corp. (a) | 50,100 | | 293,385 |
Eldorado Gold Corp. | 201,850 | | 1,103,231 |
Franco-Nevada Corp. | 22,900 | | 1,072,006 |
Gold Fields Ltd. sponsored ADR | 88,200 | | 281,358 |
Goldcorp, Inc. | 125,610 | | 2,357,173 |
Kinross Gold Corp. (a) | 130,405 | | 278,848 |
Common Stocks - continued |
| Shares | | Value |
METALS & MINING - CONTINUED |
Gold - continued |
New Gold, Inc. (a) | 110,500 | | $ 400,998 |
Newcrest Mining Ltd. (a) | 109,024 | | 906,690 |
Newmont Mining Corp. | 72,800 | | 1,365,728 |
Premier Gold Mines Ltd. (a) | 368,900 | | 592,440 |
Pretium Resources, Inc. (a) | 70,800 | | 324,145 |
Randgold Resources Ltd. sponsored ADR | 22,600 | | 1,315,546 |
Royal Gold, Inc. | 10,700 | | 611,505 |
Torex Gold Resources, Inc. (a) | 290,500 | | 309,303 |
Yamana Gold, Inc. | 121,700 | | 484,835 |
| | 18,250,478 |
Precious Metals & Minerals - 0.4% |
Aquarius Platinum Ltd. (United Kingdom) (a) | 1,164,300 | | 307,318 |
Fresnillo PLC | 37,100 | | 413,958 |
Impala Platinum Holdings Ltd. (a) | 44,000 | | 320,294 |
Tahoe Resources, Inc. (a) | 18,053 | | 312,830 |
| | 1,354,400 |
Silver - 0.4% |
Silver Wheaton Corp. | 74,200 | | 1,289,719 |
Steel - 3.7% |
ArcelorMittal SA Class A unit (d) | 160,100 | | 2,106,916 |
Fortescue Metals Group Ltd. (d) | 228,996 | | 706,759 |
Hyundai Steel Co. | 8,527 | | 540,455 |
JFE Holdings, Inc. | 67,600 | | 1,341,182 |
Maanshan Iron & Steel Ltd. (H Shares) (a) | 1,470,000 | | 383,297 |
Nippon Steel & Sumitomo Metal Corp. | 994,000 | | 2,623,013 |
POSCO | 9,852 | | 2,830,487 |
Steel Dynamics, Inc. | 27,400 | | 630,474 |
Tata Steel Ltd. | 39,717 | | 317,003 |
Thyssenkrupp AG (a) | 26,400 | | 634,370 |
| | 12,113,956 |
TOTAL METALS & MINING | | 90,324,474 |
OIL, GAS & CONSUMABLE FUELS - 28.7% |
Coal & Consumable Fuels - 1.5% |
Cameco Corp. | 19,600 | | 340,333 |
China Shenhua Energy Co. Ltd. (H Shares) | 160,500 | | 452,375 |
Cloud Peak Energy, Inc. (a) | 28,700 | | 343,539 |
Common Stocks - continued |
| Shares | | Value |
OIL, GAS & CONSUMABLE FUELS - CONTINUED |
Coal & Consumable Fuels - continued |
CONSOL Energy, Inc. | 12,300 | | $ 452,640 |
Peabody Energy Corp. (d) | 327,798 | | 3,418,933 |
| | 5,007,820 |
Integrated Oil & Gas - 12.6% |
BG Group PLC | 234,950 | | 3,915,684 |
Cenovus Energy, Inc. | 36,700 | | 908,179 |
Chevron Corp. | 90,100 | | 10,807,495 |
Exxon Mobil Corp. | 33,261 | | 3,216,671 |
Gazprom OAO sponsored ADR | 131,100 | | 864,998 |
Hess Corp. | 12,800 | | 1,085,568 |
Imperial Oil Ltd. | 9,600 | | 461,921 |
LUKOIL Oil Co. sponsored ADR (United Kingdom) | 6,600 | | 324,060 |
Occidental Petroleum Corp. | 31,200 | | 2,774,616 |
PetroChina Co. Ltd. (H Shares) | 1,040,000 | | 1,302,022 |
Royal Dutch Shell PLC Class A (United Kingdom) | 32,250 | | 1,152,027 |
Suncor Energy, Inc. | 224,732 | | 7,979,925 |
Total SA | 96,400 | | 5,755,399 |
YPF SA Class D sponsored ADR | 20,600 | | 724,502 |
| | 41,273,067 |
Oil & Gas Exploration & Production - 14.4% |
Anadarko Petroleum Corp. | 117,500 | | 10,784,150 |
Apache Corp. | 12,700 | | 980,440 |
Bonanza Creek Energy, Inc. (a) | 7,900 | | 357,396 |
Cabot Oil & Gas Corp. | 112,100 | | 3,486,310 |
Cairn Energy PLC (a) | 135,199 | | 313,819 |
Canadian Natural Resources Ltd. | 84,400 | | 2,945,257 |
Chesapeake Energy Corp. | 23,000 | | 510,140 |
Cimarex Energy Co. | 16,100 | | 1,830,087 |
Cobalt International Energy, Inc. (a) | 50,400 | | 590,184 |
Concho Resources, Inc. (a) | 7,300 | | 795,919 |
ConocoPhillips Co. | 56,300 | | 4,062,045 |
Continental Resources, Inc. (a) | 6,600 | | 372,042 |
Denbury Resources, Inc. | 27,800 | | 344,720 |
Devon Energy Corp. | 18,300 | | 1,098,000 |
Encana Corp. | 27,600 | | 514,263 |
Energen Corp. | 4,600 | | 311,420 |
EOG Resources, Inc. | 88,300 | | 8,392,915 |
EQT Corp. | 7,400 | | 695,896 |
Kosmos Energy Ltd. (a) | 73,100 | | 682,023 |
Marathon Oil Corp. | 30,200 | | 1,069,080 |
Common Stocks - continued |
| Shares | | Value |
OIL, GAS & CONSUMABLE FUELS - CONTINUED |
Oil & Gas Exploration & Production - continued |
Murphy Oil Corp. | 9,200 | | $ 491,188 |
Noble Energy, Inc. | 24,000 | | 1,383,120 |
NOVATEK OAO GDR (Reg. S) | 3,100 | | 332,940 |
Ophir Energy PLC (a) | 174,800 | | 518,150 |
Pioneer Natural Resources Co. | 6,760 | | 1,278,046 |
QEP Resources, Inc. | 13,400 | | 335,938 |
Range Resources Corp. | 9,000 | | 615,600 |
Southwestern Energy Co. (a) | 17,400 | | 565,674 |
Talisman Energy, Inc. | 53,000 | | 338,113 |
Tullow Oil PLC | 97,100 | | 754,597 |
Whiting Petroleum Corp. (a) | 5,800 | | 355,192 |
| | 47,104,664 |
Oil & Gas Refining & Marketing - 0.1% |
Valero Energy Corp. | 7,700 | | 385,693 |
Oil & Gas Storage & Transport - 0.1% |
Golar LNG Ltd. | 6,200 | | 347,882 |
TOTAL OIL, GAS & CONSUMABLE FUELS | | 94,119,126 |
PAPER & FOREST PRODUCTS - 3.6% |
Paper Products - 3.6% |
Empresas CMPC SA | 418,880 | | 1,022,777 |
International Paper Co. | 156,300 | | 7,911,906 |
Stora Enso Oyj (R Shares) | 137,900 | | 1,136,222 |
UPM-Kymmene Corp. | 99,600 | | 1,575,149 |
| | 11,646,054 |
SPECIALTY RETAIL - 0.3% |
Specialty Stores - 0.3% |
Tsutsumi Jewelry Co. Ltd. | 41,900 | | 1,030,593 |
TRADING COMPANIES & DISTRIBUTORS - 0.1% |
Trading Companies & Distributors - 0.1% |
Noble Group Ltd. | 499,000 | | 464,498 |
TOTAL COMMON STOCKS (Cost $379,587,457) |
319,110,236
|
Nonconvertible Preferred Stocks - 2.0% |
| Shares | | Value |
METALS & MINING - 1.7% |
Steel - 1.7% |
Bradespar SA (PN) | 54,600 | | $ 368,862 |
Gerdau SA sponsored ADR | 258,500 | | 1,171,005 |
Vale SA (PN-A) sponsored ADR | 430,000 | | 3,766,800 |
| | 5,306,667 |
OIL, GAS & CONSUMABLE FUELS - 0.3% |
Integrated Oil & Gas - 0.3% |
Petroleo Brasileiro SA - Petrobras (PN) sponsored (non-vtg.) | 85,100 | | 1,040,773 |
TOTAL NONCONVERTIBLE PREFERRED STOCKS (Cost $13,672,822) |
6,347,440
|
Money Market Funds - 4.7% |
| | | |
Fidelity Securities Lending Cash Central Fund, 0.11% (b)(c)
(Cost $15,443,448) | 15,443,448 | |
15,443,448
|
TOTAL INVESTMENT PORTFOLIO - 104.1% (Cost $408,703,727) | | 340,901,124 |
NET OTHER ASSETS (LIABILITIES) - (4.1)% | | (13,281,248) |
NET ASSETS - 100% | $ 327,619,876 |
Legend |
(a) Non-income producing |
(b) Affiliated fund that is generally available only to investment companies and other accounts managed by Fidelity Investments. The rate quoted is the annualized seven-day yield of the fund at period end. A complete unaudited listing of the fund's holdings as of its most recent quarter end is available upon request. In addition, each Fidelity Central Fund's financial statements, which are not covered by the Fund's Report of Independent Registered Public Accounting Firm, are available on the SEC's website or upon request. |
(c) Investment made with cash collateral received from securities on loan. |
(d) Security or a portion of the security is on loan at period end. |
(e) Security exempt from registration under Rule 144A of the Securities Act of 1933. These securities may be resold in transactions exempt from registration, normally to qualified institutional buyers. At the end of the period, the value of these securities amounted to $18,744 or 0.0% of net assets. |
Affiliated Central Funds |
Information regarding fiscal year to date income earned by the Fund from investments in Fidelity Central Funds is as follows: |
Fund | Income earned |
Fidelity Cash Central Fund | $ 539 |
Fidelity Securities Lending Cash Central Fund | 180,323 |
Total | $ 180,862 |
Other Information |
The following is a summary of the inputs used, as of October 31, 2014, involving the Fund's assets and liabilities carried at fair value. The inputs or methodology used for valuing securities may not be an indication of the risk associated with investing in those securities. For more information on valuation inputs, and their aggregation into the levels used in the table below, please refer to the Investment Valuation section in the accompanying Notes to Financial Statements. |
Valuation Inputs at Reporting Date: |
Description | Total | Level 1 | Level 2 | Level 3 |
Investments in Securities: | | | | |
Common Stocks | $ 319,110,236 | $ 243,106,382 | $ 76,003,854 | $ - |
Nonconvertible Preferred Stocks | 6,347,440 | 6,347,440 | - | - |
Money Market Funds | 15,443,448 | 15,443,448 | - | - |
Total Investments in Securities: | $ 340,901,124 | $ 264,897,270 | $ 76,003,854 | $ - |
The following is a summary of transfers between Level 1 and Level 2 for the period ended October 31, 2014. Transfers are assumed to have occurred at the beginning of the period, and are primarily attributable to the valuation techniques used for foreign equity securities, as discussed in the accompanying Notes to Financial Statements: |
Transfers | Total |
Level 1 to Level 2 | $ 17,170,440 |
Level 2 to Level 1 | $ 0 |
Distribution of investments by country or territory of incorporation, as a percentage of total net assets, is as follows (Unaudited): |
United States of America | 44.4% |
Canada | 18.1% |
United Kingdom | 13.0% |
Switzerland | 3.6% |
Bailiwick of Jersey | 2.7% |
Bermuda | 2.5% |
Brazil | 2.1% |
Japan | 1.8% |
France | 1.8% |
Russia | 1.5% |
Korea (South) | 1.1% |
Others (Individually Less Than 1%) | 7.4% |
| 100.0% |
See accompanying notes which are an integral part of the financial statements.
Annual Report
Statement of Assets and Liabilities
| October 31, 2014 |
| | |
Assets | | |
Investment in securities, at value (including securities loaned of $15,099,435) - See accompanying schedule: Unaffiliated issuers (cost $393,260,279) | $ 325,457,676 | |
Fidelity Central Funds (cost $15,443,448) | 15,443,448 | |
Total Investments (cost $408,703,727) | | $ 340,901,124 |
Receivable for investments sold | | 4,867,696 |
Receivable for fund shares sold | | 312,550 |
Dividends receivable | | 736,381 |
Distributions receivable from Fidelity Central Funds | | 15,237 |
Prepaid expenses | | 567 |
Other receivables | | 5,797 |
Total assets | | 346,839,352 |
| | |
Liabilities | | |
Payable to custodian bank | $ 116,463 | |
Payable for investments purchased | 2,758,995 | |
Payable for fund shares redeemed | 518,466 | |
Accrued management fee | 192,660 | |
Distribution and service plan fees payable | 31,254 | |
Other affiliated payables | 104,668 | |
Other payables and accrued expenses | 53,522 | |
Collateral on securities loaned, at value | 15,443,448 | |
Total liabilities | | 19,219,476 |
| | |
Net Assets | | $ 327,619,876 |
Net Assets consist of: | | |
Paid in capital | | $ 437,681,967 |
Undistributed net investment income | | 3,567,856 |
Accumulated undistributed net realized gain (loss) on investments and foreign currency transactions | | (45,809,703) |
Net unrealized appreciation (depreciation) on investments and assets and liabilities in foreign currencies | | (67,820,244) |
Net Assets | | $ 327,619,876 |
See accompanying notes which are an integral part of the financial statements.
Annual Report
Statement of Assets and Liabilities - continued
| October 31, 2014 |
| | |
Calculation of Maximum Offering Price Class A:
Net Asset Value and redemption price per share ($51,586,180 ÷ 3,893,125 shares) | | $ 13.25 |
| | |
Maximum offering price per share (100/94.25 of $13.25) | | $ 14.06 |
Class T:
Net Asset Value and redemption price per share ($9,866,622 ÷ 746,868 shares) | | $ 13.21 |
| | |
Maximum offering price per share (100/96.50 of $13.21) | | $ 13.69 |
Class B:
Net Asset Value and offering price per share ($1,584,114 ÷ 120,777 shares)A | | $ 13.12 |
| | |
Class C:
Net Asset Value and offering price per share ($17,658,820 ÷ 1,352,048 shares)A | | $ 13.06 |
| | |
Global Commodity Stock:
Net Asset Value, offering price and redemption price per share ($223,083,774 ÷ 16,762,098 shares) | | $ 13.31 |
| | |
Institutional Class:
Net Asset Value, offering price and redemption price per share ($23,840,366 ÷ 1,790,808 shares) | | $ 13.31 |
A Redemption price per share is equal to net asset value less any applicable contingent deferred sales charge.
See accompanying notes which are an integral part of the financial statements.
Annual Report
Financial Statements - continued
Statement of Operations
| Year ended October 31, 2014 |
| | |
Investment Income | | |
Dividends | | $ 9,555,544 |
Income from Fidelity Central Funds | | 180,862 |
Income before foreign taxes withheld | | 9,736,406 |
Less foreign taxes withheld | | (590,900) |
Total income | | 9,145,506 |
| | |
Expenses | | |
Management fee | $ 2,673,662 | |
Transfer agent fees | 1,134,113 | |
Distribution and service plan fees | 447,025 | |
Accounting and security lending fees | 201,778 | |
Custodian fees and expenses | 55,282 | |
Independent trustees' compensation | 1,596 | |
Registration fees | 87,169 | |
Audit | 56,364 | |
Legal | 1,405 | |
Miscellaneous | 3,267 | |
Total expenses before reductions | 4,661,661 | |
Expense reductions | (11,330) | 4,650,331 |
Net investment income (loss) | | 4,495,175 |
Realized and Unrealized Gain (Loss) Net realized gain (loss) on: | | |
Investment securities: | | |
Unaffiliated issuers | (3,578,242) | |
Foreign currency transactions | (103,036) | |
Total net realized gain (loss) | | (3,681,278) |
Change in net unrealized appreciation (depreciation) on: Investment securities | (18,616,435) | |
Assets and liabilities in foreign currencies | (28,605) | |
Total change in net unrealized appreciation (depreciation) | | (18,645,040) |
Net gain (loss) | | (22,326,318) |
Net increase (decrease) in net assets resulting from operations | | $ (17,831,143) |
See accompanying notes which are an integral part of the financial statements.
Annual Report
Statement of Changes in Net Assets
| Year ended
October 31,
2014 | Year ended
October 31,
2013 |
Increase (Decrease) in Net Assets | | |
Operations | | |
Net investment income (loss) | $ 4,495,175 | $ 6,058,817 |
Net realized gain (loss) | (3,681,278) | (772,445) |
Change in net unrealized appreciation (depreciation) | (18,645,040) | (21,248,344) |
Net increase (decrease) in net assets resulting
from operations | (17,831,143) | (15,961,972) |
Distributions to shareholders from net investment income | (4,765,250) | (5,697,049) |
Distributions to shareholders from net realized gain | (367,709) | - |
Total distributions | (5,132,959) | (5,697,049) |
Share transactions - net increase (decrease) | (64,489,864) | (152,423,209) |
Redemption fees | 7,328 | 18,199 |
Total increase (decrease) in net assets | (87,446,638) | (174,064,031) |
| | |
Net Assets | | |
Beginning of period | 415,066,514 | 589,130,545 |
End of period (including undistributed net investment income of $3,567,856 and undistributed net investment income of $4,309,466, respectively) | $ 327,619,876 | $ 415,066,514 |
See accompanying notes which are an integral part of the financial statements.
Annual Report
Financial Highlights - Class A
Years ended October 31, | 2014 | 2013 | 2012 | 2011 | 2010 |
Selected Per-Share Data | | | | | |
Net asset value, beginning of period | $ 14.17 | $ 14.59 | $ 15.14 | $ 15.60 | $ 13.29 |
Income from Investment Operations | | | | | |
Net investment income (loss) C | .15 | .16 | .11 | .12 | .19 F |
Net realized and unrealized gain (loss) | (.91) | (.45) | (.59) | (.38) | 2.20 |
Total from investment operations | (.76) | (.29) | (.48) | (.26) | 2.39 |
Distributions from net investment income | (.15) | (.13) | (.05) | (.13) | - H |
Distributions from net realized gain | (.01) | - | (.01) | (.06) | (.08) |
Total distributions | (.16) | (.13) | (.07) J | (.20) I | (.08) |
Redemption fees added to paid in capital C, H | - | - | - | - | - |
Net asset value, end of period | $ 13.25 | $ 14.17 | $ 14.59 | $ 15.14 | $ 15.60 |
Total ReturnA, B | (5.41)% | (2.00)% | (3.19)% | (1.80)% | 18.04% |
Ratios to Average Net Assets D, G | | | | | |
Expenses before reductions | 1.35% | 1.36% | 1.34% | 1.32% | 1.37% |
Expenses net of fee waivers, if any | 1.35% | 1.35% | 1.34% | 1.32% | 1.37% |
Expenses net of all reductions | 1.35% | 1.34% | 1.33% | 1.31% | 1.36% |
Net investment income (loss) | 1.05% | 1.12% | .80% | .71% | 1.35% F |
Supplemental Data | | | | | |
Net assets, end of period (000 omitted) | $ 51,586 | $ 71,293 | $ 99,694 | $ 127,979 | $ 60,370 |
Portfolio turnover rateE | 75% | 65% | 91% | 71% | 54% |
A Total returns would have been lower if certain expenses had not been reduced during the applicable periods shown.
B Total returns do not include the effect of the sales charges.
C Calculated based on average shares outstanding during the period.
D Fees and expenses of any underlying Fidelity Central Funds are not included in the Fund's expense ratio. The Fund indirectly bears its proportionate share of the expenses of any underlying Fidelity Central Funds.
E Amount does not include the portfolio activity of any underlying Fidelity Central Funds.
F Investment income per share reflects a large, non-recurring dividend which amounted to $.13 per share. Excluding this non-recurring dividend, the ratio of net investment income (loss) to average net assets would have been .42%.
G Expense ratios reflect operating expenses of the class. Expenses before reductions do not reflect amounts reimbursed by the investment adviser or reductions from brokerage service arrangements or reductions from other expense offset arrangements and do not represent the amount paid by the class during periods when reimbursements or reductions occur. Expenses net of fee waivers reflect expenses after reimbursement by the investment adviser but prior to reductions from brokerage service arrangements or other expense offset arrangements. Expenses net of all reductions represent the net expenses paid by the class.
H Amount represents less than $.01 per share.
I Total distributions of $.20 per share is comprised of distributions from net investment income of $.133 and distributions from net realized gain of $.062 per share.
J Total distributions of $.07 per share is comprised of distributions from net investment income of $.052 and distributions from net realized gain of $.014 per share.
See accompanying notes which are an integral part of the financial statements.
Annual Report
Financial Highlights - Class T
Years ended October 31, | 2014 | 2013 | 2012 | 2011 | 2010 |
Selected Per-Share Data | | | | | |
Net asset value, beginning of period | $ 14.13 | $ 14.54 | $ 15.08 | $ 15.55 | $ 13.27 |
Income from Investment Operations | | | | | |
Net investment income (loss) C | .11 | .12 | .08 | .07 | .16 F |
Net realized and unrealized gain (loss) | (.90) | (.45) | (.60) | (.38) | 2.19 |
Total from investment operations | (.79) | (.33) | (.52) | (.31) | 2.35 |
Distributions from net investment income | (.11) | (.08) | (.01) | (.10) | - |
Distributions from net realized gain | (.01) | - | (.01) | (.06) | (.07) |
Total distributions | (.13) I | (.08) | (.02) | (.16) | (.07) |
Redemption fees added to paid in capital C, H | - | - | - | - | - |
Net asset value, end of period | $ 13.21 | $ 14.13 | $ 14.54 | $ 15.08 | $ 15.55 |
Total ReturnA, B | (5.65)% | (2.26)% | (3.43)% | (2.09)% | 17.73% |
Ratios to Average Net Assets D, G | | | | | |
Expenses before reductions | 1.62% | 1.62% | 1.61% | 1.60% | 1.63% |
Expenses net of fee waivers, if any | 1.62% | 1.61% | 1.61% | 1.60% | 1.63% |
Expenses net of all reductions | 1.62% | 1.60% | 1.60% | 1.59% | 1.61% |
Net investment income (loss) | .78% | .86% | .53% | .43% | 1.10% F |
Supplemental Data | | | | | |
Net assets, end of period (000 omitted) | $ 9,867 | $ 12,551 | $ 16,692 | $ 20,831 | $ 11,762 |
Portfolio turnover rateE | 75% | 65% | 91% | 71% | 54% |
A Total returns would have been lower if certain expenses had not been reduced during the applicable periods shown.
B Total returns do not include the effect of the sales charges.
C Calculated based on average shares outstanding during the period.
D Fees and expenses of any underlying Fidelity Central Funds are not included in the Fund's expense ratio. The Fund indirectly bears its proportionate share of the expenses of any underlying Fidelity Central Funds.
E Amount does not include the portfolio activity of any underlying Fidelity Central Funds.
F Investment income per share reflects a large, non-recurring dividend which amounted to $.13 per share. Excluding this non-recurring dividend, the ratio of net investment income (loss) to average net assets would have been .17%.
G Expense ratios reflect operating expenses of the class. Expenses before reductions do not reflect amounts reimbursed by the investment adviser or reductions from brokerage service arrangements or reductions from other expense offset arrangements and do not represent the amount paid by the class during periods when reimbursements or reductions occur. Expenses net of fee waivers reflect expenses after reimbursement by the investment adviser but prior to reductions from brokerage service arrangements or other expense offset arrangements. Expenses net of all reductions represent the net expenses paid by the class.
H Amount represents less than $.01 per share.
I Total distributions of $.13 per share is comprised of distributions from net investment income of $.113 and distributions from net realized gain of $.013 per share.
See accompanying notes which are an integral part of the financial statements.
Annual Report
Financial Highlights - Class B
Years ended October 31, | 2014 | 2013 | 2012 | 2011 | 2010 |
Selected Per-Share Data | | | | | |
Net asset value, beginning of period | $ 14.01 | $ 14.41 | $ 15.00 | $ 15.46 | $ 13.22 |
Income from Investment Operations | | | | | |
Net investment income (loss) C | .04 | .05 | - H | (.01) | .08 F |
Net realized and unrealized gain (loss) | (.89) | (.45) | (.59) | (.39) | 2.20 |
Total from investment operations | (.85) | (.40) | (.59) | (.40) | 2.28 |
Distributions from net investment income | (.03) | - H | - | - | - |
Distributions from net realized gain | (.01) | - | - | (.06) | (.04) |
Total distributions | (.04) | - H | - | (.06) | (.04) |
Redemption fees added to paid in capital C, H | - | - | - | - | - |
Net asset value, end of period | $ 13.12 | $ 14.01 | $ 14.41 | $ 15.00 | $ 15.46 |
Total ReturnA, B | (6.06)% | (2.75)% | (3.93)% | (2.62)% | 17.23% |
Ratios to Average Net Assets D, G | | | | | |
Expenses before reductions | 2.11% | 2.11% | 2.10% | 2.11% | 2.16% |
Expenses net of fee waivers, if any | 2.11% | 2.11% | 2.10% | 2.11% | 2.16% |
Expenses net of all reductions | 2.11% | 2.10% | 2.10% | 2.10% | 2.15% |
Net investment income (loss) | .29% | .36% | .03% | (.09)% | .56% F |
Supplemental Data | | | | | |
Net assets, end of period (000 omitted) | $ 1,584 | $ 2,303 | $ 3,097 | $ 4,324 | $ 4,348 |
Portfolio turnover rateE | 75% | 65% | 91% | 71% | 54% |
A Total returns would have been lower if certain expenses had not been reduced during the applicable periods shown.
B Total returns do not include the effect of the contingent deferred sales charge.
C Calculated based on average shares outstanding during the period.
D Fees and expenses of any underlying Fidelity Central Funds are not included in the Fund's expense ratio. The Fund indirectly bears its proportionate share of the expenses of any underlying Fidelity Central Funds.
E Amount does not include the portfolio activity of any underlying Fidelity Central Funds.
F Investment income per share reflects a large, non-recurring dividend which amounted to $.13 per share. Excluding this non-recurring dividend, the ratio of net investment income (loss) to average net assets would have been (.37)%.
G Expense ratios reflect operating expenses of the class. Expenses before reductions do not reflect amounts reimbursed by the investment adviser or reductions from brokerage service arrangements or reductions from other expense offset arrangements and do not represent the amount paid by the class during periods when reimbursements or reductions occur. Expenses net of fee waivers reflect expenses after reimbursement by the investment adviser but prior to reductions from brokerage service arrangements or other expense offset arrangements. Expenses net of all reductions represent the net expenses paid by the class.
H Amount represents less than $.01 per share.
See accompanying notes which are an integral part of the financial statements.
Annual Report
Financial Highlights - Class C
Years ended October 31, | 2014 | 2013 | 2012 | 2011 | 2010 |
Selected Per-Share Data | | | | | |
Net asset value, beginning of period | $ 13.96 | $ 14.37 | $ 14.95 | $ 15.45 | $ 13.22 |
Income from Investment Operations | | | | | |
Net investment income (loss) C | .04 | .05 | .01 | (.01) | .08 F |
Net realized and unrealized gain (loss) | (.89) | (.44) | (.59) | (.38) | 2.19 |
Total from investment operations | (.85) | (.39) | (.58) | (.39) | 2.27 |
Distributions from net investment income | (.03) | (.02) | - | (.05) | - |
Distributions from net realized gain | (.01) | - | - | (.06) | (.04) |
Total distributions | (.05) I | (.02) | - | (.11) | (.04) |
Redemption fees added to paid in capital C, H | - | - | - | - | - |
Net asset value, end of period | $ 13.06 | $ 13.96 | $ 14.37 | $ 14.95 | $ 15.45 |
Total ReturnA, B | (6.13)% | (2.75)% | (3.88)% | (2.58)% | 17.21% |
Ratios to Average Net Assets D, G | | | | | |
Expenses before reductions | 2.11% | 2.11% | 2.10% | 2.09% | 2.14% |
Expenses net of fee waivers, if any | 2.11% | 2.11% | 2.10% | 2.09% | 2.14% |
Expenses net of all reductions | 2.11% | 2.10% | 2.09% | 2.08% | 2.13% |
Net investment income (loss) | .29% | .36% | .03% | (.07)% | .58% F |
Supplemental Data | | | | | |
Net assets, end of period (000 omitted) | $ 17,659 | $ 23,830 | $ 31,865 | $ 37,185 | $ 14,338 |
Portfolio turnover rateE | 75% | 65% | 91% | 71% | 54% |
A Total returns would have been lower if certain expenses had not been reduced during the applicable periods shown.
B Total returns do not include the effect of the contingent deferred sales charge.
C Calculated based on average shares outstanding during the period.
D Fees and expenses of any underlying Fidelity Central Funds are not included in the Fund's expense ratio. The Fund indirectly bears its proportionate share of the expenses of any underlying Fidelity Central Funds.
E Amount does not include the portfolio activity of any underlying Fidelity Central Funds.
F Investment income per share reflects a large, non-recurring dividend which amounted to $.13 per share. Excluding this non-recurring dividend, the ratio of net investment income (loss) to average net assets would have been (.34)%.
G Expense ratios reflect operating expenses of the class. Expenses before reductions do not reflect amounts reimbursed by the investment adviser or reductions from brokerage service arrangements or reductions from other expense offset arrangements and do not represent the amount paid by the class during periods when reimbursements or reductions occur. Expenses net of fee waivers reflect expenses after reimbursement by the investment adviser but prior to reductions from brokerage service arrangements or other expense offset arrangements. Expenses net of all reductions represent the net expenses paid by the class.
H Amount represents less than $.01 per share.
I Total distributions of $.05 per share is comprised of distributions from net investment income of $.033 and distributions from net realized gain of $.013 per share.
See accompanying notes which are an integral part of the financial statements.
Annual Report
Financial Highlights - Global Commodity Stock
Years ended October 31, | 2014 | 2013 | 2012 | 2011 | 2010 |
Selected Per-Share Data | | | | | |
Net asset value, beginning of period | $ 14.24 | $ 14.66 | $ 15.21 | $ 15.66 | $ 13.31 |
Income from Investment Operations | | | | | |
Net investment income (loss) B | .19 | .19 | .15 | .16 | .23 E |
Net realized and unrealized gain (loss) | (.92) | (.45) | (.60) | (.39) | 2.21 |
Total from investment operations | (.73) | (.26) | (.45) | (.23) | 2.44 |
Distributions from net investment income | (.19) | (.16) | (.08) | (.16) | (.01) |
Distributions from net realized gain | (.01) | - | (.01) | �� (.06) | (.08) |
Total distributions | (.20) | (.16) | (.10) H | (.22) | (.09) |
Redemption fees added to paid in capital B, G | - | - | - | - | - |
Net asset value, end of period | $ 13.31 | $ 14.24 | $ 14.66 | $ 15.21 | $ 15.66 |
Total ReturnA | (5.16)% | (1.75)% | (2.96)% | (1.59)% | 18.38% |
Ratios to Average Net Assets C, F | | | | | |
Expenses before reductions | 1.11% | 1.11% | 1.10% | 1.08% | 1.10% |
Expenses net of fee waivers, if any | 1.11% | 1.11% | 1.10% | 1.08% | 1.10% |
Expenses net of all reductions | 1.11% | 1.09% | 1.09% | 1.07% | 1.09% |
Net investment income (loss) | 1.29% | 1.37% | 1.04% | .95% | 1.62% E |
Supplemental Data | | | | | |
Net assets, end of period (000 omitted) | $ 223,084 | $ 273,476 | $ 387,242 | $ 531,224 | $ 310,186 |
Portfolio turnover rateD | 75% | 65% | 91% | 71% | 54% |
A Total returns would have been lower if certain expenses had not been reduced during the applicable periods shown.
B Calculated based on average shares outstanding during the period.
C Fees and expenses of any underlying Fidelity Central Funds are not included in the Fund's expense ratio. The Fund indirectly bears its proportionate share of the expenses of any underlying Fidelity Central Funds.
D Amount does not include the portfolio activity of any underlying Fidelity Central Funds.
E Investment income per share reflects a large, non-recurring dividend which amounted to $.13 per share. Excluding this non-recurring dividend, the ratio of net investment income (loss) to average net assets would have been .69%.
F Expense ratios reflect operating expenses of the class. Expenses before reductions do not reflect amounts reimbursed by the investment adviser or reductions from brokerage service arrangements or reductions from other expense offset arrangements and do not represent the amount paid by the class during periods when reimbursements or reductions occur. Expenses net of fee waivers reflect expenses after reimbursement by the investment adviser but prior to reductions from brokerage service arrangements or other expense offset arrangements. Expenses net of all reductions represent the net expenses paid by the class.
G Amount represents less than $.01 per share.
H Total distributions of $.10 per share is comprised of distributions from net investment income of $.084 and distributions from net realized gain of $.014 per share.
See accompanying notes which are an integral part of the financial statements.
Annual Report
Financial Highlights - Institutional Class
Years ended October 31, | 2014 | 2013 | 2012 | 2011 | 2010 |
Selected Per-Share Data | | | | | |
Net asset value, beginning of period | $ 14.24 | $ 14.67 | $ 15.22 | $ 15.66 | $ 13.31 |
Income from Investment Operations | | | | | |
Net investment income (loss) B | .19 | .20 | .16 | .16 | .23 E |
Net realized and unrealized gain (loss) | (.92) | (.45) | (.60) | (.38) | 2.21 |
Total from investment operations | (.73) | (.25) | (.44) | (.22) | 2.44 |
Distributions from net investment income | (.19) | (.18) | (.09) | (.16) | (.01) |
Distributions from net realized gain | (.01) | - | (.01) | (.06) | (.08) |
Total distributions | (.20) | (.18) | (.11) H | (.22) | (.09) |
Redemption fees added to paid in capital B, G | - | - | - | - | - |
Net asset value, end of period | $ 13.31 | $ 14.24 | $ 14.67 | $ 15.22 | $ 15.66 |
Total ReturnA | (5.16)% | (1.71)% | (2.90)% | (1.50)% | 18.39% |
Ratios to Average Net Assets C, F | | | | | |
Expenses before reductions | 1.06% | 1.04% | 1.04% | 1.03% | 1.09% |
Expenses net of fee waivers, if any | 1.06% | 1.04% | 1.04% | 1.03% | 1.09% |
Expenses net of all reductions | 1.06% | 1.03% | 1.03% | 1.03% | 1.07% |
Net investment income (loss) | 1.34% | 1.43% | 1.10% | .99% | 1.64% E |
Supplemental Data | | | | | |
Net assets, end of period (000 omitted) | $ 23,840 | $ 31,613 | $ 50,540 | $ 58,925 | $ 35,739 |
Portfolio turnover rateD | 75% | 65% | 91% | 71% | 54% |
A Total returns would have been lower if certain expenses had not been reduced during the applicable periods shown.
B Calculated based on average shares outstanding during the period.
C Fees and expenses of any underlying Fidelity Central Funds are not included in the Fund's expense ratio. The Fund indirectly bears its proportionate share of the expenses of any underlying Fidelity Central Funds.
D Amount does not include the portfolio activity of any underlying Fidelity Central Funds.
E Investment income per share reflects a large, non-recurring dividend which amounted to $.13 per share. Excluding this non-recurring dividend, the ratio of net investment income (loss) to average net assets would have been .71%.
F Expense ratios reflect operating expenses of the class. Expenses before reductions do not reflect amounts reimbursed by the investment adviser or reductions from brokerage service arrangements or reductions from other expense offset arrangements and do not represent the amount paid by the class during periods when reimbursements or reductions occur. Expenses net of fee waivers reflect expenses after reimbursement by the investment adviser but prior to reductions from brokerage service arrangements or other expense offset arrangements. Expenses net of all reductions represent the net expenses paid by the class.
G Amount represents less than $.01 per share.
H Total distributions of $.11 per share is comprised of distributions from net investment income of $.093 and distributions from net realized gain of $.014 per share.
See accompanying notes which are an integral part of the financial statements.
Annual Report
Notes to Financial Statements
For the period ended October 31, 2014
1. Organization.
Fidelity Global Commodity Stock Fund (the Fund) is a non-diversified fund of Fidelity Investment Trust (the Trust) and is authorized to issue an unlimited number of shares. The Trust is registered under the Investment Company Act of 1940, as amended (the 1940 Act), as an open-end management investment company organized as a Massachusetts business trust. The Fund offers Class A, Class T, Class C, Global Commodity Stock and Institutional Class shares, each of which, along with Class B shares, has equal rights as to assets and voting privileges. Class B shares are closed to new accounts and additional purchases, except for exchanges and reinvestments. Each class has exclusive voting rights with respect to matters that affect that class. Class B shares will automatically convert to Class A shares after a holding period of seven years from the initial date of purchase. The Fund's investments in emerging markets can be subject to social, economic, regulatory, and political uncertainties and can be extremely volatile.
2. Investments in Fidelity Central Funds.
The Fund invests in Fidelity Central Funds, which are open-end investment companies generally available only to other investment companies and accounts managed by the investment adviser and its affiliates. The Fund's Schedule of Investments lists each of the Fidelity Central Funds held as of period end, if any, as an investment of the Fund, but does not include the underlying holdings of each Fidelity Central Fund. As an Investing Fund, the Fund indirectly bears its proportionate share of the expenses of the underlying Fidelity Central Funds.
The Money Market Central Funds seek preservation of capital and current income and are managed by Fidelity Investments Money Management, Inc. (FIMM), an affiliate of the investment adviser. Annualized expenses of the Money Market Central Funds as of their most recent shareholder report date are less than .01%.
A complete unaudited list of holdings for each Fidelity Central Fund is available upon request or at the Securities and Exchange Commission (the SEC) website at www.sec.gov. In addition, the financial statements of the Fidelity Central Funds, which are not covered by the Fund's Report of Independent Registered Public Accounting Firm, are available on the SEC website or upon request.
3. Significant Accounting Policies.
The financial statements have been prepared in conformity with accounting principles generally accepted in the United States of America (GAAP), which require management to make certain estimates and assumptions at the date of the financial statements. Actual results could differ from those estimates. Subsequent events, if any, through the date that the financial statements were issued have been evaluated in the preparation of
Annual Report
Notes to Financial Statements - continued
3. Significant Accounting Policies - continued
the financial statements. The following summarizes the significant accounting policies of the Fund:
Investment Valuation. Investments are valued as of 4:00 p.m. Eastern time on the last calendar day of the period. In accordance with valuation policies and procedures approved by the Board of Trustees (the Board), the Fund attempts to obtain prices from one or more third party pricing vendors or brokers to value its investments. When current market prices, quotations or currency exchange rates are not readily available or reliable, investments will be fair valued in good faith by the Fidelity Management & Research Company (FMR) Fair Value Committee (the Committee), in accordance with procedures adopted by the Board. Factors used in determining fair value vary by investment type and may include market or investment specific events. The frequency with which these procedures are used cannot be predicted and they may be utilized to a significant extent. The Committee oversees the Fund's valuation policies and procedures and is responsible for approving and reporting to the Board all fair value determinations.
The Fund categorizes the inputs to valuation techniques used to value its investments into a disclosure hierarchy consisting of three levels as shown below:
Level 1 - quoted prices in active markets for identical investments
Level 2 - other significant observable inputs (including quoted prices for similar investments, interest rates, prepayment speeds, etc.)
Level 3 - unobservable inputs (including the Fund's own assumptions based on the best information available)
Valuation techniques used to value the Fund's investments by major category are as follows:
Equity securities, including restricted securities, for which market quotations are readily available, are valued at the last reported sale price or official closing price as reported by a third party pricing vendor on the primary market or exchange on which they are traded and are categorized as Level 1 in the hierarchy. In the event there were no sales during the day or closing prices are not available, securities are valued at the last quoted bid price or may be valued using the last available price and are generally categorized as Level 2 in the hierarchy. For foreign equity securities, when market or security specific events arise, comparisons to the valuation of American Depositary Receipts (ADRs), futures contracts, Exchange-Traded Funds (ETFs) and certain indexes as well as quoted prices for similar securities may be used and would be categorized as Level 2 in the hierarchy. Utilizing these techniques may result in transfers between Level 1 and Level 2. For equity securities, including restricted securities, where observable inputs are
Annual Report
3. Significant Accounting Policies - continued
Investment Valuation - continued
limited, assumptions about market activity and risk are used and these securities may be categorized as Level 3 in the hierarchy.
Investments in open-end mutual funds, including the Fidelity Central Funds, are valued at their closing net asset value (NAV) each business day and are categorized as Level 1 in the hierarchy.
Changes in valuation techniques may result in transfers in or out of an assigned level within the disclosure hierarchy. The aggregate value of investments by input level, as of October 31, 2014, including information on transfers between Levels 1 and 2, is included at the end of the Fund's Schedule of Investments.
Foreign Currency. The Fund may use foreign currency contracts to facilitate transactions in foreign-denominated securities. Gains and losses from these transactions may arise from changes in the value of the foreign currency or if the counterparties do not perform under the contracts' terms.
Foreign-denominated assets, including investment securities, and liabilities are translated into U.S. dollars at the exchange rates at period end. Purchases and sales of investment securities, income and dividends received and expenses denominated in foreign currencies are translated into U.S. dollars at the exchange rate in effect on the transaction date.
The effects of exchange rate fluctuations on investments are included with the net realized and unrealized gain (loss) on investment securities. Other foreign currency transactions resulting in realized and unrealized gain (loss) are disclosed separately.
Investment Transactions and Income. For financial reporting purposes, the Fund's investment holdings and NAV include trades executed through the end of the last business day of the period. The NAV per share for processing shareholder transactions is calculated as of the close of business of the New York Stock Exchange (NYSE), normally 4:00 p.m. Eastern time and includes trades executed through the end of the prior business day. Gains and losses on securities sold are determined on the basis of identified cost and may include proceeds received from litigation. Dividend income is recorded on the ex-dividend date, except for certain dividends from foreign securities where the ex-dividend date may have passed, which are recorded as soon as the Fund is informed of the ex-dividend date. Non-cash dividends included in dividend income, if any, are recorded at the fair market value of the securities received. Income and capital gain distributions from Fidelity Central Funds, if any, are recorded on the ex-dividend date. Distributions received on securities that represent a return of capital or capital gain are recorded as a reduction of cost of investments and/or as a realized gain. Subsequent to
Annual Report
Notes to Financial Statements - continued
3. Significant Accounting Policies - continued
Investment Transactions and Income - continued
ex-dividend date the Fund determines the components of these distributions, based upon receipt of tax filings or other correspondence relating to the underlying investment. Investment income is recorded net of foreign taxes withheld where recovery of such taxes is uncertain.
Class Allocations and Expenses. Investment income, realized and unrealized capital gains and losses, common expenses of the Fund, and certain fund-level expense reductions, if any, are allocated daily on a pro-rata basis to each class based on the relative net assets of each class to the total net assets of the Fund. Each class differs with respect to transfer agent and distribution and service plan fees incurred. Certain expense reductions may also differ by class. For the reporting period, the allocated portion of income and expenses to each class as a percent of its average net assets may vary due to the timing of recording these transactions in relation to fluctuating net assets of the classes. Expenses directly attributable to a fund are charged to that fund. Expenses attributable to more than one fund are allocated among the respective funds on the basis of relative net assets or other appropriate methods. Expense estimates are accrued in the period to which they relate and adjustments are made when actual amounts are known.
Income Tax Information and Distributions to Shareholders. Each year, the Fund intends to qualify as a regulated investment company under Subchapter M of the Internal Revenue Code, including distributing substantially all of its taxable income and realized gains. As a result, no provision for U.S. Federal income taxes is required. As of October 31, 2014, the Fund did not have any unrecognized tax benefits in the financial statements; nor is the Fund aware of any tax positions for which it is reasonably possible that the total amounts of unrecognized tax benefits will significantly change in the next twelve months. The Fund files a U.S. federal tax return, in addition to state and local tax returns as required. The Fund's federal income tax returns are subject to examination by the Internal Revenue Service (IRS) for a period of three fiscal years after they are filed. State and local tax returns may be subject to examination for an additional fiscal year depending on the jurisdiction. Foreign taxes are provided for based on the Fund's understanding of the tax rules and rates that exist in the foreign markets in which it invests.
Distributions are declared and recorded on the ex-dividend date. Income dividends and capital gain distributions are declared separately for each class. Income and capital gain distributions are determined in accordance with income tax regulations, which may differ from GAAP. In addition, the Fund claimed a portion of the payment made to redeeming shareholders as a distribution for income tax purposes.
Annual Report
3. Significant Accounting Policies - continued
Income Tax Information and Distributions to Shareholders - continued
Capital accounts within the financial statements are adjusted for permanent book-tax differences. These adjustments have no impact on net assets or the results of operations.
Capital accounts are not adjusted for temporary book-tax differences which will reverse in a subsequent period.
Book-tax differences are primarily due to foreign currency transactions, passive foreign investment companies (PFIC), partnerships, capital loss carryforwards and losses deferred due to wash sales.
The federal tax cost of investment securities and unrealized appreciation (depreciation) as of period end were as follows:
Gross unrealized appreciation | $ 16,755,440 |
Gross unrealized depreciation | (89,430,462) |
Net unrealized appreciation (depreciation) on securities | $ (72,675,022) |
| |
Tax Cost | $ 413,576,146 |
The tax-based components of distributable earnings as of period end were as follows:
Undistributed ordinary income | $ 4,143,532 |
Capital loss carryforward | $ (41,514,178) |
Net unrealized appreciation (depreciation) on securities and other investments | $ (72,691,445) |
Capital loss carryforwards are only available to offset future capital gains of the Fund to the extent provided by regulations and may be limited. Under the Regulated Investment Company Modernization Act of 2010 (the Act), the Fund is permitted to carry forward capital losses incurred in taxable years beginning after December 22, 2010 for an unlimited period and such capital losses are required to be used prior to any losses that expire. The capital loss carryforward information presented below, including any applicable limitation, is estimated as of fiscal period end and is subject to adjustment.
Fiscal year of expiration | |
2019 | $ (6,952,413) |
No expiration | |
Short-term | (14,785,479) |
Long-term | (19,776,286) |
Total no expiration | (34,561,765) |
Total capital loss carryforward | $ (41,514,178) |
The tax character of distributions paid was as follows:
| October 31, 2014 | October 31, 2013 |
Ordinary Income | $ 5,132,959 | $ 5,697,049 |
Annual Report
Notes to Financial Statements - continued
3. Significant Accounting Policies - continued
Short-Term Trading (Redemption) Fees. Shares held by investors in the Fund less than 30 days may have been subject to a redemption fee equal to 1.00% of the NAV of shares redeemed. All redemption fees, which reduce the proceeds of the shareholder redemption, are retained by the Fund and accounted for as an addition to paid in capital.
Restricted Securities. The Fund may invest in securities that are subject to legal or contractual restrictions on resale. These securities generally may be resold in transactions exempt from registration or to the public if the securities are registered. Disposal of these securities may involve time-consuming negotiations and expense, and prompt sale at an acceptable price may be difficult. Information regarding restricted securities is included at the end of the Fund's Schedule of Investments.
New Accounting Pronouncement. In June 2014, the Financial Accounting Standards Board issued Accounting Standard Update No. 2014-11, Repurchase-to-Maturity Transactions, Repurchase Financings, and Disclosures. The Update amends the accounting for certain repurchase agreements and expands disclosure requirements for reverse repurchase agreements, securities lending and other similar transactions. The disclosure requirements are effective for annual and interim reporting periods beginning after December 15, 2014. Management is currently evaluating the impact of the Update on the Fund's financial statements and related disclosures.
4. Purchases and Sales of Investments.
Purchases and sales of securities, other than short-term securities, aggregated $284,939,275 and $349,828,265, respectively.
5. Fees and Other Transactions with Affiliates.
Management Fee. Fidelity Management & Research Company (the investment adviser) and its affiliates provide the Fund with investment management related services for which the Fund pays a monthly management fee. The management fee is the sum of an individual fund fee rate that is based on an annual rate of .45% of the Fund's average net assets and an annualized group fee rate that averaged .25% during the period. The group fee rate is based upon the average net assets of all the mutual funds advised by the investment adviser, including any mutual funds previously advised by the investment adviser that are currently advised by Fidelity SelectCo, LLC, an affiliate of the investment adviser. The group fee rate decreases as assets under management increase and increases as assets under management decrease. For the reporting period, the total annual management fee rate was .70% of the Fund's average net assets.
Annual Report
5. Fees and Other Transactions with Affiliates - continued
Distribution and Service Plan Fees. In accordance with Rule 12b-1 of the 1940 Act, the Fund has adopted separate Distribution and Service Plans for each class of shares. Certain classes pay Fidelity Distributors Corporation (FDC), an affiliate of the investment adviser, separate Distribution and Service Fees, each of which is based on an annual percentage of each class' average net assets. In addition, FDC may pay financial intermediaries for selling shares of the Fund and providing shareholder support services.
For the period, the Distribution and Service Fee rates, total fees and amounts retained by FDC were as follows:
| Distribution
Fee | Service
Fee | Total Fees | Retained
by FDC |
Class A | -% | .25% | $ 157,900 | $ 965 |
Class T | .25% | .25% | 58,696 | - |
Class B | .75% | .25% | 19,785 | 14,850 |
Class C | .75% | .25% | 210,644 | 22,837 |
| | | $ 447,025 | $ 38,652 |
Sales Load. FDC may receive a front-end sales charge of up to 5.75% for selling Class A shares and 3.50% for selling Class T shares, some of which is paid to financial intermediaries for selling shares of the Fund. Depending on the holding period, FDC may receive contingent deferred sales charges levied on Class A, Class T, Class B, and Class C redemptions. The deferred sales charges range from 5.00% to 1.00% for Class B shares, 1.00% for Class C shares, 1.00% for certain purchases of Class A shares and .25% for certain purchases of Class T shares.
For the period, sales charge amounts retained by FDC were as follows:
| Retained
by FDC |
Class A | $ 22,642 |
Class T | 2,275 |
Class B* | 4,584 |
Class C* | 1,773 |
| $ 31,274 |
* When Class B and Class C shares are initially sold, FDC pays commissions from its own resources to financial intermediaries through which the sales are made.
Transfer Agent Fees. Fidelity Investments Institutional Operations Company, Inc., (FIIOC), an affiliate of the investment adviser, is the transfer, dividend disbursing and shareholder servicing agent for each class of the Fund. FIIOC receives account fees and asset-based fees that vary according to the account size and type of account of the shareholders of the respective classes of the Fund. FIIOC pays for typesetting, printing and mailing of shareholder reports, except proxy statements.
Annual Report
Notes to Financial Statements - continued
5. Fees and Other Transactions with Affiliates - continued
Transfer Agent Fees - continued
For the period, transfer agent fees for each class were as follows:
| Amount | % of
Class-Level Average
Net Assets |
Class A | $ 183,297 | .29 |
Class T | 36,439 | .31 |
Class B | 5,992 | .30 |
Class C | 63,653 | .30 |
Global Commodity Stock | 776,461 | .30 |
Institutional Class | 68,271 | .25 |
| $ 1,134,113 | |
Accounting and Security Lending Fees. Fidelity Service Company, Inc. (FSC), an affiliate of the investment adviser, maintains the Fund's accounting records. The accounting fee is based on the level of average net assets for each month. Under a separate contract, FSC administers the security lending program. The security lending fee is based on the number and duration of lending transactions.
Brokerage Commissions. The Fund placed a portion of its portfolio transactions with brokerage firms which are affiliates of the investment adviser. Brokerage commissions are included in net realized gain (loss) and change in net unrealized appreciation (depreciation) in the Statement of Operations. The commissions paid to these affiliated firms were $12,848 for the period.
6. Committed Line of Credit.
The Fund participates with other funds managed by the investment adviser or an affiliate in a $4.25 billion credit facility (the "line of credit") to be utilized for temporary or emergency purposes to fund shareholder redemptions or for other short-term liquidity purposes. The Fund has agreed to pay commitment fees on its pro-rata portion of the line of credit, which amounted to $630 and is reflected in Miscellaneous expenses on the Statement of Operations. During the period, the Fund did not borrow on this line of credit.
7. Security Lending.
The Fund lends portfolio securities through a lending agent from time to time in order to earn additional income. For equity securities, a lending agent is used and may loan securities to certain qualified borrowers, including Fidelity Capital Markets (FCM), a broker-dealer affiliated with the Fund. On the settlement date of the loan, the Fund receives collateral (in the form of U.S. Treasury obligations, letters of credit and/or cash)
Annual Report
7. Security Lending - continued
against the loaned securities and maintains collateral in an amount not less than 100% of the market value of the loaned securities during the period of the loan. The market value of the loaned securities is determined at the close of business of the Fund and any additional required collateral is delivered to the Fund on the next business day. If the borrower defaults on its obligation to return the securities loaned because of insolvency or other reasons, the Fund may apply collateral received from the borrower against the obligation. The Fund may experience delays and costs in recovering the securities loaned. Any cash collateral received is invested in the Fidelity Securities Lending Cash Central Fund. The value of loaned securities and cash collateral at period end are disclosed on the Fund's Statement of Assets and Liabilities. Security lending income represents the income earned on investing cash collateral, less rebates paid to borrowers and any lending agent fees associated with the loan, plus any premium payments received for lending certain types of securities. Security lending income is presented in the Statement of Operations as a component of income from Fidelity Central Funds. Total security lending income during the period amounted to $180,323. During the period, there were no securities loaned to FCM.
8. Expense Reductions.
Commissions paid to certain brokers with whom the investment adviser, or its affiliates, places trades on behalf of the Fund include an amount in addition to trade execution, which may be rebated back to the Fund to offset certain expenses. This amount totaled $8,577 for the period.
In addition, the investment adviser reimbursed a portion of the Fund's operating expenses during the period in the amount of $2,753.
9. Distributions to Shareholders.
Distributions to shareholders of each class were as follows:
Years ended October 31, | 2014 | 2013 |
From net investment income | | |
Class A | $ 708,856 | $ 864,701 |
Class T | 98,770 | 89,063 |
Class B | 4,646 | 847 |
Class C | 54,810 | 32,277 |
Global Commodity Stock | 3,531,196 | 4,073,304 |
Institutional Class | 366,972 | 636,857 |
Total | $ 4,765,250 | $ 5,697,049 |
Annual Report
Notes to Financial Statements - continued
9. Distributions to Shareholders - continued
Years ended October 31, | 2014 | 2013 |
From net realized gain | | |
Class A | $ 63,118 | $ - |
Class T | 11,363 | - |
Class B | 2,083 | - |
Class C | 21,591 | - |
Global Commodity Stock | 244,178 | - |
Institutional Class | 25,376 | - |
Total | $ 367,709 | $ - |
10. Share Transactions.
Share transactions for each class were as follows and may contain automatic conversions between classes or exchanges between funds:
| Shares | Shares | Dollars | Dollars |
Years ended October 31, | 2014 | 2013 | 2014 | 2013 |
Class A | | | | |
Shares sold | 686,605 | 1,201,755 | $ 9,882,029 | $ 16,769,552 |
Reinvestment of distributions | 49,529 | 52,559 | 677,563 | 744,754 |
Shares redeemed | (1,874,574) | (3,054,897) | (26,738,279) | (42,479,556) |
Net increase (decrease) | (1,138,440) | (1,800,583) | $ (16,178,687) | $ (24,965,250) |
Class T | | | | |
Shares sold | 67,497 | 130,604 | $ 970,700 | $ 1,791,142 |
Reinvestment of distributions | 7,867 | 5,824 | 107,538 | 82,471 |
Shares redeemed | (216,700) | (396,060) | (3,112,471) | (5,490,961) |
Net increase (decrease) | (141,336) | (259,632) | $ (2,034,233) | $ (3,617,348) |
Class B | | | | |
Shares sold | 2,197 | 7,047 | $ 29,999 | $ 98,902 |
Reinvestment of distributions | 453 | 54 | 6,179 | 758 |
Shares redeemed | (46,232) | (57,569) | (649,491) | (793,852) |
Net increase (decrease) | (43,582) | (50,468) | $ (613,313) | $ (694,192) |
Class C | | | | |
Shares sold | 167,515 | 368,295 | $ 2,371,848 | $ 5,059,285 |
Reinvestment of distributions | 4,980 | 1,963 | 67,632 | 27,576 |
Shares redeemed | (527,630) | (880,659) | (7,391,284) | (12,048,987) |
Net increase (decrease) | (355,135) | (510,401) | $ (4,951,804) | $ (6,962,126) |
Global Commodity Stock | | | | |
Shares sold | 3,796,689 | 5,296,700 | $ 54,637,922 | $ 74,369,495 |
Reinvestment of distributions | 246,397 | 264,635 | 3,378,098 | 3,760,465 |
Shares redeemed | (6,485,397) | (12,764,042) | (92,819,253) | (177,408,171) |
Net increase (decrease) | (2,442,311) | (7,202,707) | $ (34,803,233) | $ (99,278,211) |
Annual Report
10. Share Transactions - continued
| Shares | Shares | Dollars | Dollars |
Years ended October 31, | 2014 | 2013 | 2014 | 2013 |
Institutional Class | | | | |
Shares sold | 912,359 | 1,153,936 | $ 13,219,634 | $ 16,235,437 |
Reinvestment of distributions | 20,652 | 25,953 | 283,141 | 368,529 |
Shares redeemed | (1,362,707) | (2,405,021) | (19,411,369) | (33,510,048) |
Net increase (decrease) | (429,696) | (1,225,132) | $ (5,908,594) | $ (16,906,082) |
11. Other.
The Fund's organizational documents provide former and current trustees and officers with a limited indemnification against liabilities arising in connection with the performance of their duties to the Fund. In the normal course of business, the Fund may also enter into contracts that provide general indemnifications. The Fund's maximum exposure under these arrangements is unknown as this would be dependent on future claims that may be made against the Fund. The risk of material loss from such claims is considered remote.
At the end of the period, the investment adviser or its affiliates were the owners of record of 13% of the total outstanding shares of the Fund.
Annual Report
To the Trustees of Fidelity Investment Trust and the Shareholders of Fidelity Global Commodity Stock Fund:
In our opinion, the accompanying statement of assets and liabilities, including the schedule of investments, and the related statements of operations and of changes in net assets and the financial highlights present fairly, in all material respects, the financial position of Fidelity Global Commodity Stock Fund (a fund of Fidelity Investment Trust) at October 31, 2014, the results of its operations for the year then ended, the changes in its net assets for each of the two years in the period then ended and the financial highlights for each of the five years in the period then ended, in conformity with accounting principles generally accepted in the United States of America. These financial statements and financial highlights (hereafter referred to as "financial statements") are the responsibility of the Fidelity Global Commodity Stock Fund's management. Our responsibility is to express an opinion on these financial statements based on our audits. We conducted our audits of these financial statements in accordance with the standards of the Public Company Accounting Oversight Board (United States). Those standards require that we plan and perform the audit to obtain reasonable assurance about whether the financial statements are free of material misstatement. An audit includes examining, on a test basis, evidence supporting the amounts and disclosures in the financial statements, assessing the accounting principles used and significant estimates made by management, and evaluating the overall financial statement presentation. We believe that our audits, which included confirmation of securities at October 31, 2014 by correspondence with the custodian and brokers, provide a reasonable basis for our opinion.
PricewaterhouseCoopers LLP
Boston, Massachusetts
December 19, 2014
Annual Report
The Trustees, Member of the Advisory Board, and officers of the trust and fund, as applicable, are listed below. The Board of Trustees governs the fund and is responsible for protecting the interests of shareholders. The Trustees are experienced executives who meet periodically throughout the year to oversee the fund's activities, review contractual arrangements with companies that provide services to the fund, oversee management of the risks associated with such activities and contractual arrangements, and review the fund's performance. Except for James C. Curvey,each of the Trustees oversees 174 funds. Mr. Curvey oversees 407 funds.
The Trustees hold office without limit in time except that (a) any Trustee may resign; (b) any Trustee may be removed by written instrument, signed by at least two-thirds of the number of Trustees prior to such removal; (c) any Trustee who requests to be retired or who has become incapacitated by illness or injury may be retired by written instrument signed by a majority of the other Trustees; and (d) any Trustee may be removed at any special meeting of shareholders by a two-thirds vote of the outstanding voting securities of the trust. Each Trustee who is not an interested person (as defined in the 1940 Act) of the trust and the fund (Independent Trustee), shall retire not later than the last day of the calendar year in which his or her 75th birthday occurs. The Independent Trustees may waive this mandatory retirement age policy with respect to individual Trustees. The officers and Advisory Board Member hold office without limit in time, except that any officer and Advisory Board Member may resign or may be removed by a vote of a majority of the Trustees at any regular meeting or any special meeting of the Trustees. Except as indicated, each individual has held the office shown or other offices in the same company for the past five years.
Experience, Skills, Attributes, and Qualifications of the Fund's Trustees. The Governance and Nominating Committee has adopted a statement of policy that describes the experience, qualifications, attributes, and skills that are necessary and desirable for potential Independent Trustee candidates (Statement of Policy). The Board believes that each Trustee satisfied at the time he or she was initially elected or appointed a Trustee, and continues to satisfy, the standards contemplated by the Statement of Policy. The Governance and Nominating Committee also engages professional search firms to help identify potential Independent Trustee candidates who have the experience, qualifications, attributes, and skills consistent with the Statement of Policy. From time to time, additional criteria based on the composition and skills of the current Independent Trustees, as well as experience or skills that may be appropriate in light of future changes to board composition, business conditions, and regulatory or other developments, have also been considered by the professional search firms and the Governance and Nominating Committee. In addition, the Board takes into account the Trustees' commitment and participation in Board and committee meetings, as well as their leadership of standing and ad hoc committees throughout their tenure.
In determining that a particular Trustee was and continues to be qualified to serve as a Trustee, the Board has considered a variety of criteria, none of which, in isolation, was controlling. The Board believes that, collectively, the Trustees have balanced and diverse experience, qualifications, attributes, and skills, which allow the Board to operate effectively in governing the fund and protecting the interests of shareholders. Information about the specific experience, skills, attributes, and qualifications of each Trustee, which in each case led to the Board's conclusion that the Trustee should serve (or continue to serve) as a trustee of the fund, is provided below.
Annual Report
Board Structure and Oversight Function. James C. Curvey is an interested person (as defined in the 1940 Act) and currently serves as Chairman. The Trustees have determined that an interested Chairman is appropriate and benefits shareholders because an interested Chairman has a personal and professional stake in the quality and continuity of services provided to the fund. Independent Trustees exercise their informed business judgment to appoint an individual of their choosing to serve as Chairman, regardless of whether the Trustee happens to be independent or a member of management. The Independent Trustees have determined that they can act independently and effectively without having an Independent Trustee serve as Chairman and that a key structural component for assuring that they are in a position to do so is for the Independent Trustees to constitute a substantial majority for the Board. The Independent Trustees also regularly meet in executive session. Ned C. Lautenbach serves as Chairman of the Independent Trustees and as such (i) acts as a liaison between the Independent Trustees and management with respect to matters important to the Independent Trustees and (ii) with management prepares agendas for Board meetings.
Fidelity funds are overseen by different Boards of Trustees. The fund's Board oversees Fidelity's equity and high income funds and another Board oversees Fidelity's investment-grade bond, money market, and asset allocation funds. The asset allocation funds may invest in Fidelity funds overseen by the fund's Board. The use of separate Boards, each with its own committee structure, allows the Trustees of each group of Fidelity funds to focus on the unique issues of the funds they oversee, including common research, investment, and operational issues. On occasion, the separate Boards establish joint committees to address issues of overlapping consequences for the Fidelity funds overseen by each Board.
The Trustees operate using a system of committees to facilitate the timely and efficient consideration of all matters of importance to the Trustees, the fund, and fund shareholders and to facilitate compliance with legal and regulatory requirements and oversight of the fund's activities and associated risks. The Board, acting through its committees, has charged FMR and its affiliates with (i) identifying events or circumstances the occurrence of which could have demonstrably adverse effects on the fund's business and/or reputation; (ii) implementing processes and controls to lessen the possibility that such events or circumstances occur or to mitigate the effects of such events or circumstances if they do occur; and (iii) creating and maintaining a system designed to evaluate continuously business and market conditions in order to facilitate the identification and implementation processes described in (i) and (ii) above. Because the day-to-day operations and activities of the fund are carried out by or through FMR, its affiliates and other service providers, the fund's exposure to risks is mitigated but not eliminated by the processes overseen by the Trustees. While each of the Board's committees has responsibility for overseeing different aspects of the fund's activities, oversight is exercised primarily through the Operations, Audit, and Compliance Committees. In addition, the Independent Trustees have worked with FMR to enhance the Board's oversight of investment and financial risks, legal and regulatory risks, technology risks, and operational risks, including the development of additional risk reporting to the Board. For example, a working group comprised of Independent Trustees and FMR has worked and continues to work to review the Fidelity funds' valuation-related activities, reporting and risk management. Appropriate personnel, including but not limited to the fund's Chief Compliance Officer (CCO), FMR's internal auditor, the independent accountants, the fund's Treasurer and portfolio management personnel, make periodic reports to the Board's committees, as appropriate, including an annual review of FMR's risk management program for the Fidelity funds. The responsibilities of each standing committee, including their oversight responsibilities, are described further under "Standing Committees of the Fund's Trustees."
Annual Report
Trustees and Officers - continued
The fund's Statement of Additional Information (SAI) includes more information about the Trustees. To request a free copy, call Fidelity at 1-800-544-8544.
Interested Trustees*:
Correspondence intended for each Trustee who is an interested person may be sent to Fidelity Investments, 245 Summer Street, Boston, Massachusetts 02210.
Name, Year of Birth; Principal Occupations and Other Relevant Experience+ |
James C. Curvey (1935) |
Year of Election or Appointment: 2007 Trustee Chairman of the Board of Trustees |
| Mr. Curvey also serves as Trustee of other Fidelity funds. Mr. Curvey is a Director of Fidelity Research & Analysis Co. (2009-present), and Vice Chairman (2007-present) and Director of FMR LLC. In addition, Mr. Curvey serves as an Overseer for the Boston Symphony Orchestra and a member of the board of Artis-Naples, Naples, Florida, and as a Trustee for Brewster Academy, Wolfeboro, New Hampshire. Previously, Mr. Curvey served as a Director of Fidelity Investments Money Management, Inc. (2009-2014), a Director of FMR (2007-2014) and a Director of FMR Co., Inc. (2007-2014). |
Charles S. Morrison (1960) |
Year of Election or Appointment: 2014 Trustee |
| Mr. Morrison also serves as Trustee of other funds. He serves as a Director of Fidelity Investments Money Management, Inc. (FIMM) (2014-present), Director of Fidelity SelectCo, LLC (2014-present), President, Asset Management (2014-present) and is an employee of Fidelity Investments. Previously, Mr. Morrison served as Vice President of Fidelity's Fixed Income and Asset Allocation Funds (2012-2014), President, Fixed Income (2011-2014), Vice President of Fidelity's Money Market Funds (2005-2009), President, Money Market Group Leader of FMR (2009), and Senior Vice President, Money Market Group of FMR (2004-2009). Mr. Morrison also served as Vice President of Fidelity's Bond Funds (2002-2005), certain Balanced Funds (2002-2005), and certain Asset Allocation Funds (2002-2007), and as Senior Vice President (2002-2005) of Fidelity's Bond Division. |
* Trustees have been determined to be "Interested Trustees" by virtue of, among other things, their affiliation with the trust or various entities under common control with FMR.
+ The information above includes each Trustee's principal occupation during the last five years and other information relating to the experience, attributes, and skills relevant to each Trustee's qualifications to serve as a Trustee, which led to the conclusion that each Trustee should serve as a Trustee for the fund.
Annual Report
Trustees and Officers - continued
Independent Trustees:
Correspondence intended for each Independent Trustee (that is, the Trustees other than the Interested Trustees) may be sent to Fidelity Investments, P.O. Box 55235, Boston, Massachusetts 02205-5235.
Name, Year of Birth; Principal Occupations and Other Relevant Experience+ |
Dennis J. Dirks (1948) |
Year of Election or Appointment: 2005 Trustee |
| Mr. Dirks also serves as Trustee of other Fidelity funds. Prior to his retirement in May 2003, Mr. Dirks was Chief Operating Officer and a member of the Board of The Depository Trust & Clearing Corporation (DTCC). He also served as President, Chief Operating Officer, and Board member of The Depository Trust Company (DTC) and President and Board member of the National Securities Clearing Corporation (NSCC). In addition, Mr. Dirks served as Chief Executive Officer and Board member of the Government Securities Clearing Corporation, Chief Executive Officer and Board member of the Mortgage-Backed Securities Clearing Corporation, as a Trustee and a member of the Finance Committee of Manhattan College (2005-2008), and as a Trustee and a member of the Finance Committee of AHRC of Nassau County (2006-2008). Mr. Dirks is a member of the Independent Directors Council (IDC) Governing Council (2010-present) and Board of Directors for The Brookville Center for Children's Services, Inc. (2009-present). |
Alan J. Lacy (1953) |
Year of Election or Appointment: 2008 Trustee |
| Mr. Lacy also serves as Trustee of other Fidelity funds. Mr. Lacy serves as Senior Adviser (2007-present) of Oak Hill Capital Partners, L.P. (private equity). Mr. Lacy also served as Chief Executive Officer (2000-2005) and Vice Chairman (2005-2006) of Sears Holdings Corporation and Sears, Roebuck and Co. (retail). In addition, Mr. Lacy serves as a member of the Board of Directors of Dave & Buster's Entertainment, Inc. (restaurant and entertainment complexes, 2010-present), Earth Fare, Inc. (retail grocery, 2012-present), The Hillman Companies, Inc. (hardware wholesalers, 2010-present), and Bristol-Myers Squibb Company (global pharmaceuticals, 2008-present). Mr. Lacy is a member of the Board of Trustees of The National Parks Conservation Association (2006-present). Previously, Mr. Lacy served as Chairman of the Board of Trustees of the National Parks Conservation Association (2008-2011) and as a member of the Board of Directors for the Western Union Company (global money transfer, 2006-2011). |
Ned C. Lautenbach (1944) |
Year of Election or Appointment: 2000 Trustee Chairman of the Independent Trustees |
| Mr. Lautenbach also serves as Trustee of other Fidelity funds. Mr. Lautenbach currently serves as the Lead Director of the Eaton Corporation Board of Directors (diversified industrial, 1997-present). Mr. Lautenbach is Chairman of the Board of Directors of the Philharmonic Center for the Arts in Naples, Florida (2012-present) and a member of the Council on Foreign Relations (1994-present). Previously, Mr. Lautenbach was a Partner/Advisory Partner at Clayton, Dubilier & Rice, LLC (private equity investment, 1998-2010), as well as a Director of Sony Corporation (2006-2007). |
Joseph Mauriello (1944) |
Year of Election or Appointment: 2008 Trustee |
| Mr. Mauriello also serves as Trustee of other Fidelity funds. Prior to his retirement in January 2006, Mr. Mauriello served in numerous senior management positions including Deputy Chairman and Chief Operating Officer (2004-2005), and Vice Chairman of Financial Services (2002-2004) of KPMG LLP US (professional services, 1965-2005). Mr. Mauriello currently serves as a member of the Board of Directors of XL Group plc. (global insurance and re-insurance, 2006-present). Previously, Mr. Mauriello served as a Director of the Hamilton Funds of the Bank of New York (2006-2007) and of Arcadia Resources Inc. (health care services and products, 2007-2012). |
Robert W. Selander (1950) |
Year of Election or Appointment: 2011 Trustee |
| Mr. Selander also serves as Trustee of other Fidelity funds. Previously, Mr. Selander served as a Member of the Advisory Board of other Fidelity funds (2011), and Executive Vice Chairman (2010), Chief Executive Officer (2009-2010), and President and Chief Executive Officer (1997-2009) of Mastercard, Inc. |
Cornelia M. Small (1944) |
Year of Election or Appointment: 2005 Trustee |
| Ms. Small also serves as Trustee of other Fidelity funds. Ms. Small is a member of the Board of Directors (2009-present) and Chair of the Investment Committee (2010-present) of the Teagle Foundation. Ms. Small also serves on the Investment Committee of the Berkshire Taconic Community Foundation (2008-present). Previously, Ms. Small served as Chairperson (2002-2008) and a member of the Investment Committee and Chairperson (2008-2012) and a member of the Board of Trustees of Smith College. In addition, Ms. Small served as Chief Investment Officer, Director of Global Equity Investments, and a member of the Board of Directors of Scudder, Stevens & Clark and Scudder Kemper Investments. |
William S. Stavropoulos (1939) |
Year of Election or Appointment: 2001 Trustee Vice Chairman of the Independent Trustees |
| Mr. Stavropoulos also serves as Trustee of other Fidelity funds. Mr. Stavropoulos serves as President and Founder of the Michigan Baseball Foundation, the Great Lakes Loons (2007-present). Mr. Stavropoulos is Chairman Emeritus of the Board of Directors of The Dow Chemical Company, where he previously served in numerous senior management positions, including President, CEO (1995-2000; 2002-2004), Chairman of the Executive Committee (2000-2006), and as a member of the Board of Directors (1990-2006). Currently, Mr. Stavropoulos is Chairman of the Board of Directors of Univar Inc. (global distributor of commodity and specialty chemicals), a Director of Teradata Corporation (data warehousing and technology solutions), and Maersk Inc. (industrial conglomerate), and a member of the Advisory Board for Metalmark Capital LLC (private equity investment, 2005-present). Mr. Stavropoulos is an operating advisor to Clayton, Dubilier & Rice, LLC (private equity investment). In addition, Mr. Stavropoulos is a member of the University of Notre Dame Advisory Council for the College of Science, a Trustee of the Rollin L. Gerstacker Foundation, and a Director of the Naples Philharmonic Center for the Arts. Previously, Mr. Stavropoulos served as a Director of Chemical Financial Corporation (bank holding company, 1993-2012) and Tyco International, Ltd. (multinational manufacturing and services, 2007-2012). |
David M. Thomas (1949) |
Year of Election or Appointment: 2008 Trustee |
| Mr. Thomas also serves as Trustee of other Fidelity funds. Mr. Thomas serves as Non-Executive Chairman of the Board of Directors of Fortune Brands Home and Security (home and security products, 2011-present), and as a member of the Board of Directors of Interpublic Group of Companies, Inc. (marketing communication, 2004-present). Previously, Mr. Thomas served as Executive Chairman (2005-2006) and Chairman and Chief Executive Officer (2000-2005) of IMS Health, Inc. (pharmaceutical and healthcare information solutions), and a Director of Fortune Brands, Inc. (consumer products, 2000-2011). |
+ The information above includes each Trustee's principal occupation during the last five years and other information relating to the experience, attributes, and skills relevant to each Trustee's qualifications to serve as a Trustee, which led to the conclusion that each Trustee should serve as a Trustee for the fund.
Advisory Board Members and Officers:
Correspondence intended for each officer and Peter S. Lynch may be sent to Fidelity Investments, 245 Summer Street, Boston, Massachusetts 02210. Officers appear below in alphabetical order.
Name, Year of Birth; Principal Occupation |
Peter S. Lynch (1944) |
Year of Election or Appointment: 2003 Member of the Advisory Board |
| Mr. Lynch also serves as Member of the Advisory Board of other Fidelity funds. Mr. Lynch is Vice Chairman and a Director of FMR and FMR Co., Inc. In addition, Mr. Lynch serves as a Trustee of Boston College and as the Chairman of the Inner-City Scholarship Fund. Previously, Mr. Lynch served on the Special Olympics International Board of Directors (1997-2006). |
Elizabeth Paige Baumann (1968) |
Year of Election or Appointment: 2012 Anti-Money Laundering (AML) Officer |
| Ms. Baumann also serves as AML Officer of other funds. She is Chief AML Officer of FMR LLC (2012-present) and is an employee of Fidelity Investments. Previously, Ms. Baumann served as Vice President and Deputy Anti-Money Laundering Officer (2007-2012). |
William C. Coffey (1969) |
Year of Election or Appointment: 2009 Assistant Secretary |
| Mr. Coffey also serves as Assistant Secretary of other funds. He is Senior Vice President and Deputy General Counsel of FMR LLC (2010-present), and is an employee of Fidelity Investments. Previously, Mr. Coffey served as Vice President and Associate General Counsel of FMR LLC (2005-2009). |
Timothy M. Cohen (1969) |
Year of Election or Appointment: 2014 Vice President of certain Equity Funds |
| Mr. Cohen also serves as Vice President of other funds. Mr. Cohen serves as a Director and Chief Compliance Officer of Fidelity Management & Research (U.K.) Inc. (2013-present) and is an employee of Fidelity Investments.] |
Jonathan Davis (1968) |
Year of Election or Appointment: 2010 Assistant Treasurer |
| Mr. Davis also serves as Assistant Treasurer of other funds. Mr. Davis is an employee of Fidelity Investments. Previously, Mr. Davis served as Vice President and Associate General Counsel of FMR LLC (2003-2010). |
Adrien E. Deberghes (1967) |
Year of Election or Appointment: 2008 Deputy Treasurer |
| Mr. Deberghes also serves as an officer of other funds. He is an employee of Fidelity Investments (2008-present). Prior to joining Fidelity Investments, Mr. Deberghes was Senior Vice President of Mutual Fund Administration at State Street Corporation (2007-2008), Senior Director of Mutual Fund Administration at Investors Bank & Trust (2005-2007), and Director of Finance for Dunkin' Brands (2000-2005). |
Stephanie J. Dorsey (1969) |
Year of Election or Appointment: 2010 Assistant Treasurer |
| Ms. Dorsey also serves as an officer of other funds. She is an employee of Fidelity Investments (2008-present) and has served in other fund officer roles. Prior to joining Fidelity Investments, Ms. Dorsey served as Treasurer (2004-2008) of the JPMorgan Mutual Funds and Vice President (2004-2008) of JPMorgan Chase Bank. |
Howard J. Galligan III (1966) |
Year of Election or Appointment: 2014 Chief Financial Officer |
| Mr. Galligan also serves as Chief Financial Officer of other funds. Mr. Galligan serves as President of Fidelity Pricing and Cash Management Services (FPCMS) (2014-present) and as a Director of Strategic Advisers, Inc. (2008-present). Previously, Mr. Galligan served as Chief Administrative Officer of Asset Management (2011-2014) and Chief Operating Officer and Senior Vice President of Investment Support for Strategic Advisers, Inc. (2003-2011). |
Scott C. Goebel (1968) |
Year of Election or Appointment: 2008 Secretary and Chief Legal Officer (CLO) |
| Mr. Goebel serves as Secretary and CLO of other funds. Mr. Goebel also serves as Secretary of Fidelity SelectCo, LLC (2013-present), Fidelity Investments Money Management, Inc. (FIMM) (2010-present) and Fidelity Research and Analysis Company (FRAC) (2010-present); General Counsel, Secretary, and Senior Vice President of FMR (2008-present) and FMR Co., Inc. (2008-present); Chief Legal Officer of Fidelity Management & Research (Hong Kong) Limited (2008-present); and Assistant Secretary of Fidelity Management & Research (Japan) Limited (2008-present) and Fidelity Management & Research (U.K.) Inc. (2008-present). Previously, Mr. Goebel served as Secretary and CLO of other Fidelity funds (2008-2013), Assistant Secretary of FIMM (2008-2010), FRAC (2008-2010), and certain funds (2007-2008); and as Vice President and Secretary of Fidelity Distributors Corporation (FDC) (2005-2007). Mr. Goebel has been employed by FMR LLC or an affiliate since 2001. |
Brian B. Hogan (1964) |
Year of Election or Appointment: 2009 Vice President |
| Mr. Hogan also serves as Trustee or Vice President of other funds. Mr. Hogan serves as a Director of Fidelity SelectCo, LLC (2014-present) and President of FMR's Equity Division (2009-present). Previously, Mr. Hogan served as Senior Vice President, Equity Research of FMR (2006-2009) and as a portfolio manager. |
Chris Maher (1972) |
Year of Election or Appointment: 2013 Assistant Treasurer |
| Mr. Maher serves as Assistant Treasurer of other funds. Mr. Maher is Vice President of Valuation Oversight and is an employee of Fidelity Investments. Previously, Mr. Maher served as Vice President of Asset Management Compliance (2013), Vice President of FMR's Program Management Group (2010-2013), and Vice President of Valuation Oversight (2008-2010). |
Kenneth B. Robins (1969) |
Year of Election or Appointment: 2008 President and Treasurer |
| Mr. Robins also serves as an officer of other funds. Mr. Robins serves as Executive Vice President of Fidelity Investments Money Management, Inc. (FIMM) (2013-present) and is an employee of Fidelity Investments (2004-present). Previously, Mr. Robins served in other fund officer roles. |
Stephen Sadoski (1971) |
Year of Election or Appointment: 2012 Deputy Treasurer |
| Mr. Sadoski also serves as Deputy Treasurer of other funds. He is an employee of Fidelity Investments (2012-present) and has served in another fund officer role. Prior to joining Fidelity Investments, Mr. Sadoski served as an assistant chief accountant in the Division of Investment Management of the Securities and Exchange Commission (SEC) (2009-2012) and as a senior manager at Deloitte & Touche LLP (1997-2009). |
Stacie M. Smith (1974) |
Year of Election or Appointment: 2013 Deputy Treasurer |
| Ms. Smith also serves as an officer of other funds. She is an employee of Fidelity Investments (2009-present) and has served in other fund officer roles. Prior to joining Fidelity Investments, Ms. Smith served as Senior Audit Manager of Ernst & Young LLP (1996-2009). |
Renee Stagnone (1975) |
Year of Election or Appointment: 2013 Deputy Treasurer |
| Ms. Stagnone also serves as Deputy Treasurer of other funds. Ms. Stagnone is an employee of Fidelity Investments. |
Linda J. Wondrack (1964) |
Year of Election or Appointment: 2014 Chief Compliance Officer |
| Ms. Wondrack also serves as Chief Compliance Officer of other funds. Ms. Wondrack is Executive Vice President and head of the Ethics Office and Asset Management Compliance for Fidelity Investments (2012-present). Ms. Wondrack also serves as Chief Compliance Officer of Fidelity SelectCo, LLC (2014-present); Chief Compliance Officer of Impresa Management LLC (2013-present); and Chief Compliance Officer of FMR Co., Inc., Fidelity Investments Money Management, Inc., Fidelity Management & Research (Japan) Limited, Fidelity Management & Research (U.K.) Inc., Fidelity Management & Research (Hong Kong), Fidelity Management & Research Company, Pyramis Global Advisors, LLC, and Strategic Advisers, Inc., Ballyrock Investment Advisors LLC, and Northern Neck Investors LLC (2012-present). Previously, Ms. Wondrack served as Senior Vice President and Chief Compliance Officer for Columbia Management Investment Advisers, LLC (2005-2012); Chief Compliance Officer for certain funds within the Columbia Family of Funds (2007-2012); and Senior Vice President of Compliance Risk Management at Bank of America (2005-2010). |
Joseph F. Zambello (1957) |
Year of Election or Appointment: 2011 Deputy Treasurer |
| Mr. Zambello also serves as Deputy Treasurer of other funds. Mr. Zambello is an employee of Fidelity Investments. Previously, Mr. Zambello served as Vice President of FMR's Program Management Group (2009-2011) and Vice President of the Transfer Agent Oversight Group (2005-2009). |
Annual Report
The Board of Trustees of Fidelity Global Commodity Stock Fund voted to pay to shareholders of record at the opening of business on record date, the following distributions per share derived from capital gains realized from sales of portfolio securities, and dividends derived from net investment income:
| Pay Date | Record Date | Dividends | Capital Gains |
Global Commodity Stock | 12/08/14 | 12/05/14 | $0.178 | $0.026 |
Global Commodity Stock designates 43% of the dividend distributed during the fiscal year as qualifying for the dividends-received deduction for corporate shareholders.
Global Commodity Stock designates 100% of the dividend distributed during the fiscal year as amounts which may be taken into account as a dividend for the purposes of the maximum rate under section 1(h)(11) of the Internal Revenue Code.
The amounts per share which represent income derived from sources within, and taxes paid to, foreign countries or possessions of the United States are as follows:
| Pay Date | Income | Taxes |
Global Commodity Stock Fund | 12/09/13 | $0.1997 | $0.0155 |
The fund will notify shareholders in January 2015 of amounts for use in preparing 2014 income tax returns.
Annual Report
Board Approval of Investment Advisory Contracts and Management Fees
Fidelity Global Commodity Stock Fund
Each year, the Board of Trustees, including the Independent Trustees (together, the Board), votes on the renewal of the management contract with Fidelity Management & Research Company (FMR) and the sub-advisory agreements (together, the Advisory Contracts) for the fund. The Board, assisted by the advice of fund counsel and Independent Trustees' counsel, requests and considers a broad range of information relevant to the renewal of the Advisory Contracts throughout the year.
The Board meets regularly and, at each of its meetings, covers an extensive agenda of topics and materials and considers factors that are relevant to its annual consideration of the renewal of the fund's Advisory Contracts, including the services and support provided to the fund and its shareholders. The Board has established various standing committees (Committees), each composed of and chaired by Independent Trustees with varying backgrounds, to which the Board has assigned specific subject matter responsibilities in order to enhance effective decision-making by the Board. The Board, acting directly and through its Committees, requests and receives information concerning the annual consideration of the renewal of the fund's Advisory Contracts. The Board also meets as needed to consider matters specifically related to the Board's annual consideration of the renewal of the Advisory Contracts. Members of the Board may also meet with trustees of other Fidelity funds through ad hoc joint committees to discuss certain matters relevant to the Fidelity funds.
At its July 2014 meeting, the Board, including the Independent Trustees, unanimously determined to renew the fund's Advisory Contracts. In reaching its determination, the Board considered all factors it believed relevant, including (i) the nature, extent, and quality of the services to be provided to the fund and its shareholders (including the investment performance of the fund); (ii) the competitiveness of the fund's management fee and total expense ratio relative to peer funds; (iii) the total costs of the services to be provided by and the profits to be realized by Fidelity from its relationship with the fund; (iv) the extent to which economies of scale exist and would be realized as the fund grows; and (v) whether fee levels reflect these economies of scale, if any, for the benefit of fund shareholders. In connection with separate internal corporate reorganizations involving Fidelity Management & Research (U.K.) Inc. (FMR U.K.) and Fidelity Management & Research (Japan) Inc. (FMR Japan), the Board approved certain non-material amendments to the fund's sub-advisory agreements with FMR U.K. and FMR Japan to reflect that, after these reorganizations, FMR Investment Management (UK) Limited and Fidelity Management & Research (Japan) Limited will carry on the business of FMR U.K. and FMR Japan, respectively. The Board noted that no changes to the portfolio managers or to the foreign research or investment advisory services provided to the fund were expected in connection with either reorganization and that the same personnel and resources would continue to be available to the fund at the new entities.
Annual Report
Board Approval of Investment Advisory Contracts and
Management Fees - continued
In considering whether to renew the Advisory Contracts for the fund, the Board reached a determination, with the assistance of fund counsel and Independent Trustees' counsel and through the exercise of its business judgment, that the renewal of the Advisory Contracts was in the best interests of the fund and its shareholders and that the compensation payable under the Advisory Contracts was fair and reasonable. The Board's decision to renew the Advisory Contracts was not based on any single factor, but rather was based on a comprehensive consideration of all the information provided to the Board at its meetings throughout the year. The Board, in reaching its determination to renew the Advisory Contracts, was aware that shareholders of the fund have a broad range of investment choices available to them, including a wide choice among funds offered by Fidelity's competitors, and that the fund's shareholders, who have the opportunity to review and weigh the disclosure provided by the fund in its prospectus and other public disclosures, have chosen to invest in this fund, which is part of the Fidelity family of funds.
Nature, Extent, and Quality of Services Provided. The Board considered Fidelity's staffing as it relates to the fund, including the backgrounds of investment personnel of FMR and the sub-advisers (together, the Investment Advisers), and also considered the fund's investment objective, strategies, and related investment philosophy. The Independent Trustees also had discussions with senior management of Fidelity's investment operations and investment groups. The Board considered the structure of the portfolio manager compensation program and whether this structure provides appropriate incentives to act in the best interests of the fund. Additionally, the Board considered the portfolio managers' investments, if any, in the funds that they manage.
Resources Dedicated to Investment Management and Support Services. The Board and the Fund Oversight and Research Committees reviewed the general qualifications and capabilities of Fidelity's investment staff, including its size, education, experience, and resources, as well as Fidelity's approach to recruiting, training, managing, and compensating investment personnel. The Board noted that Fidelity has continued to increase the resources devoted to non-U.S. offices, including expansion of Fidelity's global investment organization. The Board also noted that Fidelity's analysts have extensive resources, tools and capabilities that allow them to conduct sophisticated quantitative and fundamental analysis, as well as credit analysis of issuers, counterparties and guarantors. Further, the Board believes that Fidelity's investment professionals have sufficient access to global information and data so as to provide competitive investment results over time, and that those professionals also have access to sophisticated tools that permit them to assess portfolio construction and risk and performance attribution characteristics continuously, as well as to transmit new information and research conclusions rapidly around the world. Additionally, in its deliberations, the Board considered Fidelity's trading and risk management capabilities and resources and global compliance infrastructure, which are an integral part of the investment management process.
Annual Report
Shareholder and Administrative Services. The Board considered (i) the nature, extent, quality, and cost of advisory, administrative, and shareholder services performed by the Investment Advisers and their affiliates under the Advisory Contracts and under separate agreements covering transfer agency, pricing and bookkeeping, and securities lending services for the fund; (ii) the nature and extent of the supervision of third party service providers, principally custodians and subcustodians; and (iii) the resources devoted to, and the record of compliance with, the fund's compliance policies and procedures. The Board also reviewed the allocation of fund brokerage, including allocations to brokers affiliated with the Investment Advisers, the use of brokerage commissions to pay fund expenses, and the use of "soft" commission dollars to pay for research services.
The Board noted that the growth of fund assets over time across the complex allows Fidelity to reinvest in the development of services designed to enhance the value or convenience of the Fidelity funds as investment vehicles. These services include 24-hour access to account information and market information through telephone representatives and over the Internet, investor education materials and asset allocation tools, and the expanded availability of Fidelity Investor Centers.
In 2014, the Board formed an ad hoc Committee on Transfer Agency Fees to review the variety of transfer agency fee structures throughout the industry and Fidelity's competitive positioning with respect to industry participants.
Investment in a Large Fund Family. The Board considered the benefits to shareholders of investing in a Fidelity fund, including the benefits of investing in a fund that is part of a large family of funds offering a variety of investment disciplines and providing a large variety of mutual fund investor services. The Board noted that Fidelity had taken, or had made recommendations that resulted in the Fidelity funds taking, a number of actions over the previous year that benefited particular funds, including (i) continuing to dedicate additional resources to investment research and to the support of the senior management team that oversees asset management; (ii) persisting in efforts to enhance Fidelity's global research capabilities; (iii) launching new funds and making other enhancements to meet client needs for income-oriented solutions; (iv) reducing fund expenses for certain index funds; (v) continuing to launch dedicated lower cost underlying funds to meet portfolio construction needs related to expanding underlying fund options for Fidelity funds of funds, specifically for the Freedom Fund product lines; (vi) rationalizing product lines and gaining increased efficiencies through fund mergers; (vii) launching sector-based exchange-traded funds and establishing a new Fidelity adviser to manage sector-based funds and products; (viii) continuing to develop and implement technology to improve security and increase efficiency; (ix) modifying the eligibility criteria for certain share classes to increase their marketability to a portion of the defined contribution plan market; (x) waiving redemption fees for certain qualified fund-of-fund and wrap programs and certain retirement plan transactions; and (xi) launching new Institutional Class shares of certain money market funds to attract and retain assets and to fill a gap in the money market fund lineup.
Annual Report
Board Approval of Investment Advisory Contracts and
Management Fees - continued
Investment Performance. The Board considered whether the fund has operated in accordance with its investment objective, as well as its record of compliance with its investment restrictions and its performance history.
The Board took into account discussions with the Investment Advisers about fund investment performance that occur at Board meetings throughout the year. In this regard the Board noted that as part of regularly scheduled fund reviews and other reports to the Board on fund performance, the Board periodically considers annualized return information for the fund, for different time periods, measured against a securities market index ("benchmark index") and a peer group of funds with similar objectives ("peer group"). In its evaluation of fund investment performance, the Board gave particular attention to information indicating changes in performance of certain Fidelity funds for specific time periods and the Investment Advisers' explanations for any overperformance or underperformance.
In addition to reviewing absolute and relative fund performance, the Independent Trustees periodically consider the appropriateness of fund performance metrics in evaluating the results achieved. In general, the Independent Trustees believe that fund performance should be evaluated based on net performance (after fees and expenses) of both the highest performing and lowest performing classes, where applicable, compared to appropriate benchmark indices, over appropriate time periods which may include full market cycles, and compared to peer groups, as applicable, over the same periods, taking into account relevant factors including the following: general market conditions; issuer-specific information; tactical opportunities for investment; and fund cash flows and other factors.
The Independent Trustees recognize that shareholders evaluate performance on a net basis over their own holding periods, for which one-, three-, and five-year periods are often used as a proxy. For this reason, the performance information reviewed by the Board also included net cumulative calendar year total return information for the fund and an appropriate benchmark index for the most recent one- and three-year periods, as shown below. A peer group comparison is not shown below.
Annual Report
Fidelity Global Commodity Stock Fund
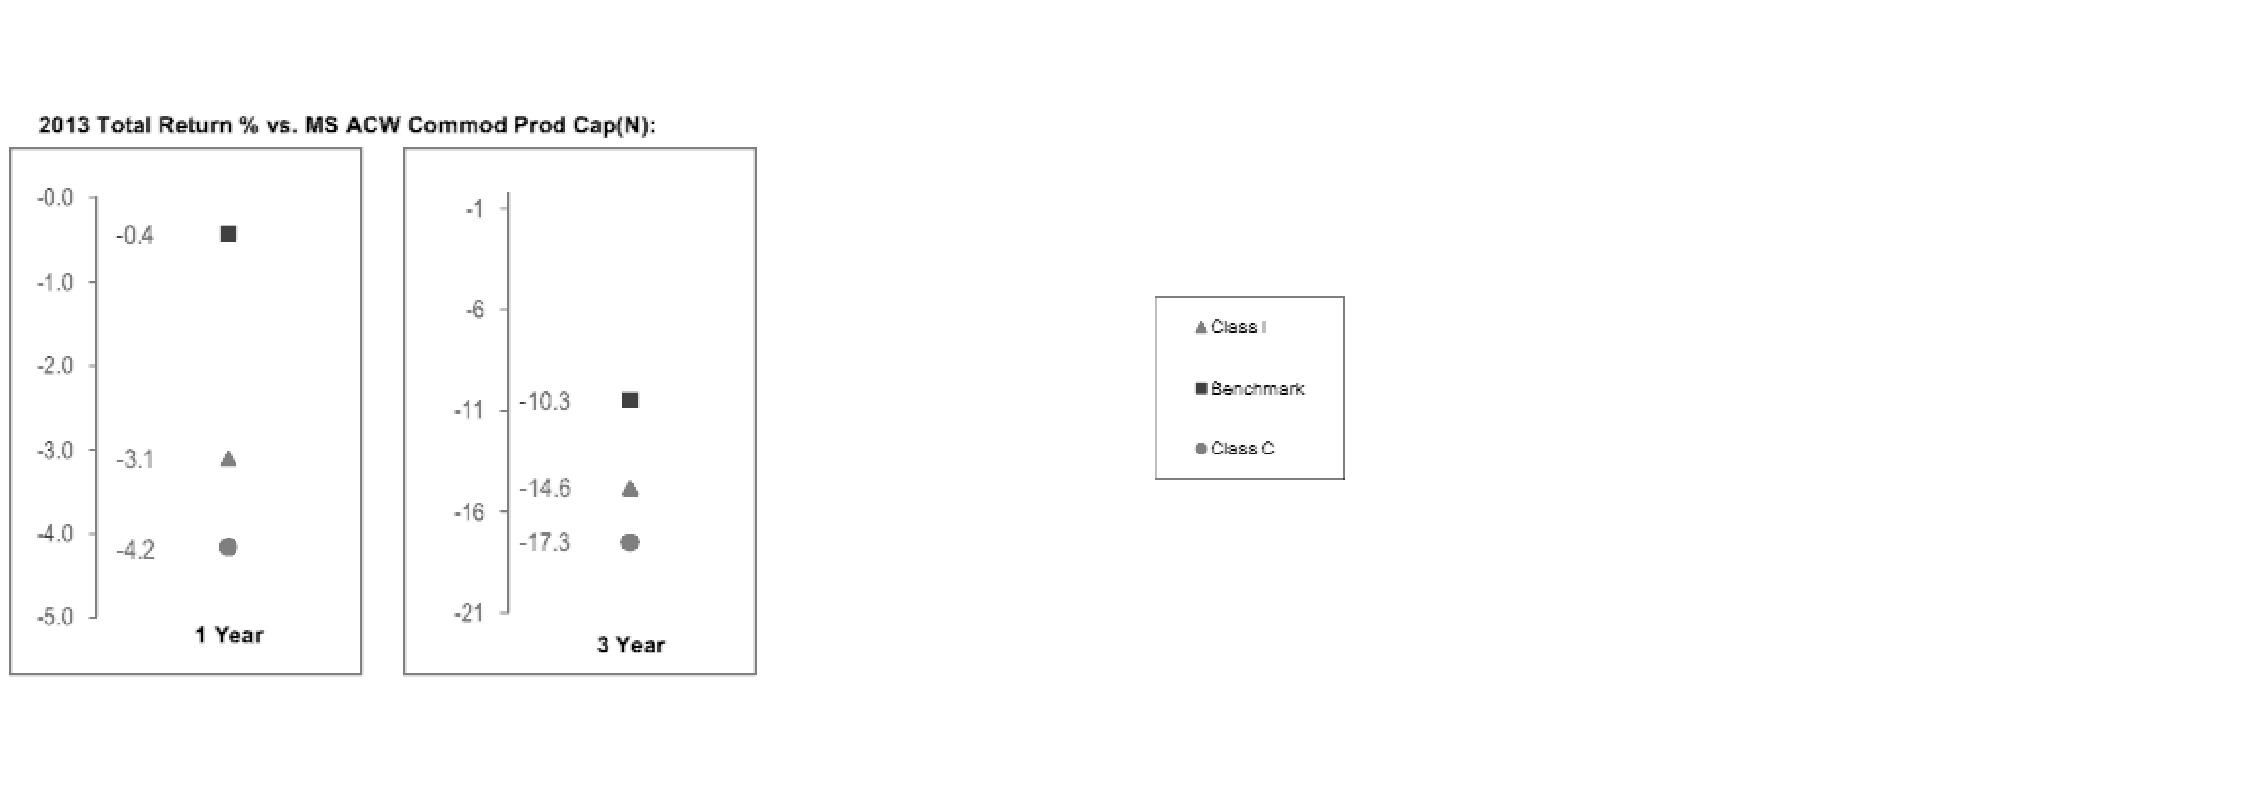
The Board has discussed with FMR the fund's underperformance (based on the December 31, 2013 data presented herein) and has engaged with FMR to consider what steps might be taken to remediate the fund's underperformance. The Board noted that the fund's performance has improved for more recent periods.
Based on its review, the Board concluded that the nature, extent, and quality of services provided to the fund under the Advisory Contracts should benefit the fund's shareholders.
Competitiveness of Management Fee and Total Expense Ratio. The Board considered the fund's management fee and total expense ratio compared to "mapped groups" of competitive funds and classes. Fidelity creates "mapped groups" by combining similar Lipper investment objective categories that have comparable investment mandates. Combining Lipper investment objective categories aids the Board's management fee and total expense ratio comparisons by broadening the competitive group used for comparison and by reducing the number of universes to which various Fidelity funds are compared.
Management Fee. The Board considered two proprietary management fee comparisons for the 12-month (or shorter) periods shown in the chart below. The group of Lipper funds used by the Board for management fee comparisons is referred to below as the "Total Mapped Group." The Total Mapped Group comparison focuses on a fund's standing in terms of gross management fees before expense reimbursements or caps relative to the total universe of funds with comparable investment mandates, regardless of whether their management fee structures also are comparable. Funds with comparable investment mandates offer exposure to similar types of securities. Funds with comparable management fee structures have similar management fee contractual arrangements (e.g., flat rate charged for advisory services, all-inclusive fee rate, etc.). "TMG %" represents the percentage of funds in the Total Mapped Group that had management fees that were lower than the fund's. For example, a hypothetical TMG % of 20% would mean that 80% of the funds in the Total Mapped Group had higher, and 20% had lower, management fees than the fund. The fund's actual TMG %s are in the chart below. The "Asset-Size Peer Group" (ASPG) comparison focuses on a fund's standing relative to a subset of non-Fidelity funds within the Total Mapped Group that are similar in size and management fee structure. For example, if a fund is in the first quartile of the ASPG, the fund's management fee ranks in the least expensive or lowest 25% of funds in the ASPG. The ASPG represents at least 15% of the funds in the Total Mapped Group with comparable asset size and management fee structures, subject to a minimum of 50 funds (or all funds in the Total Mapped Group if fewer than 50). Additional information, such as the ASPG quartile in which the fund's management fee rate ranked, is also included in the chart and considered by the Board.
Annual Report
Board Approval of Investment Advisory Contracts and
Management Fees - continued
Fidelity Global Commodity Stock Fund

The Board noted that the fund's management fee rate ranked below the median of its Total Mapped Group and below the median of its ASPG for 2013.
The Board also noted that, in August 2013, the ad hoc Committee on Management Fees was formed to conduct an in-depth review of the management fee rates of Fidelity's active equity mutual funds. The Committee focused on the following areas: (i) standard fee structures; (ii) research consumption and trading evolution; (iii) management fee competitiveness/profitability by category; and (iv) factors that drive institutional pricing.
Annual Report
Based on its review, the Board concluded that the fund's management fee is fair and reasonable in light of the services that the fund receives and the other factors considered.
Total Expense Ratio. In its review of each class's total expense ratio, the Board considered the fund's management fee as well as other fund or class expenses, as applicable, such as transfer agent fees, pricing and bookkeeping fees, fund-paid 12b-1 fees, and custodial, legal, and audit fees. The Board also noted the effects of any waivers and reimbursements on fees and expenses. As part of its review, the Board also considered the current and historical total expense ratios of each class of the fund compared to competitive fund median expenses. Each class of the fund is compared to those funds and classes in the Total Mapped Group (used by the Board for management fee comparisons) that have a similar sales load structure.
The Board noted that the total expense ratio of each of Class A, Institutional Class, and the retail class ranked below its competitive median for 2013, the total expense ratio of Class C ranked equal to its competitive median for 2013, and the total expense ratio of each of Class T and Class B ranked above its competitive median for 2013. The Board considered that, in general, various factors can affect total expense ratios. The Board noted that the total expense ratio of Class T was above the competitive median primarily because of higher 12b-1 fees on Class T as compared to most competitor funds. Class T has a higher 12b-1 fee, but a lower front-end sales charge, than traditionally priced front-end sales charge classes. The Board considered that Class T is primarily sold load-waived in the retirement plan market where its 0.50% 12b-1 fee is comparable to competing no-load, higher 12b-1 fee classes designed specifically for retirement plans. The Board noted that the fund offers multiple classes, each of which has a different sales load and 12b-1 fee structure, and that the multiple structures are intended to offer a range of pricing options for the intermediary market. The Board also noted that the total expense ratios of the classes vary primarily by the level of their 12b-1 fees, although differences in transfer agent fees may also cause expenses to vary from class to class.
Fees Charged to Other Fidelity Clients. The Board also considered Fidelity fee structures and other information with respect to clients of Fidelity, such as other funds advised or subadvised by Fidelity, pension plan clients, and other institutional clients. The Board noted the findings of the 2013 ad hoc joint committee (created with the board of other Fidelity funds), which reviewed and compared Fidelity's institutional investment advisory business with its business of providing services to the Fidelity funds, including the differences in services provided, fees charged, and costs incurred, as well as competition in their respective marketplaces.
Based on its review of total expense ratios and fees charged to other Fidelity clients, the Board concluded that the total expense ratio of each class of the fund was reasonable, although in some cases above the median of the universe presented for comparison, in light of the services that the fund and its shareholders receive and the other factors considered.
Annual Report
Board Approval of Investment Advisory Contracts and
Management Fees - continued
Costs of the Services and Profitability. The Board considered the revenues earned and the expenses incurred by Fidelity in conducting the business of developing, marketing, distributing, managing, administering and servicing the fund and servicing the fund's shareholders. The Board also considered the level of Fidelity's profits in respect of all the Fidelity funds.
On an annual basis, Fidelity presents to the Board Fidelity's profitability for the fund. Fidelity calculates the profitability for each fund, as well as aggregate profitability for groups of Fidelity funds and all Fidelity funds, using a series of detailed revenue and cost allocation methodologies which originate with the books and records of Fidelity on which Fidelity's audited financial statements are based. The Audit Committee of the Board reviews any significant changes from the prior year's methodologies.
PricewaterhouseCoopers LLP (PwC), independent registered public accounting firm and auditor to Fidelity and certain Fidelity funds, has been engaged annually by the Board as part of the Board's assessment of Fidelity's profitability analysis. PwC's engagement includes the review and assessment of the methodologies used by Fidelity in determining the revenues and expenses attributable to Fidelity's mutual fund business, and completion of agreed-upon procedures in respect of the mathematical accuracy of fund profitability and its conformity to established allocation methodologies. After considering PwC's reports issued under the engagement and information provided by Fidelity, the Board concluded that while other allocation methods may also be reasonable, Fidelity's profitability methodologies are reasonable in all material respects.
The Board also reviewed Fidelity's non-fund businesses and fall-out benefits related to the mutual fund business as well as cases where Fidelity's affiliates may benefit from or be related to the fund's business.
The Board considered the costs of the services provided by and the profits realized by Fidelity in connection with the operation of the fund and was satisfied that the profitability was not excessive in the circumstances.
Economies of Scale. The Board considered whether there have been economies of scale in respect of the management of the Fidelity funds, whether the Fidelity funds (including the fund) have appropriately benefited from any such economies of scale, and whether there is potential for realization of any further economies of scale. The Board considered the extent to which the fund will benefit from economies of scale through increased services to the fund, through waivers or reimbursements, or through fee or expense ratio reductions. The Board also noted that in 2013, it and the boards of other Fidelity funds created an ad hoc committee (the Economies of Scale Committee) to analyze whether Fidelity attains economies of scale in respect of the management and servicing of the Fidelity funds, whether the Fidelity funds have appropriately benefited from such economies of scale, and whether there is potential for realization of any further economies of scale.
Annual Report
The Board recognized that the fund's management contract incorporates a "group fee" structure, which provides for lower group fee rates as total group assets increase, and for higher group fee rates as total group assets decrease (with "group assets" defined to include fund assets under FMR's management plus sector fund assets previously under FMR's management and currently managed by Fidelity SelectCo, LLC). FMR calculates the group fee rates based on a tiered asset "breakpoint" schedule that varies based on asset class. The Board considered that the group fee is designed to deliver the benefits of economies of scale to fund shareholders when total Fidelity fund assets increase, even if assets of any particular fund are unchanged or have declined, because some portion of Fidelity's costs are attributable to services provided to all Fidelity funds, and all funds benefit if those costs can be allocated among more assets. The Board concluded that, given the group fee structure, fund shareholders will benefit from lower management fees as group assets increase at the fund complex level, regardless of whether Fidelity achieves any such economies of scale.
The Board concluded, taking into account the analysis of the Economies of Scale Committee, that economies of scale, if any, are being appropriately shared between fund shareholders and Fidelity.
Additional Information Requested by the Board. In order to develop fully the factual basis for consideration of the Fidelity funds' Advisory Contracts, the Board requested and received additional information on certain topics, including: (i) fund performance trends and Fidelity's long-term strategies for certain funds; (ii) Fidelity's strategic marketing and product lineup goals; (iii) the methodology with respect to competitive fund data and peer group classifications; (iv) the arrangements with, and performance of, certain sub-advisers on behalf of the Fidelity funds, as well as certain proposed participating affiliate arrangements; (v) the realization of fall-out benefits in certain Fidelity business units; (vi) Fidelity's group fee structures, including the rationale for the individual fee rates of certain categories of funds and the definition of group assets; (vii) trends regarding industry use of performance fee structures and the performance adjustment methodologies applicable to the Fidelity funds; (viii) additional competitive analysis regarding the total expenses for certain classes; (ix) fund profitability methodology, including Fidelity's cost allocation methodology, and the impact of certain factors on fund profitability results; and (x) the process by which Fidelity determines sub-advisory fees for funds it advises.
Based on its evaluation of all of the conclusions noted above, and after considering all factors it believed relevant, the Board ultimately concluded that the advisory fee structures are fair and reasonable, and that the fund's Advisory Contracts should be renewed.
Annual Report
Investment Adviser
Fidelity Management & Research Company
Boston, MA
Investment Sub-Advisers
FMR Co., Inc.
Fidelity Management &
Research (U.K.) Inc.
FIL Investments (Japan) Limited
FIL Investment Advisors
FIL Investment Advisors
(U.K.) Limited
Fidelity Management & Research
(Hong Kong) Limited
Fidelity Management & Research
(Japan) Limited
General Distributor
Fidelity Distributors Corporation
Smithfield, RI
Transfer and Service Agents
Fidelity Investments Institutional
Operations Company, Inc.
Boston, MA
Fidelity Service Company, Inc.
Boston, MA
Custodian
State Street Bank and Trust Company
Quincy, MA
The Fidelity Telephone Connection
Mutual Fund 24-Hour Service
Exchanges/Redemptions
and Account Assistance 1-800-544-6666
Product Information 1-800-544-6666
Retirement Accounts 1-800-544-4774
(8 a.m. - 9 p.m.)
TDD Service 1-800-544-0118
for the deaf and hearing impaired
(9 a.m. - 9 p.m. Eastern time)
Fidelity Automated Service
Telephone (FAST®)
1-800-544-5555
Automated line for quickest service
(Fidelity Investment logo)(registered trademark)
Corporate Headquarters
245 Summer St., Boston, MA 02210
www.fidelity.com
GCS-UANN-1214
1.879379.105
Fidelity®
Global Equity Income
Fund
Annual Report
October 31, 2014
(Fidelity Cover Art)
Contents
Performance | (Click Here) | How the fund has done over time. |
Management's Discussion of Fund Performance | (Click Here) | The Portfolio Manager's review of fund performance and strategy. |
Shareholder Expense Example | (Click Here) | An example of shareholder expenses. |
Investment Changes | (Click Here) | A summary of major shifts in the fund's investments over the past six months. |
Investments | (Click Here) | A complete list of the fund's investments with their market values. |
Financial Statements | (Click Here) | Statements of assets and liabilities, operations, and changes in net assets, as well as financial highlights. |
Notes | (Click Here) | Notes to the financial statements. |
Report of Independent Registered Public Accounting Firm | (Click Here) | |
Trustees and Officers | (Click Here) | |
Distributions | (Click Here) | |
Board Approval of Investment Advisory Contracts and Management Fees | (Click Here) | |
To view a fund's proxy voting guidelines and proxy voting record for the 12-month period ended June 30, visit http://www.fidelity.com/proxyvotingresults or visit the Securities and Exchange Commission's (SEC) web site at http://www.sec.gov. You may also call 1-800-544-8544 to request a free copy of the proxy voting guidelines.
Standard & Poor's, S&P and S&P 500 are registered service marks of The McGraw-Hill Companies, Inc. and have been licensed for use by Fidelity Distributors Corporation.
Other third-party marks appearing herein are the property of their respective owners.
All other marks appearing herein are registered or unregistered trademarks or service marks of FMR LLC or an affiliated company. © 2014 FMR LLC. All rights reserved.
Annual Report
This report and the financial statements contained herein are submitted for the general information of the shareholders of the fund. This report is not authorized for distribution to prospective investors in the fund unless preceded or accompanied by an effective prospectus.
A fund files its complete schedule of portfolio holdings with the SEC for the first and third quarters of each fiscal year on Form N-Q. Forms N-Q are available on the SEC's web site at http://www.sec.gov. A fund's Forms N-Q may be reviewed and copied at the SEC's Public Reference Room in Washington, DC. Information regarding the operation of the SEC's Public Reference Room may be obtained by calling 1-800-SEC-0330. For a complete list of a fund's portfolio holdings, view the most recent holdings listing, semiannual report, or annual report on Fidelity's web site at http://www.fidelity.com, http://www.advisor.fidelity.com, or http://www.401k.com, as applicable.
NOT FDIC INSURED • MAY LOSE VALUE • NO BANK GUARANTEE
Neither the fund nor Fidelity Distributors Corporation is a bank.
Annual Report
Average annual total return reflects the change in the value of an investment, assuming reinvestment of the fund's distributions from dividend income and capital gains (the profits earned upon the sale of securities that have grown in value, if any) and assuming a constant rate of performance each year. The $10,000 table and the fund's returns do not reflect the deduction of taxes that a shareholder would pay on fund distributions or the redemption of fund shares. During periods of reimbursement by Fidelity, a fund's total return will be greater than it would be had the reimbursement not occurred. How a fund did yesterday is no guarantee of how it will do tomorrow.
Average Annual Total Returns
Periods ended October 31, 2014 | Past 1
year | Life of fund A |
Fidelity® Global Equity Income | 10.10% | 13.81% |
A From May 2, 2012.
$10,000 Over Life of Fund
Let's say hypothetically that $10,000 was invested in Fidelity® Global Equity Income Fund, on May 2, 2012, when the fund started. The chart shows how the value of your investment would have changed, and also shows how the MSCI ACWI (All Country World Index) Index performed over the same period.
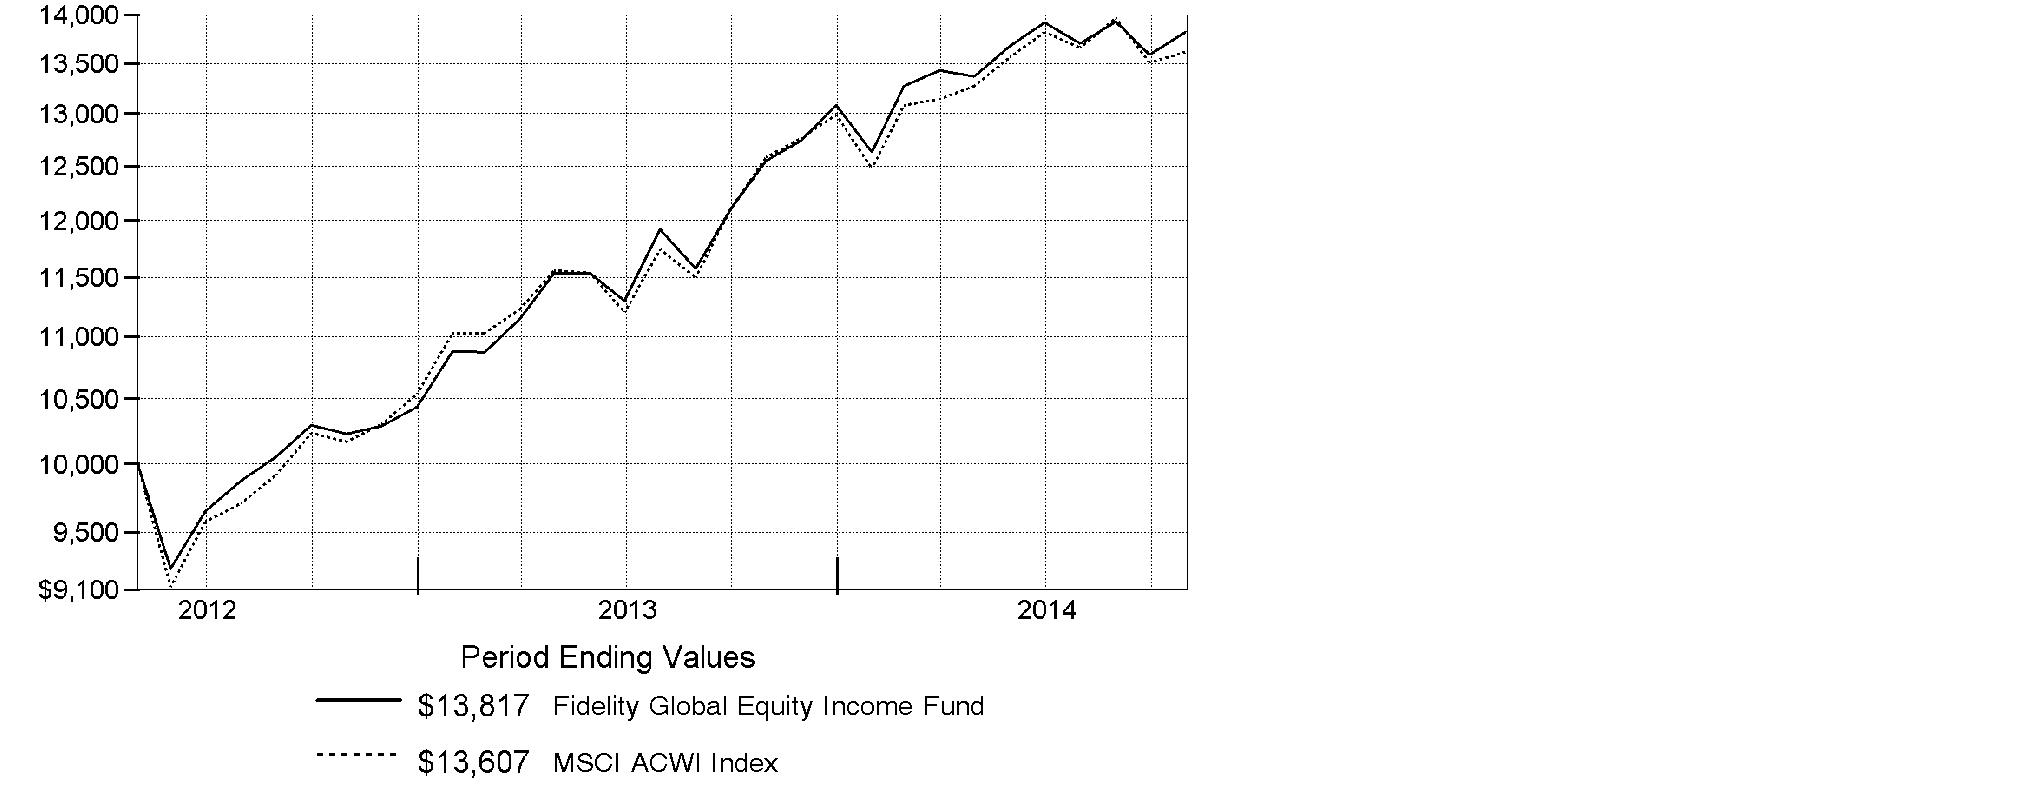
Annual Report
Market Recap: Global equities posted a healthy gain for the 12 months ending October 31, 2014, overcoming an October market decline driven by recessionary pressures in China and tepid growth in Europe. The MSCI ACWI (All Country World Index) Index rose 8.15%, helped by subdued market volatility for much of the period and supported by solid corporate earnings, especially in the United States. Stocks also benefited from easy monetary policies in Japan and the eurozone, as well as increased stimulus efforts in China. All but three of the 24 industry groups that compose the index marked a positive return. The U.S. (+17%) remained a pillar of strength, while a strongly rising dollar in the latter part of the period detracted from investors' returns in most non-U.S. markets. Canada (+5%) notched broad gains outside of its energy and materials sectors, as did Asia-Pacific ex Japan (+4%), led by investor enthusiasm for companies in India. The U.K., Europe and Japan, meanwhile, all underperformed. Among sectors, health care (+24%) led the index, with a strong contribution from the pharmaceuticals, biotechnology & life sciences industry. Information technology (+21%) also outperformed. Conversely, materials (-4%) and energy (-1%) lagged the index due to a higher supply of and lower demand for commodities.
Comments from Ramona Persaud, Portfolio Manager of Fidelity® Global Equity Income Fund: For the year, the fund's Retail Class shares gained 10.10%, outperforming the MSCI ACWI index. Versus the index, stock selection in several areas drove the fund's outperformance, especially in consumer staples where Dr Pepper Snapple Group was the fund's largest individual contributor and most overweighted position at period end. Shares of the beverage maker gained on stable pricing in its markets, as well as very strong capital allocation policies including an attractive dividend and generous share buybacks. Other interesting contributors from the sector included Greencore Group, a Dublin-based prepared-foods producer, and South Africa's Astral Foods, a poultry producer. Neither was in the index. In order to lock in profits, I sold the fund's position in Astral by period end. Elsewhere, biotechnology firm Amgen also helped. The biggest individual detractor was a non-index stake in Reunert, a South African industrial conglomerate that struggled with sluggish end markets the past year. It also hurt to avoid index component Gilead Sciences, a biotech firm that did well on its ground-breaking treatment for hepatitis C. Gilead, however, does not pay a dividend, which means it's not a name likely to be held in this portfolio or other equity-income funds.
The views expressed above reflect those of the portfolio manager(s) only through the end of the period as stated on the cover of this report and do not necessarily represent the views of Fidelity or any other person in the Fidelity organization. Any such views are subject to change at any time based upon market or other conditions and Fidelity disclaims any responsibility to update such views. These views may not be relied on as investment advice and, because investment decisions for a Fidelity fund are based on numerous factors, may not be relied on as an indication of trading intent on behalf of any Fidelity fund.
Annual Report
Shareholder Expense Example
As a shareholder of the Fund, you incur two types of costs: (1) transaction costs, including redemption fees and (2) ongoing costs, including management fees and other Fund expenses. This Example is intended to help you understand your ongoing costs (in dollars) of investing in the Fund and to compare these costs with the ongoing costs of investing in other mutual funds.
The Example is based on an investment of $1,000 invested at the beginning of the period and held for the entire period (May 1, 2014 to October 31, 2014).
Actual Expenses
The first line of the accompanying table provides information about actual account values and actual expenses. You may use the information in this line, together with the amount you invested, to estimate the expenses that you paid over the period. Simply divide your account value by $1,000.00 (for example, an $8,600 account value divided by $1,000.00 = 8.6), then multiply the result by the number in the first line under the heading entitled "Expenses Paid During Period" to estimate the expenses you paid on your account during this period. A small balance maintenance fee of $12.00 that is charged once a year may apply for certain accounts with a value of less than $2,000. This fee is not included in the table below. If it was, the estimate of expenses you paid during the period would be higher, and your ending account value lower, by this amount. In addition, the Fund, as a shareholder in the underlying Fidelity Central Funds, will indirectly bear its pro-rata share of the fees and expenses incurred by the underlying Fidelity Central Funds. These fees and expenses are not included in the Fund's annualized expense ratio used to calculate the expense estimate in the table below.
Hypothetical Example for Comparison Purposes
The second line of the accompanying table provides information about hypothetical account values and hypothetical expenses based on the Fund's actual expense ratio and an assumed rate of return of 5% per year before expenses, which is not the Fund's actual return. The hypothetical account values and expenses may not be used to estimate the actual ending account balance or expenses you paid for the period. You may use this information to compare the ongoing costs of investing in the Fund and other funds. To do so, compare this 5% hypothetical example with the 5% hypothetical examples that appear in the shareholder reports of the other funds. A small balance maintenance fee of $12.00 that is charged once a year may apply for certain accounts with a value of less than $2,000. This fee is not included in the table below. If it was, the estimate of expenses you paid during the period would be higher, and your ending account value lower, by this amount. In addition, the Fund, as a shareholder in the underlying Fidelity Central Funds, will indirectly bear its pro-rata share of the fees and expenses incurred by the underlying Fidelity Central Funds. These fees and expenses are not included in the Fund's annualized expense ratio used to calculate the expense estimate in the table below.
Please note that the expenses shown in the table are meant to highlight your ongoing costs only and do not reflect any transaction costs. Therefore, the second line of the table is useful in comparing ongoing costs only, and will not help you determine the relative total costs of owning different funds. In addition, if these transactional costs were included, your costs would have been higher.
Annual Report
Shareholder Expense Example - continued
| Annualized
Expense RatioB | Beginning
Account Value
May 1, 2014 | Ending
Account Value
October 31, 2014 | Expenses Paid
During Period*
May 1, 2014
to October 31, 2014 |
Actual | 1.13% | $ 1,000.00 | $ 1,034.10 | $ 5.79 |
HypotheticalA | | $ 1,000.00 | $ 1,019.51 | $ 5.75 |
A 5% return per year before expenses
B Annualized expense ratio reflects expenses net of applicable fee waivers.
* Expenses are equal to the Fund's annualized expense ratio, multiplied by the average account value over the period, multiplied by 184/365 (to reflect the one-half year period).
Annual Report
Investment Changes (Unaudited)
Geographic Diversification (% of fund's net assets) |
As of October 31, 2014 |
 | United States of America* 52.9% | |
 | Japan 9.4% | |
 | United Kingdom 6.0% | |
 | Sweden 4.3% | |
 | Switzerland 4.2% | |
 | Canada 4.2% | |
 | France 2.6% | |
 | Israel 2.5% | |
 | Germany 2.0% | |
 | Other 11.9% | |

* Includes Short-Term Investments and Net Other Assets (Liabilities). |
Percentages are based on country or territory of incorporation and are adjusted for the effect of futures contracts, if applicable. |
As of April 30, 2014 |
| United States of America* 44.7% | |
| United Kingdom 9.7% | |
| Japan 6.7% | |
| Sweden 5.2% | |
| Switzerland 3.9% | |
| Canada 3.9% | |
| South Africa 3.1% | |
| Ireland 3.0% | |
| Netherlands 2.6% | |
| Other 17.2% | |

* Includes Short-Term Investments and Net Other Assets (Liabilities). |
Percentages are based on country or territory of incorporation and are adjusted for the effect of futures contracts, if applicable. |
Asset Allocation as of October 31, 2014 |
| % of fund's
net assets | % of fund's net assets
6 months ago |
Stocks | 95.0 | 96.6 |
Short-Term Investments and Net Other Assets (Liabilities) | 5.0 | 3.4 |
Top Ten Stocks as of October 31, 2014 |
| % of fund's
net assets | % of fund's net assets
6 months ago |
Apple, Inc. (United States of America, Technology Hardware, Storage & Peripherals) | 2.5 | 0.0 |
Johnson & Johnson (United States of America, Pharmaceuticals) | 2.3 | 1.3 |
JPMorgan Chase & Co. (United States of America, Banks) | 2.3 | 2.1 |
Amgen, Inc. (United States of America, Biotechnology) | 2.1 | 1.4 |
Roche Holding AG (participation certificate) (Switzerland, Pharmaceuticals) | 2.0 | 2.1 |
Dr. Pepper Snapple Group, Inc. (United States of America, Beverages) | 1.8 | 1.0 |
Wells Fargo & Co. (United States of America, Banks) | 1.8 | 2.0 |
Chevron Corp. (United States of America, Oil, Gas & Consumable Fuels) | 1.7 | 1.9 |
Bank of America Corp. (United States of America, Banks) | 1.7 | 1.2 |
Astellas Pharma, Inc. (Japan, Pharmaceuticals) | 1.7 | 0.8 |
| 19.9 | |
Market Sectors as of October 31, 2014 |
| % of fund's
net assets | % of fund's net assets
6 months ago |
Financials | 20.4 | 22.6 |
Consumer Discretionary | 13.6 | 12.2 |
Health Care | 13.4 | 9.7 |
Information Technology | 11.6 | 11.5 |
Industrials | 10.4 | 11.6 |
Consumer Staples | 10.3 | 11.0 |
Energy | 7.5 | 8.3 |
Telecommunication Services | 3.7 | 6.5 |
Materials | 3.6 | 2.5 |
Utilities | 0.5 | 0.7 |
Annual Report
Investments October 31, 2014
Showing Percentage of Net Assets
Common Stocks - 95.0% |
| Shares | | Value |
Australia - 0.6% |
Woodside Petroleum Ltd. | 8,396 | | $ 298,229 |
Bailiwick of Jersey - 0.6% |
Shire PLC | 4,900 | | 328,775 |
Canada - 4.2% |
Alimentation Couche-Tard, Inc. Class B (sub. vtg.) | 100 | | 3,394 |
Constellation Software, Inc. | 500 | | 140,854 |
Corus Entertainment, Inc. Class B (non-vtg.) (d) | 17,800 | | 327,556 |
Fairfax Financial Holdings Ltd. (sub. vtg.) | 641 | | 292,862 |
Potash Corp. of Saskatchewan, Inc. (d) | 16,400 | | 559,787 |
PrairieSky Royalty Ltd. (d) | 5,200 | | 160,099 |
Suncor Energy, Inc. | 19,300 | | 685,317 |
TOTAL CANADA | | 2,169,869 |
Cayman Islands - 0.3% |
SITC International Holdings Co. Ltd. | 267,000 | | 142,230 |
Chile - 0.4% |
Quinenco SA | 88,781 | | 184,375 |
Denmark - 0.7% |
Spar Nord Bank A/S | 14,100 | | 142,436 |
Vestas Wind Systems A/S (a) | 6,800 | | 227,602 |
TOTAL DENMARK | | 370,038 |
France - 2.6% |
Bureau Veritas SA | 15,200 | | 375,815 |
Renault SA | 4,500 | | 334,008 |
Total SA | 11,100 | | 662,707 |
TOTAL FRANCE | | 1,372,530 |
Germany - 2.0% |
AURELIUS AG | 6,199 | | 215,337 |
Gerry Weber International AG (Bearer) | 5,457 | | 219,035 |
OSRAM Licht AG (a) | 7,059 | | 247,334 |
Siemens AG | 3,239 | | 365,338 |
TOTAL GERMANY | | 1,047,044 |
Greece - 0.3% |
Greek Organization of Football Prognostics SA | 13,400 | | 162,381 |
Hong Kong - 1.3% |
HKT Trust/HKT Ltd. unit | 214,600 | | 261,433 |
Techtronic Industries Co. Ltd. | 129,500 | | 405,413 |
TOTAL HONG KONG | | 666,846 |
Common Stocks - continued |
| Shares | | Value |
Ireland - 1.5% |
Accenture PLC Class A | 5,840 | | $ 473,741 |
Greencore Group PLC | 74,186 | | 311,404 |
TOTAL IRELAND | | 785,145 |
Israel - 2.5% |
Bezeq The Israel Telecommunication Corp. Ltd. | 148,600 | | 251,222 |
Rami Levi Chain Stores Hashikma Marketing 2006 Ltd. | 4,496 | | 200,167 |
Teva Pharmaceutical Industries Ltd. sponsored ADR | 14,650 | | 827,286 |
TOTAL ISRAEL | | 1,278,675 |
Japan - 9.4% |
Astellas Pharma, Inc. | 56,100 | | 870,700 |
Broadleaf Co. Ltd. | 2,900 | | 45,835 |
Daiichikosho Co. Ltd. | 10,400 | | 262,459 |
Fukuda Denshi Co. Ltd. | 2,700 | | 138,189 |
Hoya Corp. | 18,200 | | 644,041 |
Japan Tobacco, Inc. | 11,900 | | 406,017 |
KDDI Corp. | 7,300 | | 479,387 |
Leopalace21 Corp. (a) | 34,700 | | 217,342 |
Mitsubishi Electric Corp. | 22,000 | | 283,664 |
Monex Group, Inc. | 95,000 | | 242,470 |
NEC Corp. | 109,000 | | 385,465 |
Nippon Telegraph & Telephone Corp. | 6,000 | | 373,313 |
Tsuruha Holdings, Inc. | 6,200 | | 366,053 |
VT Holdings Co. Ltd. | 10,684 | | 42,194 |
Workman Co. Ltd. | 2,500 | | 130,663 |
TOTAL JAPAN | | 4,887,792 |
Korea (South) - 0.8% |
Coway Co. Ltd. | 1,493 | | 113,388 |
Samsung Electronics Co. Ltd. | 253 | | 292,925 |
TOTAL KOREA (SOUTH) | | 406,313 |
Luxembourg - 0.3% |
Altice SA | 2,300 | | 143,219 |
Netherlands - 1.1% |
LyondellBasell Industries NV Class A | 6,000 | | 549,780 |
Norway - 0.2% |
Gjensidige Forsikring ASA (d) | 7,100 | | 128,948 |
Singapore - 1.2% |
United Overseas Bank Ltd. | 33,819 | | 605,891 |
Common Stocks - continued |
| Shares | | Value |
South Africa - 1.8% |
Lewis Group Ltd. | 94,400 | | $ 568,724 |
Reunert Ltd. | 70,300 | | 371,011 |
TOTAL SOUTH AFRICA | | 939,735 |
Spain - 0.5% |
Atresmedia Corporacion de Medios de Comunicacion SA (d) | 18,315 | | 268,302 |
Sweden - 4.3% |
Intrum Justitia AB | 20,683 | | 614,539 |
Meda AB (A Shares) (d) | 19,100 | | 250,902 |
Nordea Bank AB | 65,200 | | 836,175 |
Svenska Handelsbanken AB (A Shares) | 11,580 | | 552,172 |
TOTAL SWEDEN | | 2,253,788 |
Switzerland - 4.2% |
Banque Cantonale Vaudoise (Bearer) | 580 | | 310,451 |
Roche Holding AG (participation certificate) | 3,467 | | 1,023,117 |
TE Connectivity Ltd. | 7,000 | | 427,910 |
UBS AG | 24,626 | | 428,200 |
TOTAL SWITZERLAND | | 2,189,678 |
Taiwan - 0.3% |
Vanguard International Semiconductor Corp. | 120,000 | | 180,004 |
United Kingdom - 6.0% |
Ashmore Group PLC | 26,100 | | 133,022 |
British American Tobacco PLC (United Kingdom) | 10,200 | | 578,111 |
Exova Group Ltd. PLC (a) | 9,200 | | 24,983 |
GlaxoSmithKline PLC | 34,000 | | 768,875 |
Hilton Food Group PLC | 56,200 | | 337,137 |
ITV PLC | 121,300 | | 393,909 |
Reckitt Benckiser Group PLC | 2,430 | | 204,082 |
Taylor Wimpey PLC | 1,642 | | 3,110 |
Tesco PLC | 53,600 | | 148,793 |
WH Smith PLC | 28,852 | | 519,239 |
TOTAL UNITED KINGDOM | | 3,111,261 |
United States of America - 47.9% |
AbbVie, Inc. | 6,730 | | 427,086 |
American Tower Corp. | 4,960 | | 483,600 |
Amgen, Inc. | 6,620 | | 1,073,632 |
Apple, Inc. | 11,950 | | 1,290,594 |
ARAMARK Holdings Corp. | 9,304 | | 259,675 |
Bank of America Corp. | 51,780 | | 888,545 |
Common Stocks - continued |
| Shares | | Value |
United States of America - continued |
Capital One Financial Corp. | 8,530 | | $ 706,028 |
Chevron Corp. | 7,465 | | 895,427 |
CMS Energy Corp. | 7,900 | | 258,093 |
Comcast Corp. Class A | 7,600 | | 420,660 |
Community Trust Bancorp, Inc. | 7,898 | | 283,933 |
CVB Financial Corp. | 22,310 | | 352,052 |
Danaher Corp. | 5,400 | | 434,160 |
Darden Restaurants, Inc. | 6,720 | | 347,962 |
Dr. Pepper Snapple Group, Inc. | 13,541 | | 937,714 |
Dun & Bradstreet Corp. | 3,450 | | 423,695 |
E.I. du Pont de Nemours & Co. | 3,100 | | 214,365 |
Exxon Mobil Corp. | 8,730 | | 844,278 |
FedEx Corp. | 3,681 | | 616,199 |
Freeport-McMoRan, Inc. | 9,400 | | 267,900 |
GameStop Corp. Class A | 100 | | 4,276 |
General Electric Co. | 26,900 | | 694,289 |
H&R Block, Inc. | 11,310 | | 365,426 |
IBM Corp. | 4,070 | | 669,108 |
Johnson & Johnson | 11,300 | | 1,217,914 |
Johnson Controls, Inc. | 8,170 | | 386,033 |
JPMorgan Chase & Co. | 19,930 | | 1,205,366 |
Lakeland Financial Corp. | 7,688 | | 318,591 |
Lorillard, Inc. | 4,400 | | 270,600 |
McDonald's Corp. | 2,700 | | 253,071 |
McGraw Hill Financial, Inc. | 4,340 | | 392,683 |
Microsoft Corp. | 13,964 | | 655,610 |
MPLX LP | 5,790 | | 386,077 |
Oracle Corp. | 21,126 | | 824,970 |
PepsiCo, Inc. | 5,000 | | 480,850 |
Procter & Gamble Co. | 6,700 | | 584,709 |
SunTrust Banks, Inc. | 9,600 | | 375,744 |
Target Corp. | 4,900 | | 302,918 |
The Coca-Cola Co. | 14,100 | | 590,508 |
Time Warner Cable, Inc. | 3,080 | | 453,407 |
U.S. Bancorp | 11,880 | | 506,088 |
United Technologies Corp. | 4,420 | | 472,940 |
Verizon Communications, Inc. | 11,147 | | 560,137 |
VF Corp. | 5,620 | | 380,362 |
Common Stocks - continued |
| Shares | | Value |
United States of America - continued |
W.R. Grace & Co. (a) | 2,700 | | $ 255,420 |
Wells Fargo & Co. | 17,157 | | 910,865 |
TOTAL UNITED STATES OF AMERICA | | 24,943,560 |
TOTAL COMMON STOCKS (Cost $44,536,835) |
49,414,408
|
Nonconvertible Bonds - 0.0% |
| Principal Amount | | |
Canada - 0.0% |
Constellation Software, Inc. 7.4% 3/31/40
(Cost $2,060) | CAD | 2,400 | |
2,023
|
Money Market Funds - 7.4% |
| Shares | | |
Fidelity Cash Central Fund, 0.11% (b) | 2,621,050 | | 2,621,050 |
Fidelity Securities Lending Cash Central Fund, 0.11% (b)(c) | 1,250,070 | | 1,250,070 |
TOTAL MONEY MARKET FUNDS (Cost $3,871,120) |
3,871,120
|
TOTAL INVESTMENT PORTFOLIO - 102.4% (Cost $48,410,015) | | 53,287,551 |
NET OTHER ASSETS (LIABILITIES) - (2.4)% | | (1,249,063) |
NET ASSETS - 100% | $ 52,038,488 |
Currency Abbreviations |
CAD | - | Canadian dollar |
Legend |
(a) Non-income producing |
(b) Affiliated fund that is generally available only to investment companies and other accounts managed by Fidelity Investments. The rate quoted is the annualized seven-day yield of the fund at period end. A complete unaudited listing of the fund's holdings as of its most recent quarter end is available upon request. In addition, each Fidelity Central Fund's financial statements, which are not covered by the Fund's Report of Independent Registered Public Accounting Firm, are available on the SEC's website or upon request. |
(c) Investment made with cash collateral received from securities on loan. |
(d) Security or a portion of the security is on loan at period end. |
Affiliated Central Funds |
Information regarding fiscal year to date income earned by the Fund from investments in Fidelity Central Funds is as follows: |
Fund | Income earned |
Fidelity Cash Central Fund | $ 1,931 |
Fidelity Securities Lending Cash Central Fund | 13,364 |
Total | $ 15,295 |
Other Information |
Categorizations in the Schedule of Investments are based on country or territory of incorporation. |
The following is a summary of the inputs used, as of October 31, 2014, involving the Fund's assets and liabilities carried at fair value. The inputs or methodology used for valuing securities may not be an indication of the risk associated with investing in those securities. For more information on valuation inputs, and their aggregation into the levels used in the table below, please refer to the Investment Valuation section in the accompanying Notes to Financial Statements. |
Valuation Inputs at Reporting Date: |
Description | Total | Level 1 | Level 2 | Level 3 |
Investments in Securities: | | | | |
Equities: | | | | |
Consumer Discretionary | $ 7,067,390 | $ 6,226,661 | $ 840,729 | $ - |
Consumer Staples | 5,419,539 | 3,920,565 | 1,498,974 | - |
Energy | 3,932,134 | 2,971,198 | 960,936 | - |
Financials | 10,528,801 | 9,034,898 | 1,493,903 | - |
Health Care | 6,926,476 | 3,796,820 | 3,129,656 | - |
Industrials | 5,478,174 | 4,686,942 | 791,232 | - |
Valuation Inputs at Reporting Date: |
Description | Total | Level 1 | Level 2 | Level 3 |
Investments in Securities: | | | | |
Equities: | | | | |
Information Technology | $ 6,031,057 | $ 4,775,712 | $ 1,255,345 | $ - |
Materials | 1,847,252 | 1,847,252 | - | - |
Telecommunication Services | 1,925,492 | 811,359 | 1,114,133 | - |
Utilities | 258,093 | 258,093 | - | - |
Corporate Bonds | 2,023 | - | - | 2,023 |
Money Market Funds | 3,871,120 | 3,871,120 | - | - |
Total Investments in Securities: | $ 53,287,551 | $ 42,200,620 | $ 11,084,908 | $ 2,023 |
The following is a summary of transfers between Level 1 and Level 2 for the period ended October 31, 2014. Transfers are assumed to have occurred at the beginning of the period, and are primarily attributable to the valuation techniques used for foreign equity securities, as discussed in the accompanying Notes to Financial Statements: |
Transfers | Total |
Level 1 to Level 2 | $ 1,255,644 |
Level 2 to Level 1 | $ 0 |
See accompanying notes which are an integral part of the financial statements.
Annual Report
Statement of Assets and Liabilities
| October 31, 2014 |
| | |
Assets | | |
Investment in securities, at value (including securities loaned of $1,190,256) - See accompanying schedule: Unaffiliated issuers (cost $44,538,895) | $ 49,416,431 | |
Fidelity Central Funds (cost $3,871,120) | 3,871,120 | |
Total Investments (cost $48,410,015) | | $ 53,287,551 |
Foreign currency held at value (cost $1,340) | | 1,295 |
Receivable for investments sold | | 702 |
Receivable for fund shares sold | | 78,332 |
Dividends receivable | | 104,583 |
Distributions receivable from Fidelity Central Funds | | 701 |
Prepaid expenses | | 192 |
Other receivables | | 7,118 |
Total assets | | 53,480,474 |
| | |
Liabilities | | |
Payable for investments purchased | $ 73,473 | |
Payable for fund shares redeemed | 35,615 | |
Accrued management fee | 29,320 | |
Other affiliated payables | 10,773 | |
Other payables and accrued expenses | 42,735 | |
Collateral on securities loaned, at value | 1,250,070 | |
Total liabilities | | 1,441,986 |
| | |
Net Assets | | $ 52,038,488 |
Net Assets consist of: | | |
Paid in capital | | $ 43,186,632 |
Undistributed net investment income | | 79,937 |
Accumulated undistributed net realized gain (loss) on investments and foreign currency transactions | | 3,895,925 |
Net unrealized appreciation (depreciation) on investments and assets and liabilities in foreign currencies | | 4,875,994 |
Net Assets, for 4,044,911 shares outstanding | | $ 52,038,488 |
Net Asset Value, offering price and redemption price per share ($52,038,488 ÷ 4,044,911 shares) | | $ 12.87 |
See accompanying notes which are an integral part of the financial statements.
Annual Report
Statement of Operations
| Year ended October 31, 2014 |
| | |
Investment Income | | |
Dividends | | $ 1,356,812 |
Special dividends | | 308,483 |
Interest | | 306 |
Income from Fidelity Central Funds | | 15,295 |
Income before foreign taxes withheld | | 1,680,896 |
Less foreign taxes withheld | | (88,875) |
Total income | | 1,592,021 |
| | |
Expenses | | |
Management fee | $ 330,307 | |
Transfer agent fees | 92,601 | |
Accounting and security lending fees | 24,610 | |
Custodian fees and expenses | 13,947 | |
Independent trustees' compensation | 189 | |
Registration fees | 21,750 | |
Audit | 63,960 | |
Legal | 145 | |
Miscellaneous | 492 | |
Total expenses before reductions | 548,001 | |
Expense reductions | (707) | 547,294 |
Net investment income (loss) | | 1,044,727 |
Realized and Unrealized Gain (Loss) Net realized gain (loss) on: | | |
Investment securities: | | |
Unaffiliated issuers | 4,709,544 | |
Foreign currency transactions | 9,632 | |
Total net realized gain (loss) | | 4,719,176 |
Change in net unrealized appreciation (depreciation) on: Investment securities | (1,537,097) | |
Assets and liabilities in foreign currencies | (2,117) | |
Total change in net unrealized appreciation (depreciation) | | (1,539,214) |
Net gain (loss) | | 3,179,962 |
Net increase (decrease) in net assets resulting from operations | | $ 4,224,689 |
See accompanying notes which are an integral part of the financial statements.
Annual Report
Financial Statements - continued
Statement of Changes in Net Assets
| Year ended
October 31,
2014 | Year ended
October 31,
2013 |
Increase (Decrease) in Net Assets | | |
Operations | | |
Net investment income (loss) | $ 1,044,727 | $ 673,718 |
Net realized gain (loss) | 4,719,176 | 1,081,466 |
Change in net unrealized appreciation (depreciation) | (1,539,214) | 5,341,911 |
Net increase (decrease) in net assets resulting
from operations | 4,224,689 | 7,097,095 |
Distributions to shareholders from net investment income | (913,090) | (655,660) |
Distributions to shareholders from net realized gain | (995,008) | (75,040) |
Total distributions | (1,908,098) | (730,700) |
Share transactions
Proceeds from sales of shares | 24,314,257 | 22,544,863 |
Reinvestment of distributions | 1,764,689 | 683,107 |
Cost of shares redeemed | (18,632,872) | (14,167,602) |
Net increase (decrease) in net assets resulting from share transactions | 7,446,074 | 9,060,368 |
Redemption fees | 4,623 | 6,232 |
Total increase (decrease) in net assets | 9,767,288 | 15,432,995 |
| | |
Net Assets | | |
Beginning of period | 42,271,200 | 26,838,205 |
End of period (including undistributed net investment income of $79,937 and undistributed net investment income of $0, respectively) | $ 52,038,488 | $ 42,271,200 |
Other Information Shares | | |
Sold | 1,926,789 | 2,028,428 |
Issued in reinvestment of distributions | 143,562 | 62,848 |
Redeemed | (1,491,182) | (1,267,633) |
Net increase (decrease) | 579,169 | 823,643 |
See accompanying notes which are an integral part of the financial statements.
Annual Report
Financial Highlights
Years ended October 31, | 2014 | 2013 | 2012 H |
Selected Per-Share Data | | | |
Net asset value, beginning of period | $ 12.20 | $ 10.16 | $ 10.00 |
Income from Investment Operations | | | |
Net investment income (loss) D | .28G | .22 | .08 |
Net realized and unrealized gain (loss) | .92 | 2.06 | .15 |
Total from investment operations | 1.20 | 2.28 | .23 |
Distributions from net investment income | (.25) | (.21) | (.07) |
Distributions from net realized gain | (.28) | (.03) | - |
Total distributions | (.53) | (.24) | (.07) |
Redemption fees added to paid in capital D, J | - | - | - |
Net asset value, end of period | $ 12.87 | $ 12.20 | $ 10.16 |
Total ReturnB, C | 10.10% | 22.73% | 2.25% |
Ratios to Average Net AssetsE, I | | | |
Expenses before reductions | 1.16% | 1.28% | 2.18%A |
Expenses net of fee waivers, if any | 1.16% | 1.20% | 1.20%A |
Expenses net of all reductions | 1.16% | 1.19% | 1.17%A |
Net investment income (loss) | 2.21%G | 1.94% | 1.62%A |
Supplemental Data | | | |
Net assets, end of period (000 omitted) | $52,038 | $ 42,271 | $ 26,838 |
Portfolio turnover rateF | 92% | 66% | 33%K |
A Annualized
B Total returns for periods of less than one year are not annualized.
C Total returns would have been lower if certain expenses had not been reduced during the applicable periods shown.
D Calculated based on average shares outstanding during the period.
E Fees and expenses of any underlying Fidelity Central Funds are not included in the Fund's expense ratio. The Fund indirectly bears its proportionate share of the expenses of any underlying Fidelity Central Funds.
F Amount does not include the portfolio activity of any underlying Fidelity Central Funds.
G Investment income per share reflects a large, non-recurring dividend which amounted to $.08 per share. Excluding this non-recurring dividend, the ratio of net investment income (loss) to average net assets would have been 1.56%.
H For the period May 2, 2012 (commencement of operations) to October 31, 2012.
I Expense ratios reflect operating expenses of the Fund. Expenses before reductions do not reflect amounts reimbursed by the investment adviser or reductions from brokerage service arrangements or reductions from other expense offset arrangements and do not represent the amount paid by the Fund during periods when reimbursements or reductions occur. Expense ratios before reductions for start-up periods may not be representative of longer term operating periods. Expenses net of fee waivers reflect expenses after reimbursement by the investment adviser but prior to reductions from brokerage service arrangements or other expense offset arrangements. Expenses net of all reductions represent the net expenses paid by the Fund.
J Amount represents less than $.01 per share.
K Amount not annualized.
See accompanying notes which are an integral part of the financial statements.
Annual Report
Notes to Financial Statements
For the period ended October 31, 2014
1. Organization.
Fidelity Global Equity Income Fund (the Fund) is a fund of Fidelity Investment Trust (the Trust) and is authorized to issue an unlimited number of shares. Share transactions on the Statement of Changes in Net Assets may contain exchanges between funds. The Trust is registered under the Investment Company Act of 1940, as amended (the 1940 Act), as an open-end management investment company organized as a Massachusetts business trust.
2. Investments in Fidelity Central Funds.
The Fund invests in Fidelity Central Funds, which are open-end investment companies generally available only to other investment companies and accounts managed by the investment adviser and its affiliates. The Fund's Schedule of Investments lists each of the Fidelity Central Funds held as of period end, if any, as an investment of the Fund, but does not include the underlying holdings of each Fidelity Central Fund. As an Investing Fund, the Fund indirectly bears its proportionate share of the expenses of the underlying Fidelity Central Funds.
The Money Market Central Funds seek preservation of capital and current income and are managed by Fidelity Investments Money Management, Inc. (FIMM), an affiliate of the investment adviser. Annualized expenses of the Money Market Central Funds as of their most recent shareholder report date are less than .01%.
A complete unaudited list of holdings for each Fidelity Central Fund is available upon request or at the Securities and Exchange Commission (the SEC) website at www.sec.gov. In addition, the financial statements of the Fidelity Central Funds, which are not covered by the Fund's Report of Independent Registered Public Accounting Firm, are available on the SEC website or upon request.
3. Significant Accounting Policies.
The financial statements have been prepared in conformity with accounting principles generally accepted in the United States of America (GAAP), which require management to make certain estimates and assumptions at the date of the financial statements. Actual results could differ from those estimates. Subsequent events, if any, through the date that the financial statements were issued have been evaluated in the preparation of the financial statements. The following summarizes the significant accounting policies of the Fund:
Investment Valuation. Investments are valued as of 4:00 p.m. Eastern time on the last calendar day of the period. In accordance with valuation policies and procedures approved by the Board of Trustees (the Board), the Fund attempts to obtain prices from one or more third party pricing vendors or brokers to value its investments. When
Annual Report
3. Significant Accounting Policies - continued
Investment Valuation - continued
current market prices, quotations or currency exchange rates are not readily available or reliable, investments will be fair valued in good faith by the Fidelity Management & Research Company (FMR) Fair Value Committee (the Committee), in accordance with procedures adopted by the Board. Factors used in determining fair value vary by investment type and may include market or investment specific events, changes in interest rates and credit quality. The frequency with which these procedures are used cannot be predicted and they may be utilized to a significant extent. The Committee oversees the Fund's valuation policies and procedures and is responsible for approving and reporting to the Board all fair value determinations.
The Fund categorizes the inputs to valuation techniques used to value its investments into a disclosure hierarchy consisting of three levels as shown below:
Level 1 - quoted prices in active markets for identical investments
Level 2 - other significant observable inputs (including quoted prices for similar investments, interest rates, prepayment speeds, etc.)
Level 3 - unobservable inputs (including the Fund's own assumptions based on the best information available)
Valuation techniques used to value the Fund's investments by major category are as follows:
Equity securities, including restricted securities, for which market quotations are readily available, are valued at the last reported sale price or official closing price as reported by a third party pricing vendor on the primary market or exchange on which they are traded and are categorized as Level 1 in the hierarchy. In the event there were no sales during the day or closing prices are not available, securities are valued at the last quoted bid price or may be valued using the last available price and are generally categorized as Level 2 in the hierarchy. For foreign equity securities, when market or security specific events arise, comparisons to the valuation of American Depositary Receipts (ADRs), futures contracts, Exchange-Traded Funds (ETFs) and certain indexes as well as quoted prices for similar securities may be used and would be categorized as Level 2 in the hierarchy. Utilizing these techniques may result in transfers between Level 1 and Level 2. For equity securities, including restricted securities, where observable inputs are limited, assumptions about market activity and risk are used and these securities may be categorized as Level 3 in the hierarchy.
Debt securities, including restricted securities, are valued based on evaluated prices received from third party pricing vendors or from brokers who make markets in such securities. Corporate bonds are valued by pricing vendors who utilize matrix pricing
Annual Report
Notes to Financial Statements - continued
3. Significant Accounting Policies - continued
Investment Valuation - continued
which considers yield or price of bonds of comparable quality, coupon, maturity and type or by broker-supplied prices. When independent prices are unavailable or unreliable, debt securities may be valued utilizing pricing methodologies which consider similar factors that would be used by third party pricing vendors. Debt securities are generally categorized as Level 2 in the hierarchy but may be Level 3 depending on the circumstances.
Investments in open-end mutual funds, including the Fidelity Central Funds, are valued at their closing net asset value (NAV) each business day and are categorized as Level 1 in the hierarchy.
Changes in valuation techniques may result in transfers in or out of an assigned level within the disclosure hierarchy. The aggregate value of investments by input level, as of October 31, 2014, including information on transfers between Levels 1 and 2 is included at the end of the Fund's Schedule of Investments.
Foreign Currency. The Fund may use foreign currency contracts to facilitate transactions in foreign-denominated securities. Gains and losses from these transactions may arise from changes in the value of the foreign currency or if the counterparties do not perform under the contracts' terms.
Foreign-denominated assets, including investment securities, and liabilities are translated into U.S. dollars at the exchange rates at period end. Purchases and sales of investment securities, income and dividends received and expenses denominated in foreign currencies are translated into U.S. dollars at the exchange rate in effect on the transaction date.
The effects of exchange rate fluctuations on investments are included with the net realized and unrealized gain (loss) on investment securities. Other foreign currency transactions resulting in realized and unrealized gain (loss) are disclosed separately.
Investment Transactions and Income. For financial reporting purposes, the Fund's investment holdings and NAV include trades executed through the end of the last business day of the period. The NAV per share for processing shareholder transactions is calculated as of the close of business of the New York Stock Exchange (NYSE), normally 4:00 p.m. Eastern time and includes trades executed through the end of the prior business day. Gains and losses on securities sold are determined on the basis of identified cost. Dividend income is recorded on the ex-dividend date, except for certain dividends from foreign securities where the ex-dividend date may have passed, which are recorded as soon as the Fund is informed of the ex-dividend date. Non-cash dividends included in dividend income, if any, are recorded at the fair market value of the securities received.
Annual Report
3. Significant Accounting Policies - continued
Investment Transactions and Income - continued
Income and capital gain distributions from Fidelity Central Funds, if any, are recorded on the ex-dividend date. Distributions received on securities that represent a return of capital or capital gain are recorded as a reduction of cost of investments and/or as a realized gain. Subsequent to ex-dividend date the Fund determines the components of these distributions, based upon receipt of tax filings or other correspondence relating to the underlying investment. Large, non-recurring dividends recognized by the Fund are presented separately on the Statement of Operations as "Special Dividends" and the impact of these dividends is presented in the Financial Highlights. Interest income is accrued as earned and includes coupon interest and amortization of premium and accretion of discount on debt securities as applicable. Investment income is recorded net of foreign taxes withheld where recovery of such taxes is uncertain.
Expenses. Expenses directly attributable to a fund are charged to that fund. Expenses attributable to more than one fund are allocated among the respective funds on the basis of relative net assets or other appropriate methods. Expense estimates are accrued in the period to which they relate and adjustments are made when actual amounts are known.
Income Tax Information and Distributions to Shareholders. Each year, the Fund intends to qualify as a regulated investment company under Subchapter M of the Internal Revenue Code, including distributing substantially all of its taxable income and realized gains. As a result, no provision for U.S. Federal income taxes is required. As of October 31, 2014, the Fund did not have any unrecognized tax benefits in the financial statements; nor is the Fund aware of any tax positions for which it is reasonably possible that the total amounts of unrecognized tax benefits will significantly change in the next twelve months. The Fund files a U.S. federal tax return, in addition to state and local tax returns as required. The Fund's federal income tax returns are subject to examination by the Internal Revenue Service (IRS) for a period of three fiscal years after they are filed. State and local tax returns may be subject to examination for an additional fiscal year depending on the jurisdiction. Foreign taxes are provided for based on the Fund's understanding of the tax rules and rates that exist in the foreign markets in which it invests.
Distributions are declared and recorded on the ex-dividend date. Income and capital gain distributions are determined in accordance with income tax regulations, which may differ from GAAP. In addition, the Fund claimed a portion of the payment made to redeeming shareholders as a distribution for income tax purposes.
Capital accounts within the financial statements are adjusted for permanent book-tax differences. These adjustments have no impact on net assets or the results of operations. Capital accounts are not adjusted for temporary book-tax differences which will reverse in a subsequent period.
Annual Report
Notes to Financial Statements - continued
3. Significant Accounting Policies - continued
Income Tax Information and Distributions to Shareholders - continued
Book-tax differences are primarily due to foreign currency transactions, passive foreign investment companies (PFIC), partnerships and losses deferred due to wash sales.
The federal tax cost of investment securities and unrealized appreciation (depreciation) as of period end were as follows:
Gross unrealized appreciation | $ 12,298,513 |
Gross unrealized depreciation | (7,460,868) |
Net unrealized appreciation (depreciation) on securities | $ 4,837,645 |
| |
Tax Cost | $ 48,449,906 |
The tax-based components of distributable earnings as of period end were as follows:
Undistributed ordinary income | $ 329,264 |
Undistributed long-term capital gain | $ 3,687,131 |
Net unrealized appreciation (depreciation) on securities and other investments | $ 4,835,462 |
| October 31, 2014 | October 31, 2013 |
Ordinary Income | $ 1,438,821 | $ 730,700 |
Long-term Capital Gains | 469,277 | - |
Total | $ 1,908,098 | $ 730,700 |
Short-Term Trading (Redemption) Fees. Shares held by investors in the Fund less than 30 days may have been subject to a redemption fee equal to 1.00% of the NAV of shares redeemed. All redemption fees, which reduce the proceeds of the shareholder redemption, are retained by the Fund and accounted for as an addition to paid in capital.
New Accounting Pronouncement. In June 2014, the Financial Accounting Standards Board issued Accounting Standard Update No. 2014-11, Repurchase-to-Maturity Transactions, Repurchase Financings, and Disclosures. The Update amends the accounting for certain repurchase agreements and expands disclosure requirements for reverse repurchase agreements, securities lending and other similar transactions. The disclosure requirements are effective for annual and interim reporting periods beginning after December 15, 2014. Management is currently evaluating the impact of the Update on the Fund's financial statements and related disclosures.
Annual Report
4. Purchases and Sales of Investments.
Purchases and sales of securities, other than short-term securities, aggregated $47,076,262 and $41,567,542, respectively.
5. Fees and Other Transactions with Affiliates.
Management Fee. Fidelity Management & Research Company (the investment adviser) and its affiliates provide the Fund with investment management related services for which the Fund pays a monthly management fee. The management fee is the sum of an individual fund fee rate that is based on an annual rate of .45% of the Fund's average net assets and an annualized group fee rate that averaged .25% during the period. The group fee rate is based upon the average net assets of all the mutual funds advised by the investment adviser, including any mutual funds previously advised by the investment adviser that are currently advised by Fidelity SelectCo, LLC, an affiliate of the investment adviser. The group fee rate decreases as assets under management increase and increases as assets under management decrease. For the reporting period, the total annual management fee rate was .70% of the Fund's average net assets.
Transfer Agent Fees. Fidelity Investments Institutional Operations Company, Inc. (FIIOC), an affiliate of the investment adviser, is the Fund's transfer, dividend disbursing and shareholder servicing agent. FIIOC receives account fees and asset-based fees that vary according to account size and type of account. FIIOC pays for typesetting, printing and mailing of shareholder reports, except proxy statements. For the period, the transfer agent fees were equivalent to an annual rate of .20% of average net assets.
Accounting and Security Lending Fees. Fidelity Service Company, Inc. (FSC), an affiliate of the investment adviser, maintains the Fund's accounting records. The accounting fee is based on the level of average net assets for each month. Under a separate contract, FSC administers the security lending program. The security lending fee is based on the number and duration of lending transactions.
Brokerage Commissions. The Fund placed a portion of its portfolio transactions with brokerage firms which are affiliates of the investment adviser. Brokerage commissions are included in net realized gain (loss) and change in net unrealized appreciation (depreciation) in the Statement of Operations. The commissions paid to these affiliated firms were $184 for the period.
6. Committed Line of Credit.
The Fund participates with other funds managed by the investment adviser or an affiliate in a $4.25 billion credit facility (the "line of credit") to be utilized for temporary or emergency purposes to fund shareholder redemptions or for other short-term liquidity purposes. The Fund has agreed to pay commitment fees on its pro-rata portion of the line of credit, which amounted to $74 and is reflected in Miscellaneous expenses on the Statement of Operations. During the period, the Fund did not borrow on this line of credit.
Annual Report
Notes to Financial Statements - continued
7. Security Lending.
The Fund lends portfolio securities through a lending agent from time to time in order to earn additional income. For equity securities, a lending agent is used and may loan securities to certain qualified borrowers, including Fidelity Capital Markets (FCM), a broker-dealer affiliated with the Fund. On the settlement date of the loan, the Fund receives collateral (in the form of U.S. Treasury obligations, letters of credit and/or cash) against the loaned securities and maintains collateral in an amount not less than 100% of the market value of the loaned securities during the period of the loan. The market value of the loaned securities is determined at the close of business of the Fund and any additional required collateral is delivered to the Fund on the next business day. If the borrower defaults on its obligation to return the securities loaned because of insolvency or other reasons, the Fund may apply collateral received from the borrower against the obligation. The Fund may experience delays and costs in recovering the securities loaned. Any cash collateral received is the Fidelity Securities Lending Cash Central Fund. The value of loaned securities and cash collateral at period end are disclosed on the Fund's Statement of Assets and Liabilities. Security lending income represents the income earned on investing cash collateral, less rebates paid to borrowers and any lending agent fees associated with the loan, plus any premium payments received for lending certain types of securities. Security lending income is presented in the Statement of Operations as a component of income from Fidelity Central Funds. Total security lending income during the period amounted to $13,364. During the period, there were no securities loaned to FCM.
8. Expense Reductions.
Commissions paid to certain brokers with whom the investment adviser, or its affiliates, places trades on behalf of the Fund include an amount in addition to trade execution, which may be rebated back to the Fund to offset certain expenses. This amount totaled $232 for the period.
In addition, the investment adviser reimbursed a portion of the Fund's operating expenses during the period in the amount of $475.
9. Other.
The Fund's organizational documents provide former and current trustees and officers with a limited indemnification against liabilities arising in connection with the performance of their duties to the Fund. In the normal course of business, the Fund may also enter into contracts that provide general indemnifications. The Fund's maximum exposure under these arrangements is unknown as this would be dependent on future claims that may be made against the Fund. The risk of material loss from such claims is considered remote.
Annual Report
To the Trustees of Fidelity Investment Trust and Shareholders of Fidelity Global Equity Income Fund:
We have audited the accompanying statement of assets and liabilities of Fidelity Global Equity Income Fund (the Fund), a fund of Fidelity Investment Trust, including the schedule of investments, as of October 31, 2014, and the related statement of operations for the year then ended, the statement of changes in net assets for each of the two years in the period then ended, and the financial highlights for each of the two years in the period then ended and for the period from May 2, 2012 (commencement of operations) to October 31, 2012. These financial statements and financial highlights are the responsibility of the Fund's management. Our responsibility is to express an opinion on these financial statements and financial highlights based on our audits.
We conducted our audits in accordance with the standards of the Public Company Accounting Oversight Board (United States). Those standards require that we plan and perform the audit to obtain reasonable assurance about whether the financial statements and financial highlights are free of material misstatement. The Fund is not required to have, nor were we engaged to perform, an audit of its internal control over financial reporting. Our audits included consideration of internal control over financial reporting as a basis for designing audit procedures that are appropriate in the circumstances, but not for the purpose of expressing an opinion on the effectiveness of the Fund's internal control over financial reporting. Accordingly, we express no such opinion. An audit also includes examining, on a test basis, evidence supporting the amounts and disclosures in the financial statements, assessing the accounting principles used and significant estimates made by management, as well as evaluating the overall financial statement presentation. Our procedures included confirmation of securities owned as of October 31, 2014, by correspondence with the custodians and brokers; where replies were not received from brokers, we performed other auditing procedures. We believe that our audits provide a reasonable basis for our opinion.
In our opinion, the financial statements and financial highlights referred to above present fairly, in all material respects, the financial position of Fidelity Global Equity Income Fund as of October 31, 2014, the results of its operations for the year then ended, the changes in its net assets for each of the two years in the period then ended, and the financial highlights for each of the two years in the period then ended and for the period from May 2, 2012 (commencement of operations) to October 31, 2012, in conformity with accounting principles generally accepted in the United States of America.
DELOITTE & TOUCHE LLP
Boston, Massachusetts
December 19, 2014
Annual Report
The Trustees, Member of the Advisory Board, and officers of the trust and fund, as applicable, are listed below. The Board of Trustees governs the fund and is responsible for protecting the interests of shareholders. The Trustees are experienced executives who meet periodically throughout the year to oversee the fund's activities, review contractual arrangements with companies that provide services to the fund, oversee management of the risks associated with such activities and contractual arrangements, and review the fund's performance. Except for James C. Curvey, each of the Trustees oversees 174 funds. Mr. Curvey oversees 407 funds.
The Trustees hold office without limit in time except that (a) any Trustee may resign; (b) any Trustee may be removed by written instrument, signed by at least two-thirds of the number of Trustees prior to such removal; (c) any Trustee who requests to be retired or who has become incapacitated by illness or injury may be retired by written instrument signed by a majority of the other Trustees; and (d) any Trustee may be removed at any special meeting of shareholders by a two-thirds vote of the outstanding voting securities of the trust. Each Trustee who is not an interested person (as defined in the 1940 Act) of the trust and the fund (Independent Trustee), shall retire not later than the last day of the calendar year in which his or her 75th birthday occurs. The Independent Trustees may waive this mandatory retirement age policy with respect to individual Trustees. The officers and Advisory Board Member hold office without limit in time, except that any officer and Advisory Board Member may resign or may be removed by a vote of a majority of the Trustees at any regular meeting or any special meeting of the Trustees. Except as indicated, each individual has held the office shown or other offices in the same company for the past five years.
Experience, Skills, Attributes, and Qualifications of the Fund's Trustees. The Governance and Nominating Committee has adopted a statement of policy that describes the experience, qualifications, attributes, and skills that are necessary and desirable for potential Independent Trustee candidates (Statement of Policy). The Board believes that each Trustee satisfied at the time he or she was initially elected or appointed a Trustee, and continues to satisfy, the standards contemplated by the Statement of Policy. The Governance and Nominating Committee also engages professional search firms to help identify potential Independent Trustee candidates who have the experience, qualifications, attributes, and skills consistent with the Statement of Policy. From time to time, additional criteria based on the composition and skills of the current Independent Trustees, as well as experience or skills that may be appropriate in light of future changes to board composition, business conditions, and regulatory or other developments, have also been considered by the professional search firms and the Governance and Nominating Committee. In addition, the Board takes into account the Trustees' commitment and participation in Board and committee meetings, as well as their leadership of standing and ad hoc committees throughout their tenure.
In determining that a particular Trustee was and continues to be qualified to serve as a Trustee, the Board has considered a variety of criteria, none of which, in isolation, was controlling. The Board believes that, collectively, the Trustees have balanced and diverse experience, qualifications, attributes, and skills, which allow the Board to operate effectively in governing the fund and protecting the interests of shareholders. Information about the specific experience, skills, attributes, and qualifications of each Trustee, which in each case led to the Board's conclusion that the Trustee should serve (or continue to serve) as a trustee of the fund, is provided below.
Annual Report
Board Structure and Oversight Function. James C. Curvey is an interested person (as defined in the 1940 Act) and currently serves as Chairman. The Trustees have determined that an interested Chairman is appropriate and benefits shareholders because an interested Chairman has a personal and professional stake in the quality and continuity of services provided to the fund. Independent Trustees exercise their informed business judgment to appoint an individual of their choosing to serve as Chairman, regardless of whether the Trustee happens to be independent or a member of management. The Independent Trustees have determined that they can act independently and effectively without having an Independent Trustee serve as Chairman and that a key structural component for assuring that they are in a position to do so is for the Independent Trustees to constitute a substantial majority for the Board. The Independent Trustees also regularly meet in executive session. Ned C. Lautenbach serves as Chairman of the Independent Trustees and as such (i) acts as a liaison between the Independent Trustees and management with respect to matters important to the Independent Trustees and (ii) with management prepares agendas for Board meetings.
Fidelity funds are overseen by different Boards of Trustees. The fund's Board oversees Fidelity's equity and high income funds and another Board oversees Fidelity's investment-grade bond, money market, and asset allocation funds. The asset allocation funds may invest in Fidelity funds overseen by the fund's Board. The use of separate Boards, each with its own committee structure, allows the Trustees of each group of Fidelity funds to focus on the unique issues of the funds they oversee, including common research, investment, and operational issues. On occasion, the separate Boards establish joint committees to address issues of overlapping consequences for the Fidelity funds overseen by each Board.
The Trustees operate using a system of committees to facilitate the timely and efficient consideration of all matters of importance to the Trustees, the fund, and fund shareholders and to facilitate compliance with legal and regulatory requirements and oversight of the fund's activities and associated risks. The Board, acting through its committees, has charged FMR and its affiliates with (i) identifying events or circumstances the occurrence of which could have demonstrably adverse effects on the fund's business and/or reputation; (ii) implementing processes and controls to lessen the possibility that such events or circumstances occur or to mitigate the effects of such events or circumstances if they do occur; and (iii) creating and maintaining a system designed to evaluate continuously business and market conditions in order to facilitate the identification and implementation processes described in (i) and (ii) above. Because the day-to-day operations and activities of the fund are carried out by or through FMR, its affiliates and other service providers, the fund's exposure to risks is mitigated but not eliminated by the processes overseen by the Trustees. While each of the Board's committees has responsibility for overseeing different aspects of the fund's activities, oversight is exercised primarily through the Operations, Audit, and Compliance Committees. In addition, the Independent Trustees have worked with FMR to enhance the Board's oversight of investment and financial risks, legal and regulatory risks, technology risks, and operational risks, including the development of additional risk reporting to the Board. For example, a working group comprised of Independent Trustees and FMR has worked and continues to work to review the Fidelity funds' valuation-related activities, reporting and risk management. Appropriate personnel, including but not limited to the fund's Chief Compliance Officer (CCO), FMR's internal auditor, the independent accountants, the fund's Treasurer and portfolio management personnel, make periodic reports to the Board's committees, as appropriate, including an annual review of FMR's risk management program for the Fidelity funds. The responsibilities of each standing committee, including their oversight responsibilities, are described further under "Standing Committees of the Fund's Trustees."
Annual Report
Trustees and Officers - continued
The fund's Statement of Additional Information (SAI) includes more information about the Trustees. To request a free copy, call Fidelity at 1-800-544-8544.
Interested Trustees*:
Correspondence intended for each Trustee who is an interested person may be sent to Fidelity Investments, 245 Summer Street, Boston, Massachusetts 02210.
Name, Year of Birth; Principal Occupations and Other Relevant Experience+ |
James C. Curvey (1935) |
Year of Election or Appointment: 2007 Trustee Chairman of the Board of Trustees |
| Mr. Curvey also serves as Trustee of other Fidelity funds. Mr. Curvey is a Director of Fidelity Research & Analysis Co. (2009-present), and Vice Chairman (2007-present) and Director of FMR LLC. In addition, Mr. Curvey serves as an Overseer for the Boston Symphony Orchestra and a member of the board of Artis-Naples, Naples, Florida, and as a Trustee for Brewster Academy, Wolfeboro, New Hampshire. Previously, Mr. Curvey served as a Director of Fidelity Investments Money Management, Inc. (2009-2014), a Director of FMR (2007-2014), and a Director of FMR Co., Inc. (2007-2014). |
Charles S. Morrison (1960) |
Year of Election or Appointment: 2014 Trustee |
| Mr. Morrison also serves as Trustee of other funds. He serves as a Director of Fidelity Investments Money Management, Inc. (FIMM) (2014-present), Director of Fidelity SelectCo, LLC (2014-present), President, Asset Management (2014-present), and is an employee of Fidelity Investments. Previously, Mr. Morrison served as Vice President of Fidelity's Fixed Income and Asset Allocation Funds (2012-2014), President, Fixed Income (2011-2014), Vice President of Fidelity's Money Market Funds (2005-2009), President, Money Market Group Leader of FMR (2009), and Senior Vice President, Money Market Group of FMR (2004-2009). Mr. Morrison also served as Vice President of Fidelity's Bond Funds (2002-2005), certain Balanced Funds (2002-2005), and certain Asset Allocation Funds (2002-2007), and as Senior Vice President (2002-2005) of Fidelity's Bond Division. |
* Trustees have been determined to be "Interested Trustees" by virtue of, among other things, their affiliation with the trust or various entities under common control with FMR.
+ The information above includes each Trustee's principal occupation during the last five years and other information relating to the experience, attributes, and skills relevant to each Trustee's qualifications to serve as a Trustee, which led to the conclusion that each Trustee should serve as a Trustee for the fund.
Annual Report
Trustees and Officers - continued
Independent Trustees:
Correspondence intended for each Independent Trustee (that is, the Trustees other than the Interested Trustees) may be sent to Fidelity Investments, P.O. Box 55235, Boston, Massachusetts 02205-5235.
Name, Year of Birth; Principal Occupations and Other Relevant Experience+ |
Dennis J. Dirks (1948) |
Year of Election or Appointment: 2005 Trustee |
| Mr. Dirks also serves as Trustee of other Fidelity funds. Prior to his retirement in May 2003, Mr. Dirks was Chief Operating Officer and a member of the Board of The Depository Trust & Clearing Corporation (DTCC). He also served as President, Chief Operating Officer, and Board member of The Depository Trust Company (DTC) and President and Board member of the National Securities Clearing Corporation (NSCC). In addition, Mr. Dirks served as Chief Executive Officer and Board member of the Government Securities Clearing Corporation, Chief Executive Officer and Board member of the Mortgage-Backed Securities Clearing Corporation, as a Trustee and a member of the Finance Committee of Manhattan College (2005-2008), and as a Trustee and a member of the Finance Committee of AHRC of Nassau County (2006-2008). Mr. Dirks is a member of the Independent Directors Council (IDC) Governing Council (2010-present) and Board of Directors for The Brookville Center for Children's Services, Inc. (2009-present). |
Alan J. Lacy (1953) |
Year of Election or Appointment: 2008 Trustee |
| Mr. Lacy also serves as Trustee of other Fidelity funds. Mr. Lacy serves as Senior Adviser (2007-present) of Oak Hill Capital Partners, L.P. (private equity). Mr. Lacy also served as Chief Executive Officer (2000-2005) and Vice Chairman (2005-2006) of Sears Holdings Corporation and Sears, Roebuck and Co. (retail). In addition, Mr. Lacy serves as a member of the Board of Directors of Dave & Buster's Entertainment, Inc. (restaurant and entertainment complexes, 2010-present), Earth Fare, Inc. (retail grocery, 2012-present), The Hillman Companies, Inc. (hardware wholesalers, 2010-present), and Bristol-Myers Squibb Company (global pharmaceuticals, 2008-present). Mr. Lacy is a member of the Board of Trustees of The National Parks Conservation Association (2006-present). Previously, Mr. Lacy served as Chairman of the Board of Trustees of the National Parks Conservation Association (2008-2011) and as a member of the Board of Directors for the Western Union Company (global money transfer, 2006-2011). |
Ned C. Lautenbach (1944) |
Year of Election or Appointment: 2000 Trustee Chairman of the Independent Trustees |
| Mr. Lautenbach also serves as Trustee of other Fidelity funds. Mr. Lautenbach currently serves as the Lead Director of the Eaton Corporation Board of Directors (diversified industrial, 1997-present). Mr. Lautenbach is Chairman of the Board of Directors of the Philharmonic Center for the Arts in Naples, Florida (2012-present) and a member of the Council on Foreign Relations (1994-present). Previously, Mr. Lautenbach was a Partner/Advisory Partner at Clayton, Dubilier & Rice, LLC (private equity investment, 1998-2010), as well as a Director of Sony Corporation (2006-2007). |
Joseph Mauriello (1944) |
Year of Election or Appointment: 2008 Trustee |
| Mr. Mauriello also serves as Trustee of other Fidelity funds. Prior to his retirement in January 2006, Mr. Mauriello served in numerous senior management positions including Deputy Chairman and Chief Operating Officer (2004-2005), and Vice Chairman of Financial Services (2002-2004) of KPMG LLP US (professional services, 1965-2005). Mr. Mauriello currently serves as a member of the Board of Directors of XL Group plc. (global insurance and re-insurance, 2006-present). Previously, Mr. Mauriello served as a Director of the Hamilton Funds of the Bank of New York (2006-2007) and of Arcadia Resources Inc. (health care services and products, 2007-2012). |
Robert W. Selander (1950) |
Year of Election or Appointment: 2011 Trustee |
| Mr. Selander also serves as Trustee of other Fidelity funds. Previously, Mr. Selander served as a Member of the Advisory Board of other Fidelity funds (2011), and Executive Vice Chairman (2010), Chief Executive Officer (2009-2010), and President and Chief Executive Officer (1997-2009) of Mastercard, Inc. |
Cornelia M. Small (1944) |
Year of Election or Appointment: 2005 Trustee |
| Ms. Small also serves as Trustee of other Fidelity funds. Ms. Small is a member of the Board of Directors (2009-present) and Chair of the Investment Committee (2010-present) of the Teagle Foundation. Ms. Small also serves on the Investment Committee of the Berkshire Taconic Community Foundation (2008-present). Previously, Ms. Small served as Chairperson (2002-2008) and a member of the Investment Committee and Chairperson (2008-2012) and a member of the Board of Trustees of Smith College. In addition, Ms. Small served as Chief Investment Officer, Director of Global Equity Investments, and a member of the Board of Directors of Scudder, Stevens & Clark and Scudder Kemper Investments. |
William S. Stavropoulos (1939) |
Year of Election or Appointment: 2001 Trustee Vice Chairman of the Independent Trustees |
| Mr. Stavropoulos also serves as Trustee of other Fidelity funds. Mr. Stavropoulos serves as President and Founder of the Michigan Baseball Foundation, the Great Lakes Loons (2007-present). Mr. Stavropoulos is Chairman Emeritus of the Board of Directors of The Dow Chemical Company, where he previously served in numerous senior management positions, including President, CEO (1995-2000; 2002-2004), Chairman of the Executive Committee (2000-2006), and as a member of the Board of Directors (1990-2006). Currently, Mr. Stavropoulos is Chairman of the Board of Directors of Univar Inc. (global distributor of commodity and specialty chemicals), a Director of Teradata Corporation (data warehousing and technology solutions), and Maersk Inc. (industrial conglomerate), and a member of the Advisory Board for Metalmark Capital LLC (private equity investment, 2005-present). Mr. Stavropoulos is an operating advisor to Clayton, Dubilier & Rice, LLC (private equity investment). In addition, Mr. Stavropoulos is a member of the University of Notre Dame Advisory Council for the College of Science, a Trustee of the Rollin L. Gerstacker Foundation, and a Director of the Naples Philharmonic Center for the Arts. Previously, Mr. Stavropoulos served as a Director of Chemical Financial Corporation (bank holding company, 1993-2012) and Tyco International, Ltd. (multinational manufacturing and services, 2007-2012). |
David M. Thomas (1949) |
Year of Election or Appointment: 2008 Trustee |
| Mr. Thomas also serves as Trustee of other Fidelity funds. Mr. Thomas serves as Non-Executive Chairman of the Board of Directors of Fortune Brands Home and Security (home and security products, 2011-present), and as a member of the Board of Directors of Interpublic Group of Companies, Inc. (marketing communication, 2004-present). Previously, Mr. Thomas served as Executive Chairman (2005-2006) and Chairman and Chief Executive Officer (2000-2005) of IMS Health, Inc. (pharmaceutical and healthcare information solutions), and a Director of Fortune Brands, Inc. (consumer products, 2000-2011). |
+ The information above includes each Trustee's principal occupation during the last five years and other information relating to the experience, attributes, and skills relevant to each Trustee's qualifications to serve as a Trustee, which led to the conclusion that each Trustee should serve as a Trustee for the fund.
Advisory Board Member and Officers:
Correspondence intended for each officer and Peter S. Lynch may be sent to Fidelity Investments, 245 Summer Street, Boston, Massachusetts 02210. Officers appear below in alphabetical order.
Name, Year of Birth; Principal Occupation |
Peter S. Lynch (1944) |
Year of Election or Appointment: 2003 Member of the Advisory Board |
| Mr. Lynch also serves as Member of the Advisory Board of other Fidelity funds. Mr. Lynch is Vice Chairman and a Director of FMR and FMR Co., Inc. In addition, Mr. Lynch serves as a Trustee of Boston College and as the Chairman of the Inner-City Scholarship Fund. Previously, Mr. Lynch served on the Special Olympics International Board of Directors (1997-2006). |
Elizabeth Paige Baumann (1968) |
Year of Election or Appointment: 2012 Anti-Money Laundering (AML) Officer |
| Ms. Baumann also serves as AML Officer of other funds. She is Chief AML Officer of FMR LLC (2012-present) and is an employee of Fidelity Investments. Previously, Ms. Baumann served as Vice President and Deputy Anti-Money Laundering Officer (2007-2012). |
William C. Coffey (1969) |
Year of Election or Appointment: 2009 Assistant Secretary |
| Mr. Coffey also serves as Assistant Secretary of other funds. He is Senior Vice President and Deputy General Counsel of FMR LLC (2010-present), and is an employee of Fidelity Investments. Previously, Mr. Coffey served as Vice President and Associate General Counsel of FMR LLC (2005-2009). |
Timothy M. Cohen (1969) |
Year of Election or Appointment: 2014 Vice President of certain Equity Funds |
| Mr. Cohen also serves as Vice President of other funds. Mr. Cohen serves as a Director and Chief Compliance Officer of Fidelity Management & Research (U.K.) Inc. (2013-present) and is an employee of Fidelity Investments. |
Jonathan Davis (1968) |
Year of Election or Appointment: 2010 Assistant Treasurer |
| Mr. Davis also serves as Assistant Treasurer of other funds. Mr. Davis is an employee of Fidelity Investments. Previously, Mr. Davis served as Vice President and Associate General Counsel of FMR LLC (2003-2010). |
Adrien E. Deberghes (1967) |
Year of Election or Appointment: 2008 Deputy Treasurer |
| Mr. Deberghes also serves as an officer of other funds. He is an employee of Fidelity Investments (2008-present). Prior to joining Fidelity Investments, Mr. Deberghes was Senior Vice President of Mutual Fund Administration at State Street Corporation (2007-2008), Senior Director of Mutual Fund Administration at Investors Bank & Trust (2005-2007), and Director of Finance for Dunkin' Brands (2000-2005). |
Stephanie J. Dorsey (1969) |
Year of Election or Appointment: 2010 Assistant Treasurer |
| Ms. Dorsey also serves as an officer of other funds. She is an employee of Fidelity Investments (2008-present) and has served in other fund officer roles. Prior to joining Fidelity Investments, Ms. Dorsey served as Treasurer (2004-2008) of the JPMorgan Mutual Funds and Vice President (2004-2008) of JPMorgan Chase Bank. |
Howard J. Galligan III (1966) |
Year of Election or Appointment: 2014 Chief Financial Officer |
| Mr. Galligan also serves as Chief Financial Officer of other funds. Mr. Galligan serves as President of Fidelity Pricing and Cash Management Services (FPCMS) (2014-present) and as a Director of Strategic Advisers, Inc. (2008-present). Previously, Mr. Galligan served as Chief Administrative Officer of Asset Management (2011-2014) and Chief Operating Officer and Senior Vice President of Investment Support for Strategic Advisers, Inc. (2003-2011). |
Scott C. Goebel (1968) |
Year of Election or Appointment: 2008 Secretary and Chief Legal Officer (CLO) |
| Mr. Goebel serves as Secretary and CLO of other funds. Mr. Goebel also serves as Secretary of Fidelity SelectCo, LLC (2013-present), Fidelity Investments Money Management, Inc. (FIMM) (2010-present) and Fidelity Research and Analysis Company (FRAC) (2010-present); General Counsel, Secretary, and Senior Vice President of FMR (2008-present) and FMR Co., Inc. (2008-present); Chief Legal Officer of Fidelity Management & Research (Hong Kong) Limited (2008-present); and Assistant Secretary of Fidelity Management & Research (Japan) Limited (2008-present) and Fidelity Management & Research (U.K.) Inc. (2008-present). Previously, Mr. Goebel served as Secretary and CLO of other Fidelity funds (2008-2013), Assistant Secretary of FIMM (2008-2010), FRAC (2008-2010), and certain funds (2007-2008); and as Vice President and Secretary of Fidelity Distributors Corporation (FDC) (2005-2007). Mr. Goebel has been employed by FMR LLC or an affiliate since 2001. |
Brian B. Hogan (1964) |
Year of Election or Appointment: 2009 Vice President |
| Mr. Hogan also serves as Trustee or Vice President of other funds. Mr. Hogan serves as a Director of Fidelity SelectCo, LLC (2014-present) and President of FMR's Equity Division (2009-present). Previously, Mr. Hogan served as Senior Vice President, Equity Research of FMR (2006-2009) and as a portfolio manager. |
Chris Maher (1972) |
Year of Election or Appointment: 2013 Assistant Treasurer |
| Mr. Maher serves as Assistant Treasurer of other funds. Mr. Maher is Vice President of Valuation Oversight and is an employee of Fidelity Investments. Previously, Mr. Maher served as Vice President of Asset Management Compliance (2013), Vice President of FMR's Program Management Group (2010-2013), and Vice President of Valuation Oversight (2008-2010). |
Kenneth B. Robins (1969) |
Year of Election or Appointment: 2008 President and Treasurer |
| Mr. Robins also serves as an officer of other funds. Mr. Robins serves as Executive Vice President of Fidelity Investments Money Management, Inc. (FIMM) (2013-present) and is an employee of Fidelity Investments (2004-present). Previously, Mr. Robins served in other fund officer roles. |
Stephen Sadoski (1971) |
Year of Election or Appointment: 2012 Deputy Treasurer |
| Mr. Sadoski also serves as Deputy Treasurer of other funds. He is an employee of Fidelity Investments (2012-present) and has served in another fund officer role. Prior to joining Fidelity Investments, Mr. Sadoski served as an assistant chief accountant in the Division of Investment Management of the Securities and Exchange Commission (SEC) (2009-2012) and as a senior manager at Deloitte & Touche LLP (1997-2009). |
Stacie M. Smith (1974) |
Year of Election or Appointment: 2013 Deputy Treasurer |
| Ms. Smith also serves as an officer of other funds. She is an employee of Fidelity Investments (2009-present) and has served in other fund officer roles. Prior to joining Fidelity Investments, Ms. Smith served as Senior Audit Manager of Ernst & Young LLP (1996-2009). |
Renee Stagnone (1975) |
Year of Election or Appointment: 2013 Deputy Treasurer |
| Ms. Stagnone also serves as Deputy Treasurer of other funds. Ms. Stagnone is an employee of Fidelity Investments. |
Linda J. Wondrack (1964) |
Year of Election or Appointment: 2014 Chief Compliance Officer |
| Ms. Wondrack also serves as Chief Compliance Officer of other funds. Ms. Wondrack is Executive Vice President and head of the Ethics Office and Asset Management Compliance for Fidelity Investments (2012-present). Ms. Wondrack also serves as Chief Compliance Officer of Fidelity SelectCo, LLC (2014-present); Chief Compliance Officer of Impresa Management LLC (2013-present); and Chief Compliance Officer of FMR Co., Inc., Fidelity Investments Money Management, Inc., Fidelity Management & Research (Japan) Limited, Fidelity Management & Research (U.K.) Inc., Fidelity Management & Research (Hong Kong), Fidelity Management & Research Company, Pyramis Global Advisors, LLC, and Strategic Advisers, Inc., Ballyrock Investment Advisors LLC, and Northern Neck Investors LLC (2012-present). Previously, Ms. Wondrack served as Senior Vice President and Chief Compliance Officer for Columbia Management Investment Advisers, LLC (2005-2012); Chief Compliance Officer for certain funds within the Columbia Family of Funds (2007-2012); and Senior Vice President of Compliance Risk Management at Bank of America (2005-2010). |
Joseph F. Zambello (1957) |
Year of Election or Appointment: 2011 Deputy Treasurer |
| Mr. Zambello also serves as Deputy Treasurer of other funds. Mr. Zambello is an employee of Fidelity Investments. Previously, Mr. Zambello served as Vice President of FMR's Program Management Group (2009-2011) and Vice President of the Transfer Agent Oversight Group (2005-2009). |
Annual Report
The Board of Trustees of Fidelity Global Equity Income Fund voted to pay on December 08, 2014, to shareholders of record at the opening of business on December 05, 2014, a distribution of $0.035 per share derived from capital gains realized from sales of portfolio securities and a dividend of $0.954 per share from net investment income.
The fund hereby designates as a capital gain dividend with respect to the taxable year ended October 31, 2014, $3,689,619, or, if subsequently determined to be different, the net capital gain of such year.
A total of 0.05% of the dividends distributed during the fiscal year was derived from interest on U.S. Government securities which is generally exempt from state income tax.
A percentage of the dividends distributed during the fiscal year for the fund qualifies for the dividends-received deduction for corporate shareholders:
Ex Date | Percentage |
12/06/2013 | 11% |
04/04/2014 | 42% |
07/03/2014 | 42% |
10/03/2014 | 42% |
A percentage of the dividends distributed during the fiscal year for the fund may be taken into account as a dividend for purposes of the maximum rate under section 1(h)(11) of the Internal Revenue Code.
Ex Date | Percentage |
12/06/2013 | 50% |
04/04/2014 | 100% |
07/03/2014 | 100% |
10/03/2014 | 100% |
The amounts per share which represent income derived from sources within, and taxes paid to, foreign countries or possessions of the United States are as follows:
Pay Date | Income | Taxes |
12/09/2013 | 0.0452 | 0.0056 |
04/07/2014 | 0.0473 | 0.0067 |
07/06/2014 | 0.0204 | 0.0029 |
10/06/2014 | 0.0100 | 0.0014 |
The fund will notify shareholders in January 2015 of amounts for use in preparing 2014 income tax returns.
Annual Report
Board Approval of Investment Advisory Contracts and Management Fees
Fidelity Global Equity Income Fund
Each year, the Board of Trustees, including the Independent Trustees (together, the Board), votes on the renewal of the management contract with Fidelity Management & Research Company (FMR) and the sub-advisory agreements (together, the Advisory Contracts) for the fund. The Board, assisted by the advice of fund counsel and Independent Trustees' counsel, requests and considers a broad range of information relevant to the renewal of the Advisory Contracts throughout the year.
The Board meets regularly and, at each of its meetings, covers an extensive agenda of topics and materials and considers factors that are relevant to its annual consideration of the renewal of the fund's Advisory Contracts, including the services and support provided to the fund and its shareholders. The Board has established various standing committees (Committees), each composed of and chaired by Independent Trustees with varying backgrounds, to which the Board has assigned specific subject matter responsibilities in order to enhance effective decision-making by the Board. The Board, acting directly and through its Committees, requests and receives information concerning the annual consideration of the renewal of the fund's Advisory Contracts. The Board also meets as needed to consider matters specifically related to the Board's annual consideration of the renewal of the Advisory Contracts. Members of the Board may also meet with trustees of other Fidelity funds through ad hoc joint committees to discuss certain matters relevant to the Fidelity funds.
At its July 2014 meeting, the Board, including the Independent Trustees, unanimously determined to renew the fund's Advisory Contracts. In reaching its determination, the Board considered all factors it believed relevant, including (i) the nature, extent, and quality of the services to be provided to the fund and its shareholders (including the investment performance of the fund); (ii) the competitiveness of the fund's management fee and total expense ratio relative to peer funds; (iii) the total costs of the services to be provided by and the profits to be realized by Fidelity from its relationship with the fund; (iv) the extent to which economies of scale exist and would be realized as the fund grows; and (v) whether fee levels reflect these economies of scale, if any, for the benefit of fund shareholders. In connection with separate internal corporate reorganizations involving Fidelity Management & Research (U.K.) Inc. (FMR U.K.) and Fidelity Management & Research (Japan) Inc. (FMR Japan), the Board approved certain non-material amendments to the fund's sub-advisory agreements with FMR U.K. and FMR Japan to reflect that, after these reorganizations, FMR Investment Management (UK) Limited and Fidelity Management & Research (Japan) Limited will carry on the business of FMR U.K. and FMR Japan, respectively. The Board noted that no changes to the portfolio managers or to the foreign research or investment advisory services provided to the fund were expected in connection with either reorganization and that the same personnel and resources would continue to be available to the fund at the new entities.
Annual Report
Board Approval of Investment Advisory Contracts and
Management Fees - continued
In considering whether to renew the Advisory Contracts for the fund, the Board reached a determination, with the assistance of fund counsel and Independent Trustees' counsel and through the exercise of its business judgment, that the renewal of the Advisory Contracts was in the best interests of the fund and its shareholders and that the compensation payable under the Advisory Contracts was fair and reasonable. The Board's decision to renew the Advisory Contracts was not based on any single factor, but rather was based on a comprehensive consideration of all the information provided to the Board at its meetings throughout the year. The Board, in reaching its determination to renew the Advisory Contracts, was aware that shareholders of the fund have a broad range of investment choices available to them, including a wide choice among funds offered by Fidelity's competitors, and that the fund's shareholders, who have the opportunity to review and weigh the disclosure provided by the fund in its prospectus and other public disclosures, have chosen to invest in this fund, which is part of the Fidelity family of funds.
Nature, Extent, and Quality of Services Provided. The Board considered Fidelity's staffing as it relates to the fund, including the backgrounds of investment personnel of FMR and the sub-advisers (together, the Investment Advisers), and also considered the fund's investment objective, strategies, and related investment philosophy. The Independent Trustees also had discussions with senior management of Fidelity's investment operations and investment groups. The Board considered the structure of the portfolio manager compensation program and whether this structure provides appropriate incentives to act in the best interests of the fund. Additionally, the Board considered the portfolio managers' investments, if any, in the funds that they manage.
Resources Dedicated to Investment Management and Support Services. The Board and the Fund Oversight and Research Committees reviewed the general qualifications and capabilities of Fidelity's investment staff, including its size, education, experience,and resources, as well as Fidelity's approach to recruiting, training, managing, and compensating investment personnel. The Board noted that Fidelity has continued to increase the resources devoted to non-U.S. offices, including expansion of Fidelity's global investment organization. The Board also noted that Fidelity's analysts have extensive resources, tools and capabilities that allow them to conduct sophisticated quantitative and fundamental analysis, as well as credit analysis of issuers, counterparties and guarantors. Further, the Board believes that Fidelity's investment professionals have sufficient access to global information and data so as to provide competitive investment results over time, and that those professionals also have access to sophisticated tools that permit them to assess portfolio construction and risk and performance attribution characteristics continuously, as well as to transmit new information and research conclusions rapidly around the world. Additionally, in its deliberations, the Board considered Fidelity's trading and risk management capabilities and resources and global compliance infrastructure, which are an integral part of the investment management process.
Annual Report
Shareholder and Administrative Services. The Board considered (i) the nature, extent, quality, and cost of advisory, administrative, and shareholder services performed by the Investment Advisers and their affiliates under the Advisory Contracts and under separate agreements covering transfer agency, pricing and bookkeeping, and securities lending services for the fund; (ii) the nature and extent of the supervision of third party service providers, principally custodians and subcustodians; and (iii) the resources devoted to, and the record of compliance with, the fund's compliance policies and procedures. The Board also reviewed the allocation of fund brokerage, including allocations to brokers affiliated with the Investment Advisers, the use of brokerage commissions to pay fund expenses, and the use of "soft" commission dollars to pay for research services.
The Board noted that the growth of fund assets over time across the complex allows Fidelity to reinvest in the development of services designed to enhance the value or convenience of the Fidelity funds as investment vehicles. These services include 24-hour access to account information and market information through telephone representatives and over the Internet, investor education materials and asset allocation tools, and the expanded availability of Fidelity Investor Centers.
In 2014, the Board formed an ad hoc Committee on Transfer Agency Fees to review the variety of transfer agency fee structures throughout the industry and Fidelity's competitive positioning with respect to industry participants.
Investment in a Large Fund Family. The Board considered the benefits to shareholders of investing in a Fidelity fund, including the benefits of investing in a fund that is part of a large family of funds offering a variety of investment disciplines and providing a large variety of mutual fund investor services. The Board noted that Fidelity had taken, or had made recommendations that resulted in the Fidelity funds taking, a number of actions over the previous year that benefited particular funds, including (i) continuing to dedicate additional resources to investment research and to the support of the senior management team that oversees asset management; (ii) persisting in efforts to enhance Fidelity's global research capabilities; (iii) launching new funds and making other enhancements to meet client needs for income-oriented solutions; (iv) reducing fund expenses for certain index funds; (v) continuing to launch dedicated lower cost underlying funds to meet portfolio construction needs related to expanding underlying fund options for Fidelity funds of funds, specifically for the Freedom Fund product lines; (vi) rationalizing product lines and gaining increased efficiencies through fund mergers; (vii) launching sector-based exchange-traded funds and establishing a new Fidelity adviser to manage sector-based funds and products; (viii) continuing to develop and implement technology to improve security and increase efficiency; (ix) modifying the eligibility criteria for certain share classes to increase their marketability to a portion of the defined contribution plan market; (x) waiving redemption fees for certain qualified fund-of-fund and wrap programs and certain retirement plan transactions; and (xi) launching new Institutional Class shares of certain money market funds to attract and retain assets and to fill a gap in the money market fund lineup.
Annual Report
Board Approval of Investment Advisory Contracts and
Management Fees - continued
Investment Performance. The Board considered whether the fund has operated in accordance with its investment objective, as well as its record of compliance with its investment restrictions and its performance history.
The Board took into account discussions with the Investment Advisers about fund investment performance that occur at Board meetings throughout the year. In this regard the Board noted that as part of regularly scheduled fund reviews and other reports to the Board on fund performance, the Board periodically considers annualized return information for the fund, for different time periods, measured against a securities market index ("benchmark index") and a peer group of funds with similar objectives ("peer group"). In its evaluation of fund investment performance, the Board gave particular attention to information indicating changes in performance of certain Fidelity funds for specific time periods and the Investment Advisers' explanations for any overperformance or underperformance.
In addition to reviewing absolute and relative fund performance, the Independent Trustees periodically consider the appropriateness of fund performance metrics in evaluating the results achieved. In general, the Independent Trustees believe that fund performance should be evaluated based on net performance (after fees and expenses) of both the highest performing and lowest performing classes, where applicable, compared to appropriate benchmark indices, over appropriate time periods which may include full market cycles, and compared to peer groups, as applicable, over the same periods, taking into account relevant factors including the following: general market conditions; issuer-specific information; tactical opportunities for investment; and fund cash flows and other factors.
The Independent Trustees recognize that shareholders evaluate performance on a net basis over their own holding periods, for which one-, three-, and five-year periods are often used as a proxy. For this reason, the performance information reviewed by the Board also included net cumulative calendar year total return information for the fund and an appropriate benchmark index and peer group for the most recent one-year period, as shown below. Returns are shown compared to the 25th percentile (top of box, 75% beaten) and 75th percentile (bottom of box, 25% beaten) of the peer universe. Returns of the benchmark index are "net MA," i.e., adjusted for tax withholding rates applicable to U.S.-based funds organized as Massachusetts business trusts.
Annual Report
Fidelity Global Equity Income Fund
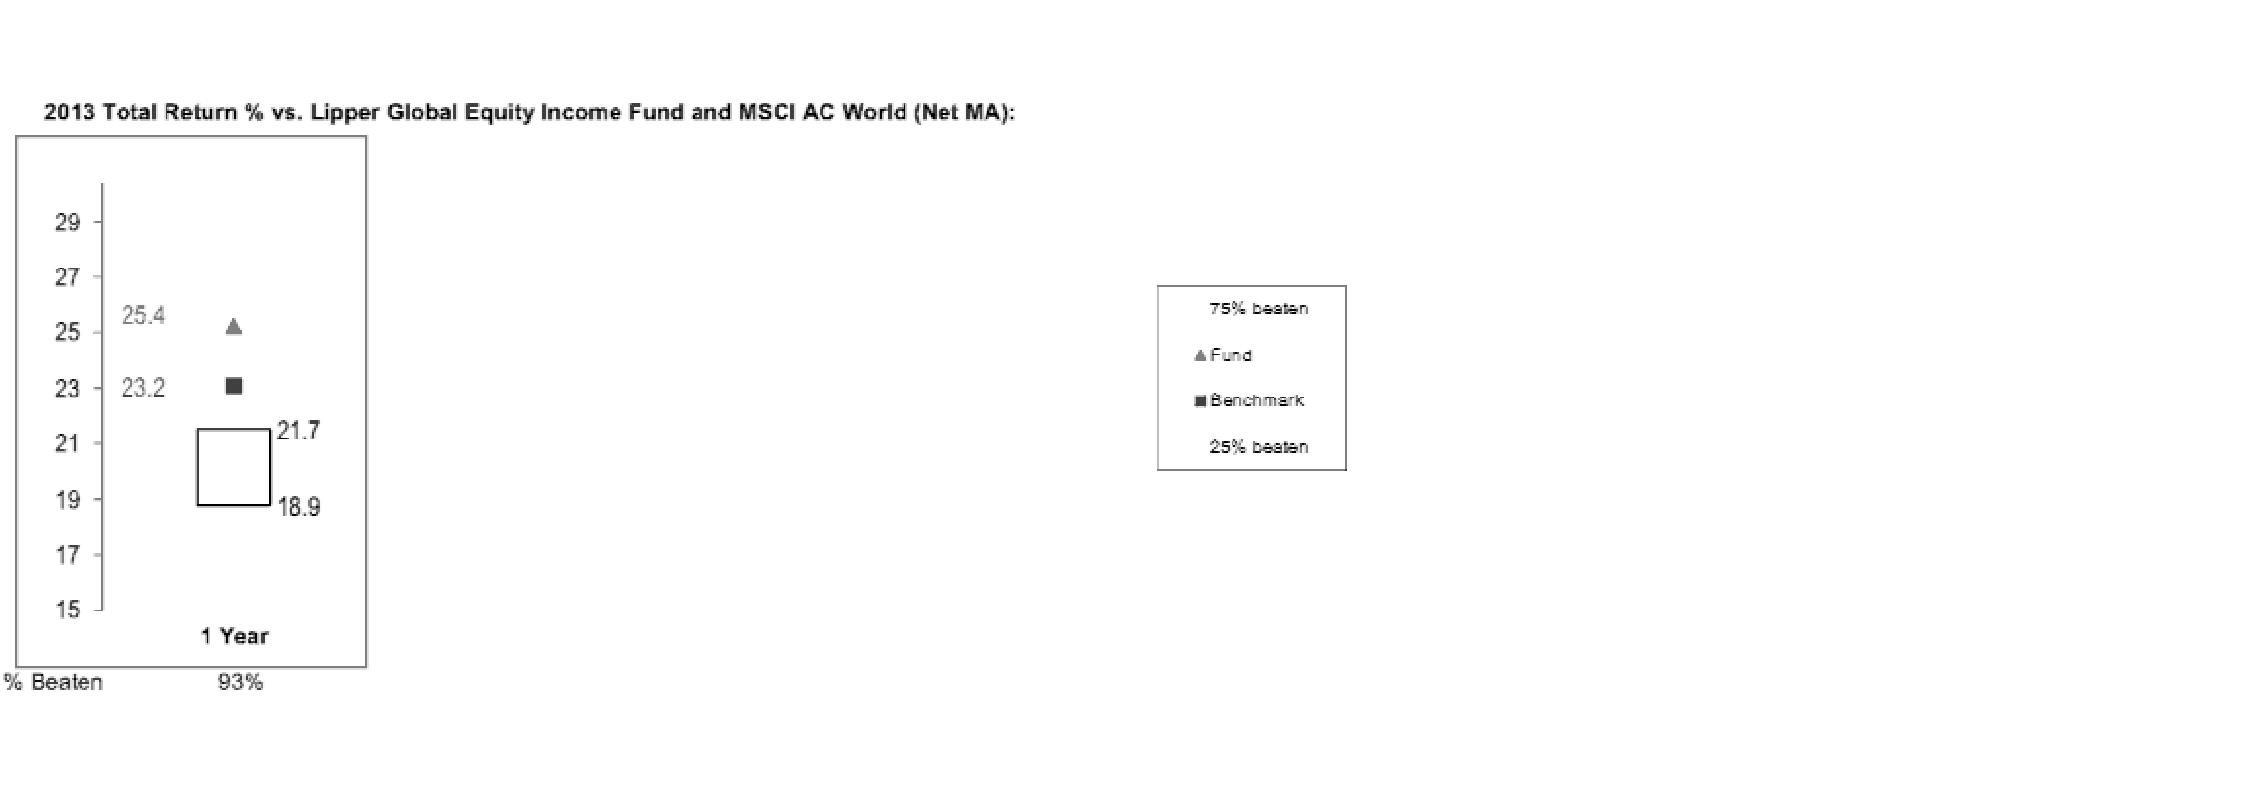
Based on its review, the Board concluded that the nature, extent, and quality of services provided to the fund under the Advisory Contracts should benefit the fund's shareholders.
Competitiveness of Management Fee and Total Expense Ratio. The Board considered the fund's management fee and total expense ratio compared to "mapped groups" of competitive funds and classes. Fidelity creates "mapped groups" by combining similar Lipper investment objective categories that have comparable investment mandates. Combining Lipper investment objective categories aids the Board's management fee and total expense ratio comparisons by broadening the competitive group used for comparison and by reducing the number of universes to which various Fidelity funds are compared.
Management Fee. The Board considered two proprietary management fee comparisons for the 12-month (or shorter) periods shown in the chart below. The group of Lipper funds used by the Board for management fee comparisons is referred to below as the "Total Mapped Group." The Total Mapped Group is broader than the Lipper peer group used by the Board for performance comparisons because the Total Mapped Group combines several Lipper investment objective categories while the Lipper peer group does not. The Total Mapped Group comparison focuses on a fund's standing in terms of gross management fees before expense reimbursements or caps relative to the total universe of funds with comparable investment mandates, regardless of whether their management fee structures also are comparable. Funds with comparable investment mandates offer exposure to similar types of securities. Funds with comparable management fee structures have similar management fee contractual arrangements (e.g., flat rate charged for advisory services, all-inclusive fee rate, etc.). "TMG %" represents the percentage of funds in the Total Mapped Group that had management fees that were lower than the fund's. For example, a hypothetical TMG % of 20% would mean that 80% of the funds in the Total Mapped Group had higher, and 20% had lower, management fees than the fund. The fund's actual TMG %s are in the chart below. The "Asset-Size Peer Group" (ASPG) comparison focuses on a fund's standing relative to a subset of non-Fidelity funds within the Total Mapped Group that are similar in size and management fee structure. For example, if a fund is in the first quartile of the ASPG, the fund's management fee ranks in the least expensive or lowest 25% of funds in the ASPG. The ASPG represents at least 15% of the funds in the Total Mapped Group with comparable asset size and management fee structures, subject to a minimum of 50 funds (or all funds in the Total Mapped Group if fewer than 50).Additional information, such as the ASPG quartile in which the fund's management fee rate ranked, is also included in the chart and considered by the Board.
Annual Report
Board Approval of Investment Advisory Contracts and
Management Fees - continued
Fidelity Global Equity Income Fund
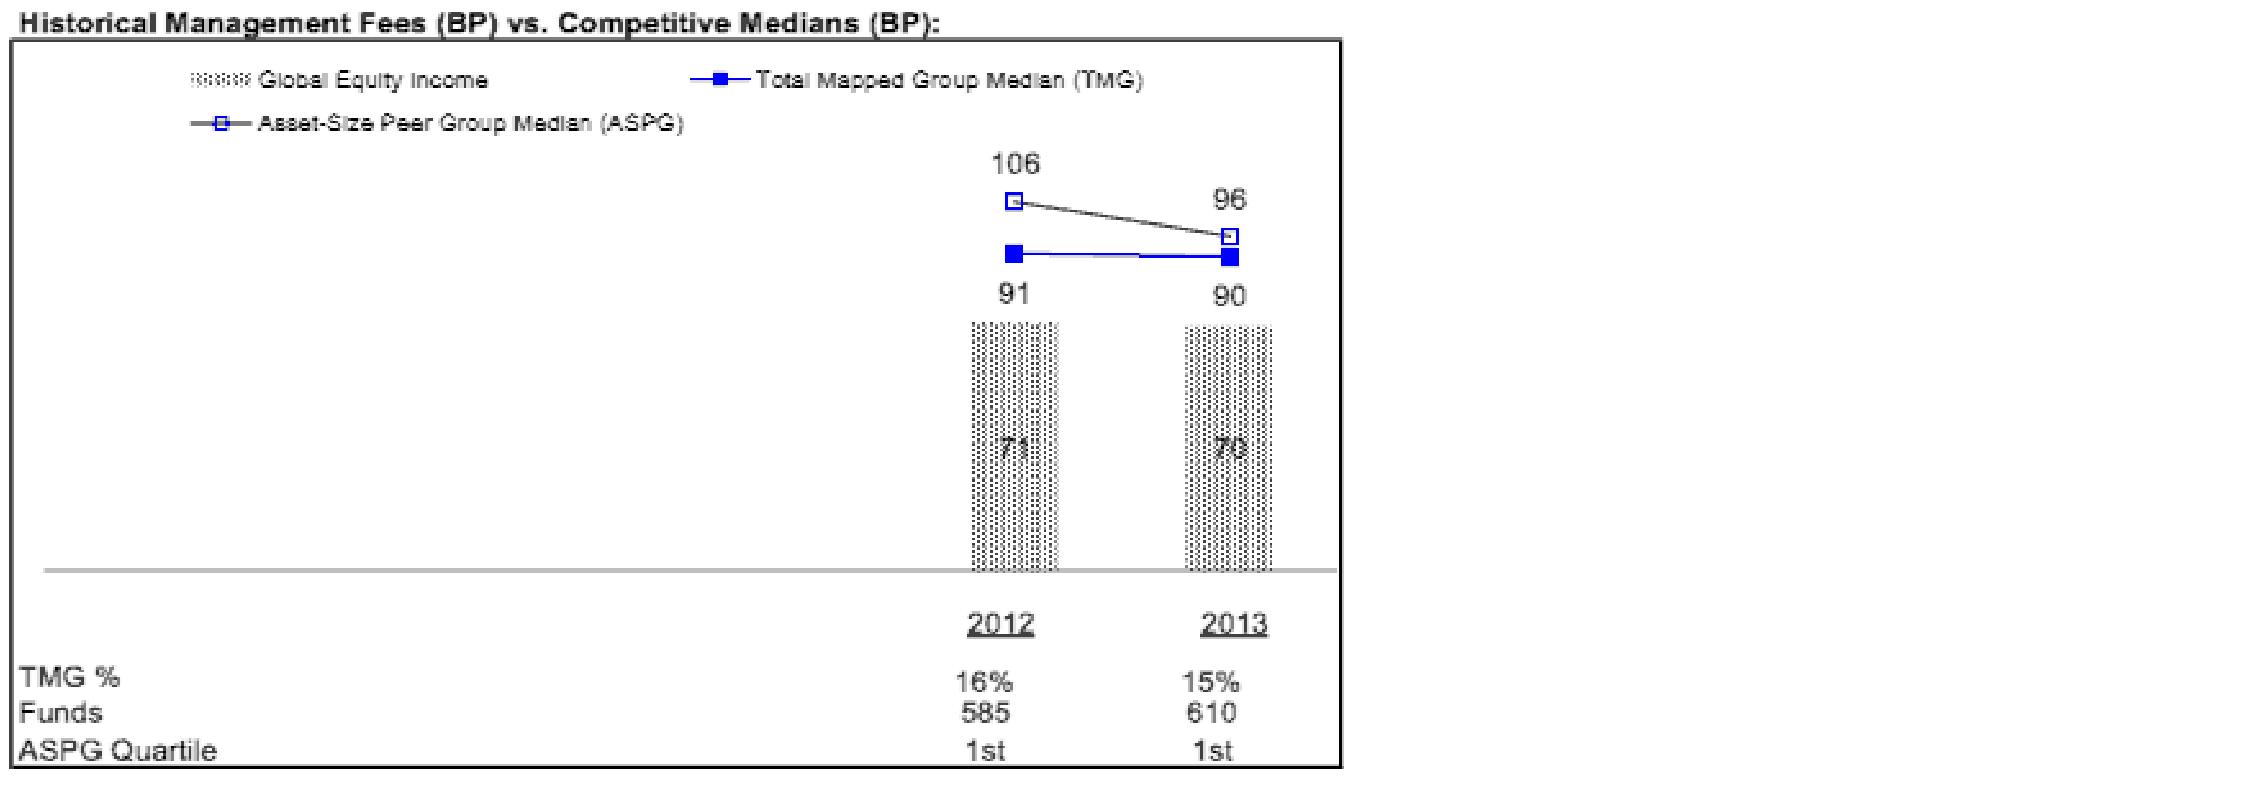
The Board noted that the fund's management fee rate ranked below the median of its Total Mapped Group and below the median of its ASPG for 2013.
The Board also noted that, in August 2013, the ad hoc Committee on Management Fees was formed to conduct an in-depth review of the management fee rates of Fidelity's active equity mutual funds. The Committee focused on the following areas: (i) standard fee structures; (ii) research consumption and trading evolution; (iii) management fee competitiveness/profitability by category; and (iv) factors that drive institutional pricing.
Annual Report
Based on its review, the Board concluded that the fund's management fee is fair and reasonable in light of the services that the fund receives and the other factors considered.
Total Expense Ratio. In its review of the fund's total expense ratio, the Board considered the fund's management fee as well as other fund expenses, such as transfer agent fees, pricing and bookkeeping fees, and custodial, legal, and audit fees. The Board also noted the effects of any waivers and reimbursements on fees and expenses. As part of its review, the Board also considered the current and historical total expense ratios of the fund compared to competitive fund median expenses. The fund is compared to those funds and classes in the Total Mapped Group (used by the Board for management fee comparisons) that have a similar sales load structure.
The Board noted that the fund's total expense ratio ranked below its competitive median for 2013.
The Board further considered that FMR contractually agreed to reimburse the fund to the extent that total expenses (excluding interest, certain taxes, certain securities lending costs, brokerage commissions, extraordinary expenses, and acquired fund fees and expenses, if any), as a percentage of average net assets, exceed 1.20% through December 31, 2014.
Fees Charged to Other Fidelity Clients. The Board also considered Fidelity fee structures and other information with respect to clients of Fidelity, such as other funds advised or subadvised by Fidelity, pension plan clients, and other institutional clients. The Board noted the findings of the 2013 ad hoc joint committee (created with the board of other Fidelity funds), which reviewed and compared Fidelity's institutional investment advisory business with its business of providing services to the Fidelity funds, including the differences in services provided, fees charged, and costs incurred, as well as competition in their respective marketplaces.
Based on its review of total expense ratios and fees charged to other Fidelity clients, the Board concluded that the fund's total expense ratio was reasonable in light of the services that the fund and its shareholders receive and the other factors considered.
Costs of the Services and Profitability. The Board considered the revenues earned and the expenses incurred by Fidelity in conducting the business of developing, marketing, distributing, managing, administering and servicing the fund and servicing the fund's shareholders. The Board also considered the level of Fidelity's profits in respect of all the Fidelity funds.
On an annual basis, Fidelity presents to the Board Fidelity's profitability for the fund. Fidelity calculates the profitability for each fund, as well as aggregate profitability for groups of Fidelity funds and all Fidelity funds, using a series of detailed revenue and cost allocation methodologies which originate with the books and records of Fidelity on which Fidelity's audited financial statements are based. The Audit Committee of the Board reviews any significant changes from the prior year's methodologies.
Annual Report
Board Approval of Investment Advisory Contracts and
Management Fees - continued
PricewaterhouseCoopers LLP (PwC), independent registered public accounting firm and auditor to Fidelity and certain Fidelity funds, has been engaged annually by the Board as part of the Board's assessment of Fidelity's profitability analysis. PwC's engagement includes the review and assessment of the methodologies used by Fidelity in determining the revenues and expenses attributable to Fidelity's mutual fund business, and completion of agreed-upon procedures in respect of the mathematical accuracy of fund profitability and its conformity to established allocation methodologies. After considering PwC's reports issued under the engagement and information provided by Fidelity, the Board concluded that while other allocation methods may also be reasonable, Fidelity's profitability methodologies are reasonable in all material respects.
The Board also reviewed Fidelity's non-fund businesses and fall-out benefits related to the mutual fund business as well as cases where Fidelity's affiliates may benefit from or be related to the fund's business.
The Board considered the costs of the services provided by and the profits realized by Fidelity in connection with the operation of the fund and was satisfied that the profitability was not excessive in the circumstances.
Economies of Scale. The Board considered whether there have been economies of scale in respect of the management of the Fidelity funds, whether the Fidelity funds (including the fund) have appropriately benefited from any such economies of scale, and whether there is potential for realization of any further economies of scale. The Board considered the extent to which the fund will benefit from economies of scale through increased services to the fund, through waivers or reimbursements, or through fee or expense ratio reductions. The Board also noted that in 2013, it and the boards of other Fidelity funds created an ad hoc committee (the Economies of Scale Committee) to analyze whether Fidelity attains economies of scale in respect of the management and servicing of the Fidelity funds, whether the Fidelity funds have appropriately benefited from such economies of scale, and whether there is potential for realization of any further economies of scale.
The Board recognized that the fund's management contract incorporates a "group fee" structure, which provides for lower group fee rates as total group assets increase, and for higher group fee rates as total group assets decrease (with "group assets" defined to include fund assets under FMR's management plus sector fund assets previously under FMR's management and currently managed by Fidelity SelectCo, LLC). FMR calculates the group fee rates based on a tiered asset "breakpoint" schedule that varies based on asset class. The Board considered that the group fee is designed to deliver the benefits of economies of scale to fund shareholders when total Fidelity fund assets increase, even if assets of any particular fund are unchanged or have declined, because some portion of Fidelity's costs are attributable to services provided to all Fidelity funds, and all funds benefit if those costs can be allocated among more assets. The Board concluded that, given the group fee structure, fund shareholders will benefit from lower management fees as group assets increase at the fund complex level, regardless of whether Fidelity achieves any such economies of scale.
Annual Report
The Board concluded, taking into account the analysis of the Economies of Scale Committee, that economies of scale, if any, are being appropriately shared between fund shareholders and Fidelity.
Additional Information Requested by the Board. In order to develop fully the factual basis for consideration of the Fidelity funds' Advisory Contracts, the Board requested and received additional information on certain topics, including: (i) fund performance trends and Fidelity's long-term strategies for certain funds; (ii) Fidelity's strategic marketing and product lineup goals; (iii) the methodology with respect to competitive fund data and peer group classifications; (iv) the arrangements with, and performance of, certain sub-advisers on behalf of the Fidelity funds, as well as certain proposed participating affiliate arrangements; (v) the realization of fall-out benefits in certain Fidelity business units; (vi) Fidelity's group fee structures, including the rationale for the individual fee rates of certain categories of funds and the definition of group assets; (vii) trends regarding industry use of performance fee structures and the performance adjustment methodologies applicable to the Fidelity funds; (viii) additional competitive analysis regarding the total expenses for certain classes; (ix) fund profitability methodology, including Fidelity's cost allocation methodology, and the impact of certain factors on fund profitability results; and (x) the process by which Fidelity determines sub-advisory fees for funds it advises.
Based on its evaluation of all of the conclusions noted above, and after considering all factors it believed relevant, the Board ultimately concluded that the advisory fee structures are fair and reasonable, and that the fund's Advisory Contracts should be renewed.
Annual Report
Investment Adviser
Fidelity Management & Research Company
Boston, MA
Investment Sub-Advisers
FMR Co., Inc.
Fidelity Management & Research
(U.K.) Inc.
Fidelity Management & Research
(Japan) Limited
Fidelity Management & Research
(Hong Kong) Limited
FIL Investment Advisors (FIA)
FIL Investment Advisors (UK) Limited
(FIA(UK))
FIL Investments (Japan) Limited (FIJ)
General Distributor
Fidelity Distributors Corporation
Smithfield, RI
Transfer and Service Agents
Fidelity Investments Institutional
Operations Company, Inc.
Boston, MA
Fidelity Service Company, Inc.
Boston, MA
Custodian
Citibank, N.A.
New York, NY
The Fidelity Telephone Connection
Mutual Fund 24-Hour Service
Exchanges/Redemptions
and Account Assistance 1-800-544-6666
Product Information 1-800-544-6666
Retirement Accounts 1-800-544-4774
(8 a.m. - 9 p.m.)
TDD Service 1-800-544-0118
for the deaf and hearing impaired
(9 a.m. - 9 p.m. Eastern time)
Fidelity Automated Service
Telephone (FAST®)
1-800-544-5555
Automated line for quickest service
(Fidelity Investment logo)(registered trademark)
Corporate Headquarters
245 Summer St., Boston, MA 02210
www.fidelity.com
GED-UANN-1214
1.938161.102
(Fidelity Investment logo)(registered trademark)
Fidelity Advisor®
International Discovery
Fund - Class A, Class T, Class B
and Class C
Annual Report
October 31, 2014
(Fidelity Cover Art)
Class A, Class T, Class B, and Class C are classes of Fidelity® International Discovery Fund
Contents
Performance | (Click Here) | How the fund has done over time. |
Management's Discussion of Fund Performance | (Click Here) | The Portfolio Manager's review of fund performance and strategy. |
Shareholder Expense Example | (Click Here) | An example of shareholder expenses. |
Investment Changes | (Click Here) | A summary of major shifts in the fund's investments over the past six months. |
Investments | (Click Here) | A complete list of the fund's investments with their market values. |
Financial Statements | (Click Here) | Statements of assets and liabilities, operations, and changes in net assets, as well as financial highlights. |
Notes | (Click Here) | Notes to financial statements. |
Report of Independent Registered Public Accounting Firm | (Click Here) | |
Trustees and Officers | (Click Here) | |
Distributions | (Click Here) | |
Board Approval of Investment Advisory Contracts and Management Fees | (Click Here) | |
To view a fund's proxy voting guidelines and proxy voting record for the 12-month period ended June 30, visit http://www.fidelity.com/proxyvotingresults or visit the Securities and Exchange Commission's (SEC) web site at http://www.sec.gov. You may also call 1-877-208-0098 to request a free copy of the proxy voting guidelines.
Standard & Poor's, S&P and S&P 500 are registered service marks of The McGraw-Hill Companies, Inc. and have been licensed for use by Fidelity Distributors Corporation.
Other third-party marks appearing herein are the property of their respective owners.
All other marks appearing herein are registered or unregistered trademarks or service marks of FMR LLC or an affiliated company. © 2014 FMR LLC. All rights reserved.
Annual Report
This report and the financial statements contained herein are submitted for the general information of the shareholders of the fund. This report is not authorized for distribution to prospective investors in the fund unless preceded or accompanied by an effective prospectus.
A fund files its complete schedule of portfolio holdings with the SEC for the first and third quarters of each fiscal year on Form N-Q. Forms N-Q are available on the SEC's web site at http://www.sec.gov. A fund's Forms N-Q may be reviewed and copied at the SEC's Public Reference Room in Washington, DC. Information regarding the operation of the SEC's Public Reference Room may be obtained by calling 1-800-SEC-0330. For a complete list of a fund's portfolio holdings, view the most recent holdings listing, semiannual report, or annual report on Fidelity's web site at http://www.fidelity.com, http://www.advisor.fidelity.com, or http://www.401k.com, as applicable.
NOT FDIC INSURED • MAY LOSE VALUE • NO BANK GUARANTEE
Neither the fund nor Fidelity Distributors Corporation is a bank.
Annual Report
Average annual total return reflects the change in the value of an investment, assuming reinvestment of the class' distributions from dividend income and capital gains (the profits earned upon the sale of securities that have grown in value, if any) and assuming a constant rate of performance each year. The $10,000 table and the fund's returns do not reflect the deduction of taxes that a shareholder would pay on fund distributions or the redemption of fund shares. During periods of reimbursement by Fidelity, a fund's total return will be greater than it would be had the reimbursement not occurred. How a fund did yesterday is no guarantee of how it will do tomorrow. Returns reflect the conversion of Class B shares to Class A shares after a maximum of seven years.
Average Annual Total Returns
Periods ended October 31, 2014 | Past 1
year | Past 5
years | Past 10
years |
Class A (incl. 5.75% sales charge) A, E | -6.09% | 6.46% | 6.10% |
Class T (incl. 3.50% sales charge) B, E | -4.08% | 6.70% | 6.04% |
Class B (incl. contingent deferred sales charge) C, E | -6.02% | 6.60% | 6.11% |
Class C (incl. contingent deferred sales charge) D , E | -2.07% | 6.92% | 5.92% |
A Class A shares bear a 0.25% 12b-1 fee. The initial offering of Class A shares took place on Janu-ary 6, 2005. Returns prior to January 6, 2005, are those of Fidelity® International Discovery Fund, the original class of the fund, which has no 12b-1 fee. Had Class A shares' 12b-1 fee been reflected, returns prior to January 6, 2005, would have been lower.
B Class T shares bear a 0.50% 12b-1 fee. The initial offering of Class T shares took place on Janu-ary 6, 2005. Returns prior to January 6, 2005, are those of Fidelity International Discovery Fund, the original class of the fund, which has no 12b-1 fee. Had Class T shares' 12b-1 fee been reflected, returns prior to January 6, 2005, would have been lower.
C Class B shares bear a 1.00% 12b-1 fee. The initial offering of Class B shares took place on Janu-ary 6, 2005. Returns prior to January 6, 2005, are those of Fidelity International Discovery Fund, the original class of the fund, which has no 12b-1 fee. Had Class B shares' 12b-1 fee been reflected, returns prior to January 6, 2005, would have been lower. Class B shares' contingent deferred sales charges included in the past one year, past five year, and past 10 year total return figures are 5%, 2%, and 0% respectively.
D Class C shares bear a 1.00% 12b-1 fee. The initial offering of Class C shares took place on Janu-ary 6, 2005. Returns prior to January 6, 2005, are those of Fidelity International Discovery Fund, the original class of the fund, which has no 12b-1 fee. Had Class C shares' 12b-1 fee been reflected, returns prior to January 6, 2005, would have been lower. Class C shares' contingent deferred sales charges included in the past one year, past five year, and past 10 year total return figures are 1%, 0%, and 0% respectively.
E Prior to October 1, 2004, the fund operated under certain different investment policies. The fund's historical performance may not represent its current investment policies.
Annual Report
$10,000 Over 10 Years
Let's say hypothetically that $10,000 was invested in Fidelity Advisor® International Discovery Fund - Class A on October 31, 2004 and the current 5.75% sales charge was paid. The chart shows how the value of your investment would have changed, and also shows how the MSCI EAFE Index performed over the same period. See footnote A on the previous page for additional information regarding the performance of Class A.
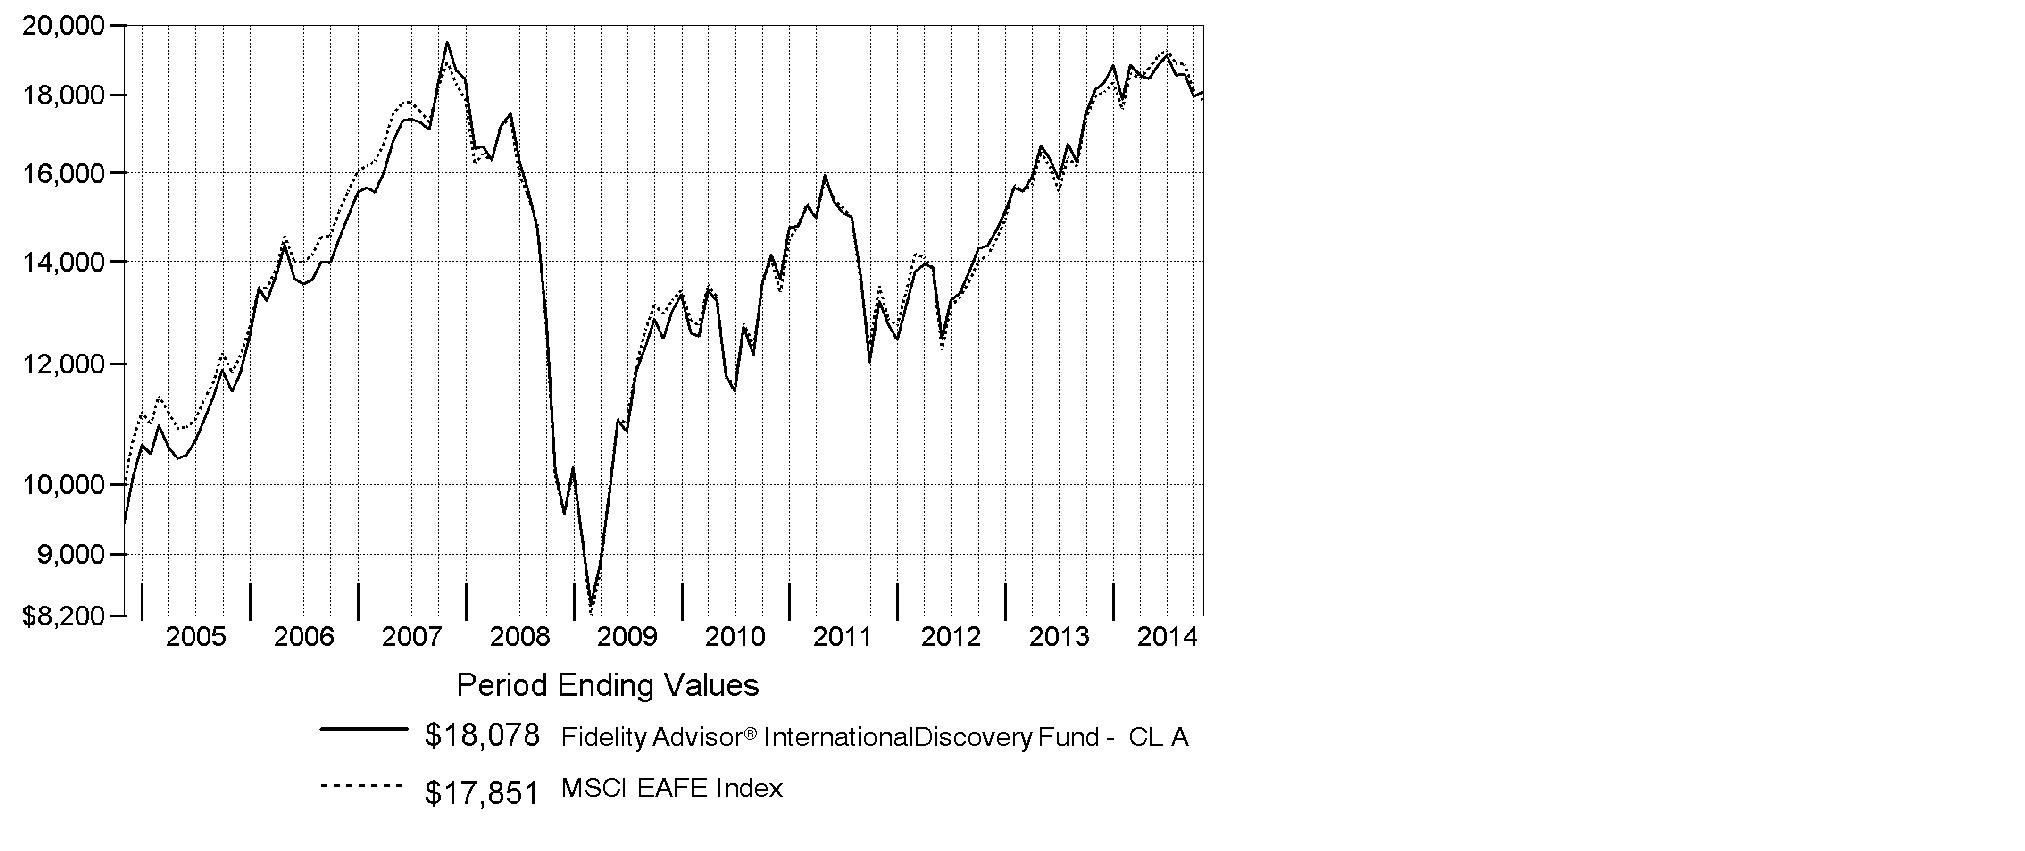
Annual Report
Market Recap: Global equities posted a healthy gain for the 12 months ending October 31, 2014, overcoming an October market decline driven by recessionary pressures in China and tepid growth in Europe. The MSCI ACWI (All Country World Index) Index rose 8.15%, helped by subdued market volatility for much of the period and supported by solid corporate earnings, especially in the United States. Stocks also benefited from easy monetary policies in Japan and the eurozone, as well as increased stimulus efforts in China. All but three of the 24 industry groups that compose the index marked a positive return. The U.S. (+17%) remained a pillar of strength, while a strongly rising dollar in the latter part of the period detracted from investors' returns in most non-U.S. markets. Canada (+5%) notched broad gains outside of its energy and materials sectors, as did Asia-Pacific ex Japan (+4%), led by investor enthusiasm for companies in India. The U.K., Europe and Japan, meanwhile, all underperformed. Among sectors, health care (+24%) led the index, with a strong contribution from the pharmaceuticals, biotechnology & life sciences industry. Information technology (+21%) also outperformed. Conversely, materials (-4%) and energy (-1%) lagged the index due to a higher supply of and lower demand for commodities.
Comments from William Kennedy, Portfolio Manager of Fidelity Advisor® International Discovery Fund: For the year, the fund's Class A, Class T, Class B and Class C shares returned -0.36%, -0.60%, -1.12%, and -1.10%, respectively (excluding sales charges), versus -0.48% for its benchmark, the MSCI EAFE Index. Security selection helped relative performance, particularly in health care, information technology and financials. The fund also benefited from out-of-index investments in the U.S. and emerging markets. Top individual contributors included U.K.-listed Hikma Pharmaceuticals, a Jordan-based company that specializes in injectable drugs. Its stock received a boost from U.S. market-share gains. Shares of pharmaceuticals company Actavis benefited from successful recent acquisitions and the tax advantage of its Ireland domicile. By contrast, security selection in industrials and consumer discretionary and in Europe ex U.K. detracted versus the index. In terms of individual disappointments, not owning Switzerland-based pharmaceuticals giant and index component Novartis hurt relative performance, as the company's strong patent portfolio and product pipeline drove sales growth and the stock gain. An overweighting in ORIX, a high-quality diversified financials conglomerate in Japan, also detracted from results, as the weak local economy pressured near-term earnings growth.
The views expressed above reflect those of the portfolio manager(s) only through the end of the period as stated on the cover of this report and do not necessarily represent the views of Fidelity or any other person in the Fidelity organization. Any such views are subject to change at any time based upon market or other conditions and Fidelity disclaims any responsibility to update such views. These views may not be relied on as investment advice and, because investment decisions for a Fidelity fund are based on numerous factors, may not be relied on as an indication of trading intent on behalf of any Fidelity fund.
Annual Report
Shareholder Expense Example
As a shareholder of the Fund, you incur two types of costs: (1) transaction costs, including sales charges (loads) on purchase payments or redemption proceeds, redemption fees and (2) ongoing costs, including management fees, distribution and/or service (12b-1) fees and other Fund expenses. This Example is intended to help you understand your ongoing costs (in dollars) of investing in the Fund and to compare these costs with the ongoing costs of investing in other mutual funds.
The Example is based on an investment of $1,000 invested at the beginning of the period and held for the entire period (May 1, 2014 to October 31, 2014).
Actual Expenses
The first line of the accompanying table for each class of the Fund provides information about actual account values and actual expenses. You may use the information in this line, together with the amount you invested, to estimate the expenses that you paid over the period. Simply divide your account value by $1,000.00 (for example, an $8,600 account value divided by $1,000.00 = 8.6), then multiply the result by the number in the first line for a class of the Fund under the heading entitled "Expenses Paid During Period" to estimate the expenses you paid on your account during this period. A small balance maintenance fee of $12.00 that is charged once a year may apply for certain accounts with a value of less than $2,000. This fee is not included in the table below. If it was, the estimate of expenses you paid during the period would be higher, and your ending account value lower, by this amount. In addition, the Fund, as a shareholder in the underlying Fidelity Central Funds, will indirectly bear its pro-rata share of the fees and expenses incurred by the underlying Fidelity Central Funds. These fees and expenses are not included in the Fund's annualized expense ratio used to calculate the expense estimate in the table below.
Hypothetical Example for Comparison Purposes
The second line of the accompanying table for each class of the Fund provides information about hypothetical account values and hypothetical expenses based on a Class' actual expense ratio and an assumed rate of return of 5% per year before expenses, which is not the Class' actual return. The hypothetical account values and expenses may not be used to estimate the actual ending account balance or expenses you paid for the period. You may use this information to compare the ongoing costs of investing in the Fund and other funds. To do so, compare this 5% hypothetical example with the 5% hypothetical examples that appear in the shareholder reports of the other funds. A small balance maintenance fee of $12.00 that is charged once a year may apply for certain accounts with a value of less than $2,000. This fee is not included in the table below. If it was, the estimate of expenses you paid during the period would be higher, and your ending account value lower, by this amount. In addition, the Fund, as a shareholder in the underlying Fidelity Central Funds, will indirectly bear its pro-rata share of the fees and expenses incurred by the underlying Fidelity Central Funds. These fees and expenses are not included in the Fund's annualized expense ratio used to calculate the expense estimate in the table below.
Please note that the expenses shown in the table are meant to highlight your ongoing costs only and do not reflect any transaction costs. Therefore, the second line of the table is useful in comparing ongoing costs only, and will not help you determine the relative total costs of owning different funds. In addition, if these transactional costs were included, your costs would have been higher.
Annual Report
| Annualized
Expense RatioB | Beginning
Account Value
May 1, 2014 | Ending
Account Value
October 31, 2014 | Expenses Paid
During Period*
May 1, 2014
to October 31, 2014 |
Class A | 1.27% | | | |
Actual | | $ 1,000.00 | $ 981.00 | $ 6.34 |
HypotheticalA | | $ 1,000.00 | $ 1,018.80 | $ 6.46 |
Class T | 1.50% | | | |
Actual | | $ 1,000.00 | $ 979.90 | $ 7.49 |
HypotheticalA | | $ 1,000.00 | $ 1,017.64 | $ 7.63 |
Class B | 2.04% | | | |
Actual | | $ 1,000.00 | $ 977.10 | $ 10.17 |
HypotheticalA | | $ 1,000.00 | $ 1,014.92 | $ 10.36 |
Class C | 2.02% | | | |
Actual | | $ 1,000.00 | $ 977.30 | $ 10.07 |
HypotheticalA | | $ 1,000.00 | $ 1,015.02 | $ 10.26 |
International Discovery | .92% | | | |
Actual | | $ 1,000.00 | $ 982.60 | $ 4.60 |
HypotheticalA | | $ 1,000.00 | $ 1,020.57 | $ 4.69 |
Class K | .79% | | | |
Actual | | $ 1,000.00 | $ 983.10 | $ 3.95 |
HypotheticalA | | $ 1,000.00 | $ 1,021.22 | $ 4.02 |
Institutional Class | .93% | | | |
Actual | | $ 1,000.00 | $ 982.60 | $ 4.65 |
HypotheticalA | | $ 1,000.00 | $ 1,020.52 | $ 4.74 |
Class Z | .81% | | | |
Actual | | $ 1,000.00 | $ 983.30 | $ 4.05 |
HypotheticalA | | $ 1,000.00 | $ 1,021.12 | $ 4.13 |
A 5% return per year before expenses
B Annualized expense ratio reflects expenses net of applicable fee waivers.
* Expenses are equal to each Class' annualized expense ratio, multiplied by the average account value over the period, multiplied by 184/365 (to reflect the one-half year period).
Annual Report
Investment Changes (Unaudited)
Geographic Diversification (% of fund's net assets) |
As of October 31, 2014 |
 | Japan 17.1% | |
 | United Kingdom 14.9% | |
 | United States of America* 9.2% | |
 | Germany 6.7% | |
 | Switzerland 6.0% | |
 | France 5.1% | |
 | Australia 4.3% | |
 | Sweden 4.1% | |
 | India 3.2% | |
 | Other 29.4% | |

* Includes Short-Term Investments and Net Other Assets (Liabilities) |
Percentages are based on country or territory of incorporation and are adjusted for the effect of futures contracts, if applicable. |
As of April 30, 2014 |
| Japan 16.3% | |
| United Kingdom 14.4% | |
| Germany 10.3% | |
| United States of America* 9.5% | |
| France 8.9% | |
| Switzerland 5.5% | |
| Sweden 5.2% | |
| Spain 3.0% | |
| Netherlands 2.7% | |
| Other 24.2% | |

* Includes Short-Term Investments and Net Other Assets (Liabilities) |
Percentages are based on country or territory of incorporation and are adjusted for the effect of futures contracts, if applicable. |
Asset Allocation as of October 31, 2014 |
| % of fund's
net assets | % of fund's net assets
6 months ago |
Stocks and Equity Futures | 97.5 | 96.0 |
Other Investments | 0.1 | 0.1 |
Short-Term Investments and Net Other Assets (Liabilities) | 2.4 | 3.9 |
Top Ten Stocks as of October 31, 2014 |
| % of fund's
net assets | % of fund's net assets
6 months ago |
Roche Holding AG (participation certificate) (Switzerland, Pharmaceuticals) | 2.5 | 2.3 |
Total SA (France, Oil, Gas & Consumable Fuels) | 1.9 | 2.0 |
Australia & New Zealand Banking Group Ltd. (Australia, Banks) | 1.7 | 1.8 |
Bayer AG (Germany, Pharmaceuticals) | 1.6 | 1.8 |
Astellas Pharma, Inc. (Japan, Pharmaceuticals) | 1.4 | 0.9 |
Keyence Corp. (Japan, Electronic Equipment & Components) | 1.3 | 1.0 |
Actavis PLC (Ireland, Pharmaceuticals) | 1.3 | 0.5 |
Housing Development Finance Corp. Ltd. (India, Thrifts & Mortgage Finance) | 1.2 | 0.8 |
Japan Tobacco, Inc. (Japan, Tobacco) | 1.2 | 1.1 |
Anheuser-Busch InBev SA NV (Belgium, Beverages) | 1.2 | 1.1 |
| 15.3 | |
Market Sectors as of October 31, 2014 |
| % of fund's
net assets | % of fund's net assets
6 months ago |
Financials | 20.7 | 21.1 |
Health Care | 14.9 | 12.4 |
Consumer Discretionary | 12.9 | 14.8 |
Information Technology | 10.7 | 8.3 |
Consumer Staples | 10.7 | 8.4 |
Industrials | 10.4 | 14.6 |
Energy | 5.6 | 3.5 |
Materials | 4.7 | 5.4 |
Telecommunication Services | 3.9 | 5.1 |
Utilities | 0.2 | 0.2 |
Annual Report
Investments October 31, 2014
Showing Percentage of Net Assets
Common Stocks - 93.6% |
| Shares | | Value (000s) |
Australia - 4.3% |
Ansell Ltd. | 2,499,254 | | $ 43,839 |
Asaleo Care Ltd. (a) | 23,409,115 | | 41,813 |
Australia & New Zealand Banking Group Ltd. | 6,493,040 | | 192,133 |
G8 Education Ltd. | 5,831,484 | | 25,767 |
Greencross Ltd. | 1,186,547 | | 8,960 |
Ramsay Health Care Ltd. | 1,215,729 | | 56,201 |
Regis Healthcare Ltd. (a) | 4,596,817 | | 17,433 |
Spotless Group Holdings Ltd. | 18,983,369 | | 32,120 |
Woodside Petroleum Ltd. | 1,705,042 | | 60,564 |
TOTAL AUSTRALIA | | 478,830 |
Austria - 0.2% |
Andritz AG | 455,300 | | 21,978 |
Bailiwick of Jersey - 1.9% |
Glencore Xstrata PLC | 9,661,966 | | 49,445 |
MySale Group PLC (f) | 8,571,600 | | 26,053 |
Shire PLC | 1,110,100 | | 74,484 |
Wolseley PLC | 1,030,400 | | 54,675 |
TOTAL BAILIWICK OF JERSEY | | 204,657 |
Belgium - 1.9% |
Anheuser-Busch InBev SA NV | 1,183,927 | | 131,291 |
Arseus NV | 252,964 | | 10,112 |
KBC Groupe SA (a) | 1,328,201 | | 71,155 |
TOTAL BELGIUM | | 212,558 |
Bermuda - 1.1% |
BW Offshore Ltd. | 8,689,300 | | 10,654 |
Noble Group Ltd. | 22,526,000 | | 20,969 |
PAX Global Technology Ltd. (a)(f) | 66,294,000 | | 71,203 |
Travelport Worldwide Ltd. (e) | 1,324,600 | | 19,140 |
TOTAL BERMUDA | | 121,966 |
Canada - 3.1% |
Alimentation Couche-Tard, Inc. Class B (sub. vtg.) | 1,346,700 | | 45,705 |
Constellation Software, Inc. | 266,500 | | 75,075 |
First Quantum Minerals Ltd. (e) | 1,164,300 | | 17,562 |
Imperial Oil Ltd. | 1,205,500 | | 58,005 |
Potash Corp. of Saskatchewan, Inc. | 813,500 | | 27,767 |
PrairieSky Royalty Ltd. (e) | 1,530,400 | | 47,118 |
Common Stocks - continued |
| Shares | | Value (000s) |
Canada - continued |
Suncor Energy, Inc. | 1,036,600 | | $ 36,808 |
TransForce, Inc. (e) | 1,412,400 | | 34,538 |
TOTAL CANADA | | 342,578 |
Cayman Islands - 2.1% |
Alibaba Group Holding Ltd. sponsored ADR | 927,200 | | 91,422 |
Baidu.com, Inc. sponsored ADR (a) | 175,200 | | 41,833 |
ENN Energy Holdings Ltd. | 3,266,000 | | 21,191 |
Greatview Aseptic Pack Co. Ltd. | 26,392,000 | | 17,374 |
Sands China Ltd. | 3,748,400 | | 23,379 |
WuXi PharmaTech Cayman, Inc. sponsored ADR (a) | 841,400 | | 31,721 |
TOTAL CAYMAN ISLANDS | | 226,920 |
China - 0.0% |
Yantai Changyu Pioneer Wine Co. Ltd. (B Shares) | 485,600 | | 1,526 |
Colombia - 0.2% |
Grupo Aval Acciones y Valores SA ADR | 1,645,837 | | 22,186 |
Cyprus - 0.0% |
SPDI Secure Property Development & Investment PLC (a) | 529,830 | | 479 |
Denmark - 2.0% |
ISS Holdings A/S (a) | 384,000 | | 10,706 |
Novo Nordisk A/S Series B | 2,298,245 | | 103,887 |
Pandora A/S | 514,000 | | 43,270 |
Vestas Wind Systems A/S (a) | 1,874,500 | | 62,741 |
TOTAL DENMARK | | 220,604 |
Finland - 0.8% |
Sampo Oyj (A Shares) | 1,739,800 | | 83,219 |
France - 5.1% |
Atos Origin SA | 531,441 | | 36,689 |
AXA SA | 1,839,400 | | 42,436 |
BNP Paribas SA | 1,039,745 | | 65,330 |
Bureau Veritas SA | 737,700 | | 18,239 |
Havas SA | 5,933,668 | | 47,961 |
Numericable Group SA (e) | 483,713 | | 17,882 |
Numericable Group SA rights 11/12/14 (a)(e) | 483,713 | | 14,342 |
Rexel SA | 1,107,782 | | 18,609 |
Schneider Electric SA | 798,800 | | 62,944 |
SR Teleperformance SA | 297,200 | | 18,719 |
Total SA | 3,562,400 | | 212,687 |
TOTAL FRANCE | | 555,838 |
Common Stocks - continued |
| Shares | | Value (000s) |
Germany - 5.7% |
Aareal Bank AG | 1,044,895 | | $ 44,743 |
Bayer AG | 1,224,000 | | 174,016 |
Continental AG | 306,500 | | 60,168 |
Drillisch AG | 2,022,600 | | 70,184 |
GEA Group AG | 1,508,060 | | 69,347 |
KION Group AG | 1,429,749 | | 51,995 |
LEG Immobilien AG | 610,854 | | 42,140 |
Siemens AG | 727,119 | | 82,014 |
Symrise AG | 500,800 | | 28,163 |
TOTAL GERMANY | | 622,770 |
Hong Kong - 2.2% |
AIA Group Ltd. | 22,053,600 | | 123,068 |
Techtronic Industries Co. Ltd. | 39,683,000 | | 124,232 |
TOTAL HONG KONG | | 247,300 |
India - 3.2% |
Bharti Infratel Ltd. | 11,032,464 | | 52,872 |
Container Corp. of India Ltd. | 470,441 | | 10,379 |
Housing Development Finance Corp. Ltd. | 7,555,494 | | 136,069 |
Info Edge India Ltd. | 1,609,886 | | 22,122 |
Lupin Ltd. | 2,986,357 | | 69,144 |
The Jammu & Kashmir Bank Ltd. | 7,127,060 | | 16,146 |
Titan Co. Ltd. (a) | 2,240,879 | | 14,720 |
Yes Bank Ltd. | 3,138,775 | | 35,543 |
TOTAL INDIA | | 356,995 |
Indonesia - 0.8% |
PT Bank Central Asia Tbk | 41,701,500 | | 45,018 |
PT Bank Rakyat Indonesia Tbk | 44,669,800 | | 40,935 |
TOTAL INDONESIA | | 85,953 |
Ireland - 2.8% |
Actavis PLC (a) | 586,200 | | 142,294 |
Bank of Ireland (a) | 63,590,200 | | 25,142 |
Glanbia PLC | 2,424,800 | | 34,215 |
James Hardie Industries PLC CDI | 3,230,390 | | 34,457 |
Kerry Group PLC Class A | 1,035,200 | | 70,299 |
TOTAL IRELAND | | 306,407 |
Italy - 1.0% |
De Longhi SpA | 2,375,100 | | 46,372 |
Common Stocks - continued |
| Shares | | Value (000s) |
Italy - continued |
Telecom Italia SpA (a)(e) | 42,790,100 | | $ 48,493 |
World Duty Free SpA (a) | 2,253,904 | | 19,079 |
TOTAL ITALY | | 113,944 |
Japan - 17.1% |
ABC-MART, Inc. | 398,400 | | 22,972 |
ACOM Co. Ltd. (a) | 7,381,200 | | 24,603 |
Aozora Bank Ltd. | 11,251,000 | | 39,546 |
Astellas Pharma, Inc. | 10,267,800 | | 159,361 |
Coca-Cola Central Japan Co. Ltd. | 1,597,500 | | 28,744 |
Dentsu, Inc. | 899,500 | | 33,443 |
Don Quijote Holdings Co. Ltd. | 898,200 | | 53,816 |
Hitachi Ltd. | 6,659,000 | | 52,323 |
Hoya Corp. | 2,822,900 | | 99,894 |
Japan Exchange Group, Inc. | 2,358,200 | | 58,498 |
Japan Tobacco, Inc. | 3,948,700 | | 134,726 |
KDDI Corp. | 1,626,800 | | 106,831 |
Keyence Corp. | 304,060 | | 147,342 |
NEC Corp. | 26,163,000 | | 92,522 |
Nippon Kanzai Co. Ltd. | 8,000 | | 209 |
Olympus Corp. (a) | 1,501,000 | | 53,894 |
OMRON Corp. | 2,083,000 | | 98,598 |
ORIX Corp. | 5,463,900 | | 75,840 |
Park24 Co. Ltd. | 1,342,800 | | 20,319 |
Rakuten, Inc. | 5,927,100 | | 66,837 |
Santen Pharmaceutical Co. Ltd. | 583,800 | | 34,845 |
Seven & i Holdings Co., Ltd. | 2,748,600 | | 107,350 |
Seven Bank Ltd. | 17,781,300 | | 74,262 |
Ship Healthcare Holdings, Inc. | 1,076,700 | | 25,201 |
SoftBank Corp. | 1,575,100 | | 114,666 |
Sundrug Co. Ltd. | 825,500 | | 39,878 |
Toshiba Plant Systems & Services Corp. | 1,771,500 | | 29,652 |
Tsuruha Holdings, Inc. | 1,212,600 | | 71,593 |
VT Holdings Co. Ltd. | 3,967,000 | | 15,667 |
TOTAL JAPAN | | 1,883,432 |
Korea (South) - 0.7% |
Naturalendo Tech Co. Ltd. | 167,866 | | 8,765 |
NAVER Corp. | 65,859 | | 46,217 |
Samsung SDI Co. Ltd. | 200,556 | | 23,519 |
TOTAL KOREA (SOUTH) | | 78,501 |
Common Stocks - continued |
| Shares | | Value (000s) |
Luxembourg - 0.6% |
Altice SA | 759,700 | | $ 47,306 |
Grand City Properties SA (a) | 1,543,962 | | 19,783 |
TOTAL LUXEMBOURG | | 67,089 |
Marshall Islands - 0.1% |
Hoegh LNG Partners LP | 591,451 | | 12,426 |
Netherlands - 2.5% |
AEGON NV | 5,028,800 | | 40,987 |
AerCap Holdings NV (a) | 1,672,000 | | 72,464 |
IMCD Group BV | 1,902,200 | | 52,442 |
ING Groep NV (Certificaten Van Aandelen) (a) | 3,830,600 | | 54,856 |
LyondellBasell Industries NV Class A | 8,700 | | 797 |
Royal DSM NV | 787,237 | | 49,292 |
TOTAL NETHERLANDS | | 270,838 |
New Zealand - 0.7% |
EBOS Group Ltd. | 4,569,842 | | 34,090 |
Ryman Healthcare Group Ltd. | 7,311,565 | | 43,258 |
TOTAL NEW ZEALAND | | 77,348 |
Philippines - 0.7% |
Alliance Global Group, Inc. | 77,786,166 | | 43,752 |
SM Investments Corp. | 1,681,790 | | 29,306 |
TOTAL PHILIPPINES | | 73,058 |
Portugal - 0.2% |
CTT Correios de Portugal SA | 2,226,700 | | 20,621 |
Singapore - 0.2% |
Ezion Holdings Ltd. | 15,127,200 | | 17,814 |
South Africa - 0.4% |
Naspers Ltd. Class N | 369,200 | | 45,947 |
Spain - 2.6% |
Amadeus IT Holding SA Class A | 2,349,200 | | 86,256 |
Atresmedia Corporacion de Medios de Comunicacion SA | 1,515,400 | | 22,200 |
Banco Bilbao Vizcaya Argentaria SA | 4,806,144 | | 53,756 |
Criteria CaixaCorp SA | 10,039,365 | | 54,739 |
Inditex SA | 2,408,395 | | 67,650 |
TOTAL SPAIN | | 284,601 |
Sweden - 4.1% |
ASSA ABLOY AB (B Shares) | 2,357,200 | | 124,849 |
H&M Hennes & Mauritz AB (B Shares) | 1,057,821 | | 42,074 |
Common Stocks - continued |
| Shares | | Value (000s) |
Sweden - continued |
HEXPOL AB (B Shares) | 341,200 | | $ 30,173 |
Intrum Justitia AB | 1,211,317 | | 35,991 |
Nordea Bank AB | 9,576,600 | | 122,818 |
Svenska Cellulosa AB (SCA) (B Shares) | 1,118,800 | | 25,015 |
Svenska Handelsbanken AB (A Shares) | 1,425,600 | | 67,977 |
TOTAL SWEDEN | | 448,897 |
Switzerland - 6.0% |
Clariant AG (Reg.) | 2,358,150 | | 41,053 |
Compagnie Financiere Richemont SA Series A | 530,511 | | 44,634 |
Lonza Group AG | 521,951 | | 57,449 |
Partners Group Holding AG | 230,056 | | 61,151 |
Roche Holding AG (participation certificate) | 926,232 | | 273,335 |
Schindler Holding AG (participation certificate) | 194,920 | | 27,228 |
Sonova Holding AG Class B | 339,424 | | 52,846 |
UBS AG | 6,126,361 | | 106,526 |
TOTAL SWITZERLAND | | 664,222 |
Taiwan - 0.3% |
ECLAT Textile Co. Ltd. | 94,607 | | 901 |
Merida Industry Co. Ltd. | 4,995,900 | | 34,456 |
TOTAL TAIWAN | | 35,357 |
Turkey - 0.1% |
Logo Yazilim Sanayi Ve Ticar (a) | 1,125,049 | | 13,211 |
United Arab Emirates - 0.1% |
Emaar Malls Group PJSC (a) | 7,174,619 | | 6,270 |
United Kingdom - 14.9% |
Aberdeen Asset Management PLC | 5,975,132 | | 41,484 |
Advanced Computer Software Group PLC | 5,750,200 | | 9,934 |
Al Noor Hospitals Group PLC | 2,487,400 | | 40,547 |
Anglo American PLC (United Kingdom) | 1,316,500 | | 27,796 |
Associated British Foods PLC | 791,000 | | 34,848 |
B&M European Value Retail S.A. | 6,402,976 | | 25,479 |
BG Group PLC | 6,766,700 | | 112,774 |
BHP Billiton PLC | 4,625,988 | | 119,520 |
British American Tobacco PLC (United Kingdom) | 2,261,200 | | 128,159 |
BTG PLC (a) | 1,152,900 | | 13,924 |
Bunzl PLC | 1,143,100 | | 30,995 |
Diageo PLC | 3,650,857 | | 107,672 |
Exova Group Ltd. PLC (a) | 4,302,877 | | 11,684 |
Galiform PLC | 5,687,600 | | 31,144 |
Common Stocks - continued |
| Shares | | Value (000s) |
United Kingdom - continued |
Hikma Pharmaceuticals PLC | 3,032,490 | | $ 91,928 |
ITV PLC | 14,738,700 | | 47,862 |
Jazztel PLC (a) | 2,320,066 | | 37,040 |
Liberty Global PLC: | | | |
Class A (a) | 677,800 | | 30,820 |
Class C | 677,800 | | 30,142 |
Lloyds Banking Group PLC (a) | 54,946,900 | | 67,853 |
London Stock Exchange Group PLC | 3,415,236 | | 110,087 |
Melrose PLC | 11,027,800 | | 45,179 |
Next PLC | 774,844 | | 79,887 |
Persimmon PLC | 1,505,600 | | 35,236 |
Poundland Group PLC (a) | 3,906,035 | | 19,683 |
Reckitt Benckiser Group PLC | 788,600 | | 66,230 |
Rex Bionics PLC (a)(f) | 1,328,936 | | 3,518 |
Rotork PLC | 717,800 | | 29,338 |
SABMiller PLC | 1,107,300 | | 62,440 |
St. James's Place Capital PLC | 5,676,000 | | 67,645 |
Taylor Wimpey PLC | 12,002,700 | | 22,734 |
The Restaurant Group PLC | 1,992,100 | | 21,558 |
Ultra Electronics Holdings PLC | 614,667 | | 17,158 |
Vodafone Group PLC | 2,127,096 | | 7,074 |
Zoopla Property Group PLC | 2,595,500 | | 8,603 |
TOTAL UNITED KINGDOM | | 1,637,975 |
United States of America - 3.9% |
Chevron Corp. | 560,500 | | 67,232 |
Constellation Brands, Inc. Class A (sub. vtg.) (a) | 505,400 | | 46,264 |
Google, Inc.: | | | |
Class A (a) | 90,700 | | 51,506 |
Class C (a) | 90,700 | | 50,709 |
Las Vegas Sands Corp. | 177,700 | | 11,064 |
McGraw Hill Financial, Inc. | 1,415,500 | | 128,074 |
Visa, Inc. Class A | 301,900 | | 72,888 |
TOTAL UNITED STATES OF AMERICA | | 427,737 |
TOTAL COMMON STOCKS (Cost $8,985,470) |
10,292,052
|
Nonconvertible Preferred Stocks - 1.0% |
| | | |
Germany - 1.0% |
Volkswagen AG | 514,100 | | 109,554 |
Nonconvertible Preferred Stocks - continued |
| Shares | | Value (000s) |
United Kingdom - 0.0% |
Rolls-Royce Group PLC | 227,278,350 | | $ 364 |
TOTAL NONCONVERTIBLE PREFERRED STOCKS (Cost $113,684) |
109,918
|
Government Obligations - 0.1% |
| Principal
Amount (000s) (d) | | |
United States of America - 0.1% |
U.S. Treasury Bills, yield at date of purchase 0.02% to 0.03% 11/13/14 to 1/29/15 (i)
(Cost $11,590) | | $ 11,590 | |
11,590
|
Preferred Securities - 0.1% |
|
Ireland - 0.1% |
Baggot Securities Ltd. 10.24% (g)(h)
(Cost $14,037) | EUR | 9,140 | |
12,947
|
Money Market Funds - 5.6% |
| Shares | | |
Fidelity Cash Central Fund, 0.11% (b) | 567,797,475 | | 567,797 |
Fidelity Securities Lending Cash Central Fund, 0.11% (b)(c) | 52,624,430 | | 52,624 |
TOTAL MONEY MARKET FUNDS (Cost $620,421) |
620,421
|
TOTAL INVESTMENT PORTFOLIO - 100.4% (Cost $9,745,202) | | 11,046,928 |
NET OTHER ASSETS (LIABILITIES) - (0.4)% | | (48,377) |
NET ASSETS - 100% | $ 10,998,551 |
Futures Contracts |
| Expiration Date | | Underlying Face Amount at Value (000s) | | Unrealized Appreciation/
(Depreciation)
(000s) |
Purchased |
Equity Index Contracts |
3,792 CME Nikkei 225 Index Contracts (United States) | Dec. 2014 | | $ 323,647 | | $ 24,598 |
|
The face value of futures purchased as a percentage of net assets is 2.9% |
Currency Abbreviations |
EUR | - | European Monetary Unit |
Legend |
(a) Non-income producing |
(b) Affiliated fund that is generally available only to investment companies and other accounts managed by Fidelity Investments. The rate quoted is the annualized seven-day yield of the fund at period end. A complete unaudited listing of the fund's holdings as of its most recent quarter end is available upon request. In addition, each Fidelity Central Fund's financial statements, which are not covered by the Fund's Report of Independent Registered Public Accounting Firm, are available on the SEC's website or upon request. |
(c) Investment made with cash collateral received from securities on loan. |
(d) Amount is stated in United States dollars unless otherwise noted. |
(e) Security or a portion of the security is on loan at period end. |
(f) Affiliated company |
(g) Security exempt from registration under Rule 144A of the Securities Act of 1933. These securities may be resold in transactions exempt from registration, normally to qualified institutional buyers. At the end of the period, the value of these securities amounted to $12,947,000 or 0.1% of net assets. |
(h) Security is perpetual in nature with no stated maturity date. |
(i) Security or a portion of the security was pledged to cover margin requirements for futures contracts. At period end, the value of securities pledged amounted to $11,590,000. |
Affiliated Central Funds |
Information regarding fiscal year to date income earned by the Fund from investments in Fidelity Central Funds is as follows: |
Fund | Income earned
(Amounts in thousands) |
Fidelity Cash Central Fund | $ 600 |
Fidelity Securities Lending Cash Central Fund | 5,278 |
Total | $ 5,878 |
Other Affiliated Issuers |
An affiliated company is a company in which the Fund has ownership of at least 5% of the voting securities. Fiscal year to date transactions with companies which are or were affiliates are as follows: |
Affiliate
(Amounts in thousands) | Value,
beginning of
period | Purchases | Sales Proceeds | Dividend Income | Value,
end of
period |
MySale Group PLC | $ - | $ 32,521 | $ - | $ - | $ 26,053 |
PAX Global Technology Ltd. | - | 39,641 | 3,956 | - | 71,203 |
Rex Bionics PLC | - | 4,037 | - | - | 3,518 |
Total | $ - | $ 76,199 | $ 3,956 | $ - | $ 100,774 |
Other Information |
Categorizations in the Schedule of Investments are based on country or territory of incorporation. |
The following is a summary of the inputs used, as of October 31, 2014, involving the Fund's assets and liabilities carried at fair value. The inputs or methodology used for valuing securities may not be an indication of the risk associated with investing in those securities. For more information on valuation inputs, and their aggregation into the levels used in the table below, please refer to the Investment Valuation section in the accompanying Notes to Financial Statements. |
Valuation Inputs at Reporting Date: |
Description
(Amounts in thousands) | Total | Level 1 | Level 2 | Level 3 |
Investments in Securities: | | | | |
Equities: | | | | |
Consumer Discretionary | $ 1,445,431 | $ 1,029,241 | $ 416,190 | $ - |
Consumer Staples | 1,177,768 | 385,016 | 792,752 | - |
Energy | 636,082 | 232,243 | 403,839 | - |
Financials | 2,262,497 | 1,051,716 | 1,210,781 | - |
Health Care | 1,634,986 | 714,402 | 920,584 | - |
Industrials | 1,109,082 | 840,362 | 268,720 | - |
Information Technology | 1,181,932 | 597,928 | 584,004 | - |
Materials | 495,841 | 296,694 | 199,147 | - |
Telecommunication Services | 437,160 | 107,224 | 329,936 | - |
Utilities | 21,191 | - | 21,191 | - |
Government Obligations | 11,590 | - | 11,590 | - |
Preferred Securities | 12,947 | - | 12,947 | - |
Money Market Funds | 620,421 | 620,421 | - | - |
Total Investments in Securities: | $ 11,046,928 | $ 5,875,247 | $ 5,171,681 | $ - |
Derivative Instruments: | | | | |
Assets | | | | |
Futures Contracts | $ 24,598 | $ 24,598 | $ - | $ - |
The following is a summary of transfers between Level 1 and Level 2 for the period ended October 31, 2014. Transfers are assumed to have occurred at the beginning of the period, and are primarily attributable to the valuation techniques used for foreign equity securities, as discussed in the accompanying Notes to Financial Statements: |
Transfers | Total (000s) |
Level 1 to Level 2 | $ 1,082,136 |
Level 2 to Level 1 | $ 0 |
Value of Derivative Instruments |
The following table is a summary of the Fund's value of derivative instruments by primary risk exposure as of October 31, 2014. For additional information on derivative instruments, please refer to the Derivative Instruments section in the accompanying Notes to Financial Statements. |
Primary Risk Exposure /
Derivative Type | Value (000s) |
| Asset | Liability |
Equity Risk | | |
Futures Contracts (a) | $ 24,598 | $ - |
Total Value of Derivatives | $ 24,598 | $ - |
(a) Reflects gross cumulative appreciation (depreciation) on futures contracts as presented in the Schedule of Investments. Only the period end receivable or payable for daily variation margin and net unrealized appreciation (depreciation) are presented in the Statement of Assets and Liabilities. |
See accompanying notes which are an integral part of the financial statements.
Annual Report
Statement of Assets and Liabilities
Amounts in thousands (except per-share amounts) | October 31, 2014 |
| | |
Assets | | |
Investment in securities, at value (including securities loaned of $50,476) - See accompanying schedule: Unaffiliated issuers (cost $9,050,379) | $ 10,325,733 | |
Fidelity Central Funds (cost $620,421) | 620,421 | |
Other affiliated issuers (cost $74,402) | 100,774 | |
Total Investments (cost $9,745,202) | | $ 11,046,928 |
Receivable for investments sold | | 41,866 |
Receivable for fund shares sold | | 6,258 |
Dividends receivable | | 19,075 |
Distributions receivable from Fidelity Central Funds | | 78 |
Receivable for daily variation margin for derivative instruments | | 23,890 |
Prepaid expenses | | 36 |
Other receivables | | 3,818 |
Total assets | | 11,141,949 |
| | |
Liabilities | | |
Payable for investments purchased | $ 408 | |
Payable for fund shares redeemed | 73,445 | |
Accrued management fee | 6,840 | |
Distribution and service plan fees payable | 112 | |
Other affiliated payables | 1,580 | |
Other payables and accrued expenses | 8,389 | |
Collateral on securities loaned, at value | 52,624 | |
Total liabilities | | 143,398 |
| | |
Net Assets | | $ 10,998,551 |
Net Assets consist of: | | |
Paid in capital | | $ 9,891,341 |
Undistributed net investment income | | 68,609 |
Accumulated undistributed net realized gain (loss) on investments and foreign currency transactions | | (278,180) |
Net unrealized appreciation (depreciation) on investments and assets and liabilities in foreign currencies | | 1,316,781 |
Net Assets | | $ 10,998,551 |
See accompanying notes which are an integral part of the financial statements.
Annual Report
Financial Statements - continued
Statement of Assets and Liabilities - continued
Amounts in thousands (except per-share amounts) | October 31, 2014 |
| | |
Calculation of Maximum Offering Price Class A:
Net Asset Value and redemption price per share ($296,718.26 ÷ 7,667.518 shares) | | $ 38.70 |
| | |
Maximum offering price per share (100/94.25 of $38.70) | | $ 41.06 |
Class T:
Net Asset Value and redemption price per share ($48,545.20 ÷ 1,263.274 shares) | | $ 38.43 |
| | |
Maximum offering price per share (100/96.50 of $38.43) | | $ 39.82 |
Class B:
Net Asset Value and offering price per share ($4,616.85 ÷ 120.484 shares)A | | $ 38.32 |
| | |
Class C:
Net Asset Value and offering price per share ($35,346.11 ÷ 924.200 shares)A | | $ 38.25 |
| | |
International Discovery:
Net Asset Value, offering price and redemption price per share ($7,464,021.58 ÷ 191,244.937 shares) | | $ 39.03 |
| | |
Class K:
Net Asset Value, offering price and redemption price per share ($2,464,322.23 ÷ 63,228.753 shares) | | $ 38.97 |
| | |
Institutional Class:
Net Asset Value, offering price and redemption price per share ($649,855.06 ÷ 16,682.058 shares) | | $ 38.96 |
| | |
Class Z:
Net Asset Value, offering price and redemption price per share ($35,125.45 ÷ 901.567 shares) | | $ 38.96 |
A Redemption price per share is equal to net asset value less any applicable contingent deferred sales charge.
See accompanying notes which are an integral part of the financial statements.
Annual Report
Statement of Operations
Amounts in thousands | Year ended October 31, 2014 |
| | |
Investment Income | | |
Dividends | | $ 259,008 |
Special dividends | | 63,816 |
Interest | | 64 |
Income from Fidelity Central Funds | | 5,878 |
Income before foreign taxes withheld | | 328,766 |
Less foreign taxes withheld | | (23,208) |
Total income | | 305,558 |
| | |
Expenses | | |
Management fee
Basic fee | $ 80,931 | |
Performance adjustment | 2,685 | |
Transfer agent fees | 17,771 | |
Distribution and service plan fees | 1,508 | |
Accounting and security lending fees | 1,856 | |
Custodian fees and expenses | 1,542 | |
Independent trustees' compensation | 48 | |
Registration fees | 223 | |
Audit | 116 | |
Legal | 40 | |
Miscellaneous | 85 | |
Total expenses before reductions | 106,805 | |
Expense reductions | (345) | 106,460 |
Net investment income (loss) | | 199,098 |
Realized and Unrealized Gain (Loss) Net realized gain (loss) on: | | |
Investment securities: | | |
Unaffiliated issuers | 740,761 | |
Other affiliated issuers | 2,158 | |
Foreign currency transactions | (1,181) | |
Futures contracts | 16,266 | |
Total net realized gain (loss) | | 758,004 |
Change in net unrealized appreciation (depreciation) on: Investment securities (net of increase in deferred foreign taxes of $7,503) | (978,230) | |
Assets and liabilities in foreign currencies | (886) | |
Futures contracts | 20,360 | |
Total change in net unrealized appreciation (depreciation) | | (958,756) |
Net gain (loss) | | (200,752) |
Net increase (decrease) in net assets resulting from operations | | $ (1,654) |
See accompanying notes which are an integral part of the financial statements.
Annual Report
Financial Statements - continued
Statement of Changes in Net Assets
Amounts in thousands | Year ended
October 31,
2014 | Year ended
October 31,
2013 |
Increase (Decrease) in Net Assets | | |
Operations | | |
Net investment income (loss) | $ 199,098 | $ 129,203 |
Net realized gain (loss) | 758,004 | 725,376 |
Change in net unrealized appreciation (depreciation) | (958,756) | 1,463,372 |
Net increase (decrease) in net assets resulting
from operations | (1,654) | 2,317,951 |
Distributions to shareholders from net investment income | (136,326) | (146,031) |
Distributions to shareholders from net realized gain | (88,586) | (8,413) |
Total distributions | (224,912) | (154,444) |
Share transactions - net increase (decrease) | (69,908) | 714,712 |
Redemption fees | 139 | 128 |
Total increase (decrease) in net assets | (296,335) | 2,878,347 |
| | |
Net Assets | | |
Beginning of period | 11,294,886 | 8,416,539 |
End of period (including undistributed net investment income of $68,609 and undistributed net investment income of $131,430, respectively) | $ 10,998,551 | $ 11,294,886 |
See accompanying notes which are an integral part of the financial statements.
Annual Report
Financial Highlights - Class A
Years ended October 31, | 2014 | 2013 | 2012 | 2011 | 2010 |
Selected Per-Share Data | | | | | |
Net asset value, beginning of period | $ 39.49 | $ 31.66 | $ 29.43 | $ 32.07 | $ 28.57 |
Income from Investment Operations | | | | | |
Net investment income (loss) C | .53 F | .34 | .41 | .42 | .31 |
Net realized and unrealized gain (loss) | (.67) | 7.97 | 2.11 | (2.52) | 3.51 |
Total from investment operations | (.14) | 8.31 | 2.52 | (2.10) | 3.82 |
Distributions from net investment income | (.33) | (.45) | (.29) | (.38) | (.28) |
Distributions from net realized gain | (.31) | (.03) | - | (.16) | (.04) |
Total distributions | (.65) I | (.48) | (.29) | (.54) | (.32) |
Redemption fees added to paid in capital C, H | - | - | - | - | - |
Net asset value, end of period | $ 38.70 | $ 39.49 | $ 31.66 | $ 29.43 | $ 32.07 |
Total ReturnA, B | (.36)% | 26.59% | 8.70% | (6.71)% | 13.43% |
Ratios to Average Net Assets D, G | | | | | |
Expenses before reductions | 1.28% | 1.35% | 1.34% | 1.30% | 1.33% |
Expenses net of fee waivers, if any | 1.28% | 1.35% | 1.34% | 1.29% | 1.33% |
Expenses net of all reductions | 1.28% | 1.33% | 1.31% | 1.25% | 1.28% |
Net investment income (loss) | 1.35% F | .97% | 1.41% | 1.31% | 1.06% |
Supplemental Data | | | | | |
Net assets, end of period (in millions) | $ 297 | $ 347 | $ 299 | $ 320 | $ 392 |
Portfolio turnover rate E | 57% | 65% | 68% | 75% | 82% |
A Total returns would have been lower if certain expenses had not been reduced during the applicable periods shown.
B Total returns do not include the effect of the sales charges.
C Calculated based on average shares outstanding during the period.
D Fees and expenses of any underlying Fidelity Central Funds are not included in the Fund's expense ratio. The Fund indirectly bears its proportionate share of the expenses of any underlying Fidelity Central Funds.
E Amount does not include the portfolio activity of any underlying Fidelity Central Funds.
F Investment income per share reflects a large, non-recurring dividend which amounted to $.22 per share. Excluding this non-recurring dividend, the ratio of net investment income (loss) to average net assets would have been .80%.
G Expense ratios reflect operating expenses of the class. Expenses before reductions do not reflect amounts reimbursed by the investment adviser or reductions from brokerage service arrangements or reductions from other expense offset arrangements and do not represent the amount paid by the class during periods when reimbursements or reductions occur. Expenses net of fee waivers reflect expenses after reimbursement by the investment adviser but prior to reductions from brokerage service arrangements or other expense offset arrangements. Expenses net of all reductions represent the net expenses paid by the class.
H Amount represents less than $.01 per share.
I Total distributions of $.65 per share is comprised of distributions from net investment income of $.334 and distributions from net realized gain of $.311 per share.
See accompanying notes which are an integral part of the financial statements.
Annual Report
Financial Highlights - Class T
Years ended October 31, | 2014 | 2013 | 2012 | 2011 | 2010 |
Selected Per-Share Data | | | | | |
Net asset value, beginning of period | $ 39.23 | $ 31.42 | $ 29.18 | $ 31.81 | $ 28.35 |
Income from Investment Operations | | | | | |
Net investment income (loss) C | .44 F | .26 | .34 | .34 | .23 |
Net realized and unrealized gain (loss) | (.68) | 7.92 | 2.09 | (2.51) | 3.48 |
Total from investment operations | (.24) | 8.18 | 2.43 | (2.17) | 3.71 |
Distributions from net investment income | (.25) | (.34) | (.19) | (.30) | (.21) |
Distributions from net realized gain | (.31) | (.03) | - | (.16) | (.04) |
Total distributions | (.56) | (.37) | (.19) | (.46) | (.25) |
Redemption fees added to paid in capital C, H | - | - | - | - | - |
Net asset value, end of period | $ 38.43 | $ 39.23 | $ 31.42 | $ 29.18 | $ 31.81 |
Total ReturnA, B | (.60)% | 26.31% | 8.41% | (6.96)% | 13.14% |
Ratios to Average Net Assets D, G | | | | | |
Expenses before reductions | 1.51% | 1.59% | 1.59% | 1.56% | 1.60% |
Expenses net of fee waivers, if any | 1.51% | 1.59% | 1.59% | 1.55% | 1.60% |
Expenses net of all reductions | 1.51% | 1.57% | 1.56% | 1.51% | 1.56% |
Net investment income (loss) | 1.11% F | .73% | 1.16% | 1.05% | .79% |
Supplemental Data | | | | | |
Net assets, end of period (in millions) | $ 49 | $ 53 | $ 46 | $ 61 | $ 92 |
Portfolio turnover rateE | 57% | 65% | 68% | 75% | 82% |
A Total returns would have been lower if certain expenses had not been reduced during the applicable periods shown.
B Total returns do not include the effect of the sales charges.
C Calculated based on average shares outstanding during the period.
D Fees and expenses of any underlying Fidelity Central Funds are not included in the Fund's expense ratio. The Fund indirectly bears its proportionate share of the expenses of any underlying Fidelity Central Funds.
E Amount does not include the portfolio activity of any underlying Fidelity Central Funds.
F Investment income per share reflects large, non-recurring dividend which amounted to $.21 per share. Excluding this non-recurring dividend, the ratio of net investment income (loss) to average net assets would have been .56%.
G Expense ratios reflect operating expenses of the class. Expenses before reductions do not reflect amounts reimbursed by the investment adviser or reductions from brokerage service arrangements or reductions from other expense offset arrangements and do not represent the amount paid by the class during periods when reimbursements or reductions occur. Expenses net of fee waivers reflect expenses after reimbursement by the investment adviser but prior to reductions from brokerage service arrangements or other expense offset arrangements. Expenses net of all reductions represent the net expenses paid by the class.
H Amount represents less than $.01 per share.
See accompanying notes which are an integral part of the financial statements.
Annual Report
Financial Highlights - Class B
Years ended October 31, | 2014 | 2013 | 2012 | 2011 | 2010 |
Selected Per-Share Data | | | | | |
Net asset value, beginning of period | $ 39.08 | $ 31.28 | $ 29.02 | $ 31.60 | $ 28.18 |
Income from Investment Operations | | | | | |
Net investment income (loss) C | .22 F | .08 | .19 | .17 | .08 |
Net realized and unrealized gain (loss) | (.66) | 7.90 | 2.09 | (2.48) | 3.44 |
Total from investment operations | (.44) | 7.98 | 2.28 | (2.31) | 3.52 |
Distributions from net investment income | (.01) | (.15) | (.02) | (.12) | (.06) |
Distributions from net realized gain | (.31) | (.03) | - | (.16) | (.04) |
Total distributions | (.32) | (.18) | (.02) | (.27) I | (.10) |
Redemption fees added to paid in capital C, H | - | - | - | - | - |
Net asset value, end of period | $ 38.32 | $ 39.08 | $ 31.28 | $ 29.02 | $ 31.60 |
Total ReturnA, B | (1.12)% | 25.64% | 7.85% | (7.39)% | 12.52% |
Ratios to Average Net Assets D, G | | | | | |
Expenses before reductions | 2.06% | 2.10% | 2.09% | 2.06% | 2.12% |
Expenses net of fee waivers, if any | 2.06% | 2.10% | 2.09% | 2.06% | 2.12% |
Expenses net of all reductions | 2.05% | 2.08% | 2.06% | 2.02% | 2.08% |
Net investment income (loss) | .57% F | .22% | .66% | .54% | .27% |
Supplemental Data | | | | | |
Net assets, end of period (in millions) | $ 5 | $ 7 | $ 8 | $ 10 | $ 14 |
Portfolio turnover rateE | 57% | 65% | 68% | 75% | 82% |
A Total returns would have been lower if certain expenses had not been reduced during the applicable periods shown.
B Total returns do not include the effect of the contingent deferred sales charge.
C Calculated based on average shares outstanding during the period.
D Fees and expenses of any underlying Fidelity Central Funds are not included in the Fund's expense ratio. The Fund indirectly bears its proportionate share of the expenses of any underlying Fidelity Central Funds.
E Amount does not include the portfolio activity of any underlying Fidelity Central Funds.
F Investment income per share reflects a large, non-recurring dividend which amounted to $.21 per share. Excluding this non-recurring dividend, the ratio of net investment income (loss) to average net assets would have been .02%.
G Expense ratios reflect operating expenses of the class. Expenses before reductions do not reflect amounts reimbursed by the investment adviser or reductions from brokerage service arrangements or reductions from other expense offset arrangements and do not represent the amount paid by the class during periods when reimbursements or reductions occur. Expenses net of fee waivers reflect expenses after reimbursement by the investment adviser but prior to reductions from brokerage service arrangements or other expense offset arrangements. Expenses net of all reductions represent the net expenses paid by the class.
H Amount represents less than $.01 per share.
I Total distributions of $.27 per share is comprised of distributions from net investment income of $.115 and distributions from net realized gain of $.155 per share.
See accompanying notes which are an integral part of the financial statements.
Annual Report
Financial Highlights - Class C
Years ended October 31, | 2014 | 2013 | 2012 | 2011 | 2010 |
Selected Per-Share Data | | | | | |
Net asset value, beginning of period | $ 39.07 | $ 31.32 | $ 29.08 | $ 31.68 | $ 28.23 |
Income from Investment Operations | | | | | |
Net investment income (loss) C | .23 F | .08 | .19 | .18 | .09 |
Net realized and unrealized gain (loss) | (.66) | 7.90 | 2.09 | (2.49) | 3.45 |
Total from investment operations | (.43) | 7.98 | 2.28 | (2.31) | 3.54 |
Distributions from net investment income | (.08) | (.20) | (.04) | (.14) | (.05) |
Distributions from net realized gain | (.31) | (.03) | - | (.16) | (.04) |
Total distributions | (.39) | (.23) | (.04) | (.29) I | (.09) |
Redemption fees added to paid in capital C, H | - | - | - | - | - |
Net asset value, end of period | $ 38.25 | $ 39.07 | $ 31.32 | $ 29.08 | $ 31.68 |
Total ReturnA, B | (1.10)% | 25.65% | 7.86% | (7.37)% | 12.54% |
Ratios to Average Net Assets D, G | | | | | |
Expenses before reductions | 2.03% | 2.10% | 2.09% | 2.05% | 2.09% |
Expenses net of fee waivers, if any | 2.03% | 2.09% | 2.09% | 2.04% | 2.09% |
Expenses net of all reductions | 2.02% | 2.07% | 2.06% | 2.00% | 2.05% |
Net investment income (loss) | .60% F | .23% | .66% | .56% | .30% |
Supplemental Data | | | | | |
Net assets, end of period (in millions) | $ 35 | $ 36 | $ 30 | $ 33 | $ 44 |
Portfolio turnover rateE | 57% | 65% | 68% | 75% | 82% |
A Total returns would have been lower if certain expenses had not been reduced during the applicable periods shown.
B Total returns do not include the effect of the contingent deferred sales charge.
C Calculated based on average shares outstanding during the period.
D Fees and expenses of any underlying Fidelity Central Funds are not included in the Fund's expense ratio. The Fund indirectly bears its proportionate share of the expenses of any underlying Fidelity Central Funds.
E Amount does not include the portfolio activity of any underlying Fidelity Central Funds.
F Investment income per share reflects a large, non-recurring dividend which amounted to $.21 per share. Excluding this non-recurring dividend, the ratio of net investment income (loss) to average net assets would have been .05%.
G Expense ratios reflect operating expenses of the class. Expenses before reductions do not reflect amounts reimbursed by the investment adviser or reductions from brokerage service arrangements or reductions from other expense offset arrangements and do not represent the amount paid by the class during periods when reimbursements or reductions occur. Expenses net of fee waivers reflect expenses after reimbursement by the investment adviser but prior to reductions from brokerage service arrangements or other expense offset arrangements. Expenses net of all reductions represent the net expenses paid by the class.
H Amount represents less than $.01 per share.
I Total distributions of $.29 per share is comprised of distributions from net investment income of $.137 and distributions from net realized gain of $.155 per share.
See accompanying notes which are an integral part of the financial statements.
Annual Report
Financial Highlights - International Discovery
Years ended October 31, | 2014 | 2013 | 2012 | 2011 | 2010 |
Selected Per-Share Data | | | | | |
Net asset value, beginning of period | $ 39.82 | $ 31.91 | $ 29.69 | $ 32.34 | $ 28.79 |
Income from Investment Operations | | | | | |
Net investment income (loss) B | .67 E | .47 | .51 | .53 | .40 |
Net realized and unrealized gain (loss) | (.68) | 8.02 | 2.12 | (2.54) | 3.54 |
Total from investment operations | (.01) | 8.49 | 2.63 | (2.01) | 3.94 |
Distributions from net investment income | (.47) | (.55) | (.41) | (.48) | (.35) |
Distributions from net realized gain | (.31) | (.03) | - | (.16) | (.04) |
Total distributions | (.78) | (.58) | (.41) | (.64) | (.39) |
Redemption fees added to paid in capital B, G | - | - | - | - | - |
Net asset value, end of period | $ 39.03 | $ 39.82 | $ 31.91 | $ 29.69 | $ 32.34 |
Total ReturnA | (.01)% | 27.03% | 9.03% | (6.39)% | 13.76% |
Ratios to Average Net Assets C, F | | | | | |
Expenses before reductions | .93% | 1.00% | 1.01% | .97% | 1.05% |
Expenses net of fee waivers, if any | .93% | 1.00% | 1.01% | .96% | 1.05% |
Expenses net of all reductions | .93% | .98% | .98% | .92% | 1.00% |
Net investment income (loss) | 1.69% E | 1.32% | 1.73% | 1.64% | 1.35% |
Supplemental Data | | | | | |
Net assets, end of period (in millions) | $ 7,464 | $ 7,800 | $ 5,965 | $ 6,806 | $ 8,133 |
Portfolio turnover rateD | 57% | 65% | 68% | 75% | 82% |
A Total returns would have been lower if certain expenses had not been reduced during the applicable periods shown.
B Calculated based on average shares outstanding during the period.
C Fees and expenses of any underlying Fidelity Central Funds are not included in the Fund's expense ratio. The Fund indirectly bears its proportionate share of the expenses of any underlying Fidelity Central Funds.
D Amount does not include the portfolio activity of any underlying Fidelity Central Funds.
E Investment income per share reflects a large, non-recurring dividend which amounted to $.22 per share. Excluding this non-recurring dividend, the ratio of net investment income (loss) to average net assets would have been 1.15%.
F Expense ratios reflect operating expenses of the class. Expenses before reductions do not reflect amounts reimbursed by the investment adviser or reductions from brokerage service arrangements or reductions from other expense offset arrangements and do not represent the amount paid by the class during periods when reimbursements or reductions occur. Expenses net of fee waivers reflect expenses after reimbursement by the investment adviser but prior to reductions from brokerage service arrangements or other expense offset arrangements. Expenses net of all reductions represent the net expenses paid by the class.
G Amount represents less than $.01 per share.
See accompanying notes which are an integral part of the financial statements.
Annual Report
Financial Highlights - Class K
Years ended October 31, | 2014 | 2013 | 2012 | 2011 | 2010 |
Selected Per-Share Data | | | | | |
Net asset value, beginning of period | $ 39.76 | $ 31.87 | $ 29.66 | $ 32.32 | $ 28.78 |
Income from Investment Operations | | | | | |
Net investment income (loss) B | .72 E | .52 | .57 | .58 | .46 |
Net realized and unrealized gain (loss) | (.67) | 8.01 | 2.11 | (2.54) | 3.53 |
Total from investment operations | .05 | 8.53 | 2.68 | (1.96) | 3.99 |
Distributions from net investment income | (.53) | (.61) | (.47) | (.55) | (.41) |
Distributions from net realized gain | (.31) | (.03) | - | (.16) | (.04) |
Total distributions | (.84) | (.64) | (.47) | (.70) H | (.45) |
Redemption fees added to paid in capital B, G | - | - | - | - | - |
Net asset value, end of period | $ 38.97 | $ 39.76 | $ 31.87 | $ 29.66 | $ 32.32 |
Total ReturnA | .13% | 27.23% | 9.24% | (6.24)% | 13.96% |
Ratios to Average Net Assets C, F | | | | | |
Expenses before reductions | .80% | .85% | .83% | .80% | .84% |
Expenses net of fee waivers, if any | .80% | .85% | .83% | .79% | .84% |
Expenses net of all reductions | .79% | .83% | .80% | .75% | .79% |
Net investment income (loss) | 1.83% E | 1.47% | 1.91% | 1.81% | 1.55% |
Supplemental Data | | | | | |
Net assets, end of period (in millions) | $ 2,464 | $ 2,576 | $ 1,776 | $ 1,245 | $ 1,078 |
Portfolio turnover rateD | 57% | 65% | 68% | 75% | 82% |
A Total returns would have been lower if certain expenses had not been reduced during the applicable periods shown.
B Calculated based on average shares outstanding during the period.
C Fees and expenses of any underlying Fidelity Central Funds are not included in the Fund's expense ratio. The Fund indirectly bears its proportionate share of the expenses of any underlying Fidelity Central Funds.
D Amount does not include the portfolio activity of any underlying Fidelity Central Funds.
E Investment income per share reflects a large, non-recurring dividend which amounted to $.22 per share. Excluding this non-recurring dividend, the ratio of net investment income (loss) to average net assets would have been 1.28%.
F Expense ratios reflect operating expenses of the class. Expenses before reductions do not reflect amounts reimbursed by the investment adviser or reductions from brokerage service arrangements or reductions from other expense offset arrangements and do not represent the amount paid by the class during periods when reimbursements or reductions occur. Expenses net of fee waivers reflect expenses after reimbursement by the investment adviser but prior to reductions from brokerage service arrangements or other expense offset arrangements. Expenses net of all reductions represent the net expenses paid by the class.
G Amount represents less than $.01 per share.
H Total distributions of $.70 per share is comprised of distributions from net investment income of $.548 and distributions from net realized gain of $.155 per share.
See accompanying notes which are an integral part of the financial statements.
Annual Report
Financial Highlights - Institutional Class
Years ended October 31, | 2014 | 2013 | 2012 | 2011 | 2010 |
Selected Per-Share Data | | | | | |
Net asset value, beginning of period | $ 39.76 | $ 31.87 | $ 29.65 | $ 32.31 | $ 28.77 |
Income from Investment Operations | | | | | |
Net investment income (loss) B | .67 E | .47 | .52 | .54 | .41 |
Net realized and unrealized gain (loss) | (.68) | 8.01 | 2.11 | (2.55) | 3.55 |
Total from investment operations | (.01) | 8.48 | 2.63 | (2.01) | 3.96 |
Distributions from net investment income | (.48) | (.56) | (.41) | (.50) | (.38) |
Distributions from net realized gain | (.31) | (.03) | - | (.16) | (.04) |
Total distributions | (.79) | (.59) | (.41) | (.65) H | (.42) |
Redemption fees added to paid in capital B, G | - | - | - | - | - |
Net asset value, end of period | $ 38.96 | $ 39.76 | $ 31.87 | $ 29.65 | $ 32.31 |
Total ReturnA | (.01)% | 27.03% | 9.07% | (6.39)% | 13.84% |
Ratios to Average Net Assets C, F | | | | | |
Expenses before reductions | .93% | 1.00% | 1.00% | .95% | .99% |
Expenses net of fee waivers, if any | .93% | 1.00% | 1.00% | .94% | .99% |
Expenses net of all reductions | .93% | .97% | .97% | .90% | .95% |
Net investment income (loss) | 1.69% E | 1.33% | 1.75% | 1.66% | 1.40% |
Supplemental Data | | | | | |
Net assets, end of period (in millions) | $ 650 | $ 476 | $ 294 | $ 278 | $ 319 |
Portfolio turnover rateD | 57% | 65% | 68% | 75% | 82% |
A Total returns would have been lower if certain expenses had not been reduced during the applicable periods shown.
B Calculated based on average shares outstanding during the period.
C Fees and expenses of any underlying Fidelity Central Funds are not included in the Fund's expense ratio. The Fund indirectly bears its proportionate share of the expenses of any underlying Fidelity Central Funds.
D Amount does not include the portfolio activity of any underlying Fidelity Central Funds.
E Investment income per share reflects a large, non-recurring dividend which amounted to $.22 per share. Excluding this non-recurring dividend, the ratio of net investment income (loss) to average net assets would have been 1.14%.
F Expense ratios reflect operating expenses of the class. Expenses before reductions do not reflect amounts reimbursed by the investment adviser or reductions from brokerage service arrangements or reductions from other expense offset arrangements and do not represent the amount paid by the class during periods when reimbursements or reductions occur. Expenses net of fee waivers reflect expenses after reimbursement by the investment adviser but prior to reductions from brokerage service arrangements or other expense offset arrangements. Expenses net of all reductions represent the net expenses paid by the class.
G Amount represents less than $.01 per share.
H Total distributions of $.65 per share is comprised of distributions from net investment income of $.497 and distributions from net realized gain of $.155 per share.
See accompanying notes which are an integral part of the financial statements.
Annual Report
Financial Highlights - Class Z
Years ended October 31, | 2014 | 2013 H |
Selected Per-Share Data | | |
Net asset value, beginning of period | $ 39.77 | $ 37.22 |
Income from Investment Operations | | |
Net investment income (loss) D | .72 G | .07 |
Net realized and unrealized gain (loss) | (.68) | 2.48 |
Total from investment operations | .04 | 2.55 |
Distributions from net investment income | (.54) | - |
Distributions from net realized gain | (.31) | - |
Total distributions | (.85) | - |
Redemption fees added to paid in capital D, J | - | - |
Net asset value, end of period | $ 38.96 | $ 39.77 |
Total ReturnB, C | .12% | 6.85% |
Ratios to Average Net Assets E, I | | |
Expenses before reductions | .80% | .85%A |
Expenses net of fee waivers, if any | .80% | .85%A |
Expenses net of all reductions | .79% | .83%A |
Net investment income (loss) | 1.83% G | .76% A |
Supplemental Data | | |
Net assets, end of period (000 omitted) | $ 35,125 | $ 107 |
Portfolio turnover rateF | 57% | 65% |
A Annualized
B Total returns for periods of less than one year are not annualized.
C Total returns would have been lower if certain expenses had not been reduced during the applicable periods shown.
D Calculated based on average shares outstanding during the period.
E Fees and expenses of any underlying Fidelity Central Funds are not included in the Fund's expense ratio. The Fund indirectly bears its proportionate share of the expenses of any underlying Fidelity Central Funds.
F Amount does not include the portfolio activity of any underlying Fidelity Central Funds.
G Investment income per share reflects a large, non-recurring dividend which amounted to $.21 per share. Excluding this non-recurring dividend, the ratio of net investment income (loss) to average net assets would have been 1.28%.
H For the period August 13, 2013 (commencement of sale of shares) to October 31, 2013.
I Expense ratios reflect operating expenses of the class. Expenses before reductions do not reflect amounts reimbursed by the investment adviser or reductions from brokerage service arrangements or reductions from other expense offset arrangements and do not represent the amount paid by the class during periods when reimbursements or reductions occur. Expenses net of fee waivers reflect expenses after reimbursement by the investment adviser but prior to reductions from brokerage service arrangements or other expense offset arrangements. Expenses net of all reductions represent the net expenses paid by the class.
J Amount represents less than $.01 per share.
See accompanying notes which are an integral part of the financial statements.
Annual Report
Notes to Financial Statements
For the period ended October 31, 2014
(Amounts in thousands except percentages)
1. Organization.
Fidelity International Discovery Fund (the Fund) is a fund of Fidelity Investment Trust (the Trust) and is authorized to issue an unlimited number of shares. The Trust is registered under the Investment Company Act of 1940, as amended (the 1940 Act), as an open-end management investment company organized as a Massachusetts business trust. The Fund offers Class A, Class T, Class C, International Discovery, Class K, Institutional Class and Class Z shares, each of which, along with Class B shares, has equal rights as to assets and voting privileges. Class B shares are closed to new accounts and additional purchases, except for exchanges and reinvestments. Each class has exclusive voting rights with respect to matters that affect that class. Class B shares will automatically convert to Class A shares after a holding period of seven years from the initial date of purchase.
2. Investments in Fidelity Central Funds.
The Fund invests in Fidelity Central Funds, which are open-end investment companies generally available only to other investment companies and accounts managed by the investment adviser and its affiliates. The Fund's Schedule of Investments lists each of the Fidelity Central Funds held as of period end, if any, as an investment of the Fund, but does not include the underlying holdings of each Fidelity Central Fund. As an Investing Fund, the Fund indirectly bears its proportionate share of the expenses of the underlying Fidelity Central Funds.
The Money Market Central Funds seek preservation of capital and current income and are managed by Fidelity Investments Money Management, Inc. (FIMM), an affiliate of the investment adviser. Annualized expenses of the Money Market Central Funds as of their most recent shareholder report date are less than .01%.
A complete unaudited list of holdings for each Fidelity Central Fund is available upon request or at the Securities and Exchange Commission (the SEC) website at www.sec.gov. In addition, the financial statements of the Fidelity Central Funds, which are not covered by the Fund's Report of Independent Registered Public Accounting Firm, are available on the SEC website or upon request.
3. Significant Accounting Policies.
The financial statements have been prepared in conformity with accounting principles generally accepted in the United States of America (GAAP), which require management to make certain estimates and assumptions at the date of the financial statements. Actual results could differ from those estimates. Subsequent events, if any, through the date that the financial statements were issued have been evaluated in the preparation of
Annual Report
3. Significant Accounting Policies - continued
the financial statements. The following summarizes the significant accounting policies of the Fund:
Investment Valuation. Investments are valued as of 4:00 p.m. Eastern time on the last calendar day of the period. In accordance with valuation policies and procedures approved by the Board of Trustees (the Board), the Fund attempts to obtain prices from one or more third party pricing vendors or brokers to value its investments. When current market prices, quotations or currency exchange rates are not readily available or reliable, investments will be fair valued in good faith by the Fidelity Management & Research Company (FMR) Fair Value Committee (the Committee), in accordance with procedures adopted by the Board. Factors used in determining fair value vary by investment type and may include market or investment specific events, changes in interest rates and credit quality. The frequency with which these procedures are used cannot be predicted and they may be utilized to a significant extent. The Committee oversees the Fund's valuation policies and procedures and is responsible for approving and reporting to the Board all fair value determinations.
The Fund categorizes the inputs to valuation techniques used to value its investments into a disclosure hierarchy consisting of three levels as shown below:
Level 1 - quoted prices in active markets for identical investments
Level 2 - other significant observable inputs (including quoted prices for similar investments, interest rates, prepayment speeds, etc.)
Level 3 - unobservable inputs (including the Fund's own assumptions based on the best information available)
Valuation techniques used to value the Fund's investments by major category are as follows:
Equity securities, including restricted securities, for which market quotations are readily available, are valued at the last reported sale price or official closing price as reported by a third party pricing vendor on the primary market or exchange on which they are traded and are categorized as Level 1 in the hierarchy. In the event there were no sales during the day or closing prices are not available, securities are valued at the last quoted bid price or may be valued using the last available price and are generally categorized as Level 2 in the hierarchy. For foreign equity securities, when market or security specific events arise, comparisons to the valuation of American Depositary Receipts (ADRs), futures contracts, Exchange-Traded Funds (ETFs) and certain indexes as well as quoted prices for similar securities may be used and would be categorized as Level 2 in the hierarchy. Utilizing these techniques may result in transfers between Level 1 and Level 2. For equity securities, including restricted securities, where observable inputs are limited, assumptions about market activity and risk are used and these securities may be categorized as Level 3 in the hierarchy.
Annual Report
Notes to Financial Statements - continued
(Amounts in thousands except percentages)
3. Significant Accounting Policies - continued
Investment Valuation - continued
Debt securities, including restricted securities, are valued based on evaluated prices received from third party pricing vendors or from brokers who make markets in such securities. Preferred securities and U.S. government and government agency obligations are valued by pricing vendors who utilize matrix pricing which considers yield or price of bonds of comparable quality, coupon, maturity and type or by broker-supplied prices. When independent prices are unavailable or unreliable, debt securities may be valued utilizing pricing methodologies which consider similar factors that would be used by third party pricing vendors. Debt securities are generally categorized as Level 2 in the hierarchy but may be Level 3 depending on the circumstances.
Futures contracts are valued at the settlement price established each day by the board of trade or exchange on which they are traded and are categorized as Level 1 in the hierarchy. Investments in open-end mutual funds, including the Fidelity Central Funds, are valued at their closing net asset value (NAV) each business day and are categorized as Level 1 in the hierarchy.
Changes in valuation techniques may result in transfers in or out of an assigned level within the disclosure hierarchy. The aggregate value of investments by input level, as of October 31, 2014, including information on transfers between Levels 1 and 2 is included at the end of the Fund's Schedule of Investments.
Foreign Currency. The Fund may use foreign currency contracts to facilitate transactions in foreign-denominated securities. Gains and losses from these transactions may arise from changes in the value of the foreign currency or if the counterparties do not perform under the contracts' terms.
Foreign-denominated assets, including investment securities, and liabilities are translated into U.S. dollars at the exchange rates at period end. Purchases and sales of investment securities, income and dividends received and expenses denominated in foreign currencies are translated into U.S. dollars at the exchange rate in effect on the transaction date.
The effects of exchange rate fluctuations on investments are included with the net realized and unrealized gain (loss) on investment securities. Other foreign currency transactions resulting in realized and unrealized gain (loss) are disclosed separately.
Investment Transactions and Income. For financial reporting purposes, the Fund's investment holdings and NAV include trades executed through the end of the last business day of the period. The NAV per share for processing shareholder transactions is calculated as of the close of business of the New York Stock Exchange (NYSE), normally 4:00 p.m. Eastern time and includes trades executed through the end of the prior business day. Gains and losses on securities sold are determined on the basis of identified
Annual Report
3. Significant Accounting Policies - continued
Investment Transactions and Income - continued
cost and may include proceeds received from litigation. Dividend income is recorded on the ex-dividend date, except for certain dividends from foreign securities where the ex-dividend date may have passed, which are recorded as soon as the Fund is informed of the ex-dividend date. Non-cash dividends included in dividend income, if any, are recorded at the fair market value of the securities received. Income and capital gain distributions from Fidelity Central Funds, if any, are recorded on the ex-dividend date. Large, non-recurring dividends recognized by the Fund are presented separately on the Statement of Operations as "Special Dividends" and the impact of these dividends is presented in the Financial Highlights. Interest income is accrued as earned and includes coupon interest and amortization of premium and accretion of discount on debt securities as applicable. Investment income is recorded net of foreign taxes withheld where recovery of such taxes is uncertain.
Class Allocations and Expenses. Investment income, realized and unrealized capital gains and losses, common expenses of the Fund, and certain fund-level expense reductions, if any, are allocated daily on a pro-rata basis to each class based on the relative net assets of each class to the total net assets of the Fund. Each class differs with respect to transfer agent and distribution and service plan fees incurred. Certain expense reductions may also differ by class. For the reporting period, the allocated portion of income and expenses to each class as a percent of its average net assets may vary due to the timing of recording these transactions in relation to fluctuating net assets of the classes. Expenses directly attributable to a fund are charged to that fund. Expenses attributable to more than one fund are allocated among the respective funds on the basis of relative net assets or other appropriate methods. Expense estimates are accrued in the period to which they relate and adjustments are made when actual amounts are known.
Deferred Trustee Compensation. Under a Deferred Compensation Plan (the Plan), independent Trustees may elect to defer receipt of a portion of their annual compensation. Deferred amounts are invested in a cross-section of Fidelity funds, are marked-to-market and remain in the Fund until distributed in accordance with the Plan. The investment of deferred amounts and the offsetting payable to the Trustees are included in the accompanying Statement of Assets and Liabilities.
Income Tax Information and Distributions to Shareholders. Each year, the Fund intends to qualify as a regulated investment company under Subchapter M of the Internal Revenue Code, including distributing substantially all of its taxable income and realized gains. As a result, no provision for U.S. Federal income taxes is required. As of October 31, 2014, the Fund did not have any unrecognized tax benefits in the financial statements; nor is the Fund aware of any tax positions for which it is reasonably possible that the total amounts of unrecognized tax benefits will significantly change in the next
Annual Report
Notes to Financial Statements - continued
(Amounts in thousands except percentages)
3. Significant Accounting Policies - continued
Income Tax Information and Distributions to Shareholders - continued
twelve months. The Fund files a U.S. federal tax return, in addition to state and local tax returns as required. The Fund's federal income tax returns are subject to examination by the Internal Revenue Service (IRS) for a period of three fiscal years after they are filed. State and local tax returns may be subject to examination for an additional fiscal year depending on the jurisdiction. Foreign taxes are provided for based on the Fund's understanding of the tax rules and rates that exist in the foreign markets in which it invests. The Fund is subject to a tax imposed on capital gains by certain countries in which it invests. An estimated deferred tax liability for net unrealized appreciation on the applicable securities is included in Other payables and accrued expenses on the Statement of Assets & Liabilities.
Distributions are declared and recorded on the ex-dividend date. Income dividends and capital gain distributions are declared separately for each class. Income and capital gain distributions are determined in accordance with income tax regulations, which may differ from GAAP. In addition, the Fund claimed a portion of the payment made to redeeming shareholders as a distribution for income tax purposes.
Capital accounts within the financial statements are adjusted for permanent book-tax differences. These adjustments have no impact on net assets or the results of operations. Capital accounts are not adjusted for temporary book-tax differences which will reverse in a subsequent period.
Book-tax differences are primarily due to futures contracts, foreign currency transactions, passive foreign investment companies (PFIC), market discount, deferred trustees compensation, capital loss carryforwards and losses deferred due to wash sales.
The federal tax cost of investment securities and unrealized appreciation (depreciation) as of period end were as follows:
Gross unrealized appreciation | $ 1,714,728 |
Gross unrealized depreciation | (439,338) |
Net unrealized appreciation (depreciation) on securities | $ 1,275,390 |
| |
Tax Cost | $ 9,771,538 |
The tax-based components of distributable earnings as of period end were as follows:
Undistributed ordinary income | $ 68,892 |
Capital loss carryforward | $ (227,245) |
Net unrealized appreciation (depreciation) on securities and other investments | $ 1,273,334 |
Annual Report
3. Significant Accounting Policies - continued
Income Tax Information and Distributions to Shareholders - continued
Capital loss carryforwards are only available to offset future capital gains of the Fund to the extent provided by regulations and may be limited. Under the Regulated Investment Company Modernization Act of 2010 (the Act), the Fund is permitted to carry forward capital losses incurred in taxable years beginning after December 22, 2010 for an unlimited period and such capital losses are required to be used prior to any losses that expire. The capital loss carryforward information presented below, including any applicable limitation, is estimated as of fiscal period end and is subject to adjustment.
Fiscal year of expiration | |
2017 | $ (227,245) |
The tax character of distributions paid was as follows:
| October 31, 2014 | October 31, 2013 |
Ordinary Income | $ 224,912 | $ 154,444 |
Short-Term Trading (Redemption) Fees. Shares held by investors in the Fund less than 30 days may have been subject to a redemption fee equal to 1.00% of the NAV of shares redeemed. All redemption fees, which reduce the proceeds of the shareholder redemption, are retained by the Fund and accounted for as an addition to paid in capital.
Restricted Securities. The Fund may invest in securities that are subject to legal or contractual restrictions on resale. These securities generally may be resold in transactions exempt from registration or to the public if the securities are registered. Disposal of these securities may involve time-consuming negotiations and expense, and prompt sale at an acceptable price may be difficult. Information regarding restricted securities is included at the end of the Fund's Schedule of Investments.
New Accounting Pronouncement. In June 2014, the Financial Accounting Standards Board issued Accounting Standard Update No. 2014-11, Repurchase-to-Maturity Transactions, Repurchase Financings, and Disclosures. The Update amends the accounting for certain repurchase agreements and expands disclosure requirements for reverse repurchase agreements, securities lending and other similar transactions. The disclosure requirements are effective for annual and interim reporting periods beginning after December 15, 2014. Management is currently evaluating the impact of the Update on the Fund's financial statements and related disclosures.
4. Derivative Instruments.
Risk Exposures and the Use of Derivative Instruments. The Fund's investment objective allows the Fund to enter into various types of derivative contracts, including
Annual Report
Notes to Financial Statements - continued
(Amounts in thousands except percentages)
4. Derivative Instruments - continued
Risk Exposures and the Use of Derivative Instruments - continued
futures contracts. Derivatives are investments whose value is primarily derived from underlying assets, indices or reference rates and may be transacted on an exchange or over-the-counter (OTC). Derivatives may involve a future commitment to buy or sell a specified asset based on specified terms, to exchange future cash flows at periodic intervals based on a notional principal amount, or for one party to make one or more payments upon the occurrence of specified events in exchange for periodic payments from the other party.
The Fund used derivatives to increase returns and to manage exposure to certain risks as defined below. The success of any strategy involving derivatives depends on analysis of numerous economic factors, and if the strategies for investment do not work as intended, the Fund may not achieve its objectives.
The Fund's use of derivatives increased or decreased its exposure to the following risk:
Equity Risk | Equity risk relates to the fluctuations in the value of financial instruments as a result of changes in market prices (other than those arising from interest rate risk or foreign exchange risk), whether caused by factors specific to an individual investment, its issuer, or all factors affecting all instruments traded in a market or market segment. |
The Fund is also exposed to additional risks from investing in derivatives, such as liquidity risk and counterparty credit risk. Liquidity risk is the risk that the Fund will be unable to close out the derivative in the open market in a timely manner. Counterparty credit risk is the risk that the counterparty will not be able to fulfill its obligation to the Fund. Counterparty credit risk related to exchange-traded futures contracts may be mitigated by the protection provided by the exchange on which they trade.
Investing in derivatives may involve greater risks than investing in the underlying assets directly and, to varying degrees, may involve risk of loss in excess of any initial investment and collateral received and amounts recognized in the Statement of Assets and Liabilities. In addition, there may be the risk that the change in value of the derivative contract does not correspond to the change in value of the underlying instrument.
Futures Contracts. A futures contract is an agreement between two parties to buy or sell a specified underlying instrument for a fixed price at a specified future date. The Fund used futures contracts to manage its exposure to the stock market.
Upon entering into a futures contract, a fund is required to deposit either cash or securities (initial margin) with a clearing broker in an amount equal to a certain percentage of the face value of the contract. Futures contracts are marked-to-market daily and subsequent daily payments variation margin are made or received by a fund depending on the
Annual Report
4. Derivative Instruments - continued
Futures Contracts - continued
daily fluctuations in the value of the futures contracts and are recorded as unrealized appreciation or (depreciation). This receivable and/or payable, if any, is included in daily variation margin for derivative instruments in the Statement of Assets and Liabilities. Realized gain or (loss) is recorded upon the expiration or closing of a futures contract.
Any open futures contracts at period end are presented in the Schedule of Investments under the caption "Futures Contracts." The underlying face amount at value reflects each contract's exposure to the underlying instrument or index at period end and is
representative of volume of activity during the period. Securities deposited to meet initial margin requirements are identified in the Schedule of Investments.
During the period the Fund recognized net realized gain (loss) of $16,266 and a change in net unrealized appreciation (depreciation) of $20,360 related to its investment in futures contracts. These amounts are included in the Statement of Operations.
5. Purchases and Sales of Investments.
Purchases and sales of securities, other than short-term securities, aggregated $6,348,453 and $6,576,338, respectively.
6. Fees and Other Transactions with Affiliates.
Management Fee. Fidelity Management & Research Company (the investment adviser) and its affiliates provide the Fund with investment management related services for which the Fund pays a monthly management fee. The management fee is the sum of an individual fund fee rate that is based on an annual rate of .424% of the Fund's average net assets and an annualized group fee rate that averaged .25% during the period. Prior to August 1, 2014 the individual fund fee rate was .45%. The group fee rate is based upon the average net assets of all the mutual funds advised by the investment adviser, including any mutual funds previously advised by the investment adviser that are currently advised by Fidelity SelectCo, LLC, an affiliate of the investment adviser. The group fee rate decreases as assets under management increase and increases as assets under management decrease. In addition, the management fee is subject to a performance adjustment (up to a maximum of ± .20% of the Fund's average net assets over a 36 month performance period). The upward or downward adjustment to the management fee is based on the relative investment performance of International Discovery as compared to its benchmark index, the MSCI EAFE Index, over the same 36 month performance period. For the reporting period, the total annual management fee rate, including the performance adjustment, was .72% of the Fund's average net assets. The performance adjustment included in the management fee rate may be higher or lower
Annual Report
Notes to Financial Statements - continued
(Amounts in thousands except percentages)
6. Fees and Other Transactions with Affiliates - continued
Management Fee - continued
than the maximum performance adjustment rate due to the difference between the average net assets for the reporting and performance periods.
Distribution and Service Plan Fees. In accordance with Rule 12b-1 of the 1940 Act, the Fund has adopted separate Distribution and Service Plans for each class of shares. Certain classes pay Fidelity Distributors Corporation (FDC), an affiliate of the investment adviser, separate Distribution and Service Fees, each of which is based on an annual percentage of each class' average net assets. In addition, FDC may pay financial intermediaries for selling shares of the Fund and providing shareholder support services.
For the period, the Distribution and Service Fee rates, total fees and amounts retained by FDC were as follows:
| Distribution
Fee | Service
Fee | Total Fees | Retained
by FDC |
Class A | -% | .25% | $ 813 | $ 6 |
Class T | .25% | .25% | 255 | 1 |
Class B | .75% | .25% | 58 | 44 |
Class C | .75% | .25% | 382 | 44 |
| | | $ 1,508 | $ 95 |
Sales Load. FDC may receive a front-end sales charge of up to 5.75% for selling Class A shares and 3.50% for selling Class T shares, some of which is paid to financial intermediaries for selling shares of the Fund. Depending on the holding period, FDC may receive contingent deferred sales charges levied on Class A, Class T, Class B, and Class C redemptions. The deferred sales charges range from 5.00% to 1.00% for Class B shares, 1.00% for Class C shares, 1.00% for certain purchases of Class A shares and .25% for certain purchases of Class T shares.
For the period, sales charge amounts retained by FDC were as follows:
| Retained
by FDC |
Class A | $ 59 |
Class T | 7 |
Class B* | 3 |
Class C* | 5 |
| $ 74 |
* When Class B and Class C shares are initially sold, FDC pays commissions from its own resources to financial intermediaries through which the sales are made.
Annual Report
6. Fees and Other Transactions with Affiliates - continued
Transfer Agent Fees. Fidelity Investments Institutional Operations Company, Inc., (FIIOC), an affiliate of the investment adviser is the transfer, dividend disbursing and shareholder servicing agent for each class of the Fund. FIIOC receives account fees and asset-based fees that vary according to the account size and type of account of the shareholders of the respective classes of the Fund, except for Class Z. FIIOC receives an asset-based fee of Class K's and Class Z's average net assets. FIIOC receives an asset-based fee of Class Z's average net assets. FIIOC pays for typesetting, printing and mailing of shareholder reports, except proxy statements.
For the period, transfer agent fees for each applicable class were as follows:
| Amount | % of
Class-Level Average
Net Assets |
Class A | $ 904 | .28 |
Class T | 134 | .26 |
Class B | 18 | .30 |
Class C | 105 | .28 |
International Discovery | 14,295 | .18 |
Class K | 1,219 | .05 |
Institutional Class | 1,088 | .18 |
Class Z | 8 | .05 |
| $ 17,771 | |
Accounting and Security Lending Fees. Fidelity Service Company, Inc. (FSC), an affiliate of the investment adviser, maintains the Fund's accounting records. The accounting fee is based on the level of average net assets for each month. Under a separate contract, FSC administers the security lending program. The security lending fee is based on the number and duration of lending transactions.
Brokerage Commissions. The Fund placed a portion of its portfolio transactions with brokerage firms which are affiliates of the investment adviser. Brokerage commissions are included in net realized gain (loss) and change in net unrealized appreciation (depreciation) in the Statement of Operations. The commissions paid to these affiliated firms were $11 for the period.
Other. During the period, the investment adviser reimbursed the Fund for certain losses in the amount of $2.
7. Committed Line of Credit.
The Fund participates with other funds managed by the investment adviser or an affiliate in a $4.25 billion credit facility (the "line of credit") to be utilized for temporary or emergency purposes to fund shareholder redemptions or for other short-term liquidity purposes. The Fund has agreed to pay commitment fees on its pro-rata portion of the line
Annual Report
Notes to Financial Statements - continued
(Amounts in thousands except percentages)
7. Committed Line of Credit - continued
of credit, which amounted to $19 and is reflected in Miscellaneous expenses on the Statement of Operations. During the period, the Fund did not borrow on this line of credit.
8. Security Lending.
The Fund lends portfolio securities through a lending agent from time to time in order to earn additional income. For equity securities, a lending agent is used and may loan securities to certain qualified borrowers, including Fidelity Capital Markets (FCM), a broker-dealer affiliated with the Fund. On the settlement date of the loan, the Fund receives collateral (in the form of U.S. Treasury obligations, letters of credit and/or cash) against the loaned securities and maintains collateral in an amount not less than 100% of the market value of the loaned securities during the period of the loan. The market value of the loaned securities is determined at the close of business of the Fund and any additional required collateral is delivered to the Fund on the next business day. If the borrower defaults on its obligation to return the securities loaned because of insolvency or other reasons, the Fund may apply collateral received from the borrower against the obligation. The Fund may experience delays and costs in recovering the securities loaned. Any cash collateral received is invested in the Fidelity Securities Lending Cash Central Fund. The value of loaned securities and cash collateral at period end are disclosed on the Fund's Statement of Assets and Liabilities. At period end, there were no security loans outstanding with FCM. Security lending income represents the income earned on investing cash collateral, less rebates paid to borrowers and any lending agent fees associated with the loan, plus any premium payments received for lending certain types of securities. Security lending income is presented in the Statement of Operations as a component of income from Fidelity Central Funds. Total security lending income during the period amounted to $5,278, including $7 from securities loaned to FCM.
9. Expense Reductions.
Commissions paid to certain brokers with whom the investment adviser, or its affiliates, places trades on behalf of the Fund include an amount in addition to trade execution, which may be rebated back to the Fund to offset certain expenses. This amount totaled $317 for the period.
In addition, the investment adviser reimbursed a portion of the Fund's operating expenses during the period in the amount of $28.
Annual Report
10. Distributions to Shareholders.
Distributions to shareholders of each class were as follows:
Years ended October 31, | 2014 | 2013 |
From net investment income | | |
Class A | $ 2,857 | $ 4,138 |
Class T | 344 | 492 |
Class B | 2 | 34 |
Class C | 79 | 186 |
International Discovery | 93,065 | 101,466 |
Class K | 33,983 | 34,651 |
Institutional Class | 5,936 | 5,064 |
Class Z | 60 | - |
Total | $ 136,326 | $ 146,031 |
From net realized gain | 2014 | 2013 |
Class A | $ 2,660 | $ 297 |
Class T | 423 | 46 |
Class B | 52 | 7 |
Class C | 295 | 30 |
International Discovery | 61,190 | 5,914 |
Class K | 20,093 | 1,827 |
Institutional Class | 3,838 | 292 |
Class Z | 35 | - |
Total | $ 88,586 | $ 8,413 |
11. Share Transactions.
Share transactions for each class were as follows and may contain automatic conversions between classes or exchanges between funds:
| Shares | Shares | Dollars | Dollars |
Years ended October 31, | 2014 | 2013 A | 2014 | 2013 A |
Class A | | | | |
Shares sold | 1,382 | 1,772 | $ 54,489 | $ 62,186 |
Reinvestment of distributions | 137 | 132 | 5,280 | 4,249 |
Shares redeemed | (2,632) | (2,553) | (104,067) | (88,988) |
Net increase (decrease) | (1,113) | (649) | $ (44,298) | $ (22,553) |
Class T | | | | |
Shares sold | 200 | 227 | $ 7,804 | $ 7,911 |
Reinvestment of distributions | 19 | 16 | 736 | 512 |
Shares redeemed | (311) | (347) | (12,118) | (11,997) |
Net increase (decrease) | (92) | (104) | $ (3,578) | $ (3,574) |
Class B | | | | |
Shares sold | 6 | 4 | $ 233 | $ 137 |
Reinvestment of distributions | 1 | 1 | 51 | 39 |
Shares redeemed | (58) | (75) | (2,266) | (2,570) |
Net increase (decrease) | (51) | (70) | $ (1,982) | $ (2,394) |
Annual Report
Notes to Financial Statements - continued
(Amounts in thousands except percentages)
11. Share Transactions - continued
| Shares | Shares | Dollars | Dollars |
Years ended October 31, | 2014 | 2013 A | 2014 | 2013 A |
Class C | | | | |
Shares sold | 232 | 184 | $ 9,059 | $ 6,532 |
Reinvestment of distributions | 9 | 6 | 337 | 193 |
Shares redeemed | (250) | (207) | (9,726) | (7,250) |
Net increase (decrease) | (9) | (17) | $ (330) | $ (525) |
International Discovery | | | | |
Shares sold | 28,809 | 37,338 | $ 1,144,588 | $ 1,332,523 |
Reinvestment of distributions | 3,813 | 3,176 | 148,138 | 102,608 |
Shares redeemed | (37,231) | (31,569) | (1,476,965) | (1,103,313) |
Net increase (decrease) | (4,609) | 8,945 | $ (184,239) | $ 331,818 |
Class K | | | | |
Shares sold | 15,775 | 19,989 | $ 628,261 | $ 699,723 |
Reinvestment of distributions | 1,396 | 1,132 | 54,076 | 36,478 |
Shares redeemed | (18,729) | (12,053) | (741,205) | (423,712) |
Net increase (decrease) | (1,558) | 9,068 | $ (58,868) | $ 312,489 |
Institutional Class | | | | |
Shares sold | 10,468 | 4,893 | $ 410,346 | $ 175,669 |
Reinvestment of distributions | 91 | 68 | 3,529 | 2,182 |
Shares redeemed | (5,852) | (2,219) | (225,868) | (78,500) |
Net increase (decrease) | 4,707 | 2,742 | $ 188,007 | $ 99,351 |
Class Z | | | | |
Shares sold | 993 | 3 | $ 39,070 | $ 100 |
Reinvestment of distributions | 2 | - | 95 | - |
Shares redeemed | (96) | - | (3,785) | - |
Net increase (decrease) | 899 | 3 | $ 35,380 | $ 100 |
A Share transactions for Class Z are for the period August 13, 2013 (commencement of sale of shares) to October 31, 2014.
12. Other.
The Fund's organizational documents provide former and current trustees and officers with a limited indemnification against liabilities arising in connection with the performance of their duties to the Fund. In the normal course of business, the Fund may also enter into contracts that provide general indemnifications. The Fund's maximum exposure under these arrangements is unknown as this would be dependent on future claims that may be made against the Fund. The risk of material loss from such claims is considered remote.
At the end of the period, Strategic Advisers International Fund was the owner of record of approximately 15% of the total outstanding shares of the Fund.
Annual Report
To the Trustees of Fidelity Investment Trust and the Shareholders of Fidelity International Discovery Fund:
In our opinion, the accompanying statement of assets and liabilities, including the schedule of investments, and the related statements of operations and of changes in net assets and the financial highlights present fairly, in all material respects, the financial position of Fidelity International Discovery Fund (a fund of Fidelity Investment Trust) at October 31, 2014, the results of its operations for the year then ended, the changes in its net assets for each of the two years in the period then ended and the financial highlights for each of the periods indicated, in conformity with accounting principles generally accepted in the United States of America. These financial statements and financial highlights (hereafter referred to as "financial statements") are the responsibility of the Fidelity International Discovery Fund's management. Our responsibility is to express an opinion on these financial statements based on our audits. We conducted our audits of these financial statements in accordance with the standards of the Public Company Accounting Oversight Board (United States). Those standards require that we plan and perform the audit to obtain reasonable assurance about whether the financial statements are free of material misstatement. An audit includes examining, on a test basis, evidence supporting the amounts and disclosures in the financial statements, assessing the accounting principles used and significant estimates made by management, and evaluating the overall financial statement presentation. We believe that our audits, which included confirmation of securities at October 31, 2014 by correspondence with the custodian and brokers, provide a reasonable basis for our opinion.
PricewaterhouseCoopers LLP
Boston, Massachusetts
December 19, 2014
Annual Report
The Trustees, Member of the Advisory Board, and officers of the trust and fund, as applicable, are listed below. The Board of Trustees governs the fund and is responsible for protecting the interests of shareholders. The Trustees are experienced executives who meet periodically throughout the year to oversee the fund's activities, review contractual arrangements with companies that provide services to the fund, oversee management of the risks associated with such activities and contractual arrangements, and review the fund's performance. Except for James C. Curvey, each of the Trustees oversees 174 funds. Mr. Curvey oversees 407 funds.
The Trustees hold office without limit in time except that (a) any Trustee may resign; (b) any Trustee may be removed by written instrument, signed by at least two-thirds of the number of Trustees prior to such removal; (c) any Trustee who requests to be retired or who has become incapacitated by illness or injury may be retired by written instrument signed by a majority of the other Trustees; and (d) any Trustee may be removed at any special meeting of shareholders by a two-thirds vote of the outstanding voting securities of the trust. Each Trustee who is not an interested person (as defined in the 1940 Act) of the trust and the fund (Independent Trustee), shall retire not later than the last day of the calendar year in which his or her 75th birthday occurs. The Independent Trustees may waive this mandatory retirement age policy with respect to individual Trustees. The officers and Advisory Board Member hold office without limit in time, except that any officer and Advisory Board Member may resign or may be removed by a vote of a majority of the Trustees at any regular meeting or any special meeting of the Trustees. Except as indicated, each individual has held the office shown or other offices in the same company for the past five years.
Experience, Skills, Attributes, and Qualifications of the Fund's Trustees. The Governance and Nominating Committee has adopted a statement of policy that describes the experience, qualifications, attributes, and skills that are necessary and desirable for potential Independent Trustee candidates (Statement of Policy). The Board believes that each Trustee satisfied at the time he or she was initially elected or appointed a Trustee, and continues to satisfy, the standards contemplated by the Statement of Policy. The Governance and Nominating Committee also engages professional search firms to help identify potential Independent Trustee candidates who have the experience, qualifications, attributes, and skills consistent with the Statement of Policy. From time to time, additional criteria based on the composition and skills of the current Independent Trustees, as well as experience or skills that may be appropriate in light of future changes to board composition, business conditions, and regulatory or other developments, have also been considered by the professional search firms and the Governance and Nominating Committee. In addition, the Board takes into account the Trustees' commitment and participation in Board and committee meetings, as well as their leadership of standing and ad hoc committees throughout their tenure.
In determining that a particular Trustee was and continues to be qualified to serve as a Trustee, the Board has considered a variety of criteria, none of which, in isolation, was controlling. The Board believes that, collectively, the Trustees have balanced and diverse experience, qualifications, attributes, and skills, which allow the Board to operate effectively in governing the fund and protecting the interests of shareholders. Information about the specific experience, skills, attributes, and qualifications of each Trustee, which in each case led to the Board's conclusion that the Trustee should serve (or continue to serve) as a trustee of the fund, is provided below.
Annual Report
Trustees and Officers - continued
Board Structure and Oversight Function. James C. Curvey is an interested person (as defined in the 1940 Act) and currently serves as Chairman. The Trustees have determined that an interested Chairman is appropriate and benefits shareholders because an interested Chairman has a personal and professional stake in the quality and continuity of services provided to the fund. Independent Trustees exercise their informed business judgment to appoint an individual of their choosing to serve as Chairman, regardless of whether the Trustee happens to be independent or a member of management. The Independent Trustees have determined that they can act independently and effectively without having an Independent Trustee serve as Chairman and that a key structural component for assuring that they are in a position to do so is for the Independent Trustees to constitute a substantial majority for the Board. The Independent Trustees also regularly meet in executive session. Ned C. Lautenbach serves as Chairman of the Independent Trustees and as such (i) acts as a liaison between the Independent Trustees and management with respect to matters important to the Independent Trustees and (ii) with management prepares agendas for Board meetings.
Fidelity funds are overseen by different Boards of Trustees. The fund's Board oversees Fidelity's equity and high income funds and another Board oversees Fidelity's investment-grade bond, money market, and asset allocation funds. The asset allocation funds may invest in Fidelity funds overseen by the fund's Board. The use of separate Boards, each with its own committee structure, allows the Trustees of each group of Fidelity funds to focus on the unique issues of the funds they oversee, including common research, investment, and operational issues. On occasion, the separate Boards establish joint committees to address issues of overlapping consequences for the Fidelity funds overseen by each Board.
The Trustees operate using a system of committees to facilitate the timely and efficient consideration of all matters of importance to the Trustees, the fund, and fund shareholders and to facilitate compliance with legal and regulatory requirements and oversight of the fund's activities and associated risks. The Board, acting through its committees, has charged FMR and its affiliates with (i) identifying events or circumstances the occurrence of which could have demonstrably adverse effects on the fund's business and/or reputation; (ii) implementing processes and controls to lessen the possibility that such events or circumstances occur or to mitigate the effects of such events or circumstances if they do occur; and (iii) creating and maintaining a system designed to evaluate continuously business and market conditions in order to facilitate the identification and implementation processes described in (i) and (ii) above. Because the day-to-day operations and activities of the fund are carried out by or through FMR, its affiliates and other service providers, the fund's exposure to risks is mitigated but not eliminated by the processes overseen by the Trustees. While each of the Board's committees has responsibility for overseeing different aspects of the fund's activities, oversight is exercised primarily through the Operations, Audit, and Compliance Committees. In addition, the Independent Trustees have worked with FMR to enhance the Board's oversight of investment and financial risks, legal and regulatory risks, technology risks, and operational risks, including the development of additional risk reporting to the Board. For example, a working group comprised of Independent Trustees and FMR has worked and continues to work to review the Fidelity funds' valuation-related activities, reporting and risk management. Appropriate personnel, including but not limited to the fund's Chief Compliance Officer (CCO), FMR's internal auditor, the independent accountants, the fund's Treasurer and portfolio management personnel, make periodic reports to the Board's committees, as appropriate, including an annual review of FMR's risk management program for the Fidelity funds. The responsibilities of each standing committee, including their oversight responsibilities, are described further under "Standing Committees of the Fund's Trustees."
Annual Report
The fund's Statement of Additional Information (SAI) includes more information about the Trustees. To request a free copy, call Fidelity at 1-877-208-0098.
Interested Trustees*:
Correspondence intended for each Trustee who is an interested person may be sent to Fidelity Investments, 245 Summer Street, Boston, Massachusetts 02210.
Name, Year of Birth; Principal Occupations and Other Relevant Experience+ |
James C. Curvey (1935) |
Year of Election or Appointment: 2007 Trustee Chairman of the Board of Trustees |
| Mr. Curvey also serves as Trustee of other Fidelity funds. Mr. Curvey is a Director of Fidelity Research & Analysis Co. (2009-present), and Vice Chairman (2007-present) and Director of FMR LLC. In addition, Mr. Curvey serves as an Overseer for the Boston Symphony Orchestra and a member of the board of ArtisNaples, Naples, Florida, and as a Trustee for Brewster Academy, Wolfeboro, New Hampshire. Previously, Mr. Curvey served as a Director of Fidelity Investments Money Management, Inc. (2009-2014), a Director of FMR (2007-2014), and a Director of FMR Co., Inc. (2007-2014). |
Charles S. Morrison (1960) |
Year of Election or Appointment: 2014 Trustee |
| Mr. Morrison also serves as Trustee of other funds. He serves as a Director of Fidelity Investments Money Management, Inc. (FIMM) (2014-present), Director of Fidelity SelectCo, LLC (2014-present), President, Asset Management (2014-present), and is an employee of Fidelity Investments. Previously, Mr. Morrison served as Vice President of Fidelity's Fixed Income and Asset Allocation Funds (2012-2014), President, Fixed Income (2011-2014), Vice President of Fidelity's Money Market Funds (2005-2009), President, Money Market Group Leader of FMR (2009), and Senior Vice President, Money Market Group of FMR (2004-2009). Mr. Morrison also served as Vice President of Fidelity's Bond Funds (2002-2005), certain Balanced Funds (2002-2005), and certain Asset Allocation Funds (2002-2007), and as Senior Vice President (2002-2005) of Fidelity's Bond Division. |
* Trustees have been determined to be "Interested Trustees" by virtue of, among other things, their affiliation with the trust or various entities under common control with FMR.
+ The information above includes each Trustee's principal occupation during the last five years and other information relating to the experience, attributes, and skills relevant to each Trustee's qualifications to serve as a Trustee, which led to the conclusion that each Trustee should serve as a Trustee for the fund.
Annual Report
Independent Trustees:
Correspondence intended for each Independent Trustee (that is, the Trustees other than the Interested Trustees) may be sent to Fidelity Investments, P.O. Box 55235, Boston, Massachusetts 02205-5235.
Name, Year of Birth; Principal Occupations and Other Relevant Experience+ |
Dennis J. Dirks (1948) |
Year of Election or Appointment: 2005 Trustee |
| Mr. Dirks also serves as Trustee of other Fidelity funds. Prior to his retirement in May 2003, Mr. Dirks was Chief Operating Officer and a member of the Board of The Depository Trust & Clearing Corporation (DTCC). He also served as President, Chief Operating Officer, and Board member of The Depository Trust Company (DTC) and President and Board member of the National Securities Clearing Corporation (NSCC). In addition, Mr. Dirks served as Chief Executive Officer and Board member of the Government Securities Clearing Corporation, Chief Executive Officer and Board member of the Mortgage-Backed Securities Clearing Corporation, as a Trustee and a member of the Finance Committee of Manhattan College (2005-2008), and as a Trustee and a member of the Finance Committee of AHRC of Nassau County (2006-2008). Mr. Dirks is a member of the Independent Directors Council (IDC) Governing Council (2010-present) and Board of Directors for The Brookville Center for Children's Services, Inc. (2009-present). |
Alan J. Lacy (1953) |
Year of Election or Appointment: 2008 Trustee |
| Mr. Lacy also serves as Trustee of other Fidelity funds. Mr. Lacy serves as Senior Adviser (2007-present) of Oak Hill Capital Partners, L.P. (private equity). Mr. Lacy also served as Chief Executive Officer (2000-2005) and Vice Chairman (2005-2006) of Sears Holdings Corporation and Sears, Roebuck and Co. (retail). In addition, Mr. Lacy serves as a member of the Board of Directors of Dave & Buster's Entertainment, Inc. (restaurant and entertainment complexes, 2010-present), Earth Fare, Inc. (retail grocery, 2012-present), The Hillman Companies, Inc. (hardware wholesalers, 2010-present), and Bristol-Myers Squibb Company (global pharmaceuticals, 2008-present). Mr. Lacy is a member of the Board of Trustees of The National Parks Conservation Association (2006-present). Previously, Mr. Lacy served as Chairman of the Board of Trustees of the National Parks Conservation Association (2008-2011) and as a member of the Board of Directors for the Western Union Company (global money transfer, 2006-2011). |
Ned C. Lautenbach (1944) |
Year of Election or Appointment: 2000 Trustee Chairman of the Independent Trustees |
| Mr. Lautenbach also serves as Trustee of other Fidelity funds. Mr. Lautenbach currently serves as the Lead Director of the Eaton Corporation Board of Directors (diversified industrial, 1997-present). Mr. Lautenbach is Chairman of the Board of Directors of the Philharmonic Center for the Arts in Naples, Florida (2012-present) and a member of the Council on Foreign Relations (1994-present). Previously, Mr. Lautenbach was a Partner/Advisory Partner at Clayton, Dubilier & Rice, LLC (private equity investment, 1998-2010), as well as a Director of Sony Corporation (2006-2007). |
Joseph Mauriello (1944) |
Year of Election or Appointment: 2008 Trustee |
| Mr. Mauriello also serves as Trustee of other Fidelity funds. Prior to his retirement in January 2006, Mr. Mauriello served in numerous senior management positions including Deputy Chairman and Chief Operating Officer (2004-2005), and Vice Chairman of Financial Services (2002-2004) of KPMG LLP US (professional services, 1965-2005). Mr. Mauriello currently serves as a member of the Board of Directors of XL Group plc. (global insurance and re-insurance, 2006-present). Previously, Mr. Mauriello served as a Director of the Hamilton Funds of the Bank of New York (2006-2007) and of Arcadia Resources Inc. (health care services and products, 2007-2012). |
Robert W. Selander (1950) |
Year of Election or Appointment: 2011 Trustee |
| Mr. Selander also serves as Trustee of other Fidelity funds. Previously, Mr. Selander served as a Member of the Advisory Board of other Fidelity funds (2011), and Executive Vice Chairman (2010), Chief Executive Officer (2009-2010), and President and Chief Executive Officer (1997-2009) of Mastercard, Inc. |
Cornelia M. Small (1944) |
Year of Election or Appointment: 2005 Trustee |
| Ms. Small also serves as Trustee of other Fidelity funds. Ms. Small is a member of the Board of Directors (2009-present) and Chair of the Investment Committee (2010-present) of the Teagle Foundation. Ms. Small also serves on the Investment Committee of the Berkshire Taconic Community Foundation (2008-present). Previously, Ms. Small served as Chairperson (2002-2008) and a member of the Investment Committee and Chairperson (2008-2012) and a member of the Board of Trustees of Smith College. In addition, Ms. Small served as Chief Investment Officer, Director of Global Equity Investments, and a member of the Board of Directors of Scudder, Stevens & Clark and Scudder Kemper Investments. |
William S. Stavropoulos (1939) |
Year of Election or Appointment: 2001 Trustee Vice Chairman of the Independent Trustees |
| Mr. Stavropoulos also serves as Trustee of other Fidelity funds. Mr. Stavropoulos serves as President and Founder of the Michigan Baseball Foundation, the Great Lakes Loons (2007-present). Mr. Stavropoulos is Chairman Emeritus of the Board of Directors of The Dow Chemical Company, where he previously served in numerous senior management positions, including President, CEO (1995-2000; 2002-2004), Chairman of the Executive Committee (2000-2006), and as a member of the Board of Directors (1990-2006). Currently, Mr. Stavropoulos is Chairman of the Board of Directors of Univar Inc. (global distributor of commodity and specialty chemicals), a Director of Teradata Corporation (data warehousing and technology solutions), and Maersk Inc. (industrial conglomerate), and a member of the Advisory Board for Metalmark Capital LLC (private equity investment, 2005-present). Mr. Stavropoulos is an operating advisor to Clayton, Dubilier & Rice, LLC (private equity investment). In addition, Mr. Stavropoulos is a member of the University of Notre Dame Advisory Council for the College of Science, a Trustee of the Rollin L. Gerstacker Foundation, and a Director of the Naples Philharmonic Center for the Arts. Previously, Mr. Stavropoulos served as a Director of Chemical Financial Corporation (bank holding company, 1993-2012) and Tyco International, Ltd. (multinational manufacturing and services, 2007-2012). |
David M. Thomas (1949) |
Year of Election or Appointment: 2008 Trustee |
| Mr. Thomas also serves as Trustee of other Fidelity funds. Mr. Thomas serves as Non-Executive Chairman of the Board of Directors of Fortune Brands Home and Security (home and security products, 2011-present), and as a member of the Board of Directors of Interpublic Group of Companies, Inc. (marketing communication, 2004-present). Previously, Mr. Thomas served as Executive Chairman (2005-2006) and Chairman and Chief Executive Officer (2000-2005) of IMS Health, Inc. (pharmaceutical and healthcare information solutions), and a Director of Fortune Brands, Inc. (consumer products, 2000-2011). |
+ The information above includes each Trustee's principal occupation during the last five years and other information relating to the experience, attributes, and skills relevant to each Trustee's qualifications to serve as a Trustee, which led to the conclusion that each Trustee should serve as a Trustee for the fund.
Advisory Board Member and Officers:
Correspondence intended for each officer and Peter S. Lynch may be sent to Fidelity Investments, 245 Summer Street, Boston, Massachusetts 02210. Officers appear below in alphabetical order.
Name, Year of Birth; Principal Occupation |
Peter S. Lynch (1944) |
Year of Election or Appointment: 2003 Member of the Advisory Board |
| Mr. Lynch also serves as Member of the Advisory Board of other Fidelity funds. Mr. Lynch is Vice Chairman and a Director of FMR and FMR Co., Inc. In addition, Mr. Lynch serves as a Trustee of Boston College and as the Chairman of the Inner-City Scholarship Fund. Previously, Mr. Lynch served on the Special Olympics International Board of Directors (1997-2006). |
Elizabeth Paige Baumann (1968) |
Year of Election or Appointment: 2012 Anti-Money Laundering (AML) Officer |
| Ms. Baumann also serves as AML Officer of other funds. She is Chief AML Officer of FMR LLC (2012-present) and is an employee of Fidelity Investments. Previously, Ms. Baumann served as Vice President and Deputy Anti-Money Laundering Officer (2007-2012). |
William C. Coffey (1969) |
Year of Election or Appointment: 2009 Assistant Secretary |
| Mr. Coffey also serves as Assistant Secretary of other funds. He is Senior Vice President and Deputy General Counsel of FMR LLC (2010-present), and is an employee of Fidelity Investments. Previously, Mr. Coffey served as Vice President and Associate General Counsel of FMR LLC (2005-2009). |
Timothy M. Cohen (1969) |
Year of Election or Appointment: 2014 Vice President of certain Equity Funds |
| Mr. Cohen also serves as Vice President of other funds. Mr. Cohen serves as a Director and Chief Compliance Officer of Fidelity Management & Research (U.K.) Inc. (2013-present) and is an employee of Fidelity Investments. |
Jonathan Davis (1968) |
Year of Election or Appointment: 2010 Assistant Treasurer |
| Mr. Davis also serves as Assistant Treasurer of other funds. Mr. Davis is an employee of Fidelity Investments. Previously, Mr. Davis served as Vice President and Associate General Counsel of FMR LLC (2003-2010). |
Adrien E. Deberghes (1967) |
Year of Election or Appointment: 2008 Deputy Treasurer |
| Mr. Deberghes also serves as an officer of other funds. He is an employee of Fidelity Investments (2008-present). Prior to joining Fidelity Investments, Mr. Deberghes was Senior Vice President of Mutual Fund Administration at State Street Corporation (2007-2008), Senior Director of Mutual Fund Administration at Investors Bank & Trust (2005-2007), and Director of Finance for Dunkin' Brands (2000-2005). |
Stephanie J. Dorsey (1969) |
Year of Election or Appointment: 2010 Assistant Treasurer |
| Ms. Dorsey also serves as an officer of other funds. She is an employee of Fidelity Investments (2008-present) and has served in other fund officer roles. Prior to joining Fidelity Investments, Ms. Dorsey served as Treasurer (2004-2008) of the JPMorgan Mutual Funds and Vice President (2004-2008) of JPMorgan Chase Bank. |
Howard J. Galligan III (1966) |
Year of Election or Appointment: 2014 Chief Financial Officer |
| Mr. Galligan also serves as Chief Financial Officer of other funds. Mr. Galligan serves as President of Fidelity Pricing and Cash Management Services (FPCMS) (2014-present) and as a Director of Strategic Advisers, Inc. (2008-present). Previously, Mr. Galligan served as Chief Administrative Officer of Asset Management (2011-2014) and Chief Operating Officer and Senior Vice President of Investment Support for Strategic Advisers, Inc. (2003-2011). |
Scott C. Goebel (1968) |
Year of Election or Appointment: 2008 Secretary and Chief Legal Officer (CLO) |
| Mr. Goebel serves as Secretary and CLO of other funds. Mr. Goebel also serves as Secretary of Fidelity SelectCo, LLC (2013-present), Fidelity Investments Money Management, Inc. (FIMM) (2010-present) and Fidelity Research and Analysis Company (FRAC) (2010-present); General Counsel, Secretary, and Senior Vice President of FMR (2008-present) and FMR Co., Inc. (2008-present); Chief Legal Officer of Fidelity Management & Research (Hong Kong) Limited (2008-present); and Assistant Secretary of Fidelity Management & Research (Japan) Limited (2008-present) and Fidelity Management & Research (U.K.) Inc. (2008-present). Previously, Mr. Goebel served as Secretary and CLO of other Fidelity funds (2008-2013), Assistant Secretary of FIMM (2008-2010), FRAC (2008-2010), and certain funds (2007-2008); and as Vice President and Secretary of Fidelity Distributors Corporation (FDC) (2005-2007). Mr. Goebel has been employed by FMR LLC or an affiliate since 2001. |
Brian B. Hogan (1964) |
Year of Election or Appointment: 2009 Vice President |
| Mr. Hogan also serves as Trustee or Vice President of other funds. Mr. Hogan serves as a Director of Fidelity SelectCo, LLC (2014-present), and President of FMR's Equity Division (2009-present). Previously, Mr. Hogan served as Senior Vice President, Equity Research of FMR (2006-2009) and as a portfolio manager. |
Chris Maher (1972) |
Year of Election or Appointment: 2013 Assistant Treasurer |
| Mr. Maher serves as Assistant Treasurer of other funds. Mr. Maher is Vice President of Valuation Oversight and is an employee of Fidelity Investments. Previously, Mr. Maher served as Vice President of Asset Management Compliance (2013), Vice President of FMR's Program Management Group (2010-2013), and Vice President of Valuation Oversight (2008-2010). |
Kenneth B. Robins (1969) |
Year of Election or Appointment: 2008 President and Treasurer |
| Mr. Robins also serves as an officer of other funds. Mr. Robins serves as Executive Vice President of Fidelity Investments Money Management, Inc. (FIMM) (2013-present) and is an employee of Fidelity Investments (2004-present). Previously, Mr. Robins served in other fund officer roles. |
Stephen Sadoski (1971) |
Year of Election or Appointment: 2012 Deputy Treasurer |
| Mr. Sadoski also serves as Deputy Treasurer of other funds. He is an employee of Fidelity Investments (2012-present) and has served in another fund officer role. Prior to joining Fidelity Investments, Mr. Sadoski served as an assistant chief accountant in the Division of Investment Management of the Securities and Exchange Commission (SEC) (2009-2012) and as a senior manager at Deloitte & Touche LLP (1997-2009). |
Stacie M. Smith (1974) |
Year of Election or Appointment: 2013 Deputy Treasurer |
| Ms. Smith also serves as an officer of other funds. She is an employee of Fidelity Investments (2009-present) and has served in other fund officer roles. Prior to joining Fidelity Investments, Ms. Smith served as Senior Audit Manager of Ernst & Young LLP (1996-2009). |
Renee Stagnone (1975) |
Year of Election or Appointment: 2013 Deputy Treasurer |
| Ms. Stagnone also serves as Deputy Treasurer of other funds. Ms. Stagnone is an employee of Fidelity Investments. |
Linda J. Wondrack (1964) |
Year of Election or Appointment: 2014 Chief Compliance Officer |
| Ms. Wondrack also serves as Chief Compliance Officer of other funds. Ms. Wondrack is Executive Vice President and head of the Ethics Office and Asset Management Compliance for Fidelity Investments (2012-present). Ms. Wondrack also serves as Chief Compliance Officer of Fidelity SelectCo, LLC (2014-present); Chief Compliance Officer of Impresa Management LLC (2013-present); and Chief Compliance Officer of FMR Co., Inc., Fidelity Investments Money Management, Inc., Fidelity Management & Research (Japan) Limited, Fidelity Management & Research (U.K.) Inc., Fidelity Management & Research (Hong Kong), Fidelity Management & Research Company, Pyramis Global Advisors, LLC, and Strategic Advisers, Inc., Ballyrock Investment Advisors LLC, and Northern Neck Investors LLC (2012-present). Previously, Ms. Wondrack served as Senior Vice President and Chief Compliance Officer for Columbia Management Investment Advisers, LLC (2005-2012); Chief Compliance Officer for certain funds within the Columbia Family of Funds (2007-2012); and Senior Vice President of Compliance Risk Management at Bank of America (2005-2010). |
Joseph F. Zambello (1957) |
Year of Election or Appointment: 2011 Deputy Treasurer |
| Mr. Zambello also serves as Deputy Treasurer of other funds. Mr. Zambello is an employee of Fidelity Investments. Previously, Mr. Zambello served as Vice President of FMR's Program Management Group (2009-2011) and Vice President of the Transfer Agent Oversight Group (2005-2009). |
Annual Report
Class A, Class T, Class B and Class C designate 1% of the dividends distributed in during the fiscal year as qualifying for the dividends-received deduction for corporate shareholders.
Class A designates 81%; Class T designates 92%; Class B designates 100%; and Class C designates 100% of dividends distributed in during the fiscal year as amounts which may be taken into account as a dividend for purposes of the maximum rate under section 1(h)(11) of the Internal Revenue Code.
The amounts per share which represent income derived from sources within, and taxes paid to, foreign countries or possessions of the United States are as follows:
| Pay Date | Income | Taxes |
Class A | 12/09/13 | $0.3449 | $0.0365 |
Class T | 12/09/13 | $0.3040 | $0.0365 |
Class B | 12/09/13 | $0.1825 | $0.0365 |
Class C | 12/09/13 | $0.2179 | $0.0365 |
The fund will notify shareholders in January 2015 of amounts for use in preparing 2014 income tax returns.
Annual Report
Board Approval of Investment Advisory Contracts and Management Fees
Fidelity International Discovery Fund
Each year, the Board of Trustees, including the Independent Trustees (together, the Board), votes on the renewal of the management contract with Fidelity Management & Research Company (FMR) and the sub-advisory agreements (together, the Advisory Contracts) for the fund. The Board, assisted by the advice of fund counsel and Independent Trustees' counsel, requests and considers a broad range of information relevant to the renewal of the Advisory Contracts throughout the year.
The Board meets regularly and, at each of its meetings, covers an extensive agenda of topics and materials and considers factors that are relevant to its annual consideration of the renewal of the fund's Advisory Contracts, including the services and support provided to the fund and its shareholders. The Board has established various standing committees (Committees), each composed of and chaired by Independent Trustees with varying backgrounds, to which the Board has assigned specific subject matter responsibilities in order to enhance effective decision-making by the Board. The Board, acting directly and through its Committees, requests and receives information concerning the annual consideration of the renewal of the fund's Advisory Contracts. The Board also meets as needed to consider matters specifically related to the Board's annual consideration of the renewal of the Advisory Contracts. Members of the Board may also meet with trustees of other Fidelity funds through ad hoc joint committees to discuss certain matters relevant to the Fidelity funds.
At its July 2014 meeting, the Board, including the Independent Trustees, unanimously determined to renew the fund's Advisory Contracts. In reaching its determination, the Board considered all factors it believed relevant, including (i) the nature, extent, and quality of the services to be provided to the fund and its shareholders (including the investment performance of the fund); (ii) the competitiveness of the fund's management fee and total expense ratio relative to peer funds; (iii) the total costs of the services to be provided by and the profits to be realized by Fidelity from its relationship with the fund; (iv) the extent to which economies of scale exist and would be realized as the fund grows; and (v) whether fee levels reflect these economies of scale, if any, for the benefit of fund shareholders. In connection with separate internal corporate reorganizations involving Fidelity Management & Research (U.K.) Inc. (FMR U.K.) and Fidelity Management & Research (Japan) Inc. (FMR Japan), the Board approved certain non-material amendments to the fund's sub-advisory agreements with FMR U.K. and FMR Japan to reflect that, after these reorganizations, FMR Investment Management (UK) Limited and Fidelity Management & Research (Japan) Limited will carry on the business of FMR U.K. and FMR Japan, respectively. The Board noted that no changes to the portfolio managers or to the foreign research or investment advisory services provided to the fund were expected in connection with either reorganization and that the same personnel and resources would continue to be available to the fund at the new entities.
Annual Report
In considering whether to renew the Advisory Contracts for the fund, the Board reached a determination, with the assistance of fund counsel and Independent Trustees' counsel and through the exercise of its business judgment, that the renewal of the Advisory Contracts was in the best interests of the fund and its shareholders and that the compensation payable under the Advisory Contracts was fair and reasonable. The Board's decision to renew the Advisory Contracts was not based on any single factor, but rather was based on a comprehensive consideration of all the information provided to the Board at its meetings throughout the year. The Board, in reaching its determination to renew the Advisory Contracts, was aware that shareholders of the fund have a broad range of investment choices available to them, including a wide choice among funds offered by Fidelity's competitors, and that the fund's shareholders, who have the opportunity to review and weigh the disclosure provided by the fund in its prospectus and other public disclosures, have chosen to invest in this fund, which is part of the Fidelity family of funds.
Nature, Extent, and Quality of Services Provided. The Board considered Fidelity's staffing as it relates to the fund, including the backgrounds of investment personnel of FMR and the sub-advisers (together, the Investment Advisers), and also considered the fund's investment objective, strategies, and related investment philosophy. The Independent Trustees also had discussions with senior management of Fidelity's investment operations and investment groups. The Board considered the structure of the portfolio manager compensation program and whether this structure provides appropriate incentives to act in the best interests of the fund. Additionally, the Board considered the portfolio managers' investments, if any, in the funds that they manage.
Resources Dedicated to Investment Management and Support Services. The Board and the Fund Oversight and Research Committees reviewed the general qualifications and capabilities of Fidelity's investment staff, including its size, education, experience, and resources, as well as Fidelity's approach to recruiting, training, managing, and compensating investment personnel. The Board noted that Fidelity has continued to increase the resources devoted to non-U.S. offices, including expansion of Fidelity's global investment organization. The Board also noted that Fidelity's analysts have extensive resources, tools and capabilities that allow them to conduct sophisticated quantitative and fundamental analysis, as well as credit analysis of issuers, counterparties and guarantors. Further, the Board believes that Fidelity's investment professionals have sufficient access to global information and data so as to provide competitive investment results over time, and that those professionals also have access to sophisticated tools that permit them to assess portfolio construction and risk and performance attribution characteristics continuously, as well as to transmit new information and research conclusions rapidly around the world. Additionally, in its deliberations, the Board considered Fidelity's trading and risk management capabilities and resources and global compliance infrastructure, which are an integral part of the investment management process.
Annual Report
Board Approval of Investment Advisory Contracts and
Management Fees - continued
Shareholder and Administrative Services. The Board considered (i) the nature, extent, quality, and cost of advisory, administrative, and shareholder services performed by the Investment Advisers and their affiliates under the Advisory Contracts and under separate agreements covering transfer agency, pricing and bookkeeping, and securities lending services for the fund; (ii) the nature and extent of the supervision of third party service providers, principally custodians and subcustodians; and (iii) the resources devoted to, and the record of compliance with, the fund's compliance policies and procedures. The Board also reviewed the allocation of fund brokerage, including allocations to brokers affiliated with the Investment Advisers, the use of brokerage commissions to pay fund expenses, and the use of "soft" commission dollars to pay for research services.
The Board noted that the growth of fund assets over time across the complex allows Fidelity to reinvest in the development of services designed to enhance the value or convenience of the Fidelity funds as investment vehicles. These services include 24-hour access to account information and market information through telephone representatives and over the Internet, investor education materials and asset allocation tools, and the expanded availability of Fidelity Investor Centers.
In 2014, the Board formed an ad hoc Committee on Transfer Agency Fees to review the variety of transfer agency fee structures throughout the industry and Fidelity's competitive positioning with respect to industry participants.
Investment in a Large Fund Family. The Board considered the benefits to shareholders of investing in a Fidelity fund, including the benefits of investing in a fund that is part of a large family of funds offering a variety of investment disciplines and providing a large variety of mutual fund investor services. The Board noted that Fidelity had taken, or had made recommendations that resulted in the Fidelity funds taking, a number of actions over the previous year that benefited particular funds, including (i) continuing to dedicate additional resources to investment research and to the support of the senior management team that oversees asset management; (ii) persisting in efforts to enhance Fidelity's global research capabilities; (iii) launching new funds and making other enhancements to meet client needs for income-oriented solutions; (iv) reducing fund expenses for certain index funds; (v) continuing to launch dedicated lower cost underlying funds to meet portfolio construction needs related to expanding underlying fund options for Fidelity funds of funds, specifically for the Freedom Fund product lines; (vi) rationalizing product lines and gaining increased efficiencies through fund mergers; (vii) launching sector-based exchange-traded funds and establishing a new Fidelity adviser to manage sector-based funds and products; (viii) continuing to develop and implement technology to improve security and increase efficiency; (ix) modifying the eligibility criteria for certain share classes to increase their marketability to a portion of the defined contribution plan market; (x) waiving redemption fees for certain qualified fund-of-fund and wrap programs and certain retirement plan transactions; and (xi) launching new Institutional Class shares of certain money market funds to attract and retain assets and to fill a gap in the money market fund lineup.
Annual Report
Investment Performance. The Board considered whether the fund has operated in accordance with its investment objective, as well as its record of compliance with its investment restrictions and its performance history.
The Board took into account discussions with the Investment Advisers about fund investment performance that occur at Board meetings throughout the year. In this regard the Board noted that as part of regularly scheduled fund reviews and other reports to the Board on fund performance, the Board periodically considers annualized return information for the fund, for different time periods, measured against a securities market index ("benchmark index") and a peer group of funds with similar objectives ("peer group"). In its evaluation of fund investment performance, the Board gave particular attention to information indicating changes in performance of certain Fidelity funds for specific time periods and the Investment Advisers' explanations for any overperformance or underperformance.
In addition to reviewing absolute and relative fund performance, the Independent Trustees periodically consider the appropriateness of fund performance metrics in evaluating the results achieved. In general, the Independent Trustees believe that fund performance should be evaluated based on net performance (after fees and expenses) of both the highest performing and lowest performing classes, where applicable, compared to appropriate benchmark indices, over appropriate time periods which may include full market cycles, and compared to peer groups, as applicable, over the same periods, taking into account relevant factors including the following: general market conditions; issuer-specific information; tactical opportunities for investment; and fund cash flows and other factors.
The Independent Trustees recognize that shareholders evaluate performance on a net basis over their own holding periods, for which one-, three-, and five-year periods are often used as a proxy. For this reason, the performance information reviewed by the Board also included net cumulative calendar year total return information for the fund and an appropriate benchmark index and peer group for the most recent one-, three-, and five-year periods, as shown below. Returns are shown compared to the 25th percentile (top of box, 75% beaten) and 75th percentile (bottom of box, 25% beaten) of the peer universe. Returns of the benchmark index are "net MA," i.e., adjusted for tax withholding rates applicable to U.S.-based funds organized as Massachusetts business trusts.
Annual Report
Board Approval of Investment Advisory Contracts and
Management Fees - continued
Fidelity International Discovery Fund
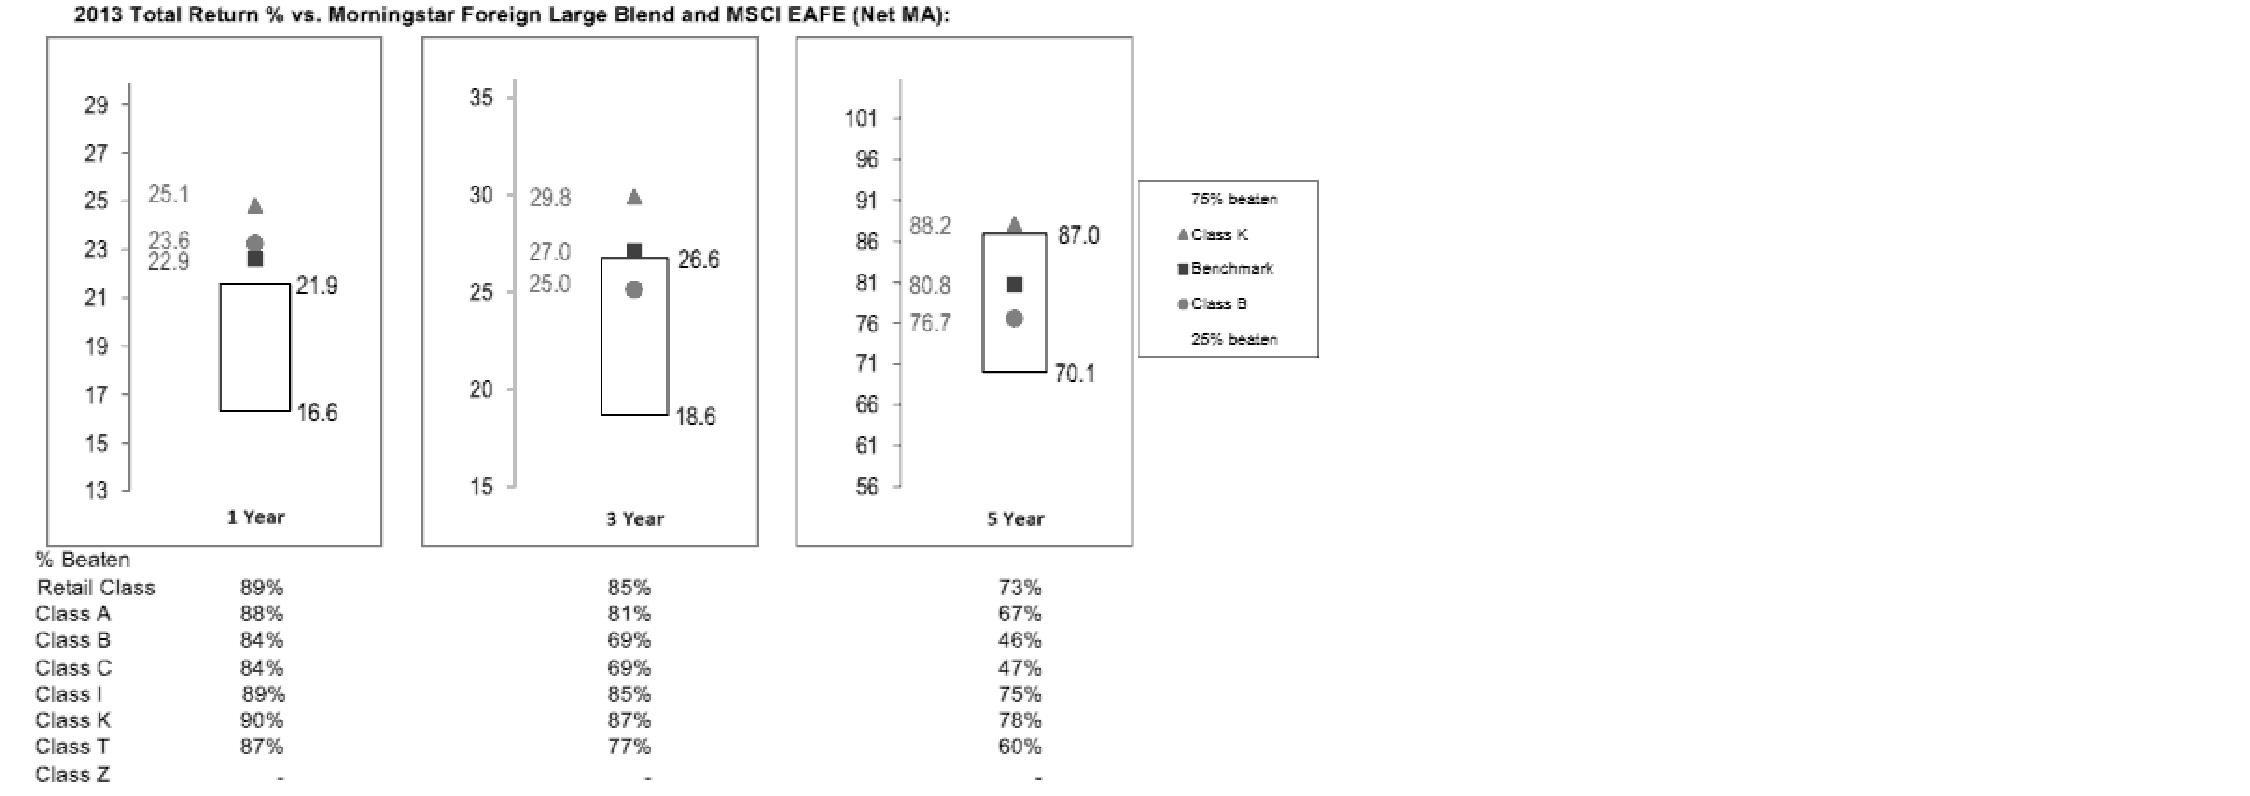
The Board also considered that the fund's management fee is subject to upward or downward adjustment depending upon whether, and to what extent, the fund's investment performance for the performance period exceeds, or is exceeded by, a securities index, thus leading to a performance adjustment for the same period. The Board noted that the performance adjustment provides FMR with a strong economic incentive to seek to achieve superior performance for the fund's shareholders and helps to more closely align the interests of FMR and the fund's shareholders.
Based on its review, the Board concluded that the nature, extent, and quality of services provided to the fund under the Advisory Contracts should benefit the fund's shareholders.
Competitiveness of Management Fee and Total Expense Ratio. The Board considered the fund's management fee and total expense ratio compared to "mapped groups" of competitive funds and classes. Fidelity creates "mapped groups" by combining similar Lipper investment objective categories that have comparable investment mandates. Combining Lipper investment objective categories aids the Board's management fee and total expense ratio comparisons by broadening the competitive group used for comparison and by reducing the number of universes to which various Fidelity funds are compared.
Management Fee. The Board considered two proprietary management fee comparisons for the 12-month periods shown in the chart below. The group of Lipper funds used by the Board for management fee comparisons is referred to below as the "Total Mapped Group." The Total Mapped Group comparison focuses on a fund's standing in terms of gross management fees before expense reimbursements or caps, and without giving effect to the fund's performance adjustment, relative to the total universe of funds with comparable investment mandates, regardless of whether their management fee structures also are comparable. Funds with comparable investment mandates offer exposure to similar types of securities. Funds with comparable management fee structures have similar management fee contractual arrangements (e.g., flat rate charged for advisory services, all-inclusive fee rate, etc.). "TMG %" represents the percentage of funds in the Total Mapped Group that had management fees that were lower than the fund's. For example, a hypothetical TMG % of 20% would mean that 80% of the funds in the Total Mapped Group had higher, and 20% had lower, management fees than the fund. The fund's actual TMG %s are in the chart below. The "Asset-Size Peer Group" (ASPG) comparison focuses on a fund's standing relative to a subset of non-Fidelity funds within the Total Mapped Group that are similar in size and management fee structure. For example, if a fund is in the first quartile of the ASPG, the fund's management fee ranks in the least expensive or lowest 25% of funds in the ASPG. The ASPG represents at least 15% of the funds in the Total Mapped Group with comparable asset size and management fee structures, subject to a minimum of 50 funds (or all funds in the Total Mapped Group if fewer than 50). Additional information, such as the ASPG quartile in which the fund's management fee rate ranked and the impact of the fund's performance adjustment, is also included in the chart and considered by the Board.
Annual Report
Fidelity International Discovery Fund
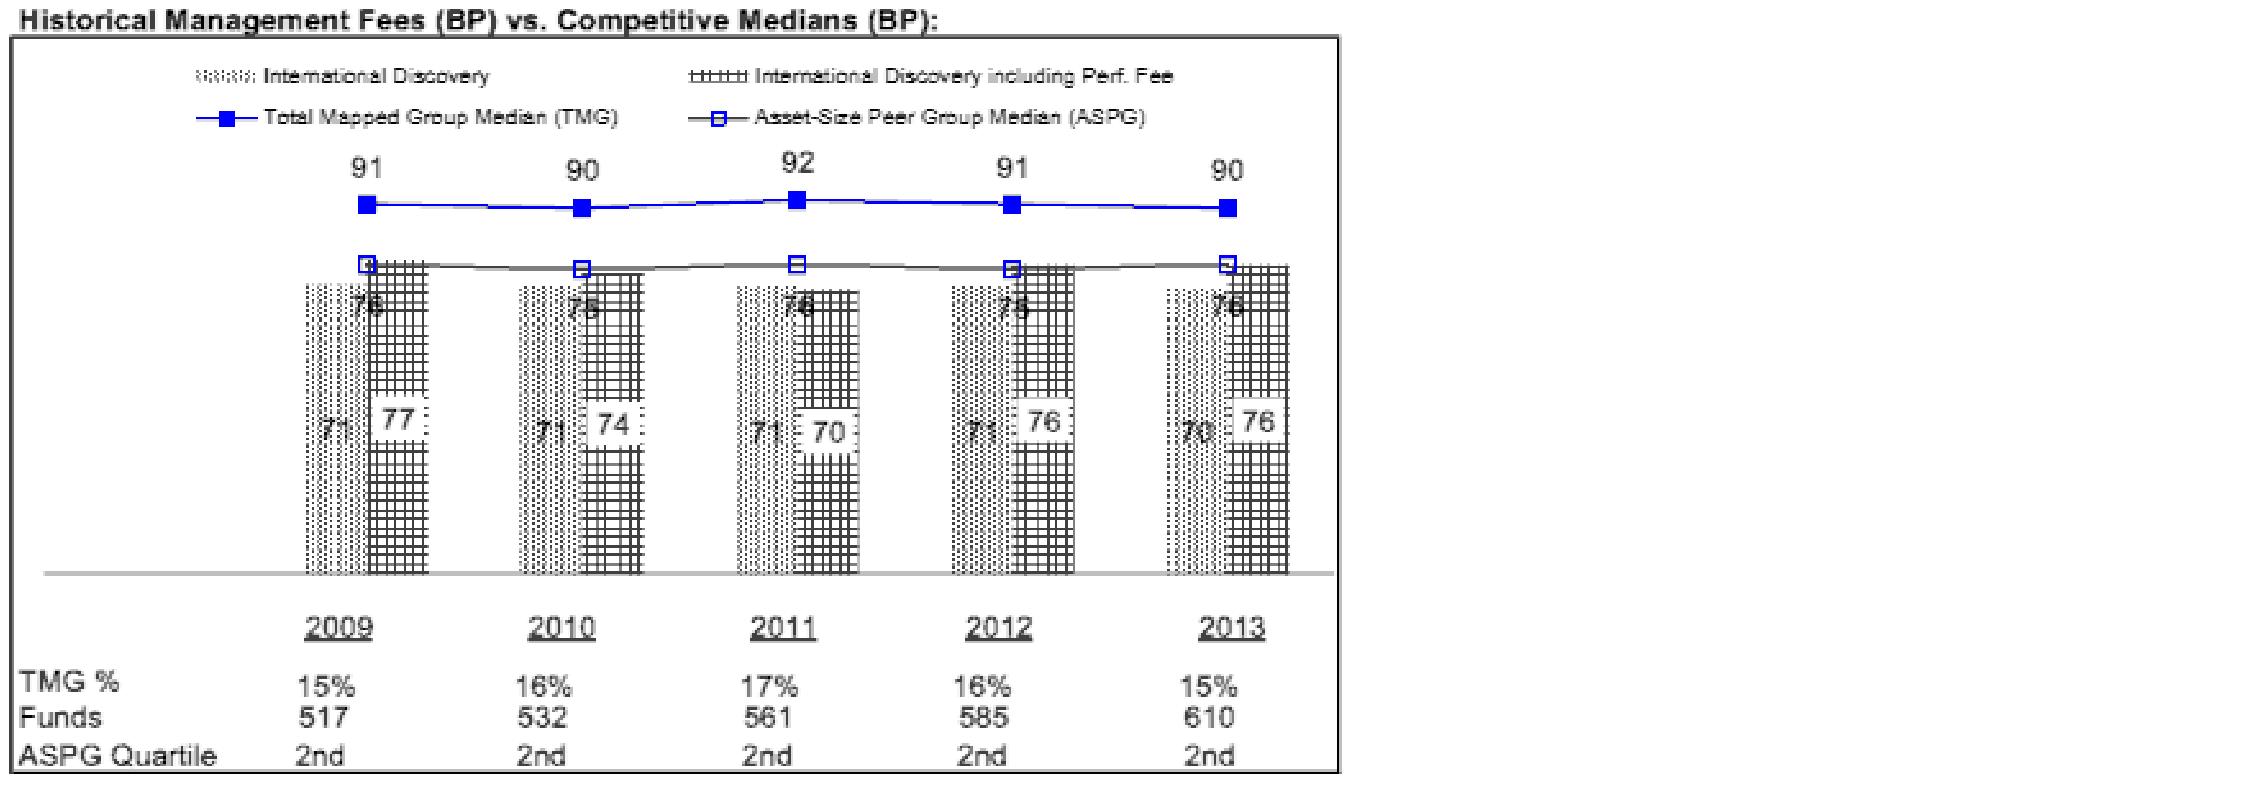
The Board noted that the fund's management fee rate ranked below the median of its Total Mapped Group and below the median of its ASPG for 2013. The Board also noted the effect of the fund's positive performance adjustment on the fund's management fee ranking.
Annual Report
Board Approval of Investment Advisory Contracts and
Management Fees - continued
Furthermore, the Board considered that, on July 16, 2014, after the periods shown in the chart above, it had approved a reduction (effective August 1, 2014) in the individual fund fee rate component of the management fee rate for the fund from 0.450% to 0.424%.
The Board also noted that, in August 2013, the ad hoc Committee on Management Fees was formed to conduct an in-depth review of the management fee rates of Fidelity's active equity mutual funds. The Committee focused on the following areas: (i) standard fee structures; (ii) research consumption and trading evolution; (iii) management fee competitiveness/profitability by category; and (iv) factors that drive institutional pricing.
Based on its review, the Board concluded that the fund's management fee is fair and reasonable in light of the services that the fund receives and the other factors considered.
Total Expense Ratio. In its review of each class's total expense ratio, the Board considered the fund's management fee as well as other fund or class expenses, as applicable, such as transfer agent fees, pricing and bookkeeping fees, fund-paid 12b-1 fees, and custodial, legal, and audit fees. The Board also noted the effects of any waivers and reimbursements on fees and expenses, as well as the impact of the fund's performance adjustment. As part of its review, the Board also considered the current and historical total expense ratios of each class of the fund compared to competitive fund median expenses. Each class of the fund is compared to those funds and classes in the Total Mapped Group (used by the Board for management fee comparisons) that have a similar sales load structure.
The Board noted that the total expense ratio of each of Class A, Class B, Class C, Institutional Class, Class Z, the retail class, and Class K ranked below its competitive median for 2013 and the total expense ratio of Class T ranked above its competitive median for 2013. The Board considered that, in general, various factors can affect total expense ratios. The Board noted that the total expense ratio of Class T was above the competitive median primarily because of higher 12b-1 fees on Class T as compared to most competitor funds. Class T has a higher 12b-1 fee, but a lower front-end sales charge, than traditionally priced front-end sales charge classes. The Board considered that Class T is primarily sold load-waived in the retirement plan market where its 0.50% 12b-1 fee is comparable to competing no-load, higher 12b-1 fee classes designed specifically for retirement plans. The Board noted that the fund offers multiple classes, each of which has a different sales load and 12b-1 fee structure, and that the multiple structures are intended to offer a range of pricing options for the intermediary market. The Board also noted that the total expense ratios of the classes vary primarily by the level of their 12b-1 fees, although differences in transfer agent fees may also cause expenses to vary from class to class.
Annual Report
Fees Charged to Other Fidelity Clients. The Board also considered Fidelity fee structures and other information with respect to clients of Fidelity, such as other funds advised or subadvised by Fidelity, pension plan clients, and other institutional clients. The Board noted the findings of the 2013 ad hoc joint committee (created with the board of other Fidelity funds), which reviewed and compared Fidelity's institutional investment advisory business with its business of providing services to the Fidelity funds, including the differences in services provided, fees charged, and costs incurred, as well as competition in their respective marketplaces.
Based on its review of total expense ratios and fees charged to other Fidelity clients, the Board concluded that the total expense ratio of each class of the fund was reasonable, although Class T was above the median of the universe presented for comparison, in light of the services that the fund and its shareholders receive and the other factors considered.
Costs of the Services and Profitability. The Board considered the revenues earned and the expenses incurred by Fidelity in conducting the business of developing, marketing, distributing, managing, administering and servicing the fund and servicing the fund's shareholders. The Board also considered the level of Fidelity's profits in respect of all the Fidelity funds.
On an annual basis, Fidelity presents to the Board Fidelity's profitability for the fund. Fidelity calculates the profitability for each fund, as well as aggregate profitability for groups of Fidelity funds and all Fidelity funds, using a series of detailed revenue and cost allocation methodologies which originate with the books and records of Fidelity on which Fidelity's audited financial statements are based. The Audit Committee of the Board reviews any significant changes from the prior year's methodologies.
PricewaterhouseCoopers LLP (PwC), independent registered public accounting firm and auditor to Fidelity and certain Fidelity funds, has been engaged annually by the Board as part of the Board's assessment of Fidelity's profitability analysis. PwC's engagement includes the review and assessment of the methodologies used by Fidelity in determining the revenues and expenses attributable to Fidelity's mutual fund business, and completion of agreed-upon procedures in respect of the mathematical accuracy of fund profitability and its conformity to established allocation methodologies. After considering PwC's reports issued under the engagement and information provided by Fidelity, the Board concluded that while other allocation methods may also be reasonable, Fidelity's profitability methodologies are reasonable in all material respects.
The Board also reviewed Fidelity's non-fund businesses and fall-out benefits related to the mutual fund business as well as cases where Fidelity's affiliates may benefit from or be related to the fund's business.
Annual Report
Board Approval of Investment Advisory Contracts and
Management Fees - continued
The Board considered the costs of the services provided by and the profits realized by Fidelity in connection with the operation of the fund and was satisfied that the profitability was not excessive in the circumstances.
Economies of Scale. The Board considered whether there have been economies of scale in respect of the management of the Fidelity funds, whether the Fidelity funds (including the fund) have appropriately benefited from any such economies of scale, and whether there is potential for realization of any further economies of scale. The Board considered the extent to which the fund will benefit from economies of scale through increased services to the fund, through waivers or reimbursements, or through fee or expense ratio reductions. The Board also noted that in 2013, it and the boards of other Fidelity funds created an ad hoc committee (the Economies of Scale Committee) to analyze whether Fidelity attains economies of scale in respect of the management and servicing of the Fidelity funds, whether the Fidelity funds have appropriately benefited from such economies of scale, and whether there is potential for realization of any further economies of scale.
The Board recognized that the fund's management contract incorporates a "group fee" structure, which provides for lower group fee rates as total group assets increase, and for higher group fee rates as total group assets decrease (with "group assets" defined to include fund assets under FMR's management plus sector fund assets previously under FMR's management and currently managed by Fidelity SelectCo, LLC). FMR calculates the group fee rates based on a tiered asset "breakpoint" schedule that varies based on asset class. The Board considered that the group fee is designed to deliver the benefits of economies of scale to fund shareholders when total Fidelity fund assets increase, even if assets of any particular fund are unchanged or have declined, because some portion of Fidelity's costs are attributable to services provided to all Fidelity funds, and all funds benefit if those costs can be allocated among more assets. The Board concluded that, given the group fee structure, fund shareholders will benefit from lower management fees as group assets increase at the fund complex level, regardless of whether Fidelity achieves any such economies of scale.
The Board concluded, taking into account the analysis of the Economies of Scale Committee, that economies of scale, if any, are being appropriately shared between fund shareholders and Fidelity.
Additional Information Requested by the Board. In order to develop fully the factual basis for consideration of the Fidelity funds' Advisory Contracts, the Board requested and received additional information on certain topics, including: (i) fund performance trends and Fidelity's long-term strategies for certain funds; (ii) Fidelity's strategic marketing and product lineup goals; (iii) the methodology with respect to competitive fund data and peer group classifications; (iv) the arrangements with, and performance of, certain sub-advisers on behalf of the Fidelity funds, as well as certain proposed participating affiliate arrangements; (v) the realization of fall-out benefits in certain Fidelity business units; (vi) Fidelity's group fee structures, including the rationale for the individual fee rates of certain categories of funds and the definition of group assets; (vii) trends regarding industry use of performance fee structures and the performance adjustment methodologies applicable to the Fidelity funds; (viii) additional competitive analysis regarding the total expenses for certain classes; (ix) fund profitability methodology, including Fidelity's cost allocation methodology, and the impact of certain factors on fund profitability results; and (x) the process by which Fidelity determines sub-advisory fees for funds it advises.
Annual Report
Based on its evaluation of all of the conclusions noted above, and after considering all factors it believed relevant, the Board ultimately concluded that the advisory fee structures are fair and reasonable, and that the fund's Advisory Contracts should be renewed.
Annual Report
Investment Adviser
Fidelity Management & Research Company
Boston, MA
Investment Sub-Advisers
FMR Co., Inc.
Fidelity Management & Research
(U.K.) Inc.
FIL Investment Advisors
FIL Investments (Japan) Limited
FIL Investment Advisors (U.K.) Limited
Fidelity Management & Research
(Hong Kong) Limited
Fidelity Management & Research
(Japan) Limited
General Distributor
Fidelity Distributors Corporation
Smithfield, RI
Transfer and Service Agents
Fidelity Investments Institutional Operations Company, Inc.
Boston, MA
Fidelity Service Company, Inc.
Boston, MA
Custodian
The Northern Trust Company
Chicago, IL
(Fidelity Investment logo)(registered trademark)
AID-UANN-1214
1.806656.109
(Fidelity Investment logo)(registered trademark)
Fidelity Advisor®
International Discovery
Fund - Institutional Class
Annual Report
October 31, 2014
(Fidelity Cover Art)
Institutional Class is
a class of Fidelity®
International Discovery Fund
Contents
Performance | (Click Here) | How the fund has done over time. |
Management's Discussion of Fund Performance | (Click Here) | The Portfolio Manager's review of fund performance and strategy. |
Shareholder Expense Example | (Click Here) | An example of shareholder expenses. |
Investment Changes | (Click Here) | A summary of major shifts in the fund's investments over the past six months. |
Investments | (Click Here) | A complete list of the fund's investments with their market values. |
Financial Statements | (Click Here) | Statements of assets and liabilities, operations, and changes in net assets, as well as financial highlights. |
Notes | (Click Here) | Notes to financial statements. |
Report of Independent Registered Public Accounting Firm | (Click Here) | |
Trustees and Officers | (Click Here) | |
Distributions | (Click Here) | |
Board Approval of Investment Advisory Contracts and Management Fees | (Click Here) | |
To view a fund's proxy voting guidelines and proxy voting record for the 12-month period ended June 30, visit http://www.fidelity.com/proxyvotingresults or visit the Securities and Exchange Commission's (SEC) web site at http://www.sec.gov. You may also call 1-877-208-0098 to request a free copy of the proxy voting guidelines.
Standard & Poor's, S&P and S&P 500 are registered service marks of The McGraw-Hill Companies, Inc. and have been licensed for use by Fidelity Distributors Corporation.
Other third-party marks appearing herein are the property of their respective owners.
All other marks appearing herein are registered or unregistered trademarks or service marks of FMR LLC or an affiliated company. © 2014 FMR LLC. All rights reserved.
Annual Report
This report and the financial statements contained herein are submitted for the general information of the shareholders of the fund. This report is not authorized for distribution to prospective investors in the fund unless preceded or accompanied by an effective prospectus.
A fund files its complete schedule of portfolio holdings with the SEC for the first and third quarters of each fiscal year on Form N-Q. Forms N-Q are available on the SEC's web site at http://www.sec.gov. A fund's Forms N-Q may be reviewed and copied at the SEC's Public Reference Room in Washington, DC. Information regarding the operation of the SEC's Public Reference Room may be obtained by calling 1-800-SEC-0330. For a complete list of a fund's portfolio holdings, view the fund's most recent holdings listing, semiannual report, or annual report on Fidelity's web site at http://www.fidelity.com, http://www.advisor.fidelity.com, or http://www.401k.com, as applicable.
NOT FDIC INSURED • MAY LOSE VALUE • NO BANK GUARANTEE
Neither the fund nor Fidelity Distributors Corporation is a bank.
Annual Report
Average annual total return reflects the change in the value of an investment, assuming reinvestment of the class' distributions from dividend income and capital gains (the profits earned upon the sale of securities that have grown in value, if any) and assuming a constant rate of performance each year. The $10,000 table and the fund's returns do not reflect the deduction of taxes that a shareholder would pay on fund distributions or the redemption of fund shares. During periods of reimbursement by Fidelity, a fund's total return will be greater than it would be had the reimbursement not occurred. How a fund did yesterday is no guarantee of how it will do tomorrow.
Average Annual Total Returns
Periods ended October 31, 2014 | Past 1
year | Past 5
years | Past 10
years |
Institutional Class A, B | -0.01% | 8.10% | 7.09% |
A The initial offering of Institutional Class shares took place on January 6, 2005. Returns prior to January 6, 2005, are those of Fidelity® International Discovery Fund, the original class of the fund.
B Prior to October 1, 2004, the fund operated under certain different investment policies. The fund's historical performance may not represent its current investment policies.
$10,000 Over 10 Years
Let's say hypothetically that $10,000 was invested in Fidelity Advisor® International Discovery Fund - Institutional Class on October 31, 2004. The chart shows how the value of your investment would have changed, and also shows how the MSCI EAFE Index performed over the same period. See footnote A above for additional information regarding the performance of Institutional Class.
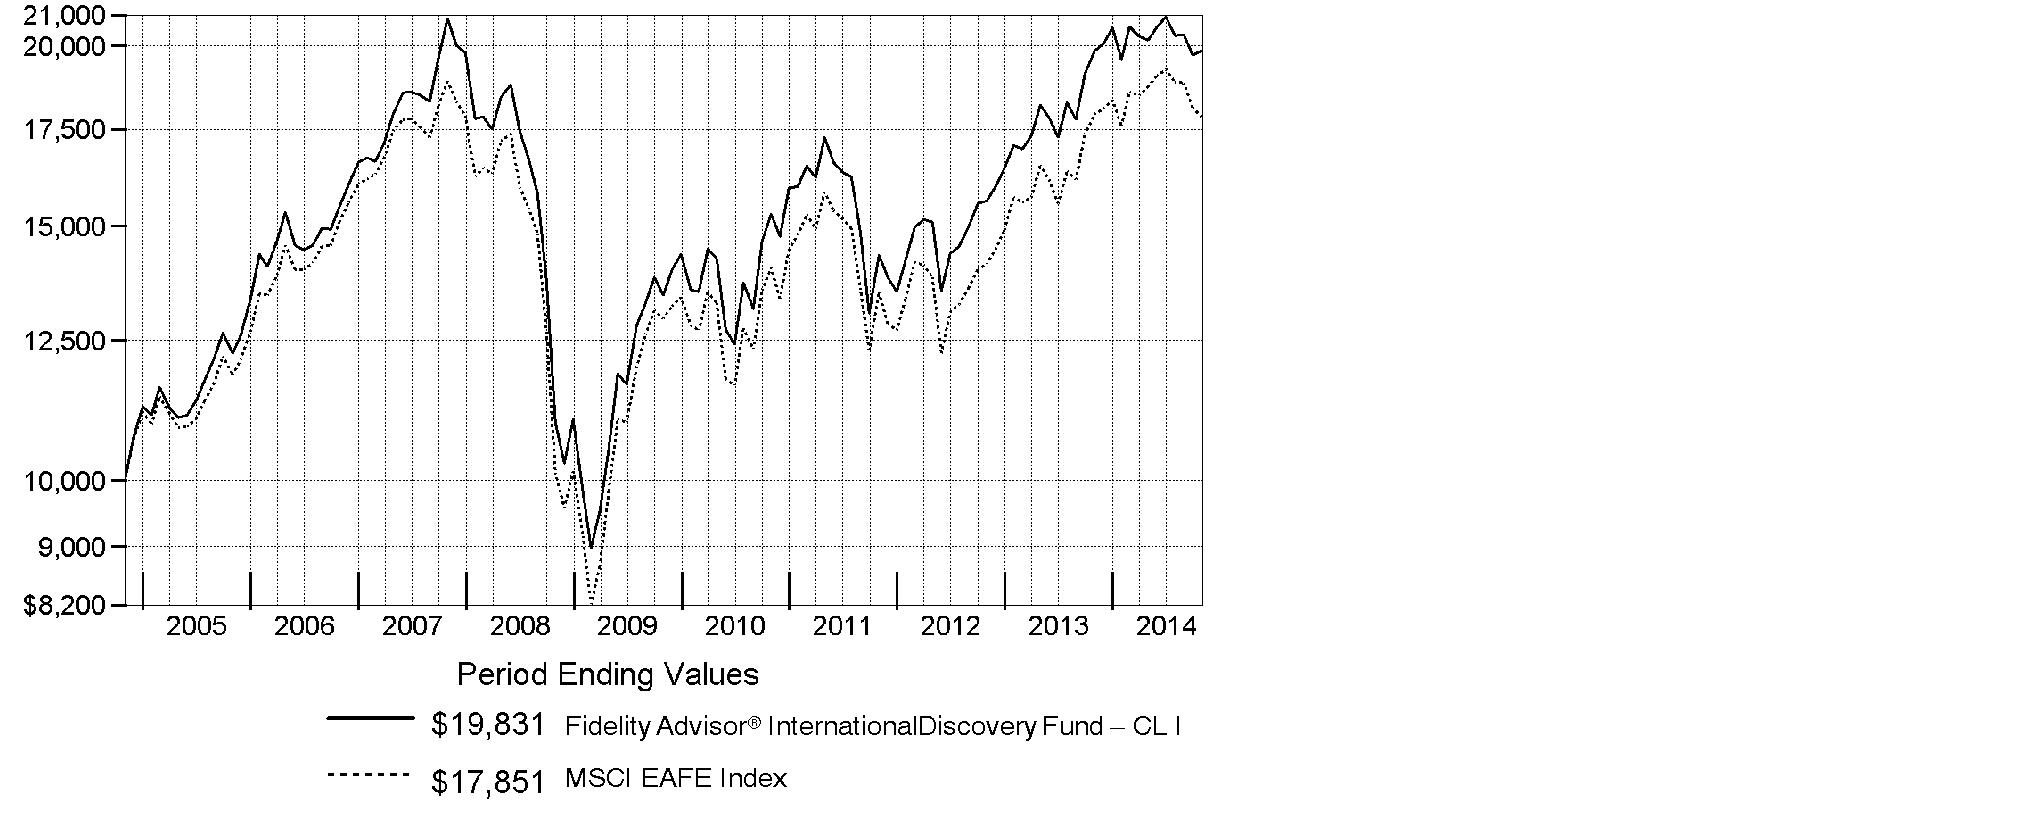
Annual Report
Market Recap: Global equities posted a healthy gain for the 12 months ending October 31, 2014, overcoming an October market decline driven by recessionary pressures in China and tepid growth in Europe. The MSCI ACWI (All Country World Index) Index rose 8.15%, helped by subdued market volatility for much of the period and supported by solid corporate earnings, especially in the United States. Stocks also benefited from easy monetary policies in Japan and the eurozone, as well as increased stimulus efforts in China. All but three of the 24 industry groups that compose the index marked a positive return. The U.S. (+17%) remained a pillar of strength, while a strongly rising dollar in the latter part of the period detracted from investors' returns in most non-U.S. markets. Canada (+5%) notched broad gains outside of its energy and materials sectors, as did Asia-Pacific ex Japan (+4%), led by investor enthusiasm for companies in India. The U.K., Europe and Japan, meanwhile, all underperformed. Among sectors, health care (+24%) led the index, with a strong contribution from the pharmaceuticals, biotechnology & life sciences industry. Information technology (+21%) also outperformed. Conversely, materials (-4%) and energy (-1%) lagged the index due to a higher supply of and lower demand for commodities.
Comments from William Kennedy, Portfolio Manager of Fidelity Advisor® International Discovery Fund: For the year, the fund's Institutional Class shares returned -0.01%, versus -0.48% for its benchmark, the MSCI EAFE Index. Security selection helped relative performance, particularly in health care, information technology and financials. The fund also benefited from out-of-index investments in the U.S. and emerging markets. Top individual contributors included U.K.-listed Hikma Pharmaceuticals, a Jordan-based company that specializes in injectable drugs. Its stock received a boost from U.S. market-share gains. Shares of pharmaceuticals company Actavis benefited from successful recent acquisitions and the tax advantage of its Ireland domicile. By contrast, security selection in industrials and consumer discretionary and in Europe ex U.K. detracted versus the index. In terms of individual disappointments, not owning Switzerland-based pharmaceuticals giant and index component Novartis hurt relative performance, as the company's strong patent portfolio and product pipeline drove sales growth and stock gains. An overweighting in ORIX, a high-quality diversified financials conglomerate in Japan, also detracted from results, as the weak local economy pressured near-term earnings growth.
The views expressed above reflect those of the portfolio manager(s) only through the end of the period as stated on the cover of this report and do not necessarily represent the views of Fidelity or any other person in the Fidelity organization. Any such views are subject to change at any time based upon market or other conditions and Fidelity disclaims any responsibility to update such views. These views may not be relied on as investment advice and, because investment decisions for a Fidelity fund are based on numerous factors, may not be relied on as an indication of trading intent on behalf of any Fidelity fund.
Annual Report
Shareholder Expense Example
As a shareholder of the Fund, you incur two types of costs: (1) transaction costs, including sales charges (loads) on purchase payments or redemption proceeds, redemption fees and (2) ongoing costs, including management fees, distribution and/or service (12b-1) fees and other Fund expenses. This Example is intended to help you understand your ongoing costs (in dollars) of investing in the Fund and to compare these costs with the ongoing costs of investing in other mutual funds.
The Example is based on an investment of $1,000 invested at the beginning of the period and held for the entire period (May 1, 2014 to October 31, 2014).
Actual Expenses
The first line of the accompanying table for each class of the Fund provides information about actual account values and actual expenses. You may use the information in this line, together with the amount you invested, to estimate the expenses that you paid over the period. Simply divide your account value by $1,000.00 (for example, an $8,600 account value divided by $1,000.00 = 8.6), then multiply the result by the number in the first line for a class of the Fund under the heading entitled "Expenses Paid During Period" to estimate the expenses you paid on your account during this period. A small balance maintenance fee of $12.00 that is charged once a year may apply for certain accounts with a value of less than $2,000. This fee is not included in the table below. If it was, the estimate of expenses you paid during the period would be higher, and your ending account value lower, by this amount. In addition, the Fund, as a shareholder in the underlying Fidelity Central Funds, will indirectly bear its pro-rata share of the fees and expenses incurred by the underlying Fidelity Central Funds. These fees and expenses are not included in the Fund's annualized expense ratio used to calculate the expense estimate in the table below.
Hypothetical Example for Comparison Purposes
The second line of the accompanying table for each class of the Fund provides information about hypothetical account values and hypothetical expenses based on a Class' actual expense ratio and an assumed rate of return of 5% per year before expenses, which is not the Class' actual return. The hypothetical account values and expenses may not be used to estimate the actual ending account balance or expenses you paid for the period. You may use this information to compare the ongoing costs of investing in the Fund and other funds. To do so, compare this 5% hypothetical example with the 5% hypothetical examples that appear in the shareholder reports of the other funds. A small balance maintenance fee of $12.00 that is charged once a year may apply for certain accounts with a value of less than $2,000. This fee is not included in the table below. If it was, the estimate of expenses you paid during the period would be higher, and your ending account value lower, by this amount. In addition, the Fund, as a shareholder in the underlying Fidelity Central Funds, will indirectly bear its pro-rata share of the fees and expenses incurred by the underlying Fidelity Central Funds. These fees and expenses are not included in the Fund's annualized expense ratio used to calculate the expense estimate in the table below.
Please note that the expenses shown in the table are meant to highlight your ongoing costs only and do not reflect any transaction costs. Therefore, the second line of the table is useful in comparing ongoing costs only, and will not help you determine the relative total costs of owning different funds. In addition, if these transactional costs were included, your costs would have been higher.
Annual Report
| Annualized
Expense RatioB | Beginning
Account Value
May 1, 2014 | Ending
Account Value
October 31, 2014 | Expenses Paid
During Period*
May 1, 2014
to October 31, 2014 |
Class A | 1.27% | | | |
Actual | | $ 1,000.00 | $ 981.00 | $ 6.34 |
HypotheticalA | | $ 1,000.00 | $ 1,018.80 | $ 6.46 |
Class T | 1.50% | | | |
Actual | | $ 1,000.00 | $ 979.90 | $ 7.49 |
HypotheticalA | | $ 1,000.00 | $ 1,017.64 | $ 7.63 |
Class B | 2.04% | | | |
Actual | | $ 1,000.00 | $ 977.10 | $ 10.17 |
HypotheticalA | | $ 1,000.00 | $ 1,014.92 | $ 10.36 |
Class C | 2.02% | | | |
Actual | | $ 1,000.00 | $ 977.30 | $ 10.07 |
HypotheticalA | | $ 1,000.00 | $ 1,015.02 | $ 10.26 |
International Discovery | .92% | | | |
Actual | | $ 1,000.00 | $ 982.60 | $ 4.60 |
HypotheticalA | | $ 1,000.00 | $ 1,020.57 | $ 4.69 |
Class K | .79% | | | |
Actual | | $ 1,000.00 | $ 983.10 | $ 3.95 |
HypotheticalA | | $ 1,000.00 | $ 1,021.22 | $ 4.02 |
Institutional Class | .93% | | | |
Actual | | $ 1,000.00 | $ 982.60 | $ 4.65 |
HypotheticalA | | $ 1,000.00 | $ 1,020.52 | $ 4.74 |
Class Z | .81% | | | |
Actual | | $ 1,000.00 | $ 983.30 | $ 4.05 |
HypotheticalA | | $ 1,000.00 | $ 1,021.12 | $ 4.13 |
A 5% return per year before expenses
B Annualized expense ratio reflects expenses net of applicable fee waivers.
* Expenses are equal to each Class' annualized expense ratio, multiplied by the average account value over the period, multiplied by 184/365 (to reflect the one-half year period).
Annual Report
Investment Changes (Unaudited)
Geographic Diversification (% of fund's net assets) |
As of October 31, 2014 |
 | Japan 17.1% | |
 | United Kingdom 14.9% | |
 | United States of America* 9.2% | |
 | Germany 6.7% | |
 | Switzerland 6.0% | |
 | France 5.1% | |
 | Australia 4.3% | |
 | Sweden 4.1% | |
 | India 3.2% | |
 | Other 29.4% | |

* Includes Short-Term Investments and Net Other Assets (Liabilities) |
Percentages are based on country or territory of incorporation and are adjusted for the effect of futures contracts, if applicable. |
As of April 30, 2014 |
| Japan 16.3% | |
| United Kingdom 14.4% | |
| Germany 10.3% | |
| United States of America* 9.5% | |
| France 8.9% | |
| Switzerland 5.5% | |
| Sweden 5.2% | |
| Spain 3.0% | |
| Netherlands 2.7% | |
| Other 24.2% | |

* Includes Short-Term Investments and Net Other Assets (Liabilities) |
Percentages are based on country or territory of incorporation and are adjusted for the effect of futures contracts, if applicable. |
Asset Allocation as of October 31, 2014 |
| % of fund's
net assets | % of fund's net assets
6 months ago |
Stocks and Equity Futures | 97.5 | 96.0 |
Other Investments | 0.1 | 0.1 |
Short-Term Investments and Net Other Assets (Liabilities) | 2.4 | 3.9 |
Top Ten Stocks as of October 31, 2014 |
| % of fund's
net assets | % of fund's net assets
6 months ago |
Roche Holding AG (participation certificate) (Switzerland, Pharmaceuticals) | 2.5 | 2.3 |
Total SA (France, Oil, Gas & Consumable Fuels) | 1.9 | 2.0 |
Australia & New Zealand Banking Group Ltd. (Australia, Banks) | 1.7 | 1.8 |
Bayer AG (Germany, Pharmaceuticals) | 1.6 | 1.8 |
Astellas Pharma, Inc. (Japan, Pharmaceuticals) | 1.4 | 0.9 |
Keyence Corp. (Japan, Electronic Equipment & Components) | 1.3 | 1.0 |
Actavis PLC (Ireland, Pharmaceuticals) | 1.3 | 0.5 |
Housing Development Finance Corp. Ltd. (India, Thrifts & Mortgage Finance) | 1.2 | 0.8 |
Japan Tobacco, Inc. (Japan, Tobacco) | 1.2 | 1.1 |
Anheuser-Busch InBev SA NV (Belgium, Beverages) | 1.2 | 1.1 |
| 15.3 | |
Market Sectors as of October 31, 2014 |
| % of fund's
net assets | % of fund's net assets
6 months ago |
Financials | 20.7 | 21.1 |
Health Care | 14.9 | 12.4 |
Consumer Discretionary | 12.9 | 14.8 |
Information Technology | 10.7 | 8.3 |
Consumer Staples | 10.7 | 8.4 |
Industrials | 10.4 | 14.6 |
Energy | 5.6 | 3.5 |
Materials | 4.7 | 5.4 |
Telecommunication Services | 3.9 | 5.1 |
Utilities | 0.2 | 0.2 |
Annual Report
Investments October 31, 2014
Showing Percentage of Net Assets
Common Stocks - 93.6% |
| Shares | | Value (000s) |
Australia - 4.3% |
Ansell Ltd. | 2,499,254 | | $ 43,839 |
Asaleo Care Ltd. (a) | 23,409,115 | | 41,813 |
Australia & New Zealand Banking Group Ltd. | 6,493,040 | | 192,133 |
G8 Education Ltd. | 5,831,484 | | 25,767 |
Greencross Ltd. | 1,186,547 | | 8,960 |
Ramsay Health Care Ltd. | 1,215,729 | | 56,201 |
Regis Healthcare Ltd. (a) | 4,596,817 | | 17,433 |
Spotless Group Holdings Ltd. | 18,983,369 | | 32,120 |
Woodside Petroleum Ltd. | 1,705,042 | | 60,564 |
TOTAL AUSTRALIA | | 478,830 |
Austria - 0.2% |
Andritz AG | 455,300 | | 21,978 |
Bailiwick of Jersey - 1.9% |
Glencore Xstrata PLC | 9,661,966 | | 49,445 |
MySale Group PLC (f) | 8,571,600 | | 26,053 |
Shire PLC | 1,110,100 | | 74,484 |
Wolseley PLC | 1,030,400 | | 54,675 |
TOTAL BAILIWICK OF JERSEY | | 204,657 |
Belgium - 1.9% |
Anheuser-Busch InBev SA NV | 1,183,927 | | 131,291 |
Arseus NV | 252,964 | | 10,112 |
KBC Groupe SA (a) | 1,328,201 | | 71,155 |
TOTAL BELGIUM | | 212,558 |
Bermuda - 1.1% |
BW Offshore Ltd. | 8,689,300 | | 10,654 |
Noble Group Ltd. | 22,526,000 | | 20,969 |
PAX Global Technology Ltd. (a)(f) | 66,294,000 | | 71,203 |
Travelport Worldwide Ltd. (e) | 1,324,600 | | 19,140 |
TOTAL BERMUDA | | 121,966 |
Canada - 3.1% |
Alimentation Couche-Tard, Inc. Class B (sub. vtg.) | 1,346,700 | | 45,705 |
Constellation Software, Inc. | 266,500 | | 75,075 |
First Quantum Minerals Ltd. (e) | 1,164,300 | | 17,562 |
Imperial Oil Ltd. | 1,205,500 | | 58,005 |
Potash Corp. of Saskatchewan, Inc. | 813,500 | | 27,767 |
PrairieSky Royalty Ltd. (e) | 1,530,400 | | 47,118 |
Common Stocks - continued |
| Shares | | Value (000s) |
Canada - continued |
Suncor Energy, Inc. | 1,036,600 | | $ 36,808 |
TransForce, Inc. (e) | 1,412,400 | | 34,538 |
TOTAL CANADA | | 342,578 |
Cayman Islands - 2.1% |
Alibaba Group Holding Ltd. sponsored ADR | 927,200 | | 91,422 |
Baidu.com, Inc. sponsored ADR (a) | 175,200 | | 41,833 |
ENN Energy Holdings Ltd. | 3,266,000 | | 21,191 |
Greatview Aseptic Pack Co. Ltd. | 26,392,000 | | 17,374 |
Sands China Ltd. | 3,748,400 | | 23,379 |
WuXi PharmaTech Cayman, Inc. sponsored ADR (a) | 841,400 | | 31,721 |
TOTAL CAYMAN ISLANDS | | 226,920 |
China - 0.0% |
Yantai Changyu Pioneer Wine Co. Ltd. (B Shares) | 485,600 | | 1,526 |
Colombia - 0.2% |
Grupo Aval Acciones y Valores SA ADR | 1,645,837 | | 22,186 |
Cyprus - 0.0% |
SPDI Secure Property Development & Investment PLC (a) | 529,830 | | 479 |
Denmark - 2.0% |
ISS Holdings A/S (a) | 384,000 | | 10,706 |
Novo Nordisk A/S Series B | 2,298,245 | | 103,887 |
Pandora A/S | 514,000 | | 43,270 |
Vestas Wind Systems A/S (a) | 1,874,500 | | 62,741 |
TOTAL DENMARK | | 220,604 |
Finland - 0.8% |
Sampo Oyj (A Shares) | 1,739,800 | | 83,219 |
France - 5.1% |
Atos Origin SA | 531,441 | | 36,689 |
AXA SA | 1,839,400 | | 42,436 |
BNP Paribas SA | 1,039,745 | | 65,330 |
Bureau Veritas SA | 737,700 | | 18,239 |
Havas SA | 5,933,668 | | 47,961 |
Numericable Group SA (e) | 483,713 | | 17,882 |
Numericable Group SA rights 11/12/14 (a)(e) | 483,713 | | 14,342 |
Rexel SA | 1,107,782 | | 18,609 |
Schneider Electric SA | 798,800 | | 62,944 |
SR Teleperformance SA | 297,200 | | 18,719 |
Total SA | 3,562,400 | | 212,687 |
TOTAL FRANCE | | 555,838 |
Common Stocks - continued |
| Shares | | Value (000s) |
Germany - 5.7% |
Aareal Bank AG | 1,044,895 | | $ 44,743 |
Bayer AG | 1,224,000 | | 174,016 |
Continental AG | 306,500 | | 60,168 |
Drillisch AG | 2,022,600 | | 70,184 |
GEA Group AG | 1,508,060 | | 69,347 |
KION Group AG | 1,429,749 | | 51,995 |
LEG Immobilien AG | 610,854 | | 42,140 |
Siemens AG | 727,119 | | 82,014 |
Symrise AG | 500,800 | | 28,163 |
TOTAL GERMANY | | 622,770 |
Hong Kong - 2.2% |
AIA Group Ltd. | 22,053,600 | | 123,068 |
Techtronic Industries Co. Ltd. | 39,683,000 | | 124,232 |
TOTAL HONG KONG | | 247,300 |
India - 3.2% |
Bharti Infratel Ltd. | 11,032,464 | | 52,872 |
Container Corp. of India Ltd. | 470,441 | | 10,379 |
Housing Development Finance Corp. Ltd. | 7,555,494 | | 136,069 |
Info Edge India Ltd. | 1,609,886 | | 22,122 |
Lupin Ltd. | 2,986,357 | | 69,144 |
The Jammu & Kashmir Bank Ltd. | 7,127,060 | | 16,146 |
Titan Co. Ltd. (a) | 2,240,879 | | 14,720 |
Yes Bank Ltd. | 3,138,775 | | 35,543 |
TOTAL INDIA | | 356,995 |
Indonesia - 0.8% |
PT Bank Central Asia Tbk | 41,701,500 | | 45,018 |
PT Bank Rakyat Indonesia Tbk | 44,669,800 | | 40,935 |
TOTAL INDONESIA | | 85,953 |
Ireland - 2.8% |
Actavis PLC (a) | 586,200 | | 142,294 |
Bank of Ireland (a) | 63,590,200 | | 25,142 |
Glanbia PLC | 2,424,800 | | 34,215 |
James Hardie Industries PLC CDI | 3,230,390 | | 34,457 |
Kerry Group PLC Class A | 1,035,200 | | 70,299 |
TOTAL IRELAND | | 306,407 |
Italy - 1.0% |
De Longhi SpA | 2,375,100 | | 46,372 |
Common Stocks - continued |
| Shares | | Value (000s) |
Italy - continued |
Telecom Italia SpA (a)(e) | 42,790,100 | | $ 48,493 |
World Duty Free SpA (a) | 2,253,904 | | 19,079 |
TOTAL ITALY | | 113,944 |
Japan - 17.1% |
ABC-MART, Inc. | 398,400 | | 22,972 |
ACOM Co. Ltd. (a) | 7,381,200 | | 24,603 |
Aozora Bank Ltd. | 11,251,000 | | 39,546 |
Astellas Pharma, Inc. | 10,267,800 | | 159,361 |
Coca-Cola Central Japan Co. Ltd. | 1,597,500 | | 28,744 |
Dentsu, Inc. | 899,500 | | 33,443 |
Don Quijote Holdings Co. Ltd. | 898,200 | | 53,816 |
Hitachi Ltd. | 6,659,000 | | 52,323 |
Hoya Corp. | 2,822,900 | | 99,894 |
Japan Exchange Group, Inc. | 2,358,200 | | 58,498 |
Japan Tobacco, Inc. | 3,948,700 | | 134,726 |
KDDI Corp. | 1,626,800 | | 106,831 |
Keyence Corp. | 304,060 | | 147,342 |
NEC Corp. | 26,163,000 | | 92,522 |
Nippon Kanzai Co. Ltd. | 8,000 | | 209 |
Olympus Corp. (a) | 1,501,000 | | 53,894 |
OMRON Corp. | 2,083,000 | | 98,598 |
ORIX Corp. | 5,463,900 | | 75,840 |
Park24 Co. Ltd. | 1,342,800 | | 20,319 |
Rakuten, Inc. | 5,927,100 | | 66,837 |
Santen Pharmaceutical Co. Ltd. | 583,800 | | 34,845 |
Seven & i Holdings Co., Ltd. | 2,748,600 | | 107,350 |
Seven Bank Ltd. | 17,781,300 | | 74,262 |
Ship Healthcare Holdings, Inc. | 1,076,700 | | 25,201 |
SoftBank Corp. | 1,575,100 | | 114,666 |
Sundrug Co. Ltd. | 825,500 | | 39,878 |
Toshiba Plant Systems & Services Corp. | 1,771,500 | | 29,652 |
Tsuruha Holdings, Inc. | 1,212,600 | | 71,593 |
VT Holdings Co. Ltd. | 3,967,000 | | 15,667 |
TOTAL JAPAN | | 1,883,432 |
Korea (South) - 0.7% |
Naturalendo Tech Co. Ltd. | 167,866 | | 8,765 |
NAVER Corp. | 65,859 | | 46,217 |
Samsung SDI Co. Ltd. | 200,556 | | 23,519 |
TOTAL KOREA (SOUTH) | | 78,501 |
Common Stocks - continued |
| Shares | | Value (000s) |
Luxembourg - 0.6% |
Altice SA | 759,700 | | $ 47,306 |
Grand City Properties SA (a) | 1,543,962 | | 19,783 |
TOTAL LUXEMBOURG | | 67,089 |
Marshall Islands - 0.1% |
Hoegh LNG Partners LP | 591,451 | | 12,426 |
Netherlands - 2.5% |
AEGON NV | 5,028,800 | | 40,987 |
AerCap Holdings NV (a) | 1,672,000 | | 72,464 |
IMCD Group BV | 1,902,200 | | 52,442 |
ING Groep NV (Certificaten Van Aandelen) (a) | 3,830,600 | | 54,856 |
LyondellBasell Industries NV Class A | 8,700 | | 797 |
Royal DSM NV | 787,237 | | 49,292 |
TOTAL NETHERLANDS | | 270,838 |
New Zealand - 0.7% |
EBOS Group Ltd. | 4,569,842 | | 34,090 |
Ryman Healthcare Group Ltd. | 7,311,565 | | 43,258 |
TOTAL NEW ZEALAND | | 77,348 |
Philippines - 0.7% |
Alliance Global Group, Inc. | 77,786,166 | | 43,752 |
SM Investments Corp. | 1,681,790 | | 29,306 |
TOTAL PHILIPPINES | | 73,058 |
Portugal - 0.2% |
CTT Correios de Portugal SA | 2,226,700 | | 20,621 |
Singapore - 0.2% |
Ezion Holdings Ltd. | 15,127,200 | | 17,814 |
South Africa - 0.4% |
Naspers Ltd. Class N | 369,200 | | 45,947 |
Spain - 2.6% |
Amadeus IT Holding SA Class A | 2,349,200 | | 86,256 |
Atresmedia Corporacion de Medios de Comunicacion SA | 1,515,400 | | 22,200 |
Banco Bilbao Vizcaya Argentaria SA | 4,806,144 | | 53,756 |
Criteria CaixaCorp SA | 10,039,365 | | 54,739 |
Inditex SA | 2,408,395 | | 67,650 |
TOTAL SPAIN | | 284,601 |
Sweden - 4.1% |
ASSA ABLOY AB (B Shares) | 2,357,200 | | 124,849 |
H&M Hennes & Mauritz AB (B Shares) | 1,057,821 | | 42,074 |
Common Stocks - continued |
| Shares | | Value (000s) |
Sweden - continued |
HEXPOL AB (B Shares) | 341,200 | | $ 30,173 |
Intrum Justitia AB | 1,211,317 | | 35,991 |
Nordea Bank AB | 9,576,600 | | 122,818 |
Svenska Cellulosa AB (SCA) (B Shares) | 1,118,800 | | 25,015 |
Svenska Handelsbanken AB (A Shares) | 1,425,600 | | 67,977 |
TOTAL SWEDEN | | 448,897 |
Switzerland - 6.0% |
Clariant AG (Reg.) | 2,358,150 | | 41,053 |
Compagnie Financiere Richemont SA Series A | 530,511 | | 44,634 |
Lonza Group AG | 521,951 | | 57,449 |
Partners Group Holding AG | 230,056 | | 61,151 |
Roche Holding AG (participation certificate) | 926,232 | | 273,335 |
Schindler Holding AG (participation certificate) | 194,920 | | 27,228 |
Sonova Holding AG Class B | 339,424 | | 52,846 |
UBS AG | 6,126,361 | | 106,526 |
TOTAL SWITZERLAND | | 664,222 |
Taiwan - 0.3% |
ECLAT Textile Co. Ltd. | 94,607 | | 901 |
Merida Industry Co. Ltd. | 4,995,900 | | 34,456 |
TOTAL TAIWAN | | 35,357 |
Turkey - 0.1% |
Logo Yazilim Sanayi Ve Ticar (a) | 1,125,049 | | 13,211 |
United Arab Emirates - 0.1% |
Emaar Malls Group PJSC (a) | 7,174,619 | | 6,270 |
United Kingdom - 14.9% |
Aberdeen Asset Management PLC | 5,975,132 | | 41,484 |
Advanced Computer Software Group PLC | 5,750,200 | | 9,934 |
Al Noor Hospitals Group PLC | 2,487,400 | | 40,547 |
Anglo American PLC (United Kingdom) | 1,316,500 | | 27,796 |
Associated British Foods PLC | 791,000 | | 34,848 |
B&M European Value Retail S.A. | 6,402,976 | | 25,479 |
BG Group PLC | 6,766,700 | | 112,774 |
BHP Billiton PLC | 4,625,988 | | 119,520 |
British American Tobacco PLC (United Kingdom) | 2,261,200 | | 128,159 |
BTG PLC (a) | 1,152,900 | | 13,924 |
Bunzl PLC | 1,143,100 | | 30,995 |
Diageo PLC | 3,650,857 | | 107,672 |
Exova Group Ltd. PLC (a) | 4,302,877 | | 11,684 |
Galiform PLC | 5,687,600 | | 31,144 |
Common Stocks - continued |
| Shares | | Value (000s) |
United Kingdom - continued |
Hikma Pharmaceuticals PLC | 3,032,490 | | $ 91,928 |
ITV PLC | 14,738,700 | | 47,862 |
Jazztel PLC (a) | 2,320,066 | | 37,040 |
Liberty Global PLC: | | | |
Class A (a) | 677,800 | | 30,820 |
Class C | 677,800 | | 30,142 |
Lloyds Banking Group PLC (a) | 54,946,900 | | 67,853 |
London Stock Exchange Group PLC | 3,415,236 | | 110,087 |
Melrose PLC | 11,027,800 | | 45,179 |
Next PLC | 774,844 | | 79,887 |
Persimmon PLC | 1,505,600 | | 35,236 |
Poundland Group PLC (a) | 3,906,035 | | 19,683 |
Reckitt Benckiser Group PLC | 788,600 | | 66,230 |
Rex Bionics PLC (a)(f) | 1,328,936 | | 3,518 |
Rotork PLC | 717,800 | | 29,338 |
SABMiller PLC | 1,107,300 | | 62,440 |
St. James's Place Capital PLC | 5,676,000 | | 67,645 |
Taylor Wimpey PLC | 12,002,700 | | 22,734 |
The Restaurant Group PLC | 1,992,100 | | 21,558 |
Ultra Electronics Holdings PLC | 614,667 | | 17,158 |
Vodafone Group PLC | 2,127,096 | | 7,074 |
Zoopla Property Group PLC | 2,595,500 | | 8,603 |
TOTAL UNITED KINGDOM | | 1,637,975 |
United States of America - 3.9% |
Chevron Corp. | 560,500 | | 67,232 |
Constellation Brands, Inc. Class A (sub. vtg.) (a) | 505,400 | | 46,264 |
Google, Inc.: | | | |
Class A (a) | 90,700 | | 51,506 |
Class C (a) | 90,700 | | 50,709 |
Las Vegas Sands Corp. | 177,700 | | 11,064 |
McGraw Hill Financial, Inc. | 1,415,500 | | 128,074 |
Visa, Inc. Class A | 301,900 | | 72,888 |
TOTAL UNITED STATES OF AMERICA | | 427,737 |
TOTAL COMMON STOCKS (Cost $8,985,470) |
10,292,052
|
Nonconvertible Preferred Stocks - 1.0% |
| | | |
Germany - 1.0% |
Volkswagen AG | 514,100 | | 109,554 |
Nonconvertible Preferred Stocks - continued |
| Shares | | Value (000s) |
United Kingdom - 0.0% |
Rolls-Royce Group PLC | 227,278,350 | | $ 364 |
TOTAL NONCONVERTIBLE PREFERRED STOCKS (Cost $113,684) |
109,918
|
Government Obligations - 0.1% |
| Principal
Amount (000s) (d) | | |
United States of America - 0.1% |
U.S. Treasury Bills, yield at date of purchase 0.02% to 0.03% 11/13/14 to 1/29/15 (i)
(Cost $11,590) | | $ 11,590 | |
11,590
|
Preferred Securities - 0.1% |
|
Ireland - 0.1% |
Baggot Securities Ltd. 10.24% (g)(h)
(Cost $14,037) | EUR | 9,140 | |
12,947
|
Money Market Funds - 5.6% |
| Shares | | |
Fidelity Cash Central Fund, 0.11% (b) | 567,797,475 | | 567,797 |
Fidelity Securities Lending Cash Central Fund, 0.11% (b)(c) | 52,624,430 | | 52,624 |
TOTAL MONEY MARKET FUNDS (Cost $620,421) |
620,421
|
TOTAL INVESTMENT PORTFOLIO - 100.4% (Cost $9,745,202) | | 11,046,928 |
NET OTHER ASSETS (LIABILITIES) - (0.4)% | | (48,377) |
NET ASSETS - 100% | $ 10,998,551 |
Futures Contracts |
| Expiration Date | | Underlying Face Amount at Value (000s) | | Unrealized Appreciation/
(Depreciation)
(000s) |
Purchased |
Equity Index Contracts |
3,792 CME Nikkei 225 Index Contracts (United States) | Dec. 2014 | | $ 323,647 | | $ 24,598 |
|
The face value of futures purchased as a percentage of net assets is 2.9% |
Currency Abbreviations |
EUR | - | European Monetary Unit |
Legend |
(a) Non-income producing |
(b) Affiliated fund that is generally available only to investment companies and other accounts managed by Fidelity Investments. The rate quoted is the annualized seven-day yield of the fund at period end. A complete unaudited listing of the fund's holdings as of its most recent quarter end is available upon request. In addition, each Fidelity Central Fund's financial statements, which are not covered by the Fund's Report of Independent Registered Public Accounting Firm, are available on the SEC's website or upon request. |
(c) Investment made with cash collateral received from securities on loan. |
(d) Amount is stated in United States dollars unless otherwise noted. |
(e) Security or a portion of the security is on loan at period end. |
(f) Affiliated company |
(g) Security exempt from registration under Rule 144A of the Securities Act of 1933. These securities may be resold in transactions exempt from registration, normally to qualified institutional buyers. At the end of the period, the value of these securities amounted to $12,947,000 or 0.1% of net assets. |
(h) Security is perpetual in nature with no stated maturity date. |
(i) Security or a portion of the security was pledged to cover margin requirements for futures contracts. At period end, the value of securities pledged amounted to $11,590,000. |
Affiliated Central Funds |
Information regarding fiscal year to date income earned by the Fund from investments in Fidelity Central Funds is as follows: |
Fund | Income earned
(Amounts in thousands) |
Fidelity Cash Central Fund | $ 600 |
Fidelity Securities Lending Cash Central Fund | 5,278 |
Total | $ 5,878 |
Other Affiliated Issuers |
An affiliated company is a company in which the Fund has ownership of at least 5% of the voting securities. Fiscal year to date transactions with companies which are or were affiliates are as follows: |
Affiliate
(Amounts in thousands) | Value,
beginning of
period | Purchases | Sales Proceeds | Dividend Income | Value,
end of
period |
MySale Group PLC | $ - | $ 32,521 | $ - | $ - | $ 26,053 |
PAX Global Technology Ltd. | - | 39,641 | 3,956 | - | 71,203 |
Rex Bionics PLC | - | 4,037 | - | - | 3,518 |
Total | $ - | $ 76,199 | $ 3,956 | $ - | $ 100,774 |
Other Information |
Categorizations in the Schedule of Investments are based on country or territory of incorporation. |
The following is a summary of the inputs used, as of October 31, 2014, involving the Fund's assets and liabilities carried at fair value. The inputs or methodology used for valuing securities may not be an indication of the risk associated with investing in those securities. For more information on valuation inputs, and their aggregation into the levels used in the table below, please refer to the Investment Valuation section in the accompanying Notes to Financial Statements. |
Valuation Inputs at Reporting Date: |
Description
(Amounts in thousands) | Total | Level 1 | Level 2 | Level 3 |
Investments in Securities: | | | | |
Equities: | | | | |
Consumer Discretionary | $ 1,445,431 | $ 1,029,241 | $ 416,190 | $ - |
Consumer Staples | 1,177,768 | 385,016 | 792,752 | - |
Energy | 636,082 | 232,243 | 403,839 | - |
Financials | 2,262,497 | 1,051,716 | 1,210,781 | - |
Health Care | 1,634,986 | 714,402 | 920,584 | - |
Industrials | 1,109,082 | 840,362 | 268,720 | - |
Information Technology | 1,181,932 | 597,928 | 584,004 | - |
Materials | 495,841 | 296,694 | 199,147 | - |
Telecommunication Services | 437,160 | 107,224 | 329,936 | - |
Utilities | 21,191 | - | 21,191 | - |
Government Obligations | 11,590 | - | 11,590 | - |
Preferred Securities | 12,947 | - | 12,947 | - |
Money Market Funds | 620,421 | 620,421 | - | - |
Total Investments in Securities: | $ 11,046,928 | $ 5,875,247 | $ 5,171,681 | $ - |
Derivative Instruments: | | | | |
Assets | | | | |
Futures Contracts | $ 24,598 | $ 24,598 | $ - | $ - |
The following is a summary of transfers between Level 1 and Level 2 for the period ended October 31, 2014. Transfers are assumed to have occurred at the beginning of the period, and are primarily attributable to the valuation techniques used for foreign equity securities, as discussed in the accompanying Notes to Financial Statements: |
Transfers | Total (000s) |
Level 1 to Level 2 | $ 1,082,136 |
Level 2 to Level 1 | $ 0 |
Value of Derivative Instruments |
The following table is a summary of the Fund's value of derivative instruments by primary risk exposure as of October 31, 2014. For additional information on derivative instruments, please refer to the Derivative Instruments section in the accompanying Notes to Financial Statements. |
Primary Risk Exposure /
Derivative Type | Value (000s) |
| Asset | Liability |
Equity Risk | | |
Futures Contracts (a) | $ 24,598 | $ - |
Total Value of Derivatives | $ 24,598 | $ - |
(a) Reflects gross cumulative appreciation (depreciation) on futures contracts as presented in the Schedule of Investments. Only the period end receivable or payable for daily variation margin and net unrealized appreciation (depreciation) are presented in the Statement of Assets and Liabilities. |
See accompanying notes which are an integral part of the financial statements.
Annual Report
Statement of Assets and Liabilities
Amounts in thousands (except per-share amounts) | October 31, 2014 |
| | |
Assets | | |
Investment in securities, at value (including securities loaned of $50,476) - See accompanying schedule: Unaffiliated issuers (cost $9,050,379) | $ 10,325,733 | |
Fidelity Central Funds (cost $620,421) | 620,421 | |
Other affiliated issuers (cost $74,402) | 100,774 | |
Total Investments (cost $9,745,202) | | $ 11,046,928 |
Receivable for investments sold | | 41,866 |
Receivable for fund shares sold | | 6,258 |
Dividends receivable | | 19,075 |
Distributions receivable from Fidelity Central Funds | | 78 |
Receivable for daily variation margin for derivative instruments | | 23,890 |
Prepaid expenses | | 36 |
Other receivables | | 3,818 |
Total assets | | 11,141,949 |
| | |
Liabilities | | |
Payable for investments purchased | $ 408 | |
Payable for fund shares redeemed | 73,445 | |
Accrued management fee | 6,840 | |
Distribution and service plan fees payable | 112 | |
Other affiliated payables | 1,580 | |
Other payables and accrued expenses | 8,389 | |
Collateral on securities loaned, at value | 52,624 | |
Total liabilities | | 143,398 |
| | |
Net Assets | | $ 10,998,551 |
Net Assets consist of: | | |
Paid in capital | | $ 9,891,341 |
Undistributed net investment income | | 68,609 |
Accumulated undistributed net realized gain (loss) on investments and foreign currency transactions | | (278,180) |
Net unrealized appreciation (depreciation) on investments and assets and liabilities in foreign currencies | | 1,316,781 |
Net Assets | | $ 10,998,551 |
See accompanying notes which are an integral part of the financial statements.
Annual Report
Financial Statements - continued
Statement of Assets and Liabilities - continued
Amounts in thousands (except per-share amounts) | October 31, 2014 |
| | |
Calculation of Maximum Offering Price Class A:
Net Asset Value and redemption price per share ($296,718.26 ÷ 7,667.518 shares) | | $ 38.70 |
| | |
Maximum offering price per share (100/94.25 of $38.70) | | $ 41.06 |
Class T:
Net Asset Value and redemption price per share ($48,545.20 ÷ 1,263.274 shares) | | $ 38.43 |
| | |
Maximum offering price per share (100/96.50 of $38.43) | | $ 39.82 |
Class B:
Net Asset Value and offering price per share ($4,616.85 ÷ 120.484 shares)A | | $ 38.32 |
| | |
Class C:
Net Asset Value and offering price per share ($35,346.11 ÷ 924.200 shares)A | | $ 38.25 |
| | |
International Discovery:
Net Asset Value, offering price and redemption price per share ($7,464,021.58 ÷ 191,244.937 shares) | | $ 39.03 |
| | |
Class K:
Net Asset Value, offering price and redemption price per share ($2,464,322.23 ÷ 63,228.753 shares) | | $ 38.97 |
| | |
Institutional Class:
Net Asset Value, offering price and redemption price per share ($649,855.06 ÷ 16,682.058 shares) | | $ 38.96 |
| | |
Class Z:
Net Asset Value, offering price and redemption price per share ($35,125.45 ÷ 901.567 shares) | | $ 38.96 |
A Redemption price per share is equal to net asset value less any applicable contingent deferred sales charge.
See accompanying notes which are an integral part of the financial statements.
Annual Report
Statement of Operations
Amounts in thousands | Year ended October 31, 2014 |
| | |
Investment Income | | |
Dividends | | $ 259,008 |
Special dividends | | 63,816 |
Interest | | 64 |
Income from Fidelity Central Funds | | 5,878 |
Income before foreign taxes withheld | | 328,766 |
Less foreign taxes withheld | | (23,208) |
Total income | | 305,558 |
| | |
Expenses | | |
Management fee
Basic fee | $ 80,931 | |
Performance adjustment | 2,685 | |
Transfer agent fees | 17,771 | |
Distribution and service plan fees | 1,508 | |
Accounting and security lending fees | 1,856 | |
Custodian fees and expenses | 1,542 | |
Independent trustees' compensation | 48 | |
Registration fees | 223 | |
Audit | 116 | |
Legal | 40 | |
Miscellaneous | 85 | |
Total expenses before reductions | 106,805 | |
Expense reductions | (345) | 106,460 |
Net investment income (loss) | | 199,098 |
Realized and Unrealized Gain (Loss) Net realized gain (loss) on: | | |
Investment securities: | | |
Unaffiliated issuers | 740,761 | |
Other affiliated issuers | 2,158 | |
Foreign currency transactions | (1,181) | |
Futures contracts | 16,266 | |
Total net realized gain (loss) | | 758,004 |
Change in net unrealized appreciation (depreciation) on: Investment securities (net of increase in deferred foreign taxes of $7,503) | (978,230) | |
Assets and liabilities in foreign currencies | (886) | |
Futures contracts | 20,360 | |
Total change in net unrealized appreciation (depreciation) | | (958,756) |
Net gain (loss) | | (200,752) |
Net increase (decrease) in net assets resulting from operations | | $ (1,654) |
See accompanying notes which are an integral part of the financial statements.
Annual Report
Financial Statements - continued
Statement of Changes in Net Assets
Amounts in thousands | Year ended
October 31,
2014 | Year ended
October 31,
2013 |
Increase (Decrease) in Net Assets | | |
Operations | | |
Net investment income (loss) | $ 199,098 | $ 129,203 |
Net realized gain (loss) | 758,004 | 725,376 |
Change in net unrealized appreciation (depreciation) | (958,756) | 1,463,372 |
Net increase (decrease) in net assets resulting
from operations | (1,654) | 2,317,951 |
Distributions to shareholders from net investment income | (136,326) | (146,031) |
Distributions to shareholders from net realized gain | (88,586) | (8,413) |
Total distributions | (224,912) | (154,444) |
Share transactions - net increase (decrease) | (69,908) | 714,712 |
Redemption fees | 139 | 128 |
Total increase (decrease) in net assets | (296,335) | 2,878,347 |
| | |
Net Assets | | |
Beginning of period | 11,294,886 | 8,416,539 |
End of period (including undistributed net investment income of $68,609 and undistributed net investment income of $131,430, respectively) | $ 10,998,551 | $ 11,294,886 |
See accompanying notes which are an integral part of the financial statements.
Annual Report
Financial Highlights - Class A
Years ended October 31, | 2014 | 2013 | 2012 | 2011 | 2010 |
Selected Per-Share Data | | | | | |
Net asset value, beginning of period | $ 39.49 | $ 31.66 | $ 29.43 | $ 32.07 | $ 28.57 |
Income from Investment Operations | | | | | |
Net investment income (loss) C | .53 F | .34 | .41 | .42 | .31 |
Net realized and unrealized gain (loss) | (.67) | 7.97 | 2.11 | (2.52) | 3.51 |
Total from investment operations | (.14) | 8.31 | 2.52 | (2.10) | 3.82 |
Distributions from net investment income | (.33) | (.45) | (.29) | (.38) | (.28) |
Distributions from net realized gain | (.31) | (.03) | - | (.16) | (.04) |
Total distributions | (.65) I | (.48) | (.29) | (.54) | (.32) |
Redemption fees added to paid in capital C, H | - | - | - | - | - |
Net asset value, end of period | $ 38.70 | $ 39.49 | $ 31.66 | $ 29.43 | $ 32.07 |
Total ReturnA, B | (.36)% | 26.59% | 8.70% | (6.71)% | 13.43% |
Ratios to Average Net Assets D, G | | | | | |
Expenses before reductions | 1.28% | 1.35% | 1.34% | 1.30% | 1.33% |
Expenses net of fee waivers, if any | 1.28% | 1.35% | 1.34% | 1.29% | 1.33% |
Expenses net of all reductions | 1.28% | 1.33% | 1.31% | 1.25% | 1.28% |
Net investment income (loss) | 1.35% F | .97% | 1.41% | 1.31% | 1.06% |
Supplemental Data | | | | | |
Net assets, end of period (in millions) | $ 297 | $ 347 | $ 299 | $ 320 | $ 392 |
Portfolio turnover rate E | 57% | 65% | 68% | 75% | 82% |
A Total returns would have been lower if certain expenses had not been reduced during the applicable periods shown.
B Total returns do not include the effect of the sales charges.
C Calculated based on average shares outstanding during the period.
D Fees and expenses of any underlying Fidelity Central Funds are not included in the Fund's expense ratio. The Fund indirectly bears its proportionate share of the expenses of any underlying Fidelity Central Funds.
E Amount does not include the portfolio activity of any underlying Fidelity Central Funds.
F Investment income per share reflects a large, non-recurring dividend which amounted to $.22 per share. Excluding this non-recurring dividend, the ratio of net investment income (loss) to average net assets would have been .80%.
G Expense ratios reflect operating expenses of the class. Expenses before reductions do not reflect amounts reimbursed by the investment adviser or reductions from brokerage service arrangements or reductions from other expense offset arrangements and do not represent the amount paid by the class during periods when reimbursements or reductions occur. Expenses net of fee waivers reflect expenses after reimbursement by the investment adviser but prior to reductions from brokerage service arrangements or other expense offset arrangements. Expenses net of all reductions represent the net expenses paid by the class.
H Amount represents less than $.01 per share.
I Total distributions of $.65 per share is comprised of distributions from net investment income of $.334 and distributions from net realized gain of $.311 per share.
See accompanying notes which are an integral part of the financial statements.
Annual Report
Financial Highlights - Class T
Years ended October 31, | 2014 | 2013 | 2012 | 2011 | 2010 |
Selected Per-Share Data | | | | | |
Net asset value, beginning of period | $ 39.23 | $ 31.42 | $ 29.18 | $ 31.81 | $ 28.35 |
Income from Investment Operations | | | | | |
Net investment income (loss) C | .44 F | .26 | .34 | .34 | .23 |
Net realized and unrealized gain (loss) | (.68) | 7.92 | 2.09 | (2.51) | 3.48 |
Total from investment operations | (.24) | 8.18 | 2.43 | (2.17) | 3.71 |
Distributions from net investment income | (.25) | (.34) | (.19) | (.30) | (.21) |
Distributions from net realized gain | (.31) | (.03) | - | (.16) | (.04) |
Total distributions | (.56) | (.37) | (.19) | (.46) | (.25) |
Redemption fees added to paid in capital C, H | - | - | - | - | - |
Net asset value, end of period | $ 38.43 | $ 39.23 | $ 31.42 | $ 29.18 | $ 31.81 |
Total ReturnA, B | (.60)% | 26.31% | 8.41% | (6.96)% | 13.14% |
Ratios to Average Net Assets D, G | | | | | |
Expenses before reductions | 1.51% | 1.59% | 1.59% | 1.56% | 1.60% |
Expenses net of fee waivers, if any | 1.51% | 1.59% | 1.59% | 1.55% | 1.60% |
Expenses net of all reductions | 1.51% | 1.57% | 1.56% | 1.51% | 1.56% |
Net investment income (loss) | 1.11% F | .73% | 1.16% | 1.05% | .79% |
Supplemental Data | | | | | |
Net assets, end of period (in millions) | $ 49 | $ 53 | $ 46 | $ 61 | $ 92 |
Portfolio turnover rateE | 57% | 65% | 68% | 75% | 82% |
A Total returns would have been lower if certain expenses had not been reduced during the applicable periods shown.
B Total returns do not include the effect of the sales charges.
C Calculated based on average shares outstanding during the period.
D Fees and expenses of any underlying Fidelity Central Funds are not included in the Fund's expense ratio. The Fund indirectly bears its proportionate share of the expenses of any underlying Fidelity Central Funds.
E Amount does not include the portfolio activity of any underlying Fidelity Central Funds.
F Investment income per share reflects large, non-recurring dividend which amounted to $.21 per share. Excluding this non-recurring dividend, the ratio of net investment income (loss) to average net assets would have been .56%.
G Expense ratios reflect operating expenses of the class. Expenses before reductions do not reflect amounts reimbursed by the investment adviser or reductions from brokerage service arrangements or reductions from other expense offset arrangements and do not represent the amount paid by the class during periods when reimbursements or reductions occur. Expenses net of fee waivers reflect expenses after reimbursement by the investment adviser but prior to reductions from brokerage service arrangements or other expense offset arrangements. Expenses net of all reductions represent the net expenses paid by the class.
H Amount represents less than $.01 per share.
See accompanying notes which are an integral part of the financial statements.
Annual Report
Financial Highlights - Class B
Years ended October 31, | 2014 | 2013 | 2012 | 2011 | 2010 |
Selected Per-Share Data | | | | | |
Net asset value, beginning of period | $ 39.08 | $ 31.28 | $ 29.02 | $ 31.60 | $ 28.18 |
Income from Investment Operations | | | | | |
Net investment income (loss) C | .22 F | .08 | .19 | .17 | .08 |
Net realized and unrealized gain (loss) | (.66) | 7.90 | 2.09 | (2.48) | 3.44 |
Total from investment operations | (.44) | 7.98 | 2.28 | (2.31) | 3.52 |
Distributions from net investment income | (.01) | (.15) | (.02) | (.12) | (.06) |
Distributions from net realized gain | (.31) | (.03) | - | (.16) | (.04) |
Total distributions | (.32) | (.18) | (.02) | (.27) I | (.10) |
Redemption fees added to paid in capital C, H | - | - | - | - | - |
Net asset value, end of period | $ 38.32 | $ 39.08 | $ 31.28 | $ 29.02 | $ 31.60 |
Total ReturnA, B | (1.12)% | 25.64% | 7.85% | (7.39)% | 12.52% |
Ratios to Average Net Assets D, G | | | | | |
Expenses before reductions | 2.06% | 2.10% | 2.09% | 2.06% | 2.12% |
Expenses net of fee waivers, if any | 2.06% | 2.10% | 2.09% | 2.06% | 2.12% |
Expenses net of all reductions | 2.05% | 2.08% | 2.06% | 2.02% | 2.08% |
Net investment income (loss) | .57% F | .22% | .66% | .54% | .27% |
Supplemental Data | | | | | |
Net assets, end of period (in millions) | $ 5 | $ 7 | $ 8 | $ 10 | $ 14 |
Portfolio turnover rateE | 57% | 65% | 68% | 75% | 82% |
A Total returns would have been lower if certain expenses had not been reduced during the applicable periods shown.
B Total returns do not include the effect of the contingent deferred sales charge.
C Calculated based on average shares outstanding during the period.
D Fees and expenses of any underlying Fidelity Central Funds are not included in the Fund's expense ratio. The Fund indirectly bears its proportionate share of the expenses of any underlying Fidelity Central Funds.
E Amount does not include the portfolio activity of any underlying Fidelity Central Funds.
F Investment income per share reflects a large, non-recurring dividend which amounted to $.21 per share. Excluding this non-recurring dividend, the ratio of net investment income (loss) to average net assets would have been .02%.
G Expense ratios reflect operating expenses of the class. Expenses before reductions do not reflect amounts reimbursed by the investment adviser or reductions from brokerage service arrangements or reductions from other expense offset arrangements and do not represent the amount paid by the class during periods when reimbursements or reductions occur. Expenses net of fee waivers reflect expenses after reimbursement by the investment adviser but prior to reductions from brokerage service arrangements or other expense offset arrangements. Expenses net of all reductions represent the net expenses paid by the class.
H Amount represents less than $.01 per share.
I Total distributions of $.27 per share is comprised of distributions from net investment income of $.115 and distributions from net realized gain of $.155 per share.
See accompanying notes which are an integral part of the financial statements.
Annual Report
Financial Highlights - Class C
Years ended October 31, | 2014 | 2013 | 2012 | 2011 | 2010 |
Selected Per-Share Data | | | | | |
Net asset value, beginning of period | $ 39.07 | $ 31.32 | $ 29.08 | $ 31.68 | $ 28.23 |
Income from Investment Operations | | | | | |
Net investment income (loss) C | .23 F | .08 | .19 | .18 | .09 |
Net realized and unrealized gain (loss) | (.66) | 7.90 | 2.09 | (2.49) | 3.45 |
Total from investment operations | (.43) | 7.98 | 2.28 | (2.31) | 3.54 |
Distributions from net investment income | (.08) | (.20) | (.04) | (.14) | (.05) |
Distributions from net realized gain | (.31) | (.03) | - | (.16) | (.04) |
Total distributions | (.39) | (.23) | (.04) | (.29) I | (.09) |
Redemption fees added to paid in capital C, H | - | - | - | - | - |
Net asset value, end of period | $ 38.25 | $ 39.07 | $ 31.32 | $ 29.08 | $ 31.68 |
Total ReturnA, B | (1.10)% | 25.65% | 7.86% | (7.37)% | 12.54% |
Ratios to Average Net Assets D, G | | | | | |
Expenses before reductions | 2.03% | 2.10% | 2.09% | 2.05% | 2.09% |
Expenses net of fee waivers, if any | 2.03% | 2.09% | 2.09% | 2.04% | 2.09% |
Expenses net of all reductions | 2.02% | 2.07% | 2.06% | 2.00% | 2.05% |
Net investment income (loss) | .60% F | .23% | .66% | .56% | .30% |
Supplemental Data | | | | | |
Net assets, end of period (in millions) | $ 35 | $ 36 | $ 30 | $ 33 | $ 44 |
Portfolio turnover rateE | 57% | 65% | 68% | 75% | 82% |
A Total returns would have been lower if certain expenses had not been reduced during the applicable periods shown.
B Total returns do not include the effect of the contingent deferred sales charge.
C Calculated based on average shares outstanding during the period.
D Fees and expenses of any underlying Fidelity Central Funds are not included in the Fund's expense ratio. The Fund indirectly bears its proportionate share of the expenses of any underlying Fidelity Central Funds.
E Amount does not include the portfolio activity of any underlying Fidelity Central Funds.
F Investment income per share reflects a large, non-recurring dividend which amounted to $.21 per share. Excluding this non-recurring dividend, the ratio of net investment income (loss) to average net assets would have been .05%.
G Expense ratios reflect operating expenses of the class. Expenses before reductions do not reflect amounts reimbursed by the investment adviser or reductions from brokerage service arrangements or reductions from other expense offset arrangements and do not represent the amount paid by the class during periods when reimbursements or reductions occur. Expenses net of fee waivers reflect expenses after reimbursement by the investment adviser but prior to reductions from brokerage service arrangements or other expense offset arrangements. Expenses net of all reductions represent the net expenses paid by the class.
H Amount represents less than $.01 per share.
I Total distributions of $.29 per share is comprised of distributions from net investment income of $.137 and distributions from net realized gain of $.155 per share.
See accompanying notes which are an integral part of the financial statements.
Annual Report
Financial Highlights - International Discovery
Years ended October 31, | 2014 | 2013 | 2012 | 2011 | 2010 |
Selected Per-Share Data | | | | | |
Net asset value, beginning of period | $ 39.82 | $ 31.91 | $ 29.69 | $ 32.34 | $ 28.79 |
Income from Investment Operations | | | | | |
Net investment income (loss) B | .67 E | .47 | .51 | .53 | .40 |
Net realized and unrealized gain (loss) | (.68) | 8.02 | 2.12 | (2.54) | 3.54 |
Total from investment operations | (.01) | 8.49 | 2.63 | (2.01) | 3.94 |
Distributions from net investment income | (.47) | (.55) | (.41) | (.48) | (.35) |
Distributions from net realized gain | (.31) | (.03) | - | (.16) | (.04) |
Total distributions | (.78) | (.58) | (.41) | (.64) | (.39) |
Redemption fees added to paid in capital B, G | - | - | - | - | - |
Net asset value, end of period | $ 39.03 | $ 39.82 | $ 31.91 | $ 29.69 | $ 32.34 |
Total ReturnA | (.01)% | 27.03% | 9.03% | (6.39)% | 13.76% |
Ratios to Average Net Assets C, F | | | | | |
Expenses before reductions | .93% | 1.00% | 1.01% | .97% | 1.05% |
Expenses net of fee waivers, if any | .93% | 1.00% | 1.01% | .96% | 1.05% |
Expenses net of all reductions | .93% | .98% | .98% | .92% | 1.00% |
Net investment income (loss) | 1.69% E | 1.32% | 1.73% | 1.64% | 1.35% |
Supplemental Data | | | | | |
Net assets, end of period (in millions) | $ 7,464 | $ 7,800 | $ 5,965 | $ 6,806 | $ 8,133 |
Portfolio turnover rateD | 57% | 65% | 68% | 75% | 82% |
A Total returns would have been lower if certain expenses had not been reduced during the applicable periods shown.
B Calculated based on average shares outstanding during the period.
C Fees and expenses of any underlying Fidelity Central Funds are not included in the Fund's expense ratio. The Fund indirectly bears its proportionate share of the expenses of any underlying Fidelity Central Funds.
D Amount does not include the portfolio activity of any underlying Fidelity Central Funds.
E Investment income per share reflects a large, non-recurring dividend which amounted to $.22 per share. Excluding this non-recurring dividend, the ratio of net investment income (loss) to average net assets would have been 1.15%.
F Expense ratios reflect operating expenses of the class. Expenses before reductions do not reflect amounts reimbursed by the investment adviser or reductions from brokerage service arrangements or reductions from other expense offset arrangements and do not represent the amount paid by the class during periods when reimbursements or reductions occur. Expenses net of fee waivers reflect expenses after reimbursement by the investment adviser but prior to reductions from brokerage service arrangements or other expense offset arrangements. Expenses net of all reductions represent the net expenses paid by the class.
G Amount represents less than $.01 per share.
See accompanying notes which are an integral part of the financial statements.
Annual Report
Financial Highlights - Class K
Years ended October 31, | 2014 | 2013 | 2012 | 2011 | 2010 |
Selected Per-Share Data | | | | | |
Net asset value, beginning of period | $ 39.76 | $ 31.87 | $ 29.66 | $ 32.32 | $ 28.78 |
Income from Investment Operations | | | | | |
Net investment income (loss) B | .72 E | .52 | .57 | .58 | .46 |
Net realized and unrealized gain (loss) | (.67) | 8.01 | 2.11 | (2.54) | 3.53 |
Total from investment operations | .05 | 8.53 | 2.68 | (1.96) | 3.99 |
Distributions from net investment income | (.53) | (.61) | (.47) | (.55) | (.41) |
Distributions from net realized gain | (.31) | (.03) | - | (.16) | (.04) |
Total distributions | (.84) | (.64) | (.47) | (.70) H | (.45) |
Redemption fees added to paid in capital B, G | - | - | - | - | - |
Net asset value, end of period | $ 38.97 | $ 39.76 | $ 31.87 | $ 29.66 | $ 32.32 |
Total ReturnA | .13% | 27.23% | 9.24% | (6.24)% | 13.96% |
Ratios to Average Net Assets C, F | | | | | |
Expenses before reductions | .80% | .85% | .83% | .80% | .84% |
Expenses net of fee waivers, if any | .80% | .85% | .83% | .79% | .84% |
Expenses net of all reductions | .79% | .83% | .80% | .75% | .79% |
Net investment income (loss) | 1.83% E | 1.47% | 1.91% | 1.81% | 1.55% |
Supplemental Data | | | | | |
Net assets, end of period (in millions) | $ 2,464 | $ 2,576 | $ 1,776 | $ 1,245 | $ 1,078 |
Portfolio turnover rateD | 57% | 65% | 68% | 75% | 82% |
A Total returns would have been lower if certain expenses had not been reduced during the applicable periods shown.
B Calculated based on average shares outstanding during the period.
C Fees and expenses of any underlying Fidelity Central Funds are not included in the Fund's expense ratio. The Fund indirectly bears its proportionate share of the expenses of any underlying Fidelity Central Funds.
D Amount does not include the portfolio activity of any underlying Fidelity Central Funds.
E Investment income per share reflects a large, non-recurring dividend which amounted to $.22 per share. Excluding this non-recurring dividend, the ratio of net investment income (loss) to average net assets would have been 1.28%.
F Expense ratios reflect operating expenses of the class. Expenses before reductions do not reflect amounts reimbursed by the investment adviser or reductions from brokerage service arrangements or reductions from other expense offset arrangements and do not represent the amount paid by the class during periods when reimbursements or reductions occur. Expenses net of fee waivers reflect expenses after reimbursement by the investment adviser but prior to reductions from brokerage service arrangements or other expense offset arrangements. Expenses net of all reductions represent the net expenses paid by the class.
G Amount represents less than $.01 per share.
H Total distributions of $.70 per share is comprised of distributions from net investment income of $.548 and distributions from net realized gain of $.155 per share.
See accompanying notes which are an integral part of the financial statements.
Annual Report
Financial Highlights - Institutional Class
Years ended October 31, | 2014 | 2013 | 2012 | 2011 | 2010 |
Selected Per-Share Data | | | | | |
Net asset value, beginning of period | $ 39.76 | $ 31.87 | $ 29.65 | $ 32.31 | $ 28.77 |
Income from Investment Operations | | | | | |
Net investment income (loss) B | .67 E | .47 | .52 | .54 | .41 |
Net realized and unrealized gain (loss) | (.68) | 8.01 | 2.11 | (2.55) | 3.55 |
Total from investment operations | (.01) | 8.48 | 2.63 | (2.01) | 3.96 |
Distributions from net investment income | (.48) | (.56) | (.41) | (.50) | (.38) |
Distributions from net realized gain | (.31) | (.03) | - | (.16) | (.04) |
Total distributions | (.79) | (.59) | (.41) | (.65) H | (.42) |
Redemption fees added to paid in capital B, G | - | - | - | - | - |
Net asset value, end of period | $ 38.96 | $ 39.76 | $ 31.87 | $ 29.65 | $ 32.31 |
Total ReturnA | (.01)% | 27.03% | 9.07% | (6.39)% | 13.84% |
Ratios to Average Net Assets C, F | | | | | |
Expenses before reductions | .93% | 1.00% | 1.00% | .95% | .99% |
Expenses net of fee waivers, if any | .93% | 1.00% | 1.00% | .94% | .99% |
Expenses net of all reductions | .93% | .97% | .97% | .90% | .95% |
Net investment income (loss) | 1.69% E | 1.33% | 1.75% | 1.66% | 1.40% |
Supplemental Data | | | | | |
Net assets, end of period (in millions) | $ 650 | $ 476 | $ 294 | $ 278 | $ 319 |
Portfolio turnover rateD | 57% | 65% | 68% | 75% | 82% |
A Total returns would have been lower if certain expenses had not been reduced during the applicable periods shown.
B Calculated based on average shares outstanding during the period.
C Fees and expenses of any underlying Fidelity Central Funds are not included in the Fund's expense ratio. The Fund indirectly bears its proportionate share of the expenses of any underlying Fidelity Central Funds.
D Amount does not include the portfolio activity of any underlying Fidelity Central Funds.
E Investment income per share reflects a large, non-recurring dividend which amounted to $.22 per share. Excluding this non-recurring dividend, the ratio of net investment income (loss) to average net assets would have been 1.14%.
F Expense ratios reflect operating expenses of the class. Expenses before reductions do not reflect amounts reimbursed by the investment adviser or reductions from brokerage service arrangements or reductions from other expense offset arrangements and do not represent the amount paid by the class during periods when reimbursements or reductions occur. Expenses net of fee waivers reflect expenses after reimbursement by the investment adviser but prior to reductions from brokerage service arrangements or other expense offset arrangements. Expenses net of all reductions represent the net expenses paid by the class.
G Amount represents less than $.01 per share.
H Total distributions of $.65 per share is comprised of distributions from net investment income of $.497 and distributions from net realized gain of $.155 per share.
See accompanying notes which are an integral part of the financial statements.
Annual Report
Financial Highlights - Class Z
Years ended October 31, | 2014 | 2013 H |
Selected Per-Share Data | | |
Net asset value, beginning of period | $ 39.77 | $ 37.22 |
Income from Investment Operations | | |
Net investment income (loss) D | .72 G | .07 |
Net realized and unrealized gain (loss) | (.68) | 2.48 |
Total from investment operations | .04 | 2.55 |
Distributions from net investment income | (.54) | - |
Distributions from net realized gain | (.31) | - |
Total distributions | (.85) | - |
Redemption fees added to paid in capital D, J | - | - |
Net asset value, end of period | $ 38.96 | $ 39.77 |
Total ReturnB, C | .12% | 6.85% |
Ratios to Average Net Assets E, I | | |
Expenses before reductions | .80% | .85%A |
Expenses net of fee waivers, if any | .80% | .85%A |
Expenses net of all reductions | .79% | .83%A |
Net investment income (loss) | 1.83% G | .76% A |
Supplemental Data | | |
Net assets, end of period (000 omitted) | $ 35,125 | $ 107 |
Portfolio turnover rateF | 57% | 65% |
A Annualized
B Total returns for periods of less than one year are not annualized.
C Total returns would have been lower if certain expenses had not been reduced during the applicable periods shown.
D Calculated based on average shares outstanding during the period.
E Fees and expenses of any underlying Fidelity Central Funds are not included in the Fund's expense ratio. The Fund indirectly bears its proportionate share of the expenses of any underlying Fidelity Central Funds.
F Amount does not include the portfolio activity of any underlying Fidelity Central Funds.
G Investment income per share reflects a large, non-recurring dividend which amounted to $.21 per share. Excluding this non-recurring dividend, the ratio of net investment income (loss) to average net assets would have been 1.28%.
H For the period August 13, 2013 (commencement of sale of shares) to October 31, 2013.
I Expense ratios reflect operating expenses of the class. Expenses before reductions do not reflect amounts reimbursed by the investment adviser or reductions from brokerage service arrangements or reductions from other expense offset arrangements and do not represent the amount paid by the class during periods when reimbursements or reductions occur. Expenses net of fee waivers reflect expenses after reimbursement by the investment adviser but prior to reductions from brokerage service arrangements or other expense offset arrangements. Expenses net of all reductions represent the net expenses paid by the class.
J Amount represents less than $.01 per share.
See accompanying notes which are an integral part of the financial statements.
Annual Report
Notes to Financial Statements
For the period ended October 31, 2014
(Amounts in thousands except percentages)
1. Organization.
Fidelity International Discovery Fund (the Fund) is a fund of Fidelity Investment Trust (the Trust) and is authorized to issue an unlimited number of shares. The Trust is registered under the Investment Company Act of 1940, as amended (the 1940 Act), as an open-end management investment company organized as a Massachusetts business trust. The Fund offers Class A, Class T, Class C, International Discovery, Class K, Institutional Class and Class Z shares, each of which, along with Class B shares, has equal rights as to assets and voting privileges. Class B shares are closed to new accounts and additional purchases, except for exchanges and reinvestments. Each class has exclusive voting rights with respect to matters that affect that class. Class B shares will automatically convert to Class A shares after a holding period of seven years from the initial date of purchase.
2. Investments in Fidelity Central Funds.
The Fund invests in Fidelity Central Funds, which are open-end investment companies generally available only to other investment companies and accounts managed by the investment adviser and its affiliates. The Fund's Schedule of Investments lists each of the Fidelity Central Funds held as of period end, if any, as an investment of the Fund, but does not include the underlying holdings of each Fidelity Central Fund. As an Investing Fund, the Fund indirectly bears its proportionate share of the expenses of the underlying Fidelity Central Funds.
The Money Market Central Funds seek preservation of capital and current income and are managed by Fidelity Investments Money Management, Inc. (FIMM), an affiliate of the investment adviser. Annualized expenses of the Money Market Central Funds as of their most recent shareholder report date are less than .01%.
A complete unaudited list of holdings for each Fidelity Central Fund is available upon request or at the Securities and Exchange Commission (the SEC) website at www.sec.gov. In addition, the financial statements of the Fidelity Central Funds, which are not covered by the Fund's Report of Independent Registered Public Accounting Firm, are available on the SEC website or upon request.
3. Significant Accounting Policies.
The financial statements have been prepared in conformity with accounting principles generally accepted in the United States of America (GAAP), which require management to make certain estimates and assumptions at the date of the financial statements. Actual results could differ from those estimates. Subsequent events, if any, through the date that the financial statements were issued have been evaluated in the preparation of
Annual Report
3. Significant Accounting Policies - continued
the financial statements. The following summarizes the significant accounting policies of the Fund:
Investment Valuation. Investments are valued as of 4:00 p.m. Eastern time on the last calendar day of the period. In accordance with valuation policies and procedures approved by the Board of Trustees (the Board), the Fund attempts to obtain prices from one or more third party pricing vendors or brokers to value its investments. When current market prices, quotations or currency exchange rates are not readily available or reliable, investments will be fair valued in good faith by the Fidelity Management & Research Company (FMR) Fair Value Committee (the Committee), in accordance with procedures adopted by the Board. Factors used in determining fair value vary by investment type and may include market or investment specific events, changes in interest rates and credit quality. The frequency with which these procedures are used cannot be predicted and they may be utilized to a significant extent. The Committee oversees the Fund's valuation policies and procedures and is responsible for approving and reporting to the Board all fair value determinations.
The Fund categorizes the inputs to valuation techniques used to value its investments into a disclosure hierarchy consisting of three levels as shown below:
Level 1 - quoted prices in active markets for identical investments
Level 2 - other significant observable inputs (including quoted prices for similar investments, interest rates, prepayment speeds, etc.)
Level 3 - unobservable inputs (including the Fund's own assumptions based on the best information available)
Valuation techniques used to value the Fund's investments by major category are as follows:
Equity securities, including restricted securities, for which market quotations are readily available, are valued at the last reported sale price or official closing price as reported by a third party pricing vendor on the primary market or exchange on which they are traded and are categorized as Level 1 in the hierarchy. In the event there were no sales during the day or closing prices are not available, securities are valued at the last quoted bid price or may be valued using the last available price and are generally categorized as Level 2 in the hierarchy. For foreign equity securities, when market or security specific events arise, comparisons to the valuation of American Depositary Receipts (ADRs), futures contracts, Exchange-Traded Funds (ETFs) and certain indexes as well as quoted prices for similar securities may be used and would be categorized as Level 2 in the hierarchy. Utilizing these techniques may result in transfers between Level 1 and Level 2. For equity securities, including restricted securities, where observable inputs are limited, assumptions about market activity and risk are used and these securities may be categorized as Level 3 in the hierarchy.
Annual Report
Notes to Financial Statements - continued
(Amounts in thousands except percentages)
3. Significant Accounting Policies - continued
Investment Valuation - continued
Debt securities, including restricted securities, are valued based on evaluated prices received from third party pricing vendors or from brokers who make markets in such securities. Preferred securities and U.S. government and government agency obligations are valued by pricing vendors who utilize matrix pricing which considers yield or price of bonds of comparable quality, coupon, maturity and type or by broker-supplied prices. When independent prices are unavailable or unreliable, debt securities may be valued utilizing pricing methodologies which consider similar factors that would be used by third party pricing vendors. Debt securities are generally categorized as Level 2 in the hierarchy but may be Level 3 depending on the circumstances.
Futures contracts are valued at the settlement price established each day by the board of trade or exchange on which they are traded and are categorized as Level 1 in the hierarchy. Investments in open-end mutual funds, including the Fidelity Central Funds, are valued at their closing net asset value (NAV) each business day and are categorized as Level 1 in the hierarchy.
Changes in valuation techniques may result in transfers in or out of an assigned level within the disclosure hierarchy. The aggregate value of investments by input level, as of October 31, 2014, including information on transfers between Levels 1 and 2 is included at the end of the Fund's Schedule of Investments.
Foreign Currency. The Fund may use foreign currency contracts to facilitate transactions in foreign-denominated securities. Gains and losses from these transactions may arise from changes in the value of the foreign currency or if the counterparties do not perform under the contracts' terms.
Foreign-denominated assets, including investment securities, and liabilities are translated into U.S. dollars at the exchange rates at period end. Purchases and sales of investment securities, income and dividends received and expenses denominated in foreign currencies are translated into U.S. dollars at the exchange rate in effect on the transaction date.
The effects of exchange rate fluctuations on investments are included with the net realized and unrealized gain (loss) on investment securities. Other foreign currency transactions resulting in realized and unrealized gain (loss) are disclosed separately.
Investment Transactions and Income. For financial reporting purposes, the Fund's investment holdings and NAV include trades executed through the end of the last business day of the period. The NAV per share for processing shareholder transactions is calculated as of the close of business of the New York Stock Exchange (NYSE), normally 4:00 p.m. Eastern time and includes trades executed through the end of the prior business day. Gains and losses on securities sold are determined on the basis of identified
Annual Report
3. Significant Accounting Policies - continued
Investment Transactions and Income - continued
cost and may include proceeds received from litigation. Dividend income is recorded on the ex-dividend date, except for certain dividends from foreign securities where the ex-dividend date may have passed, which are recorded as soon as the Fund is informed of the ex-dividend date. Non-cash dividends included in dividend income, if any, are recorded at the fair market value of the securities received. Income and capital gain distributions from Fidelity Central Funds, if any, are recorded on the ex-dividend date. Large, non-recurring dividends recognized by the Fund are presented separately on the Statement of Operations as "Special Dividends" and the impact of these dividends is presented in the Financial Highlights. Interest income is accrued as earned and includes coupon interest and amortization of premium and accretion of discount on debt securities as applicable. Investment income is recorded net of foreign taxes withheld where recovery of such taxes is uncertain.
Class Allocations and Expenses. Investment income, realized and unrealized capital gains and losses, common expenses of the Fund, and certain fund-level expense reductions, if any, are allocated daily on a pro-rata basis to each class based on the relative net assets of each class to the total net assets of the Fund. Each class differs with respect to transfer agent and distribution and service plan fees incurred. Certain expense reductions may also differ by class. For the reporting period, the allocated portion of income and expenses to each class as a percent of its average net assets may vary due to the timing of recording these transactions in relation to fluctuating net assets of the classes. Expenses directly attributable to a fund are charged to that fund. Expenses attributable to more than one fund are allocated among the respective funds on the basis of relative net assets or other appropriate methods. Expense estimates are accrued in the period to which they relate and adjustments are made when actual amounts are known.
Deferred Trustee Compensation. Under a Deferred Compensation Plan (the Plan), independent Trustees may elect to defer receipt of a portion of their annual compensation. Deferred amounts are invested in a cross-section of Fidelity funds, are marked-to-market and remain in the Fund until distributed in accordance with the Plan. The investment of deferred amounts and the offsetting payable to the Trustees are included in the accompanying Statement of Assets and Liabilities.
Income Tax Information and Distributions to Shareholders. Each year, the Fund intends to qualify as a regulated investment company under Subchapter M of the Internal Revenue Code, including distributing substantially all of its taxable income and realized gains. As a result, no provision for U.S. Federal income taxes is required. As of October 31, 2014, the Fund did not have any unrecognized tax benefits in the financial statements; nor is the Fund aware of any tax positions for which it is reasonably possible that the total amounts of unrecognized tax benefits will significantly change in the next
Annual Report
Notes to Financial Statements - continued
(Amounts in thousands except percentages)
3. Significant Accounting Policies - continued
Income Tax Information and Distributions to Shareholders - continued
twelve months. The Fund files a U.S. federal tax return, in addition to state and local tax returns as required. The Fund's federal income tax returns are subject to examination by the Internal Revenue Service (IRS) for a period of three fiscal years after they are filed. State and local tax returns may be subject to examination for an additional fiscal year depending on the jurisdiction. Foreign taxes are provided for based on the Fund's understanding of the tax rules and rates that exist in the foreign markets in which it invests. The Fund is subject to a tax imposed on capital gains by certain countries in which it invests. An estimated deferred tax liability for net unrealized appreciation on the applicable securities is included in Other payables and accrued expenses on the Statement of Assets & Liabilities.
Distributions are declared and recorded on the ex-dividend date. Income dividends and capital gain distributions are declared separately for each class. Income and capital gain distributions are determined in accordance with income tax regulations, which may differ from GAAP. In addition, the Fund claimed a portion of the payment made to redeeming shareholders as a distribution for income tax purposes.
Capital accounts within the financial statements are adjusted for permanent book-tax differences. These adjustments have no impact on net assets or the results of operations. Capital accounts are not adjusted for temporary book-tax differences which will reverse in a subsequent period.
Book-tax differences are primarily due to futures contracts, foreign currency transactions, passive foreign investment companies (PFIC), market discount, deferred trustees compensation, capital loss carryforwards and losses deferred due to wash sales.
The federal tax cost of investment securities and unrealized appreciation (depreciation) as of period end were as follows:
Gross unrealized appreciation | $ 1,714,728 |
Gross unrealized depreciation | (439,338) |
Net unrealized appreciation (depreciation) on securities | $ 1,275,390 |
| |
Tax Cost | $ 9,771,538 |
The tax-based components of distributable earnings as of period end were as follows:
Undistributed ordinary income | $ 68,892 |
Capital loss carryforward | $ (227,245) |
Net unrealized appreciation (depreciation) on securities and other investments | $ 1,273,334 |
Annual Report
3. Significant Accounting Policies - continued
Income Tax Information and Distributions to Shareholders - continued
Capital loss carryforwards are only available to offset future capital gains of the Fund to the extent provided by regulations and may be limited. Under the Regulated Investment Company Modernization Act of 2010 (the Act), the Fund is permitted to carry forward capital losses incurred in taxable years beginning after December 22, 2010 for an unlimited period and such capital losses are required to be used prior to any losses that expire. The capital loss carryforward information presented below, including any applicable limitation, is estimated as of fiscal period end and is subject to adjustment.
Fiscal year of expiration | |
2017 | $ (227,245) |
The tax character of distributions paid was as follows:
| October 31, 2014 | October 31, 2013 |
Ordinary Income | $ 224,912 | $ 154,444 |
Short-Term Trading (Redemption) Fees. Shares held by investors in the Fund less than 30 days may have been subject to a redemption fee equal to 1.00% of the NAV of shares redeemed. All redemption fees, which reduce the proceeds of the shareholder redemption, are retained by the Fund and accounted for as an addition to paid in capital.
Restricted Securities. The Fund may invest in securities that are subject to legal or contractual restrictions on resale. These securities generally may be resold in transactions exempt from registration or to the public if the securities are registered. Disposal of these securities may involve time-consuming negotiations and expense, and prompt sale at an acceptable price may be difficult. Information regarding restricted securities is included at the end of the Fund's Schedule of Investments.
New Accounting Pronouncement. In June 2014, the Financial Accounting Standards Board issued Accounting Standard Update No. 2014-11, Repurchase-to-Maturity Transactions, Repurchase Financings, and Disclosures. The Update amends the accounting for certain repurchase agreements and expands disclosure requirements for reverse repurchase agreements, securities lending and other similar transactions. The disclosure requirements are effective for annual and interim reporting periods beginning after December 15, 2014. Management is currently evaluating the impact of the Update on the Fund's financial statements and related disclosures.
4. Derivative Instruments.
Risk Exposures and the Use of Derivative Instruments. The Fund's investment objective allows the Fund to enter into various types of derivative contracts, including
Annual Report
Notes to Financial Statements - continued
(Amounts in thousands except percentages)
4. Derivative Instruments - continued
Risk Exposures and the Use of Derivative Instruments - continued
futures contracts. Derivatives are investments whose value is primarily derived from underlying assets, indices or reference rates and may be transacted on an exchange or over-the-counter (OTC). Derivatives may involve a future commitment to buy or sell a specified asset based on specified terms, to exchange future cash flows at periodic intervals based on a notional principal amount, or for one party to make one or more payments upon the occurrence of specified events in exchange for periodic payments from the other party.
The Fund used derivatives to increase returns and to manage exposure to certain risks as defined below. The success of any strategy involving derivatives depends on analysis of numerous economic factors, and if the strategies for investment do not work as intended, the Fund may not achieve its objectives.
The Fund's use of derivatives increased or decreased its exposure to the following risk:
Equity Risk | Equity risk relates to the fluctuations in the value of financial instruments as a result of changes in market prices (other than those arising from interest rate risk or foreign exchange risk), whether caused by factors specific to an individual investment, its issuer, or all factors affecting all instruments traded in a market or market segment. |
The Fund is also exposed to additional risks from investing in derivatives, such as liquidity risk and counterparty credit risk. Liquidity risk is the risk that the Fund will be unable to close out the derivative in the open market in a timely manner. Counterparty credit risk is the risk that the counterparty will not be able to fulfill its obligation to the Fund. Counterparty credit risk related to exchange-traded futures contracts may be mitigated by the protection provided by the exchange on which they trade.
Investing in derivatives may involve greater risks than investing in the underlying assets directly and, to varying degrees, may involve risk of loss in excess of any initial investment and collateral received and amounts recognized in the Statement of Assets and Liabilities. In addition, there may be the risk that the change in value of the derivative contract does not correspond to the change in value of the underlying instrument.
Futures Contracts. A futures contract is an agreement between two parties to buy or sell a specified underlying instrument for a fixed price at a specified future date. The Fund used futures contracts to manage its exposure to the stock market.
Upon entering into a futures contract, a fund is required to deposit either cash or securities (initial margin) with a clearing broker in an amount equal to a certain percentage of the face value of the contract. Futures contracts are marked-to-market daily and subsequent daily payments variation margin are made or received by a fund depending on the
Annual Report
4. Derivative Instruments - continued
Futures Contracts - continued
daily fluctuations in the value of the futures contracts and are recorded as unrealized appreciation or (depreciation). This receivable and/or payable, if any, is included in daily variation margin for derivative instruments in the Statement of Assets and Liabilities. Realized gain or (loss) is recorded upon the expiration or closing of a futures contract.
Any open futures contracts at period end are presented in the Schedule of Investments under the caption "Futures Contracts." The underlying face amount at value reflects each contract's exposure to the underlying instrument or index at period end and is
representative of volume of activity during the period. Securities deposited to meet initial margin requirements are identified in the Schedule of Investments.
During the period the Fund recognized net realized gain (loss) of $16,266 and a change in net unrealized appreciation (depreciation) of $20,360 related to its investment in futures contracts. These amounts are included in the Statement of Operations.
5. Purchases and Sales of Investments.
Purchases and sales of securities, other than short-term securities, aggregated $6,348,453 and $6,576,338, respectively.
6. Fees and Other Transactions with Affiliates.
Management Fee. Fidelity Management & Research Company (the investment adviser) and its affiliates provide the Fund with investment management related services for which the Fund pays a monthly management fee. The management fee is the sum of an individual fund fee rate that is based on an annual rate of .424% of the Fund's average net assets and an annualized group fee rate that averaged .25% during the period. Prior to August 1, 2014 the individual fund fee rate was .45%. The group fee rate is based upon the average net assets of all the mutual funds advised by the investment adviser, including any mutual funds previously advised by the investment adviser that are currently advised by Fidelity SelectCo, LLC, an affiliate of the investment adviser. The group fee rate decreases as assets under management increase and increases as assets under management decrease. In addition, the management fee is subject to a performance adjustment (up to a maximum of ± .20% of the Fund's average net assets over a 36 month performance period). The upward or downward adjustment to the management fee is based on the relative investment performance of International Discovery as compared to its benchmark index, the MSCI EAFE Index, over the same 36 month performance period. For the reporting period, the total annual management fee rate, including the performance adjustment, was .72% of the Fund's average net assets. The performance adjustment included in the management fee rate may be higher or lower
Annual Report
Notes to Financial Statements - continued
(Amounts in thousands except percentages)
6. Fees and Other Transactions with Affiliates - continued
Management Fee - continued
than the maximum performance adjustment rate due to the difference between the average net assets for the reporting and performance periods.
Distribution and Service Plan Fees. In accordance with Rule 12b-1 of the 1940 Act, the Fund has adopted separate Distribution and Service Plans for each class of shares. Certain classes pay Fidelity Distributors Corporation (FDC), an affiliate of the investment adviser, separate Distribution and Service Fees, each of which is based on an annual percentage of each class' average net assets. In addition, FDC may pay financial intermediaries for selling shares of the Fund and providing shareholder support services.
For the period, the Distribution and Service Fee rates, total fees and amounts retained by FDC were as follows:
| Distribution
Fee | Service
Fee | Total Fees | Retained
by FDC |
Class A | -% | .25% | $ 813 | $ 6 |
Class T | .25% | .25% | 255 | 1 |
Class B | .75% | .25% | 58 | 44 |
Class C | .75% | .25% | 382 | 44 |
| | | $ 1,508 | $ 95 |
Sales Load. FDC may receive a front-end sales charge of up to 5.75% for selling Class A shares and 3.50% for selling Class T shares, some of which is paid to financial intermediaries for selling shares of the Fund. Depending on the holding period, FDC may receive contingent deferred sales charges levied on Class A, Class T, Class B, and Class C redemptions. The deferred sales charges range from 5.00% to 1.00% for Class B shares, 1.00% for Class C shares, 1.00% for certain purchases of Class A shares and .25% for certain purchases of Class T shares.
For the period, sales charge amounts retained by FDC were as follows:
| Retained
by FDC |
Class A | $ 59 |
Class T | 7 |
Class B* | 3 |
Class C* | 5 |
| $ 74 |
* When Class B and Class C shares are initially sold, FDC pays commissions from its own resources to financial intermediaries through which the sales are made.
Annual Report
6. Fees and Other Transactions with Affiliates - continued
Transfer Agent Fees. Fidelity Investments Institutional Operations Company, Inc., (FIIOC), an affiliate of the investment adviser is the transfer, dividend disbursing and shareholder servicing agent for each class of the Fund. FIIOC receives account fees and asset-based fees that vary according to the account size and type of account of the shareholders of the respective classes of the Fund, except for Class Z. FIIOC receives an asset-based fee of Class K's and Class Z's average net assets. FIIOC receives an asset-based fee of Class Z's average net assets. FIIOC pays for typesetting, printing and mailing of shareholder reports, except proxy statements.
For the period, transfer agent fees for each applicable class were as follows:
| Amount | % of
Class-Level Average
Net Assets |
Class A | $ 904 | .28 |
Class T | 134 | .26 |
Class B | 18 | .30 |
Class C | 105 | .28 |
International Discovery | 14,295 | .18 |
Class K | 1,219 | .05 |
Institutional Class | 1,088 | .18 |
Class Z | 8 | .05 |
| $ 17,771 | |
Accounting and Security Lending Fees. Fidelity Service Company, Inc. (FSC), an affiliate of the investment adviser, maintains the Fund's accounting records. The accounting fee is based on the level of average net assets for each month. Under a separate contract, FSC administers the security lending program. The security lending fee is based on the number and duration of lending transactions.
Brokerage Commissions. The Fund placed a portion of its portfolio transactions with brokerage firms which are affiliates of the investment adviser. Brokerage commissions are included in net realized gain (loss) and change in net unrealized appreciation (depreciation) in the Statement of Operations. The commissions paid to these affiliated firms were $11 for the period.
Other. During the period, the investment adviser reimbursed the Fund for certain losses in the amount of $2.
7. Committed Line of Credit.
The Fund participates with other funds managed by the investment adviser or an affiliate in a $4.25 billion credit facility (the "line of credit") to be utilized for temporary or emergency purposes to fund shareholder redemptions or for other short-term liquidity purposes. The Fund has agreed to pay commitment fees on its pro-rata portion of the line
Annual Report
Notes to Financial Statements - continued
(Amounts in thousands except percentages)
7. Committed Line of Credit - continued
of credit, which amounted to $19 and is reflected in Miscellaneous expenses on the Statement of Operations. During the period, the Fund did not borrow on this line of credit.
8. Security Lending.
The Fund lends portfolio securities through a lending agent from time to time in order to earn additional income. For equity securities, a lending agent is used and may loan securities to certain qualified borrowers, including Fidelity Capital Markets (FCM), a broker-dealer affiliated with the Fund. On the settlement date of the loan, the Fund receives collateral (in the form of U.S. Treasury obligations, letters of credit and/or cash) against the loaned securities and maintains collateral in an amount not less than 100% of the market value of the loaned securities during the period of the loan. The market value of the loaned securities is determined at the close of business of the Fund and any additional required collateral is delivered to the Fund on the next business day. If the borrower defaults on its obligation to return the securities loaned because of insolvency or other reasons, the Fund may apply collateral received from the borrower against the obligation. The Fund may experience delays and costs in recovering the securities loaned. Any cash collateral received is invested in the Fidelity Securities Lending Cash Central Fund. The value of loaned securities and cash collateral at period end are disclosed on the Fund's Statement of Assets and Liabilities. At period end, there were no security loans outstanding with FCM. Security lending income represents the income earned on investing cash collateral, less rebates paid to borrowers and any lending agent fees associated with the loan, plus any premium payments received for lending certain types of securities. Security lending income is presented in the Statement of Operations as a component of income from Fidelity Central Funds. Total security lending income during the period amounted to $5,278, including $7 from securities loaned to FCM.
9. Expense Reductions.
Commissions paid to certain brokers with whom the investment adviser, or its affiliates, places trades on behalf of the Fund include an amount in addition to trade execution, which may be rebated back to the Fund to offset certain expenses. This amount totaled $317 for the period.
In addition, the investment adviser reimbursed a portion of the Fund's operating expenses during the period in the amount of $28.
Annual Report
10. Distributions to Shareholders.
Distributions to shareholders of each class were as follows:
Years ended October 31, | 2014 | 2013 |
From net investment income | | |
Class A | $ 2,857 | $ 4,138 |
Class T | 344 | 492 |
Class B | 2 | 34 |
Class C | 79 | 186 |
International Discovery | 93,065 | 101,466 |
Class K | 33,983 | 34,651 |
Institutional Class | 5,936 | 5,064 |
Class Z | 60 | - |
Total | $ 136,326 | $ 146,031 |
From net realized gain | 2014 | 2013 |
Class A | $ 2,660 | $ 297 |
Class T | 423 | 46 |
Class B | 52 | 7 |
Class C | 295 | 30 |
International Discovery | 61,190 | 5,914 |
Class K | 20,093 | 1,827 |
Institutional Class | 3,838 | 292 |
Class Z | 35 | - |
Total | $ 88,586 | $ 8,413 |
11. Share Transactions.
Share transactions for each class were as follows and may contain automatic conversions between classes or exchanges between funds:
| Shares | Shares | Dollars | Dollars |
Years ended October 31, | 2014 | 2013 A | 2014 | 2013 A |
Class A | | | | |
Shares sold | 1,382 | 1,772 | $ 54,489 | $ 62,186 |
Reinvestment of distributions | 137 | 132 | 5,280 | 4,249 |
Shares redeemed | (2,632) | (2,553) | (104,067) | (88,988) |
Net increase (decrease) | (1,113) | (649) | $ (44,298) | $ (22,553) |
Class T | | | | |
Shares sold | 200 | 227 | $ 7,804 | $ 7,911 |
Reinvestment of distributions | 19 | 16 | 736 | 512 |
Shares redeemed | (311) | (347) | (12,118) | (11,997) |
Net increase (decrease) | (92) | (104) | $ (3,578) | $ (3,574) |
Class B | | | | |
Shares sold | 6 | 4 | $ 233 | $ 137 |
Reinvestment of distributions | 1 | 1 | 51 | 39 |
Shares redeemed | (58) | (75) | (2,266) | (2,570) |
Net increase (decrease) | (51) | (70) | $ (1,982) | $ (2,394) |
Annual Report
Notes to Financial Statements - continued
(Amounts in thousands except percentages)
11. Share Transactions - continued
| Shares | Shares | Dollars | Dollars |
Years ended October 31, | 2014 | 2013 A | 2014 | 2013 A |
Class C | | | | |
Shares sold | 232 | 184 | $ 9,059 | $ 6,532 |
Reinvestment of distributions | 9 | 6 | 337 | 193 |
Shares redeemed | (250) | (207) | (9,726) | (7,250) |
Net increase (decrease) | (9) | (17) | $ (330) | $ (525) |
International Discovery | | | | |
Shares sold | 28,809 | 37,338 | $ 1,144,588 | $ 1,332,523 |
Reinvestment of distributions | 3,813 | 3,176 | 148,138 | 102,608 |
Shares redeemed | (37,231) | (31,569) | (1,476,965) | (1,103,313) |
Net increase (decrease) | (4,609) | 8,945 | $ (184,239) | $ 331,818 |
Class K | | | | |
Shares sold | 15,775 | 19,989 | $ 628,261 | $ 699,723 |
Reinvestment of distributions | 1,396 | 1,132 | 54,076 | 36,478 |
Shares redeemed | (18,729) | (12,053) | (741,205) | (423,712) |
Net increase (decrease) | (1,558) | 9,068 | $ (58,868) | $ 312,489 |
Institutional Class | | | | |
Shares sold | 10,468 | 4,893 | $ 410,346 | $ 175,669 |
Reinvestment of distributions | 91 | 68 | 3,529 | 2,182 |
Shares redeemed | (5,852) | (2,219) | (225,868) | (78,500) |
Net increase (decrease) | 4,707 | 2,742 | $ 188,007 | $ 99,351 |
Class Z | | | | |
Shares sold | 993 | 3 | $ 39,070 | $ 100 |
Reinvestment of distributions | 2 | - | 95 | - |
Shares redeemed | (96) | - | (3,785) | - |
Net increase (decrease) | 899 | 3 | $ 35,380 | $ 100 |
A Share transactions for Class Z are for the period August 13, 2013 (commencement of sale of shares) to October 31, 2014.
12. Other.
The Fund's organizational documents provide former and current trustees and officers with a limited indemnification against liabilities arising in connection with the performance of their duties to the Fund. In the normal course of business, the Fund may also enter into contracts that provide general indemnifications. The Fund's maximum exposure under these arrangements is unknown as this would be dependent on future claims that may be made against the Fund. The risk of material loss from such claims is considered remote.
At the end of the period, Strategic Advisers International Fund was the owner of record of approximately 15% of the total outstanding shares of the Fund.
Annual Report
To the Trustees of Fidelity Investment Trust and the Shareholders of Fidelity International Discovery Fund:
In our opinion, the accompanying statement of assets and liabilities, including the schedule of investments, and the related statements of operations and of changes in net assets and the financial highlights present fairly, in all material respects, the financial position of Fidelity International Discovery Fund (a fund of Fidelity Investment Trust) at October 31, 2014, the results of its operations for the year then ended, the changes in its net assets for each of the two years in the period then ended and the financial highlights for each of the periods indicated, in conformity with accounting principles generally accepted in the United States of America. These financial statements and financial highlights (hereafter referred to as "financial statements") are the responsibility of the Fidelity International Discovery Fund's management. Our responsibility is to express an opinion on these financial statements based on our audits. We conducted our audits of these financial statements in accordance with the standards of the Public Company Accounting Oversight Board (United States). Those standards require that we plan and perform the audit to obtain reasonable assurance about whether the financial statements are free of material misstatement. An audit includes examining, on a test basis, evidence supporting the amounts and disclosures in the financial statements, assessing the accounting principles used and significant estimates made by management, and evaluating the overall financial statement presentation. We believe that our audits, which included confirmation of securities at October 31, 2014 by correspondence with the custodian and brokers, provide a reasonable basis for our opinion.
PricewaterhouseCoopers LLP
Boston, Massachusetts
December 19, 2014
Annual Report
The Trustees, Member of the Advisory Board, and officers of the trust and fund, as applicable, are listed below. The Board of Trustees governs the fund and is responsible for protecting the interests of shareholders. The Trustees are experienced executives who meet periodically throughout the year to oversee the fund's activities, review contractual arrangements with companies that provide services to the fund, oversee management of the risks associated with such activities and contractual arrangements, and review the fund's performance. Except for James C. Curvey, each of the Trustees oversees 174 funds. Mr. Curvey oversees 407 funds.
The Trustees hold office without limit in time except that (a) any Trustee may resign; (b) any Trustee may be removed by written instrument, signed by at least two-thirds of the number of Trustees prior to such removal; (c) any Trustee who requests to be retired or who has become incapacitated by illness or injury may be retired by written instrument signed by a majority of the other Trustees; and (d) any Trustee may be removed at any special meeting of shareholders by a two-thirds vote of the outstanding voting securities of the trust. Each Trustee who is not an interested person (as defined in the 1940 Act) of the trust and the fund (Independent Trustee), shall retire not later than the last day of the calendar year in which his or her 75th birthday occurs. The Independent Trustees may waive this mandatory retirement age policy with respect to individual Trustees. The officers and Advisory Board Member hold office without limit in time, except that any officer and Advisory Board Member may resign or may be removed by a vote of a majority of the Trustees at any regular meeting or any special meeting of the Trustees. Except as indicated, each individual has held the office shown or other offices in the same company for the past five years.
Experience, Skills, Attributes, and Qualifications of the Fund's Trustees. The Governance and Nominating Committee has adopted a statement of policy that describes the experience, qualifications, attributes, and skills that are necessary and desirable for potential Independent Trustee candidates (Statement of Policy). The Board believes that each Trustee satisfied at the time he or she was initially elected or appointed a Trustee, and continues to satisfy, the standards contemplated by the Statement of Policy. The Governance and Nominating Committee also engages professional search firms to help identify potential Independent Trustee candidates who have the experience, qualifications, attributes, and skills consistent with the Statement of Policy. From time to time, additional criteria based on the composition and skills of the current Independent Trustees, as well as experience or skills that may be appropriate in light of future changes to board composition, business conditions, and regulatory or other developments, have also been considered by the professional search firms and the Governance and Nominating Committee. In addition, the Board takes into account the Trustees' commitment and participation in Board and committee meetings, as well as their leadership of standing and ad hoc committees throughout their tenure.
In determining that a particular Trustee was and continues to be qualified to serve as a Trustee, the Board has considered a variety of criteria, none of which, in isolation, was controlling. The Board believes that, collectively, the Trustees have balanced and diverse experience, qualifications, attributes, and skills, which allow the Board to operate effectively in governing the fund and protecting the interests of shareholders. Information about the specific experience, skills, attributes, and qualifications of each Trustee, which in each case led to the Board's conclusion that the Trustee should serve (or continue to serve) as a trustee of the fund, is provided below.
Annual Report
Trustees and Officers - continued
Board Structure and Oversight Function. James C. Curvey is an interested person (as defined in the 1940 Act) and currently serves as Chairman. The Trustees have determined that an interested Chairman is appropriate and benefits shareholders because an interested Chairman has a personal and professional stake in the quality and continuity of services provided to the fund. Independent Trustees exercise their informed business judgment to appoint an individual of their choosing to serve as Chairman, regardless of whether the Trustee happens to be independent or a member of management. The Independent Trustees have determined that they can act independently and effectively without having an Independent Trustee serve as Chairman and that a key structural component for assuring that they are in a position to do so is for the Independent Trustees to constitute a substantial majority for the Board. The Independent Trustees also regularly meet in executive session. Ned C. Lautenbach serves as Chairman of the Independent Trustees and as such (i) acts as a liaison between the Independent Trustees and management with respect to matters important to the Independent Trustees and (ii) with management prepares agendas for Board meetings.
Fidelity funds are overseen by different Boards of Trustees. The fund's Board oversees Fidelity's equity and high income funds and another Board oversees Fidelity's investment-grade bond, money market, and asset allocation funds. The asset allocation funds may invest in Fidelity funds overseen by the fund's Board. The use of separate Boards, each with its own committee structure, allows the Trustees of each group of Fidelity funds to focus on the unique issues of the funds they oversee, including common research, investment, and operational issues. On occasion, the separate Boards establish joint committees to address issues of overlapping consequences for the Fidelity funds overseen by each Board.
The Trustees operate using a system of committees to facilitate the timely and efficient consideration of all matters of importance to the Trustees, the fund, and fund shareholders and to facilitate compliance with legal and regulatory requirements and oversight of the fund's activities and associated risks. The Board, acting through its committees, has charged FMR and its affiliates with (i) identifying events or circumstances the occurrence of which could have demonstrably adverse effects on the fund's business and/or reputation; (ii) implementing processes and controls to lessen the possibility that such events or circumstances occur or to mitigate the effects of such events or circumstances if they do occur; and (iii) creating and maintaining a system designed to evaluate continuously business and market conditions in order to facilitate the identification and implementation processes described in (i) and (ii) above. Because the day-to-day operations and activities of the fund are carried out by or through FMR, its affiliates and other service providers, the fund's exposure to risks is mitigated but not eliminated by the processes overseen by the Trustees. While each of the Board's committees has responsibility for overseeing different aspects of the fund's activities, oversight is exercised primarily through the Operations, Audit, and Compliance Committees. In addition, the Independent Trustees have worked with FMR to enhance the Board's oversight of investment and financial risks, legal and regulatory risks, technology risks, and operational risks, including the development of additional risk reporting to the Board. For example, a working group comprised of Independent Trustees and FMR has worked and continues to work to review the Fidelity funds' valuation-related activities, reporting and risk management. Appropriate personnel, including but not limited to the fund's Chief Compliance Officer (CCO), FMR's internal auditor, the independent accountants, the fund's Treasurer and portfolio management personnel, make periodic reports to the Board's committees, as appropriate, including an annual review of FMR's risk management program for the Fidelity funds. The responsibilities of each standing committee, including their oversight responsibilities, are described further under "Standing Committees of the Fund's Trustees."
Annual Report
The fund's Statement of Additional Information (SAI) includes more information about the Trustees. To request a free copy, call Fidelity at 1-877-208-0098.
Interested Trustees*:
Correspondence intended for each Trustee who is an interested person may be sent to Fidelity Investments, 245 Summer Street, Boston, Massachusetts 02210.
Name, Year of Birth; Principal Occupations and Other Relevant Experience+ |
James C. Curvey (1935) |
Year of Election or Appointment: 2007 Trustee Chairman of the Board of Trustees |
| Mr. Curvey also serves as Trustee of other Fidelity funds. Mr. Curvey is a Director of Fidelity Research & Analysis Co. (2009-present), and Vice Chairman (2007-present) and Director of FMR LLC. In addition, Mr. Curvey serves as an Overseer for the Boston Symphony Orchestra and a member of the board of ArtisNaples, Naples, Florida, and as a Trustee for Brewster Academy, Wolfeboro, New Hampshire. Previously, Mr. Curvey served as a Director of Fidelity Investments Money Management, Inc. (2009-2014), a Director of FMR (2007-2014), and a Director of FMR Co., Inc. (2007-2014). |
Charles S. Morrison (1960) |
Year of Election or Appointment: 2014 Trustee |
| Mr. Morrison also serves as Trustee of other funds. He serves as a Director of Fidelity Investments Money Management, Inc. (FIMM) (2014-present), Director of Fidelity SelectCo, LLC (2014-present), President, Asset Management (2014-present), and is an employee of Fidelity Investments. Previously, Mr. Morrison served as Vice President of Fidelity's Fixed Income and Asset Allocation Funds (2012-2014), President, Fixed Income (2011-2014), Vice President of Fidelity's Money Market Funds (2005-2009), President, Money Market Group Leader of FMR (2009), and Senior Vice President, Money Market Group of FMR (2004-2009). Mr. Morrison also served as Vice President of Fidelity's Bond Funds (2002-2005), certain Balanced Funds (2002-2005), and certain Asset Allocation Funds (2002-2007), and as Senior Vice President (2002-2005) of Fidelity's Bond Division. |
* Trustees have been determined to be "Interested Trustees" by virtue of, among other things, their affiliation with the trust or various entities under common control with FMR.
+ The information above includes each Trustee's principal occupation during the last five years and other information relating to the experience, attributes, and skills relevant to each Trustee's qualifications to serve as a Trustee, which led to the conclusion that each Trustee should serve as a Trustee for the fund.
Annual Report
Independent Trustees:
Correspondence intended for each Independent Trustee (that is, the Trustees other than the Interested Trustees) may be sent to Fidelity Investments, P.O. Box 55235, Boston, Massachusetts 02205-5235.
Name, Year of Birth; Principal Occupations and Other Relevant Experience+ |
Dennis J. Dirks (1948) |
Year of Election or Appointment: 2005 Trustee |
| Mr. Dirks also serves as Trustee of other Fidelity funds. Prior to his retirement in May 2003, Mr. Dirks was Chief Operating Officer and a member of the Board of The Depository Trust & Clearing Corporation (DTCC). He also served as President, Chief Operating Officer, and Board member of The Depository Trust Company (DTC) and President and Board member of the National Securities Clearing Corporation (NSCC). In addition, Mr. Dirks served as Chief Executive Officer and Board member of the Government Securities Clearing Corporation, Chief Executive Officer and Board member of the Mortgage-Backed Securities Clearing Corporation, as a Trustee and a member of the Finance Committee of Manhattan College (2005-2008), and as a Trustee and a member of the Finance Committee of AHRC of Nassau County (2006-2008). Mr. Dirks is a member of the Independent Directors Council (IDC) Governing Council (2010-present) and Board of Directors for The Brookville Center for Children's Services, Inc. (2009-present). |
Alan J. Lacy (1953) |
Year of Election or Appointment: 2008 Trustee |
| Mr. Lacy also serves as Trustee of other Fidelity funds. Mr. Lacy serves as Senior Adviser (2007-present) of Oak Hill Capital Partners, L.P. (private equity). Mr. Lacy also served as Chief Executive Officer (2000-2005) and Vice Chairman (2005-2006) of Sears Holdings Corporation and Sears, Roebuck and Co. (retail). In addition, Mr. Lacy serves as a member of the Board of Directors of Dave & Buster's Entertainment, Inc. (restaurant and entertainment complexes, 2010-present), Earth Fare, Inc. (retail grocery, 2012-present), The Hillman Companies, Inc. (hardware wholesalers, 2010-present), and Bristol-Myers Squibb Company (global pharmaceuticals, 2008-present). Mr. Lacy is a member of the Board of Trustees of The National Parks Conservation Association (2006-present). Previously, Mr. Lacy served as Chairman of the Board of Trustees of the National Parks Conservation Association (2008-2011) and as a member of the Board of Directors for the Western Union Company (global money transfer, 2006-2011). |
Ned C. Lautenbach (1944) |
Year of Election or Appointment: 2000 Trustee Chairman of the Independent Trustees |
| Mr. Lautenbach also serves as Trustee of other Fidelity funds. Mr. Lautenbach currently serves as the Lead Director of the Eaton Corporation Board of Directors (diversified industrial, 1997-present). Mr. Lautenbach is Chairman of the Board of Directors of the Philharmonic Center for the Arts in Naples, Florida (2012-present) and a member of the Council on Foreign Relations (1994-present). Previously, Mr. Lautenbach was a Partner/Advisory Partner at Clayton, Dubilier & Rice, LLC (private equity investment, 1998-2010), as well as a Director of Sony Corporation (2006-2007). |
Joseph Mauriello (1944) |
Year of Election or Appointment: 2008 Trustee |
| Mr. Mauriello also serves as Trustee of other Fidelity funds. Prior to his retirement in January 2006, Mr. Mauriello served in numerous senior management positions including Deputy Chairman and Chief Operating Officer (2004-2005), and Vice Chairman of Financial Services (2002-2004) of KPMG LLP US (professional services, 1965-2005). Mr. Mauriello currently serves as a member of the Board of Directors of XL Group plc. (global insurance and re-insurance, 2006-present). Previously, Mr. Mauriello served as a Director of the Hamilton Funds of the Bank of New York (2006-2007) and of Arcadia Resources Inc. (health care services and products, 2007-2012). |
Robert W. Selander (1950) |
Year of Election or Appointment: 2011 Trustee |
| Mr. Selander also serves as Trustee of other Fidelity funds. Previously, Mr. Selander served as a Member of the Advisory Board of other Fidelity funds (2011), and Executive Vice Chairman (2010), Chief Executive Officer (2009-2010), and President and Chief Executive Officer (1997-2009) of Mastercard, Inc. |
Cornelia M. Small (1944) |
Year of Election or Appointment: 2005 Trustee |
| Ms. Small also serves as Trustee of other Fidelity funds. Ms. Small is a member of the Board of Directors (2009-present) and Chair of the Investment Committee (2010-present) of the Teagle Foundation. Ms. Small also serves on the Investment Committee of the Berkshire Taconic Community Foundation (2008-present). Previously, Ms. Small served as Chairperson (2002-2008) and a member of the Investment Committee and Chairperson (2008-2012) and a member of the Board of Trustees of Smith College. In addition, Ms. Small served as Chief Investment Officer, Director of Global Equity Investments, and a member of the Board of Directors of Scudder, Stevens & Clark and Scudder Kemper Investments. |
William S. Stavropoulos (1939) |
Year of Election or Appointment: 2001 Trustee Vice Chairman of the Independent Trustees |
| Mr. Stavropoulos also serves as Trustee of other Fidelity funds. Mr. Stavropoulos serves as President and Founder of the Michigan Baseball Foundation, the Great Lakes Loons (2007-present). Mr. Stavropoulos is Chairman Emeritus of the Board of Directors of The Dow Chemical Company, where he previously served in numerous senior management positions, including President, CEO (1995-2000; 2002-2004), Chairman of the Executive Committee (2000-2006), and as a member of the Board of Directors (1990-2006). Currently, Mr. Stavropoulos is Chairman of the Board of Directors of Univar Inc. (global distributor of commodity and specialty chemicals), a Director of Teradata Corporation (data warehousing and technology solutions), and Maersk Inc. (industrial conglomerate), and a member of the Advisory Board for Metalmark Capital LLC (private equity investment, 2005-present). Mr. Stavropoulos is an operating advisor to Clayton, Dubilier & Rice, LLC (private equity investment). In addition, Mr. Stavropoulos is a member of the University of Notre Dame Advisory Council for the College of Science, a Trustee of the Rollin L. Gerstacker Foundation, and a Director of the Naples Philharmonic Center for the Arts. Previously, Mr. Stavropoulos served as a Director of Chemical Financial Corporation (bank holding company, 1993-2012) and Tyco International, Ltd. (multinational manufacturing and services, 2007-2012). |
David M. Thomas (1949) |
Year of Election or Appointment: 2008 Trustee |
| Mr. Thomas also serves as Trustee of other Fidelity funds. Mr. Thomas serves as Non-Executive Chairman of the Board of Directors of Fortune Brands Home and Security (home and security products, 2011-present), and as a member of the Board of Directors of Interpublic Group of Companies, Inc. (marketing communication, 2004-present). Previously, Mr. Thomas served as Executive Chairman (2005-2006) and Chairman and Chief Executive Officer (2000-2005) of IMS Health, Inc. (pharmaceutical and healthcare information solutions), and a Director of Fortune Brands, Inc. (consumer products, 2000-2011). |
+ The information above includes each Trustee's principal occupation during the last five years and other information relating to the experience, attributes, and skills relevant to each Trustee's qualifications to serve as a Trustee, which led to the conclusion that each Trustee should serve as a Trustee for the fund.
Advisory Board Member and Officers:
Correspondence intended for each officer and Peter S. Lynch may be sent to Fidelity Investments, 245 Summer Street, Boston, Massachusetts 02210. Officers appear below in alphabetical order.
Name, Year of Birth; Principal Occupation |
Peter S. Lynch (1944) |
Year of Election or Appointment: 2003 Member of the Advisory Board |
| Mr. Lynch also serves as Member of the Advisory Board of other Fidelity funds. Mr. Lynch is Vice Chairman and a Director of FMR and FMR Co., Inc. In addition, Mr. Lynch serves as a Trustee of Boston College and as the Chairman of the Inner-City Scholarship Fund. Previously, Mr. Lynch served on the Special Olympics International Board of Directors (1997-2006). |
Elizabeth Paige Baumann (1968) |
Year of Election or Appointment: 2012 Anti-Money Laundering (AML) Officer |
| Ms. Baumann also serves as AML Officer of other funds. She is Chief AML Officer of FMR LLC (2012-present) and is an employee of Fidelity Investments. Previously, Ms. Baumann served as Vice President and Deputy Anti-Money Laundering Officer (2007-2012). |
William C. Coffey (1969) |
Year of Election or Appointment: 2009 Assistant Secretary |
| Mr. Coffey also serves as Assistant Secretary of other funds. He is Senior Vice President and Deputy General Counsel of FMR LLC (2010-present), and is an employee of Fidelity Investments. Previously, Mr. Coffey served as Vice President and Associate General Counsel of FMR LLC (2005-2009). |
Timothy M. Cohen (1969) |
Year of Election or Appointment: 2014 Vice President of certain Equity Funds |
| Mr. Cohen also serves as Vice President of other funds. Mr. Cohen serves as a Director and Chief Compliance Officer of Fidelity Management & Research (U.K.) Inc. (2013-present) and is an employee of Fidelity Investments. |
Jonathan Davis (1968) |
Year of Election or Appointment: 2010 Assistant Treasurer |
| Mr. Davis also serves as Assistant Treasurer of other funds. Mr. Davis is an employee of Fidelity Investments. Previously, Mr. Davis served as Vice President and Associate General Counsel of FMR LLC (2003-2010). |
Adrien E. Deberghes (1967) |
Year of Election or Appointment: 2008 Deputy Treasurer |
| Mr. Deberghes also serves as an officer of other funds. He is an employee of Fidelity Investments (2008-present). Prior to joining Fidelity Investments, Mr. Deberghes was Senior Vice President of Mutual Fund Administration at State Street Corporation (2007-2008), Senior Director of Mutual Fund Administration at Investors Bank & Trust (2005-2007), and Director of Finance for Dunkin' Brands (2000-2005). |
Stephanie J. Dorsey (1969) |
Year of Election or Appointment: 2010 Assistant Treasurer |
| Ms. Dorsey also serves as an officer of other funds. She is an employee of Fidelity Investments (2008-present) and has served in other fund officer roles. Prior to joining Fidelity Investments, Ms. Dorsey served as Treasurer (2004-2008) of the JPMorgan Mutual Funds and Vice President (2004-2008) of JPMorgan Chase Bank. |
Howard J. Galligan III (1966) |
Year of Election or Appointment: 2014 Chief Financial Officer |
| Mr. Galligan also serves as Chief Financial Officer of other funds. Mr. Galligan serves as President of Fidelity Pricing and Cash Management Services (FPCMS) (2014-present) and as a Director of Strategic Advisers, Inc. (2008-present). Previously, Mr. Galligan served as Chief Administrative Officer of Asset Management (2011-2014) and Chief Operating Officer and Senior Vice President of Investment Support for Strategic Advisers, Inc. (2003-2011). |
Scott C. Goebel (1968) |
Year of Election or Appointment: 2008 Secretary and Chief Legal Officer (CLO) |
| Mr. Goebel serves as Secretary and CLO of other funds. Mr. Goebel also serves as Secretary of Fidelity SelectCo, LLC (2013-present), Fidelity Investments Money Management, Inc. (FIMM) (2010-present) and Fidelity Research and Analysis Company (FRAC) (2010-present); General Counsel, Secretary, and Senior Vice President of FMR (2008-present) and FMR Co., Inc. (2008-present); Chief Legal Officer of Fidelity Management & Research (Hong Kong) Limited (2008-present); and Assistant Secretary of Fidelity Management & Research (Japan) Limited (2008-present) and Fidelity Management & Research (U.K.) Inc. (2008-present). Previously, Mr. Goebel served as Secretary and CLO of other Fidelity funds (2008-2013), Assistant Secretary of FIMM (2008-2010), FRAC (2008-2010), and certain funds (2007-2008); and as Vice President and Secretary of Fidelity Distributors Corporation (FDC) (2005-2007). Mr. Goebel has been employed by FMR LLC or an affiliate since 2001. |
Brian B. Hogan (1964) |
Year of Election or Appointment: 2009 Vice President |
| Mr. Hogan also serves as Trustee or Vice President of other funds. Mr. Hogan serves as a Director of Fidelity SelectCo, LLC (2014-present), and President of FMR's Equity Division (2009-present). Previously, Mr. Hogan served as Senior Vice President, Equity Research of FMR (2006-2009) and as a portfolio manager. |
Chris Maher (1972) |
Year of Election or Appointment: 2013 Assistant Treasurer |
| Mr. Maher serves as Assistant Treasurer of other funds. Mr. Maher is Vice President of Valuation Oversight and is an employee of Fidelity Investments. Previously, Mr. Maher served as Vice President of Asset Management Compliance (2013), Vice President of FMR's Program Management Group (2010-2013), and Vice President of Valuation Oversight (2008-2010). |
Kenneth B. Robins (1969) |
Year of Election or Appointment: 2008 President and Treasurer |
| Mr. Robins also serves as an officer of other funds. Mr. Robins serves as Executive Vice President of Fidelity Investments Money Management, Inc. (FIMM) (2013-present) and is an employee of Fidelity Investments (2004-present). Previously, Mr. Robins served in other fund officer roles. |
Stephen Sadoski (1971) |
Year of Election or Appointment: 2012 Deputy Treasurer |
| Mr. Sadoski also serves as Deputy Treasurer of other funds. He is an employee of Fidelity Investments (2012-present) and has served in another fund officer role. Prior to joining Fidelity Investments, Mr. Sadoski served as an assistant chief accountant in the Division of Investment Management of the Securities and Exchange Commission (SEC) (2009-2012) and as a senior manager at Deloitte & Touche LLP (1997-2009). |
Stacie M. Smith (1974) |
Year of Election or Appointment: 2013 Deputy Treasurer |
| Ms. Smith also serves as an officer of other funds. She is an employee of Fidelity Investments (2009-present) and has served in other fund officer roles. Prior to joining Fidelity Investments, Ms. Smith served as Senior Audit Manager of Ernst & Young LLP (1996-2009). |
Renee Stagnone (1975) |
Year of Election or Appointment: 2013 Deputy Treasurer |
| Ms. Stagnone also serves as Deputy Treasurer of other funds. Ms. Stagnone is an employee of Fidelity Investments. |
Linda J. Wondrack (1964) |
Year of Election or Appointment: 2014 Chief Compliance Officer |
| Ms. Wondrack also serves as Chief Compliance Officer of other funds. Ms. Wondrack is Executive Vice President and head of the Ethics Office and Asset Management Compliance for Fidelity Investments (2012-present). Ms. Wondrack also serves as Chief Compliance Officer of Fidelity SelectCo, LLC (2014-present); Chief Compliance Officer of Impresa Management LLC (2013-present); and Chief Compliance Officer of FMR Co., Inc., Fidelity Investments Money Management, Inc., Fidelity Management & Research (Japan) Limited, Fidelity Management & Research (U.K.) Inc., Fidelity Management & Research (Hong Kong), Fidelity Management & Research Company, Pyramis Global Advisors, LLC, and Strategic Advisers, Inc., Ballyrock Investment Advisors LLC, and Northern Neck Investors LLC (2012-present). Previously, Ms. Wondrack served as Senior Vice President and Chief Compliance Officer for Columbia Management Investment Advisers, LLC (2005-2012); Chief Compliance Officer for certain funds within the Columbia Family of Funds (2007-2012); and Senior Vice President of Compliance Risk Management at Bank of America (2005-2010). |
Joseph F. Zambello (1957) |
Year of Election or Appointment: 2011 Deputy Treasurer |
| Mr. Zambello also serves as Deputy Treasurer of other funds. Mr. Zambello is an employee of Fidelity Investments. Previously, Mr. Zambello served as Vice President of FMR's Program Management Group (2009-2011) and Vice President of the Transfer Agent Oversight Group (2005-2009). |
Annual Report
Institutional Class, designates 1% of the dividends distributed in during the fiscal year as qualifying for the dividends-received deduction for corporate shareholders
Institutional Class designates 67% of dividends distributed during the fiscal year as amounts which may be taken into account as a dividend for purposes of the maximum rate under section 1(h)(11) of the Internal Revenue Code.
The amounts per share which represent income derived from sources within, and taxes paid to, foreign countries or possessions of the United States are as follows:
| Pay Date | Income | Taxes |
Institutional Class | 12/09/13 | $0.4193 | $0.0365 |
The fund will notify shareholders in January 2015 of amounts for use in preparing 2014 income tax returns.
Annual Report
Board Approval of Investment Advisory Contracts and Management Fees
Fidelity International Discovery Fund
Each year, the Board of Trustees, including the Independent Trustees (together, the Board), votes on the renewal of the management contract with Fidelity Management & Research Company (FMR) and the sub-advisory agreements (together, the Advisory Contracts) for the fund. The Board, assisted by the advice of fund counsel and Independent Trustees' counsel, requests and considers a broad range of information relevant to the renewal of the Advisory Contracts throughout the year.
The Board meets regularly and, at each of its meetings, covers an extensive agenda of topics and materials and considers factors that are relevant to its annual consideration of the renewal of the fund's Advisory Contracts, including the services and support provided to the fund and its shareholders. The Board has established various standing committees (Committees), each composed of and chaired by Independent Trustees with varying backgrounds, to which the Board has assigned specific subject matter responsibilities in order to enhance effective decision-making by the Board. The Board, acting directly and through its Committees, requests and receives information concerning the annual consideration of the renewal of the fund's Advisory Contracts. The Board also meets as needed to consider matters specifically related to the Board's annual consideration of the renewal of the Advisory Contracts. Members of the Board may also meet with trustees of other Fidelity funds through ad hoc joint committees to discuss certain matters relevant to the Fidelity funds.
At its July 2014 meeting, the Board, including the Independent Trustees, unanimously determined to renew the fund's Advisory Contracts. In reaching its determination, the Board considered all factors it believed relevant, including (i) the nature, extent, and quality of the services to be provided to the fund and its shareholders (including the investment performance of the fund); (ii) the competitiveness of the fund's management fee and total expense ratio relative to peer funds; (iii) the total costs of the services to be provided by and the profits to be realized by Fidelity from its relationship with the fund; (iv) the extent to which economies of scale exist and would be realized as the fund grows; and (v) whether fee levels reflect these economies of scale, if any, for the benefit of fund shareholders. In connection with separate internal corporate reorganizations involving Fidelity Management & Research (U.K.) Inc. (FMR U.K.) and Fidelity Management & Research (Japan) Inc. (FMR Japan), the Board approved certain non-material amendments to the fund's sub-advisory agreements with FMR U.K. and FMR Japan to reflect that, after these reorganizations, FMR Investment Management (UK) Limited and Fidelity Management & Research (Japan) Limited will carry on the business of FMR U.K. and FMR Japan, respectively. The Board noted that no changes to the portfolio managers or to the foreign research or investment advisory services provided to the fund were expected in connection with either reorganization and that the same personnel and resources would continue to be available to the fund at the new entities.
Annual Report
In considering whether to renew the Advisory Contracts for the fund, the Board reached a determination, with the assistance of fund counsel and Independent Trustees' counsel and through the exercise of its business judgment, that the renewal of the Advisory Contracts was in the best interests of the fund and its shareholders and that the compensation payable under the Advisory Contracts was fair and reasonable. The Board's decision to renew the Advisory Contracts was not based on any single factor, but rather was based on a comprehensive consideration of all the information provided to the Board at its meetings throughout the year. The Board, in reaching its determination to renew the Advisory Contracts, was aware that shareholders of the fund have a broad range of investment choices available to them, including a wide choice among funds offered by Fidelity's competitors, and that the fund's shareholders, who have the opportunity to review and weigh the disclosure provided by the fund in its prospectus and other public disclosures, have chosen to invest in this fund, which is part of the Fidelity family of funds.
Nature, Extent, and Quality of Services Provided. The Board considered Fidelity's staffing as it relates to the fund, including the backgrounds of investment personnel of FMR and the sub-advisers (together, the Investment Advisers), and also considered the fund's investment objective, strategies, and related investment philosophy. The Independent Trustees also had discussions with senior management of Fidelity's investment operations and investment groups. The Board considered the structure of the portfolio manager compensation program and whether this structure provides appropriate incentives to act in the best interests of the fund. Additionally, the Board considered the portfolio managers' investments, if any, in the funds that they manage.
Resources Dedicated to Investment Management and Support Services. The Board and the Fund Oversight and Research Committees reviewed the general qualifications and capabilities of Fidelity's investment staff, including its size, education, experience, and resources, as well as Fidelity's approach to recruiting, training, managing, and compensating investment personnel. The Board noted that Fidelity has continued to increase the resources devoted to non-U.S. offices, including expansion of Fidelity's global investment organization. The Board also noted that Fidelity's analysts have extensive resources, tools and capabilities that allow them to conduct sophisticated quantitative and fundamental analysis, as well as credit analysis of issuers, counterparties and guarantors. Further, the Board believes that Fidelity's investment professionals have sufficient access to global information and data so as to provide competitive investment results over time, and that those professionals also have access to sophisticated tools that permit them to assess portfolio construction and risk and performance attribution characteristics continuously, as well as to transmit new information and research conclusions rapidly around the world. Additionally, in its deliberations, the Board considered Fidelity's trading and risk management capabilities and resources and global compliance infrastructure, which are an integral part of the investment management process.
Annual Report
Board Approval of Investment Advisory Contracts and
Management Fees - continued
Shareholder and Administrative Services. The Board considered (i) the nature, extent, quality, and cost of advisory, administrative, and shareholder services performed by the Investment Advisers and their affiliates under the Advisory Contracts and under separate agreements covering transfer agency, pricing and bookkeeping, and securities lending services for the fund; (ii) the nature and extent of the supervision of third party service providers, principally custodians and subcustodians; and (iii) the resources devoted to, and the record of compliance with, the fund's compliance policies and procedures. The Board also reviewed the allocation of fund brokerage, including allocations to brokers affiliated with the Investment Advisers, the use of brokerage commissions to pay fund expenses, and the use of "soft" commission dollars to pay for research services.
The Board noted that the growth of fund assets over time across the complex allows Fidelity to reinvest in the development of services designed to enhance the value or convenience of the Fidelity funds as investment vehicles. These services include 24-hour access to account information and market information through telephone representatives and over the Internet, investor education materials and asset allocation tools, and the expanded availability of Fidelity Investor Centers.
In 2014, the Board formed an ad hoc Committee on Transfer Agency Fees to review the variety of transfer agency fee structures throughout the industry and Fidelity's competitive positioning with respect to industry participants.
Investment in a Large Fund Family. The Board considered the benefits to shareholders of investing in a Fidelity fund, including the benefits of investing in a fund that is part of a large family of funds offering a variety of investment disciplines and providing a large variety of mutual fund investor services. The Board noted that Fidelity had taken, or had made recommendations that resulted in the Fidelity funds taking, a number of actions over the previous year that benefited particular funds, including (i) continuing to dedicate additional resources to investment research and to the support of the senior management team that oversees asset management; (ii) persisting in efforts to enhance Fidelity's global research capabilities; (iii) launching new funds and making other enhancements to meet client needs for income-oriented solutions; (iv) reducing fund expenses for certain index funds; (v) continuing to launch dedicated lower cost underlying funds to meet portfolio construction needs related to expanding underlying fund options for Fidelity funds of funds, specifically for the Freedom Fund product lines; (vi) rationalizing product lines and gaining increased efficiencies through fund mergers; (vii) launching sector-based exchange-traded funds and establishing a new Fidelity adviser to manage sector-based funds and products; (viii) continuing to develop and implement technology to improve security and increase efficiency; (ix) modifying the eligibility criteria for certain share classes to increase their marketability to a portion of the defined contribution plan market; (x) waiving redemption fees for certain qualified fund-of-fund and wrap programs and certain retirement plan transactions; and (xi) launching new Institutional Class shares of certain money market funds to attract and retain assets and to fill a gap in the money market fund lineup.
Annual Report
Investment Performance. The Board considered whether the fund has operated in accordance with its investment objective, as well as its record of compliance with its investment restrictions and its performance history.
The Board took into account discussions with the Investment Advisers about fund investment performance that occur at Board meetings throughout the year. In this regard the Board noted that as part of regularly scheduled fund reviews and other reports to the Board on fund performance, the Board periodically considers annualized return information for the fund, for different time periods, measured against a securities market index ("benchmark index") and a peer group of funds with similar objectives ("peer group"). In its evaluation of fund investment performance, the Board gave particular attention to information indicating changes in performance of certain Fidelity funds for specific time periods and the Investment Advisers' explanations for any overperformance or underperformance.
In addition to reviewing absolute and relative fund performance, the Independent Trustees periodically consider the appropriateness of fund performance metrics in evaluating the results achieved. In general, the Independent Trustees believe that fund performance should be evaluated based on net performance (after fees and expenses) of both the highest performing and lowest performing classes, where applicable, compared to appropriate benchmark indices, over appropriate time periods which may include full market cycles, and compared to peer groups, as applicable, over the same periods, taking into account relevant factors including the following: general market conditions; issuer-specific information; tactical opportunities for investment; and fund cash flows and other factors.
The Independent Trustees recognize that shareholders evaluate performance on a net basis over their own holding periods, for which one-, three-, and five-year periods are often used as a proxy. For this reason, the performance information reviewed by the Board also included net cumulative calendar year total return information for the fund and an appropriate benchmark index and peer group for the most recent one-, three-, and five-year periods, as shown below. Returns are shown compared to the 25th percentile (top of box, 75% beaten) and 75th percentile (bottom of box, 25% beaten) of the peer universe. Returns of the benchmark index are "net MA," i.e., adjusted for tax withholding rates applicable to U.S.-based funds organized as Massachusetts business trusts.
Annual Report
Board Approval of Investment Advisory Contracts and
Management Fees - continued
Fidelity International Discovery Fund

The Board also considered that the fund's management fee is subject to upward or downward adjustment depending upon whether, and to what extent, the fund's investment performance for the performance period exceeds, or is exceeded by, a securities index, thus leading to a performance adjustment for the same period. The Board noted that the performance adjustment provides FMR with a strong economic incentive to seek to achieve superior performance for the fund's shareholders and helps to more closely align the interests of FMR and the fund's shareholders.
Based on its review, the Board concluded that the nature, extent, and quality of services provided to the fund under the Advisory Contracts should benefit the fund's shareholders.
Competitiveness of Management Fee and Total Expense Ratio. The Board considered the fund's management fee and total expense ratio compared to "mapped groups" of competitive funds and classes. Fidelity creates "mapped groups" by combining similar Lipper investment objective categories that have comparable investment mandates. Combining Lipper investment objective categories aids the Board's management fee and total expense ratio comparisons by broadening the competitive group used for comparison and by reducing the number of universes to which various Fidelity funds are compared.
Management Fee. The Board considered two proprietary management fee comparisons for the 12-month periods shown in the chart below. The group of Lipper funds used by the Board for management fee comparisons is referred to below as the "Total Mapped Group." The Total Mapped Group comparison focuses on a fund's standing in terms of gross management fees before expense reimbursements or caps, and without giving effect to the fund's performance adjustment, relative to the total universe of funds with comparable investment mandates, regardless of whether their management fee structures also are comparable. Funds with comparable investment mandates offer exposure to similar types of securities. Funds with comparable management fee structures have similar management fee contractual arrangements (e.g., flat rate charged for advisory services, all-inclusive fee rate, etc.). "TMG %" represents the percentage of funds in the Total Mapped Group that had management fees that were lower than the fund's. For example, a hypothetical TMG % of 20% would mean that 80% of the funds in the Total Mapped Group had higher, and 20% had lower, management fees than the fund. The fund's actual TMG %s are in the chart below. The "Asset-Size Peer Group" (ASPG) comparison focuses on a fund's standing relative to a subset of non-Fidelity funds within the Total Mapped Group that are similar in size and management fee structure. For example, if a fund is in the first quartile of the ASPG, the fund's management fee ranks in the least expensive or lowest 25% of funds in the ASPG. The ASPG represents at least 15% of the funds in the Total Mapped Group with comparable asset size and management fee structures, subject to a minimum of 50 funds (or all funds in the Total Mapped Group if fewer than 50). Additional information, such as the ASPG quartile in which the fund's management fee rate ranked and the impact of the fund's performance adjustment, is also included in the chart and considered by the Board.
Annual Report
Fidelity International Discovery Fund

The Board noted that the fund's management fee rate ranked below the median of its Total Mapped Group and below the median of its ASPG for 2013. The Board also noted the effect of the fund's positive performance adjustment on the fund's management fee ranking.
Annual Report
Board Approval of Investment Advisory Contracts and
Management Fees - continued
Furthermore, the Board considered that, on July 16, 2014, after the periods shown in the chart above, it had approved a reduction (effective August 1, 2014) in the individual fund fee rate component of the management fee rate for the fund from 0.450% to 0.424%.
The Board also noted that, in August 2013, the ad hoc Committee on Management Fees was formed to conduct an in-depth review of the management fee rates of Fidelity's active equity mutual funds. The Committee focused on the following areas: (i) standard fee structures; (ii) research consumption and trading evolution; (iii) management fee competitiveness/profitability by category; and (iv) factors that drive institutional pricing.
Based on its review, the Board concluded that the fund's management fee is fair and reasonable in light of the services that the fund receives and the other factors considered.
Total Expense Ratio. In its review of each class's total expense ratio, the Board considered the fund's management fee as well as other fund or class expenses, as applicable, such as transfer agent fees, pricing and bookkeeping fees, fund-paid 12b-1 fees, and custodial, legal, and audit fees. The Board also noted the effects of any waivers and reimbursements on fees and expenses, as well as the impact of the fund's performance adjustment. As part of its review, the Board also considered the current and historical total expense ratios of each class of the fund compared to competitive fund median expenses. Each class of the fund is compared to those funds and classes in the Total Mapped Group (used by the Board for management fee comparisons) that have a similar sales load structure.
The Board noted that the total expense ratio of each of Class A, Class B, Class C, Institutional Class, Class Z, the retail class, and Class K ranked below its competitive median for 2013 and the total expense ratio of Class T ranked above its competitive median for 2013. The Board considered that, in general, various factors can affect total expense ratios. The Board noted that the total expense ratio of Class T was above the competitive median primarily because of higher 12b-1 fees on Class T as compared to most competitor funds. Class T has a higher 12b-1 fee, but a lower front-end sales charge, than traditionally priced front-end sales charge classes. The Board considered that Class T is primarily sold load-waived in the retirement plan market where its 0.50% 12b-1 fee is comparable to competing no-load, higher 12b-1 fee classes designed specifically for retirement plans. The Board noted that the fund offers multiple classes, each of which has a different sales load and 12b-1 fee structure, and that the multiple structures are intended to offer a range of pricing options for the intermediary market. The Board also noted that the total expense ratios of the classes vary primarily by the level of their 12b-1 fees, although differences in transfer agent fees may also cause expenses to vary from class to class.
Annual Report
Fees Charged to Other Fidelity Clients. The Board also considered Fidelity fee structures and other information with respect to clients of Fidelity, such as other funds advised or subadvised by Fidelity, pension plan clients, and other institutional clients. The Board noted the findings of the 2013 ad hoc joint committee (created with the board of other Fidelity funds), which reviewed and compared Fidelity's institutional investment advisory business with its business of providing services to the Fidelity funds, including the differences in services provided, fees charged, and costs incurred, as well as competition in their respective marketplaces.
Based on its review of total expense ratios and fees charged to other Fidelity clients, the Board concluded that the total expense ratio of each class of the fund was reasonable, although Class T was above the median of the universe presented for comparison, in light of the services that the fund and its shareholders receive and the other factors considered.
Costs of the Services and Profitability. The Board considered the revenues earned and the expenses incurred by Fidelity in conducting the business of developing, marketing, distributing, managing, administering and servicing the fund and servicing the fund's shareholders. The Board also considered the level of Fidelity's profits in respect of all the Fidelity funds.
On an annual basis, Fidelity presents to the Board Fidelity's profitability for the fund. Fidelity calculates the profitability for each fund, as well as aggregate profitability for groups of Fidelity funds and all Fidelity funds, using a series of detailed revenue and cost allocation methodologies which originate with the books and records of Fidelity on which Fidelity's audited financial statements are based. The Audit Committee of the Board reviews any significant changes from the prior year's methodologies.
PricewaterhouseCoopers LLP (PwC), independent registered public accounting firm and auditor to Fidelity and certain Fidelity funds, has been engaged annually by the Board as part of the Board's assessment of Fidelity's profitability analysis. PwC's engagement includes the review and assessment of the methodologies used by Fidelity in determining the revenues and expenses attributable to Fidelity's mutual fund business, and completion of agreed-upon procedures in respect of the mathematical accuracy of fund profitability and its conformity to established allocation methodologies. After considering PwC's reports issued under the engagement and information provided by Fidelity, the Board concluded that while other allocation methods may also be reasonable, Fidelity's profitability methodologies are reasonable in all material respects.
The Board also reviewed Fidelity's non-fund businesses and fall-out benefits related to the mutual fund business as well as cases where Fidelity's affiliates may benefit from or be related to the fund's business.
Annual Report
Board Approval of Investment Advisory Contracts and
Management Fees - continued
The Board considered the costs of the services provided by and the profits realized by Fidelity in connection with the operation of the fund and was satisfied that the profitability was not excessive in the circumstances.
Economies of Scale. The Board considered whether there have been economies of scale in respect of the management of the Fidelity funds, whether the Fidelity funds (including the fund) have appropriately benefited from any such economies of scale, and whether there is potential for realization of any further economies of scale. The Board considered the extent to which the fund will benefit from economies of scale through increased services to the fund, through waivers or reimbursements, or through fee or expense ratio reductions. The Board also noted that in 2013, it and the boards of other Fidelity funds created an ad hoc committee (the Economies of Scale Committee) to analyze whether Fidelity attains economies of scale in respect of the management and servicing of the Fidelity funds, whether the Fidelity funds have appropriately benefited from such economies of scale, and whether there is potential for realization of any further economies of scale.
The Board recognized that the fund's management contract incorporates a "group fee" structure, which provides for lower group fee rates as total group assets increase, and for higher group fee rates as total group assets decrease (with "group assets" defined to include fund assets under FMR's management plus sector fund assets previously under FMR's management and currently managed by Fidelity SelectCo, LLC). FMR calculates the group fee rates based on a tiered asset "breakpoint" schedule that varies based on asset class. The Board considered that the group fee is designed to deliver the benefits of economies of scale to fund shareholders when total Fidelity fund assets increase, even if assets of any particular fund are unchanged or have declined, because some portion of Fidelity's costs are attributable to services provided to all Fidelity funds, and all funds benefit if those costs can be allocated among more assets. The Board concluded that, given the group fee structure, fund shareholders will benefit from lower management fees as group assets increase at the fund complex level, regardless of whether Fidelity achieves any such economies of scale.
The Board concluded, taking into account the analysis of the Economies of Scale Committee, that economies of scale, if any, are being appropriately shared between fund shareholders and Fidelity.
Additional Information Requested by the Board. In order to develop fully the factual basis for consideration of the Fidelity funds' Advisory Contracts, the Board requested and received additional information on certain topics, including: (i) fund performance trends and Fidelity's long-term strategies for certain funds; (ii) Fidelity's strategic marketing and product lineup goals; (iii) the methodology with respect to competitive fund data and peer group classifications; (iv) the arrangements with, and performance of, certain sub-advisers on behalf of the Fidelity funds, as well as certain proposed participating affiliate arrangements; (v) the realization of fall-out benefits in certain Fidelity business units; (vi) Fidelity's group fee structures, including the rationale for the individual fee rates of certain categories of funds and the definition of group assets; (vii) trends regarding industry use of performance fee structures and the performance adjustment methodologies applicable to the Fidelity funds; (viii) additional competitive analysis regarding the total expenses for certain classes; (ix) fund profitability methodology, including Fidelity's cost allocation methodology, and the impact of certain factors on fund profitability results; and (x) the process by which Fidelity determines sub-advisory fees for funds it advises.
Annual Report
Based on its evaluation of all of the conclusions noted above, and after considering all factors it believed relevant, the Board ultimately concluded that the advisory fee structures are fair and reasonable, and that the fund's Advisory Contracts should be renewed.
Annual Report
Investment Adviser
Fidelity Management & Research Company
Boston, MA
Investment Sub-Advisers
FMR Co., Inc.
Fidelity Management & Research
(U.K.) Inc.
FIL Investment Advisors
FIL Investments (Japan) Limited
FIL Investment Advisors (U.K.) Limited
Fidelity Management & Research
(Hong Kong) Limited
Fidelity Management & Research
(Japan) Limited
General Distributor
Fidelity Distributors Corporation
Smithfield, RI
Transfer and Service Agents
Fidelity Investments Institutional Operations Company, Inc.
Boston, MA
Fidelity Service Company, Inc.
Boston, MA
Custodian
The Northern Trust Company
Chicago, IL
(Fidelity Investment logo)(registered trademark)
AIDI-UANN-1214
1.806657.109
(Fidelity Investment logo)(registered trademark)
Fidelity Advisor®
International Discovery
Fund - Class Z
Annual Report
October 31, 2014
(Fidelity Cover Art)
Class Z is
a class of Fidelity®
International Discovery Fund
Contents
Performance | (Click Here) | How the fund has done over time. |
Management's Discussion of Fund Performance | (Click Here) | The Portfolio Manager's review of fund performance and strategy. |
Shareholder Expense Example | (Click Here) | An example of shareholder expenses. |
Investment Changes | (Click Here) | A summary of major shifts in the fund's investments over the past six months. |
Investments | (Click Here) | A complete list of the fund's investments with their market values. |
Financial Statements | (Click Here) | Statements of assets and liabilities, operations, and changes in net assets, as well as financial highlights. |
Notes | (Click Here) | Notes to financial statements. |
Report of Independent Registered Public Accounting Firm | (Click Here) | |
Trustees and Officers | (Click Here) | |
Distributions | (Click Here) | |
Board Approval of Investment Advisory Contracts and Management Fees | (Click Here) | |
To view a fund's proxy voting guidelines and proxy voting record for the 12-month period ended June 30, visit http://www.fidelity.com/proxyvotingresults or visit the Securities and Exchange Commission's (SEC) web site at http://www.sec.gov. You may also call 1-877-208-0098 to request a free copy of the proxy voting guidelines.
Standard & Poor's, S&P and S&P 500 are registered service marks of The McGraw-Hill Companies, Inc. and have been licensed for use by Fidelity Distributors Corporation.
Other third-party marks appearing herein are the property of their respective owners.
All other marks appearing herein are registered or unregistered trademarks or service marks of FMR LLC or an affiliated company. © 2014 FMR LLC. All rights reserved.
Annual Report
This report and the financial statements contained herein are submitted for the general information of the shareholders of the fund. This report is not authorized for distribution to prospective investors in the fund unless preceded or accompanied by an effective prospectus.
A fund files its complete schedule of portfolio holdings with the SEC for the first and third quarters of each fiscal year on Form N-Q. Forms N-Q are available on the SEC's web site at http://www.sec.gov. A fund's Forms N-Q may be reviewed and copied at the SEC's Public Reference Room in Washington, DC. Information regarding the operation of the SEC's Public Reference Room may be obtained by calling 1-800-SEC-0330. For a complete list of a fund's portfolio holdings, view the fund's most recent holdings listing, semiannual report, or annual report on Fidelity's web site at http://www.fidelity.com, http://www.advisor.fidelity.com, or http://www.401k.com, as applicable.
NOT FDIC INSURED • MAY LOSE VALUE • NO BANK GUARANTEE
Neither the fund nor Fidelity Distributors Corporation is a bank.
Annual Report
Average annual total return reflects the change in the value of an investment, assuming reinvestment of the class' distributions from dividend income and capital gains (the profits earned upon the sale of securities that have grown in value, if any) and assuming a constant rate of performance each year. The $10,000 table and the fund's returns do not reflect the deduction of taxes that a shareholder would pay on fund distributions or the redemption of fund shares. During periods of reimbursement by Fidelity, a fund's total return will be greater than it would be had the reimbursement not occurred. How a fund did yesterday is no guarantee of how it will do tomorrow.
Average Annual Total Returns
Periods ended October 31, 2014 | Past 1
year | Past 5
years | Past 10
years |
Class Z A, B | 0.12% | 8.14% | 7.10% |
A The initial offering of Class Z shares took place on August 13, 2013. Returns between January 6, 2005 and August 13, 2013, are those of Institutional Class. Returns prior to January 6, 2005, are those of Fidelity® International Discovery Fund, the original class of the fund.
B Prior to October 1, 2004, the fund operated under certain different investment policies. The fund's historical performance may not represent its current investment policies.
$10,000 Over 10 Years
Let's say hypothetically that $10,000 was invested in Fidelity Advisor® International Discovery Fund - Class Z on October 31, 2004. The chart shows how the value of your investment would have changed, and also shows how the MSCI EAFE Index performed over the same period. See footnote A above for additional information regarding the performance of Class Z.
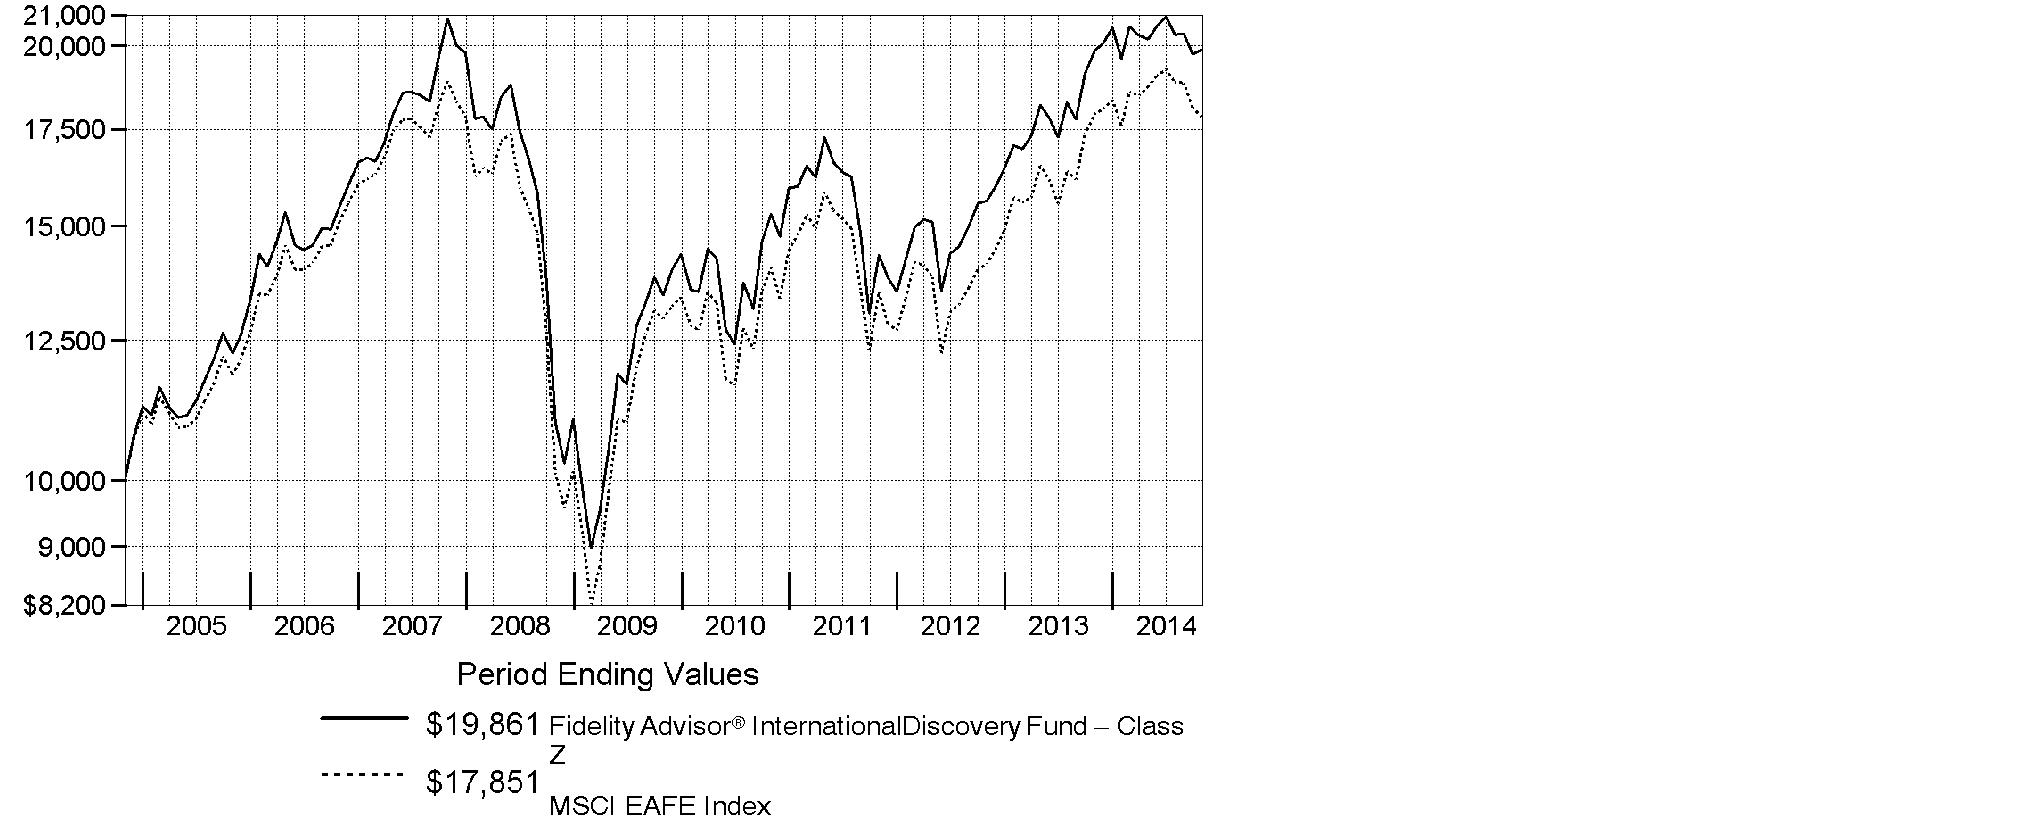
Annual Report
Market Recap: Global equities posted a healthy gain for the 12 months ending October 31, 2014, overcoming an October market decline driven by recessionary pressures in China and tepid growth in Europe. The MSCI ACWI (All Country World Index) Index rose 8.15%, helped by subdued market volatility for much of the period and supported by solid corporate earnings, especially in the United States. Stocks also benefited from easy monetary policies in Japan and the eurozone, as well as increased stimulus efforts in China. All but three of the 24 industry groups that compose the index marked a positive return. The U.S. (+17%) remained a pillar of strength, while a strongly rising dollar in the latter part of the period detracted from investors' returns in most non-U.S. markets. Canada (+5%) notched broad gains outside of its energy and materials sectors, as did Asia-Pacific ex Japan (+4%), led by investor enthusiasm for companies in India. The U.K., Europe and Japan, meanwhile, all underperformed. Among sectors, health care (+24%) led the index, with a strong contribution from the pharmaceuticals, biotechnology & life sciences industry. Information technology (+21%) also outperformed. Conversely, materials (-4%) and energy (-1%) lagged the index due to a higher supply of and lower demand for commodities.
Comments from William Kennedy, Portfolio Manager of Fidelity Advisor® International Discovery Fund: For the year, the fund's Z Class shares returned 0.12%, versus -0.48% for its benchmark, the MSCI EAFE Index. Security selection helped relative performance, particularly in health care, information technology and financials. The fund also benefited from out-of-index investments in the U.S. and emerging markets. Top individual contributors included U.K.-listed Hikma Pharmaceuticals, a Jordan-based company that specializes in injectable drugs. Its stock received a boost from U.S. market-share gains. Shares of pharmaceuticals company Actavis benefited from successful recent acquisitions and the tax advantage of its Ireland domicile. By contrast, security selection in industrials and consumer discretionary and in Europe ex U.K. detracted versus the index. In terms of individual disappointments, not owning Switzerland-based pharmaceuticals giant and index component Novartis hurt relative performance, as the company's strong patent portfolio and product pipeline drove sales growth and the stock. An overweighting in ORIX, a high-quality diversified financials conglomerate in Japan, also detracted from results, as the weak local economy pressured near-term earnings growth.
The views expressed above reflect those of the portfolio manager(s) only through the end of the period as stated on the cover of this report and do not necessarily represent the views of Fidelity or any other person in the Fidelity organization. Any such views are subject to change at any time based upon market or other conditions and Fidelity disclaims any responsibility to update such views. These views may not be relied on as investment advice and, because investment decisions for a Fidelity fund are based on numerous factors, may not be relied on as an indication of trading intent on behalf of any Fidelity fund.
Annual Report
Shareholder Expense Example
As a shareholder of the Fund, you incur two types of costs: (1) transaction costs, including sales charges (loads) on purchase payments or redemption proceeds, redemption fees and (2) ongoing costs, including management fees, distribution and/or service (12b-1) fees and other Fund expenses. This Example is intended to help you understand your ongoing costs (in dollars) of investing in the Fund and to compare these costs with the ongoing costs of investing in other mutual funds.
The Example is based on an investment of $1,000 invested at the beginning of the period and held for the entire period (May 1, 2014 to October 31, 2014).
Actual Expenses
The first line of the accompanying table for each class of the Fund provides information about actual account values and actual expenses. You may use the information in this line, together with the amount you invested, to estimate the expenses that you paid over the period. Simply divide your account value by $1,000.00 (for example, an $8,600 account value divided by $1,000.00 = 8.6), then multiply the result by the number in the first line for a class of the Fund under the heading entitled "Expenses Paid During Period" to estimate the expenses you paid on your account during this period. A small balance maintenance fee of $12.00 that is charged once a year may apply for certain accounts with a value of less than $2,000. This fee is not included in the table below. If it was, the estimate of expenses you paid during the period would be higher, and your ending account value lower, by this amount. In addition, the Fund, as a shareholder in the underlying Fidelity Central Funds, will indirectly bear its pro-rata share of the fees and expenses incurred by the underlying Fidelity Central Funds. These fees and expenses are not included in the Fund's annualized expense ratio used to calculate the expense estimate in the table below.
Hypothetical Example for Comparison Purposes
The second line of the accompanying table for each class of the Fund provides information about hypothetical account values and hypothetical expenses based on a Class' actual expense ratio and an assumed rate of return of 5% per year before expenses, which is not the Class' actual return. The hypothetical account values and expenses may not be used to estimate the actual ending account balance or expenses you paid for the period. You may use this information to compare the ongoing costs of investing in the Fund and other funds. To do so, compare this 5% hypothetical example with the 5% hypothetical examples that appear in the shareholder reports of the other funds. A small balance maintenance fee of $12.00 that is charged once a year may apply for certain accounts with a value of less than $2,000. This fee is not included in the table below. If it was, the estimate of expenses you paid during the period would be higher, and your ending account value lower, by this amount. In addition, the Fund, as a shareholder in the underlying Fidelity Central Funds, will indirectly bear its pro-rata share of the fees and expenses incurred by the underlying Fidelity Central Funds. These fees and expenses are not included in the Fund's annualized expense ratio used to calculate the expense estimate in the table below.
Please note that the expenses shown in the table are meant to highlight your ongoing costs only and do not reflect any transaction costs. Therefore, the second line of the table is useful in comparing ongoing costs only, and will not help you determine the relative total costs of owning different funds. In addition, if these transactional costs were included, your costs would have been higher.
Annual Report
| Annualized
Expense RatioB | Beginning
Account Value
May 1, 2014 | Ending
Account Value
October 31, 2014 | Expenses Paid
During Period*
May 1, 2014
to October 31, 2014 |
Class A | 1.27% | | | |
Actual | | $ 1,000.00 | $ 981.00 | $ 6.34 |
HypotheticalA | | $ 1,000.00 | $ 1,018.80 | $ 6.46 |
Class T | 1.50% | | | |
Actual | | $ 1,000.00 | $ 979.90 | $ 7.49 |
HypotheticalA | | $ 1,000.00 | $ 1,017.64 | $ 7.63 |
Class B | 2.04% | | | |
Actual | | $ 1,000.00 | $ 977.10 | $ 10.17 |
HypotheticalA | | $ 1,000.00 | $ 1,014.92 | $ 10.36 |
Class C | 2.02% | | | |
Actual | | $ 1,000.00 | $ 977.30 | $ 10.07 |
HypotheticalA | | $ 1,000.00 | $ 1,015.02 | $ 10.26 |
International Discovery | .92% | | | |
Actual | | $ 1,000.00 | $ 982.60 | $ 4.60 |
HypotheticalA | | $ 1,000.00 | $ 1,020.57 | $ 4.69 |
Class K | .79% | | | |
Actual | | $ 1,000.00 | $ 983.10 | $ 3.95 |
HypotheticalA | | $ 1,000.00 | $ 1,021.22 | $ 4.02 |
Institutional Class | .93% | | | |
Actual | | $ 1,000.00 | $ 982.60 | $ 4.65 |
HypotheticalA | | $ 1,000.00 | $ 1,020.52 | $ 4.74 |
Class Z | .81% | | | |
Actual | | $ 1,000.00 | $ 983.30 | $ 4.05 |
HypotheticalA | | $ 1,000.00 | $ 1,021.12 | $ 4.13 |
A 5% return per year before expenses
B Annualized expense ratio reflects expenses net of applicable fee waivers.
* Expenses are equal to each Class' annualized expense ratio, multiplied by the average account value over the period, multiplied by 184/365 (to reflect the one-half year period).
Annual Report
Investment Changes (Unaudited)
Geographic Diversification (% of fund's net assets) |
As of October 31, 2014 |
 | Japan 17.1% | |
 | United Kingdom 14.9% | |
 | United States of America* 9.2% | |
 | Germany 6.7% | |
 | Switzerland 6.0% | |
 | France 5.1% | |
 | Australia 4.3% | |
 | Sweden 4.1% | |
 | India 3.2% | |
 | Other 29.4% | |

* Includes Short-Term Investments and Net Other Assets (Liabilities) |
Percentages are based on country or territory of incorporation and are adjusted for the effect of futures contracts, if applicable. |
As of April 30, 2014 |
| Japan 16.3% | |
| United Kingdom 14.4% | |
| Germany 10.3% | |
| United States of America* 9.5% | |
| France 8.9% | |
| Switzerland 5.5% | |
| Sweden 5.2% | |
| Spain 3.0% | |
| Netherlands 2.7% | |
| Other 24.2% | |

* Includes Short-Term Investments and Net Other Assets (Liabilities) |
Percentages are based on country or territory of incorporation and are adjusted for the effect of futures contracts, if applicable. |
Asset Allocation as of October 31, 2014 |
| % of fund's
net assets | % of fund's net assets
6 months ago |
Stocks and Equity Futures | 97.5 | 96.0 |
Other Investments | 0.1 | 0.1 |
Short-Term Investments and Net Other Assets (Liabilities) | 2.4 | 3.9 |
Top Ten Stocks as of October 31, 2014 |
| % of fund's
net assets | % of fund's net assets
6 months ago |
Roche Holding AG (participation certificate) (Switzerland, Pharmaceuticals) | 2.5 | 2.3 |
Total SA (France, Oil, Gas & Consumable Fuels) | 1.9 | 2.0 |
Australia & New Zealand Banking Group Ltd. (Australia, Banks) | 1.7 | 1.8 |
Bayer AG (Germany, Pharmaceuticals) | 1.6 | 1.8 |
Astellas Pharma, Inc. (Japan, Pharmaceuticals) | 1.4 | 0.9 |
Keyence Corp. (Japan, Electronic Equipment & Components) | 1.3 | 1.0 |
Actavis PLC (Ireland, Pharmaceuticals) | 1.3 | 0.5 |
Housing Development Finance Corp. Ltd. (India, Thrifts & Mortgage Finance) | 1.2 | 0.8 |
Japan Tobacco, Inc. (Japan, Tobacco) | 1.2 | 1.1 |
Anheuser-Busch InBev SA NV (Belgium, Beverages) | 1.2 | 1.1 |
| 15.3 | |
Market Sectors as of October 31, 2014 |
| % of fund's
net assets | % of fund's net assets
6 months ago |
Financials | 20.7 | 21.1 |
Health Care | 14.9 | 12.4 |
Consumer Discretionary | 12.9 | 14.8 |
Information Technology | 10.7 | 8.3 |
Consumer Staples | 10.7 | 8.4 |
Industrials | 10.4 | 14.6 |
Energy | 5.6 | 3.5 |
Materials | 4.7 | 5.4 |
Telecommunication Services | 3.9 | 5.1 |
Utilities | 0.2 | 0.2 |
Annual Report
Investments October 31, 2014
Showing Percentage of Net Assets
Common Stocks - 93.6% |
| Shares | | Value (000s) |
Australia - 4.3% |
Ansell Ltd. | 2,499,254 | | $ 43,839 |
Asaleo Care Ltd. (a) | 23,409,115 | | 41,813 |
Australia & New Zealand Banking Group Ltd. | 6,493,040 | | 192,133 |
G8 Education Ltd. | 5,831,484 | | 25,767 |
Greencross Ltd. | 1,186,547 | | 8,960 |
Ramsay Health Care Ltd. | 1,215,729 | | 56,201 |
Regis Healthcare Ltd. (a) | 4,596,817 | | 17,433 |
Spotless Group Holdings Ltd. | 18,983,369 | | 32,120 |
Woodside Petroleum Ltd. | 1,705,042 | | 60,564 |
TOTAL AUSTRALIA | | 478,830 |
Austria - 0.2% |
Andritz AG | 455,300 | | 21,978 |
Bailiwick of Jersey - 1.9% |
Glencore Xstrata PLC | 9,661,966 | | 49,445 |
MySale Group PLC (f) | 8,571,600 | | 26,053 |
Shire PLC | 1,110,100 | | 74,484 |
Wolseley PLC | 1,030,400 | | 54,675 |
TOTAL BAILIWICK OF JERSEY | | 204,657 |
Belgium - 1.9% |
Anheuser-Busch InBev SA NV | 1,183,927 | | 131,291 |
Arseus NV | 252,964 | | 10,112 |
KBC Groupe SA (a) | 1,328,201 | | 71,155 |
TOTAL BELGIUM | | 212,558 |
Bermuda - 1.1% |
BW Offshore Ltd. | 8,689,300 | | 10,654 |
Noble Group Ltd. | 22,526,000 | | 20,969 |
PAX Global Technology Ltd. (a)(f) | 66,294,000 | | 71,203 |
Travelport Worldwide Ltd. (e) | 1,324,600 | | 19,140 |
TOTAL BERMUDA | | 121,966 |
Canada - 3.1% |
Alimentation Couche-Tard, Inc. Class B (sub. vtg.) | 1,346,700 | | 45,705 |
Constellation Software, Inc. | 266,500 | | 75,075 |
First Quantum Minerals Ltd. (e) | 1,164,300 | | 17,562 |
Imperial Oil Ltd. | 1,205,500 | | 58,005 |
Potash Corp. of Saskatchewan, Inc. | 813,500 | | 27,767 |
PrairieSky Royalty Ltd. (e) | 1,530,400 | | 47,118 |
Common Stocks - continued |
| Shares | | Value (000s) |
Canada - continued |
Suncor Energy, Inc. | 1,036,600 | | $ 36,808 |
TransForce, Inc. (e) | 1,412,400 | | 34,538 |
TOTAL CANADA | | 342,578 |
Cayman Islands - 2.1% |
Alibaba Group Holding Ltd. sponsored ADR | 927,200 | | 91,422 |
Baidu.com, Inc. sponsored ADR (a) | 175,200 | | 41,833 |
ENN Energy Holdings Ltd. | 3,266,000 | | 21,191 |
Greatview Aseptic Pack Co. Ltd. | 26,392,000 | | 17,374 |
Sands China Ltd. | 3,748,400 | | 23,379 |
WuXi PharmaTech Cayman, Inc. sponsored ADR (a) | 841,400 | | 31,721 |
TOTAL CAYMAN ISLANDS | | 226,920 |
China - 0.0% |
Yantai Changyu Pioneer Wine Co. Ltd. (B Shares) | 485,600 | | 1,526 |
Colombia - 0.2% |
Grupo Aval Acciones y Valores SA ADR | 1,645,837 | | 22,186 |
Cyprus - 0.0% |
SPDI Secure Property Development & Investment PLC (a) | 529,830 | | 479 |
Denmark - 2.0% |
ISS Holdings A/S (a) | 384,000 | | 10,706 |
Novo Nordisk A/S Series B | 2,298,245 | | 103,887 |
Pandora A/S | 514,000 | | 43,270 |
Vestas Wind Systems A/S (a) | 1,874,500 | | 62,741 |
TOTAL DENMARK | | 220,604 |
Finland - 0.8% |
Sampo Oyj (A Shares) | 1,739,800 | | 83,219 |
France - 5.1% |
Atos Origin SA | 531,441 | | 36,689 |
AXA SA | 1,839,400 | | 42,436 |
BNP Paribas SA | 1,039,745 | | 65,330 |
Bureau Veritas SA | 737,700 | | 18,239 |
Havas SA | 5,933,668 | | 47,961 |
Numericable Group SA (e) | 483,713 | | 17,882 |
Numericable Group SA rights 11/12/14 (a)(e) | 483,713 | | 14,342 |
Rexel SA | 1,107,782 | | 18,609 |
Schneider Electric SA | 798,800 | | 62,944 |
SR Teleperformance SA | 297,200 | | 18,719 |
Total SA | 3,562,400 | | 212,687 |
TOTAL FRANCE | | 555,838 |
Common Stocks - continued |
| Shares | | Value (000s) |
Germany - 5.7% |
Aareal Bank AG | 1,044,895 | | $ 44,743 |
Bayer AG | 1,224,000 | | 174,016 |
Continental AG | 306,500 | | 60,168 |
Drillisch AG | 2,022,600 | | 70,184 |
GEA Group AG | 1,508,060 | | 69,347 |
KION Group AG | 1,429,749 | | 51,995 |
LEG Immobilien AG | 610,854 | | 42,140 |
Siemens AG | 727,119 | | 82,014 |
Symrise AG | 500,800 | | 28,163 |
TOTAL GERMANY | | 622,770 |
Hong Kong - 2.2% |
AIA Group Ltd. | 22,053,600 | | 123,068 |
Techtronic Industries Co. Ltd. | 39,683,000 | | 124,232 |
TOTAL HONG KONG | | 247,300 |
India - 3.2% |
Bharti Infratel Ltd. | 11,032,464 | | 52,872 |
Container Corp. of India Ltd. | 470,441 | | 10,379 |
Housing Development Finance Corp. Ltd. | 7,555,494 | | 136,069 |
Info Edge India Ltd. | 1,609,886 | | 22,122 |
Lupin Ltd. | 2,986,357 | | 69,144 |
The Jammu & Kashmir Bank Ltd. | 7,127,060 | | 16,146 |
Titan Co. Ltd. (a) | 2,240,879 | | 14,720 |
Yes Bank Ltd. | 3,138,775 | | 35,543 |
TOTAL INDIA | | 356,995 |
Indonesia - 0.8% |
PT Bank Central Asia Tbk | 41,701,500 | | 45,018 |
PT Bank Rakyat Indonesia Tbk | 44,669,800 | | 40,935 |
TOTAL INDONESIA | | 85,953 |
Ireland - 2.8% |
Actavis PLC (a) | 586,200 | | 142,294 |
Bank of Ireland (a) | 63,590,200 | | 25,142 |
Glanbia PLC | 2,424,800 | | 34,215 |
James Hardie Industries PLC CDI | 3,230,390 | | 34,457 |
Kerry Group PLC Class A | 1,035,200 | | 70,299 |
TOTAL IRELAND | | 306,407 |
Italy - 1.0% |
De Longhi SpA | 2,375,100 | | 46,372 |
Common Stocks - continued |
| Shares | | Value (000s) |
Italy - continued |
Telecom Italia SpA (a)(e) | 42,790,100 | | $ 48,493 |
World Duty Free SpA (a) | 2,253,904 | | 19,079 |
TOTAL ITALY | | 113,944 |
Japan - 17.1% |
ABC-MART, Inc. | 398,400 | | 22,972 |
ACOM Co. Ltd. (a) | 7,381,200 | | 24,603 |
Aozora Bank Ltd. | 11,251,000 | | 39,546 |
Astellas Pharma, Inc. | 10,267,800 | | 159,361 |
Coca-Cola Central Japan Co. Ltd. | 1,597,500 | | 28,744 |
Dentsu, Inc. | 899,500 | | 33,443 |
Don Quijote Holdings Co. Ltd. | 898,200 | | 53,816 |
Hitachi Ltd. | 6,659,000 | | 52,323 |
Hoya Corp. | 2,822,900 | | 99,894 |
Japan Exchange Group, Inc. | 2,358,200 | | 58,498 |
Japan Tobacco, Inc. | 3,948,700 | | 134,726 |
KDDI Corp. | 1,626,800 | | 106,831 |
Keyence Corp. | 304,060 | | 147,342 |
NEC Corp. | 26,163,000 | | 92,522 |
Nippon Kanzai Co. Ltd. | 8,000 | | 209 |
Olympus Corp. (a) | 1,501,000 | | 53,894 |
OMRON Corp. | 2,083,000 | | 98,598 |
ORIX Corp. | 5,463,900 | | 75,840 |
Park24 Co. Ltd. | 1,342,800 | | 20,319 |
Rakuten, Inc. | 5,927,100 | | 66,837 |
Santen Pharmaceutical Co. Ltd. | 583,800 | | 34,845 |
Seven & i Holdings Co., Ltd. | 2,748,600 | | 107,350 |
Seven Bank Ltd. | 17,781,300 | | 74,262 |
Ship Healthcare Holdings, Inc. | 1,076,700 | | 25,201 |
SoftBank Corp. | 1,575,100 | | 114,666 |
Sundrug Co. Ltd. | 825,500 | | 39,878 |
Toshiba Plant Systems & Services Corp. | 1,771,500 | | 29,652 |
Tsuruha Holdings, Inc. | 1,212,600 | | 71,593 |
VT Holdings Co. Ltd. | 3,967,000 | | 15,667 |
TOTAL JAPAN | | 1,883,432 |
Korea (South) - 0.7% |
Naturalendo Tech Co. Ltd. | 167,866 | | 8,765 |
NAVER Corp. | 65,859 | | 46,217 |
Samsung SDI Co. Ltd. | 200,556 | | 23,519 |
TOTAL KOREA (SOUTH) | | 78,501 |
Common Stocks - continued |
| Shares | | Value (000s) |
Luxembourg - 0.6% |
Altice SA | 759,700 | | $ 47,306 |
Grand City Properties SA (a) | 1,543,962 | | 19,783 |
TOTAL LUXEMBOURG | | 67,089 |
Marshall Islands - 0.1% |
Hoegh LNG Partners LP | 591,451 | | 12,426 |
Netherlands - 2.5% |
AEGON NV | 5,028,800 | | 40,987 |
AerCap Holdings NV (a) | 1,672,000 | | 72,464 |
IMCD Group BV | 1,902,200 | | 52,442 |
ING Groep NV (Certificaten Van Aandelen) (a) | 3,830,600 | | 54,856 |
LyondellBasell Industries NV Class A | 8,700 | | 797 |
Royal DSM NV | 787,237 | | 49,292 |
TOTAL NETHERLANDS | | 270,838 |
New Zealand - 0.7% |
EBOS Group Ltd. | 4,569,842 | | 34,090 |
Ryman Healthcare Group Ltd. | 7,311,565 | | 43,258 |
TOTAL NEW ZEALAND | | 77,348 |
Philippines - 0.7% |
Alliance Global Group, Inc. | 77,786,166 | | 43,752 |
SM Investments Corp. | 1,681,790 | | 29,306 |
TOTAL PHILIPPINES | | 73,058 |
Portugal - 0.2% |
CTT Correios de Portugal SA | 2,226,700 | | 20,621 |
Singapore - 0.2% |
Ezion Holdings Ltd. | 15,127,200 | | 17,814 |
South Africa - 0.4% |
Naspers Ltd. Class N | 369,200 | | 45,947 |
Spain - 2.6% |
Amadeus IT Holding SA Class A | 2,349,200 | | 86,256 |
Atresmedia Corporacion de Medios de Comunicacion SA | 1,515,400 | | 22,200 |
Banco Bilbao Vizcaya Argentaria SA | 4,806,144 | | 53,756 |
Criteria CaixaCorp SA | 10,039,365 | | 54,739 |
Inditex SA | 2,408,395 | | 67,650 |
TOTAL SPAIN | | 284,601 |
Sweden - 4.1% |
ASSA ABLOY AB (B Shares) | 2,357,200 | | 124,849 |
H&M Hennes & Mauritz AB (B Shares) | 1,057,821 | | 42,074 |
Common Stocks - continued |
| Shares | | Value (000s) |
Sweden - continued |
HEXPOL AB (B Shares) | 341,200 | | $ 30,173 |
Intrum Justitia AB | 1,211,317 | | 35,991 |
Nordea Bank AB | 9,576,600 | | 122,818 |
Svenska Cellulosa AB (SCA) (B Shares) | 1,118,800 | | 25,015 |
Svenska Handelsbanken AB (A Shares) | 1,425,600 | | 67,977 |
TOTAL SWEDEN | | 448,897 |
Switzerland - 6.0% |
Clariant AG (Reg.) | 2,358,150 | | 41,053 |
Compagnie Financiere Richemont SA Series A | 530,511 | | 44,634 |
Lonza Group AG | 521,951 | | 57,449 |
Partners Group Holding AG | 230,056 | | 61,151 |
Roche Holding AG (participation certificate) | 926,232 | | 273,335 |
Schindler Holding AG (participation certificate) | 194,920 | | 27,228 |
Sonova Holding AG Class B | 339,424 | | 52,846 |
UBS AG | 6,126,361 | | 106,526 |
TOTAL SWITZERLAND | | 664,222 |
Taiwan - 0.3% |
ECLAT Textile Co. Ltd. | 94,607 | | 901 |
Merida Industry Co. Ltd. | 4,995,900 | | 34,456 |
TOTAL TAIWAN | | 35,357 |
Turkey - 0.1% |
Logo Yazilim Sanayi Ve Ticar (a) | 1,125,049 | | 13,211 |
United Arab Emirates - 0.1% |
Emaar Malls Group PJSC (a) | 7,174,619 | | 6,270 |
United Kingdom - 14.9% |
Aberdeen Asset Management PLC | 5,975,132 | | 41,484 |
Advanced Computer Software Group PLC | 5,750,200 | | 9,934 |
Al Noor Hospitals Group PLC | 2,487,400 | | 40,547 |
Anglo American PLC (United Kingdom) | 1,316,500 | | 27,796 |
Associated British Foods PLC | 791,000 | | 34,848 |
B&M European Value Retail S.A. | 6,402,976 | | 25,479 |
BG Group PLC | 6,766,700 | | 112,774 |
BHP Billiton PLC | 4,625,988 | | 119,520 |
British American Tobacco PLC (United Kingdom) | 2,261,200 | | 128,159 |
BTG PLC (a) | 1,152,900 | | 13,924 |
Bunzl PLC | 1,143,100 | | 30,995 |
Diageo PLC | 3,650,857 | | 107,672 |
Exova Group Ltd. PLC (a) | 4,302,877 | | 11,684 |
Galiform PLC | 5,687,600 | | 31,144 |
Common Stocks - continued |
| Shares | | Value (000s) |
United Kingdom - continued |
Hikma Pharmaceuticals PLC | 3,032,490 | | $ 91,928 |
ITV PLC | 14,738,700 | | 47,862 |
Jazztel PLC (a) | 2,320,066 | | 37,040 |
Liberty Global PLC: | | | |
Class A (a) | 677,800 | | 30,820 |
Class C | 677,800 | | 30,142 |
Lloyds Banking Group PLC (a) | 54,946,900 | | 67,853 |
London Stock Exchange Group PLC | 3,415,236 | | 110,087 |
Melrose PLC | 11,027,800 | | 45,179 |
Next PLC | 774,844 | | 79,887 |
Persimmon PLC | 1,505,600 | | 35,236 |
Poundland Group PLC (a) | 3,906,035 | | 19,683 |
Reckitt Benckiser Group PLC | 788,600 | | 66,230 |
Rex Bionics PLC (a)(f) | 1,328,936 | | 3,518 |
Rotork PLC | 717,800 | | 29,338 |
SABMiller PLC | 1,107,300 | | 62,440 |
St. James's Place Capital PLC | 5,676,000 | | 67,645 |
Taylor Wimpey PLC | 12,002,700 | | 22,734 |
The Restaurant Group PLC | 1,992,100 | | 21,558 |
Ultra Electronics Holdings PLC | 614,667 | | 17,158 |
Vodafone Group PLC | 2,127,096 | | 7,074 |
Zoopla Property Group PLC | 2,595,500 | | 8,603 |
TOTAL UNITED KINGDOM | | 1,637,975 |
United States of America - 3.9% |
Chevron Corp. | 560,500 | | 67,232 |
Constellation Brands, Inc. Class A (sub. vtg.) (a) | 505,400 | | 46,264 |
Google, Inc.: | | | |
Class A (a) | 90,700 | | 51,506 |
Class C (a) | 90,700 | | 50,709 |
Las Vegas Sands Corp. | 177,700 | | 11,064 |
McGraw Hill Financial, Inc. | 1,415,500 | | 128,074 |
Visa, Inc. Class A | 301,900 | | 72,888 |
TOTAL UNITED STATES OF AMERICA | | 427,737 |
TOTAL COMMON STOCKS (Cost $8,985,470) |
10,292,052
|
Nonconvertible Preferred Stocks - 1.0% |
| | | |
Germany - 1.0% |
Volkswagen AG | 514,100 | | 109,554 |
Nonconvertible Preferred Stocks - continued |
| Shares | | Value (000s) |
United Kingdom - 0.0% |
Rolls-Royce Group PLC | 227,278,350 | | $ 364 |
TOTAL NONCONVERTIBLE PREFERRED STOCKS (Cost $113,684) |
109,918
|
Government Obligations - 0.1% |
| Principal
Amount (000s) (d) | | |
United States of America - 0.1% |
U.S. Treasury Bills, yield at date of purchase 0.02% to 0.03% 11/13/14 to 1/29/15 (i)
(Cost $11,590) | | $ 11,590 | |
11,590
|
Preferred Securities - 0.1% |
|
Ireland - 0.1% |
Baggot Securities Ltd. 10.24% (g)(h)
(Cost $14,037) | EUR | 9,140 | |
12,947
|
Money Market Funds - 5.6% |
| Shares | | |
Fidelity Cash Central Fund, 0.11% (b) | 567,797,475 | | 567,797 |
Fidelity Securities Lending Cash Central Fund, 0.11% (b)(c) | 52,624,430 | | 52,624 |
TOTAL MONEY MARKET FUNDS (Cost $620,421) |
620,421
|
TOTAL INVESTMENT PORTFOLIO - 100.4% (Cost $9,745,202) | | 11,046,928 |
NET OTHER ASSETS (LIABILITIES) - (0.4)% | | (48,377) |
NET ASSETS - 100% | $ 10,998,551 |
Futures Contracts |
| Expiration Date | | Underlying Face Amount at Value (000s) | | Unrealized Appreciation/
(Depreciation)
(000s) |
Purchased |
Equity Index Contracts |
3,792 CME Nikkei 225 Index Contracts (United States) | Dec. 2014 | | $ 323,647 | | $ 24,598 |
|
The face value of futures purchased as a percentage of net assets is 2.9% |
Currency Abbreviations |
EUR | - | European Monetary Unit |
Legend |
(a) Non-income producing |
(b) Affiliated fund that is generally available only to investment companies and other accounts managed by Fidelity Investments. The rate quoted is the annualized seven-day yield of the fund at period end. A complete unaudited listing of the fund's holdings as of its most recent quarter end is available upon request. In addition, each Fidelity Central Fund's financial statements, which are not covered by the Fund's Report of Independent Registered Public Accounting Firm, are available on the SEC's website or upon request. |
(c) Investment made with cash collateral received from securities on loan. |
(d) Amount is stated in United States dollars unless otherwise noted. |
(e) Security or a portion of the security is on loan at period end. |
(f) Affiliated company |
(g) Security exempt from registration under Rule 144A of the Securities Act of 1933. These securities may be resold in transactions exempt from registration, normally to qualified institutional buyers. At the end of the period, the value of these securities amounted to $12,947,000 or 0.1% of net assets. |
(h) Security is perpetual in nature with no stated maturity date. |
(i) Security or a portion of the security was pledged to cover margin requirements for futures contracts. At period end, the value of securities pledged amounted to $11,590,000. |
Affiliated Central Funds |
Information regarding fiscal year to date income earned by the Fund from investments in Fidelity Central Funds is as follows: |
Fund | Income earned
(Amounts in thousands) |
Fidelity Cash Central Fund | $ 600 |
Fidelity Securities Lending Cash Central Fund | 5,278 |
Total | $ 5,878 |
Other Affiliated Issuers |
An affiliated company is a company in which the Fund has ownership of at least 5% of the voting securities. Fiscal year to date transactions with companies which are or were affiliates are as follows: |
Affiliate
(Amounts in thousands) | Value,
beginning of
period | Purchases | Sales Proceeds | Dividend Income | Value,
end of
period |
MySale Group PLC | $ - | $ 32,521 | $ - | $ - | $ 26,053 |
PAX Global Technology Ltd. | - | 39,641 | 3,956 | - | 71,203 |
Rex Bionics PLC | - | 4,037 | - | - | 3,518 |
Total | $ - | $ 76,199 | $ 3,956 | $ - | $ 100,774 |
Other Information |
Categorizations in the Schedule of Investments are based on country or territory of incorporation. |
The following is a summary of the inputs used, as of October 31, 2014, involving the Fund's assets and liabilities carried at fair value. The inputs or methodology used for valuing securities may not be an indication of the risk associated with investing in those securities. For more information on valuation inputs, and their aggregation into the levels used in the table below, please refer to the Investment Valuation section in the accompanying Notes to Financial Statements. |
Valuation Inputs at Reporting Date: |
Description
(Amounts in thousands) | Total | Level 1 | Level 2 | Level 3 |
Investments in Securities: | | | | |
Equities: | | | | |
Consumer Discretionary | $ 1,445,431 | $ 1,029,241 | $ 416,190 | $ - |
Consumer Staples | 1,177,768 | 385,016 | 792,752 | - |
Energy | 636,082 | 232,243 | 403,839 | - |
Financials | 2,262,497 | 1,051,716 | 1,210,781 | - |
Health Care | 1,634,986 | 714,402 | 920,584 | - |
Industrials | 1,109,082 | 840,362 | 268,720 | - |
Information Technology | 1,181,932 | 597,928 | 584,004 | - |
Materials | 495,841 | 296,694 | 199,147 | - |
Telecommunication Services | 437,160 | 107,224 | 329,936 | - |
Utilities | 21,191 | - | 21,191 | - |
Government Obligations | 11,590 | - | 11,590 | - |
Preferred Securities | 12,947 | - | 12,947 | - |
Money Market Funds | 620,421 | 620,421 | - | - |
Total Investments in Securities: | $ 11,046,928 | $ 5,875,247 | $ 5,171,681 | $ - |
Derivative Instruments: | | | | |
Assets | | | | |
Futures Contracts | $ 24,598 | $ 24,598 | $ - | $ - |
The following is a summary of transfers between Level 1 and Level 2 for the period ended October 31, 2014. Transfers are assumed to have occurred at the beginning of the period, and are primarily attributable to the valuation techniques used for foreign equity securities, as discussed in the accompanying Notes to Financial Statements: |
Transfers | Total (000s) |
Level 1 to Level 2 | $ 1,082,136 |
Level 2 to Level 1 | $ 0 |
Value of Derivative Instruments |
The following table is a summary of the Fund's value of derivative instruments by primary risk exposure as of October 31, 2014. For additional information on derivative instruments, please refer to the Derivative Instruments section in the accompanying Notes to Financial Statements. |
Primary Risk Exposure /
Derivative Type | Value (000s) |
| Asset | Liability |
Equity Risk | | |
Futures Contracts (a) | $ 24,598 | $ - |
Total Value of Derivatives | $ 24,598 | $ - |
(a) Reflects gross cumulative appreciation (depreciation) on futures contracts as presented in the Schedule of Investments. Only the period end receivable or payable for daily variation margin and net unrealized appreciation (depreciation) are presented in the Statement of Assets and Liabilities. |
See accompanying notes which are an integral part of the financial statements.
Annual Report
Statement of Assets and Liabilities
Amounts in thousands (except per-share amounts) | October 31, 2014 |
| | |
Assets | | |
Investment in securities, at value (including securities loaned of $50,476) - See accompanying schedule: Unaffiliated issuers (cost $9,050,379) | $ 10,325,733 | |
Fidelity Central Funds (cost $620,421) | 620,421 | |
Other affiliated issuers (cost $74,402) | 100,774 | |
Total Investments (cost $9,745,202) | | $ 11,046,928 |
Receivable for investments sold | | 41,866 |
Receivable for fund shares sold | | 6,258 |
Dividends receivable | | 19,075 |
Distributions receivable from Fidelity Central Funds | | 78 |
Receivable for daily variation margin for derivative instruments | | 23,890 |
Prepaid expenses | | 36 |
Other receivables | | 3,818 |
Total assets | | 11,141,949 |
| | |
Liabilities | | |
Payable for investments purchased | $ 408 | |
Payable for fund shares redeemed | 73,445 | |
Accrued management fee | 6,840 | |
Distribution and service plan fees payable | 112 | |
Other affiliated payables | 1,580 | |
Other payables and accrued expenses | 8,389 | |
Collateral on securities loaned, at value | 52,624 | |
Total liabilities | | 143,398 |
| | |
Net Assets | | $ 10,998,551 |
Net Assets consist of: | | |
Paid in capital | | $ 9,891,341 |
Undistributed net investment income | | 68,609 |
Accumulated undistributed net realized gain (loss) on investments and foreign currency transactions | | (278,180) |
Net unrealized appreciation (depreciation) on investments and assets and liabilities in foreign currencies | | 1,316,781 |
Net Assets | | $ 10,998,551 |
See accompanying notes which are an integral part of the financial statements.
Annual Report
Financial Statements - continued
Statement of Assets and Liabilities - continued
Amounts in thousands (except per-share amounts) | October 31, 2014 |
| | |
Calculation of Maximum Offering Price Class A:
Net Asset Value and redemption price per share ($296,718.26 ÷ 7,667.518 shares) | | $ 38.70 |
| | |
Maximum offering price per share (100/94.25 of $38.70) | | $ 41.06 |
Class T:
Net Asset Value and redemption price per share ($48,545.20 ÷ 1,263.274 shares) | | $ 38.43 |
| | |
Maximum offering price per share (100/96.50 of $38.43) | | $ 39.82 |
Class B:
Net Asset Value and offering price per share ($4,616.85 ÷ 120.484 shares)A | | $ 38.32 |
| | |
Class C:
Net Asset Value and offering price per share ($35,346.11 ÷ 924.200 shares)A | | $ 38.25 |
| | |
International Discovery:
Net Asset Value, offering price and redemption price per share ($7,464,021.58 ÷ 191,244.937 shares) | | $ 39.03 |
| | |
Class K:
Net Asset Value, offering price and redemption price per share ($2,464,322.23 ÷ 63,228.753 shares) | | $ 38.97 |
| | |
Institutional Class:
Net Asset Value, offering price and redemption price per share ($649,855.06 ÷ 16,682.058 shares) | | $ 38.96 |
| | |
Class Z:
Net Asset Value, offering price and redemption price per share ($35,125.45 ÷ 901.567 shares) | | $ 38.96 |
A Redemption price per share is equal to net asset value less any applicable contingent deferred sales charge.
See accompanying notes which are an integral part of the financial statements.
Annual Report
Statement of Operations
Amounts in thousands | Year ended October 31, 2014 |
| | |
Investment Income | | |
Dividends | | $ 259,008 |
Special dividends | | 63,816 |
Interest | | 64 |
Income from Fidelity Central Funds | | 5,878 |
Income before foreign taxes withheld | | 328,766 |
Less foreign taxes withheld | | (23,208) |
Total income | | 305,558 |
| | |
Expenses | | |
Management fee
Basic fee | $ 80,931 | |
Performance adjustment | 2,685 | |
Transfer agent fees | 17,771 | |
Distribution and service plan fees | 1,508 | |
Accounting and security lending fees | 1,856 | |
Custodian fees and expenses | 1,542 | |
Independent trustees' compensation | 48 | |
Registration fees | 223 | |
Audit | 116 | |
Legal | 40 | |
Miscellaneous | 85 | |
Total expenses before reductions | 106,805 | |
Expense reductions | (345) | 106,460 |
Net investment income (loss) | | 199,098 |
Realized and Unrealized Gain (Loss) Net realized gain (loss) on: | | |
Investment securities: | | |
Unaffiliated issuers | 740,761 | |
Other affiliated issuers | 2,158 | |
Foreign currency transactions | (1,181) | |
Futures contracts | 16,266 | |
Total net realized gain (loss) | | 758,004 |
Change in net unrealized appreciation (depreciation) on: Investment securities (net of increase in deferred foreign taxes of $7,503) | (978,230) | |
Assets and liabilities in foreign currencies | (886) | |
Futures contracts | 20,360 | |
Total change in net unrealized appreciation (depreciation) | | (958,756) |
Net gain (loss) | | (200,752) |
Net increase (decrease) in net assets resulting from operations | | $ (1,654) |
See accompanying notes which are an integral part of the financial statements.
Annual Report
Financial Statements - continued
Statement of Changes in Net Assets
Amounts in thousands | Year ended
October 31,
2014 | Year ended
October 31,
2013 |
Increase (Decrease) in Net Assets | | |
Operations | | |
Net investment income (loss) | $ 199,098 | $ 129,203 |
Net realized gain (loss) | 758,004 | 725,376 |
Change in net unrealized appreciation (depreciation) | (958,756) | 1,463,372 |
Net increase (decrease) in net assets resulting
from operations | (1,654) | 2,317,951 |
Distributions to shareholders from net investment income | (136,326) | (146,031) |
Distributions to shareholders from net realized gain | (88,586) | (8,413) |
Total distributions | (224,912) | (154,444) |
Share transactions - net increase (decrease) | (69,908) | 714,712 |
Redemption fees | 139 | 128 |
Total increase (decrease) in net assets | (296,335) | 2,878,347 |
| | |
Net Assets | | |
Beginning of period | 11,294,886 | 8,416,539 |
End of period (including undistributed net investment income of $68,609 and undistributed net investment income of $131,430, respectively) | $ 10,998,551 | $ 11,294,886 |
See accompanying notes which are an integral part of the financial statements.
Annual Report
Financial Highlights - Class A
Years ended October 31, | 2014 | 2013 | 2012 | 2011 | 2010 |
Selected Per-Share Data | | | | | |
Net asset value, beginning of period | $ 39.49 | $ 31.66 | $ 29.43 | $ 32.07 | $ 28.57 |
Income from Investment Operations | | | | | |
Net investment income (loss) C | .53 F | .34 | .41 | .42 | .31 |
Net realized and unrealized gain (loss) | (.67) | 7.97 | 2.11 | (2.52) | 3.51 |
Total from investment operations | (.14) | 8.31 | 2.52 | (2.10) | 3.82 |
Distributions from net investment income | (.33) | (.45) | (.29) | (.38) | (.28) |
Distributions from net realized gain | (.31) | (.03) | - | (.16) | (.04) |
Total distributions | (.65) I | (.48) | (.29) | (.54) | (.32) |
Redemption fees added to paid in capital C, H | - | - | - | - | - |
Net asset value, end of period | $ 38.70 | $ 39.49 | $ 31.66 | $ 29.43 | $ 32.07 |
Total ReturnA, B | (.36)% | 26.59% | 8.70% | (6.71)% | 13.43% |
Ratios to Average Net Assets D, G | | | | | |
Expenses before reductions | 1.28% | 1.35% | 1.34% | 1.30% | 1.33% |
Expenses net of fee waivers, if any | 1.28% | 1.35% | 1.34% | 1.29% | 1.33% |
Expenses net of all reductions | 1.28% | 1.33% | 1.31% | 1.25% | 1.28% |
Net investment income (loss) | 1.35% F | .97% | 1.41% | 1.31% | 1.06% |
Supplemental Data | | | | | |
Net assets, end of period (in millions) | $ 297 | $ 347 | $ 299 | $ 320 | $ 392 |
Portfolio turnover rate E | 57% | 65% | 68% | 75% | 82% |
A Total returns would have been lower if certain expenses had not been reduced during the applicable periods shown.
B Total returns do not include the effect of the sales charges.
C Calculated based on average shares outstanding during the period.
D Fees and expenses of any underlying Fidelity Central Funds are not included in the Fund's expense ratio. The Fund indirectly bears its proportionate share of the expenses of any underlying Fidelity Central Funds.
E Amount does not include the portfolio activity of any underlying Fidelity Central Funds.
F Investment income per share reflects a large, non-recurring dividend which amounted to $.22 per share. Excluding this non-recurring dividend, the ratio of net investment income (loss) to average net assets would have been .80%.
G Expense ratios reflect operating expenses of the class. Expenses before reductions do not reflect amounts reimbursed by the investment adviser or reductions from brokerage service arrangements or reductions from other expense offset arrangements and do not represent the amount paid by the class during periods when reimbursements or reductions occur. Expenses net of fee waivers reflect expenses after reimbursement by the investment adviser but prior to reductions from brokerage service arrangements or other expense offset arrangements. Expenses net of all reductions represent the net expenses paid by the class.
H Amount represents less than $.01 per share.
I Total distributions of $.65 per share is comprised of distributions from net investment income of $.334 and distributions from net realized gain of $.311 per share.
See accompanying notes which are an integral part of the financial statements.
Annual Report
Financial Highlights - Class T
Years ended October 31, | 2014 | 2013 | 2012 | 2011 | 2010 |
Selected Per-Share Data | | | | | |
Net asset value, beginning of period | $ 39.23 | $ 31.42 | $ 29.18 | $ 31.81 | $ 28.35 |
Income from Investment Operations | | | | | |
Net investment income (loss) C | .44 F | .26 | .34 | .34 | .23 |
Net realized and unrealized gain (loss) | (.68) | 7.92 | 2.09 | (2.51) | 3.48 |
Total from investment operations | (.24) | 8.18 | 2.43 | (2.17) | 3.71 |
Distributions from net investment income | (.25) | (.34) | (.19) | (.30) | (.21) |
Distributions from net realized gain | (.31) | (.03) | - | (.16) | (.04) |
Total distributions | (.56) | (.37) | (.19) | (.46) | (.25) |
Redemption fees added to paid in capital C, H | - | - | - | - | - |
Net asset value, end of period | $ 38.43 | $ 39.23 | $ 31.42 | $ 29.18 | $ 31.81 |
Total ReturnA, B | (.60)% | 26.31% | 8.41% | (6.96)% | 13.14% |
Ratios to Average Net Assets D, G | | | | | |
Expenses before reductions | 1.51% | 1.59% | 1.59% | 1.56% | 1.60% |
Expenses net of fee waivers, if any | 1.51% | 1.59% | 1.59% | 1.55% | 1.60% |
Expenses net of all reductions | 1.51% | 1.57% | 1.56% | 1.51% | 1.56% |
Net investment income (loss) | 1.11% F | .73% | 1.16% | 1.05% | .79% |
Supplemental Data | | | | | |
Net assets, end of period (in millions) | $ 49 | $ 53 | $ 46 | $ 61 | $ 92 |
Portfolio turnover rateE | 57% | 65% | 68% | 75% | 82% |
A Total returns would have been lower if certain expenses had not been reduced during the applicable periods shown.
B Total returns do not include the effect of the sales charges.
C Calculated based on average shares outstanding during the period.
D Fees and expenses of any underlying Fidelity Central Funds are not included in the Fund's expense ratio. The Fund indirectly bears its proportionate share of the expenses of any underlying Fidelity Central Funds.
E Amount does not include the portfolio activity of any underlying Fidelity Central Funds.
F Investment income per share reflects large, non-recurring dividend which amounted to $.21 per share. Excluding this non-recurring dividend, the ratio of net investment income (loss) to average net assets would have been .56%.
G Expense ratios reflect operating expenses of the class. Expenses before reductions do not reflect amounts reimbursed by the investment adviser or reductions from brokerage service arrangements or reductions from other expense offset arrangements and do not represent the amount paid by the class during periods when reimbursements or reductions occur. Expenses net of fee waivers reflect expenses after reimbursement by the investment adviser but prior to reductions from brokerage service arrangements or other expense offset arrangements. Expenses net of all reductions represent the net expenses paid by the class.
H Amount represents less than $.01 per share.
See accompanying notes which are an integral part of the financial statements.
Annual Report
Financial Highlights - Class B
Years ended October 31, | 2014 | 2013 | 2012 | 2011 | 2010 |
Selected Per-Share Data | | | | | |
Net asset value, beginning of period | $ 39.08 | $ 31.28 | $ 29.02 | $ 31.60 | $ 28.18 |
Income from Investment Operations | | | | | |
Net investment income (loss) C | .22 F | .08 | .19 | .17 | .08 |
Net realized and unrealized gain (loss) | (.66) | 7.90 | 2.09 | (2.48) | 3.44 |
Total from investment operations | (.44) | 7.98 | 2.28 | (2.31) | 3.52 |
Distributions from net investment income | (.01) | (.15) | (.02) | (.12) | (.06) |
Distributions from net realized gain | (.31) | (.03) | - | (.16) | (.04) |
Total distributions | (.32) | (.18) | (.02) | (.27) I | (.10) |
Redemption fees added to paid in capital C, H | - | - | - | - | - |
Net asset value, end of period | $ 38.32 | $ 39.08 | $ 31.28 | $ 29.02 | $ 31.60 |
Total ReturnA, B | (1.12)% | 25.64% | 7.85% | (7.39)% | 12.52% |
Ratios to Average Net Assets D, G | | | | | |
Expenses before reductions | 2.06% | 2.10% | 2.09% | 2.06% | 2.12% |
Expenses net of fee waivers, if any | 2.06% | 2.10% | 2.09% | 2.06% | 2.12% |
Expenses net of all reductions | 2.05% | 2.08% | 2.06% | 2.02% | 2.08% |
Net investment income (loss) | .57% F | .22% | .66% | .54% | .27% |
Supplemental Data | | | | | |
Net assets, end of period (in millions) | $ 5 | $ 7 | $ 8 | $ 10 | $ 14 |
Portfolio turnover rateE | 57% | 65% | 68% | 75% | 82% |
A Total returns would have been lower if certain expenses had not been reduced during the applicable periods shown.
B Total returns do not include the effect of the contingent deferred sales charge.
C Calculated based on average shares outstanding during the period.
D Fees and expenses of any underlying Fidelity Central Funds are not included in the Fund's expense ratio. The Fund indirectly bears its proportionate share of the expenses of any underlying Fidelity Central Funds.
E Amount does not include the portfolio activity of any underlying Fidelity Central Funds.
F Investment income per share reflects a large, non-recurring dividend which amounted to $.21 per share. Excluding this non-recurring dividend, the ratio of net investment income (loss) to average net assets would have been .02%.
G Expense ratios reflect operating expenses of the class. Expenses before reductions do not reflect amounts reimbursed by the investment adviser or reductions from brokerage service arrangements or reductions from other expense offset arrangements and do not represent the amount paid by the class during periods when reimbursements or reductions occur. Expenses net of fee waivers reflect expenses after reimbursement by the investment adviser but prior to reductions from brokerage service arrangements or other expense offset arrangements. Expenses net of all reductions represent the net expenses paid by the class.
H Amount represents less than $.01 per share.
I Total distributions of $.27 per share is comprised of distributions from net investment income of $.115 and distributions from net realized gain of $.155 per share.
See accompanying notes which are an integral part of the financial statements.
Annual Report
Financial Highlights - Class C
Years ended October 31, | 2014 | 2013 | 2012 | 2011 | 2010 |
Selected Per-Share Data | | | | | |
Net asset value, beginning of period | $ 39.07 | $ 31.32 | $ 29.08 | $ 31.68 | $ 28.23 |
Income from Investment Operations | | | | | |
Net investment income (loss) C | .23 F | .08 | .19 | .18 | .09 |
Net realized and unrealized gain (loss) | (.66) | 7.90 | 2.09 | (2.49) | 3.45 |
Total from investment operations | (.43) | 7.98 | 2.28 | (2.31) | 3.54 |
Distributions from net investment income | (.08) | (.20) | (.04) | (.14) | (.05) |
Distributions from net realized gain | (.31) | (.03) | - | (.16) | (.04) |
Total distributions | (.39) | (.23) | (.04) | (.29) I | (.09) |
Redemption fees added to paid in capital C, H | - | - | - | - | - |
Net asset value, end of period | $ 38.25 | $ 39.07 | $ 31.32 | $ 29.08 | $ 31.68 |
Total ReturnA, B | (1.10)% | 25.65% | 7.86% | (7.37)% | 12.54% |
Ratios to Average Net Assets D, G | | | | | |
Expenses before reductions | 2.03% | 2.10% | 2.09% | 2.05% | 2.09% |
Expenses net of fee waivers, if any | 2.03% | 2.09% | 2.09% | 2.04% | 2.09% |
Expenses net of all reductions | 2.02% | 2.07% | 2.06% | 2.00% | 2.05% |
Net investment income (loss) | .60% F | .23% | .66% | .56% | .30% |
Supplemental Data | | | | | |
Net assets, end of period (in millions) | $ 35 | $ 36 | $ 30 | $ 33 | $ 44 |
Portfolio turnover rateE | 57% | 65% | 68% | 75% | 82% |
A Total returns would have been lower if certain expenses had not been reduced during the applicable periods shown.
B Total returns do not include the effect of the contingent deferred sales charge.
C Calculated based on average shares outstanding during the period.
D Fees and expenses of any underlying Fidelity Central Funds are not included in the Fund's expense ratio. The Fund indirectly bears its proportionate share of the expenses of any underlying Fidelity Central Funds.
E Amount does not include the portfolio activity of any underlying Fidelity Central Funds.
F Investment income per share reflects a large, non-recurring dividend which amounted to $.21 per share. Excluding this non-recurring dividend, the ratio of net investment income (loss) to average net assets would have been .05%.
G Expense ratios reflect operating expenses of the class. Expenses before reductions do not reflect amounts reimbursed by the investment adviser or reductions from brokerage service arrangements or reductions from other expense offset arrangements and do not represent the amount paid by the class during periods when reimbursements or reductions occur. Expenses net of fee waivers reflect expenses after reimbursement by the investment adviser but prior to reductions from brokerage service arrangements or other expense offset arrangements. Expenses net of all reductions represent the net expenses paid by the class.
H Amount represents less than $.01 per share.
I Total distributions of $.29 per share is comprised of distributions from net investment income of $.137 and distributions from net realized gain of $.155 per share.
See accompanying notes which are an integral part of the financial statements.
Annual Report
Financial Highlights - International Discovery
Years ended October 31, | 2014 | 2013 | 2012 | 2011 | 2010 |
Selected Per-Share Data | | | | | |
Net asset value, beginning of period | $ 39.82 | $ 31.91 | $ 29.69 | $ 32.34 | $ 28.79 |
Income from Investment Operations | | | | | |
Net investment income (loss) B | .67 E | .47 | .51 | .53 | .40 |
Net realized and unrealized gain (loss) | (.68) | 8.02 | 2.12 | (2.54) | 3.54 |
Total from investment operations | (.01) | 8.49 | 2.63 | (2.01) | 3.94 |
Distributions from net investment income | (.47) | (.55) | (.41) | (.48) | (.35) |
Distributions from net realized gain | (.31) | (.03) | - | (.16) | (.04) |
Total distributions | (.78) | (.58) | (.41) | (.64) | (.39) |
Redemption fees added to paid in capital B, G | - | - | - | - | - |
Net asset value, end of period | $ 39.03 | $ 39.82 | $ 31.91 | $ 29.69 | $ 32.34 |
Total ReturnA | (.01)% | 27.03% | 9.03% | (6.39)% | 13.76% |
Ratios to Average Net Assets C, F | | | | | |
Expenses before reductions | .93% | 1.00% | 1.01% | .97% | 1.05% |
Expenses net of fee waivers, if any | .93% | 1.00% | 1.01% | .96% | 1.05% |
Expenses net of all reductions | .93% | .98% | .98% | .92% | 1.00% |
Net investment income (loss) | 1.69% E | 1.32% | 1.73% | 1.64% | 1.35% |
Supplemental Data | | | | | |
Net assets, end of period (in millions) | $ 7,464 | $ 7,800 | $ 5,965 | $ 6,806 | $ 8,133 |
Portfolio turnover rateD | 57% | 65% | 68% | 75% | 82% |
A Total returns would have been lower if certain expenses had not been reduced during the applicable periods shown.
B Calculated based on average shares outstanding during the period.
C Fees and expenses of any underlying Fidelity Central Funds are not included in the Fund's expense ratio. The Fund indirectly bears its proportionate share of the expenses of any underlying Fidelity Central Funds.
D Amount does not include the portfolio activity of any underlying Fidelity Central Funds.
E Investment income per share reflects a large, non-recurring dividend which amounted to $.22 per share. Excluding this non-recurring dividend, the ratio of net investment income (loss) to average net assets would have been 1.15%.
F Expense ratios reflect operating expenses of the class. Expenses before reductions do not reflect amounts reimbursed by the investment adviser or reductions from brokerage service arrangements or reductions from other expense offset arrangements and do not represent the amount paid by the class during periods when reimbursements or reductions occur. Expenses net of fee waivers reflect expenses after reimbursement by the investment adviser but prior to reductions from brokerage service arrangements or other expense offset arrangements. Expenses net of all reductions represent the net expenses paid by the class.
G Amount represents less than $.01 per share.
See accompanying notes which are an integral part of the financial statements.
Annual Report
Financial Highlights - Class K
Years ended October 31, | 2014 | 2013 | 2012 | 2011 | 2010 |
Selected Per-Share Data | | | | | |
Net asset value, beginning of period | $ 39.76 | $ 31.87 | $ 29.66 | $ 32.32 | $ 28.78 |
Income from Investment Operations | | | | | |
Net investment income (loss) B | .72 E | .52 | .57 | .58 | .46 |
Net realized and unrealized gain (loss) | (.67) | 8.01 | 2.11 | (2.54) | 3.53 |
Total from investment operations | .05 | 8.53 | 2.68 | (1.96) | 3.99 |
Distributions from net investment income | (.53) | (.61) | (.47) | (.55) | (.41) |
Distributions from net realized gain | (.31) | (.03) | - | (.16) | (.04) |
Total distributions | (.84) | (.64) | (.47) | (.70) H | (.45) |
Redemption fees added to paid in capital B, G | - | - | - | - | - |
Net asset value, end of period | $ 38.97 | $ 39.76 | $ 31.87 | $ 29.66 | $ 32.32 |
Total ReturnA | .13% | 27.23% | 9.24% | (6.24)% | 13.96% |
Ratios to Average Net Assets C, F | | | | | |
Expenses before reductions | .80% | .85% | .83% | .80% | .84% |
Expenses net of fee waivers, if any | .80% | .85% | .83% | .79% | .84% |
Expenses net of all reductions | .79% | .83% | .80% | .75% | .79% |
Net investment income (loss) | 1.83% E | 1.47% | 1.91% | 1.81% | 1.55% |
Supplemental Data | | | | | |
Net assets, end of period (in millions) | $ 2,464 | $ 2,576 | $ 1,776 | $ 1,245 | $ 1,078 |
Portfolio turnover rateD | 57% | 65% | 68% | 75% | 82% |
A Total returns would have been lower if certain expenses had not been reduced during the applicable periods shown.
B Calculated based on average shares outstanding during the period.
C Fees and expenses of any underlying Fidelity Central Funds are not included in the Fund's expense ratio. The Fund indirectly bears its proportionate share of the expenses of any underlying Fidelity Central Funds.
D Amount does not include the portfolio activity of any underlying Fidelity Central Funds.
E Investment income per share reflects a large, non-recurring dividend which amounted to $.22 per share. Excluding this non-recurring dividend, the ratio of net investment income (loss) to average net assets would have been 1.28%.
F Expense ratios reflect operating expenses of the class. Expenses before reductions do not reflect amounts reimbursed by the investment adviser or reductions from brokerage service arrangements or reductions from other expense offset arrangements and do not represent the amount paid by the class during periods when reimbursements or reductions occur. Expenses net of fee waivers reflect expenses after reimbursement by the investment adviser but prior to reductions from brokerage service arrangements or other expense offset arrangements. Expenses net of all reductions represent the net expenses paid by the class.
G Amount represents less than $.01 per share.
H Total distributions of $.70 per share is comprised of distributions from net investment income of $.548 and distributions from net realized gain of $.155 per share.
See accompanying notes which are an integral part of the financial statements.
Annual Report
Financial Highlights - Institutional Class
Years ended October 31, | 2014 | 2013 | 2012 | 2011 | 2010 |
Selected Per-Share Data | | | | | |
Net asset value, beginning of period | $ 39.76 | $ 31.87 | $ 29.65 | $ 32.31 | $ 28.77 |
Income from Investment Operations | | | | | |
Net investment income (loss) B | .67 E | .47 | .52 | .54 | .41 |
Net realized and unrealized gain (loss) | (.68) | 8.01 | 2.11 | (2.55) | 3.55 |
Total from investment operations | (.01) | 8.48 | 2.63 | (2.01) | 3.96 |
Distributions from net investment income | (.48) | (.56) | (.41) | (.50) | (.38) |
Distributions from net realized gain | (.31) | (.03) | - | (.16) | (.04) |
Total distributions | (.79) | (.59) | (.41) | (.65) H | (.42) |
Redemption fees added to paid in capital B, G | - | - | - | - | - |
Net asset value, end of period | $ 38.96 | $ 39.76 | $ 31.87 | $ 29.65 | $ 32.31 |
Total ReturnA | (.01)% | 27.03% | 9.07% | (6.39)% | 13.84% |
Ratios to Average Net Assets C, F | | | | | |
Expenses before reductions | .93% | 1.00% | 1.00% | .95% | .99% |
Expenses net of fee waivers, if any | .93% | 1.00% | 1.00% | .94% | .99% |
Expenses net of all reductions | .93% | .97% | .97% | .90% | .95% |
Net investment income (loss) | 1.69% E | 1.33% | 1.75% | 1.66% | 1.40% |
Supplemental Data | | | | | |
Net assets, end of period (in millions) | $ 650 | $ 476 | $ 294 | $ 278 | $ 319 |
Portfolio turnover rateD | 57% | 65% | 68% | 75% | 82% |
A Total returns would have been lower if certain expenses had not been reduced during the applicable periods shown.
B Calculated based on average shares outstanding during the period.
C Fees and expenses of any underlying Fidelity Central Funds are not included in the Fund's expense ratio. The Fund indirectly bears its proportionate share of the expenses of any underlying Fidelity Central Funds.
D Amount does not include the portfolio activity of any underlying Fidelity Central Funds.
E Investment income per share reflects a large, non-recurring dividend which amounted to $.22 per share. Excluding this non-recurring dividend, the ratio of net investment income (loss) to average net assets would have been 1.14%.
F Expense ratios reflect operating expenses of the class. Expenses before reductions do not reflect amounts reimbursed by the investment adviser or reductions from brokerage service arrangements or reductions from other expense offset arrangements and do not represent the amount paid by the class during periods when reimbursements or reductions occur. Expenses net of fee waivers reflect expenses after reimbursement by the investment adviser but prior to reductions from brokerage service arrangements or other expense offset arrangements. Expenses net of all reductions represent the net expenses paid by the class.
G Amount represents less than $.01 per share.
H Total distributions of $.65 per share is comprised of distributions from net investment income of $.497 and distributions from net realized gain of $.155 per share.
See accompanying notes which are an integral part of the financial statements.
Annual Report
Financial Highlights - Class Z
Years ended October 31, | 2014 | 2013 H |
Selected Per-Share Data | | |
Net asset value, beginning of period | $ 39.77 | $ 37.22 |
Income from Investment Operations | | |
Net investment income (loss) D | .72 G | .07 |
Net realized and unrealized gain (loss) | (.68) | 2.48 |
Total from investment operations | .04 | 2.55 |
Distributions from net investment income | (.54) | - |
Distributions from net realized gain | (.31) | - |
Total distributions | (.85) | - |
Redemption fees added to paid in capital D, J | - | - |
Net asset value, end of period | $ 38.96 | $ 39.77 |
Total ReturnB, C | .12% | 6.85% |
Ratios to Average Net Assets E, I | | |
Expenses before reductions | .80% | .85%A |
Expenses net of fee waivers, if any | .80% | .85%A |
Expenses net of all reductions | .79% | .83%A |
Net investment income (loss) | 1.83% G | .76% A |
Supplemental Data | | |
Net assets, end of period (000 omitted) | $ 35,125 | $ 107 |
Portfolio turnover rateF | 57% | 65% |
A Annualized
B Total returns for periods of less than one year are not annualized.
C Total returns would have been lower if certain expenses had not been reduced during the applicable periods shown.
D Calculated based on average shares outstanding during the period.
E Fees and expenses of any underlying Fidelity Central Funds are not included in the Fund's expense ratio. The Fund indirectly bears its proportionate share of the expenses of any underlying Fidelity Central Funds.
F Amount does not include the portfolio activity of any underlying Fidelity Central Funds.
G Investment income per share reflects a large, non-recurring dividend which amounted to $.21 per share. Excluding this non-recurring dividend, the ratio of net investment income (loss) to average net assets would have been 1.28%.
H For the period August 13, 2013 (commencement of sale of shares) to October 31, 2013.
I Expense ratios reflect operating expenses of the class. Expenses before reductions do not reflect amounts reimbursed by the investment adviser or reductions from brokerage service arrangements or reductions from other expense offset arrangements and do not represent the amount paid by the class during periods when reimbursements or reductions occur. Expenses net of fee waivers reflect expenses after reimbursement by the investment adviser but prior to reductions from brokerage service arrangements or other expense offset arrangements. Expenses net of all reductions represent the net expenses paid by the class.
J Amount represents less than $.01 per share.
See accompanying notes which are an integral part of the financial statements.
Annual Report
Notes to Financial Statements
For the period ended October 31, 2014
(Amounts in thousands except percentages)
1. Organization.
Fidelity International Discovery Fund (the Fund) is a fund of Fidelity Investment Trust (the Trust) and is authorized to issue an unlimited number of shares. The Trust is registered under the Investment Company Act of 1940, as amended (the 1940 Act), as an open-end management investment company organized as a Massachusetts business trust. The Fund offers Class A, Class T, Class C, International Discovery, Class K, Institutional Class and Class Z shares, each of which, along with Class B shares, has equal rights as to assets and voting privileges. Class B shares are closed to new accounts and additional purchases, except for exchanges and reinvestments. Each class has exclusive voting rights with respect to matters that affect that class. Class B shares will automatically convert to Class A shares after a holding period of seven years from the initial date of purchase.
2. Investments in Fidelity Central Funds.
The Fund invests in Fidelity Central Funds, which are open-end investment companies generally available only to other investment companies and accounts managed by the investment adviser and its affiliates. The Fund's Schedule of Investments lists each of the Fidelity Central Funds held as of period end, if any, as an investment of the Fund, but does not include the underlying holdings of each Fidelity Central Fund. As an Investing Fund, the Fund indirectly bears its proportionate share of the expenses of the underlying Fidelity Central Funds.
The Money Market Central Funds seek preservation of capital and current income and are managed by Fidelity Investments Money Management, Inc. (FIMM), an affiliate of the investment adviser. Annualized expenses of the Money Market Central Funds as of their most recent shareholder report date are less than .01%.
A complete unaudited list of holdings for each Fidelity Central Fund is available upon request or at the Securities and Exchange Commission (the SEC) website at www.sec.gov. In addition, the financial statements of the Fidelity Central Funds, which are not covered by the Fund's Report of Independent Registered Public Accounting Firm, are available on the SEC website or upon request.
3. Significant Accounting Policies.
The financial statements have been prepared in conformity with accounting principles generally accepted in the United States of America (GAAP), which require management to make certain estimates and assumptions at the date of the financial statements. Actual results could differ from those estimates. Subsequent events, if any, through the date that the financial statements were issued have been evaluated in the preparation of
Annual Report
3. Significant Accounting Policies - continued
the financial statements. The following summarizes the significant accounting policies of the Fund:
Investment Valuation. Investments are valued as of 4:00 p.m. Eastern time on the last calendar day of the period. In accordance with valuation policies and procedures approved by the Board of Trustees (the Board), the Fund attempts to obtain prices from one or more third party pricing vendors or brokers to value its investments. When current market prices, quotations or currency exchange rates are not readily available or reliable, investments will be fair valued in good faith by the Fidelity Management & Research Company (FMR) Fair Value Committee (the Committee), in accordance with procedures adopted by the Board. Factors used in determining fair value vary by investment type and may include market or investment specific events, changes in interest rates and credit quality. The frequency with which these procedures are used cannot be predicted and they may be utilized to a significant extent. The Committee oversees the Fund's valuation policies and procedures and is responsible for approving and reporting to the Board all fair value determinations.
The Fund categorizes the inputs to valuation techniques used to value its investments into a disclosure hierarchy consisting of three levels as shown below:
Level 1 - quoted prices in active markets for identical investments
Level 2 - other significant observable inputs (including quoted prices for similar investments, interest rates, prepayment speeds, etc.)
Level 3 - unobservable inputs (including the Fund's own assumptions based on the best information available)
Valuation techniques used to value the Fund's investments by major category are as follows:
Equity securities, including restricted securities, for which market quotations are readily available, are valued at the last reported sale price or official closing price as reported by a third party pricing vendor on the primary market or exchange on which they are traded and are categorized as Level 1 in the hierarchy. In the event there were no sales during the day or closing prices are not available, securities are valued at the last quoted bid price or may be valued using the last available price and are generally categorized as Level 2 in the hierarchy. For foreign equity securities, when market or security specific events arise, comparisons to the valuation of American Depositary Receipts (ADRs), futures contracts, Exchange-Traded Funds (ETFs) and certain indexes as well as quoted prices for similar securities may be used and would be categorized as Level 2 in the hierarchy. Utilizing these techniques may result in transfers between Level 1 and Level 2. For equity securities, including restricted securities, where observable inputs are limited, assumptions about market activity and risk are used and these securities may be categorized as Level 3 in the hierarchy.
Annual Report
Notes to Financial Statements - continued
(Amounts in thousands except percentages)
3. Significant Accounting Policies - continued
Investment Valuation - continued
Debt securities, including restricted securities, are valued based on evaluated prices received from third party pricing vendors or from brokers who make markets in such securities. Preferred securities and U.S. government and government agency obligations are valued by pricing vendors who utilize matrix pricing which considers yield or price of bonds of comparable quality, coupon, maturity and type or by broker-supplied prices. When independent prices are unavailable or unreliable, debt securities may be valued utilizing pricing methodologies which consider similar factors that would be used by third party pricing vendors. Debt securities are generally categorized as Level 2 in the hierarchy but may be Level 3 depending on the circumstances.
Futures contracts are valued at the settlement price established each day by the board of trade or exchange on which they are traded and are categorized as Level 1 in the hierarchy. Investments in open-end mutual funds, including the Fidelity Central Funds, are valued at their closing net asset value (NAV) each business day and are categorized as Level 1 in the hierarchy.
Changes in valuation techniques may result in transfers in or out of an assigned level within the disclosure hierarchy. The aggregate value of investments by input level, as of October 31, 2014, including information on transfers between Levels 1 and 2 is included at the end of the Fund's Schedule of Investments.
Foreign Currency. The Fund may use foreign currency contracts to facilitate transactions in foreign-denominated securities. Gains and losses from these transactions may arise from changes in the value of the foreign currency or if the counterparties do not perform under the contracts' terms.
Foreign-denominated assets, including investment securities, and liabilities are translated into U.S. dollars at the exchange rates at period end. Purchases and sales of investment securities, income and dividends received and expenses denominated in foreign currencies are translated into U.S. dollars at the exchange rate in effect on the transaction date.
The effects of exchange rate fluctuations on investments are included with the net realized and unrealized gain (loss) on investment securities. Other foreign currency transactions resulting in realized and unrealized gain (loss) are disclosed separately.
Investment Transactions and Income. For financial reporting purposes, the Fund's investment holdings and NAV include trades executed through the end of the last business day of the period. The NAV per share for processing shareholder transactions is calculated as of the close of business of the New York Stock Exchange (NYSE), normally 4:00 p.m. Eastern time and includes trades executed through the end of the prior business day. Gains and losses on securities sold are determined on the basis of identified
Annual Report
3. Significant Accounting Policies - continued
Investment Transactions and Income - continued
cost and may include proceeds received from litigation. Dividend income is recorded on the ex-dividend date, except for certain dividends from foreign securities where the ex-dividend date may have passed, which are recorded as soon as the Fund is informed of the ex-dividend date. Non-cash dividends included in dividend income, if any, are recorded at the fair market value of the securities received. Income and capital gain distributions from Fidelity Central Funds, if any, are recorded on the ex-dividend date. Large, non-recurring dividends recognized by the Fund are presented separately on the Statement of Operations as "Special Dividends" and the impact of these dividends is presented in the Financial Highlights. Interest income is accrued as earned and includes coupon interest and amortization of premium and accretion of discount on debt securities as applicable. Investment income is recorded net of foreign taxes withheld where recovery of such taxes is uncertain.
Class Allocations and Expenses. Investment income, realized and unrealized capital gains and losses, common expenses of the Fund, and certain fund-level expense reductions, if any, are allocated daily on a pro-rata basis to each class based on the relative net assets of each class to the total net assets of the Fund. Each class differs with respect to transfer agent and distribution and service plan fees incurred. Certain expense reductions may also differ by class. For the reporting period, the allocated portion of income and expenses to each class as a percent of its average net assets may vary due to the timing of recording these transactions in relation to fluctuating net assets of the classes. Expenses directly attributable to a fund are charged to that fund. Expenses attributable to more than one fund are allocated among the respective funds on the basis of relative net assets or other appropriate methods. Expense estimates are accrued in the period to which they relate and adjustments are made when actual amounts are known.
Deferred Trustee Compensation. Under a Deferred Compensation Plan (the Plan), independent Trustees may elect to defer receipt of a portion of their annual compensation. Deferred amounts are invested in a cross-section of Fidelity funds, are marked-to-market and remain in the Fund until distributed in accordance with the Plan. The investment of deferred amounts and the offsetting payable to the Trustees are included in the accompanying Statement of Assets and Liabilities.
Income Tax Information and Distributions to Shareholders. Each year, the Fund intends to qualify as a regulated investment company under Subchapter M of the Internal Revenue Code, including distributing substantially all of its taxable income and realized gains. As a result, no provision for U.S. Federal income taxes is required. As of October 31, 2014, the Fund did not have any unrecognized tax benefits in the financial statements; nor is the Fund aware of any tax positions for which it is reasonably possible that the total amounts of unrecognized tax benefits will significantly change in the next
Annual Report
Notes to Financial Statements - continued
(Amounts in thousands except percentages)
3. Significant Accounting Policies - continued
Income Tax Information and Distributions to Shareholders - continued
twelve months. The Fund files a U.S. federal tax return, in addition to state and local tax returns as required. The Fund's federal income tax returns are subject to examination by the Internal Revenue Service (IRS) for a period of three fiscal years after they are filed. State and local tax returns may be subject to examination for an additional fiscal year depending on the jurisdiction. Foreign taxes are provided for based on the Fund's understanding of the tax rules and rates that exist in the foreign markets in which it invests. The Fund is subject to a tax imposed on capital gains by certain countries in which it invests. An estimated deferred tax liability for net unrealized appreciation on the applicable securities is included in Other payables and accrued expenses on the Statement of Assets & Liabilities.
Distributions are declared and recorded on the ex-dividend date. Income dividends and capital gain distributions are declared separately for each class. Income and capital gain distributions are determined in accordance with income tax regulations, which may differ from GAAP. In addition, the Fund claimed a portion of the payment made to redeeming shareholders as a distribution for income tax purposes.
Capital accounts within the financial statements are adjusted for permanent book-tax differences. These adjustments have no impact on net assets or the results of operations. Capital accounts are not adjusted for temporary book-tax differences which will reverse in a subsequent period.
Book-tax differences are primarily due to futures contracts, foreign currency transactions, passive foreign investment companies (PFIC), market discount, deferred trustees compensation, capital loss carryforwards and losses deferred due to wash sales.
The federal tax cost of investment securities and unrealized appreciation (depreciation) as of period end were as follows:
Gross unrealized appreciation | $ 1,714,728 |
Gross unrealized depreciation | (439,338) |
Net unrealized appreciation (depreciation) on securities | $ 1,275,390 |
| |
Tax Cost | $ 9,771,538 |
The tax-based components of distributable earnings as of period end were as follows:
Undistributed ordinary income | $ 68,892 |
Capital loss carryforward | $ (227,245) |
Net unrealized appreciation (depreciation) on securities and other investments | $ 1,273,334 |
Annual Report
3. Significant Accounting Policies - continued
Income Tax Information and Distributions to Shareholders - continued
Capital loss carryforwards are only available to offset future capital gains of the Fund to the extent provided by regulations and may be limited. Under the Regulated Investment Company Modernization Act of 2010 (the Act), the Fund is permitted to carry forward capital losses incurred in taxable years beginning after December 22, 2010 for an unlimited period and such capital losses are required to be used prior to any losses that expire. The capital loss carryforward information presented below, including any applicable limitation, is estimated as of fiscal period end and is subject to adjustment.
Fiscal year of expiration | |
2017 | $ (227,245) |
The tax character of distributions paid was as follows:
| October 31, 2014 | October 31, 2013 |
Ordinary Income | $ 224,912 | $ 154,444 |
Short-Term Trading (Redemption) Fees. Shares held by investors in the Fund less than 30 days may have been subject to a redemption fee equal to 1.00% of the NAV of shares redeemed. All redemption fees, which reduce the proceeds of the shareholder redemption, are retained by the Fund and accounted for as an addition to paid in capital.
Restricted Securities. The Fund may invest in securities that are subject to legal or contractual restrictions on resale. These securities generally may be resold in transactions exempt from registration or to the public if the securities are registered. Disposal of these securities may involve time-consuming negotiations and expense, and prompt sale at an acceptable price may be difficult. Information regarding restricted securities is included at the end of the Fund's Schedule of Investments.
New Accounting Pronouncement. In June 2014, the Financial Accounting Standards Board issued Accounting Standard Update No. 2014-11, Repurchase-to-Maturity Transactions, Repurchase Financings, and Disclosures. The Update amends the accounting for certain repurchase agreements and expands disclosure requirements for reverse repurchase agreements, securities lending and other similar transactions. The disclosure requirements are effective for annual and interim reporting periods beginning after December 15, 2014. Management is currently evaluating the impact of the Update on the Fund's financial statements and related disclosures.
4. Derivative Instruments.
Risk Exposures and the Use of Derivative Instruments. The Fund's investment objective allows the Fund to enter into various types of derivative contracts, including
Annual Report
Notes to Financial Statements - continued
(Amounts in thousands except percentages)
4. Derivative Instruments - continued
Risk Exposures and the Use of Derivative Instruments - continued
futures contracts. Derivatives are investments whose value is primarily derived from underlying assets, indices or reference rates and may be transacted on an exchange or over-the-counter (OTC). Derivatives may involve a future commitment to buy or sell a specified asset based on specified terms, to exchange future cash flows at periodic intervals based on a notional principal amount, or for one party to make one or more payments upon the occurrence of specified events in exchange for periodic payments from the other party.
The Fund used derivatives to increase returns and to manage exposure to certain risks as defined below. The success of any strategy involving derivatives depends on analysis of numerous economic factors, and if the strategies for investment do not work as intended, the Fund may not achieve its objectives.
The Fund's use of derivatives increased or decreased its exposure to the following risk:
Equity Risk | Equity risk relates to the fluctuations in the value of financial instruments as a result of changes in market prices (other than those arising from interest rate risk or foreign exchange risk), whether caused by factors specific to an individual investment, its issuer, or all factors affecting all instruments traded in a market or market segment. |
The Fund is also exposed to additional risks from investing in derivatives, such as liquidity risk and counterparty credit risk. Liquidity risk is the risk that the Fund will be unable to close out the derivative in the open market in a timely manner. Counterparty credit risk is the risk that the counterparty will not be able to fulfill its obligation to the Fund. Counterparty credit risk related to exchange-traded futures contracts may be mitigated by the protection provided by the exchange on which they trade.
Investing in derivatives may involve greater risks than investing in the underlying assets directly and, to varying degrees, may involve risk of loss in excess of any initial investment and collateral received and amounts recognized in the Statement of Assets and Liabilities. In addition, there may be the risk that the change in value of the derivative contract does not correspond to the change in value of the underlying instrument.
Futures Contracts. A futures contract is an agreement between two parties to buy or sell a specified underlying instrument for a fixed price at a specified future date. The Fund used futures contracts to manage its exposure to the stock market.
Upon entering into a futures contract, a fund is required to deposit either cash or securities (initial margin) with a clearing broker in an amount equal to a certain percentage of the face value of the contract. Futures contracts are marked-to-market daily and subsequent daily payments variation margin are made or received by a fund depending on the
Annual Report
4. Derivative Instruments - continued
Futures Contracts - continued
daily fluctuations in the value of the futures contracts and are recorded as unrealized appreciation or (depreciation). This receivable and/or payable, if any, is included in daily variation margin for derivative instruments in the Statement of Assets and Liabilities. Realized gain or (loss) is recorded upon the expiration or closing of a futures contract.
Any open futures contracts at period end are presented in the Schedule of Investments under the caption "Futures Contracts." The underlying face amount at value reflects each contract's exposure to the underlying instrument or index at period end and is
representative of volume of activity during the period. Securities deposited to meet initial margin requirements are identified in the Schedule of Investments.
During the period the Fund recognized net realized gain (loss) of $16,266 and a change in net unrealized appreciation (depreciation) of $20,360 related to its investment in futures contracts. These amounts are included in the Statement of Operations.
5. Purchases and Sales of Investments.
Purchases and sales of securities, other than short-term securities, aggregated $6,348,453 and $6,576,338, respectively.
6. Fees and Other Transactions with Affiliates.
Management Fee. Fidelity Management & Research Company (the investment adviser) and its affiliates provide the Fund with investment management related services for which the Fund pays a monthly management fee. The management fee is the sum of an individual fund fee rate that is based on an annual rate of .424% of the Fund's average net assets and an annualized group fee rate that averaged .25% during the period. Prior to August 1, 2014 the individual fund fee rate was .45%. The group fee rate is based upon the average net assets of all the mutual funds advised by the investment adviser, including any mutual funds previously advised by the investment adviser that are currently advised by Fidelity SelectCo, LLC, an affiliate of the investment adviser. The group fee rate decreases as assets under management increase and increases as assets under management decrease. In addition, the management fee is subject to a performance adjustment (up to a maximum of ± .20% of the Fund's average net assets over a 36 month performance period). The upward or downward adjustment to the management fee is based on the relative investment performance of International Discovery as compared to its benchmark index, the MSCI EAFE Index, over the same 36 month performance period. For the reporting period, the total annual management fee rate, including the performance adjustment, was .72% of the Fund's average net assets. The performance adjustment included in the management fee rate may be higher or lower
Annual Report
Notes to Financial Statements - continued
(Amounts in thousands except percentages)
6. Fees and Other Transactions with Affiliates - continued
Management Fee - continued
than the maximum performance adjustment rate due to the difference between the average net assets for the reporting and performance periods.
Distribution and Service Plan Fees. In accordance with Rule 12b-1 of the 1940 Act, the Fund has adopted separate Distribution and Service Plans for each class of shares. Certain classes pay Fidelity Distributors Corporation (FDC), an affiliate of the investment adviser, separate Distribution and Service Fees, each of which is based on an annual percentage of each class' average net assets. In addition, FDC may pay financial intermediaries for selling shares of the Fund and providing shareholder support services.
For the period, the Distribution and Service Fee rates, total fees and amounts retained by FDC were as follows:
| Distribution
Fee | Service
Fee | Total Fees | Retained
by FDC |
Class A | -% | .25% | $ 813 | $ 6 |
Class T | .25% | .25% | 255 | 1 |
Class B | .75% | .25% | 58 | 44 |
Class C | .75% | .25% | 382 | 44 |
| | | $ 1,508 | $ 95 |
Sales Load. FDC may receive a front-end sales charge of up to 5.75% for selling Class A shares and 3.50% for selling Class T shares, some of which is paid to financial intermediaries for selling shares of the Fund. Depending on the holding period, FDC may receive contingent deferred sales charges levied on Class A, Class T, Class B, and Class C redemptions. The deferred sales charges range from 5.00% to 1.00% for Class B shares, 1.00% for Class C shares, 1.00% for certain purchases of Class A shares and .25% for certain purchases of Class T shares.
For the period, sales charge amounts retained by FDC were as follows:
| Retained
by FDC |
Class A | $ 59 |
Class T | 7 |
Class B* | 3 |
Class C* | 5 |
| $ 74 |
* When Class B and Class C shares are initially sold, FDC pays commissions from its own resources to financial intermediaries through which the sales are made.
Annual Report
6. Fees and Other Transactions with Affiliates - continued
Transfer Agent Fees. Fidelity Investments Institutional Operations Company, Inc., (FIIOC), an affiliate of the investment adviser is the transfer, dividend disbursing and shareholder servicing agent for each class of the Fund. FIIOC receives account fees and asset-based fees that vary according to the account size and type of account of the shareholders of the respective classes of the Fund, except for Class Z. FIIOC receives an asset-based fee of Class K's and Class Z's average net assets. FIIOC receives an asset-based fee of Class Z's average net assets. FIIOC pays for typesetting, printing and mailing of shareholder reports, except proxy statements.
For the period, transfer agent fees for each applicable class were as follows:
| Amount | % of
Class-Level Average
Net Assets |
Class A | $ 904 | .28 |
Class T | 134 | .26 |
Class B | 18 | .30 |
Class C | 105 | .28 |
International Discovery | 14,295 | .18 |
Class K | 1,219 | .05 |
Institutional Class | 1,088 | .18 |
Class Z | 8 | .05 |
| $ 17,771 | |
Accounting and Security Lending Fees. Fidelity Service Company, Inc. (FSC), an affiliate of the investment adviser, maintains the Fund's accounting records. The accounting fee is based on the level of average net assets for each month. Under a separate contract, FSC administers the security lending program. The security lending fee is based on the number and duration of lending transactions.
Brokerage Commissions. The Fund placed a portion of its portfolio transactions with brokerage firms which are affiliates of the investment adviser. Brokerage commissions are included in net realized gain (loss) and change in net unrealized appreciation (depreciation) in the Statement of Operations. The commissions paid to these affiliated firms were $11 for the period.
Other. During the period, the investment adviser reimbursed the Fund for certain losses in the amount of $2.
7. Committed Line of Credit.
The Fund participates with other funds managed by the investment adviser or an affiliate in a $4.25 billion credit facility (the "line of credit") to be utilized for temporary or emergency purposes to fund shareholder redemptions or for other short-term liquidity purposes. The Fund has agreed to pay commitment fees on its pro-rata portion of the line
Annual Report
Notes to Financial Statements - continued
(Amounts in thousands except percentages)
7. Committed Line of Credit - continued
of credit, which amounted to $19 and is reflected in Miscellaneous expenses on the Statement of Operations. During the period, the Fund did not borrow on this line of credit.
8. Security Lending.
The Fund lends portfolio securities through a lending agent from time to time in order to earn additional income. For equity securities, a lending agent is used and may loan securities to certain qualified borrowers, including Fidelity Capital Markets (FCM), a broker-dealer affiliated with the Fund. On the settlement date of the loan, the Fund receives collateral (in the form of U.S. Treasury obligations, letters of credit and/or cash) against the loaned securities and maintains collateral in an amount not less than 100% of the market value of the loaned securities during the period of the loan. The market value of the loaned securities is determined at the close of business of the Fund and any additional required collateral is delivered to the Fund on the next business day. If the borrower defaults on its obligation to return the securities loaned because of insolvency or other reasons, the Fund may apply collateral received from the borrower against the obligation. The Fund may experience delays and costs in recovering the securities loaned. Any cash collateral received is invested in the Fidelity Securities Lending Cash Central Fund. The value of loaned securities and cash collateral at period end are disclosed on the Fund's Statement of Assets and Liabilities. At period end, there were no security loans outstanding with FCM. Security lending income represents the income earned on investing cash collateral, less rebates paid to borrowers and any lending agent fees associated with the loan, plus any premium payments received for lending certain types of securities. Security lending income is presented in the Statement of Operations as a component of income from Fidelity Central Funds. Total security lending income during the period amounted to $5,278, including $7 from securities loaned to FCM.
9. Expense Reductions.
Commissions paid to certain brokers with whom the investment adviser, or its affiliates, places trades on behalf of the Fund include an amount in addition to trade execution, which may be rebated back to the Fund to offset certain expenses. This amount totaled $317 for the period.
In addition, the investment adviser reimbursed a portion of the Fund's operating expenses during the period in the amount of $28.
Annual Report
10. Distributions to Shareholders.
Distributions to shareholders of each class were as follows:
Years ended October 31, | 2014 | 2013 |
From net investment income | | |
Class A | $ 2,857 | $ 4,138 |
Class T | 344 | 492 |
Class B | 2 | 34 |
Class C | 79 | 186 |
International Discovery | 93,065 | 101,466 |
Class K | 33,983 | 34,651 |
Institutional Class | 5,936 | 5,064 |
Class Z | 60 | - |
Total | $ 136,326 | $ 146,031 |
From net realized gain | 2014 | 2013 |
Class A | $ 2,660 | $ 297 |
Class T | 423 | 46 |
Class B | 52 | 7 |
Class C | 295 | 30 |
International Discovery | 61,190 | 5,914 |
Class K | 20,093 | 1,827 |
Institutional Class | 3,838 | 292 |
Class Z | 35 | - |
Total | $ 88,586 | $ 8,413 |
11. Share Transactions.
Share transactions for each class were as follows and may contain automatic conversions between classes or exchanges between funds:
| Shares | Shares | Dollars | Dollars |
Years ended October 31, | 2014 | 2013 A | 2014 | 2013 A |
Class A | | | | |
Shares sold | 1,382 | 1,772 | $ 54,489 | $ 62,186 |
Reinvestment of distributions | 137 | 132 | 5,280 | 4,249 |
Shares redeemed | (2,632) | (2,553) | (104,067) | (88,988) |
Net increase (decrease) | (1,113) | (649) | $ (44,298) | $ (22,553) |
Class T | | | | |
Shares sold | 200 | 227 | $ 7,804 | $ 7,911 |
Reinvestment of distributions | 19 | 16 | 736 | 512 |
Shares redeemed | (311) | (347) | (12,118) | (11,997) |
Net increase (decrease) | (92) | (104) | $ (3,578) | $ (3,574) |
Class B | | | | |
Shares sold | 6 | 4 | $ 233 | $ 137 |
Reinvestment of distributions | 1 | 1 | 51 | 39 |
Shares redeemed | (58) | (75) | (2,266) | (2,570) |
Net increase (decrease) | (51) | (70) | $ (1,982) | $ (2,394) |
Annual Report
Notes to Financial Statements - continued
(Amounts in thousands except percentages)
11. Share Transactions - continued
| Shares | Shares | Dollars | Dollars |
Years ended October 31, | 2014 | 2013 A | 2014 | 2013 A |
Class C | | | | |
Shares sold | 232 | 184 | $ 9,059 | $ 6,532 |
Reinvestment of distributions | 9 | 6 | 337 | 193 |
Shares redeemed | (250) | (207) | (9,726) | (7,250) |
Net increase (decrease) | (9) | (17) | $ (330) | $ (525) |
International Discovery | | | | |
Shares sold | 28,809 | 37,338 | $ 1,144,588 | $ 1,332,523 |
Reinvestment of distributions | 3,813 | 3,176 | 148,138 | 102,608 |
Shares redeemed | (37,231) | (31,569) | (1,476,965) | (1,103,313) |
Net increase (decrease) | (4,609) | 8,945 | $ (184,239) | $ 331,818 |
Class K | | | | |
Shares sold | 15,775 | 19,989 | $ 628,261 | $ 699,723 |
Reinvestment of distributions | 1,396 | 1,132 | 54,076 | 36,478 |
Shares redeemed | (18,729) | (12,053) | (741,205) | (423,712) |
Net increase (decrease) | (1,558) | 9,068 | $ (58,868) | $ 312,489 |
Institutional Class | | | | |
Shares sold | 10,468 | 4,893 | $ 410,346 | $ 175,669 |
Reinvestment of distributions | 91 | 68 | 3,529 | 2,182 |
Shares redeemed | (5,852) | (2,219) | (225,868) | (78,500) |
Net increase (decrease) | 4,707 | 2,742 | $ 188,007 | $ 99,351 |
Class Z | | | | |
Shares sold | 993 | 3 | $ 39,070 | $ 100 |
Reinvestment of distributions | 2 | - | 95 | - |
Shares redeemed | (96) | - | (3,785) | - |
Net increase (decrease) | 899 | 3 | $ 35,380 | $ 100 |
A Share transactions for Class Z are for the period August 13, 2013 (commencement of sale of shares) to October 31, 2014.
12. Other.
The Fund's organizational documents provide former and current trustees and officers with a limited indemnification against liabilities arising in connection with the performance of their duties to the Fund. In the normal course of business, the Fund may also enter into contracts that provide general indemnifications. The Fund's maximum exposure under these arrangements is unknown as this would be dependent on future claims that may be made against the Fund. The risk of material loss from such claims is considered remote.
At the end of the period, Strategic Advisers International Fund was the owner of record of approximately 15% of the total outstanding shares of the Fund.
Annual Report
To the Trustees of Fidelity Investment Trust and the Shareholders of Fidelity International Discovery Fund:
In our opinion, the accompanying statement of assets and liabilities, including the schedule of investments, and the related statements of operations and of changes in net assets and the financial highlights present fairly, in all material respects, the financial position of Fidelity International Discovery Fund (a fund of Fidelity Investment Trust) at October 31, 2014, the results of its operations for the year then ended, the changes in its net assets for each of the two years in the period then ended and the financial highlights for each of the periods indicated, in conformity with accounting principles generally accepted in the United States of America. These financial statements and financial highlights (hereafter referred to as "financial statements") are the responsibility of the Fidelity International Discovery Fund's management. Our responsibility is to express an opinion on these financial statements based on our audits. We conducted our audits of these financial statements in accordance with the standards of the Public Company Accounting Oversight Board (United States). Those standards require that we plan and perform the audit to obtain reasonable assurance about whether the financial statements are free of material misstatement. An audit includes examining, on a test basis, evidence supporting the amounts and disclosures in the financial statements, assessing the accounting principles used and significant estimates made by management, and evaluating the overall financial statement presentation. We believe that our audits, which included confirmation of securities at October 31, 2014 by correspondence with the custodian and brokers, provide a reasonable basis for our opinion.
PricewaterhouseCoopers LLP
Boston, Massachusetts
December 19, 2014
Annual Report
The Trustees, Member of the Advisory Board, and officers of the trust and fund, as applicable, are listed below. The Board of Trustees governs the fund and is responsible for protecting the interests of shareholders. The Trustees are experienced executives who meet periodically throughout the year to oversee the fund's activities, review contractual arrangements with companies that provide services to the fund, oversee management of the risks associated with such activities and contractual arrangements, and review the fund's performance. Except for James C. Curvey, each of the Trustees oversees 174 funds. Mr. Curvey oversees 407 funds.
The Trustees hold office without limit in time except that (a) any Trustee may resign; (b) any Trustee may be removed by written instrument, signed by at least two-thirds of the number of Trustees prior to such removal; (c) any Trustee who requests to be retired or who has become incapacitated by illness or injury may be retired by written instrument signed by a majority of the other Trustees; and (d) any Trustee may be removed at any special meeting of shareholders by a two-thirds vote of the outstanding voting securities of the trust. Each Trustee who is not an interested person (as defined in the 1940 Act) of the trust and the fund (Independent Trustee), shall retire not later than the last day of the calendar year in which his or her 75th birthday occurs. The Independent Trustees may waive this mandatory retirement age policy with respect to individual Trustees. The officers and Advisory Board Member hold office without limit in time, except that any officer and Advisory Board Member may resign or may be removed by a vote of a majority of the Trustees at any regular meeting or any special meeting of the Trustees. Except as indicated, each individual has held the office shown or other offices in the same company for the past five years.
Experience, Skills, Attributes, and Qualifications of the Fund's Trustees. The Governance and Nominating Committee has adopted a statement of policy that describes the experience, qualifications, attributes, and skills that are necessary and desirable for potential Independent Trustee candidates (Statement of Policy). The Board believes that each Trustee satisfied at the time he or she was initially elected or appointed a Trustee, and continues to satisfy, the standards contemplated by the Statement of Policy. The Governance and Nominating Committee also engages professional search firms to help identify potential Independent Trustee candidates who have the experience, qualifications, attributes, and skills consistent with the Statement of Policy. From time to time, additional criteria based on the composition and skills of the current Independent Trustees, as well as experience or skills that may be appropriate in light of future changes to board composition, business conditions, and regulatory or other developments, have also been considered by the professional search firms and the Governance and Nominating Committee. In addition, the Board takes into account the Trustees' commitment and participation in Board and committee meetings, as well as their leadership of standing and ad hoc committees throughout their tenure.
In determining that a particular Trustee was and continues to be qualified to serve as a Trustee, the Board has considered a variety of criteria, none of which, in isolation, was controlling. The Board believes that, collectively, the Trustees have balanced and diverse experience, qualifications, attributes, and skills, which allow the Board to operate effectively in governing the fund and protecting the interests of shareholders. Information about the specific experience, skills, attributes, and qualifications of each Trustee, which in each case led to the Board's conclusion that the Trustee should serve (or continue to serve) as a trustee of the fund, is provided below.
Annual Report
Trustees and Officers - continued
Board Structure and Oversight Function. James C. Curvey is an interested person (as defined in the 1940 Act) and currently serves as Chairman. The Trustees have determined that an interested Chairman is appropriate and benefits shareholders because an interested Chairman has a personal and professional stake in the quality and continuity of services provided to the fund. Independent Trustees exercise their informed business judgment to appoint an individual of their choosing to serve as Chairman, regardless of whether the Trustee happens to be independent or a member of management. The Independent Trustees have determined that they can act independently and effectively without having an Independent Trustee serve as Chairman and that a key structural component for assuring that they are in a position to do so is for the Independent Trustees to constitute a substantial majority for the Board. The Independent Trustees also regularly meet in executive session. Ned C. Lautenbach serves as Chairman of the Independent Trustees and as such (i) acts as a liaison between the Independent Trustees and management with respect to matters important to the Independent Trustees and (ii) with management prepares agendas for Board meetings.
Fidelity funds are overseen by different Boards of Trustees. The fund's Board oversees Fidelity's equity and high income funds and another Board oversees Fidelity's investment-grade bond, money market, and asset allocation funds. The asset allocation funds may invest in Fidelity funds overseen by the fund's Board. The use of separate Boards, each with its own committee structure, allows the Trustees of each group of Fidelity funds to focus on the unique issues of the funds they oversee, including common research, investment, and operational issues. On occasion, the separate Boards establish joint committees to address issues of overlapping consequences for the Fidelity funds overseen by each Board.
The Trustees operate using a system of committees to facilitate the timely and efficient consideration of all matters of importance to the Trustees, the fund, and fund shareholders and to facilitate compliance with legal and regulatory requirements and oversight of the fund's activities and associated risks. The Board, acting through its committees, has charged FMR and its affiliates with (i) identifying events or circumstances the occurrence of which could have demonstrably adverse effects on the fund's business and/or reputation; (ii) implementing processes and controls to lessen the possibility that such events or circumstances occur or to mitigate the effects of such events or circumstances if they do occur; and (iii) creating and maintaining a system designed to evaluate continuously business and market conditions in order to facilitate the identification and implementation processes described in (i) and (ii) above. Because the day-to-day operations and activities of the fund are carried out by or through FMR, its affiliates and other service providers, the fund's exposure to risks is mitigated but not eliminated by the processes overseen by the Trustees. While each of the Board's committees has responsibility for overseeing different aspects of the fund's activities, oversight is exercised primarily through the Operations, Audit, and Compliance Committees. In addition, the Independent Trustees have worked with FMR to enhance the Board's oversight of investment and financial risks, legal and regulatory risks, technology risks, and operational risks, including the development of additional risk reporting to the Board. For example, a working group comprised of Independent Trustees and FMR has worked and continues to work to review the Fidelity funds' valuation-related activities, reporting and risk management. Appropriate personnel, including but not limited to the fund's Chief Compliance Officer (CCO), FMR's internal auditor, the independent accountants, the fund's Treasurer and portfolio management personnel, make periodic reports to the Board's committees, as appropriate, including an annual review of FMR's risk management program for the Fidelity funds. The responsibilities of each standing committee, including their oversight responsibilities, are described further under "Standing Committees of the Fund's Trustees."
Annual Report
The fund's Statement of Additional Information (SAI) includes more information about the Trustees. To request a free copy, call Fidelity at 1-877-208-0098.
Interested Trustees*:
Correspondence intended for each Trustee who is an interested person may be sent to Fidelity Investments, 245 Summer Street, Boston, Massachusetts 02210.
Name, Year of Birth; Principal Occupations and Other Relevant Experience+ |
James C. Curvey (1935) |
Year of Election or Appointment: 2007 Trustee Chairman of the Board of Trustees |
| Mr. Curvey also serves as Trustee of other Fidelity funds. Mr. Curvey is a Director of Fidelity Research & Analysis Co. (2009-present), and Vice Chairman (2007-present) and Director of FMR LLC. In addition, Mr. Curvey serves as an Overseer for the Boston Symphony Orchestra and a member of the board of ArtisNaples, Naples, Florida, and as a Trustee for Brewster Academy, Wolfeboro, New Hampshire. Previously, Mr. Curvey served as a Director of Fidelity Investments Money Management, Inc. (2009-2014), a Director of FMR (2007-2014), and a Director of FMR Co., Inc. (2007-2014). |
Charles S. Morrison (1960) |
Year of Election or Appointment: 2014 Trustee |
| Mr. Morrison also serves as Trustee of other funds. He serves as a Director of Fidelity Investments Money Management, Inc. (FIMM) (2014-present), Director of Fidelity SelectCo, LLC (2014-present), President, Asset Management (2014-present), and is an employee of Fidelity Investments. Previously, Mr. Morrison served as Vice President of Fidelity's Fixed Income and Asset Allocation Funds (2012-2014), President, Fixed Income (2011-2014), Vice President of Fidelity's Money Market Funds (2005-2009), President, Money Market Group Leader of FMR (2009), and Senior Vice President, Money Market Group of FMR (2004-2009). Mr. Morrison also served as Vice President of Fidelity's Bond Funds (2002-2005), certain Balanced Funds (2002-2005), and certain Asset Allocation Funds (2002-2007), and as Senior Vice President (2002-2005) of Fidelity's Bond Division. |
* Trustees have been determined to be "Interested Trustees" by virtue of, among other things, their affiliation with the trust or various entities under common control with FMR.
+ The information above includes each Trustee's principal occupation during the last five years and other information relating to the experience, attributes, and skills relevant to each Trustee's qualifications to serve as a Trustee, which led to the conclusion that each Trustee should serve as a Trustee for the fund.
Annual Report
Independent Trustees:
Correspondence intended for each Independent Trustee (that is, the Trustees other than the Interested Trustees) may be sent to Fidelity Investments, P.O. Box 55235, Boston, Massachusetts 02205-5235.
Name, Year of Birth; Principal Occupations and Other Relevant Experience+ |
Dennis J. Dirks (1948) |
Year of Election or Appointment: 2005 Trustee |
| Mr. Dirks also serves as Trustee of other Fidelity funds. Prior to his retirement in May 2003, Mr. Dirks was Chief Operating Officer and a member of the Board of The Depository Trust & Clearing Corporation (DTCC). He also served as President, Chief Operating Officer, and Board member of The Depository Trust Company (DTC) and President and Board member of the National Securities Clearing Corporation (NSCC). In addition, Mr. Dirks served as Chief Executive Officer and Board member of the Government Securities Clearing Corporation, Chief Executive Officer and Board member of the Mortgage-Backed Securities Clearing Corporation, as a Trustee and a member of the Finance Committee of Manhattan College (2005-2008), and as a Trustee and a member of the Finance Committee of AHRC of Nassau County (2006-2008). Mr. Dirks is a member of the Independent Directors Council (IDC) Governing Council (2010-present) and Board of Directors for The Brookville Center for Children's Services, Inc. (2009-present). |
Alan J. Lacy (1953) |
Year of Election or Appointment: 2008 Trustee |
| Mr. Lacy also serves as Trustee of other Fidelity funds. Mr. Lacy serves as Senior Adviser (2007-present) of Oak Hill Capital Partners, L.P. (private equity). Mr. Lacy also served as Chief Executive Officer (2000-2005) and Vice Chairman (2005-2006) of Sears Holdings Corporation and Sears, Roebuck and Co. (retail). In addition, Mr. Lacy serves as a member of the Board of Directors of Dave & Buster's Entertainment, Inc. (restaurant and entertainment complexes, 2010-present), Earth Fare, Inc. (retail grocery, 2012-present), The Hillman Companies, Inc. (hardware wholesalers, 2010-present), and Bristol-Myers Squibb Company (global pharmaceuticals, 2008-present). Mr. Lacy is a member of the Board of Trustees of The National Parks Conservation Association (2006-present). Previously, Mr. Lacy served as Chairman of the Board of Trustees of the National Parks Conservation Association (2008-2011) and as a member of the Board of Directors for the Western Union Company (global money transfer, 2006-2011). |
Ned C. Lautenbach (1944) |
Year of Election or Appointment: 2000 Trustee Chairman of the Independent Trustees |
| Mr. Lautenbach also serves as Trustee of other Fidelity funds. Mr. Lautenbach currently serves as the Lead Director of the Eaton Corporation Board of Directors (diversified industrial, 1997-present). Mr. Lautenbach is Chairman of the Board of Directors of the Philharmonic Center for the Arts in Naples, Florida (2012-present) and a member of the Council on Foreign Relations (1994-present). Previously, Mr. Lautenbach was a Partner/Advisory Partner at Clayton, Dubilier & Rice, LLC (private equity investment, 1998-2010), as well as a Director of Sony Corporation (2006-2007). |
Joseph Mauriello (1944) |
Year of Election or Appointment: 2008 Trustee |
| Mr. Mauriello also serves as Trustee of other Fidelity funds. Prior to his retirement in January 2006, Mr. Mauriello served in numerous senior management positions including Deputy Chairman and Chief Operating Officer (2004-2005), and Vice Chairman of Financial Services (2002-2004) of KPMG LLP US (professional services, 1965-2005). Mr. Mauriello currently serves as a member of the Board of Directors of XL Group plc. (global insurance and re-insurance, 2006-present). Previously, Mr. Mauriello served as a Director of the Hamilton Funds of the Bank of New York (2006-2007) and of Arcadia Resources Inc. (health care services and products, 2007-2012). |
Robert W. Selander (1950) |
Year of Election or Appointment: 2011 Trustee |
| Mr. Selander also serves as Trustee of other Fidelity funds. Previously, Mr. Selander served as a Member of the Advisory Board of other Fidelity funds (2011), and Executive Vice Chairman (2010), Chief Executive Officer (2009-2010), and President and Chief Executive Officer (1997-2009) of Mastercard, Inc. |
Cornelia M. Small (1944) |
Year of Election or Appointment: 2005 Trustee |
| Ms. Small also serves as Trustee of other Fidelity funds. Ms. Small is a member of the Board of Directors (2009-present) and Chair of the Investment Committee (2010-present) of the Teagle Foundation. Ms. Small also serves on the Investment Committee of the Berkshire Taconic Community Foundation (2008-present). Previously, Ms. Small served as Chairperson (2002-2008) and a member of the Investment Committee and Chairperson (2008-2012) and a member of the Board of Trustees of Smith College. In addition, Ms. Small served as Chief Investment Officer, Director of Global Equity Investments, and a member of the Board of Directors of Scudder, Stevens & Clark and Scudder Kemper Investments. |
William S. Stavropoulos (1939) |
Year of Election or Appointment: 2001 Trustee Vice Chairman of the Independent Trustees |
| Mr. Stavropoulos also serves as Trustee of other Fidelity funds. Mr. Stavropoulos serves as President and Founder of the Michigan Baseball Foundation, the Great Lakes Loons (2007-present). Mr. Stavropoulos is Chairman Emeritus of the Board of Directors of The Dow Chemical Company, where he previously served in numerous senior management positions, including President, CEO (1995-2000; 2002-2004), Chairman of the Executive Committee (2000-2006), and as a member of the Board of Directors (1990-2006). Currently, Mr. Stavropoulos is Chairman of the Board of Directors of Univar Inc. (global distributor of commodity and specialty chemicals), a Director of Teradata Corporation (data warehousing and technology solutions), and Maersk Inc. (industrial conglomerate), and a member of the Advisory Board for Metalmark Capital LLC (private equity investment, 2005-present). Mr. Stavropoulos is an operating advisor to Clayton, Dubilier & Rice, LLC (private equity investment). In addition, Mr. Stavropoulos is a member of the University of Notre Dame Advisory Council for the College of Science, a Trustee of the Rollin L. Gerstacker Foundation, and a Director of the Naples Philharmonic Center for the Arts. Previously, Mr. Stavropoulos served as a Director of Chemical Financial Corporation (bank holding company, 1993-2012) and Tyco International, Ltd. (multinational manufacturing and services, 2007-2012). |
David M. Thomas (1949) |
Year of Election or Appointment: 2008 Trustee |
| Mr. Thomas also serves as Trustee of other Fidelity funds. Mr. Thomas serves as Non-Executive Chairman of the Board of Directors of Fortune Brands Home and Security (home and security products, 2011-present), and as a member of the Board of Directors of Interpublic Group of Companies, Inc. (marketing communication, 2004-present). Previously, Mr. Thomas served as Executive Chairman (2005-2006) and Chairman and Chief Executive Officer (2000-2005) of IMS Health, Inc. (pharmaceutical and healthcare information solutions), and a Director of Fortune Brands, Inc. (consumer products, 2000-2011). |
+ The information above includes each Trustee's principal occupation during the last five years and other information relating to the experience, attributes, and skills relevant to each Trustee's qualifications to serve as a Trustee, which led to the conclusion that each Trustee should serve as a Trustee for the fund.
Advisory Board Member and Officers:
Correspondence intended for each officer and Peter S. Lynch may be sent to Fidelity Investments, 245 Summer Street, Boston, Massachusetts 02210. Officers appear below in alphabetical order.
Name, Year of Birth; Principal Occupation |
Peter S. Lynch (1944) |
Year of Election or Appointment: 2003 Member of the Advisory Board |
| Mr. Lynch also serves as Member of the Advisory Board of other Fidelity funds. Mr. Lynch is Vice Chairman and a Director of FMR and FMR Co., Inc. In addition, Mr. Lynch serves as a Trustee of Boston College and as the Chairman of the Inner-City Scholarship Fund. Previously, Mr. Lynch served on the Special Olympics International Board of Directors (1997-2006). |
Elizabeth Paige Baumann (1968) |
Year of Election or Appointment: 2012 Anti-Money Laundering (AML) Officer |
| Ms. Baumann also serves as AML Officer of other funds. She is Chief AML Officer of FMR LLC (2012-present) and is an employee of Fidelity Investments. Previously, Ms. Baumann served as Vice President and Deputy Anti-Money Laundering Officer (2007-2012). |
William C. Coffey (1969) |
Year of Election or Appointment: 2009 Assistant Secretary |
| Mr. Coffey also serves as Assistant Secretary of other funds. He is Senior Vice President and Deputy General Counsel of FMR LLC (2010-present), and is an employee of Fidelity Investments. Previously, Mr. Coffey served as Vice President and Associate General Counsel of FMR LLC (2005-2009). |
Timothy M. Cohen (1969) |
Year of Election or Appointment: 2014 Vice President of certain Equity Funds |
| Mr. Cohen also serves as Vice President of other funds. Mr. Cohen serves as a Director and Chief Compliance Officer of Fidelity Management & Research (U.K.) Inc. (2013-present) and is an employee of Fidelity Investments. |
Jonathan Davis (1968) |
Year of Election or Appointment: 2010 Assistant Treasurer |
| Mr. Davis also serves as Assistant Treasurer of other funds. Mr. Davis is an employee of Fidelity Investments. Previously, Mr. Davis served as Vice President and Associate General Counsel of FMR LLC (2003-2010). |
Adrien E. Deberghes (1967) |
Year of Election or Appointment: 2008 Deputy Treasurer |
| Mr. Deberghes also serves as an officer of other funds. He is an employee of Fidelity Investments (2008-present). Prior to joining Fidelity Investments, Mr. Deberghes was Senior Vice President of Mutual Fund Administration at State Street Corporation (2007-2008), Senior Director of Mutual Fund Administration at Investors Bank & Trust (2005-2007), and Director of Finance for Dunkin' Brands (2000-2005). |
Stephanie J. Dorsey (1969) |
Year of Election or Appointment: 2010 Assistant Treasurer |
| Ms. Dorsey also serves as an officer of other funds. She is an employee of Fidelity Investments (2008-present) and has served in other fund officer roles. Prior to joining Fidelity Investments, Ms. Dorsey served as Treasurer (2004-2008) of the JPMorgan Mutual Funds and Vice President (2004-2008) of JPMorgan Chase Bank. |
Howard J. Galligan III (1966) |
Year of Election or Appointment: 2014 Chief Financial Officer |
| Mr. Galligan also serves as Chief Financial Officer of other funds. Mr. Galligan serves as President of Fidelity Pricing and Cash Management Services (FPCMS) (2014-present) and as a Director of Strategic Advisers, Inc. (2008-present). Previously, Mr. Galligan served as Chief Administrative Officer of Asset Management (2011-2014) and Chief Operating Officer and Senior Vice President of Investment Support for Strategic Advisers, Inc. (2003-2011). |
Scott C. Goebel (1968) |
Year of Election or Appointment: 2008 Secretary and Chief Legal Officer (CLO) |
| Mr. Goebel serves as Secretary and CLO of other funds. Mr. Goebel also serves as Secretary of Fidelity SelectCo, LLC (2013-present), Fidelity Investments Money Management, Inc. (FIMM) (2010-present) and Fidelity Research and Analysis Company (FRAC) (2010-present); General Counsel, Secretary, and Senior Vice President of FMR (2008-present) and FMR Co., Inc. (2008-present); Chief Legal Officer of Fidelity Management & Research (Hong Kong) Limited (2008-present); and Assistant Secretary of Fidelity Management & Research (Japan) Limited (2008-present) and Fidelity Management & Research (U.K.) Inc. (2008-present). Previously, Mr. Goebel served as Secretary and CLO of other Fidelity funds (2008-2013), Assistant Secretary of FIMM (2008-2010), FRAC (2008-2010), and certain funds (2007-2008); and as Vice President and Secretary of Fidelity Distributors Corporation (FDC) (2005-2007). Mr. Goebel has been employed by FMR LLC or an affiliate since 2001. |
Brian B. Hogan (1964) |
Year of Election or Appointment: 2009 Vice President |
| Mr. Hogan also serves as Trustee or Vice President of other funds. Mr. Hogan serves as a Director of Fidelity Select Co, LLC (2014-present) and President of FMR's Equity Division (2009-present). Previously, Mr. Hogan served as Senior Vice President, Equity Research of FMR (2006-2009) and as a portfolio manager. |
Chris Maher (1972) |
Year of Election or Appointment: 2013 Assistant Treasurer |
| Mr. Maher serves as Assistant Treasurer of other funds. Mr. Maher is Vice President of Valuation Oversight and is an employee of Fidelity Investments. Previously, Mr. Maher served as Vice President of Asset Management Compliance (2013), Vice President of FMR's Program Management Group (2010-2013), and Vice President of Valuation Oversight (2008-2010). |
Kenneth B. Robins (1969) |
Year of Election or Appointment: 2008 President and Treasurer |
| Mr. Robins also serves as an officer of other funds. Mr. Robins serves as Executive Vice President of Fidelity Investments Money Management, Inc. (FIMM) (2013-present) and is an employee of Fidelity Investments (2004-present). Previously, Mr. Robins served in other fund officer roles. |
Stephen Sadoski (1971) |
Year of Election or Appointment: 2012 Deputy Treasurer |
| Mr. Sadoski also serves as Deputy Treasurer of other funds. He is an employee of Fidelity Investments (2012-present) and has served in another fund officer role. Prior to joining Fidelity Investments, Mr. Sadoski served as an assistant chief accountant in the Division of Investment Management of the Securities and Exchange Commission (SEC) (2009-2012) and as a senior manager at Deloitte & Touche LLP (1997-2009). |
Stacie M. Smith (1974) |
Year of Election or Appointment: 2013 Deputy Treasurer |
| Ms. Smith also serves as an officer of other funds. She is an employee of Fidelity Investments (2009-present) and has served in other fund officer roles. Prior to joining Fidelity Investments, Ms. Smith served as Senior Audit Manager of Ernst & Young LLP (1996-2009). |
Renee Stagnone (1975) |
Year of Election or Appointment: 2013 Deputy Treasurer |
| Ms. Stagnone also serves as Deputy Treasurer of other funds. Ms. Stagnone is an employee of Fidelity Investments. |
Linda J. Wondrack (1964) |
Year of Election or Appointment: 2014 Chief Compliance Officer |
| Ms. Wondrack also serves as Chief Compliance Officer of other funds. Ms. Wondrack is Executive Vice President and head of the Ethics Office and Asset Management Compliance for Fidelity Investments (2012-present). Ms. Wondrack also serves as Chief Compliance Officer of Fidelity SelectCo, LLC (2014-present); Chief Compliance Officer of Impresa Management LLC (2013-present); and Chief Compliance Officer of FMR Co., Inc., Fidelity Investments Money Management, Inc., Fidelity Management & Research (Japan) Limited, Fidelity Management & Research (U.K.) Inc., Fidelity Management & Research (Hong Kong), Fidelity Management & Research Company, Pyramis Global Advisors, LLC, and Strategic Advisers, Inc., Ballyrock Investment Advisors LLC, and Northern Neck Investors LLC (2012-present). Previously, Ms. Wondrack served as Senior Vice President and Chief Compliance Officer for Columbia Management Investment Advisers, LLC (2005-2012); Chief Compliance Officer for certain funds within the Columbia Family of Funds (2007-2012); and Senior Vice President of Compliance Risk Management at Bank of America (2005-2010). |
Joseph F. Zambello (1957) |
Year of Election or Appointment: 2011 Deputy Treasurer |
| Mr. Zambello also serves as Deputy Treasurer of other funds. Mr. Zambello is an employee of Fidelity Investments. Previously, Mr. Zambello served as Vice President of FMR's Program Management Group (2009-2011) and Vice President of the Transfer Agent Oversight Group (2005-2009). |
Annual Report
Class Z designates 1% of the dividend distributed during the fiscal year as qualifying for the dividends-received deduction for corporate shareholders.
Class Z designates 63% of the dividend during the fiscal year as amounts which may be taken into account as a dividend for the purposes of the maximum rate under section 1(h)(11) of the Internal Revenue Code.
The amounts per share which represent income derived from sources within, and taxes paid to, foreign countries or possessions of the United States are as follows:
| Pay Date | Income | Taxes |
Class Z | 12/09/13 | $0.4497 | $0.0365 |
The fund will notify shareholders in January 2015 of amounts for use in preparing 2014 income tax returns.
Annual Report
Board Approval of Investment Advisory Contracts and Management Fees
Fidelity International Discovery Fund
Each year, the Board of Trustees, including the Independent Trustees (together, the Board), votes on the renewal of the management contract with Fidelity Management & Research Company (FMR) and the sub-advisory agreements (together, the Advisory Contracts) for the fund. The Board, assisted by the advice of fund counsel and Independent Trustees' counsel, requests and considers a broad range of information relevant to the renewal of the Advisory Contracts throughout the year.
The Board meets regularly and, at each of its meetings, covers an extensive agenda of topics and materials and considers factors that are relevant to its annual consideration of the renewal of the fund's Advisory Contracts, including the services and support provided to the fund and its shareholders. The Board has established various standing committees (Committees), each composed of and chaired by Independent Trustees with varying backgrounds, to which the Board has assigned specific subject matter responsibilities in order to enhance effective decision-making by the Board. The Board, acting directly and through its Committees, requests and receives information concerning the annual consideration of the renewal of the fund's Advisory Contracts. The Board also meets as needed to consider matters specifically related to the Board's annual consideration of the renewal of the Advisory Contracts. Members of the Board may also meet with trustees of other Fidelity funds through ad hoc joint committees to discuss certain matters relevant to the Fidelity funds.
At its July 2014 meeting, the Board, including the Independent Trustees, unanimously determined to renew the fund's Advisory Contracts. In reaching its determination, the Board considered all factors it believed relevant, including (i) the nature, extent, and quality of the services to be provided to the fund and its shareholders (including the investment performance of the fund); (ii) the competitiveness of the fund's management fee and total expense ratio relative to peer funds; (iii) the total costs of the services to be provided by and the profits to be realized by Fidelity from its relationship with the fund; (iv) the extent to which economies of scale exist and would be realized as the fund grows; and (v) whether fee levels reflect these economies of scale, if any, for the benefit of fund shareholders. In connection with separate internal corporate reorganizations involving Fidelity Management & Research (U.K.) Inc. (FMR U.K.) and Fidelity Management & Research (Japan) Inc. (FMR Japan), the Board approved certain non-material amendments to the fund's sub-advisory agreements with FMR U.K. and FMR Japan to reflect that, after these reorganizations, FMR Investment Management (UK) Limited and Fidelity Management & Research (Japan) Limited will carry on the business of FMR U.K. and FMR Japan, respectively. The Board noted that no changes to the portfolio managers or to the foreign research or investment advisory services provided to the fund were expected in connection with either reorganization and that the same personnel and resources would continue to be available to the fund at the new entities.
Annual Report
In considering whether to renew the Advisory Contracts for the fund, the Board reached a determination, with the assistance of fund counsel and Independent Trustees' counsel and through the exercise of its business judgment, that the renewal of the Advisory Contracts was in the best interests of the fund and its shareholders and that the compensation payable under the Advisory Contracts was fair and reasonable. The Board's decision to renew the Advisory Contracts was not based on any single factor, but rather was based on a comprehensive consideration of all the information provided to the Board at its meetings throughout the year. The Board, in reaching its determination to renew the Advisory Contracts, was aware that shareholders of the fund have a broad range of investment choices available to them, including a wide choice among funds offered by Fidelity's competitors, and that the fund's shareholders, who have the opportunity to review and weigh the disclosure provided by the fund in its prospectus and other public disclosures, have chosen to invest in this fund, which is part of the Fidelity family of funds.
Nature, Extent, and Quality of Services Provided. The Board considered Fidelity's staffing as it relates to the fund, including the backgrounds of investment personnel of FMR and the sub-advisers (together, the Investment Advisers), and also considered the fund's investment objective, strategies, and related investment philosophy. The Independent Trustees also had discussions with senior management of Fidelity's investment operations and investment groups. The Board considered the structure of the portfolio manager compensation program and whether this structure provides appropriate incentives to act in the best interests of the fund. Additionally, the Board considered the portfolio managers' investments, if any, in the funds that they manage.
Resources Dedicated to Investment Management and Support Services. The Board and the Fund Oversight and Research Committees reviewed the general qualifications and capabilities of Fidelity's investment staff, including its size, education, experience, and resources, as well as Fidelity's approach to recruiting, training, managing, and compensating investment personnel. The Board noted that Fidelity has continued to increase the resources devoted to non-U.S. offices, including expansion of Fidelity's global investment organization. The Board also noted that Fidelity's analysts have extensive resources, tools and capabilities that allow them to conduct sophisticated quantitative and fundamental analysis, as well as credit analysis of issuers, counterparties and guarantors. Further, the Board believes that Fidelity's investment professionals have sufficient access to global information and data so as to provide competitive investment results over time, and that those professionals also have access to sophisticated tools that permit them to assess portfolio construction and risk and performance attribution characteristics continuously, as well as to transmit new information and research conclusions rapidly around the world. Additionally, in its deliberations, the Board considered Fidelity's trading and risk management capabilities and resources and global compliance infrastructure, which are an integral part of the investment management process.
Annual Report
Board Approval of Investment Advisory Contracts and
Management Fees - continued
Shareholder and Administrative Services. The Board considered (i) the nature, extent, quality, and cost of advisory, administrative, and shareholder services performed by the Investment Advisers and their affiliates under the Advisory Contracts and under separate agreements covering transfer agency, pricing and bookkeeping, and securities lending services for the fund; (ii) the nature and extent of the supervision of third party service providers, principally custodians and subcustodians; and (iii) the resources devoted to, and the record of compliance with, the fund's compliance policies and procedures. The Board also reviewed the allocation of fund brokerage, including allocations to brokers affiliated with the Investment Advisers, the use of brokerage commissions to pay fund expenses, and the use of "soft" commission dollars to pay for research services.
The Board noted that the growth of fund assets over time across the complex allows Fidelity to reinvest in the development of services designed to enhance the value or convenience of the Fidelity funds as investment vehicles. These services include 24-hour access to account information and market information through telephone representatives and over the Internet, investor education materials and asset allocation tools, and the expanded availability of Fidelity Investor Centers.
In 2014, the Board formed an ad hoc Committee on Transfer Agency Fees to review the variety of transfer agency fee structures throughout the industry and Fidelity's competitive positioning with respect to industry participants.
Investment in a Large Fund Family. The Board considered the benefits to shareholders of investing in a Fidelity fund, including the benefits of investing in a fund that is part of a large family of funds offering a variety of investment disciplines and providing a large variety of mutual fund investor services. The Board noted that Fidelity had taken, or had made recommendations that resulted in the Fidelity funds taking, a number of actions over the previous year that benefited particular funds, including (i) continuing to dedicate additional resources to investment research and to the support of the senior management team that oversees asset management; (ii) persisting in efforts to enhance Fidelity's global research capabilities; (iii) launching new funds and making other enhancements to meet client needs for income-oriented solutions; (iv) reducing fund expenses for certain index funds; (v) continuing to launch dedicated lower cost underlying funds to meet portfolio construction needs related to expanding underlying fund options for Fidelity funds of funds, specifically for the Freedom Fund product lines; (vi) rationalizing product lines and gaining increased efficiencies through fund mergers; (vii) launching sector-based exchange-traded funds and establishing a new Fidelity adviser to manage sector-based funds and products; (viii) continuing to develop and implement technology to improve security and increase efficiency; (ix) modifying the eligibility criteria for certain share classes to increase their marketability to a portion of the defined contribution plan market; (x) waiving redemption fees for certain qualified fund-of-fund and wrap programs and certain retirement plan transactions; and (xi) launching new Institutional Class shares of certain money market funds to attract and retain assets and to fill a gap in the money market fund lineup.
Annual Report
Investment Performance. The Board considered whether the fund has operated in accordance with its investment objective, as well as its record of compliance with its investment restrictions and its performance history.
The Board took into account discussions with the Investment Advisers about fund investment performance that occur at Board meetings throughout the year. In this regard the Board noted that as part of regularly scheduled fund reviews and other reports to the Board on fund performance, the Board periodically considers annualized return information for the fund, for different time periods, measured against a securities market index ("benchmark index") and a peer group of funds with similar objectives ("peer group"). In its evaluation of fund investment performance, the Board gave particular attention to information indicating changes in performance of certain Fidelity funds for specific time periods and the Investment Advisers' explanations for any overperformance or underperformance.
In addition to reviewing absolute and relative fund performance, the Independent Trustees periodically consider the appropriateness of fund performance metrics in evaluating the results achieved. In general, the Independent Trustees believe that fund performance should be evaluated based on net performance (after fees and expenses) of both the highest performing and lowest performing classes, where applicable, compared to appropriate benchmark indices, over appropriate time periods which may include full market cycles, and compared to peer groups, as applicable, over the same periods, taking into account relevant factors including the following: general market conditions; issuer-specific information; tactical opportunities for investment; and fund cash flows and other factors.
The Independent Trustees recognize that shareholders evaluate performance on a net basis over their own holding periods, for which one-, three-, and five-year periods are often used as a proxy. For this reason, the performance information reviewed by the Board also included net cumulative calendar year total return information for the fund and an appropriate benchmark index and peer group for the most recent one-, three-, and five-year periods, as shown below. Returns are shown compared to the 25th percentile (top of box, 75% beaten) and 75th percentile (bottom of box, 25% beaten) of the peer universe. Returns of the benchmark index are "net MA," i.e., adjusted for tax withholding rates applicable to U.S.-based funds organized as Massachusetts business trusts.
Annual Report
Board Approval of Investment Advisory Contracts and
Management Fees - continued
Fidelity International Discovery Fund

The Board also considered that the fund's management fee is subject to upward or downward adjustment depending upon whether, and to what extent, the fund's investment performance for the performance period exceeds, or is exceeded by, a securities index, thus leading to a performance adjustment for the same period. The Board noted that the performance adjustment provides FMR with a strong economic incentive to seek to achieve superior performance for the fund's shareholders and helps to more closely align the interests of FMR and the fund's shareholders.
Based on its review, the Board concluded that the nature, extent, and quality of services provided to the fund under the Advisory Contracts should benefit the fund's shareholders.
Competitiveness of Management Fee and Total Expense Ratio. The Board considered the fund's management fee and total expense ratio compared to "mapped groups" of competitive funds and classes. Fidelity creates "mapped groups" by combining similar Lipper investment objective categories that have comparable investment mandates. Combining Lipper investment objective categories aids the Board's management fee and total expense ratio comparisons by broadening the competitive group used for comparison and by reducing the number of universes to which various Fidelity funds are compared.
Management Fee. The Board considered two proprietary management fee comparisons for the 12-month periods shown in the chart below. The group of Lipper funds used by the Board for management fee comparisons is referred to below as the "Total Mapped Group." The Total Mapped Group comparison focuses on a fund's standing in terms of gross management fees before expense reimbursements or caps, and without giving effect to the fund's performance adjustment, relative to the total universe of funds with comparable investment mandates, regardless of whether their management fee structures also are comparable. Funds with comparable investment mandates offer exposure to similar types of securities. Funds with comparable management fee structures have similar management fee contractual arrangements (e.g., flat rate charged for advisory services, all-inclusive fee rate, etc.). "TMG %" represents the percentage of funds in the Total Mapped Group that had management fees that were lower than the fund's. For example, a hypothetical TMG % of 20% would mean that 80% of the funds in the Total Mapped Group had higher, and 20% had lower, management fees than the fund. The fund's actual TMG %s are in the chart below. The "Asset-Size Peer Group" (ASPG) comparison focuses on a fund's standing relative to a subset of non-Fidelity funds within the Total Mapped Group that are similar in size and management fee structure. For example, if a fund is in the first quartile of the ASPG, the fund's management fee ranks in the least expensive or lowest 25% of funds in the ASPG. The ASPG represents at least 15% of the funds in the Total Mapped Group with comparable asset size and management fee structures, subject to a minimum of 50 funds (or all funds in the Total Mapped Group if fewer than 50). Additional information, such as the ASPG quartile in which the fund's management fee rate ranked and the impact of the fund's performance adjustment, is also included in the chart and considered by the Board.
Annual Report
Fidelity International Discovery Fund

The Board noted that the fund's management fee rate ranked below the median of its Total Mapped Group and below the median of its ASPG for 2013. The Board also noted the effect of the fund's positive performance adjustment on the fund's management fee ranking.
Annual Report
Board Approval of Investment Advisory Contracts and
Management Fees - continued
Furthermore, the Board considered that, on July 16, 2014, after the periods shown in the chart above, it had approved a reduction (effective August 1, 2014) in the individual fund fee rate component of the management fee rate for the fund from 0.450% to 0.424%.
The Board also noted that, in August 2013, the ad hoc Committee on Management Fees was formed to conduct an in-depth review of the management fee rates of Fidelity's active equity mutual funds. The Committee focused on the following areas: (i) standard fee structures; (ii) research consumption and trading evolution; (iii) management fee competitiveness/profitability by category; and (iv) factors that drive institutional pricing.
Based on its review, the Board concluded that the fund's management fee is fair and reasonable in light of the services that the fund receives and the other factors considered.
Total Expense Ratio. In its review of each class's total expense ratio, the Board considered the fund's management fee as well as other fund or class expenses, as applicable, such as transfer agent fees, pricing and bookkeeping fees, fund-paid 12b-1 fees, and custodial, legal, and audit fees. The Board also noted the effects of any waivers and reimbursements on fees and expenses, as well as the impact of the fund's performance adjustment. As part of its review, the Board also considered the current and historical total expense ratios of each class of the fund compared to competitive fund median expenses. Each class of the fund is compared to those funds and classes in the Total Mapped Group (used by the Board for management fee comparisons) that have a similar sales load structure.
The Board noted that the total expense ratio of each of Class A, Class B, Class C, Institutional Class, Class Z, the retail class, and Class K ranked below its competitive median for 2013 and the total expense ratio of Class T ranked above its competitive median for 2013. The Board considered that, in general, various factors can affect total expense ratios. The Board noted that the total expense ratio of Class T was above the competitive median primarily because of higher 12b-1 fees on Class T as compared to most competitor funds. Class T has a higher 12b-1 fee, but a lower front-end sales charge, than traditionally priced front-end sales charge classes. The Board considered that Class T is primarily sold load-waived in the retirement plan market where its 0.50% 12b-1 fee is comparable to competing no-load, higher 12b-1 fee classes designed specifically for retirement plans. The Board noted that the fund offers multiple classes, each of which has a different sales load and 12b-1 fee structure, and that the multiple structures are intended to offer a range of pricing options for the intermediary market. The Board also noted that the total expense ratios of the classes vary primarily by the level of their 12b-1 fees, although differences in transfer agent fees may also cause expenses to vary from class to class.
Annual Report
Fees Charged to Other Fidelity Clients. The Board also considered Fidelity fee structures and other information with respect to clients of Fidelity, such as other funds advised or subadvised by Fidelity, pension plan clients, and other institutional clients. The Board noted the findings of the 2013 ad hoc joint committee (created with the board of other Fidelity funds), which reviewed and compared Fidelity's institutional investment advisory business with its business of providing services to the Fidelity funds, including the differences in services provided, fees charged, and costs incurred, as well as competition in their respective marketplaces.
Based on its review of total expense ratios and fees charged to other Fidelity clients, the Board concluded that the total expense ratio of each class of the fund was reasonable, although Class T was above the median of the universe presented for comparison, in light of the services that the fund and its shareholders receive and the other factors considered.
Costs of the Services and Profitability. The Board considered the revenues earned and the expenses incurred by Fidelity in conducting the business of developing, marketing, distributing, managing, administering and servicing the fund and servicing the fund's shareholders. The Board also considered the level of Fidelity's profits in respect of all the Fidelity funds.
On an annual basis, Fidelity presents to the Board Fidelity's profitability for the fund. Fidelity calculates the profitability for each fund, as well as aggregate profitability for groups of Fidelity funds and all Fidelity funds, using a series of detailed revenue and cost allocation methodologies which originate with the books and records of Fidelity on which Fidelity's audited financial statements are based. The Audit Committee of the Board reviews any significant changes from the prior year's methodologies.
PricewaterhouseCoopers LLP (PwC), independent registered public accounting firm and auditor to Fidelity and certain Fidelity funds, has been engaged annually by the Board as part of the Board's assessment of Fidelity's profitability analysis. PwC's engagement includes the review and assessment of the methodologies used by Fidelity in determining the revenues and expenses attributable to Fidelity's mutual fund business, and completion of agreed-upon procedures in respect of the mathematical accuracy of fund profitability and its conformity to established allocation methodologies. After considering PwC's reports issued under the engagement and information provided by Fidelity, the Board concluded that while other allocation methods may also be reasonable, Fidelity's profitability methodologies are reasonable in all material respects.
The Board also reviewed Fidelity's non-fund businesses and fall-out benefits related to the mutual fund business as well as cases where Fidelity's affiliates may benefit from or be related to the fund's business.
Annual Report
Board Approval of Investment Advisory Contracts and
Management Fees - continued
The Board considered the costs of the services provided by and the profits realized by Fidelity in connection with the operation of the fund and was satisfied that the profitability was not excessive in the circumstances.
Economies of Scale. The Board considered whether there have been economies of scale in respect of the management of the Fidelity funds, whether the Fidelity funds (including the fund) have appropriately benefited from any such economies of scale, and whether there is potential for realization of any further economies of scale. The Board considered the extent to which the fund will benefit from economies of scale through increased services to the fund, through waivers or reimbursements, or through fee or expense ratio reductions. The Board also noted that in 2013, it and the boards of other Fidelity funds created an ad hoc committee (the Economies of Scale Committee) to analyze whether Fidelity attains economies of scale in respect of the management and servicing of the Fidelity funds, whether the Fidelity funds have appropriately benefited from such economies of scale, and whether there is potential for realization of any further economies of scale.
The Board recognized that the fund's management contract incorporates a "group fee" structure, which provides for lower group fee rates as total group assets increase, and for higher group fee rates as total group assets decrease (with "group assets" defined to include fund assets under FMR's management plus sector fund assets previously under FMR's management and currently managed by Fidelity SelectCo, LLC). FMR calculates the group fee rates based on a tiered asset "breakpoint" schedule that varies based on asset class. The Board considered that the group fee is designed to deliver the benefits of economies of scale to fund shareholders when total Fidelity fund assets increase, even if assets of any particular fund are unchanged or have declined, because some portion of Fidelity's costs are attributable to services provided to all Fidelity funds, and all funds benefit if those costs can be allocated among more assets. The Board concluded that, given the group fee structure, fund shareholders will benefit from lower management fees as group assets increase at the fund complex level, regardless of whether Fidelity achieves any such economies of scale.
The Board concluded, taking into account the analysis of the Economies of Scale Committee, that economies of scale, if any, are being appropriately shared between fund shareholders and Fidelity.
Additional Information Requested by the Board. In order to develop fully the factual basis for consideration of the Fidelity funds' Advisory Contracts, the Board requested and received additional information on certain topics, including: (i) fund performance trends and Fidelity's long-term strategies for certain funds; (ii) Fidelity's strategic marketing and product lineup goals; (iii) the methodology with respect to competitive fund data and peer group classifications; (iv) the arrangements with, and performance of, certain sub-advisers on behalf of the Fidelity funds, as well as certain proposed participating affiliate arrangements; (v) the realization of fall-out benefits in certain Fidelity business units; (vi) Fidelity's group fee structures, including the rationale for the individual fee rates of certain categories of funds and the definition of group assets; (vii) trends regarding industry use of performance fee structures and the performance adjustment methodologies applicable to the Fidelity funds; (viii) additional competitive analysis regarding the total expenses for certain classes; (ix) fund profitability methodology, including Fidelity's cost allocation methodology, and the impact of certain factors on fund profitability results; and (x) the process by which Fidelity determines sub-advisory fees for funds it advises.
Annual Report
Based on its evaluation of all of the conclusions noted above, and after considering all factors it believed relevant, the Board ultimately concluded that the advisory fee structures are fair and reasonable, and that the fund's Advisory Contracts should be renewed.
Annual Report
Investment Adviser
Fidelity Management & Research Company
Boston, MA
Investment Sub-Advisers
FMR Co., Inc.
Fidelity Management & Research
(U.K.) Inc.
FIL Investment Advisors
FIL Investments (Japan) Limited
FIL Investment Advisors (UK) Limited
Fidelity Management & Research
(Hong Kong) Limited
Fidelity Management & Research
(Japan) Limited
General Distributor
Fidelity Distributors Corporation
Smithfield, RI
Transfer and Service Agents
Fidelity Investments Institutional Operations Company, Inc.
Boston, MA
Fidelity Service Company, Inc.
Boston, MA
Custodian
The Northern Trust Company
Chicago, IL
(Fidelity Investment logo)(registered trademark)
AIDZ-UANN-1214
1.9585031.101
Fidelity®
International Discovery
Fund
Annual Report
October 31, 2014
(Fidelity Cover Art)
Contents
Performance | (Click Here) | How the fund has done over time. |
Management's Discussion of Fund Performance | (Click Here) | The Portfolio Manager's review of fund performance and strategy. |
Shareholder Expense Example | (Click Here) | An example of shareholder expenses. |
Investment Changes | (Click Here) | A summary of major shifts in the fund's investments over the past six months. |
Investments | (Click Here) | A complete list of the fund's investments with their market values. |
Financial Statements | (Click Here) | Statements of assets and liabilities, operations, and changes in net assets, as well as financial highlights. |
Notes | (Click Here) | Notes to the financial statements. |
Report of Independent Registered Public Accounting Firm | (Click Here) | |
Trustees and Officers | (Click Here) | |
Distributions | (Click Here) | |
Board Approval of Investment Advisory Contracts and Management Fees | (Click Here) | |
To view a fund's proxy voting guidelines and proxy voting record for the 12-month period ended June 30, visit http://www.fidelity.com/proxyvotingresults or visit the Securities and Exchange Commission's (SEC) web site at http://www.sec.gov. You may also call 1-800-544-8544 to request a free copy of the proxy voting guidelines.
Standard & Poor's, S&P and S&P 500 are registered service marks of The McGraw-Hill Companies, Inc. and have been licensed for use by Fidelity Distributors Corporation.
Other third-party marks appearing herein are the property of their respective owners.
All other marks appearing herein are registered or unregistered trademarks or service marks of FMR LLC or an affiliated company. © 2014 FMR LLC. All rights reserved.
Annual Report
This report and the financial statements contained herein are submitted for the general information of the shareholders of the fund. This report is not authorized for distribution to prospective investors in the fund unless preceded or accompanied by an effective prospectus.
A fund files its complete schedule of portfolio holdings with the SEC for the first and third quarters of each fiscal year on Form N-Q. Forms N-Q are available on the SEC's web site at http://www.sec.gov. A fund's Forms N-Q may be reviewed and copied at the SEC's Public Reference Room in Washington, DC. Information regarding the operation of the SEC's Public Reference Room may be obtained by calling 1-800-SEC-0330. For a complete list of a fund's portfolio holdings, view the most recent holdings listing, semiannual report, or annual report on Fidelity's web site at http://www.fidelity.com, http://www.advisor.fidelity.com, or http://www.401k.com, as applicable.
NOT FDIC INSURED • MAY LOSE VALUE • NO BANK GUARANTEE
Neither the fund nor Fidelity Distributors Corporation is a bank.
Annual Report
Average annual total return reflects the change in the value of an investment, assuming reinvestment of the class' distributions from dividend income and capital gains (the profits earned upon the sale of securities that have grown in value, if any) and assuming a constant rate of performance each year. The $10,000 table and the fund's returns do not reflect the deduction of taxes that a shareholder would pay on fund distributions or the redemption of fund shares. During periods of reimbursement by Fidelity, a fund's total return will be greater than it would be had the reimbursement not occurred. How a fund did yesterday is no guarantee of how it will do tomorrow.
Average Annual Total Returns
Periods ended October 31, 2014 | Past 1
year | Past 5
years | Past 10
years |
Fidelity® International Discovery Fund A | -0.01% | 8.08% | 7.04% |
A Prior to October 1, 2004, Fidelity International Discovery Fund operated under certain different investment policies. The fund's historical performance may not represent its current investment policies.
$10,000 Over 10 Years
Let's say hypothetically that $10,000 was invested in Fidelity® International Discovery Fund, a class of the fund, on October 31, 2004. The chart shows how the value of your investment would have changed, and also shows how the MSCI EAFE Index performed over the same period.
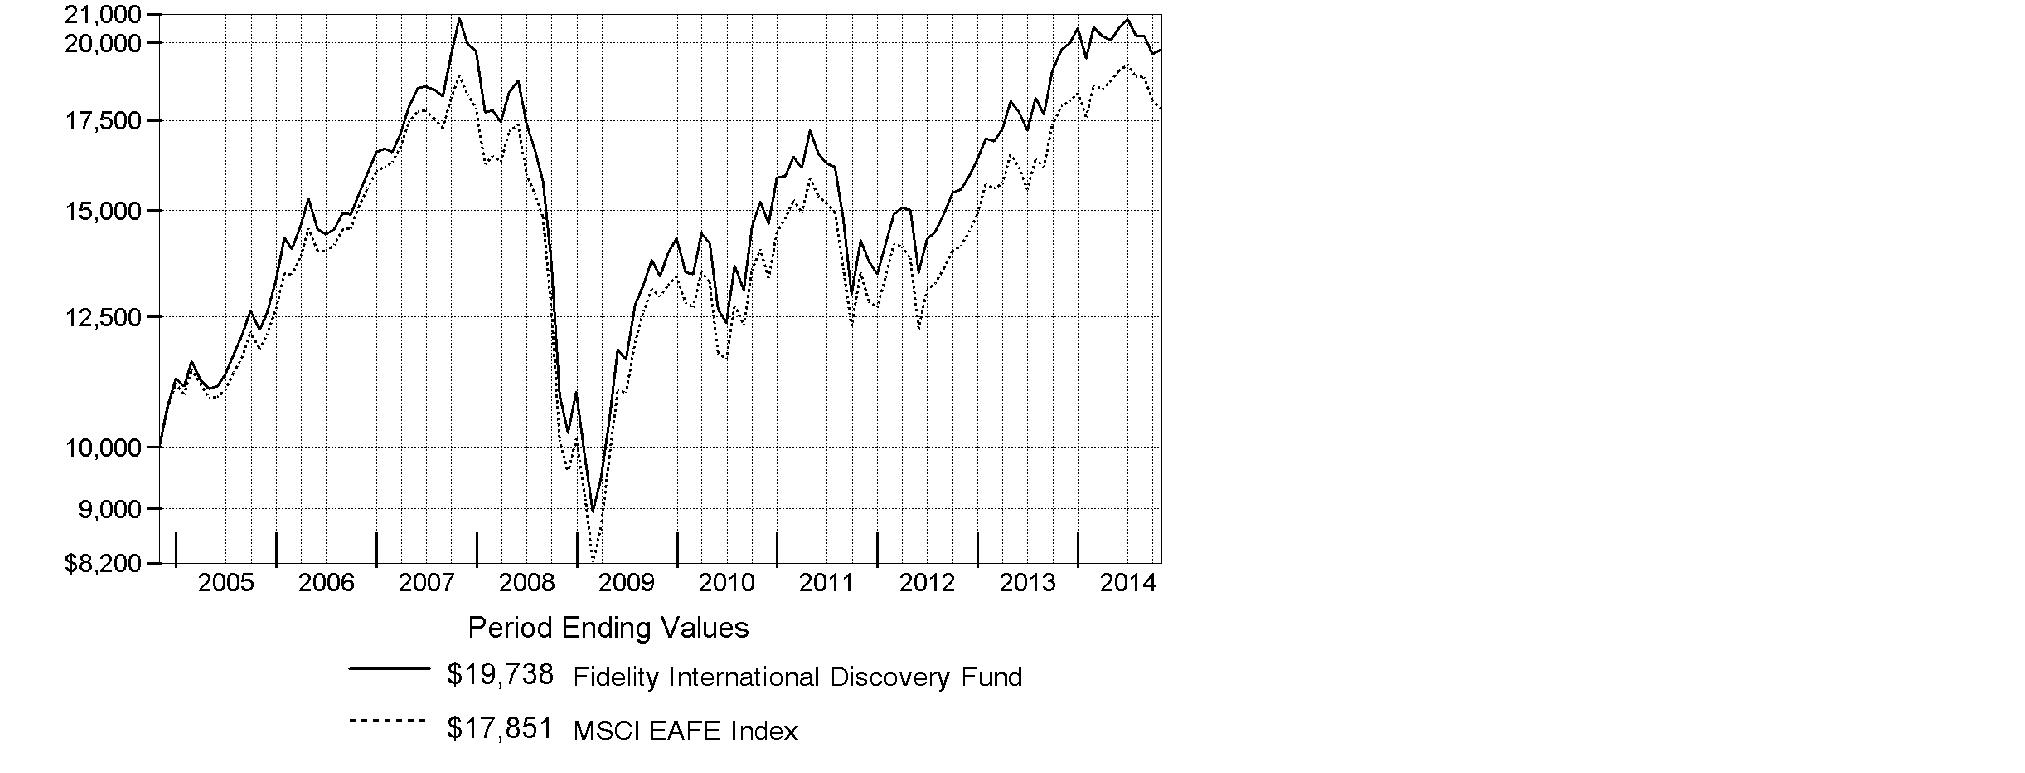
Annual Report
Market Recap: Global equities posted a healthy gain for the 12 months ending October 31, 2014, overcoming an October market decline driven by recessionary pressures in China and tepid growth in Europe. The MSCI ACWI (All Country World Index) Index rose 8.15%, helped by subdued market volatility for much of the period and supported by solid corporate earnings, especially in the United States. Stocks also benefited from easy monetary policies in Japan and the eurozone, as well as increased stimulus efforts in China. All but three of the 24 industry groups that compose the index marked a positive return. The U.S. (+17%) remained a pillar of strength, while a strongly rising dollar in the latter part of the period detracted from investors' returns in most non-U.S. markets. Canada (+5%) notched broad gains outside of its energy and materials sectors, as did Asia-Pacific ex Japan (+4%), led by investor enthusiasm for companies in India. The U.K., Europe and Japan, meanwhile, all underperformed. Among sectors, health care (+24%) led the index, with a strong contribution from the pharmaceuticals, biotechnology & life sciences industry. Information technology (+21%) also outperformed. Conversely, materials (-4%) and energy (-1%) lagged the index due to a higher supply of and lower demand for commodities.
Comments from William Kennedy, Portfolio Manager of Fidelity® International Discovery Fund: For the year, the fund's Retail Class shares returned -0.01%, versus -0.48% for its benchmark, the MSCI EAFE Index. Security selection helped relative performance, particularly in health care, information technology and financials. The fund also benefited from out-of-index investments in the U.S. and emerging markets. Top individual contributors included U.K.-listed Hikma Pharmaceuticals, a Jordan-based company that specializes in injectable drugs. Its stock received a boost from U.S. market-share gains. Shares of pharmaceuticals company Actavis benefited from successful recent acquisitions and the tax advantage of its Ireland domicile. By contrast, security selection in industrials and consumer discretionary and in Europe ex U.K. detracted versus the index. In terms of individual disappointments, not owning Switzerland-based pharmaceuticals giant and index component Novartis hurt relative performance, as the company's strong patent portfolio and product pipeline drove sales growth and the stock gain. An overweighting in ORIX, a high-quality diversified financials conglomerate in Japan, also detracted from results, as the weak local economy pressured near-term earnings growth.
The views expressed above reflect those of the portfolio manager(s) only through the end of the period as stated on the cover of this report and do not necessarily represent the views of Fidelity or any other person in the Fidelity organization. Any such views are subject to change at any time based upon market or other conditions and Fidelity disclaims any responsibility to update such views. These views may not be relied on as investment advice and, because investment decisions for a Fidelity fund are based on numerous factors, may not be relied on as an indication of trading intent on behalf of any Fidelity fund.
Annual Report
Shareholder Expense Example
As a shareholder of the Fund, you incur two types of costs: (1) transaction costs, including sales charges (loads) on purchase payments or redemption proceeds, redemption fees and (2) ongoing costs, including management fees, distribution and/or service (12b-1) fees and other Fund expenses. This Example is intended to help you understand your ongoing costs (in dollars) of investing in the Fund and to compare these costs with the ongoing costs of investing in other mutual funds.
The Example is based on an investment of $1,000 invested at the beginning of the period and held for the entire period (May 1, 2014 to October 31, 2014).
Actual Expenses
The first line of the accompanying table for each class of the Fund provides information about actual account values and actual expenses. You may use the information in this line, together with the amount you invested, to estimate the expenses that you paid over the period. Simply divide your account value by $1,000.00 (for example, an $8,600 account value divided by $1,000.00 = 8.6), then multiply the result by the number in the first line for a class of the Fund under the heading entitled "Expenses Paid During Period" to estimate the expenses you paid on your account during this period. A small balance maintenance fee of $12.00 that is charged once a year may apply for certain accounts with a value of less than $2,000. This fee is not included in the table below. If it was, the estimate of expenses you paid during the period would be higher, and your ending account value lower, by this amount. In addition, the Fund, as a shareholder in the underlying Fidelity Central Funds, will indirectly bear its pro-rata share of the fees and expenses incurred by the underlying Fidelity Central Funds. These fees and expenses are not included in the Fund's annualized expense ratio used to calculate the expense estimate in the table below.
Hypothetical Example for Comparison Purposes
The second line of the accompanying table for each class of the Fund provides information about hypothetical account values and hypothetical expenses based on a Class' actual expense ratio and an assumed rate of return of 5% per year before expenses, which is not the Class' actual return. The hypothetical account values and expenses may not be used to estimate the actual ending account balance or expenses you paid for the period. You may use this information to compare the ongoing costs of investing in the Fund and other funds. To do so, compare this 5% hypothetical example with the 5% hypothetical examples that appear in the shareholder reports of the other funds. A small balance maintenance fee of $12.00 that is charged once a year may apply for certain accounts with a value of less than $2,000. This fee is not included in the table below. If it was, the estimate of expenses you paid during the period would be higher, and your ending account value lower, by this amount. In addition, the Fund, as a shareholder in the underlying Fidelity Central Funds, will indirectly bear its pro-rata share of the fees and expenses incurred by the underlying Fidelity Central Funds. These fees and expenses are not included in the Fund's annualized expense ratio used to calculate the expense estimate in the table below.
Please note that the expenses shown in the table are meant to highlight your ongoing costs only and do not reflect any transaction costs. Therefore, the second line of the table is useful in comparing ongoing costs only, and will not help you determine the relative total costs of owning different funds. In addition, if these transactional costs were included, your costs would have been higher.
Annual Report
| Annualized
Expense RatioB | Beginning
Account Value
May 1, 2014 | Ending
Account Value
October 31, 2014 | Expenses Paid
During Period*
May 1, 2014
to October 31, 2014 |
Class A | 1.27% | | | |
Actual | | $ 1,000.00 | $ 981.00 | $ 6.34 |
HypotheticalA | | $ 1,000.00 | $ 1,018.80 | $ 6.46 |
Class T | 1.50% | | | |
Actual | | $ 1,000.00 | $ 979.90 | $ 7.49 |
HypotheticalA | | $ 1,000.00 | $ 1,017.64 | $ 7.63 |
Class B | 2.04% | | | |
Actual | | $ 1,000.00 | $ 977.10 | $ 10.17 |
HypotheticalA | | $ 1,000.00 | $ 1,014.92 | $ 10.36 |
Class C | 2.02% | | | |
Actual | | $ 1,000.00 | $ 977.30 | $ 10.07 |
HypotheticalA | | $ 1,000.00 | $ 1,015.02 | $ 10.26 |
International Discovery | .92% | | | |
Actual | | $ 1,000.00 | $ 982.60 | $ 4.60 |
HypotheticalA | | $ 1,000.00 | $ 1,020.57 | $ 4.69 |
Class K | .79% | | | |
Actual | | $ 1,000.00 | $ 983.10 | $ 3.95 |
HypotheticalA | | $ 1,000.00 | $ 1,021.22 | $ 4.02 |
Institutional Class | .93% | | | |
Actual | | $ 1,000.00 | $ 982.60 | $ 4.65 |
HypotheticalA | | $ 1,000.00 | $ 1,020.52 | $ 4.74 |
Class Z | .81% | | | |
Actual | | $ 1,000.00 | $ 983.30 | $ 4.05 |
HypotheticalA | | $ 1,000.00 | $ 1,021.12 | $ 4.13 |
A 5% return per year before expenses
B Annualized expense ratio reflects expenses net of applicable fee waivers.
* Expenses are equal to each Class' annualized expense ratio, multiplied by the average account value over the period, multiplied by 184/365 (to reflect the one-half year period).
Annual Report
Investment Changes (Unaudited)
Geographic Diversification (% of fund's net assets) |
As of October 31, 2014 |
 | Japan 17.1% | |
 | United Kingdom 14.9% | |
 | United States of America* 9.2% | |
 | Germany 6.7% | |
 | Switzerland 6.0% | |
 | France 5.1% | |
 | Australia 4.3% | |
 | Sweden 4.1% | |
 | India 3.2% | |
 | Other 29.4% | |

* Includes Short-Term Investments and Net Other Assets (Liabilities) |
Percentages are based on country or territory of incorporation and are adjusted for the effect of futures contracts, if applicable. |
As of April 30, 2014 |
| Japan 16.3% | |
| United Kingdom 14.4% | |
| Germany 10.3% | |
| United States of America* 9.5% | |
| France 8.9% | |
| Switzerland 5.5% | |
| Sweden 5.2% | |
| Spain 3.0% | |
| Netherlands 2.7% | |
| Other 24.2% | |

* Includes Short-Term Investments and Net Other Assets (Liabilities) |
Percentages are based on country or territory of incorporation and are adjusted for the effect of futures contracts, if applicable. |
Asset Allocation as of October 31, 2014 |
| % of fund's
net assets | % of fund's net assets
6 months ago |
Stocks and Equity Futures | 97.5 | 96.0 |
Other Investments | 0.1 | 0.1 |
Short-Term Investments and Net Other Assets (Liabilities) | 2.4 | 3.9 |
Top Ten Stocks as of October 31, 2014 |
| % of fund's
net assets | % of fund's net assets
6 months ago |
Roche Holding AG (participation certificate) (Switzerland, Pharmaceuticals) | 2.5 | 2.3 |
Total SA (France, Oil, Gas & Consumable Fuels) | 1.9 | 2.0 |
Australia & New Zealand Banking Group Ltd. (Australia, Banks) | 1.7 | 1.8 |
Bayer AG (Germany, Pharmaceuticals) | 1.6 | 1.8 |
Astellas Pharma, Inc. (Japan, Pharmaceuticals) | 1.4 | 0.9 |
Keyence Corp. (Japan, Electronic Equipment & Components) | 1.3 | 1.0 |
Actavis PLC (Ireland, Pharmaceuticals) | 1.3 | 0.5 |
Housing Development Finance Corp. Ltd. (India, Thrifts & Mortgage Finance) | 1.2 | 0.8 |
Japan Tobacco, Inc. (Japan, Tobacco) | 1.2 | 1.1 |
Anheuser-Busch InBev SA NV (Belgium, Beverages) | 1.2 | 1.1 |
| 15.3 | |
Market Sectors as of October 31, 2014 |
| % of fund's
net assets | % of fund's net assets
6 months ago |
Financials | 20.7 | 21.1 |
Health Care | 14.9 | 12.4 |
Consumer Discretionary | 12.9 | 14.8 |
Information Technology | 10.7 | 8.3 |
Consumer Staples | 10.7 | 8.4 |
Industrials | 10.4 | 14.6 |
Energy | 5.6 | 3.5 |
Materials | 4.7 | 5.4 |
Telecommunication Services | 3.9 | 5.1 |
Utilities | 0.2 | 0.2 |
Annual Report
Investments October 31, 2014
Showing Percentage of Net Assets
Common Stocks - 93.6% |
| Shares | | Value (000s) |
Australia - 4.3% |
Ansell Ltd. | 2,499,254 | | $ 43,839 |
Asaleo Care Ltd. (a) | 23,409,115 | | 41,813 |
Australia & New Zealand Banking Group Ltd. | 6,493,040 | | 192,133 |
G8 Education Ltd. | 5,831,484 | | 25,767 |
Greencross Ltd. | 1,186,547 | | 8,960 |
Ramsay Health Care Ltd. | 1,215,729 | | 56,201 |
Regis Healthcare Ltd. (a) | 4,596,817 | | 17,433 |
Spotless Group Holdings Ltd. | 18,983,369 | | 32,120 |
Woodside Petroleum Ltd. | 1,705,042 | | 60,564 |
TOTAL AUSTRALIA | | 478,830 |
Austria - 0.2% |
Andritz AG | 455,300 | | 21,978 |
Bailiwick of Jersey - 1.9% |
Glencore Xstrata PLC | 9,661,966 | | 49,445 |
MySale Group PLC (f) | 8,571,600 | | 26,053 |
Shire PLC | 1,110,100 | | 74,484 |
Wolseley PLC | 1,030,400 | | 54,675 |
TOTAL BAILIWICK OF JERSEY | | 204,657 |
Belgium - 1.9% |
Anheuser-Busch InBev SA NV | 1,183,927 | | 131,291 |
Arseus NV | 252,964 | | 10,112 |
KBC Groupe SA (a) | 1,328,201 | | 71,155 |
TOTAL BELGIUM | | 212,558 |
Bermuda - 1.1% |
BW Offshore Ltd. | 8,689,300 | | 10,654 |
Noble Group Ltd. | 22,526,000 | | 20,969 |
PAX Global Technology Ltd. (a)(f) | 66,294,000 | | 71,203 |
Travelport Worldwide Ltd. (e) | 1,324,600 | | 19,140 |
TOTAL BERMUDA | | 121,966 |
Canada - 3.1% |
Alimentation Couche-Tard, Inc. Class B (sub. vtg.) | 1,346,700 | | 45,705 |
Constellation Software, Inc. | 266,500 | | 75,075 |
First Quantum Minerals Ltd. (e) | 1,164,300 | | 17,562 |
Imperial Oil Ltd. | 1,205,500 | | 58,005 |
Potash Corp. of Saskatchewan, Inc. | 813,500 | | 27,767 |
PrairieSky Royalty Ltd. (e) | 1,530,400 | | 47,118 |
Common Stocks - continued |
| Shares | | Value (000s) |
Canada - continued |
Suncor Energy, Inc. | 1,036,600 | | $ 36,808 |
TransForce, Inc. (e) | 1,412,400 | | 34,538 |
TOTAL CANADA | | 342,578 |
Cayman Islands - 2.1% |
Alibaba Group Holding Ltd. sponsored ADR | 927,200 | | 91,422 |
Baidu.com, Inc. sponsored ADR (a) | 175,200 | | 41,833 |
ENN Energy Holdings Ltd. | 3,266,000 | | 21,191 |
Greatview Aseptic Pack Co. Ltd. | 26,392,000 | | 17,374 |
Sands China Ltd. | 3,748,400 | | 23,379 |
WuXi PharmaTech Cayman, Inc. sponsored ADR (a) | 841,400 | | 31,721 |
TOTAL CAYMAN ISLANDS | | 226,920 |
China - 0.0% |
Yantai Changyu Pioneer Wine Co. Ltd. (B Shares) | 485,600 | | 1,526 |
Colombia - 0.2% |
Grupo Aval Acciones y Valores SA ADR | 1,645,837 | | 22,186 |
Cyprus - 0.0% |
SPDI Secure Property Development & Investment PLC (a) | 529,830 | | 479 |
Denmark - 2.0% |
ISS Holdings A/S (a) | 384,000 | | 10,706 |
Novo Nordisk A/S Series B | 2,298,245 | | 103,887 |
Pandora A/S | 514,000 | | 43,270 |
Vestas Wind Systems A/S (a) | 1,874,500 | | 62,741 |
TOTAL DENMARK | | 220,604 |
Finland - 0.8% |
Sampo Oyj (A Shares) | 1,739,800 | | 83,219 |
France - 5.1% |
Atos Origin SA | 531,441 | | 36,689 |
AXA SA | 1,839,400 | | 42,436 |
BNP Paribas SA | 1,039,745 | | 65,330 |
Bureau Veritas SA | 737,700 | | 18,239 |
Havas SA | 5,933,668 | | 47,961 |
Numericable Group SA (e) | 483,713 | | 17,882 |
Numericable Group SA rights 11/12/14 (a)(e) | 483,713 | | 14,342 |
Rexel SA | 1,107,782 | | 18,609 |
Schneider Electric SA | 798,800 | | 62,944 |
SR Teleperformance SA | 297,200 | | 18,719 |
Total SA | 3,562,400 | | 212,687 |
TOTAL FRANCE | | 555,838 |
Common Stocks - continued |
| Shares | | Value (000s) |
Germany - 5.7% |
Aareal Bank AG | 1,044,895 | | $ 44,743 |
Bayer AG | 1,224,000 | | 174,016 |
Continental AG | 306,500 | | 60,168 |
Drillisch AG | 2,022,600 | | 70,184 |
GEA Group AG | 1,508,060 | | 69,347 |
KION Group AG | 1,429,749 | | 51,995 |
LEG Immobilien AG | 610,854 | | 42,140 |
Siemens AG | 727,119 | | 82,014 |
Symrise AG | 500,800 | | 28,163 |
TOTAL GERMANY | | 622,770 |
Hong Kong - 2.2% |
AIA Group Ltd. | 22,053,600 | | 123,068 |
Techtronic Industries Co. Ltd. | 39,683,000 | | 124,232 |
TOTAL HONG KONG | | 247,300 |
India - 3.2% |
Bharti Infratel Ltd. | 11,032,464 | | 52,872 |
Container Corp. of India Ltd. | 470,441 | | 10,379 |
Housing Development Finance Corp. Ltd. | 7,555,494 | | 136,069 |
Info Edge India Ltd. | 1,609,886 | | 22,122 |
Lupin Ltd. | 2,986,357 | | 69,144 |
The Jammu & Kashmir Bank Ltd. | 7,127,060 | | 16,146 |
Titan Co. Ltd. (a) | 2,240,879 | | 14,720 |
Yes Bank Ltd. | 3,138,775 | | 35,543 |
TOTAL INDIA | | 356,995 |
Indonesia - 0.8% |
PT Bank Central Asia Tbk | 41,701,500 | | 45,018 |
PT Bank Rakyat Indonesia Tbk | 44,669,800 | | 40,935 |
TOTAL INDONESIA | | 85,953 |
Ireland - 2.8% |
Actavis PLC (a) | 586,200 | | 142,294 |
Bank of Ireland (a) | 63,590,200 | | 25,142 |
Glanbia PLC | 2,424,800 | | 34,215 |
James Hardie Industries PLC CDI | 3,230,390 | | 34,457 |
Kerry Group PLC Class A | 1,035,200 | | 70,299 |
TOTAL IRELAND | | 306,407 |
Italy - 1.0% |
De Longhi SpA | 2,375,100 | | 46,372 |
Common Stocks - continued |
| Shares | | Value (000s) |
Italy - continued |
Telecom Italia SpA (a)(e) | 42,790,100 | | $ 48,493 |
World Duty Free SpA (a) | 2,253,904 | | 19,079 |
TOTAL ITALY | | 113,944 |
Japan - 17.1% |
ABC-MART, Inc. | 398,400 | | 22,972 |
ACOM Co. Ltd. (a) | 7,381,200 | | 24,603 |
Aozora Bank Ltd. | 11,251,000 | | 39,546 |
Astellas Pharma, Inc. | 10,267,800 | | 159,361 |
Coca-Cola Central Japan Co. Ltd. | 1,597,500 | | 28,744 |
Dentsu, Inc. | 899,500 | | 33,443 |
Don Quijote Holdings Co. Ltd. | 898,200 | | 53,816 |
Hitachi Ltd. | 6,659,000 | | 52,323 |
Hoya Corp. | 2,822,900 | | 99,894 |
Japan Exchange Group, Inc. | 2,358,200 | | 58,498 |
Japan Tobacco, Inc. | 3,948,700 | | 134,726 |
KDDI Corp. | 1,626,800 | | 106,831 |
Keyence Corp. | 304,060 | | 147,342 |
NEC Corp. | 26,163,000 | | 92,522 |
Nippon Kanzai Co. Ltd. | 8,000 | | 209 |
Olympus Corp. (a) | 1,501,000 | | 53,894 |
OMRON Corp. | 2,083,000 | | 98,598 |
ORIX Corp. | 5,463,900 | | 75,840 |
Park24 Co. Ltd. | 1,342,800 | | 20,319 |
Rakuten, Inc. | 5,927,100 | | 66,837 |
Santen Pharmaceutical Co. Ltd. | 583,800 | | 34,845 |
Seven & i Holdings Co., Ltd. | 2,748,600 | | 107,350 |
Seven Bank Ltd. | 17,781,300 | | 74,262 |
Ship Healthcare Holdings, Inc. | 1,076,700 | | 25,201 |
SoftBank Corp. | 1,575,100 | | 114,666 |
Sundrug Co. Ltd. | 825,500 | | 39,878 |
Toshiba Plant Systems & Services Corp. | 1,771,500 | | 29,652 |
Tsuruha Holdings, Inc. | 1,212,600 | | 71,593 |
VT Holdings Co. Ltd. | 3,967,000 | | 15,667 |
TOTAL JAPAN | | 1,883,432 |
Korea (South) - 0.7% |
Naturalendo Tech Co. Ltd. | 167,866 | | 8,765 |
NAVER Corp. | 65,859 | | 46,217 |
Samsung SDI Co. Ltd. | 200,556 | | 23,519 |
TOTAL KOREA (SOUTH) | | 78,501 |
Common Stocks - continued |
| Shares | | Value (000s) |
Luxembourg - 0.6% |
Altice SA | 759,700 | | $ 47,306 |
Grand City Properties SA (a) | 1,543,962 | | 19,783 |
TOTAL LUXEMBOURG | | 67,089 |
Marshall Islands - 0.1% |
Hoegh LNG Partners LP | 591,451 | | 12,426 |
Netherlands - 2.5% |
AEGON NV | 5,028,800 | | 40,987 |
AerCap Holdings NV (a) | 1,672,000 | | 72,464 |
IMCD Group BV | 1,902,200 | | 52,442 |
ING Groep NV (Certificaten Van Aandelen) (a) | 3,830,600 | | 54,856 |
LyondellBasell Industries NV Class A | 8,700 | | 797 |
Royal DSM NV | 787,237 | | 49,292 |
TOTAL NETHERLANDS | | 270,838 |
New Zealand - 0.7% |
EBOS Group Ltd. | 4,569,842 | | 34,090 |
Ryman Healthcare Group Ltd. | 7,311,565 | | 43,258 |
TOTAL NEW ZEALAND | | 77,348 |
Philippines - 0.7% |
Alliance Global Group, Inc. | 77,786,166 | | 43,752 |
SM Investments Corp. | 1,681,790 | | 29,306 |
TOTAL PHILIPPINES | | 73,058 |
Portugal - 0.2% |
CTT Correios de Portugal SA | 2,226,700 | | 20,621 |
Singapore - 0.2% |
Ezion Holdings Ltd. | 15,127,200 | | 17,814 |
South Africa - 0.4% |
Naspers Ltd. Class N | 369,200 | | 45,947 |
Spain - 2.6% |
Amadeus IT Holding SA Class A | 2,349,200 | | 86,256 |
Atresmedia Corporacion de Medios de Comunicacion SA | 1,515,400 | | 22,200 |
Banco Bilbao Vizcaya Argentaria SA | 4,806,144 | | 53,756 |
Criteria CaixaCorp SA | 10,039,365 | | 54,739 |
Inditex SA | 2,408,395 | | 67,650 |
TOTAL SPAIN | | 284,601 |
Sweden - 4.1% |
ASSA ABLOY AB (B Shares) | 2,357,200 | | 124,849 |
H&M Hennes & Mauritz AB (B Shares) | 1,057,821 | | 42,074 |
Common Stocks - continued |
| Shares | | Value (000s) |
Sweden - continued |
HEXPOL AB (B Shares) | 341,200 | | $ 30,173 |
Intrum Justitia AB | 1,211,317 | | 35,991 |
Nordea Bank AB | 9,576,600 | | 122,818 |
Svenska Cellulosa AB (SCA) (B Shares) | 1,118,800 | | 25,015 |
Svenska Handelsbanken AB (A Shares) | 1,425,600 | | 67,977 |
TOTAL SWEDEN | | 448,897 |
Switzerland - 6.0% |
Clariant AG (Reg.) | 2,358,150 | | 41,053 |
Compagnie Financiere Richemont SA Series A | 530,511 | | 44,634 |
Lonza Group AG | 521,951 | | 57,449 |
Partners Group Holding AG | 230,056 | | 61,151 |
Roche Holding AG (participation certificate) | 926,232 | | 273,335 |
Schindler Holding AG (participation certificate) | 194,920 | | 27,228 |
Sonova Holding AG Class B | 339,424 | | 52,846 |
UBS AG | 6,126,361 | | 106,526 |
TOTAL SWITZERLAND | | 664,222 |
Taiwan - 0.3% |
ECLAT Textile Co. Ltd. | 94,607 | | 901 |
Merida Industry Co. Ltd. | 4,995,900 | | 34,456 |
TOTAL TAIWAN | | 35,357 |
Turkey - 0.1% |
Logo Yazilim Sanayi Ve Ticar (a) | 1,125,049 | | 13,211 |
United Arab Emirates - 0.1% |
Emaar Malls Group PJSC (a) | 7,174,619 | | 6,270 |
United Kingdom - 14.9% |
Aberdeen Asset Management PLC | 5,975,132 | | 41,484 |
Advanced Computer Software Group PLC | 5,750,200 | | 9,934 |
Al Noor Hospitals Group PLC | 2,487,400 | | 40,547 |
Anglo American PLC (United Kingdom) | 1,316,500 | | 27,796 |
Associated British Foods PLC | 791,000 | | 34,848 |
B&M European Value Retail S.A. | 6,402,976 | | 25,479 |
BG Group PLC | 6,766,700 | | 112,774 |
BHP Billiton PLC | 4,625,988 | | 119,520 |
British American Tobacco PLC (United Kingdom) | 2,261,200 | | 128,159 |
BTG PLC (a) | 1,152,900 | | 13,924 |
Bunzl PLC | 1,143,100 | | 30,995 |
Diageo PLC | 3,650,857 | | 107,672 |
Exova Group Ltd. PLC (a) | 4,302,877 | | 11,684 |
Galiform PLC | 5,687,600 | | 31,144 |
Common Stocks - continued |
| Shares | | Value (000s) |
United Kingdom - continued |
Hikma Pharmaceuticals PLC | 3,032,490 | | $ 91,928 |
ITV PLC | 14,738,700 | | 47,862 |
Jazztel PLC (a) | 2,320,066 | | 37,040 |
Liberty Global PLC: | | | |
Class A (a) | 677,800 | | 30,820 |
Class C | 677,800 | | 30,142 |
Lloyds Banking Group PLC (a) | 54,946,900 | | 67,853 |
London Stock Exchange Group PLC | 3,415,236 | | 110,087 |
Melrose PLC | 11,027,800 | | 45,179 |
Next PLC | 774,844 | | 79,887 |
Persimmon PLC | 1,505,600 | | 35,236 |
Poundland Group PLC (a) | 3,906,035 | | 19,683 |
Reckitt Benckiser Group PLC | 788,600 | | 66,230 |
Rex Bionics PLC (a)(f) | 1,328,936 | | 3,518 |
Rotork PLC | 717,800 | | 29,338 |
SABMiller PLC | 1,107,300 | | 62,440 |
St. James's Place Capital PLC | 5,676,000 | | 67,645 |
Taylor Wimpey PLC | 12,002,700 | | 22,734 |
The Restaurant Group PLC | 1,992,100 | | 21,558 |
Ultra Electronics Holdings PLC | 614,667 | | 17,158 |
Vodafone Group PLC | 2,127,096 | | 7,074 |
Zoopla Property Group PLC | 2,595,500 | | 8,603 |
TOTAL UNITED KINGDOM | | 1,637,975 |
United States of America - 3.9% |
Chevron Corp. | 560,500 | | 67,232 |
Constellation Brands, Inc. Class A (sub. vtg.) (a) | 505,400 | | 46,264 |
Google, Inc.: | | | |
Class A (a) | 90,700 | | 51,506 |
Class C (a) | 90,700 | | 50,709 |
Las Vegas Sands Corp. | 177,700 | | 11,064 |
McGraw Hill Financial, Inc. | 1,415,500 | | 128,074 |
Visa, Inc. Class A | 301,900 | | 72,888 |
TOTAL UNITED STATES OF AMERICA | | 427,737 |
TOTAL COMMON STOCKS (Cost $8,985,470) |
10,292,052
|
Nonconvertible Preferred Stocks - 1.0% |
| | | |
Germany - 1.0% |
Volkswagen AG | 514,100 | | 109,554 |
Nonconvertible Preferred Stocks - continued |
| Shares | | Value (000s) |
United Kingdom - 0.0% |
Rolls-Royce Group PLC | 227,278,350 | | $ 364 |
TOTAL NONCONVERTIBLE PREFERRED STOCKS (Cost $113,684) |
109,918
|
Government Obligations - 0.1% |
| Principal
Amount (000s) (d) | | |
United States of America - 0.1% |
U.S. Treasury Bills, yield at date of purchase 0.02% to 0.03% 11/13/14 to 1/29/15 (i)
(Cost $11,590) | | $ 11,590 | |
11,590
|
Preferred Securities - 0.1% |
|
Ireland - 0.1% |
Baggot Securities Ltd. 10.24% (g)(h)
(Cost $14,037) | EUR | 9,140 | |
12,947
|
Money Market Funds - 5.6% |
| Shares | | |
Fidelity Cash Central Fund, 0.11% (b) | 567,797,475 | | 567,797 |
Fidelity Securities Lending Cash Central Fund, 0.11% (b)(c) | 52,624,430 | | 52,624 |
TOTAL MONEY MARKET FUNDS (Cost $620,421) |
620,421
|
TOTAL INVESTMENT PORTFOLIO - 100.4% (Cost $9,745,202) | | 11,046,928 |
NET OTHER ASSETS (LIABILITIES) - (0.4)% | | (48,377) |
NET ASSETS - 100% | $ 10,998,551 |
Futures Contracts |
| Expiration Date | | Underlying Face Amount at Value (000s) | | Unrealized Appreciation/
(Depreciation)
(000s) |
Purchased |
Equity Index Contracts |
3,792 CME Nikkei 225 Index Contracts (United States) | Dec. 2014 | | $ 323,647 | | $ 24,598 |
|
The face value of futures purchased as a percentage of net assets is 2.9% |
Currency Abbreviations |
EUR | - | European Monetary Unit |
Legend |
(a) Non-income producing |
(b) Affiliated fund that is generally available only to investment companies and other accounts managed by Fidelity Investments. The rate quoted is the annualized seven-day yield of the fund at period end. A complete unaudited listing of the fund's holdings as of its most recent quarter end is available upon request. In addition, each Fidelity Central Fund's financial statements, which are not covered by the Fund's Report of Independent Registered Public Accounting Firm, are available on the SEC's website or upon request. |
(c) Investment made with cash collateral received from securities on loan. |
(d) Amount is stated in United States dollars unless otherwise noted. |
(e) Security or a portion of the security is on loan at period end. |
(f) Affiliated company |
(g) Security exempt from registration under Rule 144A of the Securities Act of 1933. These securities may be resold in transactions exempt from registration, normally to qualified institutional buyers. At the end of the period, the value of these securities amounted to $12,947,000 or 0.1% of net assets. |
(h) Security is perpetual in nature with no stated maturity date. |
(i) Security or a portion of the security was pledged to cover margin requirements for futures contracts. At period end, the value of securities pledged amounted to $11,590,000. |
Affiliated Central Funds |
Information regarding fiscal year to date income earned by the Fund from investments in Fidelity Central Funds is as follows: |
Fund | Income earned
(Amounts in thousands) |
Fidelity Cash Central Fund | $ 600 |
Fidelity Securities Lending Cash Central Fund | 5,278 |
Total | $ 5,878 |
Other Affiliated Issuers |
An affiliated company is a company in which the Fund has ownership of at least 5% of the voting securities. Fiscal year to date transactions with companies which are or were affiliates are as follows: |
Affiliate
(Amounts in thousands) | Value,
beginning of
period | Purchases | Sales Proceeds | Dividend Income | Value,
end of
period |
MySale Group PLC | $ - | $ 32,521 | $ - | $ - | $ 26,053 |
PAX Global Technology Ltd. | - | 39,641 | 3,956 | - | 71,203 |
Rex Bionics PLC | - | 4,037 | - | - | 3,518 |
Total | $ - | $ 76,199 | $ 3,956 | $ - | $ 100,774 |
Other Information |
Categorizations in the Schedule of Investments are based on country or territory of incorporation. |
The following is a summary of the inputs used, as of October 31, 2014, involving the Fund's assets and liabilities carried at fair value. The inputs or methodology used for valuing securities may not be an indication of the risk associated with investing in those securities. For more information on valuation inputs, and their aggregation into the levels used in the table below, please refer to the Investment Valuation section in the accompanying Notes to Financial Statements. |
Valuation Inputs at Reporting Date: |
Description
(Amounts in thousands) | Total | Level 1 | Level 2 | Level 3 |
Investments in Securities: | | | | |
Equities: | | | | |
Consumer Discretionary | $ 1,445,431 | $ 1,029,241 | $ 416,190 | $ - |
Consumer Staples | 1,177,768 | 385,016 | 792,752 | - |
Energy | 636,082 | 232,243 | 403,839 | - |
Financials | 2,262,497 | 1,051,716 | 1,210,781 | - |
Health Care | 1,634,986 | 714,402 | 920,584 | - |
Industrials | 1,109,082 | 840,362 | 268,720 | - |
Information Technology | 1,181,932 | 597,928 | 584,004 | - |
Materials | 495,841 | 296,694 | 199,147 | - |
Telecommunication Services | 437,160 | 107,224 | 329,936 | - |
Utilities | 21,191 | - | 21,191 | - |
Government Obligations | 11,590 | - | 11,590 | - |
Preferred Securities | 12,947 | - | 12,947 | - |
Money Market Funds | 620,421 | 620,421 | - | - |
Total Investments in Securities: | $ 11,046,928 | $ 5,875,247 | $ 5,171,681 | $ - |
Derivative Instruments: | | | | |
Assets | | | | |
Futures Contracts | $ 24,598 | $ 24,598 | $ - | $ - |
The following is a summary of transfers between Level 1 and Level 2 for the period ended October 31, 2014. Transfers are assumed to have occurred at the beginning of the period, and are primarily attributable to the valuation techniques used for foreign equity securities, as discussed in the accompanying Notes to Financial Statements: |
Transfers | Total (000s) |
Level 1 to Level 2 | $ 1,082,136 |
Level 2 to Level 1 | $ 0 |
Value of Derivative Instruments |
The following table is a summary of the Fund's value of derivative instruments by primary risk exposure as of October 31, 2014. For additional information on derivative instruments, please refer to the Derivative Instruments section in the accompanying Notes to Financial Statements. |
Primary Risk Exposure /
Derivative Type | Value (000s) |
| Asset | Liability |
Equity Risk | | |
Futures Contracts (a) | $ 24,598 | $ - |
Total Value of Derivatives | $ 24,598 | $ - |
(a) Reflects gross cumulative appreciation (depreciation) on futures contracts as presented in the Schedule of Investments. Only the period end receivable or payable for daily variation margin and net unrealized appreciation (depreciation) are presented in the Statement of Assets and Liabilities. |
See accompanying notes which are an integral part of the financial statements.
Annual Report
Statement of Assets and Liabilities
Amounts in thousands (except per-share amounts) | October 31, 2014 |
| | |
Assets | | |
Investment in securities, at value (including securities loaned of $50,476) - See accompanying schedule: Unaffiliated issuers (cost $9,050,379) | $ 10,325,733 | |
Fidelity Central Funds (cost $620,421) | 620,421 | |
Other affiliated issuers (cost $74,402) | 100,774 | |
Total Investments (cost $9,745,202) | | $ 11,046,928 |
Receivable for investments sold | | 41,866 |
Receivable for fund shares sold | | 6,258 |
Dividends receivable | | 19,075 |
Distributions receivable from Fidelity Central Funds | | 78 |
Receivable for daily variation margin for derivative instruments | | 23,890 |
Prepaid expenses | | 36 |
Other receivables | | 3,818 |
Total assets | | 11,141,949 |
| | |
Liabilities | | |
Payable for investments purchased | $ 408 | |
Payable for fund shares redeemed | 73,445 | |
Accrued management fee | 6,840 | |
Distribution and service plan fees payable | 112 | |
Other affiliated payables | 1,580 | |
Other payables and accrued expenses | 8,389 | |
Collateral on securities loaned, at value | 52,624 | |
Total liabilities | | 143,398 |
| | |
Net Assets | | $ 10,998,551 |
Net Assets consist of: | | |
Paid in capital | | $ 9,891,341 |
Undistributed net investment income | | 68,609 |
Accumulated undistributed net realized gain (loss) on investments and foreign currency transactions | | (278,180) |
Net unrealized appreciation (depreciation) on investments and assets and liabilities in foreign currencies | | 1,316,781 |
Net Assets | | $ 10,998,551 |
See accompanying notes which are an integral part of the financial statements.
Annual Report
Financial Statements - continued
Statement of Assets and Liabilities - continued
Amounts in thousands (except per-share amounts) | October 31, 2014 |
| | |
Calculation of Maximum Offering Price Class A:
Net Asset Value and redemption price per share ($296,718.26 ÷ 7,667.518 shares) | | $ 38.70 |
| | |
Maximum offering price per share (100/94.25 of $38.70) | | $ 41.06 |
Class T:
Net Asset Value and redemption price per share ($48,545.20 ÷ 1,263.274 shares) | | $ 38.43 |
| | |
Maximum offering price per share (100/96.50 of $38.43) | | $ 39.82 |
Class B:
Net Asset Value and offering price per share ($4,616.85 ÷ 120.484 shares)A | | $ 38.32 |
| | |
Class C:
Net Asset Value and offering price per share ($35,346.11 ÷ 924.200 shares)A | | $ 38.25 |
| | |
International Discovery:
Net Asset Value, offering price and redemption price per share ($7,464,021.58 ÷ 191,244.937 shares) | | $ 39.03 |
| | |
Class K:
Net Asset Value, offering price and redemption price per share ($2,464,322.23 ÷ 63,228.753 shares) | | $ 38.97 |
| | |
Institutional Class:
Net Asset Value, offering price and redemption price per share ($649,855.06 ÷ 16,682.058 shares) | | $ 38.96 |
| | |
Class Z:
Net Asset Value, offering price and redemption price per share ($35,125.45 ÷ 901.567 shares) | | $ 38.96 |
A Redemption price per share is equal to net asset value less any applicable contingent deferred sales charge.
See accompanying notes which are an integral part of the financial statements.
Annual Report
Statement of Operations
Amounts in thousands | Year ended October 31, 2014 |
| | |
Investment Income | | |
Dividends | | $ 259,008 |
Special dividends | | 63,816 |
Interest | | 64 |
Income from Fidelity Central Funds | | 5,878 |
Income before foreign taxes withheld | | 328,766 |
Less foreign taxes withheld | | (23,208) |
Total income | | 305,558 |
| | |
Expenses | | |
Management fee
Basic fee | $ 80,931 | |
Performance adjustment | 2,685 | |
Transfer agent fees | 17,771 | |
Distribution and service plan fees | 1,508 | |
Accounting and security lending fees | 1,856 | |
Custodian fees and expenses | 1,542 | |
Independent trustees' compensation | 48 | |
Registration fees | 223 | |
Audit | 116 | |
Legal | 40 | |
Miscellaneous | 85 | |
Total expenses before reductions | 106,805 | |
Expense reductions | (345) | 106,460 |
Net investment income (loss) | | 199,098 |
Realized and Unrealized Gain (Loss) Net realized gain (loss) on: | | |
Investment securities: | | |
Unaffiliated issuers | 740,761 | |
Other affiliated issuers | 2,158 | |
Foreign currency transactions | (1,181) | |
Futures contracts | 16,266 | |
Total net realized gain (loss) | | 758,004 |
Change in net unrealized appreciation (depreciation) on: Investment securities (net of increase in deferred foreign taxes of $7,503) | (978,230) | |
Assets and liabilities in foreign currencies | (886) | |
Futures contracts | 20,360 | |
Total change in net unrealized appreciation (depreciation) | | (958,756) |
Net gain (loss) | | (200,752) |
Net increase (decrease) in net assets resulting from operations | | $ (1,654) |
See accompanying notes which are an integral part of the financial statements.
Annual Report
Financial Statements - continued
Statement of Changes in Net Assets
Amounts in thousands | Year ended
October 31,
2014 | Year ended
October 31,
2013 |
Increase (Decrease) in Net Assets | | |
Operations | | |
Net investment income (loss) | $ 199,098 | $ 129,203 |
Net realized gain (loss) | 758,004 | 725,376 |
Change in net unrealized appreciation (depreciation) | (958,756) | 1,463,372 |
Net increase (decrease) in net assets resulting
from operations | (1,654) | 2,317,951 |
Distributions to shareholders from net investment income | (136,326) | (146,031) |
Distributions to shareholders from net realized gain | (88,586) | (8,413) |
Total distributions | (224,912) | (154,444) |
Share transactions - net increase (decrease) | (69,908) | 714,712 |
Redemption fees | 139 | 128 |
Total increase (decrease) in net assets | (296,335) | 2,878,347 |
| | |
Net Assets | | |
Beginning of period | 11,294,886 | 8,416,539 |
End of period (including undistributed net investment income of $68,609 and undistributed net investment income of $131,430, respectively) | $ 10,998,551 | $ 11,294,886 |
See accompanying notes which are an integral part of the financial statements.
Annual Report
Financial Highlights - Class A
Years ended October 31, | 2014 | 2013 | 2012 | 2011 | 2010 |
Selected Per-Share Data | | | | | |
Net asset value, beginning of period | $ 39.49 | $ 31.66 | $ 29.43 | $ 32.07 | $ 28.57 |
Income from Investment Operations | | | | | |
Net investment income (loss) C | .53 F | .34 | .41 | .42 | .31 |
Net realized and unrealized gain (loss) | (.67) | 7.97 | 2.11 | (2.52) | 3.51 |
Total from investment operations | (.14) | 8.31 | 2.52 | (2.10) | 3.82 |
Distributions from net investment income | (.33) | (.45) | (.29) | (.38) | (.28) |
Distributions from net realized gain | (.31) | (.03) | - | (.16) | (.04) |
Total distributions | (.65) I | (.48) | (.29) | (.54) | (.32) |
Redemption fees added to paid in capital C, H | - | - | - | - | - |
Net asset value, end of period | $ 38.70 | $ 39.49 | $ 31.66 | $ 29.43 | $ 32.07 |
Total ReturnA, B | (.36)% | 26.59% | 8.70% | (6.71)% | 13.43% |
Ratios to Average Net Assets D, G | | | | | |
Expenses before reductions | 1.28% | 1.35% | 1.34% | 1.30% | 1.33% |
Expenses net of fee waivers, if any | 1.28% | 1.35% | 1.34% | 1.29% | 1.33% |
Expenses net of all reductions | 1.28% | 1.33% | 1.31% | 1.25% | 1.28% |
Net investment income (loss) | 1.35% F | .97% | 1.41% | 1.31% | 1.06% |
Supplemental Data | | | | | |
Net assets, end of period (in millions) | $ 297 | $ 347 | $ 299 | $ 320 | $ 392 |
Portfolio turnover rate E | 57% | 65% | 68% | 75% | 82% |
A Total returns would have been lower if certain expenses had not been reduced during the applicable periods shown.
B Total returns do not include the effect of the sales charges.
C Calculated based on average shares outstanding during the period.
D Fees and expenses of any underlying Fidelity Central Funds are not included in the Fund's expense ratio. The Fund indirectly bears its proportionate share of the expenses of any underlying Fidelity Central Funds.
E Amount does not include the portfolio activity of any underlying Fidelity Central Funds.
F Investment income per share reflects a large, non-recurring dividend which amounted to $.22 per share. Excluding this non-recurring dividend, the ratio of net investment income (loss) to average net assets would have been .80%.
G Expense ratios reflect operating expenses of the class. Expenses before reductions do not reflect amounts reimbursed by the investment adviser or reductions from brokerage service arrangements or reductions from other expense offset arrangements and do not represent the amount paid by the class during periods when reimbursements or reductions occur. Expenses net of fee waivers reflect expenses after reimbursement by the investment adviser but prior to reductions from brokerage service arrangements or other expense offset arrangements. Expenses net of all reductions represent the net expenses paid by the class.
H Amount represents less than $.01 per share.
I Total distributions of $.65 per share is comprised of distributions from net investment income of $.334 and distributions from net realized gain of $.311 per share.
See accompanying notes which are an integral part of the financial statements.
Annual Report
Financial Highlights - Class T
Years ended October 31, | 2014 | 2013 | 2012 | 2011 | 2010 |
Selected Per-Share Data | | | | | |
Net asset value, beginning of period | $ 39.23 | $ 31.42 | $ 29.18 | $ 31.81 | $ 28.35 |
Income from Investment Operations | | | | | |
Net investment income (loss) C | .44 F | .26 | .34 | .34 | .23 |
Net realized and unrealized gain (loss) | (.68) | 7.92 | 2.09 | (2.51) | 3.48 |
Total from investment operations | (.24) | 8.18 | 2.43 | (2.17) | 3.71 |
Distributions from net investment income | (.25) | (.34) | (.19) | (.30) | (.21) |
Distributions from net realized gain | (.31) | (.03) | - | (.16) | (.04) |
Total distributions | (.56) | (.37) | (.19) | (.46) | (.25) |
Redemption fees added to paid in capital C, H | - | - | - | - | - |
Net asset value, end of period | $ 38.43 | $ 39.23 | $ 31.42 | $ 29.18 | $ 31.81 |
Total ReturnA, B | (.60)% | 26.31% | 8.41% | (6.96)% | 13.14% |
Ratios to Average Net Assets D, G | | | | | |
Expenses before reductions | 1.51% | 1.59% | 1.59% | 1.56% | 1.60% |
Expenses net of fee waivers, if any | 1.51% | 1.59% | 1.59% | 1.55% | 1.60% |
Expenses net of all reductions | 1.51% | 1.57% | 1.56% | 1.51% | 1.56% |
Net investment income (loss) | 1.11% F | .73% | 1.16% | 1.05% | .79% |
Supplemental Data | | | | | |
Net assets, end of period (in millions) | $ 49 | $ 53 | $ 46 | $ 61 | $ 92 |
Portfolio turnover rateE | 57% | 65% | 68% | 75% | 82% |
A Total returns would have been lower if certain expenses had not been reduced during the applicable periods shown.
B Total returns do not include the effect of the sales charges.
C Calculated based on average shares outstanding during the period.
D Fees and expenses of any underlying Fidelity Central Funds are not included in the Fund's expense ratio. The Fund indirectly bears its proportionate share of the expenses of any underlying Fidelity Central Funds.
E Amount does not include the portfolio activity of any underlying Fidelity Central Funds.
F Investment income per share reflects large, non-recurring dividend which amounted to $.21 per share. Excluding this non-recurring dividend, the ratio of net investment income (loss) to average net assets would have been .56%.
G Expense ratios reflect operating expenses of the class. Expenses before reductions do not reflect amounts reimbursed by the investment adviser or reductions from brokerage service arrangements or reductions from other expense offset arrangements and do not represent the amount paid by the class during periods when reimbursements or reductions occur. Expenses net of fee waivers reflect expenses after reimbursement by the investment adviser but prior to reductions from brokerage service arrangements or other expense offset arrangements. Expenses net of all reductions represent the net expenses paid by the class.
H Amount represents less than $.01 per share.
See accompanying notes which are an integral part of the financial statements.
Annual Report
Financial Highlights - Class B
Years ended October 31, | 2014 | 2013 | 2012 | 2011 | 2010 |
Selected Per-Share Data | | | | | |
Net asset value, beginning of period | $ 39.08 | $ 31.28 | $ 29.02 | $ 31.60 | $ 28.18 |
Income from Investment Operations | | | | | |
Net investment income (loss) C | .22 F | .08 | .19 | .17 | .08 |
Net realized and unrealized gain (loss) | (.66) | 7.90 | 2.09 | (2.48) | 3.44 |
Total from investment operations | (.44) | 7.98 | 2.28 | (2.31) | 3.52 |
Distributions from net investment income | (.01) | (.15) | (.02) | (.12) | (.06) |
Distributions from net realized gain | (.31) | (.03) | - | (.16) | (.04) |
Total distributions | (.32) | (.18) | (.02) | (.27) I | (.10) |
Redemption fees added to paid in capital C, H | - | - | - | - | - |
Net asset value, end of period | $ 38.32 | $ 39.08 | $ 31.28 | $ 29.02 | $ 31.60 |
Total ReturnA, B | (1.12)% | 25.64% | 7.85% | (7.39)% | 12.52% |
Ratios to Average Net Assets D, G | | | | | |
Expenses before reductions | 2.06% | 2.10% | 2.09% | 2.06% | 2.12% |
Expenses net of fee waivers, if any | 2.06% | 2.10% | 2.09% | 2.06% | 2.12% |
Expenses net of all reductions | 2.05% | 2.08% | 2.06% | 2.02% | 2.08% |
Net investment income (loss) | .57% F | .22% | .66% | .54% | .27% |
Supplemental Data | | | | | |
Net assets, end of period (in millions) | $ 5 | $ 7 | $ 8 | $ 10 | $ 14 |
Portfolio turnover rateE | 57% | 65% | 68% | 75% | 82% |
A Total returns would have been lower if certain expenses had not been reduced during the applicable periods shown.
B Total returns do not include the effect of the contingent deferred sales charge.
C Calculated based on average shares outstanding during the period.
D Fees and expenses of any underlying Fidelity Central Funds are not included in the Fund's expense ratio. The Fund indirectly bears its proportionate share of the expenses of any underlying Fidelity Central Funds.
E Amount does not include the portfolio activity of any underlying Fidelity Central Funds.
F Investment income per share reflects a large, non-recurring dividend which amounted to $.21 per share. Excluding this non-recurring dividend, the ratio of net investment income (loss) to average net assets would have been .02%.
G Expense ratios reflect operating expenses of the class. Expenses before reductions do not reflect amounts reimbursed by the investment adviser or reductions from brokerage service arrangements or reductions from other expense offset arrangements and do not represent the amount paid by the class during periods when reimbursements or reductions occur. Expenses net of fee waivers reflect expenses after reimbursement by the investment adviser but prior to reductions from brokerage service arrangements or other expense offset arrangements. Expenses net of all reductions represent the net expenses paid by the class.
H Amount represents less than $.01 per share.
I Total distributions of $.27 per share is comprised of distributions from net investment income of $.115 and distributions from net realized gain of $.155 per share.
See accompanying notes which are an integral part of the financial statements.
Annual Report
Financial Highlights - Class C
Years ended October 31, | 2014 | 2013 | 2012 | 2011 | 2010 |
Selected Per-Share Data | | | | | |
Net asset value, beginning of period | $ 39.07 | $ 31.32 | $ 29.08 | $ 31.68 | $ 28.23 |
Income from Investment Operations | | | | | |
Net investment income (loss) C | .23 F | .08 | .19 | .18 | .09 |
Net realized and unrealized gain (loss) | (.66) | 7.90 | 2.09 | (2.49) | 3.45 |
Total from investment operations | (.43) | 7.98 | 2.28 | (2.31) | 3.54 |
Distributions from net investment income | (.08) | (.20) | (.04) | (.14) | (.05) |
Distributions from net realized gain | (.31) | (.03) | - | (.16) | (.04) |
Total distributions | (.39) | (.23) | (.04) | (.29) I | (.09) |
Redemption fees added to paid in capital C, H | - | - | - | - | - |
Net asset value, end of period | $ 38.25 | $ 39.07 | $ 31.32 | $ 29.08 | $ 31.68 |
Total ReturnA, B | (1.10)% | 25.65% | 7.86% | (7.37)% | 12.54% |
Ratios to Average Net Assets D, G | | | | | |
Expenses before reductions | 2.03% | 2.10% | 2.09% | 2.05% | 2.09% |
Expenses net of fee waivers, if any | 2.03% | 2.09% | 2.09% | 2.04% | 2.09% |
Expenses net of all reductions | 2.02% | 2.07% | 2.06% | 2.00% | 2.05% |
Net investment income (loss) | .60% F | .23% | .66% | .56% | .30% |
Supplemental Data | | | | | |
Net assets, end of period (in millions) | $ 35 | $ 36 | $ 30 | $ 33 | $ 44 |
Portfolio turnover rateE | 57% | 65% | 68% | 75% | 82% |
A Total returns would have been lower if certain expenses had not been reduced during the applicable periods shown.
B Total returns do not include the effect of the contingent deferred sales charge.
C Calculated based on average shares outstanding during the period.
D Fees and expenses of any underlying Fidelity Central Funds are not included in the Fund's expense ratio. The Fund indirectly bears its proportionate share of the expenses of any underlying Fidelity Central Funds.
E Amount does not include the portfolio activity of any underlying Fidelity Central Funds.
F Investment income per share reflects a large, non-recurring dividend which amounted to $.21 per share. Excluding this non-recurring dividend, the ratio of net investment income (loss) to average net assets would have been .05%.
G Expense ratios reflect operating expenses of the class. Expenses before reductions do not reflect amounts reimbursed by the investment adviser or reductions from brokerage service arrangements or reductions from other expense offset arrangements and do not represent the amount paid by the class during periods when reimbursements or reductions occur. Expenses net of fee waivers reflect expenses after reimbursement by the investment adviser but prior to reductions from brokerage service arrangements or other expense offset arrangements. Expenses net of all reductions represent the net expenses paid by the class.
H Amount represents less than $.01 per share.
I Total distributions of $.29 per share is comprised of distributions from net investment income of $.137 and distributions from net realized gain of $.155 per share.
See accompanying notes which are an integral part of the financial statements.
Annual Report
Financial Highlights - International Discovery
Years ended October 31, | 2014 | 2013 | 2012 | 2011 | 2010 |
Selected Per-Share Data | | | | | |
Net asset value, beginning of period | $ 39.82 | $ 31.91 | $ 29.69 | $ 32.34 | $ 28.79 |
Income from Investment Operations | | | | | |
Net investment income (loss) B | .67 E | .47 | .51 | .53 | .40 |
Net realized and unrealized gain (loss) | (.68) | 8.02 | 2.12 | (2.54) | 3.54 |
Total from investment operations | (.01) | 8.49 | 2.63 | (2.01) | 3.94 |
Distributions from net investment income | (.47) | (.55) | (.41) | (.48) | (.35) |
Distributions from net realized gain | (.31) | (.03) | - | (.16) | (.04) |
Total distributions | (.78) | (.58) | (.41) | (.64) | (.39) |
Redemption fees added to paid in capital B, G | - | - | - | - | - |
Net asset value, end of period | $ 39.03 | $ 39.82 | $ 31.91 | $ 29.69 | $ 32.34 |
Total ReturnA | (.01)% | 27.03% | 9.03% | (6.39)% | 13.76% |
Ratios to Average Net Assets C, F | | | | | |
Expenses before reductions | .93% | 1.00% | 1.01% | .97% | 1.05% |
Expenses net of fee waivers, if any | .93% | 1.00% | 1.01% | .96% | 1.05% |
Expenses net of all reductions | .93% | .98% | .98% | .92% | 1.00% |
Net investment income (loss) | 1.69% E | 1.32% | 1.73% | 1.64% | 1.35% |
Supplemental Data | | | | | |
Net assets, end of period (in millions) | $ 7,464 | $ 7,800 | $ 5,965 | $ 6,806 | $ 8,133 |
Portfolio turnover rateD | 57% | 65% | 68% | 75% | 82% |
A Total returns would have been lower if certain expenses had not been reduced during the applicable periods shown.
B Calculated based on average shares outstanding during the period.
C Fees and expenses of any underlying Fidelity Central Funds are not included in the Fund's expense ratio. The Fund indirectly bears its proportionate share of the expenses of any underlying Fidelity Central Funds.
D Amount does not include the portfolio activity of any underlying Fidelity Central Funds.
E Investment income per share reflects a large, non-recurring dividend which amounted to $.22 per share. Excluding this non-recurring dividend, the ratio of net investment income (loss) to average net assets would have been 1.15%.
F Expense ratios reflect operating expenses of the class. Expenses before reductions do not reflect amounts reimbursed by the investment adviser or reductions from brokerage service arrangements or reductions from other expense offset arrangements and do not represent the amount paid by the class during periods when reimbursements or reductions occur. Expenses net of fee waivers reflect expenses after reimbursement by the investment adviser but prior to reductions from brokerage service arrangements or other expense offset arrangements. Expenses net of all reductions represent the net expenses paid by the class.
G Amount represents less than $.01 per share.
See accompanying notes which are an integral part of the financial statements.
Annual Report
Financial Highlights - Class K
Years ended October 31, | 2014 | 2013 | 2012 | 2011 | 2010 |
Selected Per-Share Data | | | | | |
Net asset value, beginning of period | $ 39.76 | $ 31.87 | $ 29.66 | $ 32.32 | $ 28.78 |
Income from Investment Operations | | | | | |
Net investment income (loss) B | .72 E | .52 | .57 | .58 | .46 |
Net realized and unrealized gain (loss) | (.67) | 8.01 | 2.11 | (2.54) | 3.53 |
Total from investment operations | .05 | 8.53 | 2.68 | (1.96) | 3.99 |
Distributions from net investment income | (.53) | (.61) | (.47) | (.55) | (.41) |
Distributions from net realized gain | (.31) | (.03) | - | (.16) | (.04) |
Total distributions | (.84) | (.64) | (.47) | (.70) H | (.45) |
Redemption fees added to paid in capital B, G | - | - | - | - | - |
Net asset value, end of period | $ 38.97 | $ 39.76 | $ 31.87 | $ 29.66 | $ 32.32 |
Total ReturnA | .13% | 27.23% | 9.24% | (6.24)% | 13.96% |
Ratios to Average Net Assets C, F | | | | | |
Expenses before reductions | .80% | .85% | .83% | .80% | .84% |
Expenses net of fee waivers, if any | .80% | .85% | .83% | .79% | .84% |
Expenses net of all reductions | .79% | .83% | .80% | .75% | .79% |
Net investment income (loss) | 1.83% E | 1.47% | 1.91% | 1.81% | 1.55% |
Supplemental Data | | | | | |
Net assets, end of period (in millions) | $ 2,464 | $ 2,576 | $ 1,776 | $ 1,245 | $ 1,078 |
Portfolio turnover rateD | 57% | 65% | 68% | 75% | 82% |
A Total returns would have been lower if certain expenses had not been reduced during the applicable periods shown.
B Calculated based on average shares outstanding during the period.
C Fees and expenses of any underlying Fidelity Central Funds are not included in the Fund's expense ratio. The Fund indirectly bears its proportionate share of the expenses of any underlying Fidelity Central Funds.
D Amount does not include the portfolio activity of any underlying Fidelity Central Funds.
E Investment income per share reflects a large, non-recurring dividend which amounted to $.22 per share. Excluding this non-recurring dividend, the ratio of net investment income (loss) to average net assets would have been 1.28%.
F Expense ratios reflect operating expenses of the class. Expenses before reductions do not reflect amounts reimbursed by the investment adviser or reductions from brokerage service arrangements or reductions from other expense offset arrangements and do not represent the amount paid by the class during periods when reimbursements or reductions occur. Expenses net of fee waivers reflect expenses after reimbursement by the investment adviser but prior to reductions from brokerage service arrangements or other expense offset arrangements. Expenses net of all reductions represent the net expenses paid by the class.
G Amount represents less than $.01 per share.
H Total distributions of $.70 per share is comprised of distributions from net investment income of $.548 and distributions from net realized gain of $.155 per share.
See accompanying notes which are an integral part of the financial statements.
Annual Report
Financial Highlights - Institutional Class
Years ended October 31, | 2014 | 2013 | 2012 | 2011 | 2010 |
Selected Per-Share Data | | | | | |
Net asset value, beginning of period | $ 39.76 | $ 31.87 | $ 29.65 | $ 32.31 | $ 28.77 |
Income from Investment Operations | | | | | |
Net investment income (loss) B | .67 E | .47 | .52 | .54 | .41 |
Net realized and unrealized gain (loss) | (.68) | 8.01 | 2.11 | (2.55) | 3.55 |
Total from investment operations | (.01) | 8.48 | 2.63 | (2.01) | 3.96 |
Distributions from net investment income | (.48) | (.56) | (.41) | (.50) | (.38) |
Distributions from net realized gain | (.31) | (.03) | - | (.16) | (.04) |
Total distributions | (.79) | (.59) | (.41) | (.65) H | (.42) |
Redemption fees added to paid in capital B, G | - | - | - | - | - |
Net asset value, end of period | $ 38.96 | $ 39.76 | $ 31.87 | $ 29.65 | $ 32.31 |
Total ReturnA | (.01)% | 27.03% | 9.07% | (6.39)% | 13.84% |
Ratios to Average Net Assets C, F | | | | | |
Expenses before reductions | .93% | 1.00% | 1.00% | .95% | .99% |
Expenses net of fee waivers, if any | .93% | 1.00% | 1.00% | .94% | .99% |
Expenses net of all reductions | .93% | .97% | .97% | .90% | .95% |
Net investment income (loss) | 1.69% E | 1.33% | 1.75% | 1.66% | 1.40% |
Supplemental Data | | | | | |
Net assets, end of period (in millions) | $ 650 | $ 476 | $ 294 | $ 278 | $ 319 |
Portfolio turnover rateD | 57% | 65% | 68% | 75% | 82% |
A Total returns would have been lower if certain expenses had not been reduced during the applicable periods shown.
B Calculated based on average shares outstanding during the period.
C Fees and expenses of any underlying Fidelity Central Funds are not included in the Fund's expense ratio. The Fund indirectly bears its proportionate share of the expenses of any underlying Fidelity Central Funds.
D Amount does not include the portfolio activity of any underlying Fidelity Central Funds.
E Investment income per share reflects a large, non-recurring dividend which amounted to $.22 per share. Excluding this non-recurring dividend, the ratio of net investment income (loss) to average net assets would have been 1.14%.
F Expense ratios reflect operating expenses of the class. Expenses before reductions do not reflect amounts reimbursed by the investment adviser or reductions from brokerage service arrangements or reductions from other expense offset arrangements and do not represent the amount paid by the class during periods when reimbursements or reductions occur. Expenses net of fee waivers reflect expenses after reimbursement by the investment adviser but prior to reductions from brokerage service arrangements or other expense offset arrangements. Expenses net of all reductions represent the net expenses paid by the class.
G Amount represents less than $.01 per share.
H Total distributions of $.65 per share is comprised of distributions from net investment income of $.497 and distributions from net realized gain of $.155 per share.
See accompanying notes which are an integral part of the financial statements.
Annual Report
Financial Highlights - Class Z
Years ended October 31, | 2014 | 2013 H |
Selected Per-Share Data | | |
Net asset value, beginning of period | $ 39.77 | $ 37.22 |
Income from Investment Operations | | |
Net investment income (loss) D | .72 G | .07 |
Net realized and unrealized gain (loss) | (.68) | 2.48 |
Total from investment operations | .04 | 2.55 |
Distributions from net investment income | (.54) | - |
Distributions from net realized gain | (.31) | - |
Total distributions | (.85) | - |
Redemption fees added to paid in capital D, J | - | - |
Net asset value, end of period | $ 38.96 | $ 39.77 |
Total ReturnB, C | .12% | 6.85% |
Ratios to Average Net Assets E, I | | |
Expenses before reductions | .80% | .85%A |
Expenses net of fee waivers, if any | .80% | .85%A |
Expenses net of all reductions | .79% | .83%A |
Net investment income (loss) | 1.83% G | .76% A |
Supplemental Data | | |
Net assets, end of period (000 omitted) | $ 35,125 | $ 107 |
Portfolio turnover rateF | 57% | 65% |
A Annualized
B Total returns for periods of less than one year are not annualized.
C Total returns would have been lower if certain expenses had not been reduced during the applicable periods shown.
D Calculated based on average shares outstanding during the period.
E Fees and expenses of any underlying Fidelity Central Funds are not included in the Fund's expense ratio. The Fund indirectly bears its proportionate share of the expenses of any underlying Fidelity Central Funds.
F Amount does not include the portfolio activity of any underlying Fidelity Central Funds.
G Investment income per share reflects a large, non-recurring dividend which amounted to $.21 per share. Excluding this non-recurring dividend, the ratio of net investment income (loss) to average net assets would have been 1.28%.
H For the period August 13, 2013 (commencement of sale of shares) to October 31, 2013.
I Expense ratios reflect operating expenses of the class. Expenses before reductions do not reflect amounts reimbursed by the investment adviser or reductions from brokerage service arrangements or reductions from other expense offset arrangements and do not represent the amount paid by the class during periods when reimbursements or reductions occur. Expenses net of fee waivers reflect expenses after reimbursement by the investment adviser but prior to reductions from brokerage service arrangements or other expense offset arrangements. Expenses net of all reductions represent the net expenses paid by the class.
J Amount represents less than $.01 per share.
See accompanying notes which are an integral part of the financial statements.
Annual Report
Notes to Financial Statements
For the period ended October 31, 2014
(Amounts in thousands except percentages)
1. Organization.
Fidelity International Discovery Fund (the Fund) is a fund of Fidelity Investment Trust (the Trust) and is authorized to issue an unlimited number of shares. The Trust is registered under the Investment Company Act of 1940, as amended (the 1940 Act), as an open-end management investment company organized as a Massachusetts business trust. The Fund offers Class A, Class T, Class C, International Discovery, Class K, Institutional Class and Class Z shares, each of which, along with Class B shares, has equal rights as to assets and voting privileges. Class B shares are closed to new accounts and additional purchases, except for exchanges and reinvestments. Each class has exclusive voting rights with respect to matters that affect that class. Class B shares will automatically convert to Class A shares after a holding period of seven years from the initial date of purchase.
2. Investments in Fidelity Central Funds.
The Fund invests in Fidelity Central Funds, which are open-end investment companies generally available only to other investment companies and accounts managed by the investment adviser and its affiliates. The Fund's Schedule of Investments lists each of the Fidelity Central Funds held as of period end, if any, as an investment of the Fund, but does not include the underlying holdings of each Fidelity Central Fund. As an Investing Fund, the Fund indirectly bears its proportionate share of the expenses of the underlying Fidelity Central Funds.
The Money Market Central Funds seek preservation of capital and current income and are managed by Fidelity Investments Money Management, Inc. (FIMM), an affiliate of the investment adviser. Annualized expenses of the Money Market Central Funds as of their most recent shareholder report date are less than .01%.
A complete unaudited list of holdings for each Fidelity Central Fund is available upon request or at the Securities and Exchange Commission (the SEC) website at www.sec.gov. In addition, the financial statements of the Fidelity Central Funds, which are not covered by the Fund's Report of Independent Registered Public Accounting Firm, are available on the SEC website or upon request.
3. Significant Accounting Policies.
The financial statements have been prepared in conformity with accounting principles generally accepted in the United States of America (GAAP), which require management to make certain estimates and assumptions at the date of the financial statements. Actual results could differ from those estimates. Subsequent events, if any, through the date that the financial statements were issued have been evaluated in the preparation of
Annual Report
3. Significant Accounting Policies - continued
the financial statements. The following summarizes the significant accounting policies of the Fund:
Investment Valuation. Investments are valued as of 4:00 p.m. Eastern time on the last calendar day of the period. In accordance with valuation policies and procedures approved by the Board of Trustees (the Board), the Fund attempts to obtain prices from one or more third party pricing vendors or brokers to value its investments. When current market prices, quotations or currency exchange rates are not readily available or reliable, investments will be fair valued in good faith by the Fidelity Management & Research Company (FMR) Fair Value Committee (the Committee), in accordance with procedures adopted by the Board. Factors used in determining fair value vary by investment type and may include market or investment specific events, changes in interest rates and credit quality. The frequency with which these procedures are used cannot be predicted and they may be utilized to a significant extent. The Committee oversees the Fund's valuation policies and procedures and is responsible for approving and reporting to the Board all fair value determinations.
The Fund categorizes the inputs to valuation techniques used to value its investments into a disclosure hierarchy consisting of three levels as shown below:
Level 1 - quoted prices in active markets for identical investments
Level 2 - other significant observable inputs (including quoted prices for similar investments, interest rates, prepayment speeds, etc.)
Level 3 - unobservable inputs (including the Fund's own assumptions based on the best information available)
Valuation techniques used to value the Fund's investments by major category are as follows:
Equity securities, including restricted securities, for which market quotations are readily available, are valued at the last reported sale price or official closing price as reported by a third party pricing vendor on the primary market or exchange on which they are traded and are categorized as Level 1 in the hierarchy. In the event there were no sales during the day or closing prices are not available, securities are valued at the last quoted bid price or may be valued using the last available price and are generally categorized as Level 2 in the hierarchy. For foreign equity securities, when market or security specific events arise, comparisons to the valuation of American Depositary Receipts (ADRs), futures contracts, Exchange-Traded Funds (ETFs) and certain indexes as well as quoted prices for similar securities may be used and would be categorized as Level 2 in the hierarchy. Utilizing these techniques may result in transfers between Level 1 and Level 2. For equity securities, including restricted securities, where observable inputs are limited, assumptions about market activity and risk are used and these securities may be categorized as Level 3 in the hierarchy.
Annual Report
Notes to Financial Statements - continued
(Amounts in thousands except percentages)
3. Significant Accounting Policies - continued
Investment Valuation - continued
Debt securities, including restricted securities, are valued based on evaluated prices received from third party pricing vendors or from brokers who make markets in such securities. Preferred securities and U.S. government and government agency obligations are valued by pricing vendors who utilize matrix pricing which considers yield or price of bonds of comparable quality, coupon, maturity and type or by broker-supplied prices. When independent prices are unavailable or unreliable, debt securities may be valued utilizing pricing methodologies which consider similar factors that would be used by third party pricing vendors. Debt securities are generally categorized as Level 2 in the hierarchy but may be Level 3 depending on the circumstances.
Futures contracts are valued at the settlement price established each day by the board of trade or exchange on which they are traded and are categorized as Level 1 in the hierarchy. Investments in open-end mutual funds, including the Fidelity Central Funds, are valued at their closing net asset value (NAV) each business day and are categorized as Level 1 in the hierarchy.
Changes in valuation techniques may result in transfers in or out of an assigned level within the disclosure hierarchy. The aggregate value of investments by input level, as of October 31, 2014, including information on transfers between Levels 1 and 2 is included at the end of the Fund's Schedule of Investments.
Foreign Currency. The Fund may use foreign currency contracts to facilitate transactions in foreign-denominated securities. Gains and losses from these transactions may arise from changes in the value of the foreign currency or if the counterparties do not perform under the contracts' terms.
Foreign-denominated assets, including investment securities, and liabilities are translated into U.S. dollars at the exchange rates at period end. Purchases and sales of investment securities, income and dividends received and expenses denominated in foreign currencies are translated into U.S. dollars at the exchange rate in effect on the transaction date.
The effects of exchange rate fluctuations on investments are included with the net realized and unrealized gain (loss) on investment securities. Other foreign currency transactions resulting in realized and unrealized gain (loss) are disclosed separately.
Investment Transactions and Income. For financial reporting purposes, the Fund's investment holdings and NAV include trades executed through the end of the last business day of the period. The NAV per share for processing shareholder transactions is calculated as of the close of business of the New York Stock Exchange (NYSE), normally 4:00 p.m. Eastern time and includes trades executed through the end of the prior business day. Gains and losses on securities sold are determined on the basis of identified
Annual Report
3. Significant Accounting Policies - continued
Investment Transactions and Income - continued
cost and may include proceeds received from litigation. Dividend income is recorded on the ex-dividend date, except for certain dividends from foreign securities where the ex-dividend date may have passed, which are recorded as soon as the Fund is informed of the ex-dividend date. Non-cash dividends included in dividend income, if any, are recorded at the fair market value of the securities received. Income and capital gain distributions from Fidelity Central Funds, if any, are recorded on the ex-dividend date. Large, non-recurring dividends recognized by the Fund are presented separately on the Statement of Operations as "Special Dividends" and the impact of these dividends is presented in the Financial Highlights. Interest income is accrued as earned and includes coupon interest and amortization of premium and accretion of discount on debt securities as applicable. Investment income is recorded net of foreign taxes withheld where recovery of such taxes is uncertain.
Class Allocations and Expenses. Investment income, realized and unrealized capital gains and losses, common expenses of the Fund, and certain fund-level expense reductions, if any, are allocated daily on a pro-rata basis to each class based on the relative net assets of each class to the total net assets of the Fund. Each class differs with respect to transfer agent and distribution and service plan fees incurred. Certain expense reductions may also differ by class. For the reporting period, the allocated portion of income and expenses to each class as a percent of its average net assets may vary due to the timing of recording these transactions in relation to fluctuating net assets of the classes. Expenses directly attributable to a fund are charged to that fund. Expenses attributable to more than one fund are allocated among the respective funds on the basis of relative net assets or other appropriate methods. Expense estimates are accrued in the period to which they relate and adjustments are made when actual amounts are known.
Deferred Trustee Compensation. Under a Deferred Compensation Plan (the Plan), independent Trustees may elect to defer receipt of a portion of their annual compensation. Deferred amounts are invested in a cross-section of Fidelity funds, are marked-to-market and remain in the Fund until distributed in accordance with the Plan. The investment of deferred amounts and the offsetting payable to the Trustees are included in the accompanying Statement of Assets and Liabilities.
Income Tax Information and Distributions to Shareholders. Each year, the Fund intends to qualify as a regulated investment company under Subchapter M of the Internal Revenue Code, including distributing substantially all of its taxable income and realized gains. As a result, no provision for U.S. Federal income taxes is required. As of October 31, 2014, the Fund did not have any unrecognized tax benefits in the financial statements; nor is the Fund aware of any tax positions for which it is reasonably possible that the total amounts of unrecognized tax benefits will significantly change in the next
Annual Report
Notes to Financial Statements - continued
(Amounts in thousands except percentages)
3. Significant Accounting Policies - continued
Income Tax Information and Distributions to Shareholders - continued
twelve months. The Fund files a U.S. federal tax return, in addition to state and local tax returns as required. The Fund's federal income tax returns are subject to examination by the Internal Revenue Service (IRS) for a period of three fiscal years after they are filed. State and local tax returns may be subject to examination for an additional fiscal year depending on the jurisdiction. Foreign taxes are provided for based on the Fund's understanding of the tax rules and rates that exist in the foreign markets in which it invests. The Fund is subject to a tax imposed on capital gains by certain countries in which it invests. An estimated deferred tax liability for net unrealized appreciation on the applicable securities is included in Other payables and accrued expenses on the Statement of Assets & Liabilities.
Distributions are declared and recorded on the ex-dividend date. Income dividends and capital gain distributions are declared separately for each class. Income and capital gain distributions are determined in accordance with income tax regulations, which may differ from GAAP. In addition, the Fund claimed a portion of the payment made to redeeming shareholders as a distribution for income tax purposes.
Capital accounts within the financial statements are adjusted for permanent book-tax differences. These adjustments have no impact on net assets or the results of operations. Capital accounts are not adjusted for temporary book-tax differences which will reverse in a subsequent period.
Book-tax differences are primarily due to futures contracts, foreign currency transactions, passive foreign investment companies (PFIC), market discount, deferred trustees compensation, capital loss carryforwards and losses deferred due to wash sales.
The federal tax cost of investment securities and unrealized appreciation (depreciation) as of period end were as follows:
Gross unrealized appreciation | $ 1,714,728 |
Gross unrealized depreciation | (439,338) |
Net unrealized appreciation (depreciation) on securities | $ 1,275,390 |
| |
Tax Cost | $ 9,771,538 |
The tax-based components of distributable earnings as of period end were as follows:
Undistributed ordinary income | $ 68,892 |
Capital loss carryforward | $ (227,245) |
Net unrealized appreciation (depreciation) on securities and other investments | $ 1,273,334 |
Annual Report
3. Significant Accounting Policies - continued
Income Tax Information and Distributions to Shareholders - continued
Capital loss carryforwards are only available to offset future capital gains of the Fund to the extent provided by regulations and may be limited. Under the Regulated Investment Company Modernization Act of 2010 (the Act), the Fund is permitted to carry forward capital losses incurred in taxable years beginning after December 22, 2010 for an unlimited period and such capital losses are required to be used prior to any losses that expire. The capital loss carryforward information presented below, including any applicable limitation, is estimated as of fiscal period end and is subject to adjustment.
Fiscal year of expiration | |
2017 | $ (227,245) |
The tax character of distributions paid was as follows:
| October 31, 2014 | October 31, 2013 |
Ordinary Income | $ 224,912 | $ 154,444 |
Short-Term Trading (Redemption) Fees. Shares held by investors in the Fund less than 30 days may have been subject to a redemption fee equal to 1.00% of the NAV of shares redeemed. All redemption fees, which reduce the proceeds of the shareholder redemption, are retained by the Fund and accounted for as an addition to paid in capital.
Restricted Securities. The Fund may invest in securities that are subject to legal or contractual restrictions on resale. These securities generally may be resold in transactions exempt from registration or to the public if the securities are registered. Disposal of these securities may involve time-consuming negotiations and expense, and prompt sale at an acceptable price may be difficult. Information regarding restricted securities is included at the end of the Fund's Schedule of Investments.
New Accounting Pronouncement. In June 2014, the Financial Accounting Standards Board issued Accounting Standard Update No. 2014-11, Repurchase-to-Maturity Transactions, Repurchase Financings, and Disclosures. The Update amends the accounting for certain repurchase agreements and expands disclosure requirements for reverse repurchase agreements, securities lending and other similar transactions. The disclosure requirements are effective for annual and interim reporting periods beginning after December 15, 2014. Management is currently evaluating the impact of the Update on the Fund's financial statements and related disclosures.
4. Derivative Instruments.
Risk Exposures and the Use of Derivative Instruments. The Fund's investment objective allows the Fund to enter into various types of derivative contracts, including
Annual Report
Notes to Financial Statements - continued
(Amounts in thousands except percentages)
4. Derivative Instruments - continued
Risk Exposures and the Use of Derivative Instruments - continued
futures contracts. Derivatives are investments whose value is primarily derived from underlying assets, indices or reference rates and may be transacted on an exchange or over-the-counter (OTC). Derivatives may involve a future commitment to buy or sell a specified asset based on specified terms, to exchange future cash flows at periodic intervals based on a notional principal amount, or for one party to make one or more payments upon the occurrence of specified events in exchange for periodic payments from the other party.
The Fund used derivatives to increase returns and to manage exposure to certain risks as defined below. The success of any strategy involving derivatives depends on analysis of numerous economic factors, and if the strategies for investment do not work as intended, the Fund may not achieve its objectives.
The Fund's use of derivatives increased or decreased its exposure to the following risk:
Equity Risk | Equity risk relates to the fluctuations in the value of financial instruments as a result of changes in market prices (other than those arising from interest rate risk or foreign exchange risk), whether caused by factors specific to an individual investment, its issuer, or all factors affecting all instruments traded in a market or market segment. |
The Fund is also exposed to additional risks from investing in derivatives, such as liquidity risk and counterparty credit risk. Liquidity risk is the risk that the Fund will be unable to close out the derivative in the open market in a timely manner. Counterparty credit risk is the risk that the counterparty will not be able to fulfill its obligation to the Fund. Counterparty credit risk related to exchange-traded futures contracts may be mitigated by the protection provided by the exchange on which they trade.
Investing in derivatives may involve greater risks than investing in the underlying assets directly and, to varying degrees, may involve risk of loss in excess of any initial investment and collateral received and amounts recognized in the Statement of Assets and Liabilities. In addition, there may be the risk that the change in value of the derivative contract does not correspond to the change in value of the underlying instrument.
Futures Contracts. A futures contract is an agreement between two parties to buy or sell a specified underlying instrument for a fixed price at a specified future date. The Fund used futures contracts to manage its exposure to the stock market.
Upon entering into a futures contract, a fund is required to deposit either cash or securities (initial margin) with a clearing broker in an amount equal to a certain percentage of the face value of the contract. Futures contracts are marked-to-market daily and subsequent daily payments variation margin are made or received by a fund depending on the
Annual Report
4. Derivative Instruments - continued
Futures Contracts - continued
daily fluctuations in the value of the futures contracts and are recorded as unrealized appreciation or (depreciation). This receivable and/or payable, if any, is included in daily variation margin for derivative instruments in the Statement of Assets and Liabilities. Realized gain or (loss) is recorded upon the expiration or closing of a futures contract.
Any open futures contracts at period end are presented in the Schedule of Investments under the caption "Futures Contracts." The underlying face amount at value reflects each contract's exposure to the underlying instrument or index at period end and is
representative of volume of activity during the period. Securities deposited to meet initial margin requirements are identified in the Schedule of Investments.
During the period the Fund recognized net realized gain (loss) of $16,266 and a change in net unrealized appreciation (depreciation) of $20,360 related to its investment in futures contracts. These amounts are included in the Statement of Operations.
5. Purchases and Sales of Investments.
Purchases and sales of securities, other than short-term securities, aggregated $6,348,453 and $6,576,338, respectively.
6. Fees and Other Transactions with Affiliates.
Management Fee. Fidelity Management & Research Company (the investment adviser) and its affiliates provide the Fund with investment management related services for which the Fund pays a monthly management fee. The management fee is the sum of an individual fund fee rate that is based on an annual rate of .424% of the Fund's average net assets and an annualized group fee rate that averaged .25% during the period. Prior to August 1, 2014 the individual fund fee rate was .45%. The group fee rate is based upon the average net assets of all the mutual funds advised by the investment adviser, including any mutual funds previously advised by the investment adviser that are currently advised by Fidelity SelectCo, LLC, an affiliate of the investment adviser. The group fee rate decreases as assets under management increase and increases as assets under management decrease. In addition, the management fee is subject to a performance adjustment (up to a maximum of ± .20% of the Fund's average net assets over a 36 month performance period). The upward or downward adjustment to the management fee is based on the relative investment performance of International Discovery as compared to its benchmark index, the MSCI EAFE Index, over the same 36 month performance period. For the reporting period, the total annual management fee rate, including the performance adjustment, was .72% of the Fund's average net assets. The performance adjustment included in the management fee rate may be higher or lower
Annual Report
Notes to Financial Statements - continued
(Amounts in thousands except percentages)
6. Fees and Other Transactions with Affiliates - continued
Management Fee - continued
than the maximum performance adjustment rate due to the difference between the average net assets for the reporting and performance periods.
Distribution and Service Plan Fees. In accordance with Rule 12b-1 of the 1940 Act, the Fund has adopted separate Distribution and Service Plans for each class of shares. Certain classes pay Fidelity Distributors Corporation (FDC), an affiliate of the investment adviser, separate Distribution and Service Fees, each of which is based on an annual percentage of each class' average net assets. In addition, FDC may pay financial intermediaries for selling shares of the Fund and providing shareholder support services.
For the period, the Distribution and Service Fee rates, total fees and amounts retained by FDC were as follows:
| Distribution
Fee | Service
Fee | Total Fees | Retained
by FDC |
Class A | -% | .25% | $ 813 | $ 6 |
Class T | .25% | .25% | 255 | 1 |
Class B | .75% | .25% | 58 | 44 |
Class C | .75% | .25% | 382 | 44 |
| | | $ 1,508 | $ 95 |
Sales Load. FDC may receive a front-end sales charge of up to 5.75% for selling Class A shares and 3.50% for selling Class T shares, some of which is paid to financial intermediaries for selling shares of the Fund. Depending on the holding period, FDC may receive contingent deferred sales charges levied on Class A, Class T, Class B, and Class C redemptions. The deferred sales charges range from 5.00% to 1.00% for Class B shares, 1.00% for Class C shares, 1.00% for certain purchases of Class A shares and .25% for certain purchases of Class T shares.
For the period, sales charge amounts retained by FDC were as follows:
| Retained
by FDC |
Class A | $ 59 |
Class T | 7 |
Class B* | 3 |
Class C* | 5 |
| $ 74 |
* When Class B and Class C shares are initially sold, FDC pays commissions from its own resources to financial intermediaries through which the sales are made.
Annual Report
6. Fees and Other Transactions with Affiliates - continued
Transfer Agent Fees. Fidelity Investments Institutional Operations Company, Inc., (FIIOC), an affiliate of the investment adviser is the transfer, dividend disbursing and shareholder servicing agent for each class of the Fund. FIIOC receives account fees and asset-based fees that vary according to the account size and type of account of the shareholders of the respective classes of the Fund, except for Class Z. FIIOC receives an asset-based fee of Class K's and Class Z's average net assets. FIIOC receives an asset-based fee of Class Z's average net assets. FIIOC pays for typesetting, printing and mailing of shareholder reports, except proxy statements.
For the period, transfer agent fees for each applicable class were as follows:
| Amount | % of
Class-Level Average
Net Assets |
Class A | $ 904 | .28 |
Class T | 134 | .26 |
Class B | 18 | .30 |
Class C | 105 | .28 |
International Discovery | 14,295 | .18 |
Class K | 1,219 | .05 |
Institutional Class | 1,088 | .18 |
Class Z | 8 | .05 |
| $ 17,771 | |
Accounting and Security Lending Fees. Fidelity Service Company, Inc. (FSC), an affiliate of the investment adviser, maintains the Fund's accounting records. The accounting fee is based on the level of average net assets for each month. Under a separate contract, FSC administers the security lending program. The security lending fee is based on the number and duration of lending transactions.
Brokerage Commissions. The Fund placed a portion of its portfolio transactions with brokerage firms which are affiliates of the investment adviser. Brokerage commissions are included in net realized gain (loss) and change in net unrealized appreciation (depreciation) in the Statement of Operations. The commissions paid to these affiliated firms were $11 for the period.
Other. During the period, the investment adviser reimbursed the Fund for certain losses in the amount of $2.
7. Committed Line of Credit.
The Fund participates with other funds managed by the investment adviser or an affiliate in a $4.25 billion credit facility (the "line of credit") to be utilized for temporary or emergency purposes to fund shareholder redemptions or for other short-term liquidity purposes. The Fund has agreed to pay commitment fees on its pro-rata portion of the line
Annual Report
Notes to Financial Statements - continued
(Amounts in thousands except percentages)
7. Committed Line of Credit - continued
of credit, which amounted to $19 and is reflected in Miscellaneous expenses on the Statement of Operations. During the period, the Fund did not borrow on this line of credit.
8. Security Lending.
The Fund lends portfolio securities through a lending agent from time to time in order to earn additional income. For equity securities, a lending agent is used and may loan securities to certain qualified borrowers, including Fidelity Capital Markets (FCM), a broker-dealer affiliated with the Fund. On the settlement date of the loan, the Fund receives collateral (in the form of U.S. Treasury obligations, letters of credit and/or cash) against the loaned securities and maintains collateral in an amount not less than 100% of the market value of the loaned securities during the period of the loan. The market value of the loaned securities is determined at the close of business of the Fund and any additional required collateral is delivered to the Fund on the next business day. If the borrower defaults on its obligation to return the securities loaned because of insolvency or other reasons, the Fund may apply collateral received from the borrower against the obligation. The Fund may experience delays and costs in recovering the securities loaned. Any cash collateral received is invested in the Fidelity Securities Lending Cash Central Fund. The value of loaned securities and cash collateral at period end are disclosed on the Fund's Statement of Assets and Liabilities. At period end, there were no security loans outstanding with FCM. Security lending income represents the income earned on investing cash collateral, less rebates paid to borrowers and any lending agent fees associated with the loan, plus any premium payments received for lending certain types of securities. Security lending income is presented in the Statement of Operations as a component of income from Fidelity Central Funds. Total security lending income during the period amounted to $5,278, including $7 from securities loaned to FCM.
9. Expense Reductions.
Commissions paid to certain brokers with whom the investment adviser, or its affiliates, places trades on behalf of the Fund include an amount in addition to trade execution, which may be rebated back to the Fund to offset certain expenses. This amount totaled $317 for the period.
In addition, the investment adviser reimbursed a portion of the Fund's operating expenses during the period in the amount of $28.
Annual Report
10. Distributions to Shareholders.
Distributions to shareholders of each class were as follows:
Years ended October 31, | 2014 | 2013 |
From net investment income | | |
Class A | $ 2,857 | $ 4,138 |
Class T | 344 | 492 |
Class B | 2 | 34 |
Class C | 79 | 186 |
International Discovery | 93,065 | 101,466 |
Class K | 33,983 | 34,651 |
Institutional Class | 5,936 | 5,064 |
Class Z | 60 | - |
Total | $ 136,326 | $ 146,031 |
From net realized gain | 2014 | 2013 |
Class A | $ 2,660 | $ 297 |
Class T | 423 | 46 |
Class B | 52 | 7 |
Class C | 295 | 30 |
International Discovery | 61,190 | 5,914 |
Class K | 20,093 | 1,827 |
Institutional Class | 3,838 | 292 |
Class Z | 35 | - |
Total | $ 88,586 | $ 8,413 |
11. Share Transactions.
Share transactions for each class were as follows and may contain automatic conversions between classes or exchanges between funds:
| Shares | Shares | Dollars | Dollars |
Years ended October 31, | 2014 | 2013 A | 2014 | 2013 A |
Class A | | | | |
Shares sold | 1,382 | 1,772 | $ 54,489 | $ 62,186 |
Reinvestment of distributions | 137 | 132 | 5,280 | 4,249 |
Shares redeemed | (2,632) | (2,553) | (104,067) | (88,988) |
Net increase (decrease) | (1,113) | (649) | $ (44,298) | $ (22,553) |
Class T | | | | |
Shares sold | 200 | 227 | $ 7,804 | $ 7,911 |
Reinvestment of distributions | 19 | 16 | 736 | 512 |
Shares redeemed | (311) | (347) | (12,118) | (11,997) |
Net increase (decrease) | (92) | (104) | $ (3,578) | $ (3,574) |
Class B | | | | |
Shares sold | 6 | 4 | $ 233 | $ 137 |
Reinvestment of distributions | 1 | 1 | 51 | 39 |
Shares redeemed | (58) | (75) | (2,266) | (2,570) |
Net increase (decrease) | (51) | (70) | $ (1,982) | $ (2,394) |
Annual Report
Notes to Financial Statements - continued
(Amounts in thousands except percentages)
11. Share Transactions - continued
| Shares | Shares | Dollars | Dollars |
Years ended October 31, | 2014 | 2013 A | 2014 | 2013 A |
Class C | | | | |
Shares sold | 232 | 184 | $ 9,059 | $ 6,532 |
Reinvestment of distributions | 9 | 6 | 337 | 193 |
Shares redeemed | (250) | (207) | (9,726) | (7,250) |
Net increase (decrease) | (9) | (17) | $ (330) | $ (525) |
International Discovery | | | | |
Shares sold | 28,809 | 37,338 | $ 1,144,588 | $ 1,332,523 |
Reinvestment of distributions | 3,813 | 3,176 | 148,138 | 102,608 |
Shares redeemed | (37,231) | (31,569) | (1,476,965) | (1,103,313) |
Net increase (decrease) | (4,609) | 8,945 | $ (184,239) | $ 331,818 |
Class K | | | | |
Shares sold | 15,775 | 19,989 | $ 628,261 | $ 699,723 |
Reinvestment of distributions | 1,396 | 1,132 | 54,076 | 36,478 |
Shares redeemed | (18,729) | (12,053) | (741,205) | (423,712) |
Net increase (decrease) | (1,558) | 9,068 | $ (58,868) | $ 312,489 |
Institutional Class | | | | |
Shares sold | 10,468 | 4,893 | $ 410,346 | $ 175,669 |
Reinvestment of distributions | 91 | 68 | 3,529 | 2,182 |
Shares redeemed | (5,852) | (2,219) | (225,868) | (78,500) |
Net increase (decrease) | 4,707 | 2,742 | $ 188,007 | $ 99,351 |
Class Z | | | | |
Shares sold | 993 | 3 | $ 39,070 | $ 100 |
Reinvestment of distributions | 2 | - | 95 | - |
Shares redeemed | (96) | - | (3,785) | - |
Net increase (decrease) | 899 | 3 | $ 35,380 | $ 100 |
A Share transactions for Class Z are for the period August 13, 2013 (commencement of sale of shares) to October 31, 2014.
12. Other.
The Fund's organizational documents provide former and current trustees and officers with a limited indemnification against liabilities arising in connection with the performance of their duties to the Fund. In the normal course of business, the Fund may also enter into contracts that provide general indemnifications. The Fund's maximum exposure under these arrangements is unknown as this would be dependent on future claims that may be made against the Fund. The risk of material loss from such claims is considered remote.
At the end of the period, Strategic Advisers International Fund was the owner of record of approximately 15% of the total outstanding shares of the Fund.
Annual Report
To the Trustees of Fidelity Investment Trust and the Shareholders of Fidelity International Discovery Fund:
In our opinion, the accompanying statement of assets and liabilities, including the schedule of investments, and the related statements of operations and of changes in net assets and the financial highlights present fairly, in all material respects, the financial position of Fidelity International Discovery Fund (a fund of Fidelity Investment Trust) at October 31, 2014, the results of its operations for the year then ended, the changes in its net assets for each of the two years in the period then ended and the financial highlights for each of the periods indicated, in conformity with accounting principles generally accepted in the United States of America. These financial statements and financial highlights (hereafter referred to as "financial statements") are the responsibility of the Fidelity International Discovery Fund's management. Our responsibility is to express an opinion on these financial statements based on our audits. We conducted our audits of these financial statements in accordance with the standards of the Public Company Accounting Oversight Board (United States). Those standards require that we plan and perform the audit to obtain reasonable assurance about whether the financial statements are free of material misstatement. An audit includes examining, on a test basis, evidence supporting the amounts and disclosures in the financial statements, assessing the accounting principles used and significant estimates made by management, and evaluating the overall financial statement presentation. We believe that our audits, which included confirmation of securities at October 31, 2014 by correspondence with the custodian and brokers, provide a reasonable basis for our opinion.
PricewaterhouseCoopers LLP
Boston, Massachusetts
December 19, 2014
Annual Report
The Trustees, Member of the Advisory Board, and officers of the trust and fund, as applicable, are listed below. The Board of Trustees governs the fund and is responsible for protecting the interests of shareholders. The Trustees are experienced executives who meet periodically throughout the year to oversee the fund's activities, review contractual arrangements with companies that provide services to the fund, oversee management of the risks associated with such activities and contractual arrangements, and review the fund's performance. Except for James C. Curvey, each of the Trustees oversees 174 funds. Mr. Curvey oversees 407 funds.
The Trustees hold office without limit in time except that (a) any Trustee may resign; (b) any Trustee may be removed by written instrument, signed by at least two-thirds of the number of Trustees prior to such removal; (c) any Trustee who requests to be retired or who has become incapacitated by illness or injury may be retired by written instrument signed by a majority of the other Trustees; and (d) any Trustee may be removed at any special meeting of shareholders by a two-thirds vote of the outstanding voting securities of the trust. Each Trustee who is not an interested person (as defined in the 1940 Act) of the trust and the fund (Independent Trustee), shall retire not later than the last day of the calendar year in which his or her 75th birthday occurs. The Independent Trustees may waive this mandatory retirement age policy with respect to individual Trustees. The officers and Advisory Board Member hold office without limit in time, except that any officer and Advisory Board Member may resign or may be removed by a vote of a majority of the Trustees at any regular meeting or any special meeting of the Trustees. Except as indicated, each individual has held the office shown or other offices in the same company for the past five years.
Experience, Skills, Attributes, and Qualifications of the Fund's Trustees. The Governance and Nominating Committee has adopted a statement of policy that describes the experience, qualifications, attributes, and skills that are necessary and desirable for potential Independent Trustee candidates (Statement of Policy). The Board believes that each Trustee satisfied at the time he or she was initially elected or appointed a Trustee, and continues to satisfy, the standards contemplated by the Statement of Policy. The Governance and Nominating Committee also engages professional search firms to help identify potential Independent Trustee candidates who have the experience, qualifications, attributes, and skills consistent with the Statement of Policy. From time to time, additional criteria based on the composition and skills of the current Independent Trustees, as well as experience or skills that may be appropriate in light of future changes to board composition, business conditions, and regulatory or other developments, have also been considered by the professional search firms and the Governance and Nominating Committee. In addition, the Board takes into account the Trustees' commitment and participation in Board and committee meetings, as well as their leadership of standing and ad hoc committees throughout their tenure.
In determining that a particular Trustee was and continues to be qualified to serve as a Trustee, the Board has considered a variety of criteria, none of which, in isolation, was controlling. The Board believes that, collectively, the Trustees have balanced and diverse experience, qualifications, attributes, and skills, which allow the Board to operate effectively in governing the fund and protecting the interests of shareholders. Information about the specific experience, skills, attributes, and qualifications of each Trustee, which in each case led to the Board's conclusion that the Trustee should serve (or continue to serve) as a trustee of the fund, is provided below.
Annual Report
Trustees and Officers - continued
Board Structure and Oversight Function. James C. Curvey is an interested person (as defined in the 1940 Act) and currently serves as Chairman. The Trustees have determined that an interested Chairman is appropriate and benefits shareholders because an interested Chairman has a personal and professional stake in the quality and continuity of services provided to the fund. Independent Trustees exercise their informed business judgment to appoint an individual of their choosing to serve as Chairman, regardless of whether the Trustee happens to be independent or a member of management. The Independent Trustees have determined that they can act independently and effectively without having an Independent Trustee serve as Chairman and that a key structural component for assuring that they are in a position to do so is for the Independent Trustees to constitute a substantial majority for the Board. The Independent Trustees also regularly meet in executive session. Ned C. Lautenbach serves as Chairman of the Independent Trustees and as such (i) acts as a liaison between the Independent Trustees and management with respect to matters important to the Independent Trustees and (ii) with management prepares agendas for Board meetings.
Fidelity funds are overseen by different Boards of Trustees. The fund's Board oversees Fidelity's equity and high income funds and another Board oversees Fidelity's investment-grade bond, money market, and asset allocation funds. The asset allocation funds may invest in Fidelity funds overseen by the fund's Board. The use of separate Boards, each with its own committee structure, allows the Trustees of each group of Fidelity funds to focus on the unique issues of the funds they oversee, including common research, investment, and operational issues. On occasion, the separate Boards establish joint committees to address issues of overlapping consequences for the Fidelity funds overseen by each Board.
The Trustees operate using a system of committees to facilitate the timely and efficient consideration of all matters of importance to the Trustees, the fund, and fund shareholders and to facilitate compliance with legal and regulatory requirements and oversight of the fund's activities and associated risks. The Board, acting through its committees, has charged FMR and its affiliates with (i) identifying events or circumstances the occurrence of which could have demonstrably adverse effects on the fund's business and/or reputation; (ii) implementing processes and controls to lessen the possibility that such events or circumstances occur or to mitigate the effects of such events or circumstances if they do occur; and (iii) creating and maintaining a system designed to evaluate continuously business and market conditions in order to facilitate the identification and implementation processes described in (i) and (ii) above. Because the day-to-day operations and activities of the fund are carried out by or through FMR, its affiliates and other service providers, the fund's exposure to risks is mitigated but not eliminated by the processes overseen by the Trustees. While each of the Board's committees has responsibility for overseeing different aspects of the fund's activities, oversight is exercised primarily through the Operations, Audit, and Compliance Committees. In addition, the Independent Trustees have worked with FMR to enhance the Board's oversight of investment and financial risks, legal and regulatory risks, technology risks, and operational risks, including the development of additional risk reporting to the Board. For example, a working group comprised of Independent Trustees and FMR has worked and continues to work to review the Fidelity funds' valuation-related activities, reporting and risk management. Appropriate personnel, including but not limited to the fund's Chief Compliance Officer (CCO), FMR's internal auditor, the independent accountants, the fund's Treasurer and portfolio management personnel, make periodic reports to the Board's committees, as appropriate, including an annual review of FMR's risk management program for the Fidelity funds. The responsibilities of each standing committee, including their oversight responsibilities, are described further under "Standing Committees of the Fund's Trustees."
Annual Report
The fund's Statement of Additional Information (SAI) includes more information about the Trustees. To request a free copy, call Fidelity at 1-800-544-8544.
Interested Trustees*:
Correspondence intended for each Trustee who is an interested person may be sent to Fidelity Investments, 245 Summer Street, Boston, Massachusetts 02210.
Name, Year of Birth; Principal Occupations and Other Relevant Experience+ |
James C. Curvey (1935) |
Year of Election or Appointment: 2007 Trustee Chairman of the Board of Trustees |
| Mr. Curvey also serves as Trustee of other Fidelity funds. Mr. Curvey is a Director of Fidelity Research & Analysis Co. (2009-present), and Vice Chairman (2007-present) and Director of FMR LLC. In addition, Mr. Curvey serves as an Overseer for the Boston Symphony Orchestra and a member of the board of Artis-Naples, Naples, Florida, and as a Trustee for Brewster Academy, Wolfeboro, New Hampshire. Previously, Mr. Curvey served as a Director of Fidelity Investments Money Management, Inc. (2009-2014), a Director of FMR (2007-2014), and a Director of FMR Co., Inc. (2007-2014). |
Charles S. Morrison (1960) |
Year of Election or Appointment: 2014 Trustee |
| Mr. Morrison also serves as Trustee of other funds. He serves as a Director of Fidelity Investments Money Management, Inc. (FIMM) (2014-present), Director of Fidelity SelectCo, LLC (2014-present), President, Asset Management (2014-present) and is an employee of Fidelity Investments. Previously, Mr. Morrison served as Vice President of Fidelity's Fixed Income and Asset Allocation Funds (2012-2014), President, Fixed Income (2011-2014), Vice President of Fidelity's Money Market Funds (2005-2009), President, Money Market Group Leader of FMR (2009), and Senior Vice President, Money Market Group of FMR (2004-2009). Mr. Morrison also served as Vice President of Fidelity's Bond Funds (2002-2005), certain Balanced Funds (2002-2005), and certain Asset Allocation Funds (2002-2007), and as Senior Vice President (2002-2005) of Fidelity's Bond Division. |
* Trustees have been determined to be "Interested Trustees" by virtue of, among other things, their affiliation with the trust or various entities under common control with FMR.
+ The information above includes each Trustee's principal occupation during the last five years and other information relating to the experience, attributes, and skills relevant to each Trustee's qualifications to serve as a Trustee, which led to the conclusion that each Trustee should serve as a Trustee for the fund.
Annual Report
Independent Trustees:
Correspondence intended for each Independent Trustee (that is, the Trustees other than the Interested Trustees) may be sent to Fidelity Investments, P.O. Box 55235, Boston, Massachusetts 02205-5235.
Name, Year of Birth; Principal Occupations and Other Relevant Experience+ |
Dennis J. Dirks (1948) |
Year of Election or Appointment: 2005 Trustee |
| Mr. Dirks also serves as Trustee of other Fidelity funds. Prior to his retirement in May 2003, Mr. Dirks was Chief Operating Officer and a member of the Board of The Depository Trust & Clearing Corporation (DTCC). He also served as President, Chief Operating Officer, and Board member of The Depository Trust Company (DTC) and President and Board member of the National Securities Clearing Corporation (NSCC). In addition, Mr. Dirks served as Chief Executive Officer and Board member of the Government Securities Clearing Corporation, Chief Executive Officer and Board member of the Mortgage-Backed Securities Clearing Corporation, as a Trustee and a member of the Finance Committee of Manhattan College (2005-2008), and as a Trustee and a member of the Finance Committee of AHRC of Nassau County (2006-2008). Mr. Dirks is a member of the Independent Directors Council (IDC) Governing Council (2010-present) and Board of Directors for The Brookville Center for Children's Services, Inc. (2009-present). |
Alan J. Lacy (1953) |
Year of Election or Appointment: 2008 Trustee |
| Mr. Lacy also serves as Trustee of other Fidelity funds. Mr. Lacy serves as Senior Adviser (2007-present) of Oak Hill Capital Partners, L.P. (private equity). Mr. Lacy also served as Chief Executive Officer (2000-2005) and Vice Chairman (2005-2006) of Sears Holdings Corporation and Sears, Roebuck and Co. (retail). In addition, Mr. Lacy serves as a member of the Board of Directors of Dave & Buster's Entertainment, Inc. (restaurant and entertainment complexes, 2010-present), Earth Fare, Inc. (retail grocery, 2012-present), The Hillman Companies, Inc. (hardware wholesalers, 2010-present), and Bristol-Myers Squibb Company (global pharmaceuticals, 2008-present). Mr. Lacy is a member of the Board of Trustees of The National Parks Conservation Association (2006-present). Previously, Mr. Lacy served as Chairman of the Board of Trustees of the National Parks Conservation Association (2008-2011) and as a member of the Board of Directors for the Western Union Company (global money transfer, 2006-2011). |
Ned C. Lautenbach (1944) |
Year of Election or Appointment: 2000 Trustee Chairman of the Independent Trustees |
| Mr. Lautenbach also serves as Trustee of other Fidelity funds. Mr. Lautenbach currently serves as the Lead Director of the Eaton Corporation Board of Directors (diversified industrial, 1997-present). Mr. Lautenbach is Chairman of the Board of Directors of the Philharmonic Center for the Arts in Naples, Florida (2012-present) and a member of the Council on Foreign Relations (1994-present). Previously, Mr. Lautenbach was a Partner/Advisory Partner at Clayton, Dubilier & Rice, LLC (private equity investment, 1998-2010), as well as a Director of Sony Corporation (2006-2007). |
Joseph Mauriello (1944) |
Year of Election or Appointment: 2008 Trustee |
| Mr. Mauriello also serves as Trustee of other Fidelity funds. Prior to his retirement in January 2006, Mr. Mauriello served in numerous senior management positions including Deputy Chairman and Chief Operating Officer (2004-2005), and Vice Chairman of Financial Services (2002-2004) of KPMG LLP US (professional services, 1965-2005). Mr. Mauriello currently serves as a member of the Board of Directors of XL Group plc. (global insurance and re-insurance, 2006-present). Previously, Mr. Mauriello served as a Director of the Hamilton Funds of the Bank of New York (2006-2007) and of Arcadia Resources Inc. (health care services and products, 2007-2012). |
Robert W. Selander (1950) |
Year of Election or Appointment: 2011 Trustee |
| Mr. Selander also serves as Trustee of other Fidelity funds. Previously, Mr. Selander served as a Member of the Advisory Board of other Fidelity funds (2011), and Executive Vice Chairman (2010), Chief Executive Officer (2009-2010), and President and Chief Executive Officer (1997-2009) of Mastercard, Inc. |
Cornelia M. Small (1944) |
Year of Election or Appointment: 2005 Trustee |
| Ms. Small also serves as Trustee of other Fidelity funds. Ms. Small is a member of the Board of Directors (2009-present) and Chair of the Investment Committee (2010-present) of the Teagle Foundation. Ms. Small also serves on the Investment Committee of the Berkshire Taconic Community Foundation (2008-present). Previously, Ms. Small served as Chairperson (2002-2008) and a member of the Investment Committee and Chairperson (2008-2012) and a member of the Board of Trustees of Smith College. In addition, Ms. Small served as Chief Investment Officer, Director of Global Equity Investments, and a member of the Board of Directors of Scudder, Stevens & Clark and Scudder Kemper Investments. |
William S. Stavropoulos (1939) |
Year of Election or Appointment: 2001 Trustee Vice Chairman of the Independent Trustees |
| Mr. Stavropoulos also serves as Trustee of other Fidelity funds. Mr. Stavropoulos serves as President and Founder of the Michigan Baseball Foundation, the Great Lakes Loons (2007-present). Mr. Stavropoulos is Chairman Emeritus of the Board of Directors of The Dow Chemical Company, where he previously served in numerous senior management positions, including President, CEO (1995-2000; 2002-2004), Chairman of the Executive Committee (2000-2006), and as a member of the Board of Directors (1990-2006). Currently, Mr. Stavropoulos is Chairman of the Board of Directors of Univar Inc. (global distributor of commodity and specialty chemicals), a Director of Teradata Corporation (data warehousing and technology solutions), and Maersk Inc. (industrial conglomerate), and a member of the Advisory Board for Metalmark Capital LLC (private equity investment, 2005-present). Mr. Stavropoulos is an operating advisor to Clayton, Dubilier & Rice, LLC (private equity investment). In addition, Mr. Stavropoulos is a member of the University of Notre Dame Advisory Council for the College of Science, a Trustee of the Rollin L. Gerstacker Foundation, and a Director of the Naples Philharmonic Center for the Arts. Previously, Mr. Stavropoulos served as a Director of Chemical Financial Corporation (bank holding company, 1993-2012) and Tyco International, Ltd. (multinational manufacturing and services, 2007-2012). |
David M. Thomas (1949) |
Year of Election or Appointment: 2008 Trustee |
| Mr. Thomas also serves as Trustee of other Fidelity funds. Mr. Thomas serves as Non-Executive Chairman of the Board of Directors of Fortune Brands Home and Security (home and security products, 2011-present), and as a member of the Board of Directors of Interpublic Group of Companies, Inc. (marketing communication, 2004-present). Previously, Mr. Thomas served as Executive Chairman (2005-2006) and Chairman and Chief Executive Officer (2000-2005) of IMS Health, Inc. (pharmaceutical and healthcare information solutions), and a Director of Fortune Brands, Inc. (consumer products, 2000-2011). |
+ The information above includes each Trustee's principal occupation during the last five years and other information relating to the experience, attributes, and skills relevant to each Trustee's qualifications to serve as a Trustee, which led to the conclusion that each Trustee should serve as a Trustee for the fund.
Advisory Board Member and Officers:
Correspondence intended for each officer and Peter S. Lynch may be sent to Fidelity Investments, 245 Summer Street, Boston, Massachusetts 02210. Officers appear below in alphabetical order.
Name, Year of Birth; Principal Occupation |
Peter S. Lynch (1944) |
Year of Election or Appointment: 2003 Member of the Advisory Board |
| Mr. Lynch also serves as Member of the Advisory Board of other Fidelity funds. Mr. Lynch is Vice Chairman and a Director of FMR and FMR Co., Inc. In addition, Mr. Lynch serves as a Trustee of Boston College and as the Chairman of the Inner-City Scholarship Fund. Previously, Mr. Lynch served on the Special Olympics International Board of Directors (1997-2006). |
Elizabeth Paige Baumann (1968) |
Year of Election or Appointment: 2012 Anti-Money Laundering (AML) Officer |
| Ms. Baumann also serves as AML Officer of other funds. She is Chief AML Officer of FMR LLC (2012-present) and is an employee of Fidelity Investments. Previously, Ms. Baumann served as Vice President and Deputy Anti-Money Laundering Officer (2007-2012). |
William C. Coffey (1969) |
Year of Election or Appointment: 2009 Assistant Secretary |
| Mr. Coffey also serves as Assistant Secretary of other funds. He is Senior Vice President and Deputy General Counsel of FMR LLC (2010-present), and is an employee of Fidelity Investments. Previously, Mr. Coffey served as Vice President and Associate General Counsel of FMR LLC (2005-2009). |
Timothy M. Cohen (1969) |
Year of Election or Appointment: 2014 Vice President of certain Equity Funds |
| Mr. Cohen also serves as Vice President of other funds. Mr. Cohen serves as a Director and Chief Compliance Officer of Fidelity Management & Research (U.K.) Inc. (2013-present) and is an employee of Fidelity Investments. |
Jonathan Davis (1968) |
Year of Election or Appointment: 2010 Assistant Treasurer |
| Mr. Davis also serves as Assistant Treasurer of other funds. Mr. Davis is an employee of Fidelity Investments. Previously, Mr. Davis served as Vice President and Associate General Counsel of FMR LLC (2003-2010). |
Adrien E. Deberghes (1967) |
Year of Election or Appointment: 2008 Deputy Treasurer |
| Mr. Deberghes also serves as an officer of other funds. He is an employee of Fidelity Investments (2008-present). Prior to joining Fidelity Investments, Mr. Deberghes was Senior Vice President of Mutual Fund Administration at State Street Corporation (2007-2008), Senior Director of Mutual Fund Administration at Investors Bank & Trust (2005-2007), and Director of Finance for Dunkin' Brands (2000-2005). |
Stephanie J. Dorsey (1969) |
Year of Election or Appointment: 2010 Assistant Treasurer |
| Ms. Dorsey also serves as an officer of other funds. She is an employee of Fidelity Investments (2008-present) and has served in other fund officer roles. Prior to joining Fidelity Investments, Ms. Dorsey served as Treasurer (2004-2008) of the JPMorgan Mutual Funds and Vice President (2004-2008) of JPMorgan Chase Bank. |
Howard J. Galligan III (1966) |
Year of Election or Appointment: 2014 Chief Financial Officer |
| Mr. Galligan also serves as Chief Financial Officer of other funds. Mr. Galligan serves as President of Fidelity Pricing and Cash Management Services (FPCMS) (2014-present) and as a Director of Strategic Advisers, Inc. (2008-present). Previously, Mr. Galligan served as Chief Administrative Officer of Asset Management (2011-2014) and Chief Operating Officer and Senior Vice President of Investment Support for Strategic Advisers, Inc. (2003-2011). |
Scott C. Goebel (1968) |
Year of Election or Appointment: 2008 Secretary and Chief Legal Officer (CLO) |
| Mr. Goebel serves as Secretary and CLO of other funds. Mr. Goebel also serves as Secretary of Fidelity SelectCo, LLC (2013-present), Fidelity Investments Money Management, Inc. (FIMM) (2010-present) and Fidelity Research and Analysis Company (FRAC) (2010-present); General Counsel, Secretary, and Senior Vice President of FMR (2008-present) and FMR Co., Inc. (2008-present); Chief Legal Officer of Fidelity Management & Research (Hong Kong) Limited (2008-present); and Assistant Secretary of Fidelity Management & Research (Japan) Limited (2008-present) and Fidelity Management & Research (U.K.) Inc. (2008-present). Previously, Mr. Goebel served as Secretary and CLO of other Fidelity funds (2008-2013), Assistant Secretary of FIMM (2008-2010), FRAC (2008-2010), and certain funds (2007-2008); and as Vice President and Secretary of Fidelity Distributors Corporation (FDC) (2005-2007). Mr. Goebel has been employed by FMR LLC or an affiliate since 2001. |
Brian B. Hogan (1964) |
Year of Election or Appointment: 2009 Vice President |
| Mr. Hogan also serves as Trustee or Vice President of other funds. Mr. Hogan serves as a Director of Fidelity SelectCo, LLC (2014-present) and President of FMR's Equity Division (2009-present). Previously, Mr. Hogan served as Senior Vice President, Equity Research of FMR (2006-2009) and as a portfolio manager. |
Chris Maher (1972) |
Year of Election or Appointment: 2013 Assistant Treasurer |
| Mr. Maher serves as Assistant Treasurer of other funds. Mr. Maher is Vice President of Valuation Oversight and is an employee of Fidelity Investments. Previously, Mr. Maher served as Vice President of Asset Management Compliance (2013), Vice President of FMR's Program Management Group (2010-2013), and Vice President of Valuation Oversight (2008-2010). |
Kenneth B. Robins (1969) |
Year of Election or Appointment: 2008 President and Treasurer |
| Mr. Robins also serves as an officer of other funds. Mr. Robins serves as Executive Vice President of Fidelity Investments Money Management, Inc. (FIMM) (2013-present) and is an employee of Fidelity Investments (2004-present). Previously, Mr. Robins served in other fund officer roles. |
Stephen Sadoski (1971) |
Year of Election or Appointment: 2012 Deputy Treasurer |
| Mr. Sadoski also serves as Deputy Treasurer of other funds. He is an employee of Fidelity Investments (2012-present) and has served in another fund officer role. Prior to joining Fidelity Investments, Mr. Sadoski served as an assistant chief accountant in the Division of Investment Management of the Securities and Exchange Commission (SEC) (2009-2012) and as a senior manager at Deloitte & Touche LLP (1997-2009). |
Stacie M. Smith (1974) |
Year of Election or Appointment: 2013 Deputy Treasurer |
| Ms. Smith also serves as an officer of other funds. She is an employee of Fidelity Investments (2009-present) and has served in other fund officer roles. Prior to joining Fidelity Investments, Ms. Smith served as Senior Audit Manager of Ernst & Young LLP (1996-2009). |
Renee Stagnone (1975) |
Year of Election or Appointment: 2013 Deputy Treasurer |
| Ms. Stagnone also serves as Deputy Treasurer of other funds. Ms. Stagnone is an employee of Fidelity Investments. |
Linda J. Wondrack (1964) |
Year of Election or Appointment: 2014 Chief Compliance Officer |
| Ms. Wondrack also serves as Chief Compliance Officer of other funds. Ms. Wondrack is Executive Vice President and head of the Ethics Office and Asset Management Compliance for Fidelity Investments (2012-present). Ms. Wondrack also serves as Chief Compliance Officer of Fidelity SelectCo, LLC (2014-present); Chief Compliance Officer of Impresa Management LLC (2013-present); and Chief Compliance Officer of FMR Co., Inc., Fidelity Investments Money Management, Inc., Fidelity Management & Research (Japan) Limited, Fidelity Management & Research (U.K.) Inc., Fidelity Management & Research (Hong Kong), Fidelity Management & Research Company, Pyramis Global Advisors, LLC, and Strategic Advisers, Inc., Ballyrock Investment Advisors LLC, and Northern Neck Investors LLC (2012-present). Previously, Ms. Wondrack served as Senior Vice President and Chief Compliance Officer for Columbia Management Investment Advisers, LLC (2005-2012); Chief Compliance Officer for certain funds within the Columbia Family of Funds (2007-2012); and Senior Vice President of Compliance Risk Management at Bank of America (2005-2010). |
Joseph F. Zambello (1957) |
Year of Election or Appointment: 2011 Deputy Treasurer |
| Mr. Zambello also serves as Deputy Treasurer of other funds. Mr. Zambello is an employee of Fidelity Investments. Previously, Mr. Zambello served as Vice President of FMR's Program Management Group (2009-2011) and Vice President of the Transfer Agent Oversight Group (2005-2009). |
Annual Report
International Discovery Fund, designates 1% of the dividends distributed during the fiscal year as qualifying for the dividends-received deduction for corporate shareholders.
International Discovery Fund designates 68% of dividends distributed during the fiscal year as amounts which may be taken into account as a dividend for purposes of the maximum rate under section 1(h)(11) of the Internal Revenue Code.
The amounts per share which represent income derived from sources within, and taxes paid to, foreign countries or possessions of the United States are as follows:
| Pay Date | Income | Taxes |
International Discovery Fund | 12/09/13 | $0.4153 | $0.0365 |
The fund will notify shareholders in January 2015 of amounts for use in preparing 2014 income tax returns.
Annual Report
Board Approval of Investment Advisory Contracts and Management Fees
Fidelity International Discovery Fund
Each year, the Board of Trustees, including the Independent Trustees (together, the Board), votes on the renewal of the management contract with Fidelity Management & Research Company (FMR) and the sub-advisory agreements (together, the Advisory Contracts) for the fund. The Board, assisted by the advice of fund counsel and Independent Trustees' counsel, requests and considers a broad range of information relevant to the renewal of the Advisory Contracts throughout the year.
The Board meets regularly and, at each of its meetings, covers an extensive agenda of topics and materials and considers factors that are relevant to its annual consideration of the renewal of the fund's Advisory Contracts, including the services and support provided to the fund and its shareholders. The Board has established various standing committees (Committees), each composed of and chaired by Independent Trustees with varying backgrounds, to which the Board has assigned specific subject matter responsibilities in order to enhance effective decision-making by the Board. The Board, acting directly and through its Committees, requests and receives information concerning the annual consideration of the renewal of the fund's Advisory Contracts. The Board also meets as needed to consider matters specifically related to the Board's annual consideration of the renewal of the Advisory Contracts. Members of the Board may also meet with trustees of other Fidelity funds through ad hoc joint committees to discuss certain matters relevant to the Fidelity funds.
At its July 2014 meeting, the Board, including the Independent Trustees, unanimously determined to renew the fund's Advisory Contracts. In reaching its determination, the Board considered all factors it believed relevant, including (i) the nature, extent, and quality of the services to be provided to the fund and its shareholders (including the investment performance of the fund); (ii) the competitiveness of the fund's management fee and total expense ratio relative to peer funds; (iii) the total costs of the services to be provided by and the profits to be realized by Fidelity from its relationship with the fund; (iv) the extent to which economies of scale exist and would be realized as the fund grows; and (v) whether fee levels reflect these economies of scale, if any, for the benefit of fund shareholders. In connection with separate internal corporate reorganizations involving Fidelity Management & Research (U.K.) Inc. (FMR U.K.) and Fidelity Management & Research (Japan) Inc. (FMR Japan), the Board approved certain non-material amendments to the fund's sub-advisory agreements with FMR U.K. and FMR Japan to reflect that, after these reorganizations, FMR Investment Management (UK) Limited and Fidelity Management & Research (Japan) Limited will carry on the business of FMR U.K. and FMR Japan, respectively. The Board noted that no changes to the portfolio managers or to the foreign research or investment advisory services provided to the fund were expected in connection with either reorganization and that the same personnel and resources would continue to be available to the fund at the new entities.
Annual Report
In considering whether to renew the Advisory Contracts for the fund, the Board reached a determination, with the assistance of fund counsel and Independent Trustees' counsel and through the exercise of its business judgment, that the renewal of the Advisory Contracts was in the best interests of the fund and its shareholders and that the compensation payable under the Advisory Contracts was fair and reasonable. The Board's decision to renew the Advisory Contracts was not based on any single factor, but rather was based on a comprehensive consideration of all the information provided to the Board at its meetings throughout the year. The Board, in reaching its determination to renew the Advisory Contracts, was aware that shareholders of the fund have a broad range of investment choices available to them, including a wide choice among funds offered by Fidelity's competitors, and that the fund's shareholders, who have the opportunity to review and weigh the disclosure provided by the fund in its prospectus and other public disclosures, have chosen to invest in this fund, which is part of the Fidelity family of funds.
Nature, Extent, and Quality of Services Provided. The Board considered Fidelity's staffing as it relates to the fund, including the backgrounds of investment personnel of FMR and the sub-advisers (together, the Investment Advisers), and also considered the fund's investment objective, strategies, and related investment philosophy. The Independent Trustees also had discussions with senior management of Fidelity's investment operations and investment groups. The Board considered the structure of the portfolio manager compensation program and whether this structure provides appropriate incentives to act in the best interests of the fund. Additionally, the Board considered the portfolio managers' investments, if any, in the funds that they manage.
Resources Dedicated to Investment Management and Support Services. The Board and the Fund Oversight and Research Committees reviewed the general qualifications and capabilities of Fidelity's investment staff, including its size, education, experience, and resources, as well as Fidelity's approach to recruiting, training, managing, and compensating investment personnel. The Board noted that Fidelity has continued to increase the resources devoted to non-U.S. offices, including expansion of Fidelity's global investment organization. The Board also noted that Fidelity's analysts have extensive resources, tools and capabilities that allow them to conduct sophisticated quantitative and fundamental analysis, as well as credit analysis of issuers, counterparties and guarantors. Further, the Board believes that Fidelity's investment professionals have sufficient access to global information and data so as to provide competitive investment results over time, and that those professionals also have access to sophisticated tools that permit them to assess portfolio construction and risk and performance attribution characteristics continuously, as well as to transmit new information and research conclusions rapidly around the world. Additionally, in its deliberations, the Board considered Fidelity's trading and risk management capabilities and resources and global compliance infrastructure, which are an integral part of the investment management process.
Annual Report
Board Approval of Investment Advisory Contracts and
Management Fees - continued
Shareholder and Administrative Services. The Board considered (i) the nature, extent, quality, and cost of advisory, administrative, and shareholder services performed by the Investment Advisers and their affiliates under the Advisory Contracts and under separate agreements covering transfer agency, pricing and bookkeeping, and securities lending services for the fund; (ii) the nature and extent of the supervision of third party service providers, principally custodians and subcustodians; and (iii) the resources devoted to, and the record of compliance with, the fund's compliance policies and procedures. The Board also reviewed the allocation of fund brokerage, including allocations to brokers affiliated with the Investment Advisers, the use of brokerage commissions to pay fund expenses, and the use of "soft" commission dollars to pay for research services.
The Board noted that the growth of fund assets over time across the complex allows Fidelity to reinvest in the development of services designed to enhance the value or convenience of the Fidelity funds as investment vehicles. These services include 24-hour access to account information and market information through telephone representatives and over the Internet, investor education materials and asset allocation tools, and the expanded availability of Fidelity Investor Centers.
In 2014, the Board formed an ad hoc Committee on Transfer Agency Fees to review the variety of transfer agency fee structures throughout the industry and Fidelity's competitive positioning with respect to industry participants.
Investment in a Large Fund Family. The Board considered the benefits to shareholders of investing in a Fidelity fund, including the benefits of investing in a fund that is part of a large family of funds offering a variety of investment disciplines and providing a large variety of mutual fund investor services. The Board noted that Fidelity had taken, or had made recommendations that resulted in the Fidelity funds taking, a number of actions over the previous year that benefited particular funds, including (i) continuing to dedicate additional resources to investment research and to the support of the senior management team that oversees asset management; (ii) persisting in efforts to enhance Fidelity's global research capabilities; (iii) launching new funds and making other enhancements to meet client needs for income-oriented solutions; (iv) reducing fund expenses for certain index funds; (v) continuing to launch dedicated lower cost underlying funds to meet portfolio construction needs related to expanding underlying fund options for Fidelity funds of funds, specifically for the Freedom Fund product lines; (vi) rationalizing product lines and gaining increased efficiencies through fund mergers; (vii) launching sector-based exchange-traded funds and establishing a new Fidelity adviser to manage sector-based funds and products; (viii) continuing to develop and implement technology to improve security and increase efficiency; (ix) modifying the eligibility criteria for certain share classes to increase their marketability to a portion of the defined contribution plan market; (x) waiving redemption fees for certain qualified fund-of-fund and wrap programs and certain retirement plan transactions; and (xi) launching new Institutional Class shares of certain money market funds to attract and retain assets and to fill a gap in the money market fund lineup.
Annual Report
Investment Performance. The Board considered whether the fund has operated in accordance with its investment objective, as well as its record of compliance with its investment restrictions and its performance history.
The Board took into account discussions with the Investment Advisers about fund investment performance that occur at Board meetings throughout the year. In this regard the Board noted that as part of regularly scheduled fund reviews and other reports to the Board on fund performance, the Board periodically considers annualized return information for the fund, for different time periods, measured against a securities market index ("benchmark index") and a peer group of funds with similar objectives ("peer group"). In its evaluation of fund investment performance, the Board gave particular attention to information indicating changes in performance of certain Fidelity funds for specific time periods and the Investment Advisers' explanations for any overperformance or underperformance.
In addition to reviewing absolute and relative fund performance, the Independent Trustees periodically consider the appropriateness of fund performance metrics in evaluating the results achieved. In general, the Independent Trustees believe that fund performance should be evaluated based on net performance (after fees and expenses) of both the highest performing and lowest performing classes, where applicable, compared to appropriate benchmark indices, over appropriate time periods which may include full market cycles, and compared to peer groups, as applicable, over the same periods, taking into account relevant factors including the following: general market conditions; issuer-specific information; tactical opportunities for investment; and fund cash flows and other factors.
The Independent Trustees recognize that shareholders evaluate performance on a net basis over their own holding periods, for which one-, three-, and five-year periods are often used as a proxy. For this reason, the performance information reviewed by the Board also included net cumulative calendar year total return information for the fund and an appropriate benchmark index and peer group for the most recent one-, three-, and five-year periods, as shown below. Returns are shown compared to the 25th percentile (top of box, 75% beaten) and 75th percentile (bottom of box, 25% beaten) of the peer universe. Returns of the benchmark index are "net MA," i.e., adjusted for tax withholding rates applicable to U.S.-based funds organized as Massachusetts business trusts.
Annual Report
Board Approval of Investment Advisory Contracts and
Management Fees - continued
Fidelity International Discovery Fund

The Board also considered that the fund's management fee is subject to upward or downward adjustment depending upon whether, and to what extent, the fund's investment performance for the performance period exceeds, or is exceeded by, a securities index, thus leading to a performance adjustment for the same period. The Board noted that the performance adjustment provides FMR with a strong economic incentive to seek to achieve superior performance for the fund's shareholders and helps to more closely align the interests of FMR and the fund's shareholders.
Based on its review, the Board concluded that the nature, extent, and quality of services provided to the fund under the Advisory Contracts should benefit the fund's shareholders.
Competitiveness of Management Fee and Total Expense Ratio. The Board considered the fund's management fee and total expense ratio compared to "mapped groups" of competitive funds and classes. Fidelity creates "mapped groups" by combining similar Lipper investment objective categories that have comparable investment mandates. Combining Lipper investment objective categories aids the Board's management fee and total expense ratio comparisons by broadening the competitive group used for comparison and by reducing the number of universes to which various Fidelity funds are compared.
Management Fee. The Board considered two proprietary management fee comparisons for the 12-month periods shown in the chart below. The group of Lipper funds used by the Board for management fee comparisons is referred to below as the "Total Mapped Group." The Total Mapped Group comparison focuses on a fund's standing in terms of gross management fees before expense reimbursements or caps, and without giving effect to the fund's performance adjustment, relative to the total universe of funds with comparable investment mandates, regardless of whether their management fee structures also are comparable. Funds with comparable investment mandates offer exposure to similar types of securities. Funds with comparable management fee structures have similar management fee contractual arrangements (e.g., flat rate charged for advisory services, all-inclusive fee rate, etc.). "TMG %" represents the percentage of funds in the Total Mapped Group that had management fees that were lower than the fund's. For example, a hypothetical TMG % of 20% would mean that 80% of the funds in the Total Mapped Group had higher, and 20% had lower, management fees than the fund. The fund's actual TMG %s are in the chart below. The "Asset-Size Peer Group" (ASPG) comparison focuses on a fund's standing relative to a subset of non-Fidelity funds within the Total Mapped Group that are similar in size and management fee structure. For example, if a fund is in the first quartile of the ASPG, the fund's management fee ranks in the least expensive or lowest 25% of funds in the ASPG. The ASPG represents at least 15% of the funds in the Total Mapped Group with comparable asset size and management fee structures, subject to a minimum of 50 funds (or all funds in the Total Mapped Group if fewer than 50). Additional information, such as the ASPG quartile in which the fund's management fee rate ranked and the impact of the fund's performance adjustment, is also included in the chart and considered by the Board.
Annual Report
Fidelity International Discovery Fund

The Board noted that the fund's management fee rate ranked below the median of its Total Mapped Group and below the median of its ASPG for 2013. The Board also noted the effect of the fund's positive performance adjustment on the fund's management fee ranking.
Annual Report
Board Approval of Investment Advisory Contracts and
Management Fees - continued
Furthermore, the Board considered that, on July 16, 2014, after the periods shown in the chart above, it had approved a reduction (effective August 1, 2014) in the individual fund fee rate component of the management fee rate for the fund from 0.450% to 0.424%.
The Board also noted that, in August 2013, the ad hoc Committee on Management Fees was formed to conduct an in-depth review of the management fee rates of Fidelity's active equity mutual funds. The Committee focused on the following areas: (i) standard fee structures; (ii) research consumption and trading evolution; (iii) management fee competitiveness/profitability by category; and (iv) factors that drive institutional pricing.
Based on its review, the Board concluded that the fund's management fee is fair and reasonable in light of the services that the fund receives and the other factors considered.
Total Expense Ratio. In its review of each class's total expense ratio, the Board considered the fund's management fee as well as other fund or class expenses, as applicable, such as transfer agent fees, pricing and bookkeeping fees, fund-paid 12b-1 fees, and custodial, legal, and audit fees. The Board also noted the effects of any waivers and reimbursements on fees and expenses, as well as the impact of the fund's performance adjustment. As part of its review, the Board also considered the current and historical total expense ratios of each class of the fund compared to competitive fund median expenses. Each class of the fund is compared to those funds and classes in the Total Mapped Group (used by the Board for management fee comparisons) that have a similar sales load structure.
The Board noted that the total expense ratio of each of Class A, Class B, Class C, Institutional Class, Class Z, the retail class, and Class K ranked below its competitive median for 2013 and the total expense ratio of Class T ranked above its competitive median for 2013. The Board considered that, in general, various factors can affect total expense ratios. The Board noted that the total expense ratio of Class T was above the competitive median primarily because of higher 12b-1 fees on Class T as compared to most competitor funds. Class T has a higher 12b-1 fee, but a lower front-end sales charge, than traditionally priced front-end sales charge classes. The Board considered that Class T is primarily sold load-waived in the retirement plan market where its 0.50% 12b-1 fee is comparable to competing no-load, higher 12b-1 fee classes designed specifically for retirement plans. The Board noted that the fund offers multiple classes, each of which has a different sales load and 12b-1 fee structure, and that the multiple structures are intended to offer a range of pricing options for the intermediary market. The Board also noted that the total expense ratios of the classes vary primarily by the level of their 12b-1 fees, although differences in transfer agent fees may also cause expenses to vary from class to class.
Annual Report
Fees Charged to Other Fidelity Clients. The Board also considered Fidelity fee structures and other information with respect to clients of Fidelity, such as other funds advised or subadvised by Fidelity, pension plan clients, and other institutional clients. The Board noted the findings of the 2013 ad hoc joint committee (created with the board of other Fidelity funds), which reviewed and compared Fidelity's institutional investment advisory business with its business of providing services to the Fidelity funds, including the differences in services provided, fees charged, and costs incurred, as well as competition in their respective marketplaces.
Based on its review of total expense ratios and fees charged to other Fidelity clients, the Board concluded that the total expense ratio of each class of the fund was reasonable, although Class T was above the median of the universe presented for comparison, in light of the services that the fund and its shareholders receive and the other factors considered.
Costs of the Services and Profitability. The Board considered the revenues earned and the expenses incurred by Fidelity in conducting the business of developing, marketing, distributing, managing, administering and servicing the fund and servicing the fund's shareholders. The Board also considered the level of Fidelity's profits in respect of all the Fidelity funds.
On an annual basis, Fidelity presents to the Board Fidelity's profitability for the fund. Fidelity calculates the profitability for each fund, as well as aggregate profitability for groups of Fidelity funds and all Fidelity funds, using a series of detailed revenue and cost allocation methodologies which originate with the books and records of Fidelity on which Fidelity's audited financial statements are based. The Audit Committee of the Board reviews any significant changes from the prior year's methodologies.
PricewaterhouseCoopers LLP (PwC), independent registered public accounting firm and auditor to Fidelity and certain Fidelity funds, has been engaged annually by the Board as part of the Board's assessment of Fidelity's profitability analysis. PwC's engagement includes the review and assessment of the methodologies used by Fidelity in determining the revenues and expenses attributable to Fidelity's mutual fund business, and completion of agreed-upon procedures in respect of the mathematical accuracy of fund profitability and its conformity to established allocation methodologies. After considering PwC's reports issued under the engagement and information provided by Fidelity, the Board concluded that while other allocation methods may also be reasonable, Fidelity's profitability methodologies are reasonable in all material respects.
The Board also reviewed Fidelity's non-fund businesses and fall-out benefits related to the mutual fund business as well as cases where Fidelity's affiliates may benefit from or be related to the fund's business.
Annual Report
Board Approval of Investment Advisory Contracts and
Management Fees - continued
The Board considered the costs of the services provided by and the profits realized by Fidelity in connection with the operation of the fund and was satisfied that the profitability was not excessive in the circumstances.
Economies of Scale. The Board considered whether there have been economies of scale in respect of the management of the Fidelity funds, whether the Fidelity funds (including the fund) have appropriately benefited from any such economies of scale, and whether there is potential for realization of any further economies of scale. The Board considered the extent to which the fund will benefit from economies of scale through increased services to the fund, through waivers or reimbursements, or through fee or expense ratio reductions. The Board also noted that in 2013, it and the boards of other Fidelity funds created an ad hoc committee (the Economies of Scale Committee) to analyze whether Fidelity attains economies of scale in respect of the management and servicing of the Fidelity funds, whether the Fidelity funds have appropriately benefited from such economies of scale, and whether there is potential for realization of any further economies of scale.
The Board recognized that the fund's management contract incorporates a "group fee" structure, which provides for lower group fee rates as total group assets increase, and for higher group fee rates as total group assets decrease (with "group assets" defined to include fund assets under FMR's management plus sector fund assets previously under FMR's management and currently managed by Fidelity SelectCo, LLC). FMR calculates the group fee rates based on a tiered asset "breakpoint" schedule that varies based on asset class. The Board considered that the group fee is designed to deliver the benefits of economies of scale to fund shareholders when total Fidelity fund assets increase, even if assets of any particular fund are unchanged or have declined, because some portion of Fidelity's costs are attributable to services provided to all Fidelity funds, and all funds benefit if those costs can be allocated among more assets. The Board concluded that, given the group fee structure, fund shareholders will benefit from lower management fees as group assets increase at the fund complex level, regardless of whether Fidelity achieves any such economies of scale.
The Board concluded, taking into account the analysis of the Economies of Scale Committee, that economies of scale, if any, are being appropriately shared between fund shareholders and Fidelity.
Additional Information Requested by the Board. In order to develop fully the factual basis for consideration of the Fidelity funds' Advisory Contracts, the Board requested and received additional information on certain topics, including: (i) fund performance trends and Fidelity's long-term strategies for certain funds; (ii) Fidelity's strategic marketing and product lineup goals; (iii) the methodology with respect to competitive fund data and peer group classifications; (iv) the arrangements with, and performance of, certain sub-advisers on behalf of the Fidelity funds, as well as certain proposed participating affiliate arrangements; (v) the realization of fall-out benefits in certain Fidelity business units; (vi) Fidelity's group fee structures, including the rationale for the individual fee rates of certain categories of funds and the definition of group assets; (vii) trends regarding industry use of performance fee structures and the performance adjustment methodologies applicable to the Fidelity funds; (viii) additional competitive analysis regarding the total expenses for certain classes; (ix) fund profitability methodology, including Fidelity's cost allocation methodology, and the impact of certain factors on fund profitability results; and (x) the process by which Fidelity determines sub-advisory fees for funds it advises.
Annual Report
Based on its evaluation of all of the conclusions noted above, and after considering all factors it believed relevant, the Board ultimately concluded that the advisory fee structures are fair and reasonable, and that the fund's Advisory Contracts should be renewed.
Annual Report
Investment Adviser
Fidelity Management & Research Company
Boston, MA
Investment Sub-Advisers
FMR Co., Inc.
Fidelity Management & Research
(U.K.) Inc.
FIL Investment Advisors
FIL Investments (Japan) Limited
FIL Investment Advisors (U.K.) Limited
Fidelity Management & Research
(Hong Kong) Limited
Fidelity Management & Research
(Japan) Limited
General Distributor
Fidelity Distributors Corporation
Smithfield, RI
Transfer and Service Agents
Fidelity Investments Institutional
Operations Company, Inc.
Boston, MA
Fidelity Service Company, Inc.
Boston, MA
Custodian
The Northern Trust Company
Chicago, IL
The Fidelity Telephone Connection
Mutual Fund 24-Hour Service
Exchanges/Redemptions
and Account Assistance 1-800-544-6666
Product Information 1-800-544-8888
Retirement Accounts 1-800-544-4774
(8 a.m. - 9 p.m.)
TDD Service 1-800-544-0118
for the deaf and hearing impaired
(9 a.m. - 9 p.m. Eastern time)
Fidelity Automated Service
Telephone (FAST®)
1-800-544-5555
Automated line for quickest service
(Fidelity Investment logo)(registered trademark)
Corporate Headquarters
245 Summer St., Boston, MA 02210
www.fidelity.com
IGI-UANN-1214
1.807257.110
Fidelity®
International Discovery
Fund -
Class K
Annual Report
October 31, 2014
(Fidelity Cover Art)
Contents
Performance | (Click Here) | How the fund has done over time. |
Management's Discussion of Fund Performance | (Click Here) | The Portfolio Manager's review of fund performance and strategy. |
Shareholder Expense Example | (Click Here) | An example of shareholder expenses. |
Investment Changes | (Click Here) | A summary of major shifts in the fund's investments over the past six months. |
Investments | (Click Here) | A complete list of the fund's investments with their market values. |
Financial Statements | (Click Here) | Statements of assets and liabilities, operations, and changes in net assets, as well as financial highlights. |
Notes | (Click Here) | Notes to the financial statements. |
Report of Independent Registered Public Accounting Firm | (Click Here) | |
Trustees and Officers | (Click Here) | |
Distributions | (Click Here) | |
Board Approval of Investment Advisory Contracts and Management Fees | (Click Here) | |
To view a fund's proxy voting guidelines and proxy voting record for the 12-month period ended June 30, visit http://www.fidelity.com/proxyvotingresults or visit the Securities and Exchange Commission's (SEC) web site at http://www.sec.gov. You may also call 1-800-835-5092 to request a free copy of the proxy voting guidelines.
Standard & Poor's, S&P and S&P 500 are registered service marks of The McGraw-Hill Companies, Inc. and have been licensed for use by Fidelity Distributors Corporation.
Other third-party marks appearing herein are the property of their respective owners.
All other marks appearing herein are registered or unregistered trademarks or service marks of FMR LLC or an affiliated company. © 2014 FMR LLC. All rights reserved.
Annual Report
This report and the financial statements contained herein are submitted for the general information of the shareholders of the fund. This report is not authorized for distribution to prospective investors in the fund unless preceded or accompanied by an effective prospectus.
A fund files its complete schedule of portfolio holdings with the SEC for the first and third quarters of each fiscal year on Form N-Q. Forms N-Q are available on the SEC's web site at http://www.sec.gov. A fund's Forms N-Q may be reviewed and copied at the SEC's Public Reference Room in Washington, DC. Information regarding the operation of the SEC's Public Reference Room may be obtained by calling 1-800-SEC-0330. For a complete list of a fund's portfolio holdings, view the most recent holdings listing, semiannual report, or annual report on Fidelity's web site at http://www.fidelity.com, http://www.advisor.fidelity.com, or http://www.401k.com, as applicable.
NOT FDIC INSURED • MAY LOSE VALUE • NO BANK GUARANTEE
Neither the fund nor Fidelity Distributors Corporation is a bank.
Annual Report
Average annual total return reflects the change in the value of an investment, assuming reinvestment of the class' distributions from dividend income and capital gains (the profits earned upon the sale of securities that have grown in value, if any) and assuming a constant rate of performance each year. The $10,000 table and the fund's returns do not reflect the deduction of taxes that a shareholder would pay on fund distributions or the redemption of fund shares. During periods of reimbursement by Fidelity, a fund's total return will be greater than it would be had the reimbursement not occurred. How a fund did yesterday is no guarantee of how it will do tomorrow.
Average Annual Total Returns
Periods ended October 31, 2014 | Past 1
year | Past 5
years | Past 10
years |
Class KA,B | 0.13% | 8.26% | 7.16% |
A The initial offering of Class K shares took place on May 9, 2008. Returns prior to May 9, 2008 are those of Fidelity® International Discovery Fund, the original class of the fund.
B Prior to October 1, 2004, the fund operated under certain different investment policies. The fund's historical performance may not represent its current investment policies.
$10,000 Over 10 Years
Let's say hypothetically that $10,000 was invested in Fidelity® International Discovery Fund - Class K on October 31, 2004. The chart shows how the value of your investment would have changed, and also shows how the MSCI EAFE Index performed over the same period. See footnote A above for additional information regarding the performance of Class K.
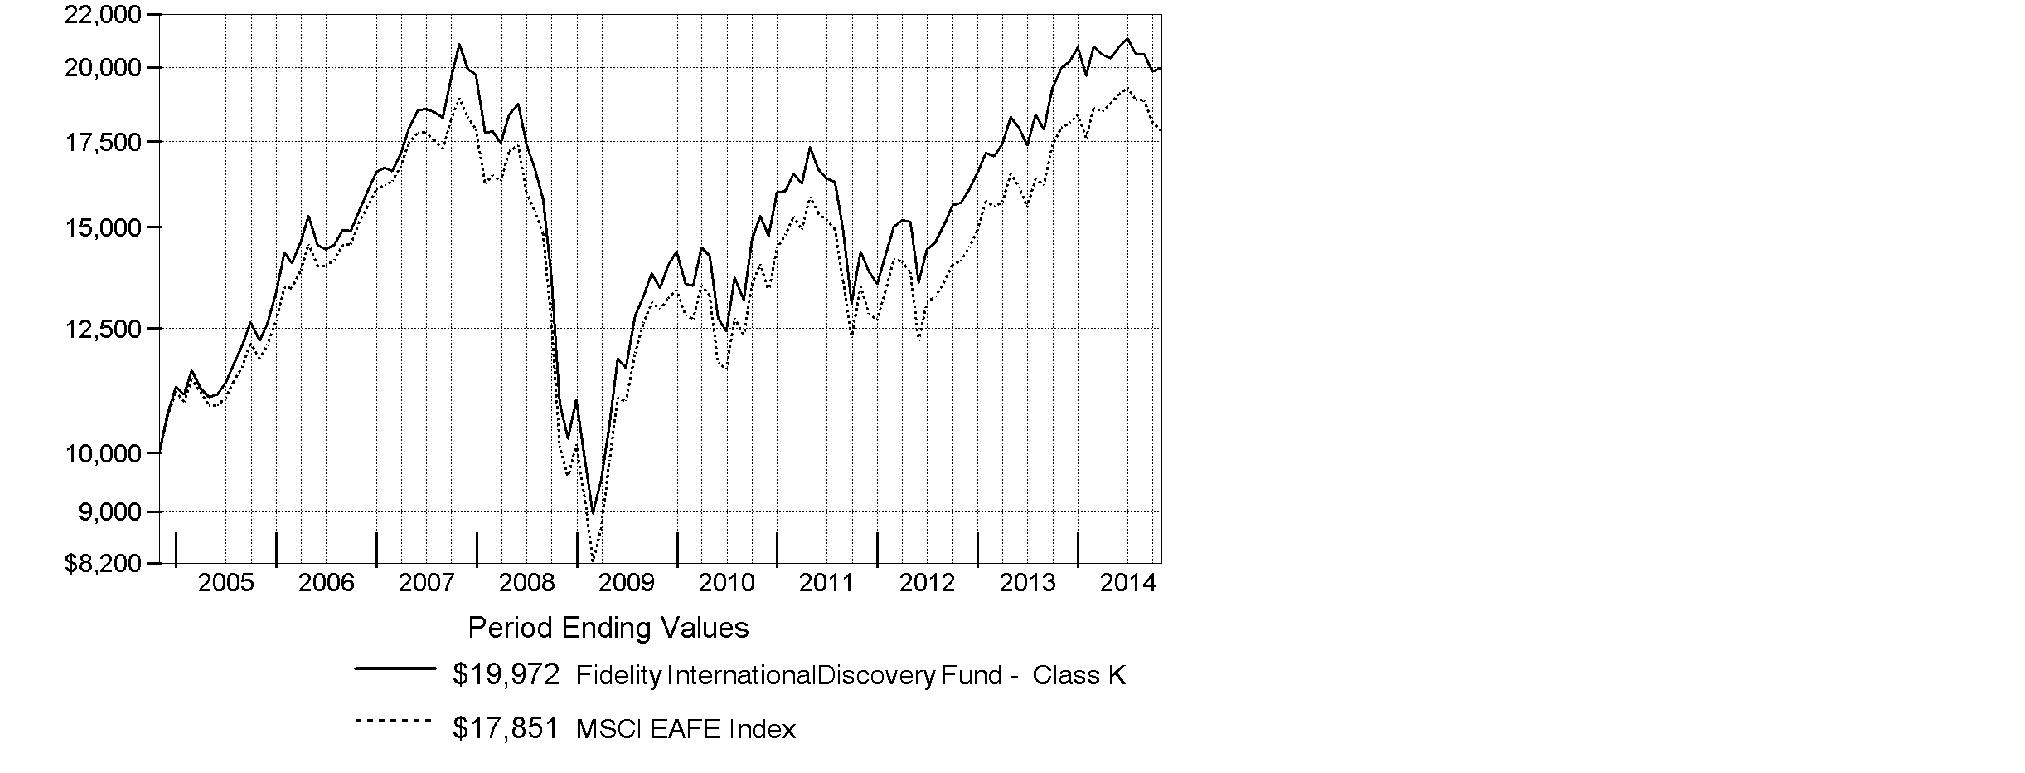
Annual Report
Market Recap: Global equities posted a healthy gain for the 12 months ending October 31, 2014, overcoming an October market decline driven by recessionary pressures in China and tepid growth in Europe. The MSCI ACWI (All Country World Index) Index rose 8.15%, helped by subdued market volatility for much of the period and supported by solid corporate earnings, especially in the United States. Stocks also benefited from easy monetary policies in Japan and the eurozone, as well as increased stimulus efforts in China. All but three of the 24 industry groups that compose the index marked a positive return. The U.S. (+17%) remained a pillar of strength, while a strongly rising dollar in the latter part of the period detracted from investors' returns in most non-U.S. markets. Canada (+5%) notched broad gains outside of its energy and materials sectors, as did Asia-Pacific ex Japan (+4%), led by investor enthusiasm for companies in India. The U.K., Europe and Japan, meanwhile, all underperformed. Among sectors, health care (+24%) led the index, with a strong contribution from the pharmaceuticals, biotechnology & life sciences industry. Information technology (+21%) also outperformed. Conversely, materials (-4%) and energy (-1%) lagged the index due to a higher supply of and lower demand for commodities.
Comments from William Kennedy, Portfolio Manager of Fidelity® International Discovery Fund: For the year, the fund's Class K shares returned 0.13%, versus -0.48% for its benchmark, the MSCI EAFE Index. Security selection helped relative performance, particularly in health care, information technology and financials. The fund also benefited from out-of-index investments in the U.S. and emerging markets. Top individual contributors included U.K.-listed Hikma Pharmaceuticals, a Jordan-based company that specializes in injectable drugs. Its stock received a boost from U.S. market-share gains. Shares of pharmaceuticals company Actavis benefited from successful recent acquisitions and the tax advantage of its Ireland domicile. By contrast, security selection in industrials and consumer discretionary and in Europe ex U.K. detracted versus the index. In terms of individual disappointments, not owning Switzerland-based pharmaceuticals giant and index component Novartis hurt relative performance, as the company's strong patent portfolio and product pipeline drove sales growth and the stock gain. An overweighting in ORIX, a high-quality diversified financials conglomerate in Japan, also detracted from results, as the weak local economy pressured near-term earnings growth.
The views expressed above reflect those of the portfolio manager(s) only through the end of the period as stated on the cover of this report and do not necessarily represent the views of Fidelity or any other person in the Fidelity organization. Any such views are subject to change at any time based upon market or other conditions and Fidelity disclaims any responsibility to update such views. These views may not be relied on as investment advice and, because investment decisions for a Fidelity fund are based on numerous factors, may not be relied on as an indication of trading intent on behalf of any Fidelity fund.
Annual Report
Shareholder Expense Example
As a shareholder of the Fund, you incur two types of costs: (1) transaction costs, including sales charges (loads) on purchase payments or redemption proceeds, redemption fees and (2) ongoing costs, including management fees, distribution and/or service (12b-1) fees and other Fund expenses. This Example is intended to help you understand your ongoing costs (in dollars) of investing in the Fund and to compare these costs with the ongoing costs of investing in other mutual funds.
The Example is based on an investment of $1,000 invested at the beginning of the period and held for the entire period (May 1, 2014 to October 31, 2014).
Actual Expenses
The first line of the accompanying table for each class of the Fund provides information about actual account values and actual expenses. You may use the information in this line, together with the amount you invested, to estimate the expenses that you paid over the period. Simply divide your account value by $1,000.00 (for example, an $8,600 account value divided by $1,000.00 = 8.6), then multiply the result by the number in the first line for a class of the Fund under the heading entitled "Expenses Paid During Period" to estimate the expenses you paid on your account during this period. A small balance maintenance fee of $12.00 that is charged once a year may apply for certain accounts with a value of less than $2,000. This fee is not included in the table below. If it was, the estimate of expenses you paid during the period would be higher, and your ending account value lower, by this amount. In addition, the Fund, as a shareholder in the underlying Fidelity Central Funds, will indirectly bear its pro-rata share of the fees and expenses incurred by the underlying Fidelity Central Funds. These fees and expenses are not included in the Fund's annualized expense ratio used to calculate the expense estimate in the table below.
Hypothetical Example for Comparison Purposes
The second line of the accompanying table for each class of the Fund provides information about hypothetical account values and hypothetical expenses based on a Class' actual expense ratio and an assumed rate of return of 5% per year before expenses, which is not the Class' actual return. The hypothetical account values and expenses may not be used to estimate the actual ending account balance or expenses you paid for the period. You may use this information to compare the ongoing costs of investing in the Fund and other funds. To do so, compare this 5% hypothetical example with the 5% hypothetical examples that appear in the shareholder reports of the other funds. A small balance maintenance fee of $12.00 that is charged once a year may apply for certain accounts with a value of less than $2,000. This fee is not included in the table below. If it was, the estimate of expenses you paid during the period would be higher, and your ending account value lower, by this amount. In addition, the Fund, as a shareholder in the underlying Fidelity Central Funds, will indirectly bear its pro-rata share of the fees and expenses incurred by the underlying Fidelity Central Funds. These fees and expenses are not included in the Fund's annualized expense ratio used to calculate the expense estimate in the table below.
Please note that the expenses shown in the table are meant to highlight your ongoing costs only and do not reflect any transaction costs. Therefore, the second line of the table is useful in comparing ongoing costs only, and will not help you determine the relative total costs of owning different funds. In addition, if these transactional costs were included, your costs would have been higher.
Annual Report
Shareholder Expense Example - continued
| Annualized
Expense RatioB | Beginning
Account Value
May 1, 2014 | Ending
Account Value
October 31, 2014 | Expenses Paid
During Period*
May 1, 2014
to October 31, 2014 |
Class A | 1.27% | | | |
Actual | | $ 1,000.00 | $ 981.00 | $ 6.34 |
HypotheticalA | | $ 1,000.00 | $ 1,018.80 | $ 6.46 |
Class T | 1.50% | | | |
Actual | | $ 1,000.00 | $ 979.90 | $ 7.49 |
HypotheticalA | | $ 1,000.00 | $ 1,017.64 | $ 7.63 |
Class B | 2.04% | | | |
Actual | | $ 1,000.00 | $ 977.10 | $ 10.17 |
HypotheticalA | | $ 1,000.00 | $ 1,014.92 | $ 10.36 |
Class C | 2.02% | | | |
Actual | | $ 1,000.00 | $ 977.30 | $ 10.07 |
HypotheticalA | | $ 1,000.00 | $ 1,015.02 | $ 10.26 |
International Discovery | .92% | | | |
Actual | | $ 1,000.00 | $ 982.60 | $ 4.60 |
HypotheticalA | | $ 1,000.00 | $ 1,020.57 | $ 4.69 |
Class K | .79% | | | |
Actual | | $ 1,000.00 | $ 983.10 | $ 3.95 |
HypotheticalA | | $ 1,000.00 | $ 1,021.22 | $ 4.02 |
Institutional Class | .93% | | | |
Actual | | $ 1,000.00 | $ 982.60 | $ 4.65 |
HypotheticalA | | $ 1,000.00 | $ 1,020.52 | $ 4.74 |
Class Z | .81% | | | |
Actual | | $ 1,000.00 | $ 983.30 | $ 4.05 |
HypotheticalA | | $ 1,000.00 | $ 1,021.12 | $ 4.13 |
A 5% return per year before expenses
B Annualized expense ratio reflects expenses net of applicable fee waivers.
* Expenses are equal to each Class' annualized expense ratio, multiplied by the average account value over the period, multiplied by 184/365 (to reflect the one-half year period).
Annual Report
Investment Changes (Unaudited)
Geographic Diversification (% of fund's net assets) |
As of October 31, 2014 |
 | Japan 17.1% | |
 | United Kingdom 14.9% | |
 | United States of America* 9.2% | |
 | Germany 6.7% | |
 | Switzerland 6.0% | |
 | France 5.1% | |
 | Australia 4.3% | |
 | Sweden 4.1% | |
 | India 3.2% | |
 | Other 29.4% | |

* Includes Short-Term Investments and Net Other Assets (Liabilities) |
Percentages are based on country or territory of incorporation and are adjusted for the effect of futures contracts, if applicable. |
As of April 30, 2014 |
| Japan 16.3% | |
| United Kingdom 14.4% | |
| Germany 10.3% | |
| United States of America* 9.5% | |
| France 8.9% | |
| Switzerland 5.5% | |
| Sweden 5.2% | |
| Spain 3.0% | |
| Netherlands 2.7% | |
| Other 24.2% | |

* Includes Short-Term Investments and Net Other Assets (Liabilities) |
Percentages are based on country or territory of incorporation and are adjusted for the effect of futures contracts, if applicable. |
Asset Allocation as of October 31, 2014 |
| % of fund's
net assets | % of fund's net assets
6 months ago |
Stocks and Equity Futures | 97.5 | 96.0 |
Other Investments | 0.1 | 0.1 |
Short-Term Investments and Net Other Assets (Liabilities) | 2.4 | 3.9 |
Top Ten Stocks as of October 31, 2014 |
| % of fund's
net assets | % of fund's net assets
6 months ago |
Roche Holding AG (participation certificate) (Switzerland, Pharmaceuticals) | 2.5 | 2.3 |
Total SA (France, Oil, Gas & Consumable Fuels) | 1.9 | 2.0 |
Australia & New Zealand Banking Group Ltd. (Australia, Banks) | 1.7 | 1.8 |
Bayer AG (Germany, Pharmaceuticals) | 1.6 | 1.8 |
Astellas Pharma, Inc. (Japan, Pharmaceuticals) | 1.4 | 0.9 |
Keyence Corp. (Japan, Electronic Equipment & Components) | 1.3 | 1.0 |
Actavis PLC (Ireland, Pharmaceuticals) | 1.3 | 0.5 |
Housing Development Finance Corp. Ltd. (India, Thrifts & Mortgage Finance) | 1.2 | 0.8 |
Japan Tobacco, Inc. (Japan, Tobacco) | 1.2 | 1.1 |
Anheuser-Busch InBev SA NV (Belgium, Beverages) | 1.2 | 1.1 |
| 15.3 | |
Market Sectors as of October 31, 2014 |
| % of fund's
net assets | % of fund's net assets
6 months ago |
Financials | 20.7 | 21.1 |
Health Care | 14.9 | 12.4 |
Consumer Discretionary | 12.9 | 14.8 |
Information Technology | 10.7 | 8.3 |
Consumer Staples | 10.7 | 8.4 |
Industrials | 10.4 | 14.6 |
Energy | 5.6 | 3.5 |
Materials | 4.7 | 5.4 |
Telecommunication Services | 3.9 | 5.1 |
Utilities | 0.2 | 0.2 |
Annual Report
Investments October 31, 2014
Showing Percentage of Net Assets
Common Stocks - 93.6% |
| Shares | | Value (000s) |
Australia - 4.3% |
Ansell Ltd. | 2,499,254 | | $ 43,839 |
Asaleo Care Ltd. (a) | 23,409,115 | | 41,813 |
Australia & New Zealand Banking Group Ltd. | 6,493,040 | | 192,133 |
G8 Education Ltd. | 5,831,484 | | 25,767 |
Greencross Ltd. | 1,186,547 | | 8,960 |
Ramsay Health Care Ltd. | 1,215,729 | | 56,201 |
Regis Healthcare Ltd. (a) | 4,596,817 | | 17,433 |
Spotless Group Holdings Ltd. | 18,983,369 | | 32,120 |
Woodside Petroleum Ltd. | 1,705,042 | | 60,564 |
TOTAL AUSTRALIA | | 478,830 |
Austria - 0.2% |
Andritz AG | 455,300 | | 21,978 |
Bailiwick of Jersey - 1.9% |
Glencore Xstrata PLC | 9,661,966 | | 49,445 |
MySale Group PLC (f) | 8,571,600 | | 26,053 |
Shire PLC | 1,110,100 | | 74,484 |
Wolseley PLC | 1,030,400 | | 54,675 |
TOTAL BAILIWICK OF JERSEY | | 204,657 |
Belgium - 1.9% |
Anheuser-Busch InBev SA NV | 1,183,927 | | 131,291 |
Arseus NV | 252,964 | | 10,112 |
KBC Groupe SA (a) | 1,328,201 | | 71,155 |
TOTAL BELGIUM | | 212,558 |
Bermuda - 1.1% |
BW Offshore Ltd. | 8,689,300 | | 10,654 |
Noble Group Ltd. | 22,526,000 | | 20,969 |
PAX Global Technology Ltd. (a)(f) | 66,294,000 | | 71,203 |
Travelport Worldwide Ltd. (e) | 1,324,600 | | 19,140 |
TOTAL BERMUDA | | 121,966 |
Canada - 3.1% |
Alimentation Couche-Tard, Inc. Class B (sub. vtg.) | 1,346,700 | | 45,705 |
Constellation Software, Inc. | 266,500 | | 75,075 |
First Quantum Minerals Ltd. (e) | 1,164,300 | | 17,562 |
Imperial Oil Ltd. | 1,205,500 | | 58,005 |
Potash Corp. of Saskatchewan, Inc. | 813,500 | | 27,767 |
PrairieSky Royalty Ltd. (e) | 1,530,400 | | 47,118 |
Common Stocks - continued |
| Shares | | Value (000s) |
Canada - continued |
Suncor Energy, Inc. | 1,036,600 | | $ 36,808 |
TransForce, Inc. (e) | 1,412,400 | | 34,538 |
TOTAL CANADA | | 342,578 |
Cayman Islands - 2.1% |
Alibaba Group Holding Ltd. sponsored ADR | 927,200 | | 91,422 |
Baidu.com, Inc. sponsored ADR (a) | 175,200 | | 41,833 |
ENN Energy Holdings Ltd. | 3,266,000 | | 21,191 |
Greatview Aseptic Pack Co. Ltd. | 26,392,000 | | 17,374 |
Sands China Ltd. | 3,748,400 | | 23,379 |
WuXi PharmaTech Cayman, Inc. sponsored ADR (a) | 841,400 | | 31,721 |
TOTAL CAYMAN ISLANDS | | 226,920 |
China - 0.0% |
Yantai Changyu Pioneer Wine Co. Ltd. (B Shares) | 485,600 | | 1,526 |
Colombia - 0.2% |
Grupo Aval Acciones y Valores SA ADR | 1,645,837 | | 22,186 |
Cyprus - 0.0% |
SPDI Secure Property Development & Investment PLC (a) | 529,830 | | 479 |
Denmark - 2.0% |
ISS Holdings A/S (a) | 384,000 | | 10,706 |
Novo Nordisk A/S Series B | 2,298,245 | | 103,887 |
Pandora A/S | 514,000 | | 43,270 |
Vestas Wind Systems A/S (a) | 1,874,500 | | 62,741 |
TOTAL DENMARK | | 220,604 |
Finland - 0.8% |
Sampo Oyj (A Shares) | 1,739,800 | | 83,219 |
France - 5.1% |
Atos Origin SA | 531,441 | | 36,689 |
AXA SA | 1,839,400 | | 42,436 |
BNP Paribas SA | 1,039,745 | | 65,330 |
Bureau Veritas SA | 737,700 | | 18,239 |
Havas SA | 5,933,668 | | 47,961 |
Numericable Group SA (e) | 483,713 | | 17,882 |
Numericable Group SA rights 11/12/14 (a)(e) | 483,713 | | 14,342 |
Rexel SA | 1,107,782 | | 18,609 |
Schneider Electric SA | 798,800 | | 62,944 |
SR Teleperformance SA | 297,200 | | 18,719 |
Total SA | 3,562,400 | | 212,687 |
TOTAL FRANCE | | 555,838 |
Common Stocks - continued |
| Shares | | Value (000s) |
Germany - 5.7% |
Aareal Bank AG | 1,044,895 | | $ 44,743 |
Bayer AG | 1,224,000 | | 174,016 |
Continental AG | 306,500 | | 60,168 |
Drillisch AG | 2,022,600 | | 70,184 |
GEA Group AG | 1,508,060 | | 69,347 |
KION Group AG | 1,429,749 | | 51,995 |
LEG Immobilien AG | 610,854 | | 42,140 |
Siemens AG | 727,119 | | 82,014 |
Symrise AG | 500,800 | | 28,163 |
TOTAL GERMANY | | 622,770 |
Hong Kong - 2.2% |
AIA Group Ltd. | 22,053,600 | | 123,068 |
Techtronic Industries Co. Ltd. | 39,683,000 | | 124,232 |
TOTAL HONG KONG | | 247,300 |
India - 3.2% |
Bharti Infratel Ltd. | 11,032,464 | | 52,872 |
Container Corp. of India Ltd. | 470,441 | | 10,379 |
Housing Development Finance Corp. Ltd. | 7,555,494 | | 136,069 |
Info Edge India Ltd. | 1,609,886 | | 22,122 |
Lupin Ltd. | 2,986,357 | | 69,144 |
The Jammu & Kashmir Bank Ltd. | 7,127,060 | | 16,146 |
Titan Co. Ltd. (a) | 2,240,879 | | 14,720 |
Yes Bank Ltd. | 3,138,775 | | 35,543 |
TOTAL INDIA | | 356,995 |
Indonesia - 0.8% |
PT Bank Central Asia Tbk | 41,701,500 | | 45,018 |
PT Bank Rakyat Indonesia Tbk | 44,669,800 | | 40,935 |
TOTAL INDONESIA | | 85,953 |
Ireland - 2.8% |
Actavis PLC (a) | 586,200 | | 142,294 |
Bank of Ireland (a) | 63,590,200 | | 25,142 |
Glanbia PLC | 2,424,800 | | 34,215 |
James Hardie Industries PLC CDI | 3,230,390 | | 34,457 |
Kerry Group PLC Class A | 1,035,200 | | 70,299 |
TOTAL IRELAND | | 306,407 |
Italy - 1.0% |
De Longhi SpA | 2,375,100 | | 46,372 |
Common Stocks - continued |
| Shares | | Value (000s) |
Italy - continued |
Telecom Italia SpA (a)(e) | 42,790,100 | | $ 48,493 |
World Duty Free SpA (a) | 2,253,904 | | 19,079 |
TOTAL ITALY | | 113,944 |
Japan - 17.1% |
ABC-MART, Inc. | 398,400 | | 22,972 |
ACOM Co. Ltd. (a) | 7,381,200 | | 24,603 |
Aozora Bank Ltd. | 11,251,000 | | 39,546 |
Astellas Pharma, Inc. | 10,267,800 | | 159,361 |
Coca-Cola Central Japan Co. Ltd. | 1,597,500 | | 28,744 |
Dentsu, Inc. | 899,500 | | 33,443 |
Don Quijote Holdings Co. Ltd. | 898,200 | | 53,816 |
Hitachi Ltd. | 6,659,000 | | 52,323 |
Hoya Corp. | 2,822,900 | | 99,894 |
Japan Exchange Group, Inc. | 2,358,200 | | 58,498 |
Japan Tobacco, Inc. | 3,948,700 | | 134,726 |
KDDI Corp. | 1,626,800 | | 106,831 |
Keyence Corp. | 304,060 | | 147,342 |
NEC Corp. | 26,163,000 | | 92,522 |
Nippon Kanzai Co. Ltd. | 8,000 | | 209 |
Olympus Corp. (a) | 1,501,000 | | 53,894 |
OMRON Corp. | 2,083,000 | | 98,598 |
ORIX Corp. | 5,463,900 | | 75,840 |
Park24 Co. Ltd. | 1,342,800 | | 20,319 |
Rakuten, Inc. | 5,927,100 | | 66,837 |
Santen Pharmaceutical Co. Ltd. | 583,800 | | 34,845 |
Seven & i Holdings Co., Ltd. | 2,748,600 | | 107,350 |
Seven Bank Ltd. | 17,781,300 | | 74,262 |
Ship Healthcare Holdings, Inc. | 1,076,700 | | 25,201 |
SoftBank Corp. | 1,575,100 | | 114,666 |
Sundrug Co. Ltd. | 825,500 | | 39,878 |
Toshiba Plant Systems & Services Corp. | 1,771,500 | | 29,652 |
Tsuruha Holdings, Inc. | 1,212,600 | | 71,593 |
VT Holdings Co. Ltd. | 3,967,000 | | 15,667 |
TOTAL JAPAN | | 1,883,432 |
Korea (South) - 0.7% |
Naturalendo Tech Co. Ltd. | 167,866 | | 8,765 |
NAVER Corp. | 65,859 | | 46,217 |
Samsung SDI Co. Ltd. | 200,556 | | 23,519 |
TOTAL KOREA (SOUTH) | | 78,501 |
Common Stocks - continued |
| Shares | | Value (000s) |
Luxembourg - 0.6% |
Altice SA | 759,700 | | $ 47,306 |
Grand City Properties SA (a) | 1,543,962 | | 19,783 |
TOTAL LUXEMBOURG | | 67,089 |
Marshall Islands - 0.1% |
Hoegh LNG Partners LP | 591,451 | | 12,426 |
Netherlands - 2.5% |
AEGON NV | 5,028,800 | | 40,987 |
AerCap Holdings NV (a) | 1,672,000 | | 72,464 |
IMCD Group BV | 1,902,200 | | 52,442 |
ING Groep NV (Certificaten Van Aandelen) (a) | 3,830,600 | | 54,856 |
LyondellBasell Industries NV Class A | 8,700 | | 797 |
Royal DSM NV | 787,237 | | 49,292 |
TOTAL NETHERLANDS | | 270,838 |
New Zealand - 0.7% |
EBOS Group Ltd. | 4,569,842 | | 34,090 |
Ryman Healthcare Group Ltd. | 7,311,565 | | 43,258 |
TOTAL NEW ZEALAND | | 77,348 |
Philippines - 0.7% |
Alliance Global Group, Inc. | 77,786,166 | | 43,752 |
SM Investments Corp. | 1,681,790 | | 29,306 |
TOTAL PHILIPPINES | | 73,058 |
Portugal - 0.2% |
CTT Correios de Portugal SA | 2,226,700 | | 20,621 |
Singapore - 0.2% |
Ezion Holdings Ltd. | 15,127,200 | | 17,814 |
South Africa - 0.4% |
Naspers Ltd. Class N | 369,200 | | 45,947 |
Spain - 2.6% |
Amadeus IT Holding SA Class A | 2,349,200 | | 86,256 |
Atresmedia Corporacion de Medios de Comunicacion SA | 1,515,400 | | 22,200 |
Banco Bilbao Vizcaya Argentaria SA | 4,806,144 | | 53,756 |
Criteria CaixaCorp SA | 10,039,365 | | 54,739 |
Inditex SA | 2,408,395 | | 67,650 |
TOTAL SPAIN | | 284,601 |
Sweden - 4.1% |
ASSA ABLOY AB (B Shares) | 2,357,200 | | 124,849 |
H&M Hennes & Mauritz AB (B Shares) | 1,057,821 | | 42,074 |
Common Stocks - continued |
| Shares | | Value (000s) |
Sweden - continued |
HEXPOL AB (B Shares) | 341,200 | | $ 30,173 |
Intrum Justitia AB | 1,211,317 | | 35,991 |
Nordea Bank AB | 9,576,600 | | 122,818 |
Svenska Cellulosa AB (SCA) (B Shares) | 1,118,800 | | 25,015 |
Svenska Handelsbanken AB (A Shares) | 1,425,600 | | 67,977 |
TOTAL SWEDEN | | 448,897 |
Switzerland - 6.0% |
Clariant AG (Reg.) | 2,358,150 | | 41,053 |
Compagnie Financiere Richemont SA Series A | 530,511 | | 44,634 |
Lonza Group AG | 521,951 | | 57,449 |
Partners Group Holding AG | 230,056 | | 61,151 |
Roche Holding AG (participation certificate) | 926,232 | | 273,335 |
Schindler Holding AG (participation certificate) | 194,920 | | 27,228 |
Sonova Holding AG Class B | 339,424 | | 52,846 |
UBS AG | 6,126,361 | | 106,526 |
TOTAL SWITZERLAND | | 664,222 |
Taiwan - 0.3% |
ECLAT Textile Co. Ltd. | 94,607 | | 901 |
Merida Industry Co. Ltd. | 4,995,900 | | 34,456 |
TOTAL TAIWAN | | 35,357 |
Turkey - 0.1% |
Logo Yazilim Sanayi Ve Ticar (a) | 1,125,049 | | 13,211 |
United Arab Emirates - 0.1% |
Emaar Malls Group PJSC (a) | 7,174,619 | | 6,270 |
United Kingdom - 14.9% |
Aberdeen Asset Management PLC | 5,975,132 | | 41,484 |
Advanced Computer Software Group PLC | 5,750,200 | | 9,934 |
Al Noor Hospitals Group PLC | 2,487,400 | | 40,547 |
Anglo American PLC (United Kingdom) | 1,316,500 | | 27,796 |
Associated British Foods PLC | 791,000 | | 34,848 |
B&M European Value Retail S.A. | 6,402,976 | | 25,479 |
BG Group PLC | 6,766,700 | | 112,774 |
BHP Billiton PLC | 4,625,988 | | 119,520 |
British American Tobacco PLC (United Kingdom) | 2,261,200 | | 128,159 |
BTG PLC (a) | 1,152,900 | | 13,924 |
Bunzl PLC | 1,143,100 | | 30,995 |
Diageo PLC | 3,650,857 | | 107,672 |
Exova Group Ltd. PLC (a) | 4,302,877 | | 11,684 |
Galiform PLC | 5,687,600 | | 31,144 |
Common Stocks - continued |
| Shares | | Value (000s) |
United Kingdom - continued |
Hikma Pharmaceuticals PLC | 3,032,490 | | $ 91,928 |
ITV PLC | 14,738,700 | | 47,862 |
Jazztel PLC (a) | 2,320,066 | | 37,040 |
Liberty Global PLC: | | | |
Class A (a) | 677,800 | | 30,820 |
Class C | 677,800 | | 30,142 |
Lloyds Banking Group PLC (a) | 54,946,900 | | 67,853 |
London Stock Exchange Group PLC | 3,415,236 | | 110,087 |
Melrose PLC | 11,027,800 | | 45,179 |
Next PLC | 774,844 | | 79,887 |
Persimmon PLC | 1,505,600 | | 35,236 |
Poundland Group PLC (a) | 3,906,035 | | 19,683 |
Reckitt Benckiser Group PLC | 788,600 | | 66,230 |
Rex Bionics PLC (a)(f) | 1,328,936 | | 3,518 |
Rotork PLC | 717,800 | | 29,338 |
SABMiller PLC | 1,107,300 | | 62,440 |
St. James's Place Capital PLC | 5,676,000 | | 67,645 |
Taylor Wimpey PLC | 12,002,700 | | 22,734 |
The Restaurant Group PLC | 1,992,100 | | 21,558 |
Ultra Electronics Holdings PLC | 614,667 | | 17,158 |
Vodafone Group PLC | 2,127,096 | | 7,074 |
Zoopla Property Group PLC | 2,595,500 | | 8,603 |
TOTAL UNITED KINGDOM | | 1,637,975 |
United States of America - 3.9% |
Chevron Corp. | 560,500 | | 67,232 |
Constellation Brands, Inc. Class A (sub. vtg.) (a) | 505,400 | | 46,264 |
Google, Inc.: | | | |
Class A (a) | 90,700 | | 51,506 |
Class C (a) | 90,700 | | 50,709 |
Las Vegas Sands Corp. | 177,700 | | 11,064 |
McGraw Hill Financial, Inc. | 1,415,500 | | 128,074 |
Visa, Inc. Class A | 301,900 | | 72,888 |
TOTAL UNITED STATES OF AMERICA | | 427,737 |
TOTAL COMMON STOCKS (Cost $8,985,470) |
10,292,052
|
Nonconvertible Preferred Stocks - 1.0% |
| | | |
Germany - 1.0% |
Volkswagen AG | 514,100 | | 109,554 |
Nonconvertible Preferred Stocks - continued |
| Shares | | Value (000s) |
United Kingdom - 0.0% |
Rolls-Royce Group PLC | 227,278,350 | | $ 364 |
TOTAL NONCONVERTIBLE PREFERRED STOCKS (Cost $113,684) |
109,918
|
Government Obligations - 0.1% |
| Principal
Amount (000s) (d) | | |
United States of America - 0.1% |
U.S. Treasury Bills, yield at date of purchase 0.02% to 0.03% 11/13/14 to 1/29/15 (i)
(Cost $11,590) | | $ 11,590 | |
11,590
|
Preferred Securities - 0.1% |
|
Ireland - 0.1% |
Baggot Securities Ltd. 10.24% (g)(h)
(Cost $14,037) | EUR | 9,140 | |
12,947
|
Money Market Funds - 5.6% |
| Shares | | |
Fidelity Cash Central Fund, 0.11% (b) | 567,797,475 | | 567,797 |
Fidelity Securities Lending Cash Central Fund, 0.11% (b)(c) | 52,624,430 | | 52,624 |
TOTAL MONEY MARKET FUNDS (Cost $620,421) |
620,421
|
TOTAL INVESTMENT PORTFOLIO - 100.4% (Cost $9,745,202) | | 11,046,928 |
NET OTHER ASSETS (LIABILITIES) - (0.4)% | | (48,377) |
NET ASSETS - 100% | $ 10,998,551 |
Futures Contracts |
| Expiration Date | | Underlying Face Amount at Value (000s) | | Unrealized Appreciation/
(Depreciation)
(000s) |
Purchased |
Equity Index Contracts |
3,792 CME Nikkei 225 Index Contracts (United States) | Dec. 2014 | | $ 323,647 | | $ 24,598 |
|
The face value of futures purchased as a percentage of net assets is 2.9% |
Currency Abbreviations |
EUR | - | European Monetary Unit |
Legend |
(a) Non-income producing |
(b) Affiliated fund that is generally available only to investment companies and other accounts managed by Fidelity Investments. The rate quoted is the annualized seven-day yield of the fund at period end. A complete unaudited listing of the fund's holdings as of its most recent quarter end is available upon request. In addition, each Fidelity Central Fund's financial statements, which are not covered by the Fund's Report of Independent Registered Public Accounting Firm, are available on the SEC's website or upon request. |
(c) Investment made with cash collateral received from securities on loan. |
(d) Amount is stated in United States dollars unless otherwise noted. |
(e) Security or a portion of the security is on loan at period end. |
(f) Affiliated company |
(g) Security exempt from registration under Rule 144A of the Securities Act of 1933. These securities may be resold in transactions exempt from registration, normally to qualified institutional buyers. At the end of the period, the value of these securities amounted to $12,947,000 or 0.1% of net assets. |
(h) Security is perpetual in nature with no stated maturity date. |
(i) Security or a portion of the security was pledged to cover margin requirements for futures contracts. At period end, the value of securities pledged amounted to $11,590,000. |
Affiliated Central Funds |
Information regarding fiscal year to date income earned by the Fund from investments in Fidelity Central Funds is as follows: |
Fund | Income earned
(Amounts in thousands) |
Fidelity Cash Central Fund | $ 600 |
Fidelity Securities Lending Cash Central Fund | 5,278 |
Total | $ 5,878 |
Other Affiliated Issuers |
An affiliated company is a company in which the Fund has ownership of at least 5% of the voting securities. Fiscal year to date transactions with companies which are or were affiliates are as follows: |
Affiliate
(Amounts in thousands) | Value,
beginning of
period | Purchases | Sales Proceeds | Dividend Income | Value,
end of
period |
MySale Group PLC | $ - | $ 32,521 | $ - | $ - | $ 26,053 |
PAX Global Technology Ltd. | - | 39,641 | 3,956 | - | 71,203 |
Rex Bionics PLC | - | 4,037 | - | - | 3,518 |
Total | $ - | $ 76,199 | $ 3,956 | $ - | $ 100,774 |
Other Information |
Categorizations in the Schedule of Investments are based on country or territory of incorporation. |
The following is a summary of the inputs used, as of October 31, 2014, involving the Fund's assets and liabilities carried at fair value. The inputs or methodology used for valuing securities may not be an indication of the risk associated with investing in those securities. For more information on valuation inputs, and their aggregation into the levels used in the table below, please refer to the Investment Valuation section in the accompanying Notes to Financial Statements. |
Valuation Inputs at Reporting Date: |
Description
(Amounts in thousands) | Total | Level 1 | Level 2 | Level 3 |
Investments in Securities: | | | | |
Equities: | | | | |
Consumer Discretionary | $ 1,445,431 | $ 1,029,241 | $ 416,190 | $ - |
Consumer Staples | 1,177,768 | 385,016 | 792,752 | - |
Energy | 636,082 | 232,243 | 403,839 | - |
Financials | 2,262,497 | 1,051,716 | 1,210,781 | - |
Health Care | 1,634,986 | 714,402 | 920,584 | - |
Industrials | 1,109,082 | 840,362 | 268,720 | - |
Information Technology | 1,181,932 | 597,928 | 584,004 | - |
Materials | 495,841 | 296,694 | 199,147 | - |
Telecommunication Services | 437,160 | 107,224 | 329,936 | - |
Utilities | 21,191 | - | 21,191 | - |
Government Obligations | 11,590 | - | 11,590 | - |
Preferred Securities | 12,947 | - | 12,947 | - |
Money Market Funds | 620,421 | 620,421 | - | - |
Total Investments in Securities: | $ 11,046,928 | $ 5,875,247 | $ 5,171,681 | $ - |
Derivative Instruments: | | | | |
Assets | | | | |
Futures Contracts | $ 24,598 | $ 24,598 | $ - | $ - |
The following is a summary of transfers between Level 1 and Level 2 for the period ended October 31, 2014. Transfers are assumed to have occurred at the beginning of the period, and are primarily attributable to the valuation techniques used for foreign equity securities, as discussed in the accompanying Notes to Financial Statements: |
Transfers | Total (000s) |
Level 1 to Level 2 | $ 1,082,136 |
Level 2 to Level 1 | $ 0 |
Value of Derivative Instruments |
The following table is a summary of the Fund's value of derivative instruments by primary risk exposure as of October 31, 2014. For additional information on derivative instruments, please refer to the Derivative Instruments section in the accompanying Notes to Financial Statements. |
Primary Risk Exposure /
Derivative Type | Value (000s) |
| Asset | Liability |
Equity Risk | | |
Futures Contracts (a) | $ 24,598 | $ - |
Total Value of Derivatives | $ 24,598 | $ - |
(a) Reflects gross cumulative appreciation (depreciation) on futures contracts as presented in the Schedule of Investments. Only the period end receivable or payable for daily variation margin and net unrealized appreciation (depreciation) are presented in the Statement of Assets and Liabilities. |
See accompanying notes which are an integral part of the financial statements.
Annual Report
Statement of Assets and Liabilities
Amounts in thousands (except per-share amounts) | October 31, 2014 |
| | |
Assets | | |
Investment in securities, at value (including securities loaned of $50,476) - See accompanying schedule: Unaffiliated issuers (cost $9,050,379) | $ 10,325,733 | |
Fidelity Central Funds (cost $620,421) | 620,421 | |
Other affiliated issuers (cost $74,402) | 100,774 | |
Total Investments (cost $9,745,202) | | $ 11,046,928 |
Receivable for investments sold | | 41,866 |
Receivable for fund shares sold | | 6,258 |
Dividends receivable | | 19,075 |
Distributions receivable from Fidelity Central Funds | | 78 |
Receivable for daily variation margin for derivative instruments | | 23,890 |
Prepaid expenses | | 36 |
Other receivables | | 3,818 |
Total assets | | 11,141,949 |
| | |
Liabilities | | |
Payable for investments purchased | $ 408 | |
Payable for fund shares redeemed | 73,445 | |
Accrued management fee | 6,840 | |
Distribution and service plan fees payable | 112 | |
Other affiliated payables | 1,580 | |
Other payables and accrued expenses | 8,389 | |
Collateral on securities loaned, at value | 52,624 | |
Total liabilities | | 143,398 |
| | |
Net Assets | | $ 10,998,551 |
Net Assets consist of: | | |
Paid in capital | | $ 9,891,341 |
Undistributed net investment income | | 68,609 |
Accumulated undistributed net realized gain (loss) on investments and foreign currency transactions | | (278,180) |
Net unrealized appreciation (depreciation) on investments and assets and liabilities in foreign currencies | | 1,316,781 |
Net Assets | | $ 10,998,551 |
See accompanying notes which are an integral part of the financial statements.
Annual Report
Statement of Assets and Liabilities - continued
Amounts in thousands (except per-share amounts) | October 31, 2014 |
| | |
Calculation of Maximum Offering Price Class A:
Net Asset Value and redemption price per share ($296,718.26 ÷ 7,667.518 shares) | | $ 38.70 |
| | |
Maximum offering price per share (100/94.25 of $38.70) | | $ 41.06 |
Class T:
Net Asset Value and redemption price per share ($48,545.20 ÷ 1,263.274 shares) | | $ 38.43 |
| | |
Maximum offering price per share (100/96.50 of $38.43) | | $ 39.82 |
Class B:
Net Asset Value and offering price per share ($4,616.85 ÷ 120.484 shares)A | | $ 38.32 |
| | |
Class C:
Net Asset Value and offering price per share ($35,346.11 ÷ 924.200 shares)A | | $ 38.25 |
| | |
International Discovery:
Net Asset Value, offering price and redemption price per share ($7,464,021.58 ÷ 191,244.937 shares) | | $ 39.03 |
| | |
Class K:
Net Asset Value, offering price and redemption price per share ($2,464,322.23 ÷ 63,228.753 shares) | | $ 38.97 |
| | |
Institutional Class:
Net Asset Value, offering price and redemption price per share ($649,855.06 ÷ 16,682.058 shares) | | $ 38.96 |
| | |
Class Z:
Net Asset Value, offering price and redemption price per share ($35,125.45 ÷ 901.567 shares) | | $ 38.96 |
A Redemption price per share is equal to net asset value less any applicable contingent deferred sales charge.
See accompanying notes which are an integral part of the financial statements.
Annual Report
Financial Statements - continued
Statement of Operations
Amounts in thousands | Year ended October 31, 2014 |
| | |
Investment Income | | |
Dividends | | $ 259,008 |
Special dividends | | 63,816 |
Interest | | 64 |
Income from Fidelity Central Funds | | 5,878 |
Income before foreign taxes withheld | | 328,766 |
Less foreign taxes withheld | | (23,208) |
Total income | | 305,558 |
| | |
Expenses | | |
Management fee
Basic fee | $ 80,931 | |
Performance adjustment | 2,685 | |
Transfer agent fees | 17,771 | |
Distribution and service plan fees | 1,508 | |
Accounting and security lending fees | 1,856 | |
Custodian fees and expenses | 1,542 | |
Independent trustees' compensation | 48 | |
Registration fees | 223 | |
Audit | 116 | |
Legal | 40 | |
Miscellaneous | 85 | |
Total expenses before reductions | 106,805 | |
Expense reductions | (345) | 106,460 |
Net investment income (loss) | | 199,098 |
Realized and Unrealized Gain (Loss) Net realized gain (loss) on: | | |
Investment securities: | | |
Unaffiliated issuers | 740,761 | |
Other affiliated issuers | 2,158 | |
Foreign currency transactions | (1,181) | |
Futures contracts | 16,266 | |
Total net realized gain (loss) | | 758,004 |
Change in net unrealized appreciation (depreciation) on: Investment securities (net of increase in deferred foreign taxes of $7,503) | (978,230) | |
Assets and liabilities in foreign currencies | (886) | |
Futures contracts | 20,360 | |
Total change in net unrealized appreciation (depreciation) | | (958,756) |
Net gain (loss) | | (200,752) |
Net increase (decrease) in net assets resulting from operations | | $ (1,654) |
See accompanying notes which are an integral part of the financial statements.
Annual Report
Statement of Changes in Net Assets
Amounts in thousands | Year ended
October 31,
2014 | Year ended
October 31,
2013 |
Increase (Decrease) in Net Assets | | |
Operations | | |
Net investment income (loss) | $ 199,098 | $ 129,203 |
Net realized gain (loss) | 758,004 | 725,376 |
Change in net unrealized appreciation (depreciation) | (958,756) | 1,463,372 |
Net increase (decrease) in net assets resulting
from operations | (1,654) | 2,317,951 |
Distributions to shareholders from net investment income | (136,326) | (146,031) |
Distributions to shareholders from net realized gain | (88,586) | (8,413) |
Total distributions | (224,912) | (154,444) |
Share transactions - net increase (decrease) | (69,908) | 714,712 |
Redemption fees | 139 | 128 |
Total increase (decrease) in net assets | (296,335) | 2,878,347 |
| | |
Net Assets | | |
Beginning of period | 11,294,886 | 8,416,539 |
End of period (including undistributed net investment income of $68,609 and undistributed net investment income of $131,430, respectively) | $ 10,998,551 | $ 11,294,886 |
See accompanying notes which are an integral part of the financial statements.
Annual Report
Financial Highlights - Class A
Years ended October 31, | 2014 | 2013 | 2012 | 2011 | 2010 |
Selected Per-Share Data | | | | | |
Net asset value, beginning of period | $ 39.49 | $ 31.66 | $ 29.43 | $ 32.07 | $ 28.57 |
Income from Investment Operations | | | | | |
Net investment income (loss) C | .53 F | .34 | .41 | .42 | .31 |
Net realized and unrealized gain (loss) | (.67) | 7.97 | 2.11 | (2.52) | 3.51 |
Total from investment operations | (.14) | 8.31 | 2.52 | (2.10) | 3.82 |
Distributions from net investment income | (.33) | (.45) | (.29) | (.38) | (.28) |
Distributions from net realized gain | (.31) | (.03) | - | (.16) | (.04) |
Total distributions | (.65) I | (.48) | (.29) | (.54) | (.32) |
Redemption fees added to paid in capital C, H | - | - | - | - | - |
Net asset value, end of period | $ 38.70 | $ 39.49 | $ 31.66 | $ 29.43 | $ 32.07 |
Total ReturnA, B | (.36)% | 26.59% | 8.70% | (6.71)% | 13.43% |
Ratios to Average Net Assets D, G | | | | | |
Expenses before reductions | 1.28% | 1.35% | 1.34% | 1.30% | 1.33% |
Expenses net of fee waivers, if any | 1.28% | 1.35% | 1.34% | 1.29% | 1.33% |
Expenses net of all reductions | 1.28% | 1.33% | 1.31% | 1.25% | 1.28% |
Net investment income (loss) | 1.35% F | .97% | 1.41% | 1.31% | 1.06% |
Supplemental Data | | | | | |
Net assets, end of period (in millions) | $ 297 | $ 347 | $ 299 | $ 320 | $ 392 |
Portfolio turnover rate E | 57% | 65% | 68% | 75% | 82% |
A Total returns would have been lower if certain expenses had not been reduced during the applicable periods shown.
B Total returns do not include the effect of the sales charges.
C Calculated based on average shares outstanding during the period.
D Fees and expenses of any underlying Fidelity Central Funds are not included in the Fund's expense ratio. The Fund indirectly bears its proportionate share of the expenses of any underlying Fidelity Central Funds.
E Amount does not include the portfolio activity of any underlying Fidelity Central Funds.
F Investment income per share reflects a large, non-recurring dividend which amounted to $.22 per share. Excluding this non-recurring dividend, the ratio of net investment income (loss) to average net assets would have been .80%.
G Expense ratios reflect operating expenses of the class. Expenses before reductions do not reflect amounts reimbursed by the investment adviser or reductions from brokerage service arrangements or reductions from other expense offset arrangements and do not represent the amount paid by the class during periods when reimbursements or reductions occur. Expenses net of fee waivers reflect expenses after reimbursement by the investment adviser but prior to reductions from brokerage service arrangements or other expense offset arrangements. Expenses net of all reductions represent the net expenses paid by the class.
H Amount represents less than $.01 per share.
I Total distributions of $.65 per share is comprised of distributions from net investment income of $.334 and distributions from net realized gain of $.311 per share.
See accompanying notes which are an integral part of the financial statements.
Annual Report
Financial Highlights - Class T
Years ended October 31, | 2014 | 2013 | 2012 | 2011 | 2010 |
Selected Per-Share Data | | | | | |
Net asset value, beginning of period | $ 39.23 | $ 31.42 | $ 29.18 | $ 31.81 | $ 28.35 |
Income from Investment Operations | | | | | |
Net investment income (loss) C | .44 F | .26 | .34 | .34 | .23 |
Net realized and unrealized gain (loss) | (.68) | 7.92 | 2.09 | (2.51) | 3.48 |
Total from investment operations | (.24) | 8.18 | 2.43 | (2.17) | 3.71 |
Distributions from net investment income | (.25) | (.34) | (.19) | (.30) | (.21) |
Distributions from net realized gain | (.31) | (.03) | - | (.16) | (.04) |
Total distributions | (.56) | (.37) | (.19) | (.46) | (.25) |
Redemption fees added to paid in capital C, H | - | - | - | - | - |
Net asset value, end of period | $ 38.43 | $ 39.23 | $ 31.42 | $ 29.18 | $ 31.81 |
Total ReturnA, B | (.60)% | 26.31% | 8.41% | (6.96)% | 13.14% |
Ratios to Average Net Assets D, G | | | | | |
Expenses before reductions | 1.51% | 1.59% | 1.59% | 1.56% | 1.60% |
Expenses net of fee waivers, if any | 1.51% | 1.59% | 1.59% | 1.55% | 1.60% |
Expenses net of all reductions | 1.51% | 1.57% | 1.56% | 1.51% | 1.56% |
Net investment income (loss) | 1.11% F | .73% | 1.16% | 1.05% | .79% |
Supplemental Data | | | | | |
Net assets, end of period (in millions) | $ 49 | $ 53 | $ 46 | $ 61 | $ 92 |
Portfolio turnover rateE | 57% | 65% | 68% | 75% | 82% |
A Total returns would have been lower if certain expenses had not been reduced during the applicable periods shown.
B Total returns do not include the effect of the sales charges.
C Calculated based on average shares outstanding during the period.
D Fees and expenses of any underlying Fidelity Central Funds are not included in the Fund's expense ratio. The Fund indirectly bears its proportionate share of the expenses of any underlying Fidelity Central Funds.
E Amount does not include the portfolio activity of any underlying Fidelity Central Funds.
F Investment income per share reflects large, non-recurring dividend which amounted to $.21 per share. Excluding this non-recurring dividend, the ratio of net investment income (loss) to average net assets would have been .56%.
G Expense ratios reflect operating expenses of the class. Expenses before reductions do not reflect amounts reimbursed by the investment adviser or reductions from brokerage service arrangements or reductions from other expense offset arrangements and do not represent the amount paid by the class during periods when reimbursements or reductions occur. Expenses net of fee waivers reflect expenses after reimbursement by the investment adviser but prior to reductions from brokerage service arrangements or other expense offset arrangements. Expenses net of all reductions represent the net expenses paid by the class.
H Amount represents less than $.01 per share.
See accompanying notes which are an integral part of the financial statements.
Annual Report
Financial Highlights - Class B
Years ended October 31, | 2014 | 2013 | 2012 | 2011 | 2010 |
Selected Per-Share Data | | | | | |
Net asset value, beginning of period | $ 39.08 | $ 31.28 | $ 29.02 | $ 31.60 | $ 28.18 |
Income from Investment Operations | | | | | |
Net investment income (loss) C | .22 F | .08 | .19 | .17 | .08 |
Net realized and unrealized gain (loss) | (.66) | 7.90 | 2.09 | (2.48) | 3.44 |
Total from investment operations | (.44) | 7.98 | 2.28 | (2.31) | 3.52 |
Distributions from net investment income | (.01) | (.15) | (.02) | (.12) | (.06) |
Distributions from net realized gain | (.31) | (.03) | - | (.16) | (.04) |
Total distributions | (.32) | (.18) | (.02) | (.27) I | (.10) |
Redemption fees added to paid in capital C, H | - | - | - | - | - |
Net asset value, end of period | $ 38.32 | $ 39.08 | $ 31.28 | $ 29.02 | $ 31.60 |
Total ReturnA, B | (1.12)% | 25.64% | 7.85% | (7.39)% | 12.52% |
Ratios to Average Net Assets D, G | | | | | |
Expenses before reductions | 2.06% | 2.10% | 2.09% | 2.06% | 2.12% |
Expenses net of fee waivers, if any | 2.06% | 2.10% | 2.09% | 2.06% | 2.12% |
Expenses net of all reductions | 2.05% | 2.08% | 2.06% | 2.02% | 2.08% |
Net investment income (loss) | .57% F | .22% | .66% | .54% | .27% |
Supplemental Data | | | | | |
Net assets, end of period (in millions) | $ 5 | $ 7 | $ 8 | $ 10 | $ 14 |
Portfolio turnover rateE | 57% | 65% | 68% | 75% | 82% |
A Total returns would have been lower if certain expenses had not been reduced during the applicable periods shown.
B Total returns do not include the effect of the contingent deferred sales charge.
C Calculated based on average shares outstanding during the period.
D Fees and expenses of any underlying Fidelity Central Funds are not included in the Fund's expense ratio. The Fund indirectly bears its proportionate share of the expenses of any underlying Fidelity Central Funds.
E Amount does not include the portfolio activity of any underlying Fidelity Central Funds.
F Investment income per share reflects a large, non-recurring dividend which amounted to $.21 per share. Excluding this non-recurring dividend, the ratio of net investment income (loss) to average net assets would have been .02%.
G Expense ratios reflect operating expenses of the class. Expenses before reductions do not reflect amounts reimbursed by the investment adviser or reductions from brokerage service arrangements or reductions from other expense offset arrangements and do not represent the amount paid by the class during periods when reimbursements or reductions occur. Expenses net of fee waivers reflect expenses after reimbursement by the investment adviser but prior to reductions from brokerage service arrangements or other expense offset arrangements. Expenses net of all reductions represent the net expenses paid by the class.
H Amount represents less than $.01 per share.
I Total distributions of $.27 per share is comprised of distributions from net investment income of $.115 and distributions from net realized gain of $.155 per share.
See accompanying notes which are an integral part of the financial statements.
Annual Report
Financial Highlights - Class C
Years ended October 31, | 2014 | 2013 | 2012 | 2011 | 2010 |
Selected Per-Share Data | | | | | |
Net asset value, beginning of period | $ 39.07 | $ 31.32 | $ 29.08 | $ 31.68 | $ 28.23 |
Income from Investment Operations | | | | | |
Net investment income (loss) C | .23 F | .08 | .19 | .18 | .09 |
Net realized and unrealized gain (loss) | (.66) | 7.90 | 2.09 | (2.49) | 3.45 |
Total from investment operations | (.43) | 7.98 | 2.28 | (2.31) | 3.54 |
Distributions from net investment income | (.08) | (.20) | (.04) | (.14) | (.05) |
Distributions from net realized gain | (.31) | (.03) | - | (.16) | (.04) |
Total distributions | (.39) | (.23) | (.04) | (.29) I | (.09) |
Redemption fees added to paid in capital C, H | - | - | - | - | - |
Net asset value, end of period | $ 38.25 | $ 39.07 | $ 31.32 | $ 29.08 | $ 31.68 |
Total ReturnA, B | (1.10)% | 25.65% | 7.86% | (7.37)% | 12.54% |
Ratios to Average Net Assets D, G | | | | | |
Expenses before reductions | 2.03% | 2.10% | 2.09% | 2.05% | 2.09% |
Expenses net of fee waivers, if any | 2.03% | 2.09% | 2.09% | 2.04% | 2.09% |
Expenses net of all reductions | 2.02% | 2.07% | 2.06% | 2.00% | 2.05% |
Net investment income (loss) | .60% F | .23% | .66% | .56% | .30% |
Supplemental Data | | | | | |
Net assets, end of period (in millions) | $ 35 | $ 36 | $ 30 | $ 33 | $ 44 |
Portfolio turnover rateE | 57% | 65% | 68% | 75% | 82% |
A Total returns would have been lower if certain expenses had not been reduced during the applicable periods shown.
B Total returns do not include the effect of the contingent deferred sales charge.
C Calculated based on average shares outstanding during the period.
D Fees and expenses of any underlying Fidelity Central Funds are not included in the Fund's expense ratio. The Fund indirectly bears its proportionate share of the expenses of any underlying Fidelity Central Funds.
E Amount does not include the portfolio activity of any underlying Fidelity Central Funds.
F Investment income per share reflects a large, non-recurring dividend which amounted to $.21 per share. Excluding this non-recurring dividend, the ratio of net investment income (loss) to average net assets would have been .05%.
G Expense ratios reflect operating expenses of the class. Expenses before reductions do not reflect amounts reimbursed by the investment adviser or reductions from brokerage service arrangements or reductions from other expense offset arrangements and do not represent the amount paid by the class during periods when reimbursements or reductions occur. Expenses net of fee waivers reflect expenses after reimbursement by the investment adviser but prior to reductions from brokerage service arrangements or other expense offset arrangements. Expenses net of all reductions represent the net expenses paid by the class.
H Amount represents less than $.01 per share.
I Total distributions of $.29 per share is comprised of distributions from net investment income of $.137 and distributions from net realized gain of $.155 per share.
See accompanying notes which are an integral part of the financial statements.
Annual Report
Financial Highlights - International Discovery
Years ended October 31, | 2014 | 2013 | 2012 | 2011 | 2010 |
Selected Per-Share Data | | | | | |
Net asset value, beginning of period | $ 39.82 | $ 31.91 | $ 29.69 | $ 32.34 | $ 28.79 |
Income from Investment Operations | | | | | |
Net investment income (loss) B | .67 E | .47 | .51 | .53 | .40 |
Net realized and unrealized gain (loss) | (.68) | 8.02 | 2.12 | (2.54) | 3.54 |
Total from investment operations | (.01) | 8.49 | 2.63 | (2.01) | 3.94 |
Distributions from net investment income | (.47) | (.55) | (.41) | (.48) | (.35) |
Distributions from net realized gain | (.31) | (.03) | - | (.16) | (.04) |
Total distributions | (.78) | (.58) | (.41) | (.64) | (.39) |
Redemption fees added to paid in capital B, G | - | - | - | - | - |
Net asset value, end of period | $ 39.03 | $ 39.82 | $ 31.91 | $ 29.69 | $ 32.34 |
Total ReturnA | (.01)% | 27.03% | 9.03% | (6.39)% | 13.76% |
Ratios to Average Net Assets C, F | | | | | |
Expenses before reductions | .93% | 1.00% | 1.01% | .97% | 1.05% |
Expenses net of fee waivers, if any | .93% | 1.00% | 1.01% | .96% | 1.05% |
Expenses net of all reductions | .93% | .98% | .98% | .92% | 1.00% |
Net investment income (loss) | 1.69% E | 1.32% | 1.73% | 1.64% | 1.35% |
Supplemental Data | | | | | |
Net assets, end of period (in millions) | $ 7,464 | $ 7,800 | $ 5,965 | $ 6,806 | $ 8,133 |
Portfolio turnover rateD | 57% | 65% | 68% | 75% | 82% |
A Total returns would have been lower if certain expenses had not been reduced during the applicable periods shown.
B Calculated based on average shares outstanding during the period.
C Fees and expenses of any underlying Fidelity Central Funds are not included in the Fund's expense ratio. The Fund indirectly bears its proportionate share of the expenses of any underlying Fidelity Central Funds.
D Amount does not include the portfolio activity of any underlying Fidelity Central Funds.
E Investment income per share reflects a large, non-recurring dividend which amounted to $.22 per share. Excluding this non-recurring dividend, the ratio of net investment income (loss) to average net assets would have been 1.15%.
F Expense ratios reflect operating expenses of the class. Expenses before reductions do not reflect amounts reimbursed by the investment adviser or reductions from brokerage service arrangements or reductions from other expense offset arrangements and do not represent the amount paid by the class during periods when reimbursements or reductions occur. Expenses net of fee waivers reflect expenses after reimbursement by the investment adviser but prior to reductions from brokerage service arrangements or other expense offset arrangements. Expenses net of all reductions represent the net expenses paid by the class.
G Amount represents less than $.01 per share.
See accompanying notes which are an integral part of the financial statements.
Annual Report
Financial Highlights - Class K
Years ended October 31, | 2014 | 2013 | 2012 | 2011 | 2010 |
Selected Per-Share Data | | | | | |
Net asset value, beginning of period | $ 39.76 | $ 31.87 | $ 29.66 | $ 32.32 | $ 28.78 |
Income from Investment Operations | | | | | |
Net investment income (loss) B | .72 E | .52 | .57 | .58 | .46 |
Net realized and unrealized gain (loss) | (.67) | 8.01 | 2.11 | (2.54) | 3.53 |
Total from investment operations | .05 | 8.53 | 2.68 | (1.96) | 3.99 |
Distributions from net investment income | (.53) | (.61) | (.47) | (.55) | (.41) |
Distributions from net realized gain | (.31) | (.03) | - | (.16) | (.04) |
Total distributions | (.84) | (.64) | (.47) | (.70) H | (.45) |
Redemption fees added to paid in capital B, G | - | - | - | - | - |
Net asset value, end of period | $ 38.97 | $ 39.76 | $ 31.87 | $ 29.66 | $ 32.32 |
Total ReturnA | .13% | 27.23% | 9.24% | (6.24)% | 13.96% |
Ratios to Average Net Assets C, F | | | | | |
Expenses before reductions | .80% | .85% | .83% | .80% | .84% |
Expenses net of fee waivers, if any | .80% | .85% | .83% | .79% | .84% |
Expenses net of all reductions | .79% | .83% | .80% | .75% | .79% |
Net investment income (loss) | 1.83% E | 1.47% | 1.91% | 1.81% | 1.55% |
Supplemental Data | | | | | |
Net assets, end of period (in millions) | $ 2,464 | $ 2,576 | $ 1,776 | $ 1,245 | $ 1,078 |
Portfolio turnover rateD | 57% | 65% | 68% | 75% | 82% |
A Total returns would have been lower if certain expenses had not been reduced during the applicable periods shown.
B Calculated based on average shares outstanding during the period.
C Fees and expenses of any underlying Fidelity Central Funds are not included in the Fund's expense ratio. The Fund indirectly bears its proportionate share of the expenses of any underlying Fidelity Central Funds.
D Amount does not include the portfolio activity of any underlying Fidelity Central Funds.
E Investment income per share reflects a large, non-recurring dividend which amounted to $.22 per share. Excluding this non-recurring dividend, the ratio of net investment income (loss) to average net assets would have been 1.28%.
F Expense ratios reflect operating expenses of the class. Expenses before reductions do not reflect amounts reimbursed by the investment adviser or reductions from brokerage service arrangements or reductions from other expense offset arrangements and do not represent the amount paid by the class during periods when reimbursements or reductions occur. Expenses net of fee waivers reflect expenses after reimbursement by the investment adviser but prior to reductions from brokerage service arrangements or other expense offset arrangements. Expenses net of all reductions represent the net expenses paid by the class.
G Amount represents less than $.01 per share.
H Total distributions of $.70 per share is comprised of distributions from net investment income of $.548 and distributions from net realized gain of $.155 per share.
See accompanying notes which are an integral part of the financial statements.
Annual Report
Financial Highlights - Institutional Class
Years ended October 31, | 2014 | 2013 | 2012 | 2011 | 2010 |
Selected Per-Share Data | | | | | |
Net asset value, beginning of period | $ 39.76 | $ 31.87 | $ 29.65 | $ 32.31 | $ 28.77 |
Income from Investment Operations | | | | | |
Net investment income (loss) B | .67 E | .47 | .52 | .54 | .41 |
Net realized and unrealized gain (loss) | (.68) | 8.01 | 2.11 | (2.55) | 3.55 |
Total from investment operations | (.01) | 8.48 | 2.63 | (2.01) | 3.96 |
Distributions from net investment income | (.48) | (.56) | (.41) | (.50) | (.38) |
Distributions from net realized gain | (.31) | (.03) | - | (.16) | (.04) |
Total distributions | (.79) | (.59) | (.41) | (.65) H | (.42) |
Redemption fees added to paid in capital B, G | - | - | - | - | - |
Net asset value, end of period | $ 38.96 | $ 39.76 | $ 31.87 | $ 29.65 | $ 32.31 |
Total ReturnA | (.01)% | 27.03% | 9.07% | (6.39)% | 13.84% |
Ratios to Average Net Assets C, F | | | | | |
Expenses before reductions | .93% | 1.00% | 1.00% | .95% | .99% |
Expenses net of fee waivers, if any | .93% | 1.00% | 1.00% | .94% | .99% |
Expenses net of all reductions | .93% | .97% | .97% | .90% | .95% |
Net investment income (loss) | 1.69% E | 1.33% | 1.75% | 1.66% | 1.40% |
Supplemental Data | | | | | |
Net assets, end of period (in millions) | $ 650 | $ 476 | $ 294 | $ 278 | $ 319 |
Portfolio turnover rateD | 57% | 65% | 68% | 75% | 82% |
A Total returns would have been lower if certain expenses had not been reduced during the applicable periods shown.
B Calculated based on average shares outstanding during the period.
C Fees and expenses of any underlying Fidelity Central Funds are not included in the Fund's expense ratio. The Fund indirectly bears its proportionate share of the expenses of any underlying Fidelity Central Funds.
D Amount does not include the portfolio activity of any underlying Fidelity Central Funds.
E Investment income per share reflects a large, non-recurring dividend which amounted to $.22 per share. Excluding this non-recurring dividend, the ratio of net investment income (loss) to average net assets would have been 1.14%.
F Expense ratios reflect operating expenses of the class. Expenses before reductions do not reflect amounts reimbursed by the investment adviser or reductions from brokerage service arrangements or reductions from other expense offset arrangements and do not represent the amount paid by the class during periods when reimbursements or reductions occur. Expenses net of fee waivers reflect expenses after reimbursement by the investment adviser but prior to reductions from brokerage service arrangements or other expense offset arrangements. Expenses net of all reductions represent the net expenses paid by the class.
G Amount represents less than $.01 per share.
H Total distributions of $.65 per share is comprised of distributions from net investment income of $.497 and distributions from net realized gain of $.155 per share.
See accompanying notes which are an integral part of the financial statements.
Annual Report
Financial Highlights - Class Z
Years ended October 31, | 2014 | 2013 H |
Selected Per-Share Data | | |
Net asset value, beginning of period | $ 39.77 | $ 37.22 |
Income from Investment Operations | | |
Net investment income (loss) D | .72 G | .07 |
Net realized and unrealized gain (loss) | (.68) | 2.48 |
Total from investment operations | .04 | 2.55 |
Distributions from net investment income | (.54) | - |
Distributions from net realized gain | (.31) | - |
Total distributions | (.85) | - |
Redemption fees added to paid in capital D, J | - | - |
Net asset value, end of period | $ 38.96 | $ 39.77 |
Total ReturnB, C | .12% | 6.85% |
Ratios to Average Net Assets E, I | | |
Expenses before reductions | .80% | .85%A |
Expenses net of fee waivers, if any | .80% | .85%A |
Expenses net of all reductions | .79% | .83%A |
Net investment income (loss) | 1.83% G | .76% A |
Supplemental Data | | |
Net assets, end of period (000 omitted) | $ 35,125 | $ 107 |
Portfolio turnover rateF | 57% | 65% |
A Annualized
B Total returns for periods of less than one year are not annualized.
C Total returns would have been lower if certain expenses had not been reduced during the applicable periods shown.
D Calculated based on average shares outstanding during the period.
E Fees and expenses of any underlying Fidelity Central Funds are not included in the Fund's expense ratio. The Fund indirectly bears its proportionate share of the expenses of any underlying Fidelity Central Funds.
F Amount does not include the portfolio activity of any underlying Fidelity Central Funds.
G Investment income per share reflects a large, non-recurring dividend which amounted to $.21 per share. Excluding this non-recurring dividend, the ratio of net investment income (loss) to average net assets would have been 1.28%.
H For the period August 13, 2013 (commencement of sale of shares) to October 31, 2013.
I Expense ratios reflect operating expenses of the class. Expenses before reductions do not reflect amounts reimbursed by the investment adviser or reductions from brokerage service arrangements or reductions from other expense offset arrangements and do not represent the amount paid by the class during periods when reimbursements or reductions occur. Expenses net of fee waivers reflect expenses after reimbursement by the investment adviser but prior to reductions from brokerage service arrangements or other expense offset arrangements. Expenses net of all reductions represent the net expenses paid by the class.
J Amount represents less than $.01 per share.
See accompanying notes which are an integral part of the financial statements.
Annual Report
Notes to Financial Statements
For the period ended October 31, 2014
(Amounts in thousands except percentages)
1. Organization.
Fidelity International Discovery Fund (the Fund) is a fund of Fidelity Investment Trust (the Trust) and is authorized to issue an unlimited number of shares. The Trust is registered under the Investment Company Act of 1940, as amended (the 1940 Act), as an open-end management investment company organized as a Massachusetts business trust. The Fund offers Class A, Class T, Class C, International Discovery, Class K, Institutional Class and Class Z shares, each of which, along with Class B shares, has equal rights as to assets and voting privileges. Class B shares are closed to new accounts and additional purchases, except for exchanges and reinvestments. Each class has exclusive voting rights with respect to matters that affect that class. Class B shares will automatically convert to Class A shares after a holding period of seven years from the initial date of purchase.
2. Investments in Fidelity Central Funds.
The Fund invests in Fidelity Central Funds, which are open-end investment companies generally available only to other investment companies and accounts managed by the investment adviser and its affiliates. The Fund's Schedule of Investments lists each of the Fidelity Central Funds held as of period end, if any, as an investment of the Fund, but does not include the underlying holdings of each Fidelity Central Fund. As an Investing Fund, the Fund indirectly bears its proportionate share of the expenses of the underlying Fidelity Central Funds.
The Money Market Central Funds seek preservation of capital and current income and are managed by Fidelity Investments Money Management, Inc. (FIMM), an affiliate of the investment adviser. Annualized expenses of the Money Market Central Funds as of their most recent shareholder report date are less than .01%.
A complete unaudited list of holdings for each Fidelity Central Fund is available upon request or at the Securities and Exchange Commission (the SEC) website at www.sec.gov. In addition, the financial statements of the Fidelity Central Funds, which are not covered by the Fund's Report of Independent Registered Public Accounting Firm, are available on the SEC website or upon request.
3. Significant Accounting Policies.
The financial statements have been prepared in conformity with accounting principles generally accepted in the United States of America (GAAP), which require management to make certain estimates and assumptions at the date of the financial statements. Actual results could differ from those estimates. Subsequent events, if any, through the date that the financial statements were issued have been evaluated in the preparation of
Annual Report
3. Significant Accounting Policies - continued
the financial statements. The following summarizes the significant accounting policies of the Fund:
Investment Valuation. Investments are valued as of 4:00 p.m. Eastern time on the last calendar day of the period. In accordance with valuation policies and procedures approved by the Board of Trustees (the Board), the Fund attempts to obtain prices from one or more third party pricing vendors or brokers to value its investments. When current market prices, quotations or currency exchange rates are not readily available or reliable, investments will be fair valued in good faith by the Fidelity Management & Research Company (FMR) Fair Value Committee (the Committee), in accordance with procedures adopted by the Board. Factors used in determining fair value vary by investment type and may include market or investment specific events, changes in interest rates and credit quality. The frequency with which these procedures are used cannot be predicted and they may be utilized to a significant extent. The Committee oversees the Fund's valuation policies and procedures and is responsible for approving and reporting to the Board all fair value determinations.
The Fund categorizes the inputs to valuation techniques used to value its investments into a disclosure hierarchy consisting of three levels as shown below:
Level 1 - quoted prices in active markets for identical investments
Level 2 - other significant observable inputs (including quoted prices for similar investments, interest rates, prepayment speeds, etc.)
Level 3 - unobservable inputs (including the Fund's own assumptions based on the best information available)
Valuation techniques used to value the Fund's investments by major category are as follows:
Equity securities, including restricted securities, for which market quotations are readily available, are valued at the last reported sale price or official closing price as reported by a third party pricing vendor on the primary market or exchange on which they are traded and are categorized as Level 1 in the hierarchy. In the event there were no sales during the day or closing prices are not available, securities are valued at the last quoted bid price or may be valued using the last available price and are generally categorized as Level 2 in the hierarchy. For foreign equity securities, when market or security specific events arise, comparisons to the valuation of American Depositary Receipts (ADRs), futures contracts, Exchange-Traded Funds (ETFs) and certain indexes as well as quoted prices for similar securities may be used and would be categorized as Level 2 in the hierarchy. Utilizing these techniques may result in transfers between Level 1 and Level 2. For equity securities, including restricted securities, where observable inputs are limited, assumptions about market activity and risk are used and these securities may be categorized as Level 3 in the hierarchy.
Annual Report
Notes to Financial Statements - continued
(Amounts in thousands except percentages)
3. Significant Accounting Policies - continued
Investment Valuation - continued
Debt securities, including restricted securities, are valued based on evaluated prices received from third party pricing vendors or from brokers who make markets in such securities. Preferred securities and U.S. government and government agency obligations are valued by pricing vendors who utilize matrix pricing which considers yield or price of bonds of comparable quality, coupon, maturity and type or by broker-supplied prices. When independent prices are unavailable or unreliable, debt securities may be valued utilizing pricing methodologies which consider similar factors that would be used by third party pricing vendors. Debt securities are generally categorized as Level 2 in the hierarchy but may be Level 3 depending on the circumstances.
Futures contracts are valued at the settlement price established each day by the board of trade or exchange on which they are traded and are categorized as Level 1 in the hierarchy. Investments in open-end mutual funds, including the Fidelity Central Funds, are valued at their closing net asset value (NAV) each business day and are categorized as Level 1 in the hierarchy.
Changes in valuation techniques may result in transfers in or out of an assigned level within the disclosure hierarchy. The aggregate value of investments by input level, as of October 31, 2014, including information on transfers between Levels 1 and 2 is included at the end of the Fund's Schedule of Investments.
Foreign Currency. The Fund may use foreign currency contracts to facilitate transactions in foreign-denominated securities. Gains and losses from these transactions may arise from changes in the value of the foreign currency or if the counterparties do not perform under the contracts' terms.
Foreign-denominated assets, including investment securities, and liabilities are translated into U.S. dollars at the exchange rates at period end. Purchases and sales of investment securities, income and dividends received and expenses denominated in foreign currencies are translated into U.S. dollars at the exchange rate in effect on the transaction date.
The effects of exchange rate fluctuations on investments are included with the net realized and unrealized gain (loss) on investment securities. Other foreign currency transactions resulting in realized and unrealized gain (loss) are disclosed separately.
Investment Transactions and Income. For financial reporting purposes, the Fund's investment holdings and NAV include trades executed through the end of the last business day of the period. The NAV per share for processing shareholder transactions is calculated as of the close of business of the New York Stock Exchange (NYSE), normally 4:00 p.m. Eastern time and includes trades executed through the end of the prior business day. Gains and losses on securities sold are determined on the basis of identified
Annual Report
3. Significant Accounting Policies - continued
Investment Transactions and Income - continued
cost and may include proceeds received from litigation. Dividend income is recorded on the ex-dividend date, except for certain dividends from foreign securities where the ex-dividend date may have passed, which are recorded as soon as the Fund is informed of the ex-dividend date. Non-cash dividends included in dividend income, if any, are recorded at the fair market value of the securities received. Income and capital gain distributions from Fidelity Central Funds, if any, are recorded on the ex-dividend date. Large, non-recurring dividends recognized by the Fund are presented separately on the Statement of Operations as "Special Dividends" and the impact of these dividends is presented in the Financial Highlights. Interest income is accrued as earned and includes coupon interest and amortization of premium and accretion of discount on debt securities as applicable. Investment income is recorded net of foreign taxes withheld where recovery of such taxes is uncertain.
Class Allocations and Expenses. Investment income, realized and unrealized capital gains and losses, common expenses of the Fund, and certain fund-level expense reductions, if any, are allocated daily on a pro-rata basis to each class based on the relative net assets of each class to the total net assets of the Fund. Each class differs with respect to transfer agent and distribution and service plan fees incurred. Certain expense reductions may also differ by class. For the reporting period, the allocated portion of income and expenses to each class as a percent of its average net assets may vary due to the timing of recording these transactions in relation to fluctuating net assets of the classes. Expenses directly attributable to a fund are charged to that fund. Expenses attributable to more than one fund are allocated among the respective funds on the basis of relative net assets or other appropriate methods. Expense estimates are accrued in the period to which they relate and adjustments are made when actual amounts are known.
Deferred Trustee Compensation. Under a Deferred Compensation Plan (the Plan), independent Trustees may elect to defer receipt of a portion of their annual compensation. Deferred amounts are invested in a cross-section of Fidelity funds, are marked-to-market and remain in the Fund until distributed in accordance with the Plan. The investment of deferred amounts and the offsetting payable to the Trustees are included in the accompanying Statement of Assets and Liabilities.
Income Tax Information and Distributions to Shareholders. Each year, the Fund intends to qualify as a regulated investment company under Subchapter M of the Internal Revenue Code, including distributing substantially all of its taxable income and realized gains. As a result, no provision for U.S. Federal income taxes is required. As of October 31, 2014, the Fund did not have any unrecognized tax benefits in the financial statements; nor is the Fund aware of any tax positions for which it is reasonably possible that the total amounts of unrecognized tax benefits will significantly change in the next
Annual Report
Notes to Financial Statements - continued
(Amounts in thousands except percentages)
3. Significant Accounting Policies - continued
Income Tax Information and Distributions to Shareholders - continued
twelve months. The Fund files a U.S. federal tax return, in addition to state and local tax returns as required. The Fund's federal income tax returns are subject to examination by the Internal Revenue Service (IRS) for a period of three fiscal years after they are filed. State and local tax returns may be subject to examination for an additional fiscal year depending on the jurisdiction. Foreign taxes are provided for based on the Fund's understanding of the tax rules and rates that exist in the foreign markets in which it invests. The Fund is subject to a tax imposed on capital gains by certain countries in which it invests. An estimated deferred tax liability for net unrealized appreciation on the applicable securities is included in Other payables and accrued expenses on the Statement of Assets & Liabilities.
Distributions are declared and recorded on the ex-dividend date. Income dividends and capital gain distributions are declared separately for each class. Income and capital gain distributions are determined in accordance with income tax regulations, which may differ from GAAP. In addition, the Fund claimed a portion of the payment made to redeeming shareholders as a distribution for income tax purposes.
Capital accounts within the financial statements are adjusted for permanent book-tax differences. These adjustments have no impact on net assets or the results of operations. Capital accounts are not adjusted for temporary book-tax differences which will reverse in a subsequent period.
Book-tax differences are primarily due to futures contracts, foreign currency transactions, passive foreign investment companies (PFIC), market discount, deferred trustees compensation, capital loss carryforwards and losses deferred due to wash sales.
The federal tax cost of investment securities and unrealized appreciation (depreciation) as of period end were as follows:
Gross unrealized appreciation | $ 1,714,728 |
Gross unrealized depreciation | (439,338) |
Net unrealized appreciation (depreciation) on securities | $ 1,275,390 |
| |
Tax Cost | $ 9,771,538 |
The tax-based components of distributable earnings as of period end were as follows:
Undistributed ordinary income | $ 68,892 |
Capital loss carryforward | $ (227,245) |
Net unrealized appreciation (depreciation) on securities and other investments | $ 1,273,334 |
Annual Report
3. Significant Accounting Policies - continued
Income Tax Information and Distributions to Shareholders - continued
Capital loss carryforwards are only available to offset future capital gains of the Fund to the extent provided by regulations and may be limited. Under the Regulated Investment Company Modernization Act of 2010 (the Act), the Fund is permitted to carry forward capital losses incurred in taxable years beginning after December 22, 2010 for an unlimited period and such capital losses are required to be used prior to any losses that expire. The capital loss carryforward information presented below, including any applicable limitation, is estimated as of fiscal period end and is subject to adjustment.
Fiscal year of expiration | |
2017 | $ (227,245) |
The tax character of distributions paid was as follows:
| October 31, 2014 | October 31, 2013 |
Ordinary Income | $ 224,912 | $ 154,444 |
Short-Term Trading (Redemption) Fees. Shares held by investors in the Fund less than 30 days may have been subject to a redemption fee equal to 1.00% of the NAV of shares redeemed. All redemption fees, which reduce the proceeds of the shareholder redemption, are retained by the Fund and accounted for as an addition to paid in capital.
Restricted Securities. The Fund may invest in securities that are subject to legal or contractual restrictions on resale. These securities generally may be resold in transactions exempt from registration or to the public if the securities are registered. Disposal of these securities may involve time-consuming negotiations and expense, and prompt sale at an acceptable price may be difficult. Information regarding restricted securities is included at the end of the Fund's Schedule of Investments.
New Accounting Pronouncement. In June 2014, the Financial Accounting Standards Board issued Accounting Standard Update No. 2014-11, Repurchase-to-Maturity Transactions, Repurchase Financings, and Disclosures. The Update amends the accounting for certain repurchase agreements and expands disclosure requirements for reverse repurchase agreements, securities lending and other similar transactions. The disclosure requirements are effective for annual and interim reporting periods beginning after December 15, 2014. Management is currently evaluating the impact of the Update on the Fund's financial statements and related disclosures.
4. Derivative Instruments.
Risk Exposures and the Use of Derivative Instruments. The Fund's investment objective allows the Fund to enter into various types of derivative contracts, including
Annual Report
Notes to Financial Statements - continued
(Amounts in thousands except percentages)
4. Derivative Instruments - continued
Risk Exposures and the Use of Derivative Instruments - continued
futures contracts. Derivatives are investments whose value is primarily derived from underlying assets, indices or reference rates and may be transacted on an exchange or over-the-counter (OTC). Derivatives may involve a future commitment to buy or sell a specified asset based on specified terms, to exchange future cash flows at periodic intervals based on a notional principal amount, or for one party to make one or more payments upon the occurrence of specified events in exchange for periodic payments from the other party.
The Fund used derivatives to increase returns and to manage exposure to certain risks as defined below. The success of any strategy involving derivatives depends on analysis of numerous economic factors, and if the strategies for investment do not work as intended, the Fund may not achieve its objectives.
The Fund's use of derivatives increased or decreased its exposure to the following risk:
Equity Risk | Equity risk relates to the fluctuations in the value of financial instruments as a result of changes in market prices (other than those arising from interest rate risk or foreign exchange risk), whether caused by factors specific to an individual investment, its issuer, or all factors affecting all instruments traded in a market or market segment. |
The Fund is also exposed to additional risks from investing in derivatives, such as liquidity risk and counterparty credit risk. Liquidity risk is the risk that the Fund will be unable to close out the derivative in the open market in a timely manner. Counterparty credit risk is the risk that the counterparty will not be able to fulfill its obligation to the Fund. Counterparty credit risk related to exchange-traded futures contracts may be mitigated by the protection provided by the exchange on which they trade.
Investing in derivatives may involve greater risks than investing in the underlying assets directly and, to varying degrees, may involve risk of loss in excess of any initial investment and collateral received and amounts recognized in the Statement of Assets and Liabilities. In addition, there may be the risk that the change in value of the derivative contract does not correspond to the change in value of the underlying instrument.
Futures Contracts. A futures contract is an agreement between two parties to buy or sell a specified underlying instrument for a fixed price at a specified future date. The Fund used futures contracts to manage its exposure to the stock market.
Upon entering into a futures contract, a fund is required to deposit either cash or securities (initial margin) with a clearing broker in an amount equal to a certain percentage of the face value of the contract. Futures contracts are marked-to-market daily and subsequent daily payments variation margin are made or received by a fund depending on the
Annual Report
4. Derivative Instruments - continued
Futures Contracts - continued
daily fluctuations in the value of the futures contracts and are recorded as unrealized appreciation or (depreciation). This receivable and/or payable, if any, is included in daily variation margin for derivative instruments in the Statement of Assets and Liabilities. Realized gain or (loss) is recorded upon the expiration or closing of a futures contract.
Any open futures contracts at period end are presented in the Schedule of Investments under the caption "Futures Contracts." The underlying face amount at value reflects each contract's exposure to the underlying instrument or index at period end and is
representative of volume of activity during the period. Securities deposited to meet initial margin requirements are identified in the Schedule of Investments.
During the period the Fund recognized net realized gain (loss) of $16,266 and a change in net unrealized appreciation (depreciation) of $20,360 related to its investment in futures contracts. These amounts are included in the Statement of Operations.
5. Purchases and Sales of Investments.
Purchases and sales of securities, other than short-term securities, aggregated $6,348,453 and $6,576,338, respectively.
6. Fees and Other Transactions with Affiliates.
Management Fee. Fidelity Management & Research Company (the investment adviser) and its affiliates provide the Fund with investment management related services for which the Fund pays a monthly management fee. The management fee is the sum of an individual fund fee rate that is based on an annual rate of .424% of the Fund's average net assets and an annualized group fee rate that averaged .25% during the period. Prior to August 1, 2014 the individual fund fee rate was .45%. The group fee rate is based upon the average net assets of all the mutual funds advised by the investment adviser, including any mutual funds previously advised by the investment adviser that are currently advised by Fidelity SelectCo, LLC, an affiliate of the investment adviser. The group fee rate decreases as assets under management increase and increases as assets under management decrease. In addition, the management fee is subject to a performance adjustment (up to a maximum of ± .20% of the Fund's average net assets over a 36 month performance period). The upward or downward adjustment to the management fee is based on the relative investment performance of International Discovery as compared to its benchmark index, the MSCI EAFE Index, over the same 36 month performance period. For the reporting period, the total annual management fee rate, including the performance adjustment, was .72% of the Fund's average net assets. The performance adjustment included in the management fee rate may be higher or lower
Annual Report
Notes to Financial Statements - continued
(Amounts in thousands except percentages)
6. Fees and Other Transactions with Affiliates - continued
Management Fee - continued
than the maximum performance adjustment rate due to the difference between the average net assets for the reporting and performance periods.
Distribution and Service Plan Fees. In accordance with Rule 12b-1 of the 1940 Act, the Fund has adopted separate Distribution and Service Plans for each class of shares. Certain classes pay Fidelity Distributors Corporation (FDC), an affiliate of the investment adviser, separate Distribution and Service Fees, each of which is based on an annual percentage of each class' average net assets. In addition, FDC may pay financial intermediaries for selling shares of the Fund and providing shareholder support services.
For the period, the Distribution and Service Fee rates, total fees and amounts retained by FDC were as follows:
| Distribution
Fee | Service
Fee | Total Fees | Retained
by FDC |
Class A | -% | .25% | $ 813 | $ 6 |
Class T | .25% | .25% | 255 | 1 |
Class B | .75% | .25% | 58 | 44 |
Class C | .75% | .25% | 382 | 44 |
| | | $ 1,508 | $ 95 |
Sales Load. FDC may receive a front-end sales charge of up to 5.75% for selling Class A shares and 3.50% for selling Class T shares, some of which is paid to financial intermediaries for selling shares of the Fund. Depending on the holding period, FDC may receive contingent deferred sales charges levied on Class A, Class T, Class B, and Class C redemptions. The deferred sales charges range from 5.00% to 1.00% for Class B shares, 1.00% for Class C shares, 1.00% for certain purchases of Class A shares and .25% for certain purchases of Class T shares.
For the period, sales charge amounts retained by FDC were as follows:
| Retained
by FDC |
Class A | $ 59 |
Class T | 7 |
Class B* | 3 |
Class C* | 5 |
| $ 74 |
* When Class B and Class C shares are initially sold, FDC pays commissions from its own resources to financial intermediaries through which the sales are made.
Annual Report
6. Fees and Other Transactions with Affiliates - continued
Transfer Agent Fees. Fidelity Investments Institutional Operations Company, Inc., (FIIOC), an affiliate of the investment adviser is the transfer, dividend disbursing and shareholder servicing agent for each class of the Fund. FIIOC receives account fees and asset-based fees that vary according to the account size and type of account of the shareholders of the respective classes of the Fund, except for Class Z. FIIOC receives an asset-based fee of Class K's and Class Z's average net assets. FIIOC receives an asset-based fee of Class Z's average net assets. FIIOC pays for typesetting, printing and mailing of shareholder reports, except proxy statements.
For the period, transfer agent fees for each applicable class were as follows:
| Amount | % of
Class-Level Average
Net Assets |
Class A | $ 904 | .28 |
Class T | 134 | .26 |
Class B | 18 | .30 |
Class C | 105 | .28 |
International Discovery | 14,295 | .18 |
Class K | 1,219 | .05 |
Institutional Class | 1,088 | .18 |
Class Z | 8 | .05 |
| $ 17,771 | |
Accounting and Security Lending Fees. Fidelity Service Company, Inc. (FSC), an affiliate of the investment adviser, maintains the Fund's accounting records. The accounting fee is based on the level of average net assets for each month. Under a separate contract, FSC administers the security lending program. The security lending fee is based on the number and duration of lending transactions.
Brokerage Commissions. The Fund placed a portion of its portfolio transactions with brokerage firms which are affiliates of the investment adviser. Brokerage commissions are included in net realized gain (loss) and change in net unrealized appreciation (depreciation) in the Statement of Operations. The commissions paid to these affiliated firms were $11 for the period.
Other. During the period, the investment adviser reimbursed the Fund for certain losses in the amount of $2.
7. Committed Line of Credit.
The Fund participates with other funds managed by the investment adviser or an affiliate in a $4.25 billion credit facility (the "line of credit") to be utilized for temporary or emergency purposes to fund shareholder redemptions or for other short-term liquidity purposes. The Fund has agreed to pay commitment fees on its pro-rata portion of the line
Annual Report
Notes to Financial Statements - continued
(Amounts in thousands except percentages)
7. Committed Line of Credit - continued
of credit, which amounted to $19 and is reflected in Miscellaneous expenses on the Statement of Operations. During the period, the Fund did not borrow on this line of credit.
8. Security Lending.
The Fund lends portfolio securities through a lending agent from time to time in order to earn additional income. For equity securities, a lending agent is used and may loan securities to certain qualified borrowers, including Fidelity Capital Markets (FCM), a broker-dealer affiliated with the Fund. On the settlement date of the loan, the Fund receives collateral (in the form of U.S. Treasury obligations, letters of credit and/or cash) against the loaned securities and maintains collateral in an amount not less than 100% of the market value of the loaned securities during the period of the loan. The market value of the loaned securities is determined at the close of business of the Fund and any additional required collateral is delivered to the Fund on the next business day. If the borrower defaults on its obligation to return the securities loaned because of insolvency or other reasons, the Fund may apply collateral received from the borrower against the obligation. The Fund may experience delays and costs in recovering the securities loaned. Any cash collateral received is invested in the Fidelity Securities Lending Cash Central Fund. The value of loaned securities and cash collateral at period end are disclosed on the Fund's Statement of Assets and Liabilities. At period end, there were no security loans outstanding with FCM. Security lending income represents the income earned on investing cash collateral, less rebates paid to borrowers and any lending agent fees associated with the loan, plus any premium payments received for lending certain types of securities. Security lending income is presented in the Statement of Operations as a component of income from Fidelity Central Funds. Total security lending income during the period amounted to $5,278, including $7 from securities loaned to FCM.
9. Expense Reductions.
Commissions paid to certain brokers with whom the investment adviser, or its affiliates, places trades on behalf of the Fund include an amount in addition to trade execution, which may be rebated back to the Fund to offset certain expenses. This amount totaled $317 for the period.
In addition, the investment adviser reimbursed a portion of the Fund's operating expenses during the period in the amount of $28.
Annual Report
10. Distributions to Shareholders.
Distributions to shareholders of each class were as follows:
Years ended October 31, | 2014 | 2013 |
From net investment income | | |
Class A | $ 2,857 | $ 4,138 |
Class T | 344 | 492 |
Class B | 2 | 34 |
Class C | 79 | 186 |
International Discovery | 93,065 | 101,466 |
Class K | 33,983 | 34,651 |
Institutional Class | 5,936 | 5,064 |
Class Z | 60 | - |
Total | $ 136,326 | $ 146,031 |
From net realized gain | 2014 | 2013 |
Class A | $ 2,660 | $ 297 |
Class T | 423 | 46 |
Class B | 52 | 7 |
Class C | 295 | 30 |
International Discovery | 61,190 | 5,914 |
Class K | 20,093 | 1,827 |
Institutional Class | 3,838 | 292 |
Class Z | 35 | - |
Total | $ 88,586 | $ 8,413 |
11. Share Transactions.
Share transactions for each class were as follows and may contain automatic conversions between classes or exchanges between funds:
| Shares | Shares | Dollars | Dollars |
Years ended October 31, | 2014 | 2013 A | 2014 | 2013 A |
Class A | | | | |
Shares sold | 1,382 | 1,772 | $ 54,489 | $ 62,186 |
Reinvestment of distributions | 137 | 132 | 5,280 | 4,249 |
Shares redeemed | (2,632) | (2,553) | (104,067) | (88,988) |
Net increase (decrease) | (1,113) | (649) | $ (44,298) | $ (22,553) |
Class T | | | | |
Shares sold | 200 | 227 | $ 7,804 | $ 7,911 |
Reinvestment of distributions | 19 | 16 | 736 | 512 |
Shares redeemed | (311) | (347) | (12,118) | (11,997) |
Net increase (decrease) | (92) | (104) | $ (3,578) | $ (3,574) |
Class B | | | | |
Shares sold | 6 | 4 | $ 233 | $ 137 |
Reinvestment of distributions | 1 | 1 | 51 | 39 |
Shares redeemed | (58) | (75) | (2,266) | (2,570) |
Net increase (decrease) | (51) | (70) | $ (1,982) | $ (2,394) |
Annual Report
Notes to Financial Statements - continued
(Amounts in thousands except percentages)
11. Share Transactions - continued
| Shares | Shares | Dollars | Dollars |
Years ended October 31, | 2014 | 2013 A | 2014 | 2013 A |
Class C | | | | |
Shares sold | 232 | 184 | $ 9,059 | $ 6,532 |
Reinvestment of distributions | 9 | 6 | 337 | 193 |
Shares redeemed | (250) | (207) | (9,726) | (7,250) |
Net increase (decrease) | (9) | (17) | $ (330) | $ (525) |
International Discovery | | | | |
Shares sold | 28,809 | 37,338 | $ 1,144,588 | $ 1,332,523 |
Reinvestment of distributions | 3,813 | 3,176 | 148,138 | 102,608 |
Shares redeemed | (37,231) | (31,569) | (1,476,965) | (1,103,313) |
Net increase (decrease) | (4,609) | 8,945 | $ (184,239) | $ 331,818 |
Class K | | | | |
Shares sold | 15,775 | 19,989 | $ 628,261 | $ 699,723 |
Reinvestment of distributions | 1,396 | 1,132 | 54,076 | 36,478 |
Shares redeemed | (18,729) | (12,053) | (741,205) | (423,712) |
Net increase (decrease) | (1,558) | 9,068 | $ (58,868) | $ 312,489 |
Institutional Class | | | | |
Shares sold | 10,468 | 4,893 | $ 410,346 | $ 175,669 |
Reinvestment of distributions | 91 | 68 | 3,529 | 2,182 |
Shares redeemed | (5,852) | (2,219) | (225,868) | (78,500) |
Net increase (decrease) | 4,707 | 2,742 | $ 188,007 | $ 99,351 |
Class Z | | | | |
Shares sold | 993 | 3 | $ 39,070 | $ 100 |
Reinvestment of distributions | 2 | - | 95 | - |
Shares redeemed | (96) | - | (3,785) | - |
Net increase (decrease) | 899 | 3 | $ 35,380 | $ 100 |
A Share transactions for Class Z are for the period August 13, 2013 (commencement of sale of shares) to October 31, 2014.
12. Other.
The Fund's organizational documents provide former and current trustees and officers with a limited indemnification against liabilities arising in connection with the performance of their duties to the Fund. In the normal course of business, the Fund may also enter into contracts that provide general indemnifications. The Fund's maximum exposure under these arrangements is unknown as this would be dependent on future claims that may be made against the Fund. The risk of material loss from such claims is considered remote.
At the end of the period, Strategic Advisers International Fund was the owner of record of approximately 15% of the total outstanding shares of the Fund.
Annual Report
To the Trustees of Fidelity Investment Trust and the Shareholders of Fidelity International Discovery Fund:
In our opinion, the accompanying statement of assets and liabilities, including the schedule of investments, and the related statements of operations and of changes in net assets and the financial highlights present fairly, in all material respects, the financial position of Fidelity International Discovery Fund (a fund of Fidelity Investment Trust) at October 31, 2014, the results of its operations for the year then ended, the changes in its net assets for each of the two years in the period then ended and the financial highlights for each of the periods indicated, in conformity with accounting principles generally accepted in the United States of America. These financial statements and financial highlights (hereafter referred to as "financial statements") are the responsibility of the Fidelity International Discovery Fund's management. Our responsibility is to express an opinion on these financial statements based on our audits. We conducted our audits of these financial statements in accordance with the standards of the Public Company Accounting Oversight Board (United States). Those standards require that we plan and perform the audit to obtain reasonable assurance about whether the financial statements are free of material misstatement. An audit includes examining, on a test basis, evidence supporting the amounts and disclosures in the financial statements, assessing the accounting principles used and significant estimates made by management, and evaluating the overall financial statement presentation. We believe that our audits, which included confirmation of securities at October 31, 2014 by correspondence with the custodian and brokers, provide a reasonable basis for our opinion.
PricewaterhouseCoopers LLP
Boston, Massachusetts
December 19, 2014
Annual Report
The Trustees, Member of the Advisory Board, and officers of the trust and fund, as applicable, are listed below. The Board of Trustees governs the fund and is responsible for protecting the interests of shareholders. The Trustees are experienced executives who meet periodically throughout the year to oversee the fund's activities, review contractual arrangements with companies that provide services to the fund, oversee management of the risks associated with such activities and contractual arrangements, and review the fund's performance. Except for James C. Curvey, each of the Trustees oversees 174 funds. Mr. Curvey oversees 407 funds.
The Trustees hold office without limit in time except that (a) any Trustee may resign; (b) any Trustee may be removed by written instrument, signed by at least two-thirds of the number of Trustees prior to such removal; (c) any Trustee who requests to be retired or who has become incapacitated by illness or injury may be retired by written instrument signed by a majority of the other Trustees; and (d) any Trustee may be removed at any special meeting of shareholders by a two-thirds vote of the outstanding voting securities of the trust. Each Trustee who is not an interested person (as defined in the 1940 Act) of the trust and the fund (Independent Trustee), shall retire not later than the last day of the calendar year in which his or her 75th birthday occurs. The Independent Trustees may waive this mandatory retirement age policy with respect to individual Trustees. The officers and Advisory Board Member hold office without limit in time, except that any officer and Advisory Board Member may resign or may be removed by a vote of a majority of the Trustees at any regular meeting or any special meeting of the Trustees. Except as indicated, each individual has held the office shown or other offices in the same company for the past five years.
Experience, Skills, Attributes, and Qualifications of the Fund's Trustees. The Governance and Nominating Committee has adopted a statement of policy that describes the experience, qualifications, attributes, and skills that are necessary and desirable for potential Independent Trustee candidates (Statement of Policy). The Board believes that each Trustee satisfied at the time he or she was initially elected or appointed a Trustee, and continues to satisfy, the standards contemplated by the Statement of Policy. The Governance and Nominating Committee also engages professional search firms to help identify potential Independent Trustee candidates who have the experience, qualifications, attributes, and skills consistent with the Statement of Policy. From time to time, additional criteria based on the composition and skills of the current Independent Trustees, as well as experience or skills that may be appropriate in light of future changes to board composition, business conditions, and regulatory or other developments, have also been considered by the professional search firms and the Governance and Nominating Committee. In addition, the Board takes into account the Trustees' commitment and participation in Board and committee meetings, as well as their leadership of standing and ad hoc committees throughout their tenure.
In determining that a particular Trustee was and continues to be qualified to serve as a Trustee, the Board has considered a variety of criteria, none of which, in isolation, was controlling. The Board believes that, collectively, the Trustees have balanced and diverse experience, qualifications, attributes, and skills, which allow the Board to operate effectively in governing the fund and protecting the interests of shareholders. Information about the specific experience, skills, attributes, and qualifications of each Trustee, which in each case led to the Board's conclusion that the Trustee should serve (or continue to serve) as a trustee of the fund, is provided below.
Annual Report
Trustees and Officers - continued
Board Structure and Oversight Function. James C. Curvey is an interested person (as defined in the 1940 Act) and currently serves as Chairman. The Trustees have determined that an interested Chairman is appropriate and benefits shareholders because an interested Chairman has a personal and professional stake in the quality and continuity of services provided to the fund. Independent Trustees exercise their informed business judgment to appoint an individual of their choosing to serve as Chairman, regardless of whether the Trustee happens to be independent or a member of management. The Independent Trustees have determined that they can act independently and effectively without having an Independent Trustee serve as Chairman and that a key structural component for assuring that they are in a position to do so is for the Independent Trustees to constitute a substantial majority for the Board. The Independent Trustees also regularly meet in executive session. Ned C. Lautenbach serves as Chairman of the Independent Trustees and as such (i) acts as a liaison between the Independent Trustees and management with respect to matters important to the Independent Trustees and (ii) with management prepares agendas for Board meetings.
Fidelity funds are overseen by different Boards of Trustees. The fund's Board oversees Fidelity's equity and high income funds and another Board oversees Fidelity's investment-grade bond, money market, and asset allocation funds. The asset allocation funds may invest in Fidelity funds overseen by the fund's Board. The use of separate Boards, each with its own committee structure, allows the Trustees of each group of Fidelity funds to focus on the unique issues of the funds they oversee, including common research, investment, and operational issues. On occasion, the separate Boards establish joint committees to address issues of overlapping consequences for the Fidelity funds overseen by each Board.
The Trustees operate using a system of committees to facilitate the timely and efficient consideration of all matters of importance to the Trustees, the fund, and fund shareholders and to facilitate compliance with legal and regulatory requirements and oversight of the fund's activities and associated risks. The Board, acting through its committees, has charged FMR and its affiliates with (i) identifying events or circumstances the occurrence of which could have demonstrably adverse effects on the fund's business and/or reputation; (ii) implementing processes and controls to lessen the possibility that such events or circumstances occur or to mitigate the effects of such events or circumstances if they do occur; and (iii) creating and maintaining a system designed to evaluate continuously business and market conditions in order to facilitate the identification and implementation processes described in (i) and (ii) above. Because the day-to-day operations and activities of the fund are carried out by or through FMR, its affiliates and other service providers, the fund's exposure to risks is mitigated but not eliminated by the processes overseen by the Trustees. While each of the Board's committees has responsibility for overseeing different aspects of the fund's activities, oversight is exercised primarily through the Operations, Audit, and Compliance Committees. In addition, the Independent Trustees have worked with FMR to enhance the Board's oversight of investment and financial risks, legal and regulatory risks, technology risks, and operational risks, including the development of additional risk reporting to the Board. For example, a working group comprised of Independent Trustees and FMR has worked and continues to work to review the Fidelity funds' valuation-related activities, reporting and risk management. Appropriate personnel, including but not limited to the fund's Chief Compliance Officer (CCO), FMR's internal auditor, the independent accountants, the fund's Treasurer and portfolio management personnel, make periodic reports to the Board's committees, as appropriate, including an annual review of FMR's risk management program for the Fidelity funds. The responsibilities of each standing committee, including their oversight responsibilities, are described further under "Standing Committees of the Fund's Trustees."
Annual Report
The fund's Statement of Additional Information (SAI) includes more information about the Trustees. To request a free copy, call Fidelity at 1-800-835-5092.
Interested Trustees*:
Correspondence intended for each Trustee who is an interested person may be sent to Fidelity Investments, 245 Summer Street, Boston, Massachusetts 02210.
Name, Year of Birth; Principal Occupations and Other Relevant Experience+ |
James C. Curvey (1935) |
Year of Election or Appointment: 2007 Trustee Chairman of the Board of Trustees |
| Mr. Curvey also serves as Trustee of other Fidelity funds. Mr. Curvey is a Director of Fidelity Research & Analysis Co. (2009-present), and Vice Chairman (2007-present) and Director of FMR LLC. In addition, Mr. Curvey serves as an Overseer for the Boston Symphony Orchestra and a member of the board of Artis-Naples, Naples, Florida, and as a Trustee for Brewster Academy, Wolfeboro, New Hampshire. Previously, Mr. Curvey served as a Director of Fidelity Investments Money Management, Inc. (2009-2014), a Director of FMR (2007-2014), and a Director of FMR Co., Inc. (2007-2014). |
Charles S. Morrison (1960) |
Year of Election or Appointment: 2014 Trustee |
| Mr. Morrison also serves as Trustee of other funds. He serves as a Director of Fidelity Investments Money Management, Inc. (FIMM) (2014-present), Director of Fidelity SelectCo, LLC (2014-present), President, Asset Management (2014-present) and is an employee of Fidelity Investments. Previously, Mr. Morrison served as Vice President of Fidelity's Fixed Income and Asset Allocation Funds (2012-2014), President, Fixed Income (2011-2014), Vice President of Fidelity's Money Market Funds (2005-2009), President, Money Market Group Leader of FMR (2009), and Senior Vice President, Money Market Group of FMR (2004-2009). Mr. Morrison also served as Vice President of Fidelity's Bond Funds (2002-2005), certain Balanced Funds (2002-2005), and certain Asset Allocation Funds (2002-2007), and as Senior Vice President (2002-2005) of Fidelity's Bond Division. |
* Trustees have been determined to be "Interested Trustees" by virtue of, among other things, their affiliation with the trust or various entities under common control with FMR.
+ The information above includes each Trustee's principal occupation during the last five years and other information relating to the experience, attributes, and skills relevant to each Trustee's qualifications to serve as a Trustee, which led to the conclusion that each Trustee should serve as a Trustee for the fund.
Annual Report
Independent Trustees:
Correspondence intended for each Independent Trustee (that is, the Trustees other than the Interested Trustees) may be sent to Fidelity Investments, P.O. Box 55235, Boston, Massachusetts 02205-5235.
Name, Year of Birth; Principal Occupations and Other Relevant Experience+ |
Dennis J. Dirks (1948) |
Year of Election or Appointment: 2005 Trustee |
| Mr. Dirks also serves as Trustee of other Fidelity funds. Prior to his retirement in May 2003, Mr. Dirks was Chief Operating Officer and a member of the Board of The Depository Trust & Clearing Corporation (DTCC). He also served as President, Chief Operating Officer, and Board member of The Depository Trust Company (DTC) and President and Board member of the National Securities Clearing Corporation (NSCC). In addition, Mr. Dirks served as Chief Executive Officer and Board member of the Government Securities Clearing Corporation, Chief Executive Officer and Board member of the Mortgage-Backed Securities Clearing Corporation, as a Trustee and a member of the Finance Committee of Manhattan College (2005-2008), and as a Trustee and a member of the Finance Committee of AHRC of Nassau County (2006-2008). Mr. Dirks is a member of the Independent Directors Council (IDC) Governing Council (2010-present) and Board of Directors for The Brookville Center for Children's Services, Inc. (2009-present). |
Alan J. Lacy (1953) |
Year of Election or Appointment: 2008 Trustee |
| Mr. Lacy also serves as Trustee of other Fidelity funds. Mr. Lacy serves as Senior Adviser (2007-present) of Oak Hill Capital Partners, L.P. (private equity). Mr. Lacy also served as Chief Executive Officer (2000-2005) and Vice Chairman (2005-2006) of Sears Holdings Corporation and Sears, Roebuck and Co. (retail). In addition, Mr. Lacy serves as a member of the Board of Directors of Dave & Buster's Entertainment, Inc. (restaurant and entertainment complexes, 2010-present), Earth Fare, Inc. (retail grocery, 2012-present), The Hillman Companies, Inc. (hardware wholesalers, 2010-present), and Bristol-Myers Squibb Company (global pharmaceuticals, 2008-present). Mr. Lacy is a member of the Board of Trustees of The National Parks Conservation Association (2006-present). Previously, Mr. Lacy served as Chairman of the Board of Trustees of the National Parks Conservation Association (2008-2011) and as a member of the Board of Directors for the Western Union Company (global money transfer, 2006-2011). |
Ned C. Lautenbach (1944) |
Year of Election or Appointment: 2000 Trustee Chairman of the Independent Trustees |
| Mr. Lautenbach also serves as Trustee of other Fidelity funds. Mr. Lautenbach currently serves as the Lead Director of the Eaton Corporation Board of Directors (diversified industrial, 1997-present). Mr. Lautenbach is Chairman of the Board of Directors of the Philharmonic Center for the Arts in Naples, Florida (2012-present) and a member of the Council on Foreign Relations (1994-present). Previously, Mr. Lautenbach was a Partner/Advisory Partner at Clayton, Dubilier & Rice, LLC (private equity investment, 1998-2010), as well as a Director of Sony Corporation (2006-2007). |
Joseph Mauriello (1944) |
Year of Election or Appointment: 2008 Trustee |
| Mr. Mauriello also serves as Trustee of other Fidelity funds. Prior to his retirement in January 2006, Mr. Mauriello served in numerous senior management positions including Deputy Chairman and Chief Operating Officer (2004-2005), and Vice Chairman of Financial Services (2002-2004) of KPMG LLP US (professional services, 1965-2005). Mr. Mauriello currently serves as a member of the Board of Directors of XL Group plc. (global insurance and re-insurance, 2006-present). Previously, Mr. Mauriello served as a Director of the Hamilton Funds of the Bank of New York (2006-2007) and of Arcadia Resources Inc. (health care services and products, 2007-2012). |
Robert W. Selander (1950) |
Year of Election or Appointment: 2011 Trustee |
| Mr. Selander also serves as Trustee of other Fidelity funds. Previously, Mr. Selander served as a Member of the Advisory Board of other Fidelity funds (2011), and Executive Vice Chairman (2010), Chief Executive Officer (2009-2010), and President and Chief Executive Officer (1997-2009) of Mastercard, Inc. |
Cornelia M. Small (1944) |
Year of Election or Appointment: 2005 Trustee |
| Ms. Small also serves as Trustee of other Fidelity funds. Ms. Small is a member of the Board of Directors (2009-present) and Chair of the Investment Committee (2010-present) of the Teagle Foundation. Ms. Small also serves on the Investment Committee of the Berkshire Taconic Community Foundation (2008-present). Previously, Ms. Small served as Chairperson (2002-2008) and a member of the Investment Committee and Chairperson (2008-2012) and a member of the Board of Trustees of Smith College. In addition, Ms. Small served as Chief Investment Officer, Director of Global Equity Investments, and a member of the Board of Directors of Scudder, Stevens & Clark and Scudder Kemper Investments. |
William S. Stavropoulos (1939) |
Year of Election or Appointment: 2001 Trustee Vice Chairman of the Independent Trustees |
| Mr. Stavropoulos also serves as Trustee of other Fidelity funds. Mr. Stavropoulos serves as President and Founder of the Michigan Baseball Foundation, the Great Lakes Loons (2007-present). Mr. Stavropoulos is Chairman Emeritus of the Board of Directors of The Dow Chemical Company, where he previously served in numerous senior management positions, including President, CEO (1995-2000; 2002-2004), Chairman of the Executive Committee (2000-2006), and as a member of the Board of Directors (1990-2006). Currently, Mr. Stavropoulos is Chairman of the Board of Directors of Univar Inc. (global distributor of commodity and specialty chemicals), a Director of Teradata Corporation (data warehousing and technology solutions), and Maersk Inc. (industrial conglomerate), and a member of the Advisory Board for Metalmark Capital LLC (private equity investment, 2005-present). Mr. Stavropoulos is an operating advisor to Clayton, Dubilier & Rice, LLC (private equity investment). In addition, Mr. Stavropoulos is a member of the University of Notre Dame Advisory Council for the College of Science, a Trustee of the Rollin L. Gerstacker Foundation, and a Director of the Naples Philharmonic Center for the Arts. Previously, Mr. Stavropoulos served as a Director of Chemical Financial Corporation (bank holding company, 1993-2012) and Tyco International, Ltd. (multinational manufacturing and services, 2007-2012). |
David M. Thomas (1949) |
Year of Election or Appointment: 2008 Trustee |
| Mr. Thomas also serves as Trustee of other Fidelity funds. Mr. Thomas serves as Non-Executive Chairman of the Board of Directors of Fortune Brands Home and Security (home and security products, 2011-present), and as a member of the Board of Directors of Interpublic Group of Companies, Inc. (marketing communication, 2004-present). Previously, Mr. Thomas served as Executive Chairman (2005-2006) and Chairman and Chief Executive Officer (2000-2005) of IMS Health, Inc. (pharmaceutical and healthcare information solutions), and a Director of Fortune Brands, Inc. (consumer products, 2000-2011). |
+ The information above includes each Trustee's principal occupation during the last five years and other information relating to the experience, attributes, and skills relevant to each Trustee's qualifications to serve as a Trustee, which led to the conclusion that each Trustee should serve as a Trustee for the fund.
Advisory Board Member and Officers:
Correspondence intended for each officer and Peter S. Lynch may be sent to Fidelity Investments, 245 Summer Street, Boston, Massachusetts 02210. Officers appear below in alphabetical order.
Name, Year of Birth; Principal Occupation |
Peter S. Lynch (1944) |
Year of Election or Appointment: 2003 Member of the Advisory Board |
| Mr. Lynch also serves as Member of the Advisory Board of other Fidelity funds. Mr. Lynch is Vice Chairman and a Director of FMR and FMR Co., Inc. In addition, Mr. Lynch serves as a Trustee of Boston College and as the Chairman of the Inner-City Scholarship Fund. Previously, Mr. Lynch served on the Special Olympics International Board of Directors (1997-2006). |
Elizabeth Paige Baumann (1968) |
Year of Election or Appointment: 2012 Anti-Money Laundering (AML) Officer |
| Ms. Baumann also serves as AML Officer of other funds. She is Chief AML Officer of FMR LLC (2012-present) and is an employee of Fidelity Investments. Previously, Ms. Baumann served as Vice President and Deputy Anti-Money Laundering Officer (2007-2012). |
William C. Coffey (1969) |
Year of Election or Appointment: 2009 Assistant Secretary |
| Mr. Coffey also serves as Assistant Secretary of other funds. He is Senior Vice President and Deputy General Counsel of FMR LLC (2010-present), and is an employee of Fidelity Investments. Previously, Mr. Coffey served as Vice President and Associate General Counsel of FMR LLC (2005-2009). |
Timothy M. Cohen (1969) |
Year of Election or Appointment: 2014 Vice President of certain Equity Funds |
| Mr. Cohen also serves as Vice President of other funds. Mr. Cohen serves as a Director and Chief Compliance Officer of Fidelity Management & Research (U.K.) Inc. (2013-present) and is an employee of Fidelity Investments. |
Jonathan Davis (1968) |
Year of Election or Appointment: 2010 Assistant Treasurer |
| Mr. Davis also serves as Assistant Treasurer of other funds. Mr. Davis is an employee of Fidelity Investments. Previously, Mr. Davis served as Vice President and Associate General Counsel of FMR LLC (2003-2010). |
Adrien E. Deberghes (1967) |
Year of Election or Appointment: 2008 Deputy Treasurer |
| Mr. Deberghes also serves as an officer of other funds. He is an employee of Fidelity Investments (2008-present). Prior to joining Fidelity Investments, Mr. Deberghes was Senior Vice President of Mutual Fund Administration at State Street Corporation (2007-2008), Senior Director of Mutual Fund Administration at Investors Bank & Trust (2005-2007), and Director of Finance for Dunkin' Brands (2000-2005). |
Stephanie J. Dorsey (1969) |
Year of Election or Appointment: 2010 Assistant Treasurer |
| Ms. Dorsey also serves as an officer of other funds. She is an employee of Fidelity Investments (2008-present) and has served in other fund officer roles. Prior to joining Fidelity Investments, Ms. Dorsey served as Treasurer (2004-2008) of the JPMorgan Mutual Funds and Vice President (2004-2008) of JPMorgan Chase Bank. |
Howard J. Galligan III (1966) |
Year of Election or Appointment: 2014 Chief Financial Officer |
| Mr. Galligan also serves as Chief Financial Officer of other funds. Mr. Galligan serves as President of Fidelity Pricing and Cash Management Services (FPCMS) (2014-present) and as a Director of Strategic Advisers, Inc. (2008-present). Previously, Mr. Galligan served as Chief Administrative Officer of Asset Management (2011-2014) and Chief Operating Officer and Senior Vice President of Investment Support for Strategic Advisers, Inc. (2003-2011). |
Scott C. Goebel (1968) |
Year of Election or Appointment: 2008 Secretary and Chief Legal Officer (CLO) |
| Mr. Goebel serves as Secretary and CLO of other funds. Mr. Goebel also serves as Secretary of Fidelity SelectCo, LLC (2013-present), Fidelity Investments Money Management, Inc. (FIMM) (2010-present) and Fidelity Research and Analysis Company (FRAC) (2010-present); General Counsel, Secretary, and Senior Vice President of FMR (2008-present) and FMR Co., Inc. (2008-present); Chief Legal Officer of Fidelity Management & Research (Hong Kong) Limited (2008-present); and Assistant Secretary of Fidelity Management & Research (Japan) Limited (2008-present) and Fidelity Management & Research (U.K.) Inc. (2008-present). Previously, Mr. Goebel served as Secretary and CLO of other Fidelity funds (2008-2013), Assistant Secretary of FIMM (2008-2010), FRAC (2008-2010), and certain funds (2007-2008); and as Vice President and Secretary of Fidelity Distributors Corporation (FDC) (2005-2007). Mr. Goebel has been employed by FMR LLC or an affiliate since 2001. |
Brian B. Hogan (1964) |
Year of Election or Appointment: 2009 Vice President |
| Mr. Hogan also serves as Trustee or Vice President of other funds. Mr. Hogan serves as a Director of Fidelity SelectCo, LLC (2014-present) and President of FMR's Equity Division (2009-present). Previously, Mr. Hogan served as Senior Vice President, Equity Research of FMR (2006-2009) and as a portfolio manager. |
Chris Maher (1972) |
Year of Election or Appointment: 2013 Assistant Treasurer |
| Mr. Maher serves as Assistant Treasurer of other funds. Mr. Maher is Vice President of Valuation Oversight and is an employee of Fidelity Investments. Previously, Mr. Maher served as Vice President of Asset Management Compliance (2013), Vice President of FMR's Program Management Group (2010-2013), and Vice President of Valuation Oversight (2008-2010). |
Kenneth B. Robins (1969) |
Year of Election or Appointment: 2008 President and Treasurer |
| Mr. Robins also serves as an officer of other funds. Mr. Robins serves as Executive Vice President of Fidelity Investments Money Management, Inc. (FIMM) (2013-present) and is an employee of Fidelity Investments (2004-present). Previously, Mr. Robins served in other fund officer roles. |
Stephen Sadoski (1971) |
Year of Election or Appointment: 2012 Deputy Treasurer |
| Mr. Sadoski also serves as Deputy Treasurer of other funds. He is an employee of Fidelity Investments (2012-present) and has served in another fund officer role. Prior to joining Fidelity Investments, Mr. Sadoski served as an assistant chief accountant in the Division of Investment Management of the Securities and Exchange Commission (SEC) (2009-2012) and as a senior manager at Deloitte & Touche LLP (1997-2009). |
Stacie M. Smith (1974) |
Year of Election or Appointment: 2013 Deputy Treasurer |
| Ms. Smith also serves as an officer of other funds. She is an employee of Fidelity Investments (2009-present) and has served in other fund officer roles. Prior to joining Fidelity Investments, Ms. Smith served as Senior Audit Manager of Ernst & Young LLP (1996-2009). |
Renee Stagnone (1975) |
Year of Election or Appointment: 2013 Deputy Treasurer |
| Ms. Stagnone also serves as Deputy Treasurer of other funds. Ms. Stagnone is an employee of Fidelity Investments. |
Linda J. Wondrack (1964) |
Year of Election or Appointment: 2014 Chief Compliance Officer |
| Ms. Wondrack also serves as Chief Compliance Officer of other funds. Ms. Wondrack is Executive Vice President and head of the Ethics Office and Asset Management Compliance for Fidelity Investments (2012-present). Ms. Wondrack also serves as Chief Compliance Officer of Fidelity SelectCo, LLC (2014-present); Chief Compliance Officer of Impresa Management LLC (2013-present); and Chief Compliance Officer of FMR Co., Inc., Fidelity Investments Money Management, Inc., Fidelity Management & Research (Japan) Limited, Fidelity Management & Research (U.K.) Inc., Fidelity Management & Research (Hong Kong), Fidelity Management & Research Company, Pyramis Global Advisors, LLC, and Strategic Advisers, Inc., Ballyrock Investment Advisors LLC, and Northern Neck Investors LLC (2012-present). Previously, Ms. Wondrack served as Senior Vice President and Chief Compliance Officer for Columbia Management Investment Advisers, LLC (2005-2012); Chief Compliance Officer for certain funds within the Columbia Family of Funds (2007-2012); and Senior Vice President of Compliance Risk Management at Bank of America (2005-2010). |
Joseph F. Zambello (1957) |
Year of Election or Appointment: 2011 Deputy Treasurer |
| Mr. Zambello also serves as Deputy Treasurer of other funds. Mr. Zambello is an employee of Fidelity Investments. Previously, Mr. Zambello served as Vice President of FMR's Program Management Group (2009-2011) and Vice President of the Transfer Agent Oversight Group (2005-2009). |
Annual Report
Class K, designates 1% of the dividends distributed during the fiscal year as qualifying for the dividends-received deduction for corporate shareholders.
Class K designates 64% of dividends distributed during the fiscal year as amounts which may be taken into account as a dividend for purposes of the maximum rate under section 1(h)(11) of the Internal Revenue Code.
The amounts per share which represent income derived from sources within, and taxes paid to, foreign countries or possessions of the United States are as follows:
| Pay Date | Income | Taxes |
Class K | 12/09/13 | $0.4421 | $0.0365 |
The fund will notify shareholders in January 2015 of amounts for use in preparing 2014 income tax returns.
Annual Report
Board Approval of Investment Advisory Contracts and Management Fees
Fidelity International Discovery Fund
Each year, the Board of Trustees, including the Independent Trustees (together, the Board), votes on the renewal of the management contract with Fidelity Management & Research Company (FMR) and the sub-advisory agreements (together, the Advisory Contracts) for the fund. The Board, assisted by the advice of fund counsel and Independent Trustees' counsel, requests and considers a broad range of information relevant to the renewal of the Advisory Contracts throughout the year.
The Board meets regularly and, at each of its meetings, covers an extensive agenda of topics and materials and considers factors that are relevant to its annual consideration of the renewal of the fund's Advisory Contracts, including the services and support provided to the fund and its shareholders. The Board has established various standing committees (Committees), each composed of and chaired by Independent Trustees with varying backgrounds, to which the Board has assigned specific subject matter responsibilities in order to enhance effective decision-making by the Board. The Board, acting directly and through its Committees, requests and receives information concerning the annual consideration of the renewal of the fund's Advisory Contracts. The Board also meets as needed to consider matters specifically related to the Board's annual consideration of the renewal of the Advisory Contracts. Members of the Board may also meet with trustees of other Fidelity funds through ad hoc joint committees to discuss certain matters relevant to the Fidelity funds.
At its July 2014 meeting, the Board, including the Independent Trustees, unanimously determined to renew the fund's Advisory Contracts. In reaching its determination, the Board considered all factors it believed relevant, including (i) the nature, extent, and quality of the services to be provided to the fund and its shareholders (including the investment performance of the fund); (ii) the competitiveness of the fund's management fee and total expense ratio relative to peer funds; (iii) the total costs of the services to be provided by and the profits to be realized by Fidelity from its relationship with the fund; (iv) the extent to which economies of scale exist and would be realized as the fund grows; and (v) whether fee levels reflect these economies of scale, if any, for the benefit of fund shareholders. In connection with separate internal corporate reorganizations involving Fidelity Management & Research (U.K.) Inc. (FMR U.K.) and Fidelity Management & Research (Japan) Inc. (FMR Japan), the Board approved certain non-material amendments to the fund's sub-advisory agreements with FMR U.K. and FMR Japan to reflect that, after these reorganizations, FMR Investment Management (UK) Limited and Fidelity Management & Research (Japan) Limited will carry on the business of FMR U.K. and FMR Japan, respectively. The Board noted that no changes to the portfolio managers or to the foreign research or investment advisory services provided to the fund were expected in connection with either reorganization and that the same personnel and resources would continue to be available to the fund at the new entities.
Annual Report
In considering whether to renew the Advisory Contracts for the fund, the Board reached a determination, with the assistance of fund counsel and Independent Trustees' counsel and through the exercise of its business judgment, that the renewal of the Advisory Contracts was in the best interests of the fund and its shareholders and that the compensation payable under the Advisory Contracts was fair and reasonable. The Board's decision to renew the Advisory Contracts was not based on any single factor, but rather was based on a comprehensive consideration of all the information provided to the Board at its meetings throughout the year. The Board, in reaching its determination to renew the Advisory Contracts, was aware that shareholders of the fund have a broad range of investment choices available to them, including a wide choice among funds offered by Fidelity's competitors, and that the fund's shareholders, who have the opportunity to review and weigh the disclosure provided by the fund in its prospectus and other public disclosures, have chosen to invest in this fund, which is part of the Fidelity family of funds.
Nature, Extent, and Quality of Services Provided. The Board considered Fidelity's staffing as it relates to the fund, including the backgrounds of investment personnel of FMR and the sub-advisers (together, the Investment Advisers), and also considered the fund's investment objective, strategies, and related investment philosophy. The Independent Trustees also had discussions with senior management of Fidelity's investment operations and investment groups. The Board considered the structure of the portfolio manager compensation program and whether this structure provides appropriate incentives to act in the best interests of the fund. Additionally, the Board considered the portfolio managers' investments, if any, in the funds that they manage.
Resources Dedicated to Investment Management and Support Services. The Board and the Fund Oversight and Research Committees reviewed the general qualifications and capabilities of Fidelity's investment staff, including its size, education, experience, and resources, as well as Fidelity's approach to recruiting, training, managing, and compensating investment personnel. The Board noted that Fidelity has continued to increase the resources devoted to non-U.S. offices, including expansion of Fidelity's global investment organization. The Board also noted that Fidelity's analysts have extensive resources, tools and capabilities that allow them to conduct sophisticated quantitative and fundamental analysis, as well as credit analysis of issuers, counterparties and guarantors. Further, the Board believes that Fidelity's investment professionals have sufficient access to global information and data so as to provide competitive investment results over time, and that those professionals also have access to sophisticated tools that permit them to assess portfolio construction and risk and performance attribution characteristics continuously, as well as to transmit new information and research conclusions rapidly around the world. Additionally, in its deliberations, the Board considered Fidelity's trading and risk management capabilities and resources and global compliance infrastructure, which are an integral part of the investment management process.
Annual Report
Board Approval of Investment Advisory Contracts and
Management Fees - continued
Shareholder and Administrative Services. The Board considered (i) the nature, extent, quality, and cost of advisory, administrative, and shareholder services performed by the Investment Advisers and their affiliates under the Advisory Contracts and under separate agreements covering transfer agency, pricing and bookkeeping, and securities lending services for the fund; (ii) the nature and extent of the supervision of third party service providers, principally custodians and subcustodians; and (iii) the resources devoted to, and the record of compliance with, the fund's compliance policies and procedures. The Board also reviewed the allocation of fund brokerage, including allocations to brokers affiliated with the Investment Advisers, the use of brokerage commissions to pay fund expenses, and the use of "soft" commission dollars to pay for research services.
The Board noted that the growth of fund assets over time across the complex allows Fidelity to reinvest in the development of services designed to enhance the value or convenience of the Fidelity funds as investment vehicles. These services include 24-hour access to account information and market information through telephone representatives and over the Internet, investor education materials and asset allocation tools, and the expanded availability of Fidelity Investor Centers.
In 2014, the Board formed an ad hoc Committee on Transfer Agency Fees to review the variety of transfer agency fee structures throughout the industry and Fidelity's competitive positioning with respect to industry participants.
Investment in a Large Fund Family. The Board considered the benefits to shareholders of investing in a Fidelity fund, including the benefits of investing in a fund that is part of a large family of funds offering a variety of investment disciplines and providing a large variety of mutual fund investor services. The Board noted that Fidelity had taken, or had made recommendations that resulted in the Fidelity funds taking, a number of actions over the previous year that benefited particular funds, including (i) continuing to dedicate additional resources to investment research and to the support of the senior management team that oversees asset management; (ii) persisting in efforts to enhance Fidelity's global research capabilities; (iii) launching new funds and making other enhancements to meet client needs for income-oriented solutions; (iv) reducing fund expenses for certain index funds; (v) continuing to launch dedicated lower cost underlying funds to meet portfolio construction needs related to expanding underlying fund options for Fidelity funds of funds, specifically for the Freedom Fund product lines; (vi) rationalizing product lines and gaining increased efficiencies through fund mergers; (vii) launching sector-based exchange-traded funds and establishing a new Fidelity adviser to manage sector-based funds and products; (viii) continuing to develop and implement technology to improve security and increase efficiency; (ix) modifying the eligibility criteria for certain share classes to increase their marketability to a portion of the defined contribution plan market; (x) waiving redemption fees for certain qualified fund-of-fund and wrap programs and certain retirement plan transactions; and (xi) launching new Institutional Class shares of certain money market funds to attract and retain assets and to fill a gap in the money market fund lineup.
Annual Report
Investment Performance. The Board considered whether the fund has operated in accordance with its investment objective, as well as its record of compliance with its investment restrictions and its performance history.
The Board took into account discussions with the Investment Advisers about fund investment performance that occur at Board meetings throughout the year. In this regard the Board noted that as part of regularly scheduled fund reviews and other reports to the Board on fund performance, the Board periodically considers annualized return information for the fund, for different time periods, measured against a securities market index ("benchmark index") and a peer group of funds with similar objectives ("peer group"). In its evaluation of fund investment performance, the Board gave particular attention to information indicating changes in performance of certain Fidelity funds for specific time periods and the Investment Advisers' explanations for any overperformance or underperformance.
In addition to reviewing absolute and relative fund performance, the Independent Trustees periodically consider the appropriateness of fund performance metrics in evaluating the results achieved. In general, the Independent Trustees believe that fund performance should be evaluated based on net performance (after fees and expenses) of both the highest performing and lowest performing classes, where applicable, compared to appropriate benchmark indices, over appropriate time periods which may include full market cycles, and compared to peer groups, as applicable, over the same periods, taking into account relevant factors including the following: general market conditions; issuer-specific information; tactical opportunities for investment; and fund cash flows and other factors.
The Independent Trustees recognize that shareholders evaluate performance on a net basis over their own holding periods, for which one-, three-, and five-year periods are often used as a proxy. For this reason, the performance information reviewed by the Board also included net cumulative calendar year total return information for the fund and an appropriate benchmark index and peer group for the most recent one-, three-, and five-year periods, as shown below. Returns are shown compared to the 25th percentile (top of box, 75% beaten) and 75th percentile (bottom of box, 25% beaten) of the peer universe. Returns of the benchmark index are "net MA," i.e., adjusted for tax withholding rates applicable to U.S.-based funds organized as Massachusetts business trusts.
Annual Report
Board Approval of Investment Advisory Contracts and
Management Fees - continued
Fidelity International Discovery Fund

The Board also considered that the fund's management fee is subject to upward or downward adjustment depending upon whether, and to what extent, the fund's investment performance for the performance period exceeds, or is exceeded by, a securities index, thus leading to a performance adjustment for the same period. The Board noted that the performance adjustment provides FMR with a strong economic incentive to seek to achieve superior performance for the fund's shareholders and helps to more closely align the interests of FMR and the fund's shareholders.
Based on its review, the Board concluded that the nature, extent, and quality of services provided to the fund under the Advisory Contracts should benefit the fund's shareholders.
Competitiveness of Management Fee and Total Expense Ratio. The Board considered the fund's management fee and total expense ratio compared to "mapped groups" of competitive funds and classes. Fidelity creates "mapped groups" by combining similar Lipper investment objective categories that have comparable investment mandates. Combining Lipper investment objective categories aids the Board's management fee and total expense ratio comparisons by broadening the competitive group used for comparison and by reducing the number of universes to which various Fidelity funds are compared.
Management Fee. The Board considered two proprietary management fee comparisons for the 12-month periods shown in the chart below. The group of Lipper funds used by the Board for management fee comparisons is referred to below as the "Total Mapped Group." The Total Mapped Group comparison focuses on a fund's standing in terms of gross management fees before expense reimbursements or caps, and without giving effect to the fund's performance adjustment, relative to the total universe of funds with comparable investment mandates, regardless of whether their management fee structures also are comparable. Funds with comparable investment mandates offer exposure to similar types of securities. Funds with comparable management fee structures have similar management fee contractual arrangements (e.g., flat rate charged for advisory services, all-inclusive fee rate, etc.). "TMG %" represents the percentage of funds in the Total Mapped Group that had management fees that were lower than the fund's. For example, a hypothetical TMG % of 20% would mean that 80% of the funds in the Total Mapped Group had higher, and 20% had lower, management fees than the fund. The fund's actual TMG %s are in the chart below. The "Asset-Size Peer Group" (ASPG) comparison focuses on a fund's standing relative to a subset of non-Fidelity funds within the Total Mapped Group that are similar in size and management fee structure. For example, if a fund is in the first quartile of the ASPG, the fund's management fee ranks in the least expensive or lowest 25% of funds in the ASPG. The ASPG represents at least 15% of the funds in the Total Mapped Group with comparable asset size and management fee structures, subject to a minimum of 50 funds (or all funds in the Total Mapped Group if fewer than 50). Additional information, such as the ASPG quartile in which the fund's management fee rate ranked and the impact of the fund's performance adjustment, is also included in the chart and considered by the Board.
Annual Report
Fidelity International Discovery Fund

The Board noted that the fund's management fee rate ranked below the median of its Total Mapped Group and below the median of its ASPG for 2013. The Board also noted the effect of the fund's positive performance adjustment on the fund's management fee ranking.
Annual Report
Board Approval of Investment Advisory Contracts and
Management Fees - continued
Furthermore, the Board considered that, on July 16, 2014, after the periods shown in the chart above, it had approved a reduction (effective August 1, 2014) in the individual fund fee rate component of the management fee rate for the fund from 0.450% to 0.424%.
The Board also noted that, in August 2013, the ad hoc Committee on Management Fees was formed to conduct an in-depth review of the management fee rates of Fidelity's active equity mutual funds. The Committee focused on the following areas: (i) standard fee structures; (ii) research consumption and trading evolution; (iii) management fee competitiveness/profitability by category; and (iv) factors that drive institutional pricing.
Based on its review, the Board concluded that the fund's management fee is fair and reasonable in light of the services that the fund receives and the other factors considered.
Total Expense Ratio. In its review of each class's total expense ratio, the Board considered the fund's management fee as well as other fund or class expenses, as applicable, such as transfer agent fees, pricing and bookkeeping fees, fund-paid 12b-1 fees, and custodial, legal, and audit fees. The Board also noted the effects of any waivers and reimbursements on fees and expenses, as well as the impact of the fund's performance adjustment. As part of its review, the Board also considered the current and historical total expense ratios of each class of the fund compared to competitive fund median expenses. Each class of the fund is compared to those funds and classes in the Total Mapped Group (used by the Board for management fee comparisons) that have a similar sales load structure.
The Board noted that the total expense ratio of each of Class A, Class B, Class C, Institutional Class, Class Z, the retail class, and Class K ranked below its competitive median for 2013 and the total expense ratio of Class T ranked above its competitive median for 2013. The Board considered that, in general, various factors can affect total expense ratios. The Board noted that the total expense ratio of Class T was above the competitive median primarily because of higher 12b-1 fees on Class T as compared to most competitor funds. Class T has a higher 12b-1 fee, but a lower front-end sales charge, than traditionally priced front-end sales charge classes. The Board considered that Class T is primarily sold load-waived in the retirement plan market where its 0.50% 12b-1 fee is comparable to competing no-load, higher 12b-1 fee classes designed specifically for retirement plans. The Board noted that the fund offers multiple classes, each of which has a different sales load and 12b-1 fee structure, and that the multiple structures are intended to offer a range of pricing options for the intermediary market. The Board also noted that the total expense ratios of the classes vary primarily by the level of their 12b-1 fees, although differences in transfer agent fees may also cause expenses to vary from class to class.
Annual Report
Fees Charged to Other Fidelity Clients. The Board also considered Fidelity fee structures and other information with respect to clients of Fidelity, such as other funds advised or subadvised by Fidelity, pension plan clients, and other institutional clients. The Board noted the findings of the 2013 ad hoc joint committee (created with the board of other Fidelity funds), which reviewed and compared Fidelity's institutional investment advisory business with its business of providing services to the Fidelity funds, including the differences in services provided, fees charged, and costs incurred, as well as competition in their respective marketplaces.
Based on its review of total expense ratios and fees charged to other Fidelity clients, the Board concluded that the total expense ratio of each class of the fund was reasonable, although Class T was above the median of the universe presented for comparison, in light of the services that the fund and its shareholders receive and the other factors considered.
Costs of the Services and Profitability. The Board considered the revenues earned and the expenses incurred by Fidelity in conducting the business of developing, marketing, distributing, managing, administering and servicing the fund and servicing the fund's shareholders. The Board also considered the level of Fidelity's profits in respect of all the Fidelity funds.
On an annual basis, Fidelity presents to the Board Fidelity's profitability for the fund. Fidelity calculates the profitability for each fund, as well as aggregate profitability for groups of Fidelity funds and all Fidelity funds, using a series of detailed revenue and cost allocation methodologies which originate with the books and records of Fidelity on which Fidelity's audited financial statements are based. The Audit Committee of the Board reviews any significant changes from the prior year's methodologies.
PricewaterhouseCoopers LLP (PwC), independent registered public accounting firm and auditor to Fidelity and certain Fidelity funds, has been engaged annually by the Board as part of the Board's assessment of Fidelity's profitability analysis. PwC's engagement includes the review and assessment of the methodologies used by Fidelity in determining the revenues and expenses attributable to Fidelity's mutual fund business, and completion of agreed-upon procedures in respect of the mathematical accuracy of fund profitability and its conformity to established allocation methodologies. After considering PwC's reports issued under the engagement and information provided by Fidelity, the Board concluded that while other allocation methods may also be reasonable, Fidelity's profitability methodologies are reasonable in all material respects.
The Board also reviewed Fidelity's non-fund businesses and fall-out benefits related to the mutual fund business as well as cases where Fidelity's affiliates may benefit from or be related to the fund's business.
Annual Report
Board Approval of Investment Advisory Contracts and
Management Fees - continued
The Board considered the costs of the services provided by and the profits realized by Fidelity in connection with the operation of the fund and was satisfied that the profitability was not excessive in the circumstances.
Economies of Scale. The Board considered whether there have been economies of scale in respect of the management of the Fidelity funds, whether the Fidelity funds (including the fund) have appropriately benefited from any such economies of scale, and whether there is potential for realization of any further economies of scale. The Board considered the extent to which the fund will benefit from economies of scale through increased services to the fund, through waivers or reimbursements, or through fee or expense ratio reductions. The Board also noted that in 2013, it and the boards of other Fidelity funds created an ad hoc committee (the Economies of Scale Committee) to analyze whether Fidelity attains economies of scale in respect of the management and servicing of the Fidelity funds, whether the Fidelity funds have appropriately benefited from such economies of scale, and whether there is potential for realization of any further economies of scale.
The Board recognized that the fund's management contract incorporates a "group fee" structure, which provides for lower group fee rates as total group assets increase, and for higher group fee rates as total group assets decrease (with "group assets" defined to include fund assets under FMR's management plus sector fund assets previously under FMR's management and currently managed by Fidelity SelectCo, LLC). FMR calculates the group fee rates based on a tiered asset "breakpoint" schedule that varies based on asset class. The Board considered that the group fee is designed to deliver the benefits of economies of scale to fund shareholders when total Fidelity fund assets increase, even if assets of any particular fund are unchanged or have declined, because some portion of Fidelity's costs are attributable to services provided to all Fidelity funds, and all funds benefit if those costs can be allocated among more assets. The Board concluded that, given the group fee structure, fund shareholders will benefit from lower management fees as group assets increase at the fund complex level, regardless of whether Fidelity achieves any such economies of scale.
The Board concluded, taking into account the analysis of the Economies of Scale Committee, that economies of scale, if any, are being appropriately shared between fund shareholders and Fidelity.
Additional Information Requested by the Board. In order to develop fully the factual basis for consideration of the Fidelity funds' Advisory Contracts, the Board requested and received additional information on certain topics, including: (i) fund performance trends and Fidelity's long-term strategies for certain funds; (ii) Fidelity's strategic marketing and product lineup goals; (iii) the methodology with respect to competitive fund data and peer group classifications; (iv) the arrangements with, and performance of, certain sub-advisers on behalf of the Fidelity funds, as well as certain proposed participating affiliate arrangements; (v) the realization of fall-out benefits in certain Fidelity business units; (vi) Fidelity's group fee structures, including the rationale for the individual fee rates of certain categories of funds and the definition of group assets; (vii) trends regarding industry use of performance fee structures and the performance adjustment methodologies applicable to the Fidelity funds; (viii) additional competitive analysis regarding the total expenses for certain classes; (ix) fund profitability methodology, including Fidelity's cost allocation methodology, and the impact of certain factors on fund profitability results; and (x) the process by which Fidelity determines sub-advisory fees for funds it advises.
Annual Report
Based on its evaluation of all of the conclusions noted above, and after considering all factors it believed relevant, the Board ultimately concluded that the advisory fee structures are fair and reasonable, and that the fund's Advisory Contracts should be renewed.
Annual Report
Investment Adviser
Fidelity Management & Research Company
Boston, MA
Investment Sub-Advisers
FMR Co., Inc.
Fidelity Management & Research
(U.K.) Inc.
FIL Investments (Japan) Limited
FIL Investment Advisors
FIL Investment Advisors
(U.K.) Limited
Fidelity Management & Research
(Hong Kong) Limited
Fidelity Management & Research
(Japan) Limited
General Distributor
Fidelity Distributors Corporation
Smithfield, RI
Transfer and Service Agents
Fidelity Investments Institutional
Operations Company, Inc.
Boston, MA
Fidelity Service Company, Inc.
Boston, MA
Custodian
The Northern Trust Company
Chicago, IL
(Fidelity Investment logo)(registered trademark)
Corporate Headquarters
245 Summer St., Boston, MA 02210
www.fidelity.com
IGI-K-UANN-1214
1.863305.106
(Fidelity Investment logo)(registered trademark)
Fidelity Advisor®
International Growth
Fund - Class A, Class T, Class B
and Class C
Annual Report
October 31, 2014
(Fidelity Cover Art)
Class A, Class T,
Class B, and Class C are
classes of Fidelity®
International Growth Fund
Contents
Performance | (Click Here) | How the fund has done over time. |
Management's Discussion of Fund Performance | (Click Here) | The Portfolio Manager's review of fund performance and strategy. |
Shareholder Expense Example | (Click Here) | An example of shareholder expenses. |
Investment Changes | (Click Here) | A summary of major shifts in the fund's investments over the past six months. |
Investments | (Click Here) | A complete list of the fund's investments with their market values. |
Financial Statements | (Click Here) | Statements of assets and liabilities, operations, and changes in net assets, as well as financial highlights. |
Notes | (Click Here) | Notes to financial statements. |
Report of Independent Registered Public Accounting Firm | (Click Here) | |
Trustees and Officers | (Click Here) | |
Distributions | (Click Here) | |
Board Approval of Investment Advisory Contracts and Management Fees | (Click Here) | |
To view a fund's proxy voting guidelines and proxy voting record for the 12-month period ended June 30, visit http://www.fidelity.com/proxyvotingresults or visit the Securities and Exchange Commission's (SEC) web site at http://www.sec.gov. You may also call 1-877-208-0098 to request a free copy of the proxy voting guidelines.
Standard & Poor's, S&P and S&P 500 are registered service marks of The McGraw-Hill Companies, Inc. and have been licensed for use by Fidelity Distributors Corporation.
Other third-party marks appearing herein are the property of their respective owners.
All other marks appearing herein are registered or unregistered trademarks or service marks of FMR LLC or an affiliated company. © 2014 FMR LLC. All rights reserved.
Annual Report
This report and the financial statements contained herein are submitted for the general information of the shareholders of the fund. This report is not authorized for distribution to prospective investors in the fund unless preceded or accompanied by an effective prospectus.
A fund files its complete schedule of portfolio holdings with the SEC for the first and third quarters of each fiscal year on Form N-Q. Forms N-Q are available on the SEC's web site at http://www.sec.gov. A fund's Forms N-Q may be reviewed and copied at the SEC's Public Reference Room in Washington, DC. Information regarding the operation of the SEC's Public Reference Room may be obtained by calling 1-800-SEC-0330. For a complete list of a fund's portfolio holdings, view the most recent holdings listing, semiannual report, or annual report on Fidelity's web site at http://www.fidelity.com, http://www.advisor.fidelity.com, or http://www.401k.com, as applicable.
NOT FDIC INSURED • MAY LOSE VALUE • NO BANK GUARANTEE
Neither the fund nor Fidelity Distributors Corporation is a bank.
Annual Report
Average annual total return reflects the change in the value of an investment, assuming reinvestment of the class' distributions from dividend income and capital gains (the profits earned upon the sale of securities that have grown in value, if any) and assuming a constant rate of performance each year. The $10,000 table and the fund's returns do not reflect the deduction of taxes that a shareholder would pay on fund distributions or the redemption of fund shares. During periods of reimbursement by Fidelity, a fund's total return will be greater than it would be had the reimbursement not occurred. How a fund did yesterday is no guarantee of how it will do tomorrow.
Average Annual Total Returns
Periods ended October 31, 2014 | Past 1
year | Past 5
years | Life of
fund A |
Class A (incl. 5.75% sales charge) | -3.36% | 9.01% | 1.24% |
Class T (incl. 3.50% sales charge) | -1.37% | 9.25% | 1.32% |
Class B (incl. contingent deferred sales charge) B | -3.24% | 9.20% | 1.34% |
Class C (incl. contingent deferred sales charge) C | 0.77% | 9.48% | 1.34% |
A From November 1, 2007.
B Class B shares' contingent deferred sales charges included in the past one year, past five years, and life of fund total return figures are 5%, 2%, and 0%, respectively.
C Class C shares' contingent deferred sales charges included in the past one year, past five years, and life of fund total return figures are 1%, 0%, and 0%, respectively.
Annual Report
$10,000 Over Life of Fund
Let's say hypothetically that $10,000 was invested in Fidelity Advisor® International Growth Fund - Class A on November 1, 2007, when the fund started, and the current 5.75% sales charge was paid. The chart shows how the value of your investment would have changed, and also shows how the MSCI EAFE Growth Index performed over the same period.
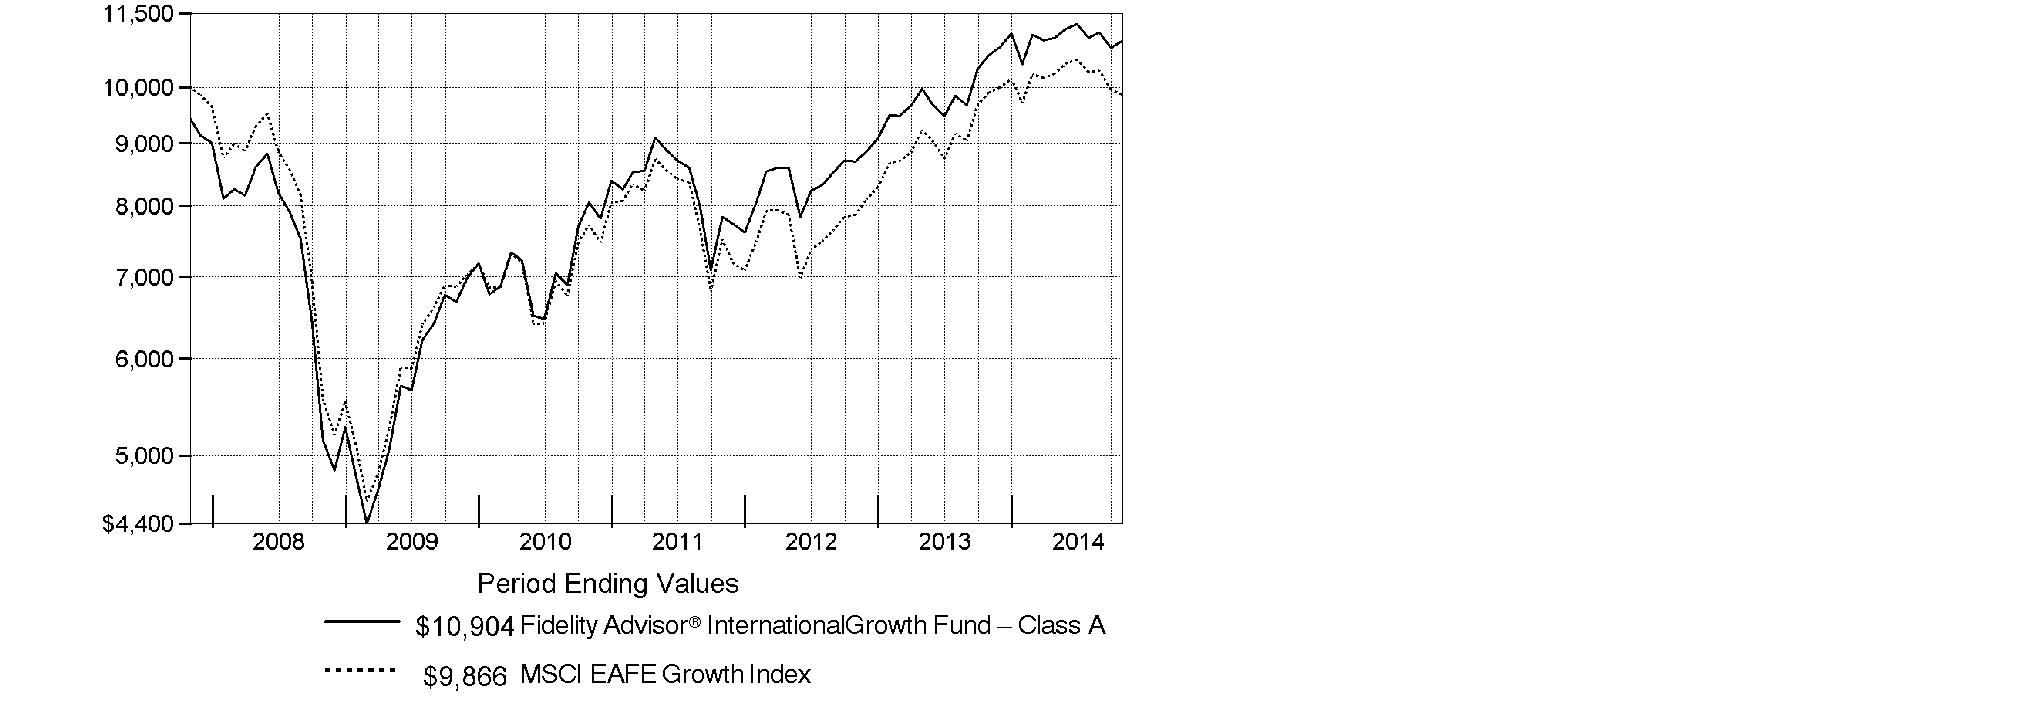
Annual Report
Market Recap: Global equities posted a healthy gain for the 12 months ending October 31, 2014, overcoming an October market decline driven by recessionary pressures in China and tepid growth in Europe. The MSCI ACWI (All Country World Index) Index rose 8.15%, helped by subdued market volatility for much of the period and supported by solid corporate earnings, especially in the United States. Stocks also benefited from easy monetary policies in Japan and the eurozone, as well as increased stimulus efforts in China. All but three of the 24 industry groups that compose the index marked a positive return. The U.S. (+17%) remained a pillar of strength, while a strongly rising dollar in the latter part of the period detracted from investors' returns in most non-U.S. markets. Canada (+5%) notched broad gains outside of its energy and materials sectors, as did Asia-Pacific ex Japan (+4%), led by investor enthusiasm for companies in India. The U.K., Europe and Japan, meanwhile, all underperformed. Among sectors, health care (+24%) led the index, with a strong contribution from the pharmaceuticals, biotechnology & life sciences industry. Information technology (+21%) also outperformed. Conversely, materials (-4%) and energy (-1%) lagged the index due to a higher supply of and lower demand for commodities.
Comments from Jed Weiss, Portfolio Manager of Fidelity Advisor® International Growth Fund: For the year ending October 31, 2014, the fund's Class A, Class T, Class B and Class C shares returned 2.54%, 2.21%, 1.76% and 1.77%, respectively (excluding sales charges), well ahead of the MSCI EAFE Growth Index, which returned -0.51%. The fund benefited from its positioning in the U.S. - where some fund holdings happen to be domiciled while doing most or all of their business abroad - and also a beneficial underweighting in Europe. My stance in Japan was a modest negative. On an individual basis, U.K.-based hotel company Intercontinental Hotels Group was the fund's top individual contributor. I continued to like this stock for its strong operations and ability to benefit from a cyclically improving hotel business, especially in the U.S. Visa and MasterCard, two U.S.-based payment-processing software companies not found in the index, also were significant contributors. One notable laggard was Andritz, an Austrian industrial engineering firm with a dominant competitive position in several industries. The value of our stake fell during the 12 months, most likely because of investors' concerns about a slowing global economy. Another disappointment was Nokian Tyres, a Finland-based tire manufacturer that encountered a difficult business environment. I ultimately sold the fund's stake in search of other opportunities.
The views expressed above reflect those of the portfolio manager(s) only through the end of the period as stated on the cover of this report and do not necessarily represent the views of Fidelity or any other person in the Fidelity organization. Any such views are subject to change at any time based upon market or other conditions and Fidelity disclaims any responsibility to update such views. These views may not be relied on as investment advice and, because investment decisions for a Fidelity fund are based on numerous factors, may not be relied on as an indication of trading intent on behalf of any Fidelity fund.
Annual Report
Shareholder Expense Example
As a shareholder of the Fund, you incur two types of costs: (1) transaction costs, including sales charges (loads) on purchase payments or redemption proceeds, redemption fees and (2) ongoing costs, including management fees, distribution and/or service (12b-1) fees and other Fund expenses. This Example is intended to help you understand your ongoing costs (in dollars) of investing in the Fund and to compare these costs with the ongoing costs of investing in other mutual funds.
The Example is based on an investment of $1,000 invested at the beginning of the period and held for the entire period (May 1, 2014 to October 31, 2014).
Actual Expenses
The first line of the accompanying table for each class of the Fund provides information about actual account values and actual expenses. You may use the information in this line, together with the amount you invested, to estimate the expenses that you paid over the period. Simply divide your account value by $1,000.00 (for example, an $8,600 account value divided by $1,000.00 = 8.6), then multiply the result by the number in the first line for a class of the Fund under the heading entitled "Expenses Paid During Period" to estimate the expenses you paid on your account during this period. A small balance maintenance fee of $12.00 that is charged once a year may apply for certain accounts with a value of less than $2,000. This fee is not included in the table below. If it was, the estimate of expenses you paid during the period would be higher, and your ending account value lower, by this amount. In addition, the Fund, as a shareholder in the underlying Fidelity Central Funds, will indirectly bear its pro-rata share of the fees and expenses incurred by the underlying Fidelity Central Funds. These fees and expenses are not included in the Fund's annualized expense ratio used to calculate the expense estimate in the table below.
Hypothetical Example for Comparison Purposes
The second line of the accompanying table for each class of the Fund provides information about hypothetical account values and hypothetical expenses based on a Class' actual expense ratio and an assumed rate of return of 5% per year before expenses, which is not the Class' actual return. The hypothetical account values and expenses may not be used to estimate the actual ending account balance or expenses you paid for the period. You may use this information to compare the ongoing costs of investing in the Fund and other funds. To do so, compare this 5% hypothetical example with the 5% hypothetical examples that appear in the shareholder reports of the other funds. A small balance maintenance fee of $12.00 that is charged once a year may apply for certain accounts with a value of less than $2,000. This fee is not included in the table below. If it was, the estimate of expenses you paid during the period would be higher, and your ending account value lower, by this amount. In addition, the Fund, as a shareholder in the underlying Fidelity Central Funds, will indirectly bear its pro-rata share of the fees and expenses incurred by the underlying Fidelity Central Funds. These fees and expenses are not included in the Fund's annualized expense ratio used to calculate the expense estimate in the table below.
Please note that the expenses shown in the table are meant to highlight your ongoing costs only and do not reflect any transaction costs. Therefore, the second line of the table is useful in comparing ongoing costs only, and will not help you determine the relative total costs of owning different funds. In addition, if these transactional costs were included, your costs would have been higher.
Annual Report
| Annualized
Expense RatioB | Beginning
Account Value
May 1, 2014 | Ending
Account Value
October 31, 2014 | Expenses Paid
During Period*
May 1, 2014 to
October 31, 2014 |
Class A | 1.34% | | | |
Actual | | $ 1,000.00 | $ 993.70 | $ 6.73 |
HypotheticalA | | $ 1,000.00 | $ 1,018.45 | $ 6.82 |
Class T | 1.64% | | | |
Actual | | $ 1,000.00 | $ 991.90 | $ 8.23 |
HypotheticalA | | $ 1,000.00 | $ 1,016.94 | $ 8.34 |
Class B | 2.13% | | | |
Actual | | $ 1,000.00 | $ 990.90 | $ 10.69 |
HypotheticalA | | $ 1,000.00 | $ 1,014.47 | $ 10.82 |
Class C | 2.12% | | | |
Actual | | $ 1,000.00 | $ 990.00 | $ 10.63 |
HypotheticalA | | $ 1,000.00 | $ 1,014.52 | $ 10.76 |
International Growth | 1.03% | | | |
Actual | | $ 1,000.00 | $ 995.50 | $ 5.18 |
HypotheticalA | | $ 1,000.00 | $ 1,020.01 | $ 5.24 |
Institutional Class | 1.05% | | | |
Actual | | $ 1,000.00 | $ 995.50 | $ 5.28 |
HypotheticalA | | $ 1,000.00 | $ 1,019.91 | $ 5.35 |
Class Z | .88% | | | |
Actual | | $ 1,000.00 | $ 996.40 | $ 4.43 |
HypotheticalA | | $ 1,000.00 | $ 1,020.77 | $ 4.48 |
A 5% return per year before expenses
B Annualized expense ratio reflects expenses net of applicable fee waivers.
* Expenses are equal to each Class' annualized expense ratio, multiplied by the average account value over the period, multiplied by 184/365 (to reflect the one-half year period).
Annual Report
Investment Changes (Unaudited)
Geographic Diversification (% of fund's net assets) |
As of October 31, 2014 |
 | United States of America* 18.8% | |
 | United Kingdom 15.5% | |
 | Japan 14.2% | |
 | Switzerland 12.4% | |
 | Sweden 5.6% | |
 | Germany 4.6% | |
 | Belgium 4.5% | |
 | Australia 3.5% | |
 | Denmark 2.8% | |
 | Other 18.1% | |

Percentages are based on country or territory of incorporation and are adjusted for the effect of futures contracts, if applicable. |
* Includes Short-Term Investments and Net Other Assets (Liabilities) |
As of April 30, 2014 |
| United States of America* 17.7% | |
| United Kingdom 14.4% | |
| Japan 13.9% | |
| Switzerland 13.4% | |
| Sweden 6.7% | |
| Belgium 4.7% | |
| Germany 4.2% | |
| Australia 3.0% | |
| Denmark 3.0% | |
| Other 19.0% | |

Percentages are based on country or territory of incorporation and are adjusted for the effect of futures contracts, if applicable. |
* Includes Short-Term Investments and Net Other Assets (Liabilities) |
Asset Allocation as of October 31, 2014 |
| % of fund's
net assets | % of fund's net assets
6 months ago |
Stocks | 96.7 | 96.7 |
Short-Term Investments and Net Other Assets (Liabilities) | 3.3 | 3.3 |
Top Ten Stocks as of October 31, 2014 |
| % of fund's
net assets | % of fund's net assets
6 months ago |
Roche Holding AG (participation certificate) (Switzerland, Pharmaceuticals) | 4.5 | 4.2 |
Nestle SA (Switzerland, Food Products) | 3.7 | 3.7 |
Prudential PLC (United Kingdom, Insurance) | 3.0 | 2.8 |
Anheuser-Busch InBev SA NV (Belgium, Beverages) | 3.0 | 3.2 |
DENSO Corp. (Japan, Auto Components) | 2.6 | 2.7 |
Linde AG (Germany, Chemicals) | 2.6 | 2.6 |
Keyence Corp. (Japan, Electronic Equipment & Components) | 2.3 | 1.7 |
CSL Ltd. (Australia, Biotechnology) | 2.3 | 2.0 |
Novo Nordisk A/S Series B sponsored ADR (Denmark, Pharmaceuticals) | 2.2 | 2.5 |
Reckitt Benckiser Group PLC (United Kingdom, Household Products) | 2.2 | 2.1 |
| 28.4 | |
Market Sectors as of October 31, 2014 |
| % of fund's
net assets | % of fund's net assets
6 months ago |
Health Care | 16.1 | 12.2 |
Consumer Discretionary | 15.5 | 17.2 |
Financials | 15.2 | 15.9 |
Industrials | 14.8 | 14.9 |
Consumer Staples | 14.8 | 15.7 |
Information Technology | 9.9 | 7.8 |
Materials | 7.4 | 8.3 |
Energy | 2.2 | 2.3 |
Telecommunication Services | 0.8 | 2.4 |
Annual Report
Investments October 31, 2014
Showing Percentage of Net Assets
Common Stocks - 96.7% |
| Shares | | Value |
Australia - 3.5% |
CSL Ltd. | 298,127 | | $ 21,048,639 |
Sydney Airport unit | 1,294,562 | | 5,032,913 |
Transurban Group unit | 939,495 | | 6,728,575 |
TOTAL AUSTRALIA | | 32,810,127 |
Austria - 1.0% |
Andritz AG | 190,697 | | 9,205,199 |
Bailiwick of Jersey - 1.0% |
Shire PLC | 138,400 | | 9,286,215 |
Belgium - 4.5% |
Anheuser-Busch InBev SA NV | 251,991 | | 27,944,391 |
KBC Groupe SA (a) | 265,383 | | 14,217,141 |
TOTAL BELGIUM | | 42,161,532 |
Bermuda - 0.5% |
Lazard Ltd. Class A | 99,692 | | 4,905,843 |
Canada - 0.7% |
Canadian Pacific Railway Ltd. | 33,200 | | 6,905,706 |
Cayman Islands - 2.7% |
Sands China Ltd. | 1,690,400 | | 10,543,212 |
Tencent Holdings Ltd. | 343,200 | | 5,516,004 |
Wynn Macau Ltd. | 2,474,400 | | 8,945,222 |
TOTAL CAYMAN ISLANDS | | 25,004,438 |
Denmark - 2.8% |
Jyske Bank A/S (Reg.) (a) | 101,100 | | 5,446,923 |
Novo Nordisk A/S Series B sponsored ADR | 452,400 | | 20,439,432 |
TOTAL DENMARK | | 25,886,355 |
Finland - 0.2% |
Tikkurila Oyj | 108,900 | | 2,248,993 |
France - 1.0% |
Safran SA | 152,700 | | 9,663,478 |
Germany - 4.6% |
Bayer AG | 133,500 | | 18,979,677 |
Linde AG | 129,941 | | 23,961,253 |
TOTAL GERMANY | | 42,940,930 |
India - 0.5% |
Housing Development Finance Corp. Ltd. | 235,780 | | 4,246,218 |
Common Stocks - continued |
| Shares | | Value |
Ireland - 2.3% |
CRH PLC sponsored ADR | 444,566 | | $ 9,962,724 |
James Hardie Industries PLC: | | | |
CDI | 445,857 | | 4,755,798 |
sponsored ADR | 132,300 | | 7,055,559 |
TOTAL IRELAND | | 21,774,081 |
Israel - 0.2% |
Azrieli Group | 67,500 | | 2,166,849 |
Italy - 0.6% |
Azimut Holding SpA | 111,600 | | 2,606,833 |
Interpump Group SpA | 252,351 | | 3,288,830 |
TOTAL ITALY | | 5,895,663 |
Japan - 14.2% |
Aozora Bank Ltd. | 1,240,000 | | 4,358,487 |
Astellas Pharma, Inc. | 797,900 | | 12,383,805 |
Coca-Cola Central Japan Co. Ltd. | 174,500 | | 3,139,790 |
DENSO Corp. | 533,800 | | 24,465,988 |
East Japan Railway Co. | 68,800 | | 5,373,503 |
Fanuc Corp. | 51,900 | | 9,146,637 |
Fast Retailing Co. Ltd. | 27,400 | | 10,186,156 |
Japan Tobacco, Inc. | 144,500 | | 4,930,203 |
Keyence Corp. | 43,762 | | 21,206,307 |
Mitsui Fudosan Co. Ltd. | 439,000 | | 14,121,067 |
Seven Bank Ltd. | 1,300,000 | | 5,429,321 |
SHO-BOND Holdings Co. Ltd. | 121,100 | | 4,679,336 |
USS Co. Ltd. | 566,700 | | 8,918,724 |
Yamato Kogyo Co. Ltd. | 142,400 | | 4,613,045 |
TOTAL JAPAN | | 132,952,369 |
Kenya - 0.4% |
Safaricom Ltd. | 25,598,200 | | 3,491,314 |
Korea (South) - 0.4% |
NAVER Corp. | 5,695 | | 3,996,510 |
Mexico - 0.5% |
Fomento Economico Mexicano S.A.B. de CV sponsored ADR | 44,855 | | 4,316,845 |
Netherlands - 1.6% |
ING Groep NV (Certificaten Van Aandelen) (a) | 1,049,764 | | 15,033,001 |
South Africa - 1.6% |
Clicks Group Ltd. | 649,951 | | 4,425,424 |
Common Stocks - continued |
| Shares | | Value |
South Africa - continued |
MTN Group Ltd. | 164,900 | | $ 3,647,916 |
Naspers Ltd. Class N | 52,500 | | 6,533,566 |
TOTAL SOUTH AFRICA | | 14,606,906 |
Spain - 2.0% |
Inditex SA | 570,726 | | 16,031,326 |
Prosegur Compania de Seguridad SA (Reg.) | 419,349 | | 2,459,374 |
TOTAL SPAIN | | 18,490,700 |
Sweden - 5.6% |
ASSA ABLOY AB (B Shares) | 303,961 | | 16,099,232 |
Atlas Copco AB (A Shares) | 333,509 | | 9,624,773 |
Fagerhult AB | 228,152 | | 4,202,064 |
H&M Hennes & Mauritz AB (B Shares) | 254,482 | | 10,121,864 |
Intrum Justitia AB | 88,300 | | 2,623,595 |
Svenska Handelsbanken AB (A Shares) | 210,740 | | 10,048,760 |
TOTAL SWEDEN | | 52,720,288 |
Switzerland - 12.4% |
Nestle SA | 475,669 | | 34,882,777 |
Novartis AG | 141,366 | | 13,119,171 |
Roche Holding AG (participation certificate) | 142,215 | | 41,967,880 |
Schindler Holding AG: | | | |
(participation certificate) | 50,627 | | 7,071,942 |
(Reg.) | 8,980 | | 1,215,191 |
UBS AG (NY Shares) | 1,028,161 | | 17,869,438 |
TOTAL SWITZERLAND | | 116,126,399 |
Taiwan - 0.4% |
Taiwan Semiconductor Manufacturing Co. Ltd. | 864,000 | | 3,739,490 |
Turkey - 0.5% |
Coca-Cola Icecek Sanayi A/S | 226,534 | | 5,167,378 |
United Kingdom - 15.5% |
Babcock International Group PLC | 315,784 | | 5,531,498 |
BAE Systems PLC | 677,000 | | 4,967,707 |
Berendsen PLC | 226,573 | | 3,660,733 |
BG Group PLC | 614,495 | | 10,241,193 |
GlaxoSmithKline PLC | 418,600 | | 9,466,206 |
Informa PLC | 557,755 | | 4,291,678 |
InterContinental Hotel Group PLC ADR | 407,996 | | 15,507,928 |
Johnson Matthey PLC | 182,777 | | 8,695,630 |
Prudential PLC | 1,228,409 | | 28,445,074 |
Common Stocks - continued |
| Shares | | Value |
United Kingdom - continued |
Reckitt Benckiser Group PLC | 241,345 | | $ 20,269,179 |
Rolls-Royce Group PLC | 560,137 | | 7,553,711 |
Rotork PLC | 51,700 | | 2,113,100 |
SABMiller PLC | 339,166 | | 19,125,376 |
Shaftesbury PLC | 249,233 | | 2,854,678 |
Unite Group PLC | 377,876 | | 2,581,165 |
TOTAL UNITED KINGDOM | | 145,304,856 |
United States of America - 15.5% |
Autoliv, Inc. (d) | 111,169 | | 10,198,644 |
Berkshire Hathaway, Inc. Class B (a) | 50,184 | | 7,033,789 |
BorgWarner, Inc. | 198,192 | | 11,300,908 |
Cummins, Inc. | 50,782 | | 7,423,313 |
FMC Technologies, Inc. (a) | 77,152 | | 4,323,598 |
Google, Inc.: | | | |
Class A (a) | 20,533 | | 11,660,075 |
Class C (a) | 9,003 | | 5,033,397 |
Martin Marietta Materials, Inc. | 70,300 | | 8,219,476 |
MasterCard, Inc. Class A | 172,900 | | 14,480,375 |
Mead Johnson Nutrition Co. Class A | 38,844 | | 3,857,598 |
Mohawk Industries, Inc. (a) | 54,100 | | 7,684,364 |
National Oilwell Varco, Inc. | 27,772 | | 2,017,358 |
Oceaneering International, Inc. | 54,213 | | 3,809,548 |
Philip Morris International, Inc. | 87,408 | | 7,780,186 |
PriceSmart, Inc. | 43,000 | | 3,828,290 |
ResMed, Inc. (d) | 67,200 | | 3,509,184 |
Solera Holdings, Inc. | 112,389 | | 5,838,609 |
SS&C Technologies Holdings, Inc. (a) | 124,300 | | 6,006,176 |
Union Pacific Corp. | 51,400 | | 5,985,530 |
Visa, Inc. Class A | 61,275 | | 14,793,623 |
TOTAL UNITED STATES OF AMERICA | | 144,784,041 |
TOTAL COMMON STOCKS (Cost $817,018,791) |
905,831,724
|
Nonconvertible Preferred Stocks - 0.0% |
| | | |
United Kingdom - 0.0% |
Rolls-Royce Group PLC
(Cost $80,771) | 50,412,330 | |
80,645
|
Money Market Funds - 3.9% |
| Shares | | Value |
Fidelity Cash Central Fund, 0.11% (b) | 24,195,564 | | $ 24,195,564 |
Fidelity Securities Lending Cash Central Fund, 0.11% (b)(c) | 12,132,000 | | 12,132,000 |
TOTAL MONEY MARKET FUNDS (Cost $36,327,564) |
36,327,564
|
TOTAL INVESTMENT PORTFOLIO - 100.6% (Cost $853,427,126) | 942,239,933 |
NET OTHER ASSETS (LIABILITIES) - (0.6)% | (5,448,826) |
NET ASSETS - 100% | $ 936,791,107 |
Legend |
(a) Non-income producing |
(b) Affiliated fund that is generally available only to investment companies and other accounts managed by Fidelity Investments. The rate quoted is the annualized seven-day yield of the fund at period end. A complete unaudited listing of the fund's holdings as of its most recent quarter end is available upon request. In addition, each Fidelity Central Fund's financial statements, which are not covered by the Fund's Report of Independent Registered Public Accounting Firm, are available on the SEC's website or upon request. |
(c) Investment made with cash collateral received from securities on loan. |
(d) Security or a portion of the security is on loan at period end. |
Affiliated Central Funds |
Information regarding fiscal year to date income earned by the Fund from investments in Fidelity Central Funds is as follows: |
Fund | Income earned |
Fidelity Cash Central Fund | $ 22,126 |
Fidelity Securities Lending Cash Central Fund | 325,646 |
Total | $ 347,772 |
Other Information |
Categorizations in the Schedule of Investments are based on country or territory of incorporation. |
The following is a summary of the inputs used, as of October 31, 2014, involving the Fund's assets and liabilities carried at fair value. The inputs or methodology used for valuing securities may not be an indication of the risk associated with investing in those securities. For more information on valuation inputs, and their aggregation into the levels used in the table below, please refer to the Investment Valuation section in the accompanying Notes to Financial Statements. |
Valuation Inputs at Reporting Date: |
Description | Total | Level 1 | Level 2 | Level 3 |
Investments in Securities: | | | | |
Equities: | | | | |
Consumer Discretionary | $ 144,729,580 | $ 81,670,278 | $ 63,059,302 | $ - |
Consumer Staples | 139,667,437 | 68,770,276 | 70,897,161 | - |
Energy | 20,391,697 | 10,150,504 | 10,241,193 | - |
Financials | 141,364,587 | 69,731,419 | 71,633,168 | - |
Health Care | 150,200,209 | 42,928,293 | 107,271,916 | - |
Industrials | 140,636,585 | 109,675,621 | 30,960,964 | - |
Information Technology | 92,270,566 | 61,808,765 | 30,461,801 | - |
Materials | 69,512,478 | 60,143,635 | 9,368,843 | - |
Telecommunication Services | 7,139,230 | 7,139,230 | - | - |
Money Market Funds | 36,327,564 | 36,327,564 | - | - |
Total Investments in Securities: | $ 942,239,933 | $ 548,345,585 | $ 393,894,348 | $ - |
The following is a summary of transfers between Level 1 and Level 2 for the period ended October 31, 2014. Transfers are assumed to have occurred at the beginning of the period, and are primarily attributable to the valuation techniques used for foreign equity securities, as discussed in the accompanying Notes to Financial Statements: |
Transfers | Total |
Level 1 to Level 2 | $ 60,817,931 |
Level 2 to Level 1 | $ 0 |
See accompanying notes which are an integral part of the financial statements.
Annual Report
Statement of Assets and Liabilities
| October 31, 2014 |
| | |
Assets | | |
Investment in securities, at value (including securities loaned of $12,004,474) - See accompanying schedule: Unaffiliated issuers (cost $817,099,562) | $ 905,912,369 | |
Fidelity Central Funds (cost $36,327,564) | 36,327,564 | |
Total Investments (cost $853,427,126) | | $ 942,239,933 |
Foreign currency held at value (cost $43) | | 42 |
Receivable for investments sold | | 4,073,580 |
Receivable for fund shares sold | | 4,531,915 |
Dividends receivable | | 1,723,029 |
Distributions receivable from Fidelity Central Funds | | 6,903 |
Prepaid expenses | | 3,337 |
Other receivables | | 2,775 |
Total assets | | 952,581,514 |
| | |
Liabilities | | |
Payable for investments purchased | $ 1,884,552 | |
Payable for fund shares redeemed | 842,608 | |
Accrued management fee | 580,330 | |
Distribution and service plan fees payable | 60,982 | |
Other affiliated payables | 191,189 | |
Other payables and accrued expenses | 98,746 | |
Collateral on securities loaned, at value | 12,132,000 | |
Total liabilities | | 15,790,407 |
| | |
Net Assets | | $ 936,791,107 |
Net Assets consist of: | | |
Paid in capital | | $ 850,335,068 |
Undistributed net investment income | | 6,829,762 |
Accumulated undistributed net realized gain (loss) on investments and foreign currency transactions | | (9,108,156) |
Net unrealized appreciation (depreciation) on investments and assets and liabilities in foreign currencies | | 88,734,433 |
Net Assets | | $ 936,791,107 |
See accompanying notes which are an integral part of the financial statements.
Annual Report
Financial Statements - continued
Statement of Assets and Liabilities - continued
| October 31, 2014 |
| | |
Calculation of Maximum Offering Price
Class A:
Net Asset Value and redemption price per share
($119,017,195 ÷ 10,806,546 shares) | | $ 11.01 |
| | |
Maximum offering price per share (100/94.25 of $11.01) | | $ 11.68 |
Class T:
Net Asset Value and redemption price per share ($26,368,504 ÷ 2,404,861 shares) | | $ 10.96 |
| | |
Maximum offering price per share (100/96.50 of $10.96) | | $ 11.36 |
Class B:
Net Asset Value and offering price per share ($1,404,031 ÷ 128,735 shares)A | | $ 10.91 |
| | |
Class C:
Net Asset Value and offering price per share ($32,737,168 ÷ 3,011,271 shares)A | | $ 10.87 |
| | |
International Growth:
Net Asset Value, offering price and redemption price per share ($635,606,779 ÷ 57,274,082 shares) | | $ 11.10 |
| | |
Institutional Class:
Net Asset Value, offering price and redemption price per share ($121,553,795 ÷ 10,967,024 shares) | | $ 11.08 |
| | |
Class Z:
Net Asset Value, offering price and redemption price per share ($103,635 ÷ 9,336 shares) | | $ 11.10 |
A Redemption price per share is equal to net asset value less any applicable contingent deferred sales charge.
See accompanying notes which are an integral part of the financial statements.
Annual Report
Statement of Operations
| Year ended October 31, 2014 |
| | |
Investment Income | | |
Dividends | | $ 17,871,194 |
Income from Fidelity Central Funds | | 347,772 |
Income before foreign taxes withheld | | 18,218,966 |
Less foreign taxes withheld | | (1,316,845) |
Total income | | 16,902,121 |
| | |
Expenses | | |
Management fee
Basic fee | $ 5,413,678 | |
Performance adjustment | 364,493 | |
Transfer agent fees | 1,687,661 | |
Distribution and service plan fees | 677,617 | |
Accounting and security lending fees | 377,289 | |
Custodian fees and expenses | 106,805 | |
Independent trustees' compensation | 3,045 | |
Registration fees | 139,931 | |
Audit | 71,897 | |
Legal | 2,124 | |
Miscellaneous | 3,622 | |
Total expenses before reductions | 8,848,162 | |
Expense reductions | (10,690) | 8,837,472 |
Net investment income (loss) | | 8,064,649 |
Realized and Unrealized Gain (Loss) Net realized gain (loss) on: | | |
Investment securities: | | |
Unaffiliated issuers | (8,867,777) | |
Foreign currency transactions | (61,847) | |
Total net realized gain (loss) | | (8,929,624) |
Change in net unrealized appreciation (depreciation) on: Investment securities (net of increase in deferred foreign taxes of $11,698) | 17,936,446 | |
Assets and liabilities in foreign currencies | (63,604) | |
Total change in net unrealized appreciation (depreciation) | | 17,872,842 |
Net gain (loss) | | 8,943,218 |
Net increase (decrease) in net assets resulting from operations | | $ 17,007,867 |
See accompanying notes which are an integral part of the financial statements.
Annual Report
Financial Statements - continued
Statement of Changes in Net Assets
| Year ended
October 31,
2014 | Year ended
October 31,
2013 |
Increase (Decrease) in Net Assets | | |
Operations | | |
Net investment income (loss) | $ 8,064,649 | $ 3,493,326 |
Net realized gain (loss) | (8,929,624) | 6,317,113 |
Change in net unrealized appreciation (depreciation) | 17,872,842 | 60,869,889 |
Net increase (decrease) in net assets resulting
from operations | 17,007,867 | 70,680,328 |
Distributions to shareholders from net investment income | (2,592,643) | (2,081,336) |
Distributions to shareholders from net realized gain | (513,441) | (113,769) |
Total distributions | (3,106,084) | (2,195,105) |
Share transactions - net increase (decrease) | 336,569,228 | 324,915,158 |
Redemption fees | 42,228 | 31,216 |
Total increase (decrease) in net assets | 350,513,239 | 393,431,597 |
| | |
Net Assets | | |
Beginning of period | 586,277,868 | 192,846,271 |
End of period (including undistributed net investment income of $6,829,762 and undistributed net investment income of $2,476,993, respectively) | $ 936,791,107 | $ 586,277,868 |
See accompanying notes which are an integral part of the financial statements.
Annual Report
Financial Highlights - Class A
Years ended October 31, | 2014 | 2013 | 2012 | 2011 | 2010 |
Selected Per-Share Data | | | | | |
Net asset value, beginning of period | $ 10.78 | $ 8.91 | $ 8.09 | $ 8.38 | $ 7.01 |
Income from Investment Operations | | | | | |
Net investment income (loss) C | .09 | .08 | .08 | .08 | .05 |
Net realized and unrealized gain (loss) | .18 | 1.88 | .81 | (.31) | 1.39 |
Total from investment operations | .27 | 1.96 | .89 | (.23) | 1.44 |
Distributions from net investment income | (.03) | (.08) | (.06) | (.05) | (.05) |
Distributions from net realized gain | (.01) | (.01) | (.01) | (.01) | (.03) |
Total distributions | (.04) | (.09) | (.07) | (.06) | (.07) H |
Redemption fees added to paid in capital C, G | - | - | - | - | - |
Net asset value, end of period | $ 11.01 | $ 10.78 | $ 8.91 | $ 8.09 | $ 8.38 |
Total ReturnA, B | 2.54% | 22.18% | 11.10% | (2.76)% | 20.68% |
Ratios to Average Net Assets D, F | | | | | |
Expenses before reductions | 1.35% | 1.44% | 1.58% | 1.77% | 2.13% |
Expenses net of fee waivers, if any | 1.35% | 1.43% | 1.45% | 1.45% | 1.50% |
Expenses net of all reductions | 1.34% | 1.42% | 1.44% | 1.43% | 1.48% |
Net investment income (loss) | .84% | .80% | .99% | .92% | .74% |
Supplemental Data | | | | | |
Net assets, end of period (000 omitted) | $ 119,017 | $ 74,595 | $ 21,874 | $ 6,352 | $ 3,084 |
Portfolio turnover rateE | 27% | 32% | 32% | 68% | 87% |
A Total returns would have been lower if certain expenses had not been reduced during the applicable periods shown.
B Total returns do not include the effect of the sales charges.
C Calculated based on average shares outstanding during the period.
D Fees and expenses of any underlying Fidelity Central Funds are not included in the Fund's expense ratio. The Fund indirectly bears its proportionate share of the expenses of any underlying Fidelity Central Funds.
E Amount does not include the portfolio activity of any underlying Fidelity Central Funds.
F Expense ratios reflect operating expenses of the class. Expenses before reductions do not reflect amounts reimbursed by the investment adviser or reductions from brokerage service arrangements or reductions from other expense offset arrangements and do not represent the amount paid by the class during periods when reimbursements or reductions occur. Expenses net of fee waivers reflect expenses after reimbursement by the investment adviser but prior to reductions from brokerage service arrangements or other expense offset arrangements. Expenses net of all reductions represent the net expenses paid by the class.
G Amount represents less than $.01 per share.
H Total distributions of $.07 per share is comprised of distributions from net investment income of $.046 and distributions from net realized gain of $.025 per share.
See accompanying notes which are an integral part of the financial statements.
Annual Report
Financial Highlights - Class T
Years ended October 31, | 2014 | 2013 | 2012 | 2011 | 2010 |
Selected Per-Share Data | | | | | |
Net asset value, beginning of period | $ 10.75 | $ 8.89 | $ 8.08 | $ 8.38 | $ 7.00 |
Income from Investment Operations | | | | | |
Net investment income (loss) C | .06 | .05 | .06 | .06 | .04 |
Net realized and unrealized gain (loss) | .18 | 1.88 | .81 | (.31) | 1.39 |
Total from investment operations | .24 | 1.93 | .87 | (.25) | 1.43 |
Distributions from net investment income | (.02) | (.07) | (.05) | (.04) | (.02) |
Distributions from net realized gain | (.01) | (.01) | (.01) | (.01) | (.03) |
Total distributions | (.03) | (.07) H | (.06) | (.05) | (.05) |
Redemption fees added to paid in capital C, G | - | - | - | - | - |
Net asset value, end of period | $ 10.96 | $ 10.75 | $ 8.89 | $ 8.08 | $ 8.38 |
Total ReturnA, B | 2.21% | 21.91% | 10.82% | (3.03)% | 20.47% |
Ratios to Average Net Assets D, F | | | | | |
Expenses before reductions | 1.65% | 1.69% | 1.85% | 2.03% | 2.41% |
Expenses net of fee waivers, if any | 1.65% | 1.69% | 1.70% | 1.70% | 1.75% |
Expenses net of all reductions | 1.65% | 1.68% | 1.69% | 1.68% | 1.73% |
Net investment income (loss) | .53% | .54% | .74% | .67% | .49% |
Supplemental Data | | | | | |
Net assets, end of period (000 omitted) | $ 26,369 | $ 23,118 | $ 10,690 | $ 2,917 | $ 1,034 |
Portfolio turnover rateE | 27% | 32% | 32% | 68% | 87% |
A Total returns would have been lower if certain expenses had not been reduced during the applicable periods shown.
B Total returns do not include the effect of the sales charges.
C Calculated based on average shares outstanding during the period.
D Fees and expenses of any underlying Fidelity Central Funds are not included in the Fund's expense ratio. The Fund indirectly bears its proportionate share of the expenses of any underlying Fidelity Central Funds.
E Amount does not include the portfolio activity of any underlying Fidelity Central Funds.
F Expense ratios reflect operating expenses of the class. Expenses before reductions do not reflect amounts reimbursed by the investment adviser or reductions from brokerage service arrangements or reductions from other expense offset arrangements and do not represent the amount paid by the class during periods when reimbursements or reductions occur. Expenses net of fee waivers reflect expenses after reimbursement by the investment adviser but prior to reductions from brokerage service arrangements or other expense offset arrangements. Expenses net of all reductions represent the net expenses paid by the class.
G Amount represents less than $.01 per share.
H Total distributions of $.07 per share is comprised of distributions from net investment income of $.069 and distributions from net realized gain of $.005 per share.
See accompanying notes which are an integral part of the financial statements.
Annual Report
Financial Highlights - Class B
Years ended October 31, | 2014 | 2013 | 2012 | 2011 | 2010 |
Selected Per-Share Data | | | | | |
Net asset value, beginning of period | $ 10.73 | $ 8.88 | $ 8.06 | $ 8.36 | $ 6.98 |
Income from Investment Operations | | | | | |
Net investment income (loss) C | - G | - G | .02 | .01 | - G |
Net realized and unrealized gain (loss) | .19 | 1.89 | .80 | (.30) | 1.38 |
Total from investment operations | .19 | 1.89 | .82 | (.29) | 1.38 |
Distributions from net investment income | - | (.03) | - | (.01) | - |
Distributions from net realized gain | (.01) | (.01) | - | - G | - |
Total distributions | (.01) | (.04) | - | (.01) | - |
Redemption fees added to paid in capital C, G | - | - | - | - | - |
Net asset value, end of period | $ 10.91 | $ 10.73 | $ 8.88 | $ 8.06 | $ 8.36 |
Total ReturnA, B | 1.76% | 21.35% | 10.17% | (3.47)% | 19.77% |
Ratios to Average Net Assets D, F | | | | | |
Expenses before reductions | 2.14% | 2.19% | 2.35% | 2.55% | 2.87% |
Expenses net of fee waivers, if any | 2.14% | 2.18% | 2.20% | 2.20% | 2.25% |
Expenses net of all reductions | 2.14% | 2.17% | 2.19% | 2.18% | 2.23% |
Net investment income (loss) | .04% | .05% | .24% | .17% | (.01)% |
Supplemental Data | | | | | |
Net assets, end of period (000 omitted) | $ 1,404 | $ 1,579 | $ 1,116 | $ 473 | $ 581 |
Portfolio turnover rateE | 27% | 32% | 32% | 68% | 87% |
A Total returns would have been lower if certain expenses had not been reduced during the applicable periods shown.
B Total returns do not include the effect of the contingent deferred sales charge.
C Calculated based on average shares outstanding during the period.
D Fees and expenses of any underlying Fidelity Central Funds are not included in the Fund's expense ratio. The Fund indirectly bears its proportionate share of the expenses of any underlying Fidelity Central Funds.
E Amount does not include the portfolio activity of any underlying Fidelity Central Funds.
F Expense ratios reflect operating expenses of the class. Expenses before reductions do not reflect amounts reimbursed by the investment adviser or reductions from brokerage service arrangements or reductions from other expense offset arrangements and do not represent the amount paid by the class during periods when reimbursements or reductions occur. Expenses net of fee waivers reflect expenses after reimbursement by the investment adviser but prior to reductions from brokerage service arrangements or other expense offset arrangements. Expenses net of all reductions represent the net expenses paid by the class.
G Amount represents less than $.01 per share.
See accompanying notes which are an integral part of the financial statements.
Annual Report
Financial Highlights - Class C
Years ended October 31, | 2014 | 2013 | 2012 | 2011 | 2010 |
Selected Per-Share Data | | | | | |
Net asset value, beginning of period | $ 10.69 | $ 8.84 | $ 8.03 | $ 8.34 | $ 6.98 |
Income from Investment Operations | | | | | |
Net investment income (loss) C | .01 | .01 | .02 | .01 | -G |
Net realized and unrealized gain (loss) | .18 | 1.87 | .80 | (.31) | 1.38 |
Total from investment operations | .19 | 1.88 | .82 | (.30) | 1.38 |
Distributions from net investment income | - | (.02) | (.01) | (.01) | - |
Distributions from net realized gain | (.01) | (.01) | (.01) | (.01) | (.02) |
Total distributions | (.01) | (.03) | (.01)I | (.01)H | (.02) |
Redemption fees added to paid in capital C, G | - | - | - | - | - |
Net asset value, end of period | $ 10.87 | $ 10.69 | $ 8.84 | $ 8.03 | $ 8.34 |
Total ReturnA, B | 1.77% | 21.29% | 10.27% | (3.57)% | 19.82% |
Ratios to Average Net Assets D, F | | | | | |
Expenses before reductions | 2.12% | 2.19% | 2.33% | 2.52% | 2.89% |
Expenses net of fee waivers, if any | 2.12% | 2.18% | 2.20% | 2.20% | 2.25% |
Expenses net of all reductions | 2.12% | 2.17% | 2.19% | 2.18% | 2.24% |
Net investment income (loss) | .06% | .05% | .24% | .17% | (.01)% |
Supplemental Data | | | | | |
Net assets, end of period (000 omitted) | $ 32,737 | $ 17,196 | $ 5,648 | $ 2,767 | $ 1,261 |
Portfolio turnover rateE | 27% | 32% | 32% | 68% | 87% |
A Total returns would have been lower if certain expenses had not been reduced during the applicable periods shown.
B Total returns do not include the effect of the contingent deferred sales charge.
C Calculated based on average shares outstanding during the period.
D Fees and expenses of any underlying Fidelity Central Funds are not included in the Fund's expense ratio. The Fund indirectly bears its proportionate share of the expenses of any underlying Fidelity Central Funds.
E Amount does not include the portfolio activity of any underlying Fidelity Central Funds.
F Expense ratios reflect operating expenses of the class. Expenses before reductions do not reflect amounts reimbursed by the investment adviser or reductions from brokerage service arrangements or reductions from other expense offset arrangements and do not represent the amount paid by the class during periods when reimbursements or reductions occur. Expenses net of fee waivers reflect expenses after reimbursement by the investment adviser but prior to reductions from brokerage service arrangements or other expense offset arrangements. Expenses net of all reductions represent the net expenses paid by the class.
G Amount represents less than $.01 per share.
H Total distributions of $.01 per share is comprised of distributions from net investment income of $.008 and distributions from net realized gain of $.005 per share.
I Total distributions of $.01 per share is comprised of distributions from net investment income of $.007 and distributions from net realized gain of $.006 per share.
See accompanying notes which are an integral part of the financial statements.
Annual Report
Financial Highlights - International Growth
Years ended October 31, | 2014 | 2013 | 2012 | 2011 | 2010 |
Selected Per-Share Data | | | | | |
Net asset value, beginning of period | $ 10.84 | $ 8.95 | $ 8.12 | $ 8.40 | $ 7.02 |
Income from Investment Operations | | | | | |
Net investment income (loss) B | .13 | .11 | .11 | .10 | .07 |
Net realized and unrealized gain (loss) | .19 | 1.88 | .81 | (.30) | 1.39 |
Total from investment operations | .32 | 1.99 | .92 | (.20) | 1.46 |
Distributions from net investment income | (.05) | (.10) | (.08) | (.07) | (.06) |
Distributions from net realized gain | (.01) | (.01) | (.01) | (.01) | (.03) |
Total distributions | (.06) | (.10)H | (.09) | (.08) | (.08)G |
Redemption fees added to paid in capital B,F | - | - | - | - | - |
Net asset value, end of period | $ 11.10 | $ 10.84 | $ 8.95 | $ 8.12 | $ 8.40 |
Total ReturnA | 2.96% | 22.48% | 11.41% | (2.47)% | 20.97% |
Ratios to Average Net Assets C, E | | | | | |
Expenses before reductions | 1.04% | 1.13% | 1.28% | 1.52% | 1.89% |
Expenses net of fee waivers, if any | 1.04% | 1.13% | 1.20% | 1.20% | 1.25% |
Expenses net of all reductions | 1.04% | 1.11% | 1.19% | 1.18% | 1.23% |
Net investment income (loss) | 1.14% | 1.11% | 1.24% | 1.17% | .99% |
Supplemental Data | | | | | |
Net assets, end of period (000 omitted) | $ 635,607 | $ 430,914 | $ 149,526 | $ 53,437 | $ 28,454 |
Portfolio turnover rateD | 27% | 32% | 32% | 68% | 87% |
A Total returns would have been lower if certain expenses had not been reduced during the applicable periods shown.
B Calculated based on average shares outstanding during the period.
C Fees and expenses of any underlying Fidelity Central Funds are not included in the Fund's expense ratio. The Fund indirectly bears its proportionate share of the expenses of any underlying Fidelity Central Funds.
D Amount does not include the portfolio activity of any underlying Fidelity Central Funds.
E Expense ratios reflect operating expenses of the class. Expenses before reductions do not reflect amounts reimbursed by the investment adviser or reductions from brokerage service arrangements or reductions from other expense offset arrangements and do not represent the amount paid by the class during periods when reimbursements or reductions occur. Expenses net of fee waivers reflect expenses after reimbursement by the investment adviser but prior to reductions from brokerage service arrangements or other expense offset arrangements. Expenses net of all reductions represent the net expenses paid by the class.
F Amount represents less than $.01 per share.
G Total distributions of $.08 per share is comprised of distributions from net investment income of $.057 and distributions from net realized gain of $.025 per share.
H Total distributions of $.10 per share is comprised of distributions from net investment income of $.097 and distributions from net realized gain of $.005 per share.
See accompanying notes which are an integral part of the financial statements.
Annual Report
Financial Highlights - Institutional Class
Years ended October 31, | 2014 | 2013 | 2012 | 2011 | 2010 |
Selected Per-Share Data | | | | | |
Net asset value, beginning of period | $ 10.84 | $ 8.94 | $ 8.12 | $ 8.40 | $ 7.02 |
Income from Investment Operations | | | | | |
Net investment income (loss) B | .13 | .11 | .10 | .10 | .07 |
Net realized and unrealized gain (loss) | .18 | 1.90 | .81 | (.30) | 1.39 |
Total from investment operations | .31 | 2.01 | .91 | (.20) | 1.46 |
Distributions from net investment income | (.06) | (.10) | (.08) | (.07) | (.06) |
Distributions from net realized gain | (.01) | (.01) | (.01) | (.01) | (.03) |
Total distributions | (.07) | (.11) | (.09) | (.08) | (.08)G |
Redemption fees added to paid in capital B,F | - | - | - | - | - |
Net asset value, end of period | $ 11.08 | $ 10.84 | $ 8.94 | $ 8.12 | $ 8.40 |
Total ReturnA | 2.84% | 22.66% | 11.28% | (2.47)% | 20.97% |
Ratios to Average Net Assets C, E | | | | | |
Expenses before reductions | 1.04% | 1.11% | 1.27% | 1.50% | 1.92% |
Expenses net of fee waivers, if any | 1.04% | 1.11% | 1.20% | 1.20% | 1.25% |
Expenses net of all reductions | 1.04% | 1.09% | 1.19% | 1.18% | 1.23% |
Net investment income (loss) | 1.14% | 1.13% | 1.24% | 1.17% | .99% |
Supplemental Data | | | | | |
Net assets, end of period (000 omitted) | $ 121,554 | $ 38,771 | $ 3,992 | $ 493 | $ 113 |
Portfolio turnover rateD | 27% | 32% | 32% | 68% | 87% |
A Total returns would have been lower if certain expenses had not been reduced during the applicable periods shown.
B Calculated based on average shares outstanding during the period.
C Fees and expenses of any underlying Fidelity Central Funds are not included in the Fund's expense ratio. The Fund indirectly bears its proportionate share of the expenses of any underlying Fidelity Central Funds.
D Amount does not include the portfolio activity of any underlying Fidelity Central Funds.
E Expense ratios reflect operating expenses of the class. Expenses before reductions do not reflect amounts reimbursed by the investment adviser or reductions from brokerage service arrangements or reductions from other expense offset arrangements and do not represent the amount paid by the class during periods when reimbursements or reductions occur. Expenses net of fee waivers reflect expenses after reimbursement by the investment adviser but prior to reductions from brokerage service arrangements or other expense offset arrangements. Expenses net of all reductions represent the net expenses paid by the class.
F Amount represents less than $.01 per share.
G Total distributions of $.08 per share is comprised of distributions from net investment income of $.057 and distributions from net realized gain of $.025 per share.
See accompanying notes which are an integral part of the financial statements.
Annual Report
Financial Highlights - Class Z
Years ended October 31, | 2014 | 2013 G |
Selected Per-Share Data | | |
Net asset value, beginning of period | $ 10.84 | $ 10.26 |
Income from Investment Operations | | |
Net investment income (loss) D | .14 | .02 |
Net realized and unrealized gain (loss) | .19 | .56 |
Total from investment operations | .33 | .58 |
Distributions from net investment income | (.06) | - |
Distributions from net realized gain | (.01) | - |
Total distributions | (.07) | - |
Redemption fees added to paid in capital D,I | - | - |
Net asset value, end of period | $ 11.10 | $ 10.84 |
Total ReturnB, C | 3.07% | 5.65% |
Ratios to Average Net Assets E, H | | |
Expenses before reductions | .88% | .94%A |
Expenses net of fee waivers, if any | .88% | .94%A |
Expenses net of all reductions | .88% | .93%A |
Net investment income (loss) | 1.30% | .65%A |
Supplemental Data | | |
Net assets, end of period (000 omitted) | $ 104 | $ 106 |
Portfolio turnover rateF | 27% | 32% |
A Annualized
B Total returns for periods of less than one year are not annualized.
C Total returns would have been lower if certain expenses had not been reduced during the applicable periods shown.
D Calculated based on average shares outstanding during the period.
E Fees and expenses of any underlying Fidelity Central Funds are not included in the Fund's expense ratio. The Fund indirectly bears its proportionate share of the expenses of any underlying Fidelity Central Funds.
F Amount does not include the portfolio activity of any underlying Fidelity Central Funds.
G For the period August 13, 2013 (commencement of sale of shares) to October 31, 2013.
H Expense ratios reflect operating expenses of the class. Expenses before reductions do not reflect amounts reimbursed by the investment adviser or reductions from brokerage service arrangements or reductions from other expense offset arrangements and do not represent the amount paid by the class during periods when reimbursements or reductions occur. Expense ratios before reductions for start-up periods may not be representative of longer-term operating periods. Expenses net of fee waivers reflect expenses after reimbursement by the investment adviser but prior to reductions from brokerage service arrangements or other expense offset arrangements. Expenses net of all reductions represent the net expenses paid by the class.
I Amount represents less than $.01 per share.
See accompanying notes which are an integral part of the financial statements.
Annual Report
Notes to Financial Statements
For the period ended October 31, 2014
1. Organization.
Fidelity International Growth Fund (the Fund) is a fund of Fidelity Investment Trust (the Trust) and is authorized to issue an unlimited number of shares. The Trust is registered under the Investment Company Act of 1940, as amended (the 1940 Act), as an open-end management investment company organized as a Massachusetts business trust. The Fund offers Class A, Class T, Class C, International Growth, Institutional Class and Class Z shares, each of which, along with Class B shares, has equal rights as to assets and voting privileges. Class B shares are closed to new accounts and additional purchases, except for exchanges and reinvestments. Each class has exclusive voting rights with respect to matters that affect that class. Class B shares will automatically convert to Class A shares after a holding period of seven years from the initial date of purchase.
2. Investments in Fidelity Central Funds.
The Fund invests in Fidelity Central Funds, which are open-end investment companies generally available only to other investment companies and accounts managed by the investment adviser and its affiliates. The Fund's Schedule of Investments lists each of the Fidelity Central Funds held as of period end, if any, as an investment of the Fund, but does not include the underlying holdings of each Fidelity Central Fund. As an Investing Fund, the Fund indirectly bears its proportionate share of the expenses of the underlying Fidelity Central Funds.
The Money Market Central Funds seek preservation of capital and current income and are managed by Fidelity Investments Money Management, Inc. (FIMM), an affiliate of the investment adviser. Annualized expenses of the Money Market Central Funds as of their most recent shareholder report date are less than .01%.
A complete unaudited list of holdings for each Fidelity Central Fund is available upon request or at the Securities and Exchange Commission (the SEC) website at www.sec.gov. In addition, the financial statements of the Fidelity Central Funds, which are not covered by the Fund's Report of Independent Registered Public Accounting Firm, are available on the SEC website or upon request.
3. Significant Accounting Policies.
The financial statements have been prepared in conformity with accounting principles generally accepted in the United States of America (GAAP), which require management to make certain estimates and assumptions at the date of the financial statements. Actual results could differ from those estimates. Subsequent events, if any, through the date that the financial statements were issued have been evaluated in the preparation of the financial statements. The following summarizes the significant accounting policies of the Fund:
Annual Report
3. Significant Accounting Policies - continued
Investment Valuation. Investments are valued as of 4:00 p.m. Eastern time on the last calendar day of the period. In accordance with valuation policies and procedures approved by the Board of Trustees (the Board), the Fund attempts to obtain prices from one or more third party pricing vendors or brokers to value its investments. When current market prices, quotations or currency exchange rates are not readily available or reliable, investments will be fair valued in good faith by the Fidelity Management & Research Company (FMR) Fair Value Committee (the Committee), in accordance with procedures adopted by the Board. Factors used in determining fair value vary by investment type and may include market or investment specific events. The frequency with which these procedures are used cannot be predicted and they may be utilized to a significant extent. The Committee oversees the Fund's valuation policies and procedures and is responsible for approving and reporting to the Board all fair value determinations.
The Fund categorizes the inputs to valuation techniques used to value its investments into a disclosure hierarchy consisting of three levels as shown below:
Level 1 - quoted prices in active markets for identical investments
Level 2 - other significant observable inputs (including quoted prices for similar investments, interest rates, prepayment speeds, etc.)
Level 3 - unobservable inputs (including the Fund's own assumptions based on the best information available)
Valuation techniques used to value the Fund's investments by major category are as follows:
Equity securities, including restricted securities, for which market quotations are readily available, are valued at the last reported sale price or official closing price as reported by a third party pricing vendor on the primary market or exchange on which they are traded and are categorized as Level 1 in the hierarchy. In the event there were no sales during the day or closing prices are not available, securities are valued at the last quoted bid price or may be valued using the last available price and are generally categorized as Level 2 in the hierarchy. For foreign equity securities, when market or security specific events arise, comparisons to the valuation of American Depositary Receipts (ADRs), futures contracts, Exchange-Traded Funds (ETFs) and certain indexes as well as quoted prices for similar securities may be used and would be categorized as Level 2 in the hierarchy. Utilizing these techniques may result in transfers between Level 1 and Level 2. For equity securities, including restricted securities, where observable inputs are limited, assumptions about market activity and risk are used and these securities may be categorized as Level 3 in the hierarchy.
Annual Report
Notes to Financial Statements - continued
3. Significant Accounting Policies - continued
Investment Valuation - continued
Investments in open-end mutual funds, including the Fidelity Central Funds, are valued at their closing net asset value (NAV) each business day and are categorized as Level 1 in the hierarchy.
Changes in valuation techniques may result in transfers in or out of an assigned level within the disclosure hierarchy. The aggregate value of investments by input level, as of October 31, 2014, including information on transfers between Levels 1 and 2, is included at the end of the Fund's Schedule of Investments.
Foreign Currency. The Fund may use foreign currency contracts to facilitate transactions in foreign-denominated securities. Gains and losses from these transactions may arise from changes in the value of the foreign currency or if the counterparties do not perform under the contracts' terms.
Foreign-denominated assets, including investment securities, and liabilities are translated into U.S. dollars at the exchange rates at period end. Purchases and sales of investment securities, income and dividends received and expenses denominated in foreign currencies are translated into U.S. dollars at the exchange rate in effect on the transaction date.
The effects of exchange rate fluctuations on investments are included with the net realized and unrealized gain (loss) on investment securities. Other foreign currency transactions resulting in realized and unrealized gain (loss) are disclosed separately.
Investment Transactions and Income. For financial reporting purposes, the Fund's investment holdings and NAV include trades executed through the end of the last business day of the period. The NAV per share for processing shareholder transactions is calculated as of the close of business of the New York Stock Exchange (NYSE), normally 4:00 p.m. Eastern time and includes trades executed through the end of the prior business day. Gains and losses on securities sold are determined on the basis of identified cost and may include proceeds received from litigation. Dividend income is recorded on the ex-dividend date, except for certain dividends from foreign securities where the ex-dividend date may have passed, which are recorded as soon as the Fund is informed of the ex-dividend date. Non-cash dividends included in dividend income, if any, are recorded at the fair market value of the securities received. Income and capital gain distributions from Fidelity Central Funds, if any, are recorded on the ex-dividend date. Investment income is recorded net of foreign taxes withheld where recovery of such taxes is uncertain.
Annual Report
3. Significant Accounting Policies - continued
Class Allocations and Expenses. Investment income, realized and unrealized capital gains and losses, common expenses of the Fund, and certain fund-level expense reductions, if any, are allocated daily on a pro-rata basis to each class based on the relative net assets of each class to the total net assets of the Fund. Each class differs with respect to transfer agent and distribution and service plan fees incurred. Certain expense reductions may also differ by class. For the reporting period, the allocated portion of income and expenses to each class as a percent of its average net assets may vary due to the timing of recording these transactions in relation to fluctuating net assets of the classes. Expenses directly attributable to a fund are charged to that fund. Expenses attributable to more than one fund are allocated among the respective funds on the basis of relative net assets or other appropriate methods. Expense estimates are accrued in the period to which they relate and adjustments are made when actual amounts are known.
Income Tax Information and Distributions to Shareholders. Each year, the Fund intends to qualify as a regulated investment company under Subchapter M of the Internal Revenue Code, including distributing substantially all of its taxable income and realized gains. As a result, no provision for U.S. Federal income taxes is required. As of October 31, 2014, the Fund did not have any unrecognized tax benefits in the financial statements; nor is the Fund aware of any tax positions for which it is reasonably possible that the total amounts of unrecognized tax benefits will significantly change in the next twelve months. The Fund files a U.S. federal tax return, in addition to state and local tax returns as required. The Fund's federal income tax returns are subject to examination by the Internal Revenue Service (IRS) for a period of three fiscal years after they are filed. State and local tax returns may be subject to examination for an additional fiscal year depending on the jurisdiction. Foreign taxes are provided for based on the Fund's understanding of the tax rules and rates that exist in the foreign markets in which it invests. The Fund is subject to a tax imposed on capital gains by certain countries in which it invests. An estimated deferred tax liability for net unrealized appreciation on the applicable securities is included in Other payables and accrued expenses on the Statement of Assets & Liabilities.
Distributions are declared and recorded on the ex-dividend date. Income dividends and capital gain distributions are declared separately for each class. Income and capital gain distributions are determined in accordance with income tax regulations, which may differ from GAAP. In addition, the Fund claimed a portion of the payment made to redeeming shareholders as a distribution for income tax purposes.
Capital accounts within the financial statements are adjusted for permanent book-tax differences. These adjustments have no impact on net assets or the results of operations. Capital accounts are not adjusted for temporary book-tax differences which will reverse in a subsequent period.
Annual Report
Notes to Financial Statements - continued
3. Significant Accounting Policies - continued
Income Tax Information and Distributions to Shareholders - continued
Book-tax differences are primarily due to foreign currency transactions, passive foreign investment companies (PFIC), partnerships, capital loss carryforwards and losses deferred due to wash sales.
The federal tax cost of investment securities and unrealized appreciation (depreciation) as of period end were as follows:
Gross unrealized appreciation | $ 110,999,674 |
Gross unrealized depreciation | (22,777,849) |
Net unrealized appreciation (depreciation) on securities | $ 88,221,825 |
| |
Tax Cost | $ 854,018,108 |
The tax-based components of distributable earnings as of period end were as follows:
Undistributed ordinary income | $ 6,829,762 |
Capital loss carryforward | $ (8,517,174) |
Net unrealized appreciation (depreciation) on securities and other investments | $ 88,155,149 |
Capital loss carryforwards are only available to offset future capital gains of the Fund to the extent provided by regulations and may be limited. Under the Regulated Investment Company Modernization Act of 2010 (the Act), the Fund is permitted to carry forward capital losses incurred in taxable years beginning after December 22, 2010 for an unlimited period and such capital losses are required to be used prior to any losses that expire. The capital loss carryforward information presented below, including any applicable limitation, is estimated as of fiscal period end and is subject to adjustment.
No expiration | |
Short-term | (7,236,154) |
Long-term | (1,281,020) |
Total no expiration | (8,517,174) |
The tax character of distributions paid was as follows:
| October 31, 2014 | October 31, 2013 |
Ordinary Income | $ 2,592,642 | $ 2,195,105 |
Long-term Capital Gains | 513,442 | - |
Total | $ 3,106,084 | $ 2,195,105 |
Annual Report
3. Significant Accounting Policies - continued
Short-Term Trading (Redemption) Fees. Shares held by investors in the Fund less than 30 days may have been subject to a redemption fee equal to 1.00% of the NAV of shares redeemed. All redemption fees, which reduce the proceeds of the shareholder redemption, are retained by the Fund and accounted for as an addition to paid in capital.
New Accounting Pronouncement. In June 2014, the Financial Accounting Standards Board issued Accounting Standard Update No. 2014-11, Repurchase-to-Maturity Transactions, Repurchase Financings, and Disclosures. The Update amends the accounting for certain repurchase agreements and expands disclosure requirements for reverse repurchase agreements, securities lending and other similar transactions. The disclosure requirements are effective for annual and interim reporting periods beginning after December 15, 2014. Management is currently evaluating the impact of the Update on the Fund's financial statements and related disclosures.
4. Purchases and Sales of Investments.
Purchases and sales of securities, other than short-term securities, aggregated $523,591,304 and $200,715,697, respectively.
5. Fees and Other Transactions with Affiliates.
Management Fee. Fidelity Management & Research Company and its affiliates provide the Fund with investment management related services for which the Fund pays a monthly management fee. The management fee is the sum of an individual fund fee rate that is based on an annual rate of .45% of the Fund's average net assets and an annualized group fee rate that averaged .25% during the period. The group fee rate is based upon the average net assets of all the mutual funds advised by the investment adviser, including any mutual funds previously advised by the investment adviser that are currently advised by Fidelity SelectCo, LLC, an affiliate of the investment adviser. The group fee rate decreases as assets under management increase and increases as assets under management decrease. In addition, the management fee is subject to a performance adjustment (up to a maximum of ± .20% of the Fund's average net assets over a 36 month performance period). The upward or downward adjustment to the management fee is based on the relative investment performance of International Growth as compared to its benchmark index, the MSCI EAFE Growth Index, over the same 36 month performance period. For the reporting period, the total annual management fee rate, including the performance adjustment, was .75% of the Fund's average net assets. The performance adjustment included in the management fee rate may be higher or lower than the maximum performance adjustment rate due to the difference between the average net assets for the reporting and performance periods.
Annual Report
Notes to Financial Statements - continued
5. Fees and Other Transactions with Affiliates - continued
Distribution and Service Plan Fees. In accordance with Rule 12b-1 of the 1940 Act, the Fund has adopted separate Distribution and Service Plans for each class of shares. Certain classes pay Fidelity Distributors Corporation (FDC), an affiliate of the investment adviser, separate Distribution and Service Fees, each of which is based on an annual percentage of each class' average net assets. In addition, FDC may pay financial intermediaries for selling shares of the Fund and providing shareholder support services. For the period, the Distribution and Service Fee rates, total fees and amounts retained by FDC were as follows:
| Distribution
Fee | Service
Fee | Total Fees | Retained
by FDC |
Class A | -% | .25% | $ 254,598 | $ 7,801 |
Class T | .25% | .25% | 131,110 | - |
Class B | .75% | .25% | 15,512 | 11,650 |
Class C | .75% | .25% | 276,397 | 95,761 |
| | | $ 677,617 | $ 115,212 |
Sales Load. FDC may receive a front-end sales charge of up to 5.75% for selling Class A shares and 3.50% for selling Class T shares, some of which is paid to financial intermediaries for selling shares of the Fund. Depending on the holding period, FDC may receive contingent deferred sales charges levied on Class A, Class T, Class B, and Class C redemptions. The deferred sales charges range from 5.00% to 1.00% for Class B shares, 1.00% for Class C shares, 1.00% for certain purchases of Class A shares and .25% for certain purchases of Class T shares.
For the period, sales charge amounts retained by FDC were as follows:
| Retained
by FDC |
Class A | $ 86,435 |
Class T | 14,136 |
Class B* | 528 |
Class C* | 3,947 |
| $ 105,046 |
* When Class B and Class C shares are initially sold, FDC pays commissions from its own resources to financial intermediaries through which the sales are made.
Transfer Agent Fees. Fidelity Investments Institutional Operations Company, Inc., (FIIOC), an affiliate of the investment adviser, is the transfer, dividend disbursing and shareholder servicing agent for each class of the Fund. FIIOC receives account fees and asset-based fees that vary according to the account size and type of account of the
Annual Report
5. Fees and Other Transactions with Affiliates - continued
Transfer Agent Fees - continued
shareholders of the respective classes of the Fund, except for Class Z. FIIOC receives an asset-based fee of Class Z's average net assets. FIIOC pays for typesetting, printing and mailing of shareholder reports, except proxy statements.
For the period, transfer agent fees for each class were as follows:
| Amount | % of
Class-Level Average
Net Assets |
Class A | $ 265,803 | .26 |
Class T | 81,975 | .31 |
Class B | 4,755 | .31 |
Class C | 79,887 | .29 |
International Growth | 1,083,784 | .20 |
Institutional Class | 171,407 | .21 |
Class Z | 50 | .05 |
| $ 1,687,661 | |
Accounting and Security Lending Fees. Fidelity Service Company, Inc. (FSC), an affiliate of the investment adviser, maintains the Fund's accounting records. The accounting fee is based on the level of average net assets for each month. Under a separate contract, FSC administers the security lending program. The security lending fee is based on the number and duration of lending transactions.
Brokerage Commissions. The Fund placed a portion of its portfolio transactions with brokerage firms which are affiliates of the investment adviser. Brokerage commissions are included in net realized gain (loss) and change in net unrealized appreciation (depreciation) in the Statement of Operations. The commissions paid to these affiliated firms were $1,309 for the period.
Other. During the period, the investment adviser reimbursed the Fund for certain losses in the amount of $4,581.
6. Committed Line of Credit.
The Fund participates with other funds managed by the investment adviser or an affiliate in a $4.25 billion credit facility (the "line of credit") to be utilized for temporary or emergency purposes to fund shareholder redemptions or for other short-term liquidity purposes. The Fund has agreed to pay commitment fees on its pro-rata portion of the line of credit, which amounted to $1,181 and is reflected in Miscellaneous expenses on the Statement of Operations. During the period, the Fund did not borrow on this line of credit.
Annual Report
Notes to Financial Statements - continued
7. Security Lending.
The Fund lends portfolio securities through a lending agent from time to time in order to earn additional income. For equity securities, a lending agent is used and may loan securities to certain qualified borrowers, including Fidelity Capital Markets (FCM), a broker-dealer affiliated with the Fund. On the settlement date of the loan, the Fund receives collateral (in the form of U.S. Treasury obligations, letters of credit and/or cash) against the loaned securities and maintains collateral in an amount not less than 100% of the market value of the loaned securities during the period of the loan. The market value of the loaned securities is determined at the close of business of the Fund and any additional required collateral is delivered to the Fund on the next business day. If the borrower defaults on its obligation to return the securities loaned because of insolvency or other reasons, the Fund may apply collateral received from the borrower against the obligation. The Fund may experience delays and costs in recovering the securities loaned. Any cash collateral received is invested in the Fidelity Securities Lending Cash Central Fund. The value of loaned securities and cash collateral at period end are disclosed on the Fund's Statement of Assets and Liabilities. The value of securities loaned to FCM at period end was $819,854. Security lending income represents the income earned on investing cash collateral, less rebates paid to borrowers and any lending agent fees associated with the loan, plus any premium payments received for lending certain types of securities. Security lending income is presented in the Statement of Operations as a component of income from Fidelity Central Funds. Total security lending income during the period amounted to $325,646, including $14,631 from securities loaned to FCM.
8. Expense Reductions.
Commissions paid to certain brokers with whom the investment adviser, or its affiliates, places trades on behalf of the Fund include an amount in addition to trade execution, which may be rebated back to the Fund to offset certain expenses. This amount totaled $6,405 for the period. In addition, through arrangements with the Fund's custodian, credits realized as a result of uninvested cash balances were used to reduce the Fund's expenses. During the period, these credits reduced the Fund's custody expenses by $37.
In addition, the investment adviser reimbursed a portion of the Fund's operating expenses during the period in the amount of $4,248.
Annual Report
9. Distributions to Shareholders.
Distributions to shareholders of each class were as follows:
Years ended October 31, | 2014 | 2013 |
From net investment income | | |
Class A | $ 253,092 | $ 226,330 |
Class T | 40,595 | 86,155 |
Class B | - | 4,290 |
Class C | - | 14,481 |
International Growth | 2,051,403 | 1,698,830 |
Institutional Class | 246,949 | 51,250 |
Class Z | 604 | - |
Total | $ 2,592,643 | $ 2,081,336 |
From net realized gain | | |
Class A | $ 66,995 | $ 13,472 |
Class T | 20,298 | 6,243 |
Class B | 1,337 | 631 |
Class C | 16,479 | 3,291 |
International Growth | 369,252 | 87,569 |
Institutional Class | 38,992 | 2,563 |
Class Z | 88 | - |
Total | $ 513,441 | $ 113,769 |
10. Share Transactions.
Share transactions for each class were as follows and may contain automatic conversions between classes or exchanges between funds:
| Shares | Dollars |
Years ended October 31, | 2014 | 2013A | 2014 | 2013A |
Class A | | | | |
Shares sold | 6,584,484 | 5,907,169 | $ 72,326,606 | $ 58,500,264 |
Reinvestment of distributions | 27,068 | 24,178 | 291,793 | 218,566 |
Shares redeemed | (2,724,911) | (1,466,703) | (30,099,985) | (14,226,261) |
Net increase (decrease) | 3,886,641 | 4,464,644 | $ 42,518,414 | $ 44,492,569 |
Class T | | | | |
Shares sold | 834,072 | 1,144,706 | $ 9,114,198 | $ 11,429,141 |
Reinvestment of distributions | 5,459 | 10,086 | 58,733 | 91,076 |
Shares redeemed | (585,464) | (206,178) | (6,459,248) | (2,020,899) |
Net increase (decrease) | 254,067 | 948,614 | $ 2,713,683 | $ 9,499,318 |
Class B | | | | |
Shares sold | 35,020 | 70,442 | $ 380,789 | $ 702,618 |
Reinvestment of distributions | 123 | 531 | 1,323 | 4,806 |
Shares redeemed | (53,583) | (49,437) | (587,919) | (483,935) |
Net increase (decrease) | (18,440) | 21,536 | $ (205,807) | $ 223,489 |
Annual Report
Notes to Financial Statements - continued
10. Share Transactions - continued
| Shares | Dollars |
Years ended October 31, | 2014 | 2013A | 2014 | 2013A |
Class C | | | | |
Shares sold | 1,827,859 | 1,392,365 | $ 19,884,401 | $ 13,520,584 |
Reinvestment of distributions | 1,498 | 1,911 | 16,049 | 17,237 |
Shares redeemed | (426,678) | (424,469) | (4,637,384) | (4,120,400) |
Net increase (decrease) | 1,402,679 | 969,807 | $ 15,263,066 | $ 9,417,421 |
International Growth | | | | |
Shares sold | 27,835,093 | 29,198,608 | $ 307,440,711 | $ 290,678,738 |
Reinvestment of distributions | 197,948 | 192,126 | 2,143,781 | 1,742,585 |
Shares redeemed | (10,494,762) | (6,365,570) | (115,997,211) | (62,814,771) |
Net increase (decrease) | 17,538,279 | 23,025,164 | $ 193,587,281 | $ 229,606,552 |
Institutional Class | | | | |
Shares sold | 10,292,704 | 3,568,741 | $ 113,864,505 | $ 35,951,935 |
Reinvestment of distributions | 24,180 | 5,682 | 261,623 | 51,476 |
Shares redeemed | (2,927,192) | (443,392) | (31,428,962) | (4,427,602) |
Net increase (decrease) | 7,389,692 | 3,131,031 | $ 82,697,166 | $ 31,575,809 |
Class Z | | | | |
Shares sold | - | 9,747 | $ - | $ 100,000 |
Reinvestment of distributions | 64 | - | 692 | - |
Shares redeemed | (475) | - | (5,267) | - |
Net increase (decrease) | (411) | 9,747 | $ (4,575) | $ 100,000 |
A Share transactions for Class Z are for the period August 13, 2013 (commencement of sale of shares) to October 31, 2013.
11. Other.
The Fund's organizational documents provide former and current trustees and officers with a limited indemnification against liabilities arising in connection with the performance of their duties to the Fund. In the normal course of business, the Fund may also enter into contracts that provide general indemnifications. The Fund's maximum exposure under these arrangements is unknown as this would be dependent on future claims that may be made against the Fund. The risk of material loss from such claims is considered remote.
Annual Report
To the Trustees of Fidelity Investment Trust and the Shareholders of Fidelity International Growth Fund:
In our opinion, the accompanying statement of assets and liabilities, including the schedule of investments, and the related statements of operations and of changes in net assets and the financial highlights present fairly, in all material respects, the financial position of Fidelity International Growth Fund (a fund of Fidelity Investment Trust) at October 31, 2014, the results of its operations for the year then ended, the changes in its net assets for each of the two years in the period then ended and the financial highlights for each of the periods indicated, in conformity with accounting principles generally accepted in the United States of America. These financial statements and financial highlights (hereafter referred to as "financial statements") are the responsibility of the Fidelity International Growth Fund's management. Our responsibility is to express an opinion on these financial statements based on our audits. We conducted our audits of these financial statements in accordance with the standards of the Public Company Accounting Oversight Board (United States). Those standards require that we plan and perform the audit to obtain reasonable assurance about whether the financial statements are free of material misstatement. An audit includes examining, on a test basis, evidence supporting the amounts and disclosures in the financial statements, assessing the accounting principles used and significant estimates made by management, and evaluating the overall financial statement presentation. We believe that our audits, which included confirmation of securities at October 31, 2014 by correspondence with the custodian and brokers, provide a reasonable basis for our opinion.
PricewaterhouseCoopers LLP
Boston, Massachusetts
December 18, 2014
Annual Report
The Trustees, Member of the Advisory Board, and officers of the trust and fund, as applicable, are listed below. The Board of Trustees governs the fund and is responsible for protecting the interests of shareholders. The Trustees are experienced executives who meet periodically throughout the year to oversee the fund's activities, review contractual arrangements with companies that provide services to the fund, oversee management of the risks associated with such activities and contractual arrangements, and review the fund's performance. Except for James C. Curvey, each of the Trustees oversees 174 funds. Mr. Curvey oversees 407 funds.
The Trustees hold office without limit in time except that (a) any Trustee may resign; (b) any Trustee may be removed by written instrument, signed by at least two-thirds of the number of Trustees prior to such removal; (c) any Trustee who requests to be retired or who has become incapacitated by illness or injury may be retired by written instrument signed by a majority of the other Trustees; and (d) any Trustee may be removed at any special meeting of shareholders by a two-thirds vote of the outstanding voting securities of the trust. Each Trustee who is not an interested person (as defined in the 1940 Act) of the trust and the fund (Independent Trustee), shall retire not later than the last day of the calendar year in which his or her 75th birthday occurs. The Independent Trustees may waive this mandatory retirement age policy with respect to individual Trustees. The officers and Advisory Board Member hold office without limit in time, except that any officer and Advisory Board Member may resign or may be removed by a vote of a majority of the Trustees at any regular meeting or any special meeting of the Trustees. Except as indicated, each individual has held the office shown or other offices in the same company for the past five years.
Experience, Skills, Attributes, and Qualifications of the Fund's Trustees. The Governance and Nominating Committee has adopted a statement of policy that describes the experience, qualifications, attributes, and skills that are necessary and desirable for potential Independent Trustee candidates (Statement of Policy). The Board believes that each Trustee satisfied at the time he or she was initially elected or appointed a Trustee, and continues to satisfy, the standards contemplated by the Statement of Policy. The Governance and Nominating Committee also engages professional search firms to help identify potential Independent Trustee candidates who have the experience, qualifications, attributes, and skills consistent with the Statement of Policy. From time to time, additional criteria based on the composition and skills of the current Independent Trustees, as well as experience or skills that may be appropriate in light of future changes to board composition, business conditions, and regulatory or other developments, have also been considered by the professional search firms and the Governance and Nominating Committee. In addition, the Board takes into account the Trustees' commitment and participation in Board and committee meetings, as well as their leadership of standing and ad hoc committees throughout their tenure.
In determining that a particular Trustee was and continues to be qualified to serve as a Trustee, the Board has considered a variety of criteria, none of which, in isolation, was controlling. The Board believes that, collectively, the Trustees have balanced and diverse experience, qualifications, attributes, and skills, which allow the Board to operate effectively in governing the fund and protecting the interests of shareholders. Information about the specific experience, skills, attributes, and qualifications of each Trustee, which in each case led to the Board's conclusion that the Trustee should serve (or continue to serve) as a trustee of the fund, is provided below.
Annual Report
Board Structure and Oversight Function. James C. Curvey is an interested person (as defined in the 1940 Act) and currently serves as Chairman. The Trustees have determined that an interested Chairman is appropriate and benefits shareholders because an interested Chairman has a personal and professional stake in the quality and continuity of services provided to the fund. Independent Trustees exercise their informed business judgment to appoint an individual of their choosing to serve as Chairman, regardless of whether the Trustee happens to be independent or a member of management. The Independent Trustees have determined that they can act independently and effectively without having an Independent Trustee serve as Chairman and that a key structural component for assuring that they are in a position to do so is for the Independent Trustees to constitute a substantial majority for the Board. The Independent Trustees also regularly meet in executive session. Ned C. Lautenbach serves as Chairman of the Independent Trustees and as such (i) acts as a liaison between the Independent Trustees and management with respect to matters important to the Independent Trustees and (ii) with management prepares agendas for Board meetings.
Fidelity funds are overseen by different Boards of Trustees. The fund's Board oversees Fidelity's equity and high income funds and another Board oversees Fidelity's investment-grade bond, money market, and asset allocation funds. The asset allocation funds may invest in Fidelity funds overseen by the fund's Board. The use of separate Boards, each with its own committee structure, allows the Trustees of each group of Fidelity funds to focus on the unique issues of the funds they oversee, including common research, investment, and operational issues. On occasion, the separate Boards establish joint committees to address issues of overlapping consequences for the Fidelity funds overseen by each Board.
The Trustees operate using a system of committees to facilitate the timely and efficient consideration of all matters of importance to the Trustees, the fund, and fund shareholders and to facilitate compliance with legal and regulatory requirements and oversight of the fund's activities and associated risks. The Board, acting through its committees, has charged FMR and its affiliates with (i) identifying events or circumstances the occurrence of which could have demonstrably adverse effects on the fund's business and/or reputation; (ii) implementing processes and controls to lessen the possibility that such events or circumstances occur or to mitigate the effects of such events or circumstances if they do occur; and (iii) creating and maintaining a system designed to evaluate continuously business and market conditions in order to facilitate the identification and implementation processes described in (i) and (ii) above. Because the day-to-day operations and activities of the fund are carried out by or through FMR, its affiliates and other service providers, the fund's exposure to risks is mitigated but not eliminated by the processes overseen by the Trustees. While each of the Board's committees has responsibility for overseeing different aspects of the fund's activities, oversight is exercised primarily through the Operations, Audit, and Compliance Committees. In addition, the Independent Trustees have worked with FMR to enhance the Board's oversight of investment and financial risks, legal and regulatory risks, technology risks, and operational risks, including the development of additional risk reporting to the Board. For example, a working group comprised of Independent Trustees and FMR has worked and continues to work to review the Fidelity funds' valuation-related activities, reporting and risk management. Appropriate personnel, including but not limited to the fund's Chief Compliance Officer (CCO), FMR's internal auditor, the independent accountants, the fund's Treasurer and portfolio management personnel, make periodic reports to the Board's committees, as appropriate, including an annual review of FMR's risk management program for the Fidelity funds. The responsibilities of each standing committee, including their oversight responsibilities, are described further under "Standing Committees of the Fund's Trustees."
Annual Report
Trustees and Officers - continued
The fund's Statement of Additional Information (SAI) includes more information about the Trustees. To request a free copy, call Fidelity at 1-877-208-0098.
Interested Trustees*:
Correspondence intended for each Trustee who is an interested person may be sent to Fidelity Investments, 245 Summer Street, Boston, Massachusetts 02210.
Name, Year of Birth; Principal Occupations and Other Relevant Experience+ |
James C. Curvey (1935) |
Year of Election or Appointment: 2007 Trustee Chairman of the Board of Trustees |
| Mr. Curvey also serves as Trustee of other Fidelity funds. Mr. Curvey is a Director of Fidelity Research & Analysis Co. (2009-present), and Vice Chairman (2007-present) and Director of FMR LLC. In addition, Mr. Curvey serves as an Overseer for the Boston Symphony Orchestra and a member of the board of Artis-Naples, Naples, Florida, and as a Trustee for Brewster Academy, Wolfeboro, New Hampshire. Previously, Mr. Curvey served as a Director of Fidelity Investments Money Management, Inc. (2009-2014), a Director of FMR (2007-2014), and a Director of FMR Co., Inc. (2007-2014). |
Charles S. Morrison (1960) |
Year of Election or Appointment: 2014 Trustee |
| Mr. Morrison also serves as Trustee of other funds. He serves as a Director of Fidelity Investments Money Management, Inc. (FIMM) (2014-present), Director of Fidelity SelectCo, LLC (2014-present), President, Asset Management (2014-present), and is an employee of Fidelity Investments. Previously, Mr. Morrison served as Vice President of Fidelity's Fixed Income and Asset Allocation Funds (2012-2014), President, Fixed Income (2011-2014), Vice President of Fidelity's Money Market Funds (2005-2009), President, Money Market Group Leader of FMR (2009), and Senior Vice President, Money Market Group of FMR (2004-2009). Mr. Morrison also served as Vice President of Fidelity's Bond Funds (2002-2005), certain Balanced Funds (2002-2005), and certain Asset Allocation Funds (2002-2007), and as Senior Vice President (2002-2005) of Fidelity's Bond Division. |
* Trustees have been determined to be "Interested Trustees" by virtue of, among other things, their affiliation with the trust or various entities under common control with FMR.
+ The information above includes each Trustee's principal occupation during the last five years and other information relating to the experience, attributes, and skills relevant to each Trustee's qualifications to serve as a Trustee, which led to the conclusion that each Trustee should serve as a Trustee for the fund.
Annual Report
Trustees and Officers - continued
Independent Trustees:
Correspondence intended for each Independent Trustee (that is, the Trustees other than the Interested Trustees) may be sent to Fidelity Investments, P.O. Box 55235, Boston, Massachusetts 02205-5235.
Name, Year of Birth; Principal Occupations and Other Relevant Experience+ |
Dennis J. Dirks (1948) |
Year of Election or Appointment: 2005 Trustee |
| Mr. Dirks also serves as Trustee of other Fidelity funds. Prior to his retirement in May 2003, Mr. Dirks was Chief Operating Officer and a member of the Board of The Depository Trust & Clearing Corporation (DTCC). He also served as President, Chief Operating Officer, and Board member of The Depository Trust Company (DTC) and President and Board member of the National Securities Clearing Corporation (NSCC). In addition, Mr. Dirks served as Chief Executive Officer and Board member of the Government Securities Clearing Corporation, Chief Executive Officer and Board member of the Mortgage-Backed Securities Clearing Corporation, as a Trustee and a member of the Finance Committee of Manhattan College (2005-2008), and as a Trustee and a member of the Finance Committee of AHRC of Nassau County (2006-2008). Mr. Dirks is a member of the Independent Directors Council (IDC) Governing Council (2010-present) and Board of Directors for The Brookville Center for Children's Services, Inc. (2009-present). |
Alan J. Lacy (1953) |
Year of Election or Appointment: 2008 Trustee |
| Mr. Lacy also serves as Trustee of other Fidelity funds. Mr. Lacy serves as Senior Adviser (2007-present) of Oak Hill Capital Partners, L.P. (private equity). Mr. Lacy also served as Chief Executive Officer (2000-2005) and Vice Chairman (2005-2006) of Sears Holdings Corporation and Sears, Roebuck and Co. (retail). In addition, Mr. Lacy serves as a member of the Board of Directors of Dave & Buster's Entertainment, Inc. (restaurant and entertainment complexes, 2010-present), Earth Fare, Inc. (retail grocery, 2012-present), The Hillman Companies, Inc. (hardware wholesalers, 2010-present), and Bristol-Myers Squibb Company (global pharmaceuticals, 2008-present). Mr. Lacy is a member of the Board of Trustees of The National Parks Conservation Association (2006-present). Previously, Mr. Lacy served as Chairman of the Board of Trustees of the National Parks Conservation Association (2008-2011) and as a member of the Board of Directors for the Western Union Company (global money transfer, 2006-2011). |
Ned C. Lautenbach (1944) |
Year of Election or Appointment: 2000 Trustee Chairman of the Independent Trustees |
| Mr. Lautenbach also serves as Trustee of other Fidelity funds. Mr. Lautenbach currently serves as the Lead Director of the Eaton Corporation Board of Directors (diversified industrial, 1997-present). Mr. Lautenbach is Chairman of the Board of Directors of the Philharmonic Center for the Arts in Naples, Florida (2012-present) and a member of the Council on Foreign Relations (1994-present). Previously, Mr. Lautenbach was a Partner/Advisory Partner at Clayton, Dubilier & Rice, LLC (private equity investment, 1998-2010), as well as a Director of Sony Corporation (2006-2007). |
Joseph Mauriello (1944) |
Year of Election or Appointment: 2008 Trustee |
| Mr. Mauriello also serves as Trustee of other Fidelity funds. Prior to his retirement in January 2006, Mr. Mauriello served in numerous senior management positions including Deputy Chairman and Chief Operating Officer (2004-2005), and Vice Chairman of Financial Services (2002-2004) of KPMG LLP US (professional services, 1965-2005). Mr. Mauriello currently serves as a member of the Board of Directors of XL Group plc. (global insurance and re-insurance, 2006-present). Previously, Mr. Mauriello served as a Director of the Hamilton Funds of the Bank of New York (2006-2007) and of Arcadia Resources Inc. (health care services and products, 2007-2012). |
Robert W. Selander (1950) |
Year of Election or Appointment: 2011 Trustee |
| Mr. Selander also serves as Trustee of other Fidelity funds. Previously, Mr. Selander served as a Member of the Advisory Board of other Fidelity funds (2011), and Executive Vice Chairman (2010), Chief Executive Officer (2009-2010), and President and Chief Executive Officer (1997-2009) of Mastercard, Inc. |
Cornelia M. Small (1944) |
Year of Election or Appointment: 2005 Trustee |
| Ms. Small also serves as Trustee of other Fidelity funds. Ms. Small is a member of the Board of Directors (2009-present) and Chair of the Investment Committee (2010-present) of the Teagle Foundation. Ms. Small also serves on the Investment Committee of the Berkshire Taconic Community Foundation (2008-present). Previously, Ms. Small served as Chairperson (2002-2008) and a member of the Investment Committee and Chairperson (2008-2012) and a member of the Board of Trustees of Smith College. In addition, Ms. Small served as Chief Investment Officer, Director of Global Equity Investments, and a member of the Board of Directors of Scudder, Stevens & Clark and Scudder Kemper Investments. |
William S. Stavropoulos (1939) |
Year of Election or Appointment: 2001 Trustee Vice Chairman of the Independent Trustees |
| Mr. Stavropoulos also serves as Trustee of other Fidelity funds. Mr. Stavropoulos serves as President and Founder of the Michigan Baseball Foundation, the Great Lakes Loons (2007-present). Mr. Stavropoulos is Chairman Emeritus of the Board of Directors of The Dow Chemical Company, where he previously served in numerous senior management positions, including President, CEO (1995-2000; 2002-2004), Chairman of the Executive Committee (2000-2006), and as a member of the Board of Directors (1990-2006). Currently, Mr. Stavropoulos is Chairman of the Board of Directors of Univar Inc. (global distributor of commodity and specialty chemicals), a Director of Teradata Corporation (data warehousing and technology solutions), and Maersk Inc. (industrial conglomerate), and a member of the Advisory Board for Metalmark Capital LLC (private equity investment, 2005-present). Mr. Stavropoulos is an operating advisor to Clayton, Dubilier & Rice, LLC (private equity investment). In addition, Mr. Stavropoulos is a member of the University of Notre Dame Advisory Council for the College of Science, a Trustee of the Rollin L. Gerstacker Foundation, and a Director of the Naples Philharmonic Center for the Arts. Previously, Mr. Stavropoulos served as a Director of Chemical Financial Corporation (bank holding company, 1993-2012) and Tyco International, Ltd. (multinational manufacturing and services, 2007-2012). |
David M. Thomas (1949) |
Year of Election or Appointment: 2008 Trustee |
| Mr. Thomas also serves as Trustee of other Fidelity funds. Mr. Thomas serves as Non-Executive Chairman of the Board of Directors of Fortune Brands Home and Security (home and security products, 2011-present), and as a member of the Board of Directors of Interpublic Group of Companies, Inc. (marketing communication, 2004-present). Previously, Mr. Thomas served as Executive Chairman (2005-2006) and Chairman and Chief Executive Officer (2000-2005) of IMS Health, Inc. (pharmaceutical and healthcare information solutions), and a Director of Fortune Brands, Inc. (consumer products, 2000-2011). |
+ The information above includes each Trustee's principal occupation during the last five years and other information relating to the experience, attributes, and skills relevant to each Trustee's qualifications to serve as a Trustee, which led to the conclusion that each Trustee should serve as a Trustee for the fund.
Advisory Board Member and Officers:
Correspondence intended for each officer and Peter S. Lynch may be sent to Fidelity Investments, 245 Summer Street, Boston, Massachusetts 02210. Officers appear below in alphabetical order.
Name, Year of Birth; Principal Occupation |
Peter S. Lynch (1944) |
Year of Election or Appointment: 2003 Member of the Advisory Board |
| Mr. Lynch also serves as Member of the Advisory Board of other Fidelity funds. Mr. Lynch is Vice Chairman and a Director of FMR and FMR Co., Inc. In addition, Mr. Lynch serves as a Trustee of Boston College and as the Chairman of the Inner-City Scholarship Fund. Previously, Mr. Lynch served on the Special Olympics International Board of Directors (1997-2006). |
Elizabeth Paige Baumann (1968) |
Year of Election or Appointment: 2012 Anti-Money Laundering (AML) Officer |
| Ms. Baumann also serves as AML Officer of other funds. She is Chief AML Officer of FMR LLC (2012-present) and is an employee of Fidelity Investments. Previously, Ms. Baumann served as Vice President and Deputy Anti-Money Laundering Officer (2007-2012). |
William C. Coffey (1969) |
Year of Election or Appointment: 2009 Assistant Secretary |
| Mr. Coffey also serves as Assistant Secretary of other funds. He is Senior Vice President and Deputy General Counsel of FMR LLC (2010-present), and is an employee of Fidelity Investments. Previously, Mr. Coffey served as Vice President and Associate General Counsel of FMR LLC (2005-2009). |
Timothy M. Cohen (1969) |
Year of Election or Appointment: 2014 Vice President of certain Equity Funds |
| Mr. Cohen also serves as Vice President of other funds. Mr. Cohen serves as a Director and Chief Compliance Officer of Fidelity Management & Research (U.K.) Inc. (2013-present) and is an employee of Fidelity Investments. |
Jonathan Davis (1968) |
Year of Election or Appointment: 2010 Assistant Treasurer |
| Mr. Davis also serves as Assistant Treasurer of other funds. Mr. Davis is an employee of Fidelity Investments. Previously, Mr. Davis served as Vice President and Associate General Counsel of FMR LLC (2003-2010). |
Adrien E. Deberghes (1967) |
Year of Election or Appointment: 2008 Deputy Treasurer |
| Mr. Deberghes also serves as an officer of other funds. He is an employee of Fidelity Investments (2008-present). Prior to joining Fidelity Investments, Mr. Deberghes was Senior Vice President of Mutual Fund Administration at State Street Corporation (2007-2008), Senior Director of Mutual Fund Administration at Investors Bank & Trust (2005-2007), and Director of Finance for Dunkin' Brands (2000-2005). |
Stephanie J. Dorsey (1969) |
Year of Election or Appointment: 2010 Assistant Treasurer |
| Ms. Dorsey also serves as an officer of other funds. She is an employee of Fidelity Investments (2008-present) and has served in other fund officer roles. Prior to joining Fidelity Investments, Ms. Dorsey served as Treasurer (2004-2008) of the JPMorgan Mutual Funds and Vice President (2004-2008) of JPMorgan Chase Bank. |
Howard J. Galligan III (1966) |
Year of Election or Appointment: 2014 Chief Financial Officer |
| Mr. Galligan also serves as Chief Financial Officer of other funds. Mr. Galligan serves as President of Fidelity Pricing and Cash Management Services (FPCMS) (2014-present) and as a Director of Strategic Advisers, Inc. (2008-present). Previously, Mr. Galligan served as Chief Administrative Officer of Asset Management (2011-2014) and Chief Operating Officer and Senior Vice President of Investment Support for Strategic Advisers, Inc. (2003-2011). |
Scott C. Goebel (1968) |
Year of Election or Appointment: 2008 Secretary and Chief Legal Officer (CLO) |
| Mr. Goebel serves as Secretary and CLO of other funds. Mr. Goebel also serves as Secretary of Fidelity SelectCo, LLC (2013-present), Fidelity Investments Money Management, Inc. (FIMM) (2010-present) and Fidelity Research and Analysis Company (FRAC) (2010-present); General Counsel, Secretary, and Senior Vice President of FMR (2008-present) and FMR Co., Inc. (2008-present); Chief Legal Officer of Fidelity Management & Research (Hong Kong) Limited (2008-present); and Assistant Secretary of Fidelity Management & Research (Japan) Limited (2008-present) and Fidelity Management & Research (U.K.) Inc. (2008-present). Previously, Mr. Goebel served as Secretary and CLO of other Fidelity funds (2008-2013), Assistant Secretary of FIMM (2008-2010), FRAC (2008-2010), and certain funds (2007-2008); and as Vice President and Secretary of Fidelity Distributors Corporation (FDC) (2005-2007). Mr. Goebel has been employed by FMR LLC or an affiliate since 2001. |
Brian B. Hogan (1964) |
Year of Election or Appointment: 2009 Vice President |
| Mr. Hogan also serves as Trustee or Vice President of other funds. Mr. Hogan serves as a Director of Fidelity SelectCo, LLC (2014-present) and President of FMR's Equity Division (2009-present). Previously, Mr. Hogan served as Senior Vice President, Equity Research of FMR (2006-2009) and as a portfolio manager. |
Chris Maher (1972) |
Year of Election or Appointment: 2013 Assistant Treasurer |
| Mr. Maher serves as Assistant Treasurer of other funds. Mr. Maher is Vice President of Valuation Oversight and is an employee of Fidelity Investments. Previously, Mr. Maher served as Vice President of Asset Management Compliance (2013), Vice President of FMR's Program Management Group (2010-2013), and Vice President of Valuation Oversight (2008-2010). |
Kenneth B. Robins (1969) |
Year of Election or Appointment: 2008 President and Treasurer |
| Mr. Robins also serves as an officer of other funds. Mr. Robins serves as Executive Vice President of Fidelity Investments Money Management, Inc. (FIMM) (2013-present) and is an employee of Fidelity Investments (2004-present). Previously, Mr. Robins served in other fund officer roles. |
Stephen Sadoski (1971) |
Year of Election or Appointment: 2012 Deputy Treasurer |
| Mr. Sadoski also serves as Deputy Treasurer of other funds. He is an employee of Fidelity Investments (2012-present) and has served in another fund officer role. Prior to joining Fidelity Investments, Mr. Sadoski served as an assistant chief accountant in the Division of Investment Management of the Securities and Exchange Commission (SEC) (2009-2012) and as a senior manager at Deloitte & Touche LLP (1997-2009). |
Stacie M. Smith (1974) |
Year of Election or Appointment: 2013 Deputy Treasurer |
| Ms. Smith also serves as an officer of other funds. She is an employee of Fidelity Investments (2009-present) and has served in other fund officer roles. Prior to joining Fidelity Investments, Ms. Smith served as Senior Audit Manager of Ernst & Young LLP (1996-2009). |
Renee Stagnone (1975) |
Year of Election or Appointment: 2013 Deputy Treasurer |
| Ms. Stagnone also serves as Deputy Treasurer of other funds. Ms. Stagnone is an employee of Fidelity Investments. |
Linda J. Wondrack (1964) |
Year of Election or Appointment: 2014 Chief Compliance Officer |
| Ms. Wondrack also serves as Chief Compliance Officer of other funds. Ms. Wondrack is Executive Vice President and head of the Ethics Office and Asset Management Compliance for Fidelity Investments (2012-present). Ms. Wondrack also serves as Chief Compliance Officer of Fidelity SelectCo, LLC (2014-present); Chief Compliance Officer of Impresa Management LLC (2013-present); and Chief Compliance Officer of FMR Co., Inc., Fidelity Investments Money Management, Inc., Fidelity Management & Research (Japan) Limited, Fidelity Management & Research (U.K.) Inc., Fidelity Management & Research (Hong Kong), Fidelity Management & Research Company, Pyramis Global Advisors, LLC, and Strategic Advisers, Inc., Ballyrock Investment Advisors LLC, and Northern Neck Investors LLC (2012-present). Previously, Ms. Wondrack served as Senior Vice President and Chief Compliance Officer for Columbia Management Investment Advisers, LLC (2005-2012); Chief Compliance Officer for certain funds within the Columbia Family of Funds (2007-2012); and Senior Vice President of Compliance Risk Management at Bank of America (2005-2010). |
Joseph F. Zambello (1957) |
Year of Election or Appointment: 2011 Deputy Treasurer |
| Mr. Zambello also serves as Deputy Treasurer of other funds. Mr. Zambello is an employee of Fidelity Investments. Previously, Mr. Zambello served as Vice President of FMR's Program Management Group (2009-2011) and Vice President of the Transfer Agent Oversight Group (2005-2009). |
Annual Report
Class A designates 26%, Class T designates 43% of the dividends distributed in December 2013 as indicated in the Corporate Qualifying memo distributed by the Tax department, during the fiscal year as qualifying for the dividends received deduction for corporate shareholders.
Class A and Class B designates 100% of the dividends distributed during the fiscal year as amounts which may be taken into account as a dividend for purposes of the maximum rate under section 1(h)(11) of the Internal Revenue Code.
The amounts per share which represent income derived from sources within, and taxes paid to, foreign countries or possessions of the United States are as follows:
| Pay Date | Income | Taxes |
Class A | 12/09/2013 | $0.0399 | $0.0059 |
| | | |
Class T | 12/09/2013 | $0.0239 | $0.0059 |
| | | |
Class B | 12/09/2013 | $0.0000 | $0.0000 |
| | | |
Class C | 12/09/2013 | $0.0000 | $0.0000 |
The fund will notify shareholders in January 2015 of amounts for use in preparing 2014 income tax returns.
Annual Report
Board Approval of Investment Advisory Contracts and Management Fees
Fidelity International Growth Fund
Each year, the Board of Trustees, including the Independent Trustees (together, the Board), votes on the renewal of the management contract with Fidelity Management & Research Company (FMR) and the sub-advisory agreements (together, the Advisory Contracts) for the fund. The Board, assisted by the advice of fund counsel and Independent Trustees' counsel, requests and considers a broad range of information relevant to the renewal of the Advisory Contracts throughout the year.
The Board meets regularly and, at each of its meetings, covers an extensive agenda of topics and materials and considers factors that are relevant to its annual consideration of the renewal of the fund's Advisory Contracts, including the services and support provided to the fund and its shareholders. The Board has established various standing committees (Committees), each composed of and chaired by Independent Trustees with varying backgrounds, to which the Board has assigned specific subject matter responsibilities in order to enhance effective decision-making by the Board. The Board, acting directly and through its Committees, requests and receives information concerning the annual consideration of the renewal of the fund's Advisory Contracts. The Board also meets as needed to consider matters specifically related to the Board's annual consideration of the renewal of the Advisory Contracts. Members of the Board may also meet with trustees of other Fidelity funds through ad hoc joint committees to discuss certain matters relevant to the Fidelity funds.
At its July 2014 meeting, the Board, including the Independent Trustees, unanimously determined to renew the fund's Advisory Contracts. In reaching its determination, the Board considered all factors it believed relevant, including (i) the nature, extent, and quality of the services to be provided to the fund and its shareholders (including the investment performance of the fund); (ii) the competitiveness of the fund's management fee and total expense ratio relative to peer funds; (iii) the total costs of the services to be provided by and the profits to be realized by Fidelity from its relationship with the fund; (iv) the extent to which economies of scale exist and would be realized as the fund grows; and (v) whether fee levels reflect these economies of scale, if any, for the benefit of fund shareholders. In connection with separate internal corporate reorganizations involving Fidelity Management & Research (U.K.) Inc. (FMR U.K.) and Fidelity Management & Research (Japan) Inc. (FMR Japan), the Board approved certain non-material amendments to the fund's sub-advisory agreements with FMR U.K. and FMR Japan to reflect that, after these reorganizations, FMR Investment Management (UK) Limited and Fidelity Management & Research (Japan) Limited will carry on the business of FMR U.K. and FMR Japan, respectively. The Board noted that no changes to the portfolio managers or to the foreign research or investment advisory services provided to the fund were expected in connection with either reorganization and that the same personnel and resources would continue to be available to the fund at the new entities.
Annual Report
Board Approval of Investment Advisory Contracts and
Management Fees - continued
In considering whether to renew the Advisory Contracts for the fund, the Board reached a determination, with the assistance of fund counsel and Independent Trustees' counsel and through the exercise of its business judgment, that the renewal of the Advisory Contracts was in the best interests of the fund and its shareholders and that the compensation payable under the Advisory Contracts was fair and reasonable. The Board's decision to renew the Advisory Contracts was not based on any single factor, but rather was based on a comprehensive consideration of all the information provided to the Board at its meetings throughout the year. The Board, in reaching its determination to renew the Advisory Contracts, was aware that shareholders of the fund have a broad range of investment choices available to them, including a wide choice among funds offered by Fidelity's competitors, and that the fund's shareholders, who have the opportunity to review and weigh the disclosure provided by the fund in its prospectus and other public disclosures, have chosen to invest in this fund, which is part of the Fidelity family of funds.
Nature, Extent, and Quality of Services Provided. The Board considered Fidelity's staffing as it relates to the fund, including the backgrounds of investment personnel of FMR and the sub-advisers (together, the Investment Advisers), and also considered the fund's investment objective, strategies, and related investment philosophy. The Independent Trustees also had discussions with senior management of Fidelity's investment operations and investment groups. The Board considered the structure of the portfolio manager compensation program and whether this structure provides appropriate incentives to act in the best interests of the fund. Additionally, the Board considered the portfolio managers' investments, if any, in the funds that they manage.
Resources Dedicated to Investment Management and Support Services. The Board and the Fund Oversight and Research Committees reviewed the general qualifications and capabilities of Fidelity's investment staff, including its size, education, experience, and resources, as well as Fidelity's approach to recruiting, training, managing, and compensating investment personnel. The Board noted that Fidelity has continued to increase the resources devoted to non-U.S. offices, including expansion of Fidelity's global investment organization. The Board also noted that Fidelity's analysts have extensive resources, tools and capabilities that allow them to conduct sophisticated quantitative and fundamental analysis, as well as credit analysis of issuers, counterparties and guarantors. Further, the Board believes that Fidelity's investment professionals have sufficient access to global information and data so as to provide competitive investment results over time, and that those professionals also have access to sophisticated tools that permit them to assess portfolio construction and risk and performance attribution characteristics continuously, as well as to transmit new information and research conclusions rapidly around the world. Additionally, in its deliberations, the Board considered Fidelity's trading and risk management capabilities and resources and global compliance infrastructure, which are an integral part of the investment management process.
Annual Report
Shareholder and Administrative Services. The Board considered (i) the nature, extent, quality, and cost of advisory, administrative, and shareholder services performed by the Investment Advisers and their affiliates under the Advisory Contracts and under separate agreements covering transfer agency, pricing and bookkeeping, and securities lending services for the fund; (ii) the nature and extent of the supervision of third party service providers, principally custodians and subcustodians; and (iii) the resources devoted to, and the record of compliance with, the fund's compliance policies and procedures. The Board also reviewed the allocation of fund brokerage, including allocations to brokers affiliated with the Investment Advisers, the use of brokerage commissions to pay fund expenses, and the use of "soft" commission dollars to pay for research services.
The Board noted that the growth of fund assets over time across the complex allows Fidelity to reinvest in the development of services designed to enhance the value or convenience of the Fidelity funds as investment vehicles. These services include 24-hour access to account information and market information through telephone representatives and over the Internet, investor education materials and asset allocation tools, and the expanded availability of Fidelity Investor Centers.
In 2014, the Board formed an ad hoc Committee on Transfer Agency Fees to review the variety of transfer agency fee structures throughout the industry and Fidelity's competitive positioning with respect to industry participants.
Investment in a Large Fund Family. The Board considered the benefits to shareholders of investing in a Fidelity fund, including the benefits of investing in a fund that is part of a large family of funds offering a variety of investment disciplines and providing a large variety of mutual fund investor services. The Board noted that Fidelity had taken, or had made recommendations that resulted in the Fidelity funds taking, a number of actions over the previous year that benefited particular funds, including (i) continuing to dedicate additional resources to investment research and to the support of the senior management team that oversees asset management; (ii) persisting in efforts to enhance Fidelity's global research capabilities; (iii) launching new funds and making other enhancements to meet client needs for income-oriented solutions; (iv) reducing fund expenses for certain index funds; (v) continuing to launch dedicated lower cost underlying funds to meet portfolio construction needs related to expanding underlying fund options for Fidelity funds of funds, specifically for the Freedom Fund product lines; (vi) rationalizing product lines and gaining increased efficiencies through fund mergers; (vii) launching sector-based exchange-traded funds and establishing a new Fidelity adviser to manage sector-based funds and products; (viii) continuing to develop and implement technology to improve security and increase efficiency; (ix) modifying the eligibility criteria for certain share classes to increase their marketability to a portion of the defined contribution plan market; (x) waiving redemption fees for certain qualified fund-of-fund and wrap programs and certain retirement plan transactions; and (xi) launching new Institutional Class shares of certain money market funds to attract and retain assets and to fill a gap in the money market fund lineup.
Annual Report
Board Approval of Investment Advisory Contracts and
Management Fees - continued
Investment Performance. The Board considered whether the fund has operated in accordance with its investment objective, as well as its record of compliance with its investment restrictions and its performance history.
The Board took into account discussions with the Investment Advisers about fund investment performance that occur at Board meetings throughout the year. In this regard the Board noted that as part of regularly scheduled fund reviews and other reports to the Board on fund performance, the Board periodically considers annualized return information for the fund, for different time periods, measured against a securities market index ("benchmark index") and a peer group of funds with similar objectives ("peer group"). In its evaluation of fund investment performance, the Board gave particular attention to information indicating changes in performance of certain Fidelity funds for specific time periods and the Investment Advisers' explanations for any overperformance or underperformance.
In addition to reviewing absolute and relative fund performance, the Independent Trustees periodically consider the appropriateness of fund performance metrics in evaluating the results achieved. In general, the Independent Trustees believe that fund performance should be evaluated based on net performance (after fees and expenses) of both the highest performing and lowest performing classes, where applicable, compared to appropriate benchmark indices, over appropriate time periods which may include full market cycles, and compared to peer groups, as applicable, over the same periods, taking into account relevant factors including the following: general market conditions; issuer-specific information; tactical opportunities for investment; and fund cash flows and other factors.
The Independent Trustees recognize that shareholders evaluate performance on a net basis over their own holding periods, for which one-, three-, and five-year periods are often used as a proxy. For this reason, the performance information reviewed by the Board also included net cumulative calendar year total return information for the fund and an appropriate benchmark index and peer group for the most recent one-, three-, and five-year periods, as shown below. Returns are shown compared to the 25th percentile (top of box, 75% beaten) and 75th percentile (bottom of box, 25% beaten) of the peer universe. Returns of the benchmark index are "net MA," i.e., adjusted for tax withholding rates applicable to U.S.-based funds organized as Massachusetts business trusts.
Annual Report
Fidelity International Growth Fund

The Board also considered that the fund's management fee is subject to upward or downward adjustment depending upon whether, and to what extent, the fund's investment performance for the performance period exceeds, or is exceeded by, a securities index, thus leading to a performance adjustment for the same period. The Board noted that the performance adjustment provides FMR with a strong economic incentive to seek to achieve superior performance for the fund's shareholders and helps to more closely align the interests of FMR and the fund's shareholders.
Based on its review, the Board concluded that the nature, extent, and quality of services provided to the fund under the Advisory Contracts should benefit the fund's shareholders.
Competitiveness of Management Fee and Total Expense Ratio. The Board considered the fund's management fee and total expense ratio compared to "mapped groups" of competitive funds and classes. Fidelity creates "mapped groups" by combining similar Lipper investment objective categories that have comparable investment mandates. Combining Lipper investment objective categories aids the Board's management fee and total expense ratio comparisons by broadening the competitive group used for comparison and by reducing the number of universes to which various Fidelity funds are compared.
Management Fee. The Board considered two proprietary management fee comparisons for the 12-month periods shown in the chart below. The group of Lipper funds used by the Board for management fee comparisons is referred to below as the "Total Mapped Group." The Total Mapped Group comparison focuses on a fund's standing in terms of gross management fees before expense reimbursements or caps, and without giving effect to the fund's performance adjustment, relative to the total universe of funds with comparable investment mandates, regardless of whether their management fee structures also are comparable. Funds with comparable investment mandates offer exposure to similar types of securities. Funds with comparable management fee structures have similar management fee contractual arrangements (e.g., flat rate charged for advisory services, all-inclusive fee rate, etc.). "TMG %" represents the percentage of funds in the Total Mapped Group that had management fees that were lower than the fund's. For example, a hypothetical TMG % of 20% would mean that 80% of the funds in the Total Mapped Group had higher, and 20% had lower, management fees than the fund. The fund's actual TMG %s are in the chart below. The "Asset-Size Peer Group" (ASPG) comparison focuses on a fund's standing relative to a subset of non-Fidelity funds within the Total Mapped Group that are similar in size and management fee structure. For example, if a fund is in the first quartile of the ASPG, the fund's management fee ranks in the least expensive or lowest 25% of funds in the ASPG. The ASPG represents at least 15% of the funds in the Total Mapped Group with comparable asset size and management fee structures, subject to a minimum of 50 funds (or all funds in the Total Mapped Group if fewer than 50). Additional information, such as the ASPG quartile in which the fund's management fee rate ranked and the impact of the fund's performance adjustment, is also included in the chart and considered by the Board.
Annual Report
Board Approval of Investment Advisory Contracts and
Management Fees - continued
Fidelity International Growth Fund

The Board noted that the fund's management fee rate ranked below the median of its Total Mapped Group and below the median of its ASPG for 2013. The Board also noted the effect of the fund's positive performance adjustment on the fund's management fee ranking.
Annual Report
The Board also noted that, in August 2013, the ad hoc Committee on Management Fees was formed to conduct an in-depth review of the management fee rates of Fidelity's active equity mutual funds. The Committee focused on the following areas: (i) standard fee structures; (ii) research consumption and trading evolution; (iii) management fee competitiveness/profitability by category; and (iv) factors that drive institutional pricing.
Based on its review, the Board concluded that the fund's management fee is fair and reasonable in light of the services that the fund receives and the other factors considered.
Total Expense Ratio. In its review of each class's total expense ratio, the Board considered the fund's management fee as well as other fund or class expenses, as applicable, such as transfer agent fees, pricing and bookkeeping fees, fund-paid 12b-1 fees, and custodial, legal, and audit fees. The Board also noted the effects of any waivers and reimbursements on fees and expenses, as well as the impact of the fund's performance adjustment. As part of its review, the Board also considered the current and historical total expense ratios of each class of the fund compared to competitive fund median expenses. Each class of the fund is compared to those funds and classes in the Total Mapped Group (used by the Board for management fee comparisons) that have a similar sales load structure.
The Board noted that the total expense ratio of each of Institutional Class, Class Z, and the retail class ranked below its competitive median for 2013, the total expense ratio of Class A ranked equal to its competitive median for 2013, and the total expense ratio of each of Class T, Class B, and Class C ranked above its competitive median for 2013.The Board considered that, in general, various factors can affect total expense ratios. The Board noted that the total expense ratio of Class T was above the competitive median primarily because of higher 12b-1 fees on Class T as compared to most competitor funds. Class T has a higher 12b-1 fee, but a lower front-end sales charge, than traditionally priced front-end sales charge classes. The Board considered that Class T is primarily sold load-waived in the retirement plan market where its 0.50% 12b-1 fee is comparable to competing no-load, higher 12b-1 fee classes designed specifically for retirement plans. The Board noted that the fund offers multiple classes, each of which has a different sales load and 12b-1 fee structure, and that the multiple structures are intended to offer a range of pricing options for the intermediary market. The Board also noted that the total expense ratios of the classes vary primarily by the level of their 12b-1 fees, although differences in transfer agent fees may also cause expenses to vary from class to class.
The Board further considered that FMR contractually agreed to reimburse Class A, Class T, Class B, Class C, Institutional Class, Class Z, and the retail class of the fund to the extent that total operating expenses (excluding interest, certain taxes, certain securities lending costs, brokerage commissions, extraordinary expenses, and acquired fund fees and expenses, if any), as a percentage of their respective average net assets, exceed 1.45%, 1.70%, 2.20%, 2.20%, 1.20%, 1.05%, and 1.20% through December 31, 2014.
Annual Report
Board Approval of Investment Advisory Contracts and
Management Fees - continued
Fees Charged to Other Fidelity Clients. The Board also considered Fidelity fee structures and other information with respect to clients of Fidelity, such as other funds advised or subadvised by Fidelity, pension plan clients, and other institutional clients. The Board noted the findings of the 2013 ad hoc joint committee (created with the board of other Fidelity funds), which reviewed and compared Fidelity's institutional investment advisory business with its business of providing services to the Fidelity funds, including the differences in services provided, fees charged, and costs incurred, as well as competition in their respective marketplaces.
Based on its review of total expense ratios and fees charged to other Fidelity clients, the Board concluded that the total expense ratio of each class of the fund was reasonable, although in some cases above the median of the universe presented for comparison, in light of the services that the fund and its shareholders receive and the other factors considered.
Costs of the Services and Profitability. The Board considered the revenues earned and the expenses incurred by Fidelity in conducting the business of developing, marketing, distributing, managing, administering and servicing the fund and servicing the fund's shareholders. The Board also considered the level of Fidelity's profits in respect of all the Fidelity funds.
On an annual basis, Fidelity presents to the Board Fidelity's profitability for the fund. Fidelity calculates the profitability for each fund, as well as aggregate profitability for groups of Fidelity funds and all Fidelity funds, using a series of detailed revenue and cost allocation methodologies which originate with the books and records of Fidelity on which Fidelity's audited financial statements are based. The Audit Committee of the Board reviews any significant changes from the prior year's methodologies.
PricewaterhouseCoopers LLP (PwC), independent registered public accounting firm and auditor to Fidelity and certain Fidelity funds, has been engaged annually by the Board as part of the Board's assessment of Fidelity's profitability analysis. PwC's engagement includes the review and assessment of the methodologies used by Fidelity in determining the revenues and expenses attributable to Fidelity's mutual fund business, and completion of agreed-upon procedures in respect of the mathematical accuracy of fund profitability and its conformity to established allocation methodologies. After considering PwC's reports issued under the engagement and information provided by Fidelity, the Board concluded that while other allocation methods may also be reasonable, Fidelity's profitability methodologies are reasonable in all material respects.
The Board also reviewed Fidelity's non-fund businesses and fall-out benefits related to the mutual fund business as well as cases where Fidelity's affiliates may benefit from or be related to the fund's business.
Annual Report
The Board considered the costs of the services provided by and the profits realized by Fidelity in connection with the operation of the fund and was satisfied that the profitability was not excessive in the circumstances.
Economies of Scale. The Board considered whether there have been economies of scale in respect of the management of the Fidelity funds, whether the Fidelity funds (including the fund) have appropriately benefited from any such economies of scale, and whether there is potential for realization of any further economies of scale. The Board considered the extent to which the fund will benefit from economies of scale through increased services to the fund, through waivers or reimbursements, or through fee or expense ratio reductions. The Board also noted that in 2013, it and the boards of other Fidelity funds created an ad hoc committee (the Economies of Scale Committee) to analyze whether Fidelity attains economies of scale in respect of the management and servicing of the Fidelity funds, whether the Fidelity funds have appropriately benefited from such economies of scale, and whether there is potential for realization of any further economies of scale.
The Board recognized that the fund's management contract incorporates a "group fee" structure, which provides for lower group fee rates as total group assets increase, and for higher group fee rates as total group assets decrease (with "group assets" defined to include fund assets under FMR's management plus sector fund assets previously under FMR's management and currently managed by Fidelity SelectCo, LLC). FMR calculates the group fee rates based on a tiered asset "breakpoint" schedule that varies based on asset class. The Board considered that the group fee is designed to deliver the benefits of economies of scale to fund shareholders when total Fidelity fund assets increase, even if assets of any particular fund are unchanged or have declined, because some portion of Fidelity's costs are attributable to services provided to all Fidelity funds, and all funds benefit if those costs can be allocated among more assets. The Board concluded that, given the group fee structure, fund shareholders will benefit from lower management fees as group assets increase at the fund complex level, regardless of whether Fidelity achieves any such economies of scale.
The Board concluded, taking into account the analysis of the Economies of Scale Committee, that economies of scale, if any, are being appropriately shared between fund shareholders and Fidelity.
Additional Information Requested by the Board. In order to develop fully the factual basis for consideration of the Fidelity funds' Advisory Contracts, the Board requested and received additional information on certain topics, including: (i) fund performance trends and Fidelity's long-term strategies for certain funds; (ii) Fidelity's strategic marketing and product lineup goals; (iii) the methodology with respect to competitive fund data and peer group classifications; (iv) the arrangements with, and performance of, certain sub-advisers on behalf of the Fidelity funds, as well as certain proposed participating affiliate arrangements; (v) the realization of fall-out benefits in certain Fidelity business units; (vi) Fidelity's group fee structures, including the rationale for the individual fee rates of certain categories of funds and the definition of group assets; (vii) trends regarding industry use of performance fee structures and the performance adjustment methodologies applicable to the Fidelity funds; (viii) additional competitive analysis regarding the total expenses for certain classes; (ix) fund profitability methodology, including Fidelity's cost allocation methodology, and the impact of certain factors on fund profitability results; and (x) the process by which Fidelity determines sub-advisory fees for funds it advises.
Annual Report
Board Approval of Investment Advisory Contracts and
Management Fees - continued
Based on its evaluation of all of the conclusions noted above, and after considering all factors it believed relevant, the Board ultimately concluded that the advisory fee structures are fair and reasonable, and that the fund's Advisory Contracts should be renewed.
Annual Report
Investment Adviser
Fidelity Management & Research Company
Boston, MA
Investment Sub-Advisers
FMR Co., Inc.
Fidelity Management & Research
(U.K.) Inc.
Fidelity Management & Research
(Hong Kong) Limited
Fidelity Management & Research
(Japan) Limited
FIL Investment Advisors
FIL Investments (Japan) Limited
FIL Investment Advisors (UK) Limited
General Distributor
Fidelity Distributors Corporation
Smithfield, RI
Transfer and Service Agents
Fidelity Investments Institutional Operations Company, Inc.
Boston, MA
Fidelity Service Company, Inc.
Boston, MA
Custodian
State Street Bank and Trust Company
Quincy, MA
(Fidelity Investment logo)(registered trademark)
AIGF-UANN-1214
1.853348.106
(Fidelity Investment logo)(registered trademark)
Fidelity Advisor®
International Growth
Fund - Institutional Class
Annual Report
October 31, 2014
(Fidelity Cover Art)
Institutional Class is
a class of Fidelity®
International Growth Fund
Contents
Performance | (Click Here) | How the fund has done over time. |
Management's Discussion of Fund Performance | (Click Here) | The Portfolio Manager's review of fund performance and strategy. |
Shareholder Expense Example | (Click Here) | An example of shareholder expenses. |
Investment Changes | (Click Here) | A summary of major shifts in the fund's investments over the past six months. |
Investments | (Click Here) | A complete list of the fund's investments with their market values. |
Financial Statements | (Click Here) | Statements of assets and liabilities, operations, and changes in net assets, as well as financial highlights. |
Notes | (Click Here) | Notes to financial statements. |
Report of Independent Registered Public Accounting Firm | (Click Here) | |
Trustees and Officers | (Click Here) | |
Distributions | (Click Here) | |
Board Approval of Investment Advisory Contracts and Management Fees | (Click Here) | |
To view a fund's proxy voting guidelines and proxy voting record for the 12-month period ended June 30, visit http://www.fidelity.com/proxyvotingresults or visit the Securities and Exchange Commission's (SEC) web site at http://www.sec.gov. You may also call 1-877-208-0098 to request a free copy of the proxy voting guidelines.
Standard & Poor's, S&P and S&P 500 are registered service marks of The McGraw-Hill Companies, Inc. and have been licensed for use by Fidelity Distributors Corporation.
Other third-party marks appearing herein are the property of their respective owners.
All other marks appearing herein are registered or unregistered trademarks or service marks of FMR LLC or an affiliated company. © 2014 FMR LLC. All rights reserved.
Annual Report
This report and the financial statements contained herein are submitted for the general information of the shareholders of the fund. This report is not authorized for distribution to prospective investors in the fund unless preceded or accompanied by an effective prospectus.
A fund files its complete schedule of portfolio holdings with the SEC for the first and third quarters of each fiscal year on Form N-Q. Forms N-Q are available on the SEC's web site at http://www.sec.gov. A fund's Forms N-Q may be reviewed and copied at the SEC's Public Reference Room in Washington, DC. Information regarding the operation of the SEC's Public Reference Room may be obtained by calling 1-800-SEC-0330. For a complete list of a fund's portfolio holdings, view the most recent holdings listing, semiannual report, or annual report on Fidelity's web site at http://www.fidelity.com, http://www.advisor.fidelity.com, or http://www.401k.com, as applicable.
NOT FDIC INSURED • MAY LOSE VALUE • NO BANK GUARANTEE
Neither the fund nor Fidelity Distributors Corporation is a bank.
Annual Report
Average annual total return reflects the change in the value of an investment, assuming reinvestment of the class' distributions from dividend income and capital gains (the profits earned upon the sale of securities that have grown in value, if any) and assuming a constant rate of performance each year. The $10,000 table and the fund's returns do not reflect the deduction of taxes that a shareholder would pay on fund distributions or the redemption of fund shares. During periods of reimbursement by Fidelity, a fund's total return will be greater than it would be had the reimbursement not occurred. How a fund did yesterday is no guarantee of how it will do tomorrow.
Average Annual Total Returns
Periods ended October 31, 2014 | Past 1
year | Past 5
years | Life of
fund A |
Institutional Class | 2.84% | 10.62% | 2.37% |
A From November 1, 2007.
$10,000 Over Life of Fund
Let's say hypothetically that $10,000 was invested in Fidelity Advisor® International Growth Fund - Institutional Class on November 1, 2007, when the fund started. The chart shows how the value of your investment would have changed, and also shows how the MSCI EAFE Growth Index performed over the same period.
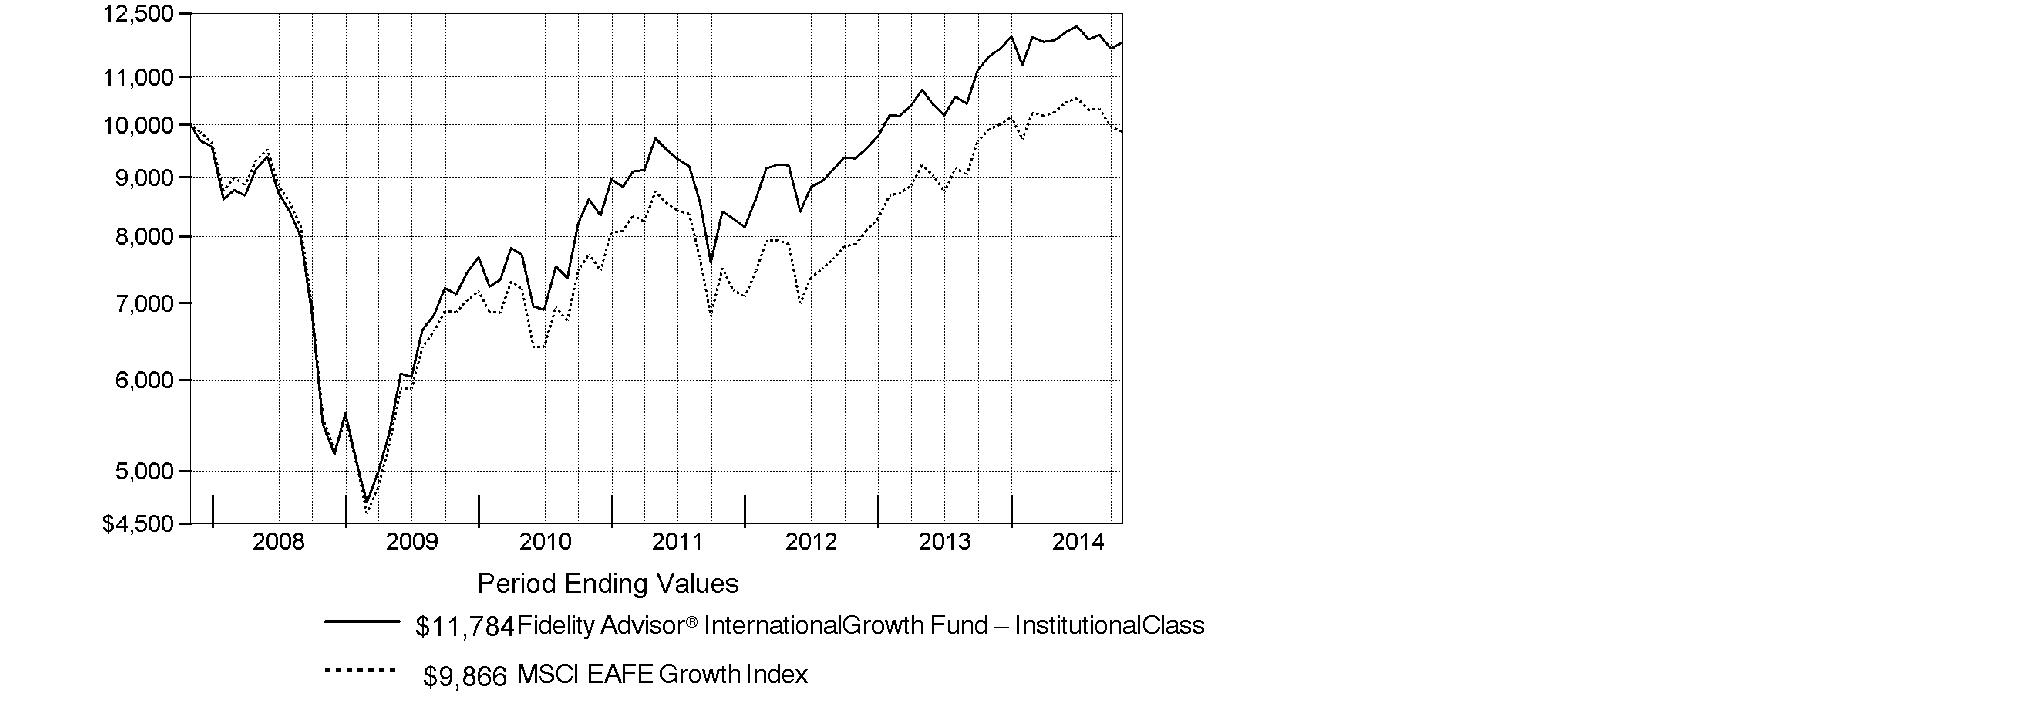
Annual Report
Market Recap: Global equities posted a healthy gain for the 12 months ending October 31, 2014, overcoming an October market decline driven by recessionary pressures in China and tepid growth in Europe. The MSCI ACWI (All Country World Index) Index rose 8.15%, helped by subdued market volatility for much of the period and supported by solid corporate earnings, especially in the United States. Stocks also benefited from easy monetary policies in Japan and the eurozone, as well as increased stimulus efforts in China. All but three of the 24 industry groups that compose the index marked a positive return. The U.S. (+17%) remained a pillar of strength, while a strongly rising dollar in the latter part of the period detracted from investors' returns in most non-U.S. markets. Canada (+5%) notched broad gains outside of its energy and materials sectors, as did Asia-Pacific ex Japan (+4%), led by investor enthusiasm for companies in India. The U.K., Europe and Japan, meanwhile, all underperformed. Among sectors, health care (+24%) led the index, with a strong contribution from the pharmaceuticals, biotechnology & life sciences industry. Information technology (+21%) also outperformed. Conversely, materials (-4%) and energy (-1%) lagged the index due to a higher supply of and lower demand for commodities.
Comments from Jed Weiss, Portfolio Manager of Fidelity Advisor® International Growth Fund: For the year ending October 31, 2014, the fund's Institutional Class shares gained 2.84%, well ahead of the MSCI EAFE Growth Index, which returned -0.51%. The fund benefited from its positioning in the U.S. - where some fund holdings happen to be domiciled while doing most or all of their business abroad - and also a beneficial underweighting in Europe. My stance in Japan was a modest negative. On an individual basis, U.K.-based hotel company Intercontinental Hotels Group was the fund's top individual contributor. I continued to like this stock for its strong operations and ability to benefit from a cyclically improving hotel business, especially in the U.S. Visa and MasterCard, two U.S.-based payment-processing software companies not found in the index, also were significant contributors. One notable laggard was Andritz, an Austrian industrial engineering firm with a dominant competitive position in several industries. The value of our stake fell during the 12 months, most likely because of investors' concerns about a slowing global economy. Another disappointment was Nokian Tyres, a Finland-based tire manufacturer that encountered a difficult business environment. I ultimately sold the fund's stake in search of other opportunities.
The views expressed above reflect those of the portfolio manager(s) only through the end of the period as stated on the cover of this report and do not necessarily represent the views of Fidelity or any other person in the Fidelity organization. Any such views are subject to change at any time based upon market or other conditions and Fidelity disclaims any responsibility to update such views. These views may not be relied on as investment advice and, because investment decisions for a Fidelity fund are based on numerous factors, may not be relied on as an indication of trading intent on behalf of any Fidelity fund.
Annual Report
Shareholder Expense Example
As a shareholder of the Fund, you incur two types of costs: (1) transaction costs, including sales charges (loads) on purchase payments or redemption proceeds, redemption fees and (2) ongoing costs, including management fees, distribution and/or service (12b-1) fees and other Fund expenses. This Example is intended to help you understand your ongoing costs (in dollars) of investing in the Fund and to compare these costs with the ongoing costs of investing in other mutual funds.
The Example is based on an investment of $1,000 invested at the beginning of the period and held for the entire period (May 1, 2014 to October 31, 2014).
Actual Expenses
The first line of the accompanying table for each class of the Fund provides information about actual account values and actual expenses. You may use the information in this line, together with the amount you invested, to estimate the expenses that you paid over the period. Simply divide your account value by $1,000.00 (for example, an $8,600 account value divided by $1,000.00 = 8.6), then multiply the result by the number in the first line for a class of the Fund under the heading entitled "Expenses Paid During Period" to estimate the expenses you paid on your account during this period. A small balance maintenance fee of $12.00 that is charged once a year may apply for certain accounts with a value of less than $2,000. This fee is not included in the table below. If it was, the estimate of expenses you paid during the period would be higher, and your ending account value lower, by this amount. In addition, the Fund, as a shareholder in the underlying Fidelity Central Funds, will indirectly bear its pro-rata share of the fees and expenses incurred by the underlying Fidelity Central Funds. These fees and expenses are not included in the Fund's annualized expense ratio used to calculate the expense estimate in the table below.
Hypothetical Example for Comparison Purposes
The second line of the accompanying table for each class of the Fund provides information about hypothetical account values and hypothetical expenses based on a Class' actual expense ratio and an assumed rate of return of 5% per year before expenses, which is not the Class' actual return. The hypothetical account values and expenses may not be used to estimate the actual ending account balance or expenses you paid for the period. You may use this information to compare the ongoing costs of investing in the Fund and other funds. To do so, compare this 5% hypothetical example with the 5% hypothetical examples that appear in the shareholder reports of the other funds. A small balance maintenance fee of $12.00 that is charged once a year may apply for certain accounts with a value of less than $2,000. This fee is not included in the table below. If it was, the estimate of expenses you paid during the period would be higher, and your ending account value lower, by this amount. In addition, the Fund, as a shareholder in the underlying Fidelity Central Funds, will indirectly bear its pro-rata share of the fees and expenses incurred by the underlying Fidelity Central Funds. These fees and expenses are not included in the Fund's annualized expense ratio used to calculate the expense estimate in the table below.
Please note that the expenses shown in the table are meant to highlight your ongoing costs only and do not reflect any transaction costs. Therefore, the second line of the table is useful in comparing ongoing costs only, and will not help you determine the relative total costs of owning different funds. In addition, if these transactional costs were included, your costs would have been higher.
Annual Report
Shareholder Expense Example - continued
| Annualized
Expense RatioB | Beginning
Account Value
May 1, 2014 | Ending
Account Value
October 31, 2014 | Expenses Paid
During Period*
May 1, 2014 to
October 31, 2014 |
Class A | 1.34% | | | |
Actual | | $ 1,000.00 | $ 993.70 | $ 6.73 |
HypotheticalA | | $ 1,000.00 | $ 1,018.45 | $ 6.82 |
Class T | 1.64% | | | |
Actual | | $ 1,000.00 | $ 991.90 | $ 8.23 |
HypotheticalA | | $ 1,000.00 | $ 1,016.94 | $ 8.34 |
Class B | 2.13% | | | |
Actual | | $ 1,000.00 | $ 990.90 | $ 10.69 |
HypotheticalA | | $ 1,000.00 | $ 1,014.47 | $ 10.82 |
Class C | 2.12% | | | |
Actual | | $ 1,000.00 | $ 990.00 | $ 10.63 |
HypotheticalA | | $ 1,000.00 | $ 1,014.52 | $ 10.76 |
International Growth | 1.03% | | | |
Actual | | $ 1,000.00 | $ 995.50 | $ 5.18 |
HypotheticalA | | $ 1,000.00 | $ 1,020.01 | $ 5.24 |
Institutional Class | 1.05% | | | |
Actual | | $ 1,000.00 | $ 995.50 | $ 5.28 |
HypotheticalA | | $ 1,000.00 | $ 1,019.91 | $ 5.35 |
Class Z | .88% | | | |
Actual | | $ 1,000.00 | $ 996.40 | $ 4.43 |
HypotheticalA | | $ 1,000.00 | $ 1,020.77 | $ 4.48 |
A 5% return per year before expenses
B Annualized expense ratio reflects expenses net of applicable fee waivers.
* Expenses are equal to each Class' annualized expense ratio, multiplied by the average account value over the period, multiplied by 184/365 (to reflect the one-half year period).
Annual Report
Investment Changes (Unaudited)
Geographic Diversification (% of fund's net assets) |
As of October 31, 2014 |
 | United States of America* 18.8% | |
 | United Kingdom 15.5% | |
 | Japan 14.2% | |
 | Switzerland 12.4% | |
 | Sweden 5.6% | |
 | Germany 4.6% | |
 | Belgium 4.5% | |
 | Australia 3.5% | |
 | Denmark 2.8% | |
 | Other 18.1% | |

Percentages are based on country or territory of incorporation and are adjusted for the effect of futures contracts, if applicable. |
* Includes Short-Term Investments and Net Other Assets (Liabilities) |
As of April 30, 2014 |
| United States of America* 17.7% | |
| United Kingdom 14.4% | |
| Japan 13.9% | |
| Switzerland 13.4% | |
| Sweden 6.7% | |
| Belgium 4.7% | |
| Germany 4.2% | |
| Australia 3.0% | |
| Denmark 3.0% | |
| Other 19.0% | |

Percentages are based on country or territory of incorporation and are adjusted for the effect of futures contracts, if applicable. |
* Includes Short-Term Investments and Net Other Assets (Liabilities) |
Asset Allocation as of October 31, 2014 |
| % of fund's
net assets | % of fund's net assets
6 months ago |
Stocks | 96.7 | 96.7 |
Short-Term Investments and Net Other Assets (Liabilities) | 3.3 | 3.3 |
Top Ten Stocks as of October 31, 2014 |
| % of fund's
net assets | % of fund's net assets
6 months ago |
Roche Holding AG (participation certificate) (Switzerland, Pharmaceuticals) | 4.5 | 4.2 |
Nestle SA (Switzerland, Food Products) | 3.7 | 3.7 |
Prudential PLC (United Kingdom, Insurance) | 3.0 | 2.8 |
Anheuser-Busch InBev SA NV (Belgium, Beverages) | 3.0 | 3.2 |
DENSO Corp. (Japan, Auto Components) | 2.6 | 2.7 |
Linde AG (Germany, Chemicals) | 2.6 | 2.6 |
Keyence Corp. (Japan, Electronic Equipment & Components) | 2.3 | 1.7 |
CSL Ltd. (Australia, Biotechnology) | 2.3 | 2.0 |
Novo Nordisk A/S Series B sponsored ADR (Denmark, Pharmaceuticals) | 2.2 | 2.5 |
Reckitt Benckiser Group PLC (United Kingdom, Household Products) | 2.2 | 2.1 |
| 28.4 | |
Market Sectors as of October 31, 2014 |
| % of fund's
net assets | % of fund's net assets
6 months ago |
Health Care | 16.1 | 12.2 |
Consumer Discretionary | 15.5 | 17.2 |
Financials | 15.2 | 15.9 |
Industrials | 14.8 | 14.9 |
Consumer Staples | 14.8 | 15.7 |
Information Technology | 9.9 | 7.8 |
Materials | 7.4 | 8.3 |
Energy | 2.2 | 2.3 |
Telecommunication Services | 0.8 | 2.4 |
Annual Report
Investments October 31, 2014
Showing Percentage of Net Assets
Common Stocks - 96.7% |
| Shares | | Value |
Australia - 3.5% |
CSL Ltd. | 298,127 | | $ 21,048,639 |
Sydney Airport unit | 1,294,562 | | 5,032,913 |
Transurban Group unit | 939,495 | | 6,728,575 |
TOTAL AUSTRALIA | | 32,810,127 |
Austria - 1.0% |
Andritz AG | 190,697 | | 9,205,199 |
Bailiwick of Jersey - 1.0% |
Shire PLC | 138,400 | | 9,286,215 |
Belgium - 4.5% |
Anheuser-Busch InBev SA NV | 251,991 | | 27,944,391 |
KBC Groupe SA (a) | 265,383 | | 14,217,141 |
TOTAL BELGIUM | | 42,161,532 |
Bermuda - 0.5% |
Lazard Ltd. Class A | 99,692 | | 4,905,843 |
Canada - 0.7% |
Canadian Pacific Railway Ltd. | 33,200 | | 6,905,706 |
Cayman Islands - 2.7% |
Sands China Ltd. | 1,690,400 | | 10,543,212 |
Tencent Holdings Ltd. | 343,200 | | 5,516,004 |
Wynn Macau Ltd. | 2,474,400 | | 8,945,222 |
TOTAL CAYMAN ISLANDS | | 25,004,438 |
Denmark - 2.8% |
Jyske Bank A/S (Reg.) (a) | 101,100 | | 5,446,923 |
Novo Nordisk A/S Series B sponsored ADR | 452,400 | | 20,439,432 |
TOTAL DENMARK | | 25,886,355 |
Finland - 0.2% |
Tikkurila Oyj | 108,900 | | 2,248,993 |
France - 1.0% |
Safran SA | 152,700 | | 9,663,478 |
Germany - 4.6% |
Bayer AG | 133,500 | | 18,979,677 |
Linde AG | 129,941 | | 23,961,253 |
TOTAL GERMANY | | 42,940,930 |
India - 0.5% |
Housing Development Finance Corp. Ltd. | 235,780 | | 4,246,218 |
Common Stocks - continued |
| Shares | | Value |
Ireland - 2.3% |
CRH PLC sponsored ADR | 444,566 | | $ 9,962,724 |
James Hardie Industries PLC: | | | |
CDI | 445,857 | | 4,755,798 |
sponsored ADR | 132,300 | | 7,055,559 |
TOTAL IRELAND | | 21,774,081 |
Israel - 0.2% |
Azrieli Group | 67,500 | | 2,166,849 |
Italy - 0.6% |
Azimut Holding SpA | 111,600 | | 2,606,833 |
Interpump Group SpA | 252,351 | | 3,288,830 |
TOTAL ITALY | | 5,895,663 |
Japan - 14.2% |
Aozora Bank Ltd. | 1,240,000 | | 4,358,487 |
Astellas Pharma, Inc. | 797,900 | | 12,383,805 |
Coca-Cola Central Japan Co. Ltd. | 174,500 | | 3,139,790 |
DENSO Corp. | 533,800 | | 24,465,988 |
East Japan Railway Co. | 68,800 | | 5,373,503 |
Fanuc Corp. | 51,900 | | 9,146,637 |
Fast Retailing Co. Ltd. | 27,400 | | 10,186,156 |
Japan Tobacco, Inc. | 144,500 | | 4,930,203 |
Keyence Corp. | 43,762 | | 21,206,307 |
Mitsui Fudosan Co. Ltd. | 439,000 | | 14,121,067 |
Seven Bank Ltd. | 1,300,000 | | 5,429,321 |
SHO-BOND Holdings Co. Ltd. | 121,100 | | 4,679,336 |
USS Co. Ltd. | 566,700 | | 8,918,724 |
Yamato Kogyo Co. Ltd. | 142,400 | | 4,613,045 |
TOTAL JAPAN | | 132,952,369 |
Kenya - 0.4% |
Safaricom Ltd. | 25,598,200 | | 3,491,314 |
Korea (South) - 0.4% |
NAVER Corp. | 5,695 | | 3,996,510 |
Mexico - 0.5% |
Fomento Economico Mexicano S.A.B. de CV sponsored ADR | 44,855 | | 4,316,845 |
Netherlands - 1.6% |
ING Groep NV (Certificaten Van Aandelen) (a) | 1,049,764 | | 15,033,001 |
South Africa - 1.6% |
Clicks Group Ltd. | 649,951 | | 4,425,424 |
Common Stocks - continued |
| Shares | | Value |
South Africa - continued |
MTN Group Ltd. | 164,900 | | $ 3,647,916 |
Naspers Ltd. Class N | 52,500 | | 6,533,566 |
TOTAL SOUTH AFRICA | | 14,606,906 |
Spain - 2.0% |
Inditex SA | 570,726 | | 16,031,326 |
Prosegur Compania de Seguridad SA (Reg.) | 419,349 | | 2,459,374 |
TOTAL SPAIN | | 18,490,700 |
Sweden - 5.6% |
ASSA ABLOY AB (B Shares) | 303,961 | | 16,099,232 |
Atlas Copco AB (A Shares) | 333,509 | | 9,624,773 |
Fagerhult AB | 228,152 | | 4,202,064 |
H&M Hennes & Mauritz AB (B Shares) | 254,482 | | 10,121,864 |
Intrum Justitia AB | 88,300 | | 2,623,595 |
Svenska Handelsbanken AB (A Shares) | 210,740 | | 10,048,760 |
TOTAL SWEDEN | | 52,720,288 |
Switzerland - 12.4% |
Nestle SA | 475,669 | | 34,882,777 |
Novartis AG | 141,366 | | 13,119,171 |
Roche Holding AG (participation certificate) | 142,215 | | 41,967,880 |
Schindler Holding AG: | | | |
(participation certificate) | 50,627 | | 7,071,942 |
(Reg.) | 8,980 | | 1,215,191 |
UBS AG (NY Shares) | 1,028,161 | | 17,869,438 |
TOTAL SWITZERLAND | | 116,126,399 |
Taiwan - 0.4% |
Taiwan Semiconductor Manufacturing Co. Ltd. | 864,000 | | 3,739,490 |
Turkey - 0.5% |
Coca-Cola Icecek Sanayi A/S | 226,534 | | 5,167,378 |
United Kingdom - 15.5% |
Babcock International Group PLC | 315,784 | | 5,531,498 |
BAE Systems PLC | 677,000 | | 4,967,707 |
Berendsen PLC | 226,573 | | 3,660,733 |
BG Group PLC | 614,495 | | 10,241,193 |
GlaxoSmithKline PLC | 418,600 | | 9,466,206 |
Informa PLC | 557,755 | | 4,291,678 |
InterContinental Hotel Group PLC ADR | 407,996 | | 15,507,928 |
Johnson Matthey PLC | 182,777 | | 8,695,630 |
Prudential PLC | 1,228,409 | | 28,445,074 |
Common Stocks - continued |
| Shares | | Value |
United Kingdom - continued |
Reckitt Benckiser Group PLC | 241,345 | | $ 20,269,179 |
Rolls-Royce Group PLC | 560,137 | | 7,553,711 |
Rotork PLC | 51,700 | | 2,113,100 |
SABMiller PLC | 339,166 | | 19,125,376 |
Shaftesbury PLC | 249,233 | | 2,854,678 |
Unite Group PLC | 377,876 | | 2,581,165 |
TOTAL UNITED KINGDOM | | 145,304,856 |
United States of America - 15.5% |
Autoliv, Inc. (d) | 111,169 | | 10,198,644 |
Berkshire Hathaway, Inc. Class B (a) | 50,184 | | 7,033,789 |
BorgWarner, Inc. | 198,192 | | 11,300,908 |
Cummins, Inc. | 50,782 | | 7,423,313 |
FMC Technologies, Inc. (a) | 77,152 | | 4,323,598 |
Google, Inc.: | | | |
Class A (a) | 20,533 | | 11,660,075 |
Class C (a) | 9,003 | | 5,033,397 |
Martin Marietta Materials, Inc. | 70,300 | | 8,219,476 |
MasterCard, Inc. Class A | 172,900 | | 14,480,375 |
Mead Johnson Nutrition Co. Class A | 38,844 | | 3,857,598 |
Mohawk Industries, Inc. (a) | 54,100 | | 7,684,364 |
National Oilwell Varco, Inc. | 27,772 | | 2,017,358 |
Oceaneering International, Inc. | 54,213 | | 3,809,548 |
Philip Morris International, Inc. | 87,408 | | 7,780,186 |
PriceSmart, Inc. | 43,000 | | 3,828,290 |
ResMed, Inc. (d) | 67,200 | | 3,509,184 |
Solera Holdings, Inc. | 112,389 | | 5,838,609 |
SS&C Technologies Holdings, Inc. (a) | 124,300 | | 6,006,176 |
Union Pacific Corp. | 51,400 | | 5,985,530 |
Visa, Inc. Class A | 61,275 | | 14,793,623 |
TOTAL UNITED STATES OF AMERICA | | 144,784,041 |
TOTAL COMMON STOCKS (Cost $817,018,791) |
905,831,724
|
Nonconvertible Preferred Stocks - 0.0% |
| | | |
United Kingdom - 0.0% |
Rolls-Royce Group PLC
(Cost $80,771) | 50,412,330 | |
80,645
|
Money Market Funds - 3.9% |
| Shares | | Value |
Fidelity Cash Central Fund, 0.11% (b) | 24,195,564 | | $ 24,195,564 |
Fidelity Securities Lending Cash Central Fund, 0.11% (b)(c) | 12,132,000 | | 12,132,000 |
TOTAL MONEY MARKET FUNDS (Cost $36,327,564) |
36,327,564
|
TOTAL INVESTMENT PORTFOLIO - 100.6% (Cost $853,427,126) | 942,239,933 |
NET OTHER ASSETS (LIABILITIES) - (0.6)% | (5,448,826) |
NET ASSETS - 100% | $ 936,791,107 |
Legend |
(a) Non-income producing |
(b) Affiliated fund that is generally available only to investment companies and other accounts managed by Fidelity Investments. The rate quoted is the annualized seven-day yield of the fund at period end. A complete unaudited listing of the fund's holdings as of its most recent quarter end is available upon request. In addition, each Fidelity Central Fund's financial statements, which are not covered by the Fund's Report of Independent Registered Public Accounting Firm, are available on the SEC's website or upon request. |
(c) Investment made with cash collateral received from securities on loan. |
(d) Security or a portion of the security is on loan at period end. |
Affiliated Central Funds |
Information regarding fiscal year to date income earned by the Fund from investments in Fidelity Central Funds is as follows: |
Fund | Income earned |
Fidelity Cash Central Fund | $ 22,126 |
Fidelity Securities Lending Cash Central Fund | 325,646 |
Total | $ 347,772 |
Other Information |
Categorizations in the Schedule of Investments are based on country or territory of incorporation. |
The following is a summary of the inputs used, as of October 31, 2014, involving the Fund's assets and liabilities carried at fair value. The inputs or methodology used for valuing securities may not be an indication of the risk associated with investing in those securities. For more information on valuation inputs, and their aggregation into the levels used in the table below, please refer to the Investment Valuation section in the accompanying Notes to Financial Statements. |
Valuation Inputs at Reporting Date: |
Description | Total | Level 1 | Level 2 | Level 3 |
Investments in Securities: | | | | |
Equities: | | | | |
Consumer Discretionary | $ 144,729,580 | $ 81,670,278 | $ 63,059,302 | $ - |
Consumer Staples | 139,667,437 | 68,770,276 | 70,897,161 | - |
Energy | 20,391,697 | 10,150,504 | 10,241,193 | - |
Financials | 141,364,587 | 69,731,419 | 71,633,168 | - |
Health Care | 150,200,209 | 42,928,293 | 107,271,916 | - |
Industrials | 140,636,585 | 109,675,621 | 30,960,964 | - |
Information Technology | 92,270,566 | 61,808,765 | 30,461,801 | - |
Materials | 69,512,478 | 60,143,635 | 9,368,843 | - |
Telecommunication Services | 7,139,230 | 7,139,230 | - | - |
Money Market Funds | 36,327,564 | 36,327,564 | - | - |
Total Investments in Securities: | $ 942,239,933 | $ 548,345,585 | $ 393,894,348 | $ - |
The following is a summary of transfers between Level 1 and Level 2 for the period ended October 31, 2014. Transfers are assumed to have occurred at the beginning of the period, and are primarily attributable to the valuation techniques used for foreign equity securities, as discussed in the accompanying Notes to Financial Statements: |
Transfers | Total |
Level 1 to Level 2 | $ 60,817,931 |
Level 2 to Level 1 | $ 0 |
See accompanying notes which are an integral part of the financial statements.
Annual Report
Statement of Assets and Liabilities
| October 31, 2014 |
| | |
Assets | | |
Investment in securities, at value (including securities loaned of $12,004,474) - See accompanying schedule: Unaffiliated issuers (cost $817,099,562) | $ 905,912,369 | |
Fidelity Central Funds (cost $36,327,564) | 36,327,564 | |
Total Investments (cost $853,427,126) | | $ 942,239,933 |
Foreign currency held at value (cost $43) | | 42 |
Receivable for investments sold | | 4,073,580 |
Receivable for fund shares sold | | 4,531,915 |
Dividends receivable | | 1,723,029 |
Distributions receivable from Fidelity Central Funds | | 6,903 |
Prepaid expenses | | 3,337 |
Other receivables | | 2,775 |
Total assets | | 952,581,514 |
| | |
Liabilities | | |
Payable for investments purchased | $ 1,884,552 | |
Payable for fund shares redeemed | 842,608 | |
Accrued management fee | 580,330 | |
Distribution and service plan fees payable | 60,982 | |
Other affiliated payables | 191,189 | |
Other payables and accrued expenses | 98,746 | |
Collateral on securities loaned, at value | 12,132,000 | |
Total liabilities | | 15,790,407 |
| | |
Net Assets | | $ 936,791,107 |
Net Assets consist of: | | |
Paid in capital | | $ 850,335,068 |
Undistributed net investment income | | 6,829,762 |
Accumulated undistributed net realized gain (loss) on investments and foreign currency transactions | | (9,108,156) |
Net unrealized appreciation (depreciation) on investments and assets and liabilities in foreign currencies | | 88,734,433 |
Net Assets | | $ 936,791,107 |
See accompanying notes which are an integral part of the financial statements.
Annual Report
Statement of Assets and Liabilities - continued
| October 31, 2014 |
| | |
Calculation of Maximum Offering Price
Class A:
Net Asset Value and redemption price per share
($119,017,195 ÷ 10,806,546 shares) | | $ 11.01 |
| | |
Maximum offering price per share (100/94.25 of $11.01) | | $ 11.68 |
Class T:
Net Asset Value and redemption price per share ($26,368,504 ÷ 2,404,861 shares) | | $ 10.96 |
| | |
Maximum offering price per share (100/96.50 of $10.96) | | $ 11.36 |
Class B:
Net Asset Value and offering price per share ($1,404,031 ÷ 128,735 shares)A | | $ 10.91 |
| | |
Class C:
Net Asset Value and offering price per share ($32,737,168 ÷ 3,011,271 shares)A | | $ 10.87 |
| | |
International Growth:
Net Asset Value, offering price and redemption price per share ($635,606,779 ÷ 57,274,082 shares) | | $ 11.10 |
| | |
Institutional Class:
Net Asset Value, offering price and redemption price per share ($121,553,795 ÷ 10,967,024 shares) | | $ 11.08 |
| | |
Class Z:
Net Asset Value, offering price and redemption price per share ($103,635 ÷ 9,336 shares) | | $ 11.10 |
A Redemption price per share is equal to net asset value less any applicable contingent deferred sales charge.
See accompanying notes which are an integral part of the financial statements.
Annual Report
Financial Statements - continued
Statement of Operations
| Year ended October 31, 2014 |
| | |
Investment Income | | |
Dividends | | $ 17,871,194 |
Income from Fidelity Central Funds | | 347,772 |
Income before foreign taxes withheld | | 18,218,966 |
Less foreign taxes withheld | | (1,316,845) |
Total income | | 16,902,121 |
| | |
Expenses | | |
Management fee
Basic fee | $ 5,413,678 | |
Performance adjustment | 364,493 | |
Transfer agent fees | 1,687,661 | |
Distribution and service plan fees | 677,617 | |
Accounting and security lending fees | 377,289 | |
Custodian fees and expenses | 106,805 | |
Independent trustees' compensation | 3,045 | |
Registration fees | 139,931 | |
Audit | 71,897 | |
Legal | 2,124 | |
Miscellaneous | 3,622 | |
Total expenses before reductions | 8,848,162 | |
Expense reductions | (10,690) | 8,837,472 |
Net investment income (loss) | | 8,064,649 |
Realized and Unrealized Gain (Loss) Net realized gain (loss) on: | | |
Investment securities: | | |
Unaffiliated issuers | (8,867,777) | |
Foreign currency transactions | (61,847) | |
Total net realized gain (loss) | | (8,929,624) |
Change in net unrealized appreciation (depreciation) on: Investment securities (net of increase in deferred foreign taxes of $11,698) | 17,936,446 | |
Assets and liabilities in foreign currencies | (63,604) | |
Total change in net unrealized appreciation (depreciation) | | 17,872,842 |
Net gain (loss) | | 8,943,218 |
Net increase (decrease) in net assets resulting from operations | | $ 17,007,867 |
See accompanying notes which are an integral part of the financial statements.
Annual Report
Statement of Changes in Net Assets
| Year ended
October 31,
2014 | Year ended
October 31,
2013 |
Increase (Decrease) in Net Assets | | |
Operations | | |
Net investment income (loss) | $ 8,064,649 | $ 3,493,326 |
Net realized gain (loss) | (8,929,624) | 6,317,113 |
Change in net unrealized appreciation (depreciation) | 17,872,842 | 60,869,889 |
Net increase (decrease) in net assets resulting
from operations | 17,007,867 | 70,680,328 |
Distributions to shareholders from net investment income | (2,592,643) | (2,081,336) |
Distributions to shareholders from net realized gain | (513,441) | (113,769) |
Total distributions | (3,106,084) | (2,195,105) |
Share transactions - net increase (decrease) | 336,569,228 | 324,915,158 |
Redemption fees | 42,228 | 31,216 |
Total increase (decrease) in net assets | 350,513,239 | 393,431,597 |
| | |
Net Assets | | |
Beginning of period | 586,277,868 | 192,846,271 |
End of period (including undistributed net investment income of $6,829,762 and undistributed net investment income of $2,476,993, respectively) | $ 936,791,107 | $ 586,277,868 |
See accompanying notes which are an integral part of the financial statements.
Annual Report
Financial Highlights - Class A
Years ended October 31, | 2014 | 2013 | 2012 | 2011 | 2010 |
Selected Per-Share Data | | | | | |
Net asset value, beginning of period | $ 10.78 | $ 8.91 | $ 8.09 | $ 8.38 | $ 7.01 |
Income from Investment Operations | | | | | |
Net investment income (loss) C | .09 | .08 | .08 | .08 | .05 |
Net realized and unrealized gain (loss) | .18 | 1.88 | .81 | (.31) | 1.39 |
Total from investment operations | .27 | 1.96 | .89 | (.23) | 1.44 |
Distributions from net investment income | (.03) | (.08) | (.06) | (.05) | (.05) |
Distributions from net realized gain | (.01) | (.01) | (.01) | (.01) | (.03) |
Total distributions | (.04) | (.09) | (.07) | (.06) | (.07) H |
Redemption fees added to paid in capital C, G | - | - | - | - | - |
Net asset value, end of period | $ 11.01 | $ 10.78 | $ 8.91 | $ 8.09 | $ 8.38 |
Total ReturnA, B | 2.54% | 22.18% | 11.10% | (2.76)% | 20.68% |
Ratios to Average Net Assets D, F | | | | | |
Expenses before reductions | 1.35% | 1.44% | 1.58% | 1.77% | 2.13% |
Expenses net of fee waivers, if any | 1.35% | 1.43% | 1.45% | 1.45% | 1.50% |
Expenses net of all reductions | 1.34% | 1.42% | 1.44% | 1.43% | 1.48% |
Net investment income (loss) | .84% | .80% | .99% | .92% | .74% |
Supplemental Data | | | | | |
Net assets, end of period (000 omitted) | $ 119,017 | $ 74,595 | $ 21,874 | $ 6,352 | $ 3,084 |
Portfolio turnover rateE | 27% | 32% | 32% | 68% | 87% |
A Total returns would have been lower if certain expenses had not been reduced during the applicable periods shown.
B Total returns do not include the effect of the sales charges.
C Calculated based on average shares outstanding during the period.
D Fees and expenses of any underlying Fidelity Central Funds are not included in the Fund's expense ratio. The Fund indirectly bears its proportionate share of the expenses of any underlying Fidelity Central Funds.
E Amount does not include the portfolio activity of any underlying Fidelity Central Funds.
F Expense ratios reflect operating expenses of the class. Expenses before reductions do not reflect amounts reimbursed by the investment adviser or reductions from brokerage service arrangements or reductions from other expense offset arrangements and do not represent the amount paid by the class during periods when reimbursements or reductions occur. Expenses net of fee waivers reflect expenses after reimbursement by the investment adviser but prior to reductions from brokerage service arrangements or other expense offset arrangements. Expenses net of all reductions represent the net expenses paid by the class.
G Amount represents less than $.01 per share.
H Total distributions of $.07 per share is comprised of distributions from net investment income of $.046 and distributions from net realized gain of $.025 per share.
See accompanying notes which are an integral part of the financial statements.
Annual Report
Financial Highlights - Class T
Years ended October 31, | 2014 | 2013 | 2012 | 2011 | 2010 |
Selected Per-Share Data | | | | | |
Net asset value, beginning of period | $ 10.75 | $ 8.89 | $ 8.08 | $ 8.38 | $ 7.00 |
Income from Investment Operations | | | | | |
Net investment income (loss) C | .06 | .05 | .06 | .06 | .04 |
Net realized and unrealized gain (loss) | .18 | 1.88 | .81 | (.31) | 1.39 |
Total from investment operations | .24 | 1.93 | .87 | (.25) | 1.43 |
Distributions from net investment income | (.02) | (.07) | (.05) | (.04) | (.02) |
Distributions from net realized gain | (.01) | (.01) | (.01) | (.01) | (.03) |
Total distributions | (.03) | (.07) H | (.06) | (.05) | (.05) |
Redemption fees added to paid in capital C, G | - | - | - | - | - |
Net asset value, end of period | $ 10.96 | $ 10.75 | $ 8.89 | $ 8.08 | $ 8.38 |
Total ReturnA, B | 2.21% | 21.91% | 10.82% | (3.03)% | 20.47% |
Ratios to Average Net Assets D, F | | | | | |
Expenses before reductions | 1.65% | 1.69% | 1.85% | 2.03% | 2.41% |
Expenses net of fee waivers, if any | 1.65% | 1.69% | 1.70% | 1.70% | 1.75% |
Expenses net of all reductions | 1.65% | 1.68% | 1.69% | 1.68% | 1.73% |
Net investment income (loss) | .53% | .54% | .74% | .67% | .49% |
Supplemental Data | | | | | |
Net assets, end of period (000 omitted) | $ 26,369 | $ 23,118 | $ 10,690 | $ 2,917 | $ 1,034 |
Portfolio turnover rateE | 27% | 32% | 32% | 68% | 87% |
A Total returns would have been lower if certain expenses had not been reduced during the applicable periods shown.
B Total returns do not include the effect of the sales charges.
C Calculated based on average shares outstanding during the period.
D Fees and expenses of any underlying Fidelity Central Funds are not included in the Fund's expense ratio. The Fund indirectly bears its proportionate share of the expenses of any underlying Fidelity Central Funds.
E Amount does not include the portfolio activity of any underlying Fidelity Central Funds.
F Expense ratios reflect operating expenses of the class. Expenses before reductions do not reflect amounts reimbursed by the investment adviser or reductions from brokerage service arrangements or reductions from other expense offset arrangements and do not represent the amount paid by the class during periods when reimbursements or reductions occur. Expenses net of fee waivers reflect expenses after reimbursement by the investment adviser but prior to reductions from brokerage service arrangements or other expense offset arrangements. Expenses net of all reductions represent the net expenses paid by the class.
G Amount represents less than $.01 per share.
H Total distributions of $.07 per share is comprised of distributions from net investment income of $.069 and distributions from net realized gain of $.005 per share.
See accompanying notes which are an integral part of the financial statements.
Annual Report
Financial Highlights - Class B
Years ended October 31, | 2014 | 2013 | 2012 | 2011 | 2010 |
Selected Per-Share Data | | | | | |
Net asset value, beginning of period | $ 10.73 | $ 8.88 | $ 8.06 | $ 8.36 | $ 6.98 |
Income from Investment Operations | | | | | |
Net investment income (loss) C | - G | - G | .02 | .01 | - G |
Net realized and unrealized gain (loss) | .19 | 1.89 | .80 | (.30) | 1.38 |
Total from investment operations | .19 | 1.89 | .82 | (.29) | 1.38 |
Distributions from net investment income | - | (.03) | - | (.01) | - |
Distributions from net realized gain | (.01) | (.01) | - | - G | - |
Total distributions | (.01) | (.04) | - | (.01) | - |
Redemption fees added to paid in capital C, G | - | - | - | - | - |
Net asset value, end of period | $ 10.91 | $ 10.73 | $ 8.88 | $ 8.06 | $ 8.36 |
Total ReturnA, B | 1.76% | 21.35% | 10.17% | (3.47)% | 19.77% |
Ratios to Average Net Assets D, F | | | | | |
Expenses before reductions | 2.14% | 2.19% | 2.35% | 2.55% | 2.87% |
Expenses net of fee waivers, if any | 2.14% | 2.18% | 2.20% | 2.20% | 2.25% |
Expenses net of all reductions | 2.14% | 2.17% | 2.19% | 2.18% | 2.23% |
Net investment income (loss) | .04% | .05% | .24% | .17% | (.01)% |
Supplemental Data | | | | | |
Net assets, end of period (000 omitted) | $ 1,404 | $ 1,579 | $ 1,116 | $ 473 | $ 581 |
Portfolio turnover rateE | 27% | 32% | 32% | 68% | 87% |
A Total returns would have been lower if certain expenses had not been reduced during the applicable periods shown.
B Total returns do not include the effect of the contingent deferred sales charge.
C Calculated based on average shares outstanding during the period.
D Fees and expenses of any underlying Fidelity Central Funds are not included in the Fund's expense ratio. The Fund indirectly bears its proportionate share of the expenses of any underlying Fidelity Central Funds.
E Amount does not include the portfolio activity of any underlying Fidelity Central Funds.
F Expense ratios reflect operating expenses of the class. Expenses before reductions do not reflect amounts reimbursed by the investment adviser or reductions from brokerage service arrangements or reductions from other expense offset arrangements and do not represent the amount paid by the class during periods when reimbursements or reductions occur. Expenses net of fee waivers reflect expenses after reimbursement by the investment adviser but prior to reductions from brokerage service arrangements or other expense offset arrangements. Expenses net of all reductions represent the net expenses paid by the class.
G Amount represents less than $.01 per share.
See accompanying notes which are an integral part of the financial statements.
Annual Report
Financial Highlights - Class C
Years ended October 31, | 2014 | 2013 | 2012 | 2011 | 2010 |
Selected Per-Share Data | | | | | |
Net asset value, beginning of period | $ 10.69 | $ 8.84 | $ 8.03 | $ 8.34 | $ 6.98 |
Income from Investment Operations | | | | | |
Net investment income (loss) C | .01 | .01 | .02 | .01 | -G |
Net realized and unrealized gain (loss) | .18 | 1.87 | .80 | (.31) | 1.38 |
Total from investment operations | .19 | 1.88 | .82 | (.30) | 1.38 |
Distributions from net investment income | - | (.02) | (.01) | (.01) | - |
Distributions from net realized gain | (.01) | (.01) | (.01) | (.01) | (.02) |
Total distributions | (.01) | (.03) | (.01)I | (.01)H | (.02) |
Redemption fees added to paid in capital C, G | - | - | - | - | - |
Net asset value, end of period | $ 10.87 | $ 10.69 | $ 8.84 | $ 8.03 | $ 8.34 |
Total ReturnA, B | 1.77% | 21.29% | 10.27% | (3.57)% | 19.82% |
Ratios to Average Net Assets D, F | | | | | |
Expenses before reductions | 2.12% | 2.19% | 2.33% | 2.52% | 2.89% |
Expenses net of fee waivers, if any | 2.12% | 2.18% | 2.20% | 2.20% | 2.25% |
Expenses net of all reductions | 2.12% | 2.17% | 2.19% | 2.18% | 2.24% |
Net investment income (loss) | .06% | .05% | .24% | .17% | (.01)% |
Supplemental Data | | | | | |
Net assets, end of period (000 omitted) | $ 32,737 | $ 17,196 | $ 5,648 | $ 2,767 | $ 1,261 |
Portfolio turnover rateE | 27% | 32% | 32% | 68% | 87% |
A Total returns would have been lower if certain expenses had not been reduced during the applicable periods shown.
B Total returns do not include the effect of the contingent deferred sales charge.
C Calculated based on average shares outstanding during the period.
D Fees and expenses of any underlying Fidelity Central Funds are not included in the Fund's expense ratio. The Fund indirectly bears its proportionate share of the expenses of any underlying Fidelity Central Funds.
E Amount does not include the portfolio activity of any underlying Fidelity Central Funds.
F Expense ratios reflect operating expenses of the class. Expenses before reductions do not reflect amounts reimbursed by the investment adviser or reductions from brokerage service arrangements or reductions from other expense offset arrangements and do not represent the amount paid by the class during periods when reimbursements or reductions occur. Expenses net of fee waivers reflect expenses after reimbursement by the investment adviser but prior to reductions from brokerage service arrangements or other expense offset arrangements. Expenses net of all reductions represent the net expenses paid by the class.
G Amount represents less than $.01 per share.
H Total distributions of $.01 per share is comprised of distributions from net investment income of $.008 and distributions from net realized gain of $.005 per share.
I Total distributions of $.01 per share is comprised of distributions from net investment income of $.007 and distributions from net realized gain of $.006 per share.
See accompanying notes which are an integral part of the financial statements.
Annual Report
Financial Highlights - International Growth
Years ended October 31, | 2014 | 2013 | 2012 | 2011 | 2010 |
Selected Per-Share Data | | | | | |
Net asset value, beginning of period | $ 10.84 | $ 8.95 | $ 8.12 | $ 8.40 | $ 7.02 |
Income from Investment Operations | | | | | |
Net investment income (loss) B | .13 | .11 | .11 | .10 | .07 |
Net realized and unrealized gain (loss) | .19 | 1.88 | .81 | (.30) | 1.39 |
Total from investment operations | .32 | 1.99 | .92 | (.20) | 1.46 |
Distributions from net investment income | (.05) | (.10) | (.08) | (.07) | (.06) |
Distributions from net realized gain | (.01) | (.01) | (.01) | (.01) | (.03) |
Total distributions | (.06) | (.10)H | (.09) | (.08) | (.08)G |
Redemption fees added to paid in capital B,F | - | - | - | - | - |
Net asset value, end of period | $ 11.10 | $ 10.84 | $ 8.95 | $ 8.12 | $ 8.40 |
Total ReturnA | 2.96% | 22.48% | 11.41% | (2.47)% | 20.97% |
Ratios to Average Net Assets C, E | | | | | |
Expenses before reductions | 1.04% | 1.13% | 1.28% | 1.52% | 1.89% |
Expenses net of fee waivers, if any | 1.04% | 1.13% | 1.20% | 1.20% | 1.25% |
Expenses net of all reductions | 1.04% | 1.11% | 1.19% | 1.18% | 1.23% |
Net investment income (loss) | 1.14% | 1.11% | 1.24% | 1.17% | .99% |
Supplemental Data | | | | | |
Net assets, end of period (000 omitted) | $ 635,607 | $ 430,914 | $ 149,526 | $ 53,437 | $ 28,454 |
Portfolio turnover rateD | 27% | 32% | 32% | 68% | 87% |
A Total returns would have been lower if certain expenses had not been reduced during the applicable periods shown.
B Calculated based on average shares outstanding during the period.
C Fees and expenses of any underlying Fidelity Central Funds are not included in the Fund's expense ratio. The Fund indirectly bears its proportionate share of the expenses of any underlying Fidelity Central Funds.
D Amount does not include the portfolio activity of any underlying Fidelity Central Funds.
E Expense ratios reflect operating expenses of the class. Expenses before reductions do not reflect amounts reimbursed by the investment adviser or reductions from brokerage service arrangements or reductions from other expense offset arrangements and do not represent the amount paid by the class during periods when reimbursements or reductions occur. Expenses net of fee waivers reflect expenses after reimbursement by the investment adviser but prior to reductions from brokerage service arrangements or other expense offset arrangements. Expenses net of all reductions represent the net expenses paid by the class.
F Amount represents less than $.01 per share.
G Total distributions of $.08 per share is comprised of distributions from net investment income of $.057 and distributions from net realized gain of $.025 per share.
H Total distributions of $.10 per share is comprised of distributions from net investment income of $.097 and distributions from net realized gain of $.005 per share.
See accompanying notes which are an integral part of the financial statements.
Annual Report
Financial Highlights - Institutional Class
Years ended October 31, | 2014 | 2013 | 2012 | 2011 | 2010 |
Selected Per-Share Data | | | | | |
Net asset value, beginning of period | $ 10.84 | $ 8.94 | $ 8.12 | $ 8.40 | $ 7.02 |
Income from Investment Operations | | | | | |
Net investment income (loss) B | .13 | .11 | .10 | .10 | .07 |
Net realized and unrealized gain (loss) | .18 | 1.90 | .81 | (.30) | 1.39 |
Total from investment operations | .31 | 2.01 | .91 | (.20) | 1.46 |
Distributions from net investment income | (.06) | (.10) | (.08) | (.07) | (.06) |
Distributions from net realized gain | (.01) | (.01) | (.01) | (.01) | (.03) |
Total distributions | (.07) | (.11) | (.09) | (.08) | (.08)G |
Redemption fees added to paid in capital B,F | - | - | - | - | - |
Net asset value, end of period | $ 11.08 | $ 10.84 | $ 8.94 | $ 8.12 | $ 8.40 |
Total ReturnA | 2.84% | 22.66% | 11.28% | (2.47)% | 20.97% |
Ratios to Average Net Assets C, E | | | | | |
Expenses before reductions | 1.04% | 1.11% | 1.27% | 1.50% | 1.92% |
Expenses net of fee waivers, if any | 1.04% | 1.11% | 1.20% | 1.20% | 1.25% |
Expenses net of all reductions | 1.04% | 1.09% | 1.19% | 1.18% | 1.23% |
Net investment income (loss) | 1.14% | 1.13% | 1.24% | 1.17% | .99% |
Supplemental Data | | | | | |
Net assets, end of period (000 omitted) | $ 121,554 | $ 38,771 | $ 3,992 | $ 493 | $ 113 |
Portfolio turnover rateD | 27% | 32% | 32% | 68% | 87% |
A Total returns would have been lower if certain expenses had not been reduced during the applicable periods shown.
B Calculated based on average shares outstanding during the period.
C Fees and expenses of any underlying Fidelity Central Funds are not included in the Fund's expense ratio. The Fund indirectly bears its proportionate share of the expenses of any underlying Fidelity Central Funds.
D Amount does not include the portfolio activity of any underlying Fidelity Central Funds.
E Expense ratios reflect operating expenses of the class. Expenses before reductions do not reflect amounts reimbursed by the investment adviser or reductions from brokerage service arrangements or reductions from other expense offset arrangements and do not represent the amount paid by the class during periods when reimbursements or reductions occur. Expenses net of fee waivers reflect expenses after reimbursement by the investment adviser but prior to reductions from brokerage service arrangements or other expense offset arrangements. Expenses net of all reductions represent the net expenses paid by the class.
F Amount represents less than $.01 per share.
G Total distributions of $.08 per share is comprised of distributions from net investment income of $.057 and distributions from net realized gain of $.025 per share.
See accompanying notes which are an integral part of the financial statements.
Annual Report
Financial Highlights - Class Z
Years ended October 31, | 2014 | 2013 G |
Selected Per-Share Data | | |
Net asset value, beginning of period | $ 10.84 | $ 10.26 |
Income from Investment Operations | | |
Net investment income (loss) D | .14 | .02 |
Net realized and unrealized gain (loss) | .19 | .56 |
Total from investment operations | .33 | .58 |
Distributions from net investment income | (.06) | - |
Distributions from net realized gain | (.01) | - |
Total distributions | (.07) | - |
Redemption fees added to paid in capital D,I | - | - |
Net asset value, end of period | $ 11.10 | $ 10.84 |
Total ReturnB, C | 3.07% | 5.65% |
Ratios to Average Net Assets E, H | | |
Expenses before reductions | .88% | .94%A |
Expenses net of fee waivers, if any | .88% | .94%A |
Expenses net of all reductions | .88% | .93%A |
Net investment income (loss) | 1.30% | .65%A |
Supplemental Data | | |
Net assets, end of period (000 omitted) | $ 104 | $ 106 |
Portfolio turnover rateF | 27% | 32% |
A Annualized
B Total returns for periods of less than one year are not annualized.
C Total returns would have been lower if certain expenses had not been reduced during the applicable periods shown.
D Calculated based on average shares outstanding during the period.
E Fees and expenses of any underlying Fidelity Central Funds are not included in the Fund's expense ratio. The Fund indirectly bears its proportionate share of the expenses of any underlying Fidelity Central Funds.
F Amount does not include the portfolio activity of any underlying Fidelity Central Funds.
G For the period August 13, 2013 (commencement of sale of shares) to October 31, 2013.
H Expense ratios reflect operating expenses of the class. Expenses before reductions do not reflect amounts reimbursed by the investment adviser or reductions from brokerage service arrangements or reductions from other expense offset arrangements and do not represent the amount paid by the class during periods when reimbursements or reductions occur. Expense ratios before reductions for start-up periods may not be representative of longer-term operating periods. Expenses net of fee waivers reflect expenses after reimbursement by the investment adviser but prior to reductions from brokerage service arrangements or other expense offset arrangements. Expenses net of all reductions represent the net expenses paid by the class.
I Amount represents less than $.01 per share.
See accompanying notes which are an integral part of the financial statements.
Annual Report
Notes to Financial Statements
For the period ended October 31, 2014
1. Organization.
Fidelity International Growth Fund (the Fund) is a fund of Fidelity Investment Trust (the Trust) and is authorized to issue an unlimited number of shares. The Trust is registered under the Investment Company Act of 1940, as amended (the 1940 Act), as an open-end management investment company organized as a Massachusetts business trust. The Fund offers Class A, Class T, Class C, International Growth, Institutional Class and Class Z shares, each of which, along with Class B shares, has equal rights as to assets and voting privileges. Class B shares are closed to new accounts and additional purchases, except for exchanges and reinvestments. Each class has exclusive voting rights with respect to matters that affect that class. Class B shares will automatically convert to Class A shares after a holding period of seven years from the initial date of purchase.
2. Investments in Fidelity Central Funds.
The Fund invests in Fidelity Central Funds, which are open-end investment companies generally available only to other investment companies and accounts managed by the investment adviser and its affiliates. The Fund's Schedule of Investments lists each of the Fidelity Central Funds held as of period end, if any, as an investment of the Fund, but does not include the underlying holdings of each Fidelity Central Fund. As an Investing Fund, the Fund indirectly bears its proportionate share of the expenses of the underlying Fidelity Central Funds.
The Money Market Central Funds seek preservation of capital and current income and are managed by Fidelity Investments Money Management, Inc. (FIMM), an affiliate of the investment adviser. Annualized expenses of the Money Market Central Funds as of their most recent shareholder report date are less than .01%.
A complete unaudited list of holdings for each Fidelity Central Fund is available upon request or at the Securities and Exchange Commission (the SEC) website at www.sec.gov. In addition, the financial statements of the Fidelity Central Funds, which are not covered by the Fund's Report of Independent Registered Public Accounting Firm, are available on the SEC website or upon request.
3. Significant Accounting Policies.
The financial statements have been prepared in conformity with accounting principles generally accepted in the United States of America (GAAP), which require management to make certain estimates and assumptions at the date of the financial statements. Actual results could differ from those estimates. Subsequent events, if any, through the date that the financial statements were issued have been evaluated in the preparation of the financial statements. The following summarizes the significant accounting policies of the Fund:
Annual Report
3. Significant Accounting Policies - continued
Investment Valuation. Investments are valued as of 4:00 p.m. Eastern time on the last calendar day of the period. In accordance with valuation policies and procedures approved by the Board of Trustees (the Board), the Fund attempts to obtain prices from one or more third party pricing vendors or brokers to value its investments. When current market prices, quotations or currency exchange rates are not readily available or reliable, investments will be fair valued in good faith by the Fidelity Management & Research Company (FMR) Fair Value Committee (the Committee), in accordance with procedures adopted by the Board. Factors used in determining fair value vary by investment type and may include market or investment specific events. The frequency with which these procedures are used cannot be predicted and they may be utilized to a significant extent. The Committee oversees the Fund's valuation policies and procedures and is responsible for approving and reporting to the Board all fair value determinations.
The Fund categorizes the inputs to valuation techniques used to value its investments into a disclosure hierarchy consisting of three levels as shown below:
Level 1 - quoted prices in active markets for identical investments
Level 2 - other significant observable inputs (including quoted prices for similar investments, interest rates, prepayment speeds, etc.)
Level 3 - unobservable inputs (including the Fund's own assumptions based on the best information available)
Valuation techniques used to value the Fund's investments by major category are as follows:
Equity securities, including restricted securities, for which market quotations are readily available, are valued at the last reported sale price or official closing price as reported by a third party pricing vendor on the primary market or exchange on which they are traded and are categorized as Level 1 in the hierarchy. In the event there were no sales during the day or closing prices are not available, securities are valued at the last quoted bid price or may be valued using the last available price and are generally categorized as Level 2 in the hierarchy. For foreign equity securities, when market or security specific events arise, comparisons to the valuation of American Depositary Receipts (ADRs), futures contracts, Exchange-Traded Funds (ETFs) and certain indexes as well as quoted prices for similar securities may be used and would be categorized as Level 2 in the hierarchy. Utilizing these techniques may result in transfers between Level 1 and Level 2. For equity securities, including restricted securities, where observable inputs are limited, assumptions about market activity and risk are used and these securities may be categorized as Level 3 in the hierarchy.
Annual Report
Notes to Financial Statements - continued
3. Significant Accounting Policies - continued
Investment Valuation - continued
Investments in open-end mutual funds, including the Fidelity Central Funds, are valued at their closing net asset value (NAV) each business day and are categorized as Level 1 in the hierarchy.
Changes in valuation techniques may result in transfers in or out of an assigned level within the disclosure hierarchy. The aggregate value of investments by input level, as of October 31, 2014, including information on transfers between Levels 1 and 2, is included at the end of the Fund's Schedule of Investments.
Foreign Currency. The Fund may use foreign currency contracts to facilitate transactions in foreign-denominated securities. Gains and losses from these transactions may arise from changes in the value of the foreign currency or if the counterparties do not perform under the contracts' terms.
Foreign-denominated assets, including investment securities, and liabilities are translated into U.S. dollars at the exchange rates at period end. Purchases and sales of investment securities, income and dividends received and expenses denominated in foreign currencies are translated into U.S. dollars at the exchange rate in effect on the transaction date.
The effects of exchange rate fluctuations on investments are included with the net realized and unrealized gain (loss) on investment securities. Other foreign currency transactions resulting in realized and unrealized gain (loss) are disclosed separately.
Investment Transactions and Income. For financial reporting purposes, the Fund's investment holdings and NAV include trades executed through the end of the last business day of the period. The NAV per share for processing shareholder transactions is calculated as of the close of business of the New York Stock Exchange (NYSE), normally 4:00 p.m. Eastern time and includes trades executed through the end of the prior business day. Gains and losses on securities sold are determined on the basis of identified cost and may include proceeds received from litigation. Dividend income is recorded on the ex-dividend date, except for certain dividends from foreign securities where the ex-dividend date may have passed, which are recorded as soon as the Fund is informed of the ex-dividend date. Non-cash dividends included in dividend income, if any, are recorded at the fair market value of the securities received. Income and capital gain distributions from Fidelity Central Funds, if any, are recorded on the ex-dividend date. Investment income is recorded net of foreign taxes withheld where recovery of such taxes is uncertain.
Annual Report
3. Significant Accounting Policies - continued
Class Allocations and Expenses. Investment income, realized and unrealized capital gains and losses, common expenses of the Fund, and certain fund-level expense reductions, if any, are allocated daily on a pro-rata basis to each class based on the relative net assets of each class to the total net assets of the Fund. Each class differs with respect to transfer agent and distribution and service plan fees incurred. Certain expense reductions may also differ by class. For the reporting period, the allocated portion of income and expenses to each class as a percent of its average net assets may vary due to the timing of recording these transactions in relation to fluctuating net assets of the classes. Expenses directly attributable to a fund are charged to that fund. Expenses attributable to more than one fund are allocated among the respective funds on the basis of relative net assets or other appropriate methods. Expense estimates are accrued in the period to which they relate and adjustments are made when actual amounts are known.
Income Tax Information and Distributions to Shareholders. Each year, the Fund intends to qualify as a regulated investment company under Subchapter M of the Internal Revenue Code, including distributing substantially all of its taxable income and realized gains. As a result, no provision for U.S. Federal income taxes is required. As of October 31, 2014, the Fund did not have any unrecognized tax benefits in the financial statements; nor is the Fund aware of any tax positions for which it is reasonably possible that the total amounts of unrecognized tax benefits will significantly change in the next twelve months. The Fund files a U.S. federal tax return, in addition to state and local tax returns as required. The Fund's federal income tax returns are subject to examination by the Internal Revenue Service (IRS) for a period of three fiscal years after they are filed. State and local tax returns may be subject to examination for an additional fiscal year depending on the jurisdiction. Foreign taxes are provided for based on the Fund's understanding of the tax rules and rates that exist in the foreign markets in which it invests. The Fund is subject to a tax imposed on capital gains by certain countries in which it invests. An estimated deferred tax liability for net unrealized appreciation on the applicable securities is included in Other payables and accrued expenses on the Statement of Assets & Liabilities.
Distributions are declared and recorded on the ex-dividend date. Income dividends and capital gain distributions are declared separately for each class. Income and capital gain distributions are determined in accordance with income tax regulations, which may differ from GAAP. In addition, the Fund claimed a portion of the payment made to redeeming shareholders as a distribution for income tax purposes.
Capital accounts within the financial statements are adjusted for permanent book-tax differences. These adjustments have no impact on net assets or the results of operations. Capital accounts are not adjusted for temporary book-tax differences which will reverse in a subsequent period.
Annual Report
Notes to Financial Statements - continued
3. Significant Accounting Policies - continued
Income Tax Information and Distributions to Shareholders - continued
Book-tax differences are primarily due to foreign currency transactions, passive foreign investment companies (PFIC), partnerships, capital loss carryforwards and losses deferred due to wash sales.
The federal tax cost of investment securities and unrealized appreciation (depreciation) as of period end were as follows:
Gross unrealized appreciation | $ 110,999,674 |
Gross unrealized depreciation | (22,777,849) |
Net unrealized appreciation (depreciation) on securities | $ 88,221,825 |
| |
Tax Cost | $ 854,018,108 |
The tax-based components of distributable earnings as of period end were as follows:
Undistributed ordinary income | $ 6,829,762 |
Capital loss carryforward | $ (8,517,174) |
Net unrealized appreciation (depreciation) on securities and other investments | $ 88,155,149 |
Capital loss carryforwards are only available to offset future capital gains of the Fund to the extent provided by regulations and may be limited. Under the Regulated Investment Company Modernization Act of 2010 (the Act), the Fund is permitted to carry forward capital losses incurred in taxable years beginning after December 22, 2010 for an unlimited period and such capital losses are required to be used prior to any losses that expire. The capital loss carryforward information presented below, including any applicable limitation, is estimated as of fiscal period end and is subject to adjustment.
No expiration | |
Short-term | (7,236,154) |
Long-term | (1,281,020) |
Total no expiration | (8,517,174) |
The tax character of distributions paid was as follows:
| October 31, 2014 | October 31, 2013 |
Ordinary Income | $ 2,592,642 | $ 2,195,105 |
Long-term Capital Gains | 513,442 | - |
Total | $ 3,106,084 | $ 2,195,105 |
Annual Report
3. Significant Accounting Policies - continued
Short-Term Trading (Redemption) Fees. Shares held by investors in the Fund less than 30 days may have been subject to a redemption fee equal to 1.00% of the NAV of shares redeemed. All redemption fees, which reduce the proceeds of the shareholder redemption, are retained by the Fund and accounted for as an addition to paid in capital.
New Accounting Pronouncement. In June 2014, the Financial Accounting Standards Board issued Accounting Standard Update No. 2014-11, Repurchase-to-Maturity Transactions, Repurchase Financings, and Disclosures. The Update amends the accounting for certain repurchase agreements and expands disclosure requirements for reverse repurchase agreements, securities lending and other similar transactions. The disclosure requirements are effective for annual and interim reporting periods beginning after December 15, 2014. Management is currently evaluating the impact of the Update on the Fund's financial statements and related disclosures.
4. Purchases and Sales of Investments.
Purchases and sales of securities, other than short-term securities, aggregated $523,591,304 and $200,715,697, respectively.
5. Fees and Other Transactions with Affiliates.
Management Fee. Fidelity Management & Research Company and its affiliates provide the Fund with investment management related services for which the Fund pays a monthly management fee. The management fee is the sum of an individual fund fee rate that is based on an annual rate of .45% of the Fund's average net assets and an annualized group fee rate that averaged .25% during the period. The group fee rate is based upon the average net assets of all the mutual funds advised by the investment adviser, including any mutual funds previously advised by the investment adviser that are currently advised by Fidelity SelectCo, LLC, an affiliate of the investment adviser. The group fee rate decreases as assets under management increase and increases as assets under management decrease. In addition, the management fee is subject to a performance adjustment (up to a maximum of ± .20% of the Fund's average net assets over a 36 month performance period). The upward or downward adjustment to the management fee is based on the relative investment performance of International Growth as compared to its benchmark index, the MSCI EAFE Growth Index, over the same 36 month performance period. For the reporting period, the total annual management fee rate, including the performance adjustment, was .75% of the Fund's average net assets. The performance adjustment included in the management fee rate may be higher or lower than the maximum performance adjustment rate due to the difference between the average net assets for the reporting and performance periods.
Annual Report
Notes to Financial Statements - continued
5. Fees and Other Transactions with Affiliates - continued
Distribution and Service Plan Fees. In accordance with Rule 12b-1 of the 1940 Act, the Fund has adopted separate Distribution and Service Plans for each class of shares. Certain classes pay Fidelity Distributors Corporation (FDC), an affiliate of the investment adviser, separate Distribution and Service Fees, each of which is based on an annual percentage of each class' average net assets. In addition, FDC may pay financial intermediaries for selling shares of the Fund and providing shareholder support services. For the period, the Distribution and Service Fee rates, total fees and amounts retained by FDC were as follows:
| Distribution
Fee | Service
Fee | Total Fees | Retained
by FDC |
Class A | -% | .25% | $ 254,598 | $ 7,801 |
Class T | .25% | .25% | 131,110 | - |
Class B | .75% | .25% | 15,512 | 11,650 |
Class C | .75% | .25% | 276,397 | 95,761 |
| | | $ 677,617 | $ 115,212 |
Sales Load. FDC may receive a front-end sales charge of up to 5.75% for selling Class A shares and 3.50% for selling Class T shares, some of which is paid to financial intermediaries for selling shares of the Fund. Depending on the holding period, FDC may receive contingent deferred sales charges levied on Class A, Class T, Class B, and Class C redemptions. The deferred sales charges range from 5.00% to 1.00% for Class B shares, 1.00% for Class C shares, 1.00% for certain purchases of Class A shares and .25% for certain purchases of Class T shares.
For the period, sales charge amounts retained by FDC were as follows:
| Retained
by FDC |
Class A | $ 86,435 |
Class T | 14,136 |
Class B* | 528 |
Class C* | 3,947 |
| $ 105,046 |
* When Class B and Class C shares are initially sold, FDC pays commissions from its own resources to financial intermediaries through which the sales are made.
Transfer Agent Fees. Fidelity Investments Institutional Operations Company, Inc., (FIIOC), an affiliate of the investment adviser, is the transfer, dividend disbursing and shareholder servicing agent for each class of the Fund. FIIOC receives account fees and asset-based fees that vary according to the account size and type of account of the
Annual Report
5. Fees and Other Transactions with Affiliates - continued
Transfer Agent Fees - continued
shareholders of the respective classes of the Fund, except for Class Z. FIIOC receives an asset-based fee of Class Z's average net assets. FIIOC pays for typesetting, printing and mailing of shareholder reports, except proxy statements.
For the period, transfer agent fees for each class were as follows:
| Amount | % of
Class-Level Average
Net Assets |
Class A | $ 265,803 | .26 |
Class T | 81,975 | .31 |
Class B | 4,755 | .31 |
Class C | 79,887 | .29 |
International Growth | 1,083,784 | .20 |
Institutional Class | 171,407 | .21 |
Class Z | 50 | .05 |
| $ 1,687,661 | |
Accounting and Security Lending Fees. Fidelity Service Company, Inc. (FSC), an affiliate of the investment adviser, maintains the Fund's accounting records. The accounting fee is based on the level of average net assets for each month. Under a separate contract, FSC administers the security lending program. The security lending fee is based on the number and duration of lending transactions.
Brokerage Commissions. The Fund placed a portion of its portfolio transactions with brokerage firms which are affiliates of the investment adviser. Brokerage commissions are included in net realized gain (loss) and change in net unrealized appreciation (depreciation) in the Statement of Operations. The commissions paid to these affiliated firms were $1,309 for the period.
Other. During the period, the investment adviser reimbursed the Fund for certain losses in the amount of $4,581.
6. Committed Line of Credit.
The Fund participates with other funds managed by the investment adviser or an affiliate in a $4.25 billion credit facility (the "line of credit") to be utilized for temporary or emergency purposes to fund shareholder redemptions or for other short-term liquidity purposes. The Fund has agreed to pay commitment fees on its pro-rata portion of the line of credit, which amounted to $1,181 and is reflected in Miscellaneous expenses on the Statement of Operations. During the period, the Fund did not borrow on this line of credit.
Annual Report
Notes to Financial Statements - continued
7. Security Lending.
The Fund lends portfolio securities through a lending agent from time to time in order to earn additional income. For equity securities, a lending agent is used and may loan securities to certain qualified borrowers, including Fidelity Capital Markets (FCM), a broker-dealer affiliated with the Fund. On the settlement date of the loan, the Fund receives collateral (in the form of U.S. Treasury obligations, letters of credit and/or cash) against the loaned securities and maintains collateral in an amount not less than 100% of the market value of the loaned securities during the period of the loan. The market value of the loaned securities is determined at the close of business of the Fund and any additional required collateral is delivered to the Fund on the next business day. If the borrower defaults on its obligation to return the securities loaned because of insolvency or other reasons, the Fund may apply collateral received from the borrower against the obligation. The Fund may experience delays and costs in recovering the securities loaned. Any cash collateral received is invested in the Fidelity Securities Lending Cash Central Fund. The value of loaned securities and cash collateral at period end are disclosed on the Fund's Statement of Assets and Liabilities. The value of securities loaned to FCM at period end was $819,854. Security lending income represents the income earned on investing cash collateral, less rebates paid to borrowers and any lending agent fees associated with the loan, plus any premium payments received for lending certain types of securities. Security lending income is presented in the Statement of Operations as a component of income from Fidelity Central Funds. Total security lending income during the period amounted to $325,646, including $14,631 from securities loaned to FCM.
8. Expense Reductions.
Commissions paid to certain brokers with whom the investment adviser, or its affiliates, places trades on behalf of the Fund include an amount in addition to trade execution, which may be rebated back to the Fund to offset certain expenses. This amount totaled $6,405 for the period. In addition, through arrangements with the Fund's custodian, credits realized as a result of uninvested cash balances were used to reduce the Fund's expenses. During the period, these credits reduced the Fund's custody expenses by $37.
In addition, the investment adviser reimbursed a portion of the Fund's operating expenses during the period in the amount of $4,248.
Annual Report
9. Distributions to Shareholders.
Distributions to shareholders of each class were as follows:
Years ended October 31, | 2014 | 2013 |
From net investment income | | |
Class A | $ 253,092 | $ 226,330 |
Class T | 40,595 | 86,155 |
Class B | - | 4,290 |
Class C | - | 14,481 |
International Growth | 2,051,403 | 1,698,830 |
Institutional Class | 246,949 | 51,250 |
Class Z | 604 | - |
Total | $ 2,592,643 | $ 2,081,336 |
From net realized gain | | |
Class A | $ 66,995 | $ 13,472 |
Class T | 20,298 | 6,243 |
Class B | 1,337 | 631 |
Class C | 16,479 | 3,291 |
International Growth | 369,252 | 87,569 |
Institutional Class | 38,992 | 2,563 |
Class Z | 88 | - |
Total | $ 513,441 | $ 113,769 |
10. Share Transactions.
Share transactions for each class were as follows and may contain automatic conversions between classes or exchanges between funds:
| Shares | Dollars |
Years ended October 31, | 2014 | 2013A | 2014 | 2013A |
Class A | | | | |
Shares sold | 6,584,484 | 5,907,169 | $ 72,326,606 | $ 58,500,264 |
Reinvestment of distributions | 27,068 | 24,178 | 291,793 | 218,566 |
Shares redeemed | (2,724,911) | (1,466,703) | (30,099,985) | (14,226,261) |
Net increase (decrease) | 3,886,641 | 4,464,644 | $ 42,518,414 | $ 44,492,569 |
Class T | | | | |
Shares sold | 834,072 | 1,144,706 | $ 9,114,198 | $ 11,429,141 |
Reinvestment of distributions | 5,459 | 10,086 | 58,733 | 91,076 |
Shares redeemed | (585,464) | (206,178) | (6,459,248) | (2,020,899) |
Net increase (decrease) | 254,067 | 948,614 | $ 2,713,683 | $ 9,499,318 |
Class B | | | | |
Shares sold | 35,020 | 70,442 | $ 380,789 | $ 702,618 |
Reinvestment of distributions | 123 | 531 | 1,323 | 4,806 |
Shares redeemed | (53,583) | (49,437) | (587,919) | (483,935) |
Net increase (decrease) | (18,440) | 21,536 | $ (205,807) | $ 223,489 |
Annual Report
Notes to Financial Statements - continued
10. Share Transactions - continued
| Shares | Dollars |
Years ended October 31, | 2014 | 2013A | 2014 | 2013A |
Class C | | | | |
Shares sold | 1,827,859 | 1,392,365 | $ 19,884,401 | $ 13,520,584 |
Reinvestment of distributions | 1,498 | 1,911 | 16,049 | 17,237 |
Shares redeemed | (426,678) | (424,469) | (4,637,384) | (4,120,400) |
Net increase (decrease) | 1,402,679 | 969,807 | $ 15,263,066 | $ 9,417,421 |
International Growth | | | | |
Shares sold | 27,835,093 | 29,198,608 | $ 307,440,711 | $ 290,678,738 |
Reinvestment of distributions | 197,948 | 192,126 | 2,143,781 | 1,742,585 |
Shares redeemed | (10,494,762) | (6,365,570) | (115,997,211) | (62,814,771) |
Net increase (decrease) | 17,538,279 | 23,025,164 | $ 193,587,281 | $ 229,606,552 |
Institutional Class | | | | |
Shares sold | 10,292,704 | 3,568,741 | $ 113,864,505 | $ 35,951,935 |
Reinvestment of distributions | 24,180 | 5,682 | 261,623 | 51,476 |
Shares redeemed | (2,927,192) | (443,392) | (31,428,962) | (4,427,602) |
Net increase (decrease) | 7,389,692 | 3,131,031 | $ 82,697,166 | $ 31,575,809 |
Class Z | | | | |
Shares sold | - | 9,747 | $ - | $ 100,000 |
Reinvestment of distributions | 64 | - | 692 | - |
Shares redeemed | (475) | - | (5,267) | - |
Net increase (decrease) | (411) | 9,747 | $ (4,575) | $ 100,000 |
A Share transactions for Class Z are for the period August 13, 2013 (commencement of sale of shares) to October 31, 2013.
11. Other.
The Fund's organizational documents provide former and current trustees and officers with a limited indemnification against liabilities arising in connection with the performance of their duties to the Fund. In the normal course of business, the Fund may also enter into contracts that provide general indemnifications. The Fund's maximum exposure under these arrangements is unknown as this would be dependent on future claims that may be made against the Fund. The risk of material loss from such claims is considered remote.
Annual Report
To the Trustees of Fidelity Investment Trust and the Shareholders of Fidelity International Growth Fund:
In our opinion, the accompanying statement of assets and liabilities, including the schedule of investments, and the related statements of operations and of changes in net assets and the financial highlights present fairly, in all material respects, the financial position of Fidelity International Growth Fund (a fund of Fidelity Investment Trust) at October 31, 2014, the results of its operations for the year then ended, the changes in its net assets for each of the two years in the period then ended and the financial highlights for each of the periods indicated, in conformity with accounting principles generally accepted in the United States of America. These financial statements and financial highlights (hereafter referred to as "financial statements") are the responsibility of the Fidelity International Growth Fund's management. Our responsibility is to express an opinion on these financial statements based on our audits. We conducted our audits of these financial statements in accordance with the standards of the Public Company Accounting Oversight Board (United States). Those standards require that we plan and perform the audit to obtain reasonable assurance about whether the financial statements are free of material misstatement. An audit includes examining, on a test basis, evidence supporting the amounts and disclosures in the financial statements, assessing the accounting principles used and significant estimates made by management, and evaluating the overall financial statement presentation. We believe that our audits, which included confirmation of securities at October 31, 2014 by correspondence with the custodian and brokers, provide a reasonable basis for our opinion.
PricewaterhouseCoopers LLP
Boston, Massachusetts
December 18, 2014
Annual Report
The Trustees, Member of the Advisory Board, and officers of the trust and fund, as applicable, are listed below. The Board of Trustees governs the fund and is responsible for protecting the interests of shareholders. The Trustees are experienced executives who meet periodically throughout the year to oversee the fund's activities, review contractual arrangements with companies that provide services to the fund, oversee management of the risks associated with such activities and contractual arrangements, and review the fund's performance. Except for James C. Curvey, each of the Trustees oversees 174 funds. Mr. Curvey oversees 407 funds.
The Trustees hold office without limit in time except that (a) any Trustee may resign; (b) any Trustee may be removed by written instrument, signed by at least two-thirds of the number of Trustees prior to such removal; (c) any Trustee who requests to be retired or who has become incapacitated by illness or injury may be retired by written instrument signed by a majority of the other Trustees; and (d) any Trustee may be removed at any special meeting of shareholders by a two-thirds vote of the outstanding voting securities of the trust. Each Trustee who is not an interested person (as defined in the 1940 Act) of the trust and the fund (Independent Trustee), shall retire not later than the last day of the calendar year in which his or her 75th birthday occurs. The Independent Trustees may waive this mandatory retirement age policy with respect to individual Trustees. The officers and Advisory Board Member hold office without limit in time, except that any officer and Advisory Board Member may resign or may be removed by a vote of a majority of the Trustees at any regular meeting or any special meeting of the Trustees. Except as indicated, each individual has held the office shown or other offices in the same company for the past five years.
Experience, Skills, Attributes, and Qualifications of the Fund's Trustees. The Governance and Nominating Committee has adopted a statement of policy that describes the experience, qualifications, attributes, and skills that are necessary and desirable for potential Independent Trustee candidates (Statement of Policy). The Board believes that each Trustee satisfied at the time he or she was initially elected or appointed a Trustee, and continues to satisfy, the standards contemplated by the Statement of Policy. The Governance and Nominating Committee also engages professional search firms to help identify potential Independent Trustee candidates who have the experience, qualifications, attributes, and skills consistent with the Statement of Policy. From time to time, additional criteria based on the composition and skills of the current Independent Trustees, as well as experience or skills that may be appropriate in light of future changes to board composition, business conditions, and regulatory or other developments, have also been considered by the professional search firms and the Governance and Nominating Committee. In addition, the Board takes into account the Trustees' commitment and participation in Board and committee meetings, as well as their leadership of standing and ad hoc committees throughout their tenure.
In determining that a particular Trustee was and continues to be qualified to serve as a Trustee, the Board has considered a variety of criteria, none of which, in isolation, was controlling. The Board believes that, collectively, the Trustees have balanced and diverse experience, qualifications, attributes, and skills, which allow the Board to operate effectively in governing the fund and protecting the interests of shareholders. Information about the specific experience, skills, attributes, and qualifications of each Trustee, which in each case led to the Board's conclusion that the Trustee should serve (or continue to serve) as a trustee of the fund, is provided below.
Annual Report
Board Structure and Oversight Function. James C. Curvey is an interested person (as defined in the 1940 Act) and currently serves as Chairman. The Trustees have determined that an interested Chairman is appropriate and benefits shareholders because an interested Chairman has a personal and professional stake in the quality and continuity of services provided to the fund. Independent Trustees exercise their informed business judgment to appoint an individual of their choosing to serve as Chairman, regardless of whether the Trustee happens to be independent or a member of management. The Independent Trustees have determined that they can act independently and effectively without having an Independent Trustee serve as Chairman and that a key structural component for assuring that they are in a position to do so is for the Independent Trustees to constitute a substantial majority for the Board. The Independent Trustees also regularly meet in executive session. Ned C. Lautenbach serves as Chairman of the Independent Trustees and as such (i) acts as a liaison between the Independent Trustees and management with respect to matters important to the Independent Trustees and (ii) with management prepares agendas for Board meetings.
Fidelity funds are overseen by different Boards of Trustees. The fund's Board oversees Fidelity's equity and high income funds and another Board oversees Fidelity's investment-grade bond, money market, and asset allocation funds. The asset allocation funds may invest in Fidelity funds overseen by the fund's Board. The use of separate Boards, each with its own committee structure, allows the Trustees of each group of Fidelity funds to focus on the unique issues of the funds they oversee, including common research, investment, and operational issues. On occasion, the separate Boards establish joint committees to address issues of overlapping consequences for the Fidelity funds overseen by each Board.
The Trustees operate using a system of committees to facilitate the timely and efficient consideration of all matters of importance to the Trustees, the fund, and fund shareholders and to facilitate compliance with legal and regulatory requirements and oversight of the fund's activities and associated risks. The Board, acting through its committees, has charged FMR and its affiliates with (i) identifying events or circumstances the occurrence of which could have demonstrably adverse effects on the fund's business and/or reputation; (ii) implementing processes and controls to lessen the possibility that such events or circumstances occur or to mitigate the effects of such events or circumstances if they do occur; and (iii) creating and maintaining a system designed to evaluate continuously business and market conditions in order to facilitate the identification and implementation processes described in (i) and (ii) above. Because the day-to-day operations and activities of the fund are carried out by or through FMR, its affiliates and other service providers, the fund's exposure to risks is mitigated but not eliminated by the processes overseen by the Trustees. While each of the Board's committees has responsibility for overseeing different aspects of the fund's activities, oversight is exercised primarily through the Operations, Audit, and Compliance Committees. In addition, the Independent Trustees have worked with FMR to enhance the Board's oversight of investment and financial risks, legal and regulatory risks, technology risks, and operational risks, including the development of additional risk reporting to the Board. For example, a working group comprised of Independent Trustees and FMR has worked and continues to work to review the Fidelity funds' valuation-related activities, reporting and risk management. Appropriate personnel, including but not limited to the fund's Chief Compliance Officer (CCO), FMR's internal auditor, the independent accountants, the fund's Treasurer and portfolio management personnel, make periodic reports to the Board's committees, as appropriate, including an annual review of FMR's risk management program for the Fidelity funds. The responsibilities of each standing committee, including their oversight responsibilities, are described further under "Standing Committees of the Fund's Trustees."
Annual Report
Trustees and Officers - continued
The fund's Statement of Additional Information (SAI) includes more information about the Trustees. To request a free copy, call Fidelity at 1-877-208-0098.
Interested Trustees*:
Correspondence intended for each Trustee who is an interested person may be sent to Fidelity Investments, 245 Summer Street, Boston, Massachusetts 02210.
Name, Year of Birth; Principal Occupations and Other Relevant Experience+ |
James C. Curvey (1935) |
Year of Election or Appointment: 2007 Trustee Chairman of the Board of Trustees |
| Mr. Curvey also serves as Trustee of other Fidelity funds. Mr. Curvey is a Director of Fidelity Research & Analysis Co. (2009-present), and Vice Chairman (2007-present) and Director of FMR LLC. In addition, Mr. Curvey serves as an Overseer for the Boston Symphony Orchestra and a member of the board of Artis-Naples, Naples, Florida, and as a Trustee for Brewster Academy, Wolfeboro, New Hampshire. Previously, Mr. Curvey served as a Director of Fidelity Investments Money Management, Inc. (2009-2014), a Director of FMR (2007-2014), and a Director of FMR Co., Inc. (2007-2014). |
Charles S. Morrison (1960) |
Year of Election or Appointment: 2014 Trustee |
| Mr. Morrison also serves as Trustee of other funds. He serves as a Director of Fidelity Investments Money Management, Inc. (FIMM) (2014-present), Director of Fidelity SelectCo, LLC (2014-present), President, Asset Management (2014-present), and is an employee of Fidelity Investments. Previously, Mr. Morrison served as Vice President of Fidelity's Fixed Income and Asset Allocation Funds (2012-2014), President, Fixed Income (2011-2014), Vice President of Fidelity's Money Market Funds (2005-2009), President, Money Market Group Leader of FMR (2009), and Senior Vice President, Money Market Group of FMR (2004-2009). Mr. Morrison also served as Vice President of Fidelity's Bond Funds (2002-2005), certain Balanced Funds (2002-2005), and certain Asset Allocation Funds (2002-2007), and as Senior Vice President (2002-2005) of Fidelity's Bond Division. |
* Trustees have been determined to be "Interested Trustees" by virtue of, among other things, their affiliation with the trust or various entities under common control with FMR.
+ The information above includes each Trustee's principal occupation during the last five years and other information relating to the experience, attributes, and skills relevant to each Trustee's qualifications to serve as a Trustee, which led to the conclusion that each Trustee should serve as a Trustee for the fund.
Annual Report
Trustees and Officers - continued
Independent Trustees:
Correspondence intended for each Independent Trustee (that is, the Trustees other than the Interested Trustees) may be sent to Fidelity Investments, P.O. Box 55235, Boston, Massachusetts 02205-5235.
Name, Year of Birth; Principal Occupations and Other Relevant Experience+ |
Dennis J. Dirks (1948) |
Year of Election or Appointment: 2005 Trustee |
| Mr. Dirks also serves as Trustee of other Fidelity funds. Prior to his retirement in May 2003, Mr. Dirks was Chief Operating Officer and a member of the Board of The Depository Trust & Clearing Corporation (DTCC). He also served as President, Chief Operating Officer, and Board member of The Depository Trust Company (DTC) and President and Board member of the National Securities Clearing Corporation (NSCC). In addition, Mr. Dirks served as Chief Executive Officer and Board member of the Government Securities Clearing Corporation, Chief Executive Officer and Board member of the Mortgage-Backed Securities Clearing Corporation, as a Trustee and a member of the Finance Committee of Manhattan College (2005-2008), and as a Trustee and a member of the Finance Committee of AHRC of Nassau County (2006-2008). Mr. Dirks is a member of the Independent Directors Council (IDC) Governing Council (2010-present) and Board of Directors for The Brookville Center for Children's Services, Inc. (2009-present). |
Alan J. Lacy (1953) |
Year of Election or Appointment: 2008 Trustee |
| Mr. Lacy also serves as Trustee of other Fidelity funds. Mr. Lacy serves as Senior Adviser (2007-present) of Oak Hill Capital Partners, L.P. (private equity). Mr. Lacy also served as Chief Executive Officer (2000-2005) and Vice Chairman (2005-2006) of Sears Holdings Corporation and Sears, Roebuck and Co. (retail). In addition, Mr. Lacy serves as a member of the Board of Directors of Dave & Buster's Entertainment, Inc. (restaurant and entertainment complexes, 2010-present), Earth Fare, Inc. (retail grocery, 2012-present), The Hillman Companies, Inc. (hardware wholesalers, 2010-present), and Bristol-Myers Squibb Company (global pharmaceuticals, 2008-present). Mr. Lacy is a member of the Board of Trustees of The National Parks Conservation Association (2006-present). Previously, Mr. Lacy served as Chairman of the Board of Trustees of the National Parks Conservation Association (2008-2011) and as a member of the Board of Directors for the Western Union Company (global money transfer, 2006-2011). |
Ned C. Lautenbach (1944) |
Year of Election or Appointment: 2000 Trustee Chairman of the Independent Trustees |
| Mr. Lautenbach also serves as Trustee of other Fidelity funds. Mr. Lautenbach currently serves as the Lead Director of the Eaton Corporation Board of Directors (diversified industrial, 1997-present). Mr. Lautenbach is Chairman of the Board of Directors of the Philharmonic Center for the Arts in Naples, Florida (2012-present) and a member of the Council on Foreign Relations (1994-present). Previously, Mr. Lautenbach was a Partner/Advisory Partner at Clayton, Dubilier & Rice, LLC (private equity investment, 1998-2010), as well as a Director of Sony Corporation (2006-2007). |
Joseph Mauriello (1944) |
Year of Election or Appointment: 2008 Trustee |
| Mr. Mauriello also serves as Trustee of other Fidelity funds. Prior to his retirement in January 2006, Mr. Mauriello served in numerous senior management positions including Deputy Chairman and Chief Operating Officer (2004-2005), and Vice Chairman of Financial Services (2002-2004) of KPMG LLP US (professional services, 1965-2005). Mr. Mauriello currently serves as a member of the Board of Directors of XL Group plc. (global insurance and re-insurance, 2006-present). Previously, Mr. Mauriello served as a Director of the Hamilton Funds of the Bank of New York (2006-2007) and of Arcadia Resources Inc. (health care services and products, 2007-2012). |
Robert W. Selander (1950) |
Year of Election or Appointment: 2011 Trustee |
| Mr. Selander also serves as Trustee of other Fidelity funds. Previously, Mr. Selander served as a Member of the Advisory Board of other Fidelity funds (2011), and Executive Vice Chairman (2010), Chief Executive Officer (2009-2010), and President and Chief Executive Officer (1997-2009) of Mastercard, Inc. |
Cornelia M. Small (1944) |
Year of Election or Appointment: 2005 Trustee |
| Ms. Small also serves as Trustee of other Fidelity funds. Ms. Small is a member of the Board of Directors (2009-present) and Chair of the Investment Committee (2010-present) of the Teagle Foundation. Ms. Small also serves on the Investment Committee of the Berkshire Taconic Community Foundation (2008-present). Previously, Ms. Small served as Chairperson (2002-2008) and a member of the Investment Committee and Chairperson (2008-2012) and a member of the Board of Trustees of Smith College. In addition, Ms. Small served as Chief Investment Officer, Director of Global Equity Investments, and a member of the Board of Directors of Scudder, Stevens & Clark and Scudder Kemper Investments. |
William S. Stavropoulos (1939) |
Year of Election or Appointment: 2001 Trustee Vice Chairman of the Independent Trustees |
| Mr. Stavropoulos also serves as Trustee of other Fidelity funds. Mr. Stavropoulos serves as President and Founder of the Michigan Baseball Foundation, the Great Lakes Loons (2007-present). Mr. Stavropoulos is Chairman Emeritus of the Board of Directors of The Dow Chemical Company, where he previously served in numerous senior management positions, including President, CEO (1995-2000; 2002-2004), Chairman of the Executive Committee (2000-2006), and as a member of the Board of Directors (1990-2006). Currently, Mr. Stavropoulos is Chairman of the Board of Directors of Univar Inc. (global distributor of commodity and specialty chemicals), a Director of Teradata Corporation (data warehousing and technology solutions), and Maersk Inc. (industrial conglomerate), and a member of the Advisory Board for Metalmark Capital LLC (private equity investment, 2005-present). Mr. Stavropoulos is an operating advisor to Clayton, Dubilier & Rice, LLC (private equity investment). In addition, Mr. Stavropoulos is a member of the University of Notre Dame Advisory Council for the College of Science, a Trustee of the Rollin L. Gerstacker Foundation, and a Director of the Naples Philharmonic Center for the Arts. Previously, Mr. Stavropoulos served as a Director of Chemical Financial Corporation (bank holding company, 1993-2012) and Tyco International, Ltd. (multinational manufacturing and services, 2007-2012). |
David M. Thomas (1949) |
Year of Election or Appointment: 2008 Trustee |
| Mr. Thomas also serves as Trustee of other Fidelity funds. Mr. Thomas serves as Non-Executive Chairman of the Board of Directors of Fortune Brands Home and Security (home and security products, 2011-present), and as a member of the Board of Directors of Interpublic Group of Companies, Inc. (marketing communication, 2004-present). Previously, Mr. Thomas served as Executive Chairman (2005-2006) and Chairman and Chief Executive Officer (2000-2005) of IMS Health, Inc. (pharmaceutical and healthcare information solutions), and a Director of Fortune Brands, Inc. (consumer products, 2000-2011). |
+ The information above includes each Trustee's principal occupation during the last five years and other information relating to the experience, attributes, and skills relevant to each Trustee's qualifications to serve as a Trustee, which led to the conclusion that each Trustee should serve as a Trustee for the fund.
Advisory Board Member and Officers:
Correspondence intended for each officer and Peter S. Lynch may be sent to Fidelity Investments, 245 Summer Street, Boston, Massachusetts 02210. Officers appear below in alphabetical order.
Name, Year of Birth; Principal Occupation |
Peter S. Lynch (1944) |
Year of Election or Appointment: 2003 Member of the Advisory Board |
| Mr. Lynch also serves as Member of the Advisory Board of other Fidelity funds. Mr. Lynch is Vice Chairman and a Director of FMR and FMR Co., Inc. In addition, Mr. Lynch serves as a Trustee of Boston College and as the Chairman of the Inner-City Scholarship Fund. Previously, Mr. Lynch served on the Special Olympics International Board of Directors (1997-2006). |
Elizabeth Paige Baumann (1968) |
Year of Election or Appointment: 2012 Anti-Money Laundering (AML) Officer |
| Ms. Baumann also serves as AML Officer of other funds. She is Chief AML Officer of FMR LLC (2012-present) and is an employee of Fidelity Investments. Previously, Ms. Baumann served as Vice President and Deputy Anti-Money Laundering Officer (2007-2012). |
William C. Coffey (1969) |
Year of Election or Appointment: 2009 Assistant Secretary |
| Mr. Coffey also serves as Assistant Secretary of other funds. He is Senior Vice President and Deputy General Counsel of FMR LLC (2010-present), and is an employee of Fidelity Investments. Previously, Mr. Coffey served as Vice President and Associate General Counsel of FMR LLC (2005-2009). |
Timothy M. Cohen (1969) |
Year of Election or Appointment: 2014 Vice President of certain Equity Funds |
| Mr. Cohen also serves as Vice President of other funds. Mr. Cohen serves as a Director and Chief Compliance Officer of Fidelity Management & Research (U.K.) Inc. (2013-present) and is an employee of Fidelity Investments. |
Jonathan Davis (1968) |
Year of Election or Appointment: 2010 Assistant Treasurer |
| Mr. Davis also serves as Assistant Treasurer of other funds. Mr. Davis is an employee of Fidelity Investments. Previously, Mr. Davis served as Vice President and Associate General Counsel of FMR LLC (2003-2010). |
Adrien E. Deberghes (1967) |
Year of Election or Appointment: 2008 Deputy Treasurer |
| Mr. Deberghes also serves as an officer of other funds. He is an employee of Fidelity Investments (2008-present). Prior to joining Fidelity Investments, Mr. Deberghes was Senior Vice President of Mutual Fund Administration at State Street Corporation (2007-2008), Senior Director of Mutual Fund Administration at Investors Bank & Trust (2005-2007), and Director of Finance for Dunkin' Brands (2000-2005). |
Stephanie J. Dorsey (1969) |
Year of Election or Appointment: 2010 Assistant Treasurer |
| Ms. Dorsey also serves as an officer of other funds. She is an employee of Fidelity Investments (2008-present) and has served in other fund officer roles. Prior to joining Fidelity Investments, Ms. Dorsey served as Treasurer (2004-2008) of the JPMorgan Mutual Funds and Vice President (2004-2008) of JPMorgan Chase Bank. |
Howard J. Galligan III (1966) |
Year of Election or Appointment: 2014 Chief Financial Officer |
| Mr. Galligan also serves as Chief Financial Officer of other funds. Mr. Galligan serves as President of Fidelity Pricing and Cash Management Services (FPCMS) (2014-present) and as a Director of Strategic Advisers, Inc. (2008-present). Previously, Mr. Galligan served as Chief Administrative Officer of Asset Management (2011-2014) and Chief Operating Officer and Senior Vice President of Investment Support for Strategic Advisers, Inc. (2003-2011). |
Scott C. Goebel (1968) |
Year of Election or Appointment: 2008 Secretary and Chief Legal Officer (CLO) |
| Mr. Goebel serves as Secretary and CLO of other funds. Mr. Goebel also serves as Secretary of Fidelity SelectCo, LLC (2013-present), Fidelity Investments Money Management, Inc. (FIMM) (2010-present) and Fidelity Research and Analysis Company (FRAC) (2010-present); General Counsel, Secretary, and Senior Vice President of FMR (2008-present) and FMR Co., Inc. (2008-present); Chief Legal Officer of Fidelity Management & Research (Hong Kong) Limited (2008-present); and Assistant Secretary of Fidelity Management & Research (Japan) Limited (2008-present) and Fidelity Management & Research (U.K.) Inc. (2008-present). Previously, Mr. Goebel served as Secretary and CLO of other Fidelity funds (2008-2013), Assistant Secretary of FIMM (2008-2010), FRAC (2008-2010), and certain funds (2007-2008); and as Vice President and Secretary of Fidelity Distributors Corporation (FDC) (2005-2007). Mr. Goebel has been employed by FMR LLC or an affiliate since 2001. |
Brian B. Hogan (1964) |
Year of Election or Appointment: 2009 Vice President |
| Mr. Hogan also serves as Trustee or Vice President of other funds. Mr. Hogan serves as a Director of Fidelity SelectCo, LLC (2014-present) and President of FMR's Equity Division (2009-present). Previously, Mr. Hogan served as Senior Vice President, Equity Research of FMR (2006-2009) and as a portfolio manager. |
Chris Maher (1972) |
Year of Election or Appointment: 2013 Assistant Treasurer |
| Mr. Maher serves as Assistant Treasurer of other funds. Mr. Maher is Vice President of Valuation Oversight and is an employee of Fidelity Investments. Previously, Mr. Maher served as Vice President of Asset Management Compliance (2013), Vice President of FMR's Program Management Group (2010-2013), and Vice President of Valuation Oversight (2008-2010). |
Kenneth B. Robins (1969) |
Year of Election or Appointment: 2008 President and Treasurer |
| Mr. Robins also serves as an officer of other funds. Mr. Robins serves as Executive Vice President of Fidelity Investments Money Management, Inc. (FIMM) (2013-present) and is an employee of Fidelity Investments (2004-present). Previously, Mr. Robins served in other fund officer roles. |
Stephen Sadoski (1971) |
Year of Election or Appointment: 2012 Deputy Treasurer |
| Mr. Sadoski also serves as Deputy Treasurer of other funds. He is an employee of Fidelity Investments (2012-present) and has served in another fund officer role. Prior to joining Fidelity Investments, Mr. Sadoski served as an assistant chief accountant in the Division of Investment Management of the Securities and Exchange Commission (SEC) (2009-2012) and as a senior manager at Deloitte & Touche LLP (1997-2009). |
Stacie M. Smith (1974) |
Year of Election or Appointment: 2013 Deputy Treasurer |
| Ms. Smith also serves as an officer of other funds. She is an employee of Fidelity Investments (2009-present) and has served in other fund officer roles. Prior to joining Fidelity Investments, Ms. Smith served as Senior Audit Manager of Ernst & Young LLP (1996-2009). |
Renee Stagnone (1975) |
Year of Election or Appointment: 2013 Deputy Treasurer |
| Ms. Stagnone also serves as Deputy Treasurer of other funds. Ms. Stagnone is an employee of Fidelity Investments. |
Linda J. Wondrack (1964) |
Year of Election or Appointment: 2014 Chief Compliance Officer |
| Ms. Wondrack also serves as Chief Compliance Officer of other funds. Ms. Wondrack is Executive Vice President and head of the Ethics Office and Asset Management Compliance for Fidelity Investments (2012-present). Ms. Wondrack also serves as Chief Compliance Officer of Fidelity SelectCo, LLC (2014-present); Chief Compliance Officer of Impresa Management LLC (2013-present); and Chief Compliance Officer of FMR Co., Inc., Fidelity Investments Money Management, Inc., Fidelity Management & Research (Japan) Limited, Fidelity Management & Research (U.K.) Inc., Fidelity Management & Research (Hong Kong), Fidelity Management & Research Company, Pyramis Global Advisors, LLC, and Strategic Advisers, Inc., Ballyrock Investment Advisors LLC, and Northern Neck Investors LLC (2012-present). Previously, Ms. Wondrack served as Senior Vice President and Chief Compliance Officer for Columbia Management Investment Advisers, LLC (2005-2012); Chief Compliance Officer for certain funds within the Columbia Family of Funds (2007-2012); and Senior Vice President of Compliance Risk Management at Bank of America (2005-2010). |
Joseph F. Zambello (1957) |
Year of Election or Appointment: 2011 Deputy Treasurer |
| Mr. Zambello also serves as Deputy Treasurer of other funds. Mr. Zambello is an employee of Fidelity Investments. Previously, Mr. Zambello served as Vice President of FMR's Program Management Group (2009-2011) and Vice President of the Transfer Agent Oversight Group (2005-2009). |
Annual Report
Institutional Class designates 16% of the dividends distributed in December 2013 as indicated in the Corporate Qualifying memo distributed by the Tax department, during the fiscal year as qualifying for the dividends-received deduction for corporate shareholders.
Institutional Class designates 100% of the dividends distributed in December during the fiscal year as amounts which may be taken into account as a dividend for purposes of the maximum rate under section 1(h)(11) of the Internal Revenue Code.
The amounts per share which represent income derived from sources within, and taxes paid to, foreign countries or possessions of the United States are as follows:
| Pay Date | Income | Taxes |
Institutional Class | 12/09/2013 | $0.0629 | $0.0059 |
The fund will notify shareholders in January 2015 of amounts for use in preparing 2014 income tax returns.
Annual Report
Board Approval of Investment Advisory Contracts and Management Fees
Fidelity International Growth Fund
Each year, the Board of Trustees, including the Independent Trustees (together, the Board), votes on the renewal of the management contract with Fidelity Management & Research Company (FMR) and the sub-advisory agreements (together, the Advisory Contracts) for the fund. The Board, assisted by the advice of fund counsel and Independent Trustees' counsel, requests and considers a broad range of information relevant to the renewal of the Advisory Contracts throughout the year.
The Board meets regularly and, at each of its meetings, covers an extensive agenda of topics and materials and considers factors that are relevant to its annual consideration of the renewal of the fund's Advisory Contracts, including the services and support provided to the fund and its shareholders. The Board has established various standing committees (Committees), each composed of and chaired by Independent Trustees with varying backgrounds, to which the Board has assigned specific subject matter responsibilities in order to enhance effective decision-making by the Board. The Board, acting directly and through its Committees, requests and receives information concerning the annual consideration of the renewal of the fund's Advisory Contracts. The Board also meets as needed to consider matters specifically related to the Board's annual consideration of the renewal of the Advisory Contracts. Members of the Board may also meet with trustees of other Fidelity funds through ad hoc joint committees to discuss certain matters relevant to the Fidelity funds.
At its July 2014 meeting, the Board, including the Independent Trustees, unanimously determined to renew the fund's Advisory Contracts. In reaching its determination, the Board considered all factors it believed relevant, including (i) the nature, extent, and quality of the services to be provided to the fund and its shareholders (including the investment performance of the fund); (ii) the competitiveness of the fund's management fee and total expense ratio relative to peer funds; (iii) the total costs of the services to be provided by and the profits to be realized by Fidelity from its relationship with the fund; (iv) the extent to which economies of scale exist and would be realized as the fund grows; and (v) whether fee levels reflect these economies of scale, if any, for the benefit of fund shareholders. In connection with separate internal corporate reorganizations involving Fidelity Management & Research (U.K.) Inc. (FMR U.K.) and Fidelity Management & Research (Japan) Inc. (FMR Japan), the Board approved certain non-material amendments to the fund's sub-advisory agreements with FMR U.K. and FMR Japan to reflect that, after these reorganizations, FMR Investment Management (UK) Limited and Fidelity Management & Research (Japan) Limited will carry on the business of FMR U.K. and FMR Japan, respectively. The Board noted that no changes to the portfolio managers or to the foreign research or investment advisory services provided to the fund were expected in connection with either reorganization and that the same personnel and resources would continue to be available to the fund at the new entities.
Annual Report
Board Approval of Investment Advisory Contracts and
Management Fees - continued
In considering whether to renew the Advisory Contracts for the fund, the Board reached a determination, with the assistance of fund counsel and Independent Trustees' counsel and through the exercise of its business judgment, that the renewal of the Advisory Contracts was in the best interests of the fund and its shareholders and that the compensation payable under the Advisory Contracts was fair and reasonable. The Board's decision to renew the Advisory Contracts was not based on any single factor, but rather was based on a comprehensive consideration of all the information provided to the Board at its meetings throughout the year. The Board, in reaching its determination to renew the Advisory Contracts, was aware that shareholders of the fund have a broad range of investment choices available to them, including a wide choice among funds offered by Fidelity's competitors, and that the fund's shareholders, who have the opportunity to review and weigh the disclosure provided by the fund in its prospectus and other public disclosures, have chosen to invest in this fund, which is part of the Fidelity family of funds.
Nature, Extent, and Quality of Services Provided. The Board considered Fidelity's staffing as it relates to the fund, including the backgrounds of investment personnel of FMR and the sub-advisers (together, the Investment Advisers), and also considered the fund's investment objective, strategies, and related investment philosophy. The Independent Trustees also had discussions with senior management of Fidelity's investment operations and investment groups. The Board considered the structure of the portfolio manager compensation program and whether this structure provides appropriate incentives to act in the best interests of the fund. Additionally, the Board considered the portfolio managers' investments, if any, in the funds that they manage.
Resources Dedicated to Investment Management and Support Services. The Board and the Fund Oversight and Research Committees reviewed the general qualifications and capabilities of Fidelity's investment staff, including its size, education, experience, and resources, as well as Fidelity's approach to recruiting, training, managing, and compensating investment personnel. The Board noted that Fidelity has continued to increase the resources devoted to non-U.S. offices, including expansion of Fidelity's global investment organization. The Board also noted that Fidelity's analysts have extensive resources, tools and capabilities that allow them to conduct sophisticated quantitative and fundamental analysis, as well as credit analysis of issuers, counterparties and guarantors. Further, the Board believes that Fidelity's investment professionals have sufficient access to global information and data so as to provide competitive investment results over time, and that those professionals also have access to sophisticated tools that permit them to assess portfolio construction and risk and performance attribution characteristics continuously, as well as to transmit new information and research conclusions rapidly around the world. Additionally, in its deliberations, the Board considered Fidelity's trading and risk management capabilities and resources and global compliance infrastructure, which are an integral part of the investment management process.
Annual Report
Shareholder and Administrative Services. The Board considered (i) the nature, extent, quality, and cost of advisory, administrative, and shareholder services performed by the Investment Advisers and their affiliates under the Advisory Contracts and under separate agreements covering transfer agency, pricing and bookkeeping, and securities lending services for the fund; (ii) the nature and extent of the supervision of third party service providers, principally custodians and subcustodians; and (iii) the resources devoted to, and the record of compliance with, the fund's compliance policies and procedures. The Board also reviewed the allocation of fund brokerage, including allocations to brokers affiliated with the Investment Advisers, the use of brokerage commissions to pay fund expenses, and the use of "soft" commission dollars to pay for research services.
The Board noted that the growth of fund assets over time across the complex allows Fidelity to reinvest in the development of services designed to enhance the value or convenience of the Fidelity funds as investment vehicles. These services include 24-hour access to account information and market information through telephone representatives and over the Internet, investor education materials and asset allocation tools, and the expanded availability of Fidelity Investor Centers.
In 2014, the Board formed an ad hoc Committee on Transfer Agency Fees to review the variety of transfer agency fee structures throughout the industry and Fidelity's competitive positioning with respect to industry participants.
Investment in a Large Fund Family. The Board considered the benefits to shareholders of investing in a Fidelity fund, including the benefits of investing in a fund that is part of a large family of funds offering a variety of investment disciplines and providing a large variety of mutual fund investor services. The Board noted that Fidelity had taken, or had made recommendations that resulted in the Fidelity funds taking, a number of actions over the previous year that benefited particular funds, including (i) continuing to dedicate additional resources to investment research and to the support of the senior management team that oversees asset management; (ii) persisting in efforts to enhance Fidelity's global research capabilities; (iii) launching new funds and making other enhancements to meet client needs for income-oriented solutions; (iv) reducing fund expenses for certain index funds; (v) continuing to launch dedicated lower cost underlying funds to meet portfolio construction needs related to expanding underlying fund options for Fidelity funds of funds, specifically for the Freedom Fund product lines; (vi) rationalizing product lines and gaining increased efficiencies through fund mergers; (vii) launching sector-based exchange-traded funds and establishing a new Fidelity adviser to manage sector-based funds and products; (viii) continuing to develop and implement technology to improve security and increase efficiency; (ix) modifying the eligibility criteria for certain share classes to increase their marketability to a portion of the defined contribution plan market; (x) waiving redemption fees for certain qualified fund-of-fund and wrap programs and certain retirement plan transactions; and (xi) launching new Institutional Class shares of certain money market funds to attract and retain assets and to fill a gap in the money market fund lineup.
Annual Report
Board Approval of Investment Advisory Contracts and
Management Fees - continued
Investment Performance. The Board considered whether the fund has operated in accordance with its investment objective, as well as its record of compliance with its investment restrictions and its performance history.
The Board took into account discussions with the Investment Advisers about fund investment performance that occur at Board meetings throughout the year. In this regard the Board noted that as part of regularly scheduled fund reviews and other reports to the Board on fund performance, the Board periodically considers annualized return information for the fund, for different time periods, measured against a securities market index ("benchmark index") and a peer group of funds with similar objectives ("peer group"). In its evaluation of fund investment performance, the Board gave particular attention to information indicating changes in performance of certain Fidelity funds for specific time periods and the Investment Advisers' explanations for any overperformance or underperformance.
In addition to reviewing absolute and relative fund performance, the Independent Trustees periodically consider the appropriateness of fund performance metrics in evaluating the results achieved. In general, the Independent Trustees believe that fund performance should be evaluated based on net performance (after fees and expenses) of both the highest performing and lowest performing classes, where applicable, compared to appropriate benchmark indices, over appropriate time periods which may include full market cycles, and compared to peer groups, as applicable, over the same periods, taking into account relevant factors including the following: general market conditions; issuer-specific information; tactical opportunities for investment; and fund cash flows and other factors.
The Independent Trustees recognize that shareholders evaluate performance on a net basis over their own holding periods, for which one-, three-, and five-year periods are often used as a proxy. For this reason, the performance information reviewed by the Board also included net cumulative calendar year total return information for the fund and an appropriate benchmark index and peer group for the most recent one-, three-, and five-year periods, as shown below. Returns are shown compared to the 25th percentile (top of box, 75% beaten) and 75th percentile (bottom of box, 25% beaten) of the peer universe. Returns of the benchmark index are "net MA," i.e., adjusted for tax withholding rates applicable to U.S.-based funds organized as Massachusetts business trusts.
Annual Report
Fidelity International Growth Fund
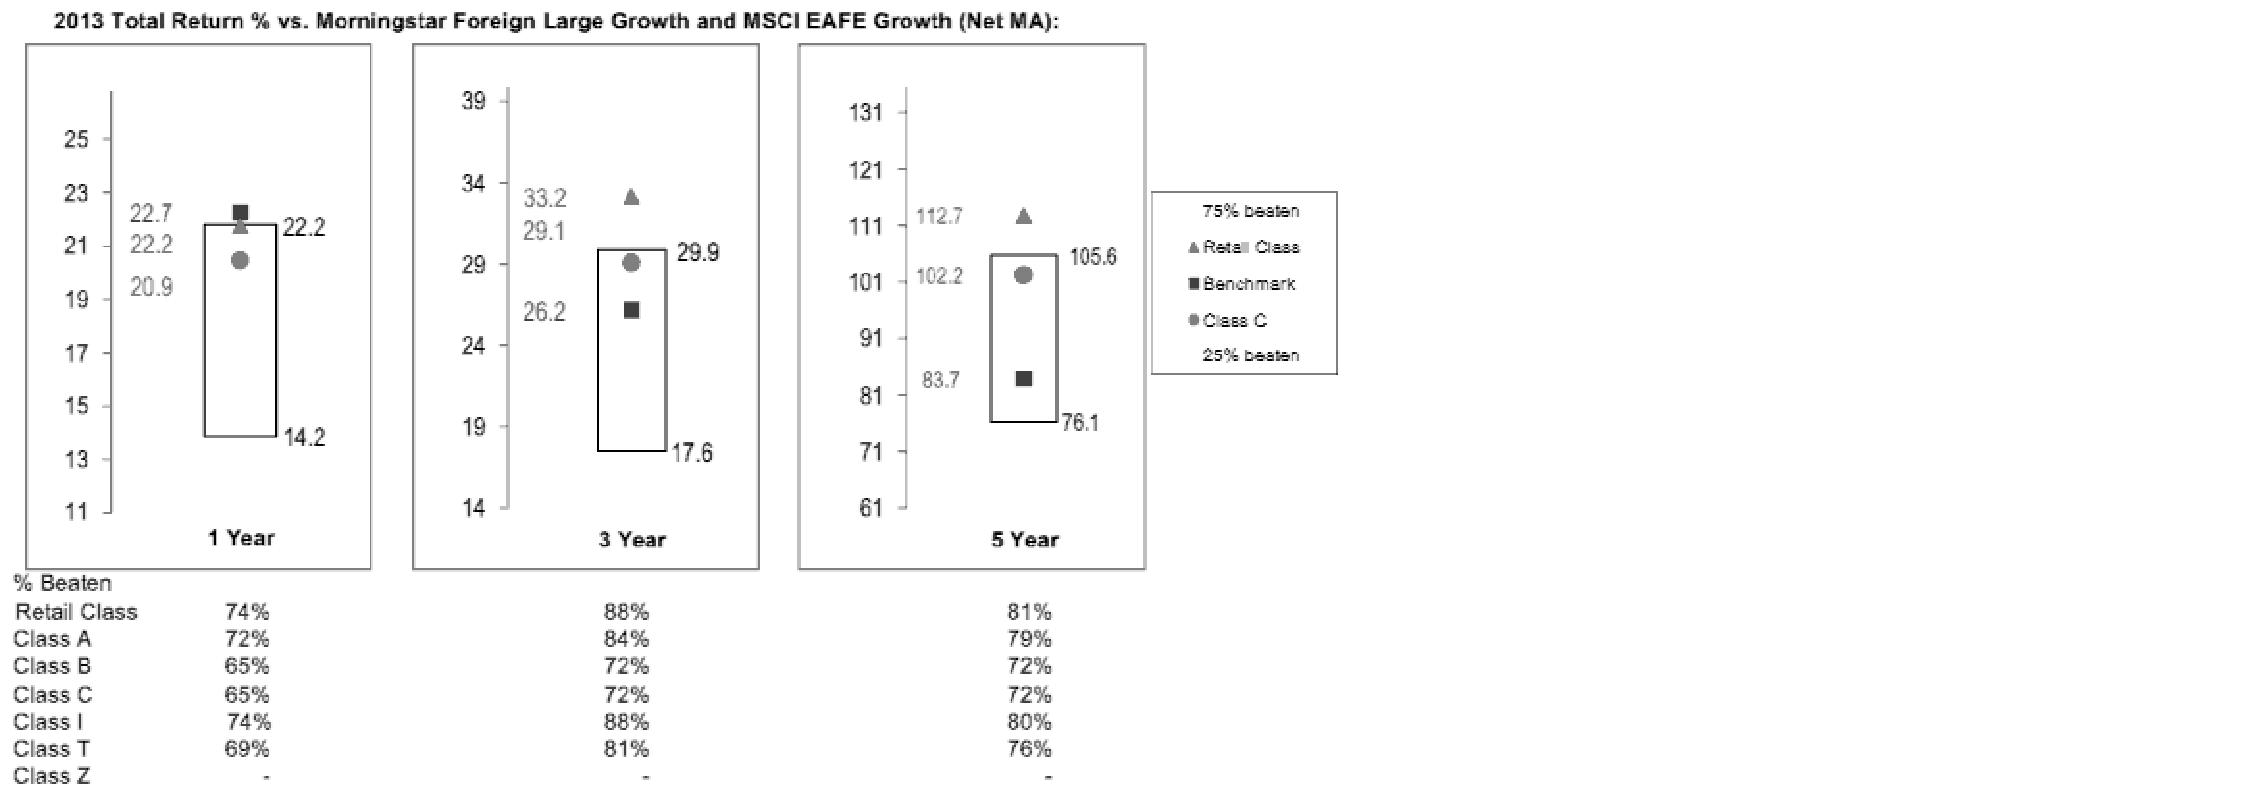
The Board also considered that the fund's management fee is subject to upward or downward adjustment depending upon whether, and to what extent, the fund's investment performance for the performance period exceeds, or is exceeded by, a securities index, thus leading to a performance adjustment for the same period. The Board noted that the performance adjustment provides FMR with a strong economic incentive to seek to achieve superior performance for the fund's shareholders and helps to more closely align the interests of FMR and the fund's shareholders.
Based on its review, the Board concluded that the nature, extent, and quality of services provided to the fund under the Advisory Contracts should benefit the fund's shareholders.
Competitiveness of Management Fee and Total Expense Ratio. The Board considered the fund's management fee and total expense ratio compared to "mapped groups" of competitive funds and classes. Fidelity creates "mapped groups" by combining similar Lipper investment objective categories that have comparable investment mandates. Combining Lipper investment objective categories aids the Board's management fee and total expense ratio comparisons by broadening the competitive group used for comparison and by reducing the number of universes to which various Fidelity funds are compared.
Management Fee. The Board considered two proprietary management fee comparisons for the 12-month periods shown in the chart below. The group of Lipper funds used by the Board for management fee comparisons is referred to below as the "Total Mapped Group." The Total Mapped Group comparison focuses on a fund's standing in terms of gross management fees before expense reimbursements or caps, and without giving effect to the fund's performance adjustment, relative to the total universe of funds with comparable investment mandates, regardless of whether their management fee structures also are comparable. Funds with comparable investment mandates offer exposure to similar types of securities. Funds with comparable management fee structures have similar management fee contractual arrangements (e.g., flat rate charged for advisory services, all-inclusive fee rate, etc.). "TMG %" represents the percentage of funds in the Total Mapped Group that had management fees that were lower than the fund's. For example, a hypothetical TMG % of 20% would mean that 80% of the funds in the Total Mapped Group had higher, and 20% had lower, management fees than the fund. The fund's actual TMG %s are in the chart below. The "Asset-Size Peer Group" (ASPG) comparison focuses on a fund's standing relative to a subset of non-Fidelity funds within the Total Mapped Group that are similar in size and management fee structure. For example, if a fund is in the first quartile of the ASPG, the fund's management fee ranks in the least expensive or lowest 25% of funds in the ASPG. The ASPG represents at least 15% of the funds in the Total Mapped Group with comparable asset size and management fee structures, subject to a minimum of 50 funds (or all funds in the Total Mapped Group if fewer than 50). Additional information, such as the ASPG quartile in which the fund's management fee rate ranked and the impact of the fund's performance adjustment, is also included in the chart and considered by the Board.
Annual Report
Board Approval of Investment Advisory Contracts and
Management Fees - continued
Fidelity International Growth Fund

The Board noted that the fund's management fee rate ranked below the median of its Total Mapped Group and below the median of its ASPG for 2013. The Board also noted the effect of the fund's positive performance adjustment on the fund's management fee ranking.
Annual Report
The Board also noted that, in August 2013, the ad hoc Committee on Management Fees was formed to conduct an in-depth review of the management fee rates of Fidelity's active equity mutual funds. The Committee focused on the following areas: (i) standard fee structures; (ii) research consumption and trading evolution; (iii) management fee competitiveness/profitability by category; and (iv) factors that drive institutional pricing.
Based on its review, the Board concluded that the fund's management fee is fair and reasonable in light of the services that the fund receives and the other factors considered.
Total Expense Ratio. In its review of each class's total expense ratio, the Board considered the fund's management fee as well as other fund or class expenses, as applicable, such as transfer agent fees, pricing and bookkeeping fees, fund-paid 12b-1 fees, and custodial, legal, and audit fees. The Board also noted the effects of any waivers and reimbursements on fees and expenses, as well as the impact of the fund's performance adjustment. As part of its review, the Board also considered the current and historical total expense ratios of each class of the fund compared to competitive fund median expenses. Each class of the fund is compared to those funds and classes in the Total Mapped Group (used by the Board for management fee comparisons) that have a similar sales load structure.
The Board noted that the total expense ratio of each of Institutional Class, Class Z, and the retail class ranked below its competitive median for 2013, the total expense ratio of Class A ranked equal to its competitive median for 2013, and the total expense ratio of each of Class T, Class B, and Class C ranked above its competitive median for 2013.The Board considered that, in general, various factors can affect total expense ratios. The Board noted that the total expense ratio of Class T was above the competitive median primarily because of higher 12b-1 fees on Class T as compared to most competitor funds. Class T has a higher 12b-1 fee, but a lower front-end sales charge, than traditionally priced front-end sales charge classes. The Board considered that Class T is primarily sold load-waived in the retirement plan market where its 0.50% 12b-1 fee is comparable to competing no-load, higher 12b-1 fee classes designed specifically for retirement plans. The Board noted that the fund offers multiple classes, each of which has a different sales load and 12b-1 fee structure, and that the multiple structures are intended to offer a range of pricing options for the intermediary market. The Board also noted that the total expense ratios of the classes vary primarily by the level of their 12b-1 fees, although differences in transfer agent fees may also cause expenses to vary from class to class.
The Board further considered that FMR contractually agreed to reimburse Class A, Class T, Class B, Class C, Institutional Class, Class Z, and the retail class of the fund to the extent that total operating expenses (excluding interest, certain taxes, certain securities lending costs, brokerage commissions, extraordinary expenses, and acquired fund fees and expenses, if any), as a percentage of their respective average net assets, exceed 1.45%, 1.70%, 2.20%, 2.20%, 1.20%, 1.05%, and 1.20% through December 31, 2014.
Annual Report
Board Approval of Investment Advisory Contracts and
Management Fees - continued
Fees Charged to Other Fidelity Clients. The Board also considered Fidelity fee structures and other information with respect to clients of Fidelity, such as other funds advised or subadvised by Fidelity, pension plan clients, and other institutional clients. The Board noted the findings of the 2013 ad hoc joint committee (created with the board of other Fidelity funds), which reviewed and compared Fidelity's institutional investment advisory business with its business of providing services to the Fidelity funds, including the differences in services provided, fees charged, and costs incurred, as well as competition in their respective marketplaces.
Based on its review of total expense ratios and fees charged to other Fidelity clients, the Board concluded that the total expense ratio of each class of the fund was reasonable, although in some cases above the median of the universe presented for comparison, in light of the services that the fund and its shareholders receive and the other factors considered.
Costs of the Services and Profitability. The Board considered the revenues earned and the expenses incurred by Fidelity in conducting the business of developing, marketing, distributing, managing, administering and servicing the fund and servicing the fund's shareholders. The Board also considered the level of Fidelity's profits in respect of all the Fidelity funds.
On an annual basis, Fidelity presents to the Board Fidelity's profitability for the fund. Fidelity calculates the profitability for each fund, as well as aggregate profitability for groups of Fidelity funds and all Fidelity funds, using a series of detailed revenue and cost allocation methodologies which originate with the books and records of Fidelity on which Fidelity's audited financial statements are based. The Audit Committee of the Board reviews any significant changes from the prior year's methodologies.
PricewaterhouseCoopers LLP (PwC), independent registered public accounting firm and auditor to Fidelity and certain Fidelity funds, has been engaged annually by the Board as part of the Board's assessment of Fidelity's profitability analysis. PwC's engagement includes the review and assessment of the methodologies used by Fidelity in determining the revenues and expenses attributable to Fidelity's mutual fund business, and completion of agreed-upon procedures in respect of the mathematical accuracy of fund profitability and its conformity to established allocation methodologies. After considering PwC's reports issued under the engagement and information provided by Fidelity, the Board concluded that while other allocation methods may also be reasonable, Fidelity's profitability methodologies are reasonable in all material respects.
The Board also reviewed Fidelity's non-fund businesses and fall-out benefits related to the mutual fund business as well as cases where Fidelity's affiliates may benefit from or be related to the fund's business.
Annual Report
The Board considered the costs of the services provided by and the profits realized by Fidelity in connection with the operation of the fund and was satisfied that the profitability was not excessive in the circumstances.
Economies of Scale. The Board considered whether there have been economies of scale in respect of the management of the Fidelity funds, whether the Fidelity funds (including the fund) have appropriately benefited from any such economies of scale, and whether there is potential for realization of any further economies of scale. The Board considered the extent to which the fund will benefit from economies of scale through increased services to the fund, through waivers or reimbursements, or through fee or expense ratio reductions. The Board also noted that in 2013, it and the boards of other Fidelity funds created an ad hoc committee (the Economies of Scale Committee) to analyze whether Fidelity attains economies of scale in respect of the management and servicing of the Fidelity funds, whether the Fidelity funds have appropriately benefited from such economies of scale, and whether there is potential for realization of any further economies of scale.
The Board recognized that the fund's management contract incorporates a "group fee" structure, which provides for lower group fee rates as total group assets increase, and for higher group fee rates as total group assets decrease (with "group assets" defined to include fund assets under FMR's management plus sector fund assets previously under FMR's management and currently managed by Fidelity SelectCo, LLC). FMR calculates the group fee rates based on a tiered asset "breakpoint" schedule that varies based on asset class. The Board considered that the group fee is designed to deliver the benefits of economies of scale to fund shareholders when total Fidelity fund assets increase, even if assets of any particular fund are unchanged or have declined, because some portion of Fidelity's costs are attributable to services provided to all Fidelity funds, and all funds benefit if those costs can be allocated among more assets. The Board concluded that, given the group fee structure, fund shareholders will benefit from lower management fees as group assets increase at the fund complex level, regardless of whether Fidelity achieves any such economies of scale.
The Board concluded, taking into account the analysis of the Economies of Scale Committee, that economies of scale, if any, are being appropriately shared between fund shareholders and Fidelity.
Additional Information Requested by the Board. In order to develop fully the factual basis for consideration of the Fidelity funds' Advisory Contracts, the Board requested and received additional information on certain topics, including: (i) fund performance trends and Fidelity's long-term strategies for certain funds; (ii) Fidelity's strategic marketing and product lineup goals; (iii) the methodology with respect to competitive fund data and peer group classifications; (iv) the arrangements with, and performance of, certain sub-advisers on behalf of the Fidelity funds, as well as certain proposed participating affiliate arrangements; (v) the realization of fall-out benefits in certain Fidelity business units; (vi) Fidelity's group fee structures, including the rationale for the individual fee rates of certain categories of funds and the definition of group assets; (vii) trends regarding industry use of performance fee structures and the performance adjustment methodologies applicable to the Fidelity funds; (viii) additional competitive analysis regarding the total expenses for certain classes; (ix) fund profitability methodology, including Fidelity's cost allocation methodology, and the impact of certain factors on fund profitability results; and (x) the process by which Fidelity determines sub-advisory fees for funds it advises.
Annual Report
Board Approval of Investment Advisory Contracts and
Management Fees - continued
Based on its evaluation of all of the conclusions noted above, and after considering all factors it believed relevant, the Board ultimately concluded that the advisory fee structures are fair and reasonable, and that the fund's Advisory Contracts should be renewed.
Annual Report
Investment Adviser
Fidelity Management & Research Company
Boston, MA
Investment Sub-Advisers
FMR Co., Inc.
Fidelity Management & Research
(U.K.) Inc.
Fidelity Management & Research
(Hong Kong) Limited
Fidelity Management & Research
(Japan) Limited
FIL Investment Advisors
FIL Investments (Japan) Limited
FIL Investment Advisors (UK) Limited
General Distributor
Fidelity Distributors Corporation
Smithfield, RI
Transfer and Service Agents
Fidelity Investments Institutional Operations Company, Inc.
Boston, MA
Fidelity Service Company, Inc.
Boston, MA
Custodian
State Street Bank and Trust Company
Quincy, MA
(Fidelity Investment logo)(registered trademark)
AIGFI-UANN-1214
1.853341.106
(Fidelity Investment logo)(registered trademark)
Fidelity Advisor®
International Growth
Fund - Class Z
Annual Report
October 31, 2014
(Fidelity Cover Art)
Class Z is
a class of Fidelity®
International Growth Fund
Contents
Performance | (Click Here) | How the fund has done over time. |
Management's Discussion of Fund Performance | (Click Here) | The Portfolio Manager's review of fund performance and strategy. |
Shareholder Expense Example | (Click Here) | An example of shareholder expenses. |
Investment Changes | (Click Here) | A summary of major shifts in the fund's investments over the past six months. |
Investments | (Click Here) | A complete list of the fund's investments with their market values. |
Financial Statements | (Click Here) | Statements of assets and liabilities, operations, and changes in net assets, as well as financial highlights. |
Notes | (Click Here) | Notes to financial statements. |
Report of Independent Registered Public Accounting Firm | (Click Here) | |
Trustees and Officers | (Click Here) | |
Distributions | (Click Here) | |
Board Approval of Investment Advisory Contracts and Management Fees | (Click Here) | |
To view a fund's proxy voting guidelines and proxy voting record for the 12-month period ended June 30, visit http://www.fidelity.com/proxyvotingresults or visit the Securities and Exchange Commission's (SEC) web site at http://www.sec.gov. You may also call 1-877-208-0098 to request a free copy of the proxy voting guidelines.
Standard & Poor's, S&P and S&P 500 are registered service marks of The McGraw-Hill Companies, Inc. and have been licensed for use by Fidelity Distributors Corporation.
Other third-party marks appearing herein are the property of their respective owners.
All other marks appearing herein are registered or unregistered trademarks or service marks of FMR LLC or an affiliated company. © 2014 FMR LLC. All rights reserved.
Annual Report
This report and the financial statements contained herein are submitted for the general information of the shareholders of the fund. This report is not authorized for distribution to prospective investors in the fund unless preceded or accompanied by an effective prospectus.
A fund files its complete schedule of portfolio holdings with the SEC for the first and third quarters of each fiscal year on Form N-Q. Forms N-Q are available on the SEC's web site at http://www.sec.gov. A fund's Forms N-Q may be reviewed and copied at the SEC's Public Reference Room in Washington, DC. Information regarding the operation of the SEC's Public Reference Room may be obtained by calling 1-800-SEC-0330. For a complete list of a fund's portfolio holdings, view the most recent holdings listing, semiannual report, or annual report on Fidelity's web site at http://www.fidelity.com, http://www.advisor.fidelity.com, or http://www.401k.com, as applicable.
NOT FDIC INSURED • MAY LOSE VALUE • NO BANK GUARANTEE
Neither the fund nor Fidelity Distributors Corporation is a bank.
Annual Report
Average annual total return reflects the change in the value of an investment, assuming reinvestment of the class' distributions from dividend income and capital gains (the profits earned upon the sale of securities that have grown in value, if any) and assuming a constant rate of performance each year. The $10,000 table and the fund's returns do not reflect the deduction of taxes that a shareholder would pay on fund distributions or the redemption of fund shares. During periods of reimbursement by Fidelity, a fund's total return will be greater than it would be had the reimbursement not occurred. How a fund did yesterday is no guarantee of how it will do tomorrow.
Average Annual Total Returns
Periods ended October 31, 2014 | Past 1
year | Past 5
years | Life of
fund A |
Class Z B | 3.07% | 10.67% | 2.40% |
A From November 1, 2007.
B The initial offering of Class Z shares took place on August 13, 2013. Returns prior to August 13, 2013, are those of Institutional Class.
$10,000 Over Life of Fund
Let's say hypothetically that $10,000 was invested in Fidelity Advisor® International Growth Fund - Class Z on November 1, 2007, when the fund started. The chart shows how the value of your investment would have changed, and also shows how the MSCI EAFE Growth Index performed over the same period. See footnote B above for additional information regarding the performance of Class Z.
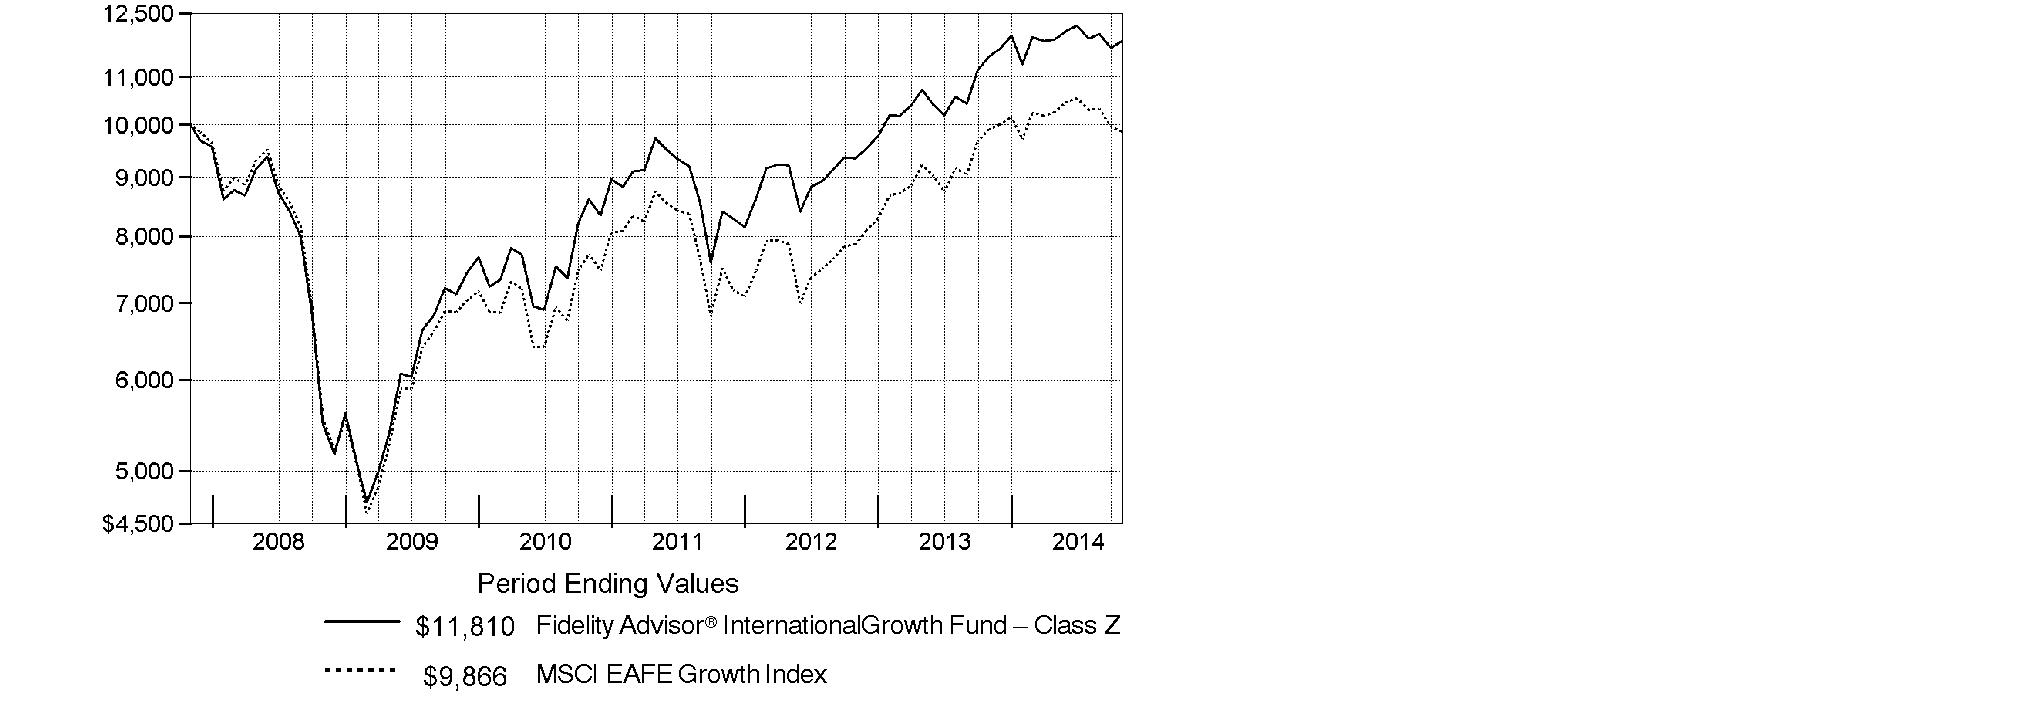
Annual Report
Market Recap: Global equities posted a healthy gain for the 12 months ending October 31, 2014, overcoming an October market decline driven by recessionary pressures in China and tepid growth in Europe. The MSCI ACWI (All Country World Index) Index rose 8.15%, helped by subdued market volatility for much of the period and supported by solid corporate earnings, especially in the United States. Stocks also benefited from easy monetary policies in Japan and the eurozone, as well as increased stimulus efforts in China. All but three of the 24 industry groups that compose the index marked a positive return. The U.S. (+17%) remained a pillar of strength, while a strongly rising dollar in the latter part of the period detracted from investors' returns in most non-U.S. markets. Canada (+5%) notched broad gains outside of its energy and materials sectors, as did Asia-Pacific ex Japan (+4%), led by investor enthusiasm for companies in India. The U.K., Europe and Japan, meanwhile, all underperformed. Among sectors, health care (+24%) led the index, with a strong contribution from the pharmaceuticals, biotechnology & life sciences industry. Information technology (+21%) also outperformed. Conversely, materials (-4%) and energy (-1%) lagged the index due to a higher supply of and lower demand for commodities.
Comments from Jed Weiss, Portfolio Manager of Fidelity Advisor® International Growth Fund: For the year ending October 31, 2014, the fund's Class Z shares gained 3.07%, well ahead of the MSCI EAFE Growth Index, which returned -0.51%. The fund benefited from its positioning in the U.S. - where some fund holdings happen to be domiciled while doing most or all of their business abroad - and also a beneficial underweighting in Europe. My stance in Japan was a modest negative. On an individual basis, U.K.-based hotel company Intercontinental Hotels Group was the fund's top individual contributor. I continued to like this stock for its strong operations and ability to benefit from a cyclically improving hotel business, especially in the U.S. Visa and MasterCard, two U.S.-based payment-processing software companies not found in the index, also were significant contributors. One notable laggard was Andritz, an Austrian industrial engineering firm with a dominant competitive position in several industries. The value of our stake fell during the 12 months, most likely because of investors' concerns about a slowing global economy. Another disappointment was Nokian Tyres, a Finland-based tire manufacturer that encountered a difficult business environment. I ultimately sold the fund's stake in search of other opportunities.
The views expressed above reflect those of the portfolio manager(s) only through the end of the period as stated on the cover of this report and do not necessarily represent the views of Fidelity or any other person in the Fidelity organization. Any such views are subject to change at any time based upon market or other conditions and Fidelity disclaims any responsibility to update such views. These views may not be relied on as investment advice and, because investment decisions for a Fidelity fund are based on numerous factors, may not be relied on as an indication of trading intent on behalf of any Fidelity fund.
Annual Report
Shareholder Expense Example
As a shareholder of the Fund, you incur two types of costs: (1) transaction costs, including sales charges (loads) on purchase payments or redemption proceeds, redemption fees and (2) ongoing costs, including management fees, distribution and/or service (12b-1) fees and other Fund expenses. This Example is intended to help you understand your ongoing costs (in dollars) of investing in the Fund and to compare these costs with the ongoing costs of investing in other mutual funds.
The Example is based on an investment of $1,000 invested at the beginning of the period and held for the entire period (May 1, 2014 to October 31, 2014).
Actual Expenses
The first line of the accompanying table for each class of the Fund provides information about actual account values and actual expenses. You may use the information in this line, together with the amount you invested, to estimate the expenses that you paid over the period. Simply divide your account value by $1,000.00 (for example, an $8,600 account value divided by $1,000.00 = 8.6), then multiply the result by the number in the first line for a class of the Fund under the heading entitled "Expenses Paid During Period" to estimate the expenses you paid on your account during this period. A small balance maintenance fee of $12.00 that is charged once a year may apply for certain accounts with a value of less than $2,000. This fee is not included in the table below. If it was, the estimate of expenses you paid during the period would be higher, and your ending account value lower, by this amount. In addition, the Fund, as a shareholder in the underlying Fidelity Central Funds, will indirectly bear its pro-rata share of the fees and expenses incurred by the underlying Fidelity Central Funds. These fees and expenses are not included in the Fund's annualized expense ratio used to calculate the expense estimate in the table below.
Hypothetical Example for Comparison Purposes
The second line of the accompanying table for each class of the Fund provides information about hypothetical account values and hypothetical expenses based on a Class' actual expense ratio and an assumed rate of return of 5% per year before expenses, which is not the Class' actual return. The hypothetical account values and expenses may not be used to estimate the actual ending account balance or expenses you paid for the period. You may use this information to compare the ongoing costs of investing in the Fund and other funds. To do so, compare this 5% hypothetical example with the 5% hypothetical examples that appear in the shareholder reports of the other funds. A small balance maintenance fee of $12.00 that is charged once a year may apply for certain accounts with a value of less than $2,000. This fee is not included in the table below. If it was, the estimate of expenses you paid during the period would be higher, and your ending account value lower, by this amount. In addition, the Fund, as a shareholder in the underlying Fidelity Central Funds, will indirectly bear its pro-rata share of the fees and expenses incurred by the underlying Fidelity Central Funds. These fees and expenses are not included in the Fund's annualized expense ratio used to calculate the expense estimate in the table below.
Please note that the expenses shown in the table are meant to highlight your ongoing costs only and do not reflect any transaction costs. Therefore, the second line of the table is useful in comparing ongoing costs only, and will not help you determine the relative total costs of owning different funds. In addition, if these transactional costs were included, your costs would have been higher.
Annual Report
Shareholder Expense Example - continued
| Annualized
Expense RatioB | Beginning
Account Value
May 1, 2014 | Ending
Account Value
October 31, 2014 | Expenses Paid
During Period*
May 1, 2014 to
October 31, 2014 |
Class A | 1.34% | | | |
Actual | | $ 1,000.00 | $ 993.70 | $ 6.73 |
HypotheticalA | | $ 1,000.00 | $ 1,018.45 | $ 6.82 |
Class T | 1.64% | | | |
Actual | | $ 1,000.00 | $ 991.90 | $ 8.23 |
HypotheticalA | | $ 1,000.00 | $ 1,016.94 | $ 8.34 |
Class B | 2.13% | | | |
Actual | | $ 1,000.00 | $ 990.90 | $ 10.69 |
HypotheticalA | | $ 1,000.00 | $ 1,014.47 | $ 10.82 |
Class C | 2.12% | | | |
Actual | | $ 1,000.00 | $ 990.00 | $ 10.63 |
HypotheticalA | | $ 1,000.00 | $ 1,014.52 | $ 10.76 |
International Growth | 1.03% | | | |
Actual | | $ 1,000.00 | $ 995.50 | $ 5.18 |
HypotheticalA | | $ 1,000.00 | $ 1,020.01 | $ 5.24 |
Institutional Class | 1.05% | | | |
Actual | | $ 1,000.00 | $ 995.50 | $ 5.28 |
HypotheticalA | | $ 1,000.00 | $ 1,019.91 | $ 5.35 |
Class Z | .88% | | | |
Actual | | $ 1,000.00 | $ 996.40 | $ 4.43 |
HypotheticalA | | $ 1,000.00 | $ 1,020.77 | $ 4.48 |
A 5% return per year before expenses
B Annualized expense ratio reflects expenses net of applicable fee waivers.
* Expenses are equal to each Class' annualized expense ratio, multiplied by the average account value over the period, multiplied by 184/365 (to reflect the one-half year period).
Annual Report
Investment Changes (Unaudited)
Geographic Diversification (% of fund's net assets) |
As of October 31, 2014 |
 | United States of America* 18.8% | |
 | United Kingdom 15.5% | |
 | Japan 14.2% | |
 | Switzerland 12.4% | |
 | Sweden 5.6% | |
 | Germany 4.6% | |
 | Belgium 4.5% | |
 | Australia 3.5% | |
 | Denmark 2.8% | |
 | Other 18.1% | |

Percentages are based on country or territory of incorporation and are adjusted for the effect of futures contracts, if applicable. |
* Includes Short-Term Investments and Net Other Assets (Liabilities) |
As of April 30, 2014 |
| United States of America* 17.7% | |
| United Kingdom 14.4% | |
| Japan 13.9% | |
| Switzerland 13.4% | |
| Sweden 6.7% | |
| Belgium 4.7% | |
| Germany 4.2% | |
| Australia 3.0% | |
| Denmark 3.0% | |
| Other 19.0% | |

Percentages are based on country or territory of incorporation and are adjusted for the effect of futures contracts, if applicable. |
* Includes Short-Term Investments and Net Other Assets (Liabilities) |
Asset Allocation as of October 31, 2014 |
| % of fund's
net assets | % of fund's net assets
6 months ago |
Stocks | 96.7 | 96.7 |
Short-Term Investments and Net Other Assets (Liabilities) | 3.3 | 3.3 |
Top Ten Stocks as of October 31, 2014 |
| % of fund's
net assets | % of fund's net assets
6 months ago |
Roche Holding AG (participation certificate) (Switzerland, Pharmaceuticals) | 4.5 | 4.2 |
Nestle SA (Switzerland, Food Products) | 3.7 | 3.7 |
Prudential PLC (United Kingdom, Insurance) | 3.0 | 2.8 |
Anheuser-Busch InBev SA NV (Belgium, Beverages) | 3.0 | 3.2 |
DENSO Corp. (Japan, Auto Components) | 2.6 | 2.7 |
Linde AG (Germany, Chemicals) | 2.6 | 2.6 |
Keyence Corp. (Japan, Electronic Equipment & Components) | 2.3 | 1.7 |
CSL Ltd. (Australia, Biotechnology) | 2.3 | 2.0 |
Novo Nordisk A/S Series B sponsored ADR (Denmark, Pharmaceuticals) | 2.2 | 2.5 |
Reckitt Benckiser Group PLC (United Kingdom, Household Products) | 2.2 | 2.1 |
| 28.4 | |
Market Sectors as of October 31, 2014 |
| % of fund's
net assets | % of fund's net assets
6 months ago |
Health Care | 16.1 | 12.2 |
Consumer Discretionary | 15.5 | 17.2 |
Financials | 15.2 | 15.9 |
Industrials | 14.8 | 14.9 |
Consumer Staples | 14.8 | 15.7 |
Information Technology | 9.9 | 7.8 |
Materials | 7.4 | 8.3 |
Energy | 2.2 | 2.3 |
Telecommunication Services | 0.8 | 2.4 |
Annual Report
Investments October 31, 2014
Showing Percentage of Net Assets
Common Stocks - 96.7% |
| Shares | | Value |
Australia - 3.5% |
CSL Ltd. | 298,127 | | $ 21,048,639 |
Sydney Airport unit | 1,294,562 | | 5,032,913 |
Transurban Group unit | 939,495 | | 6,728,575 |
TOTAL AUSTRALIA | | 32,810,127 |
Austria - 1.0% |
Andritz AG | 190,697 | | 9,205,199 |
Bailiwick of Jersey - 1.0% |
Shire PLC | 138,400 | | 9,286,215 |
Belgium - 4.5% |
Anheuser-Busch InBev SA NV | 251,991 | | 27,944,391 |
KBC Groupe SA (a) | 265,383 | | 14,217,141 |
TOTAL BELGIUM | | 42,161,532 |
Bermuda - 0.5% |
Lazard Ltd. Class A | 99,692 | | 4,905,843 |
Canada - 0.7% |
Canadian Pacific Railway Ltd. | 33,200 | | 6,905,706 |
Cayman Islands - 2.7% |
Sands China Ltd. | 1,690,400 | | 10,543,212 |
Tencent Holdings Ltd. | 343,200 | | 5,516,004 |
Wynn Macau Ltd. | 2,474,400 | | 8,945,222 |
TOTAL CAYMAN ISLANDS | | 25,004,438 |
Denmark - 2.8% |
Jyske Bank A/S (Reg.) (a) | 101,100 | | 5,446,923 |
Novo Nordisk A/S Series B sponsored ADR | 452,400 | | 20,439,432 |
TOTAL DENMARK | | 25,886,355 |
Finland - 0.2% |
Tikkurila Oyj | 108,900 | | 2,248,993 |
France - 1.0% |
Safran SA | 152,700 | | 9,663,478 |
Germany - 4.6% |
Bayer AG | 133,500 | | 18,979,677 |
Linde AG | 129,941 | | 23,961,253 |
TOTAL GERMANY | | 42,940,930 |
India - 0.5% |
Housing Development Finance Corp. Ltd. | 235,780 | | 4,246,218 |
Common Stocks - continued |
| Shares | | Value |
Ireland - 2.3% |
CRH PLC sponsored ADR | 444,566 | | $ 9,962,724 |
James Hardie Industries PLC: | | | |
CDI | 445,857 | | 4,755,798 |
sponsored ADR | 132,300 | | 7,055,559 |
TOTAL IRELAND | | 21,774,081 |
Israel - 0.2% |
Azrieli Group | 67,500 | | 2,166,849 |
Italy - 0.6% |
Azimut Holding SpA | 111,600 | | 2,606,833 |
Interpump Group SpA | 252,351 | | 3,288,830 |
TOTAL ITALY | | 5,895,663 |
Japan - 14.2% |
Aozora Bank Ltd. | 1,240,000 | | 4,358,487 |
Astellas Pharma, Inc. | 797,900 | | 12,383,805 |
Coca-Cola Central Japan Co. Ltd. | 174,500 | | 3,139,790 |
DENSO Corp. | 533,800 | | 24,465,988 |
East Japan Railway Co. | 68,800 | | 5,373,503 |
Fanuc Corp. | 51,900 | | 9,146,637 |
Fast Retailing Co. Ltd. | 27,400 | | 10,186,156 |
Japan Tobacco, Inc. | 144,500 | | 4,930,203 |
Keyence Corp. | 43,762 | | 21,206,307 |
Mitsui Fudosan Co. Ltd. | 439,000 | | 14,121,067 |
Seven Bank Ltd. | 1,300,000 | | 5,429,321 |
SHO-BOND Holdings Co. Ltd. | 121,100 | | 4,679,336 |
USS Co. Ltd. | 566,700 | | 8,918,724 |
Yamato Kogyo Co. Ltd. | 142,400 | | 4,613,045 |
TOTAL JAPAN | | 132,952,369 |
Kenya - 0.4% |
Safaricom Ltd. | 25,598,200 | | 3,491,314 |
Korea (South) - 0.4% |
NAVER Corp. | 5,695 | | 3,996,510 |
Mexico - 0.5% |
Fomento Economico Mexicano S.A.B. de CV sponsored ADR | 44,855 | | 4,316,845 |
Netherlands - 1.6% |
ING Groep NV (Certificaten Van Aandelen) (a) | 1,049,764 | | 15,033,001 |
South Africa - 1.6% |
Clicks Group Ltd. | 649,951 | | 4,425,424 |
Common Stocks - continued |
| Shares | | Value |
South Africa - continued |
MTN Group Ltd. | 164,900 | | $ 3,647,916 |
Naspers Ltd. Class N | 52,500 | | 6,533,566 |
TOTAL SOUTH AFRICA | | 14,606,906 |
Spain - 2.0% |
Inditex SA | 570,726 | | 16,031,326 |
Prosegur Compania de Seguridad SA (Reg.) | 419,349 | | 2,459,374 |
TOTAL SPAIN | | 18,490,700 |
Sweden - 5.6% |
ASSA ABLOY AB (B Shares) | 303,961 | | 16,099,232 |
Atlas Copco AB (A Shares) | 333,509 | | 9,624,773 |
Fagerhult AB | 228,152 | | 4,202,064 |
H&M Hennes & Mauritz AB (B Shares) | 254,482 | | 10,121,864 |
Intrum Justitia AB | 88,300 | | 2,623,595 |
Svenska Handelsbanken AB (A Shares) | 210,740 | | 10,048,760 |
TOTAL SWEDEN | | 52,720,288 |
Switzerland - 12.4% |
Nestle SA | 475,669 | | 34,882,777 |
Novartis AG | 141,366 | | 13,119,171 |
Roche Holding AG (participation certificate) | 142,215 | | 41,967,880 |
Schindler Holding AG: | | | |
(participation certificate) | 50,627 | | 7,071,942 |
(Reg.) | 8,980 | | 1,215,191 |
UBS AG (NY Shares) | 1,028,161 | | 17,869,438 |
TOTAL SWITZERLAND | | 116,126,399 |
Taiwan - 0.4% |
Taiwan Semiconductor Manufacturing Co. Ltd. | 864,000 | | 3,739,490 |
Turkey - 0.5% |
Coca-Cola Icecek Sanayi A/S | 226,534 | | 5,167,378 |
United Kingdom - 15.5% |
Babcock International Group PLC | 315,784 | | 5,531,498 |
BAE Systems PLC | 677,000 | | 4,967,707 |
Berendsen PLC | 226,573 | | 3,660,733 |
BG Group PLC | 614,495 | | 10,241,193 |
GlaxoSmithKline PLC | 418,600 | | 9,466,206 |
Informa PLC | 557,755 | | 4,291,678 |
InterContinental Hotel Group PLC ADR | 407,996 | | 15,507,928 |
Johnson Matthey PLC | 182,777 | | 8,695,630 |
Prudential PLC | 1,228,409 | | 28,445,074 |
Common Stocks - continued |
| Shares | | Value |
United Kingdom - continued |
Reckitt Benckiser Group PLC | 241,345 | | $ 20,269,179 |
Rolls-Royce Group PLC | 560,137 | | 7,553,711 |
Rotork PLC | 51,700 | | 2,113,100 |
SABMiller PLC | 339,166 | | 19,125,376 |
Shaftesbury PLC | 249,233 | | 2,854,678 |
Unite Group PLC | 377,876 | | 2,581,165 |
TOTAL UNITED KINGDOM | | 145,304,856 |
United States of America - 15.5% |
Autoliv, Inc. (d) | 111,169 | | 10,198,644 |
Berkshire Hathaway, Inc. Class B (a) | 50,184 | | 7,033,789 |
BorgWarner, Inc. | 198,192 | | 11,300,908 |
Cummins, Inc. | 50,782 | | 7,423,313 |
FMC Technologies, Inc. (a) | 77,152 | | 4,323,598 |
Google, Inc.: | | | |
Class A (a) | 20,533 | | 11,660,075 |
Class C (a) | 9,003 | | 5,033,397 |
Martin Marietta Materials, Inc. | 70,300 | | 8,219,476 |
MasterCard, Inc. Class A | 172,900 | | 14,480,375 |
Mead Johnson Nutrition Co. Class A | 38,844 | | 3,857,598 |
Mohawk Industries, Inc. (a) | 54,100 | | 7,684,364 |
National Oilwell Varco, Inc. | 27,772 | | 2,017,358 |
Oceaneering International, Inc. | 54,213 | | 3,809,548 |
Philip Morris International, Inc. | 87,408 | | 7,780,186 |
PriceSmart, Inc. | 43,000 | | 3,828,290 |
ResMed, Inc. (d) | 67,200 | | 3,509,184 |
Solera Holdings, Inc. | 112,389 | | 5,838,609 |
SS&C Technologies Holdings, Inc. (a) | 124,300 | | 6,006,176 |
Union Pacific Corp. | 51,400 | | 5,985,530 |
Visa, Inc. Class A | 61,275 | | 14,793,623 |
TOTAL UNITED STATES OF AMERICA | | 144,784,041 |
TOTAL COMMON STOCKS (Cost $817,018,791) |
905,831,724
|
Nonconvertible Preferred Stocks - 0.0% |
| | | |
United Kingdom - 0.0% |
Rolls-Royce Group PLC
(Cost $80,771) | 50,412,330 | |
80,645
|
Money Market Funds - 3.9% |
| Shares | | Value |
Fidelity Cash Central Fund, 0.11% (b) | 24,195,564 | | $ 24,195,564 |
Fidelity Securities Lending Cash Central Fund, 0.11% (b)(c) | 12,132,000 | | 12,132,000 |
TOTAL MONEY MARKET FUNDS (Cost $36,327,564) |
36,327,564
|
TOTAL INVESTMENT PORTFOLIO - 100.6% (Cost $853,427,126) | 942,239,933 |
NET OTHER ASSETS (LIABILITIES) - (0.6)% | (5,448,826) |
NET ASSETS - 100% | $ 936,791,107 |
Legend |
(a) Non-income producing |
(b) Affiliated fund that is generally available only to investment companies and other accounts managed by Fidelity Investments. The rate quoted is the annualized seven-day yield of the fund at period end. A complete unaudited listing of the fund's holdings as of its most recent quarter end is available upon request. In addition, each Fidelity Central Fund's financial statements, which are not covered by the Fund's Report of Independent Registered Public Accounting Firm, are available on the SEC's website or upon request. |
(c) Investment made with cash collateral received from securities on loan. |
(d) Security or a portion of the security is on loan at period end. |
Affiliated Central Funds |
Information regarding fiscal year to date income earned by the Fund from investments in Fidelity Central Funds is as follows: |
Fund | Income earned |
Fidelity Cash Central Fund | $ 22,126 |
Fidelity Securities Lending Cash Central Fund | 325,646 |
Total | $ 347,772 |
Other Information |
Categorizations in the Schedule of Investments are based on country or territory of incorporation. |
The following is a summary of the inputs used, as of October 31, 2014, involving the Fund's assets and liabilities carried at fair value. The inputs or methodology used for valuing securities may not be an indication of the risk associated with investing in those securities. For more information on valuation inputs, and their aggregation into the levels used in the table below, please refer to the Investment Valuation section in the accompanying Notes to Financial Statements. |
Valuation Inputs at Reporting Date: |
Description | Total | Level 1 | Level 2 | Level 3 |
Investments in Securities: | | | | |
Equities: | | | | |
Consumer Discretionary | $ 144,729,580 | $ 81,670,278 | $ 63,059,302 | $ - |
Consumer Staples | 139,667,437 | 68,770,276 | 70,897,161 | - |
Energy | 20,391,697 | 10,150,504 | 10,241,193 | - |
Financials | 141,364,587 | 69,731,419 | 71,633,168 | - |
Health Care | 150,200,209 | 42,928,293 | 107,271,916 | - |
Industrials | 140,636,585 | 109,675,621 | 30,960,964 | - |
Information Technology | 92,270,566 | 61,808,765 | 30,461,801 | - |
Materials | 69,512,478 | 60,143,635 | 9,368,843 | - |
Telecommunication Services | 7,139,230 | 7,139,230 | - | - |
Money Market Funds | 36,327,564 | 36,327,564 | - | - |
Total Investments in Securities: | $ 942,239,933 | $ 548,345,585 | $ 393,894,348 | $ - |
The following is a summary of transfers between Level 1 and Level 2 for the period ended October 31, 2014. Transfers are assumed to have occurred at the beginning of the period, and are primarily attributable to the valuation techniques used for foreign equity securities, as discussed in the accompanying Notes to Financial Statements: |
Transfers | Total |
Level 1 to Level 2 | $ 60,817,931 |
Level 2 to Level 1 | $ 0 |
See accompanying notes which are an integral part of the financial statements.
Annual Report
Statement of Assets and Liabilities
| October 31, 2014 |
| | |
Assets | | |
Investment in securities, at value (including securities loaned of $12,004,474) - See accompanying schedule: Unaffiliated issuers (cost $817,099,562) | $ 905,912,369 | |
Fidelity Central Funds (cost $36,327,564) | 36,327,564 | |
Total Investments (cost $853,427,126) | | $ 942,239,933 |
Foreign currency held at value (cost $43) | | 42 |
Receivable for investments sold | | 4,073,580 |
Receivable for fund shares sold | | 4,531,915 |
Dividends receivable | | 1,723,029 |
Distributions receivable from Fidelity Central Funds | | 6,903 |
Prepaid expenses | | 3,337 |
Other receivables | | 2,775 |
Total assets | | 952,581,514 |
| | |
Liabilities | | |
Payable for investments purchased | $ 1,884,552 | |
Payable for fund shares redeemed | 842,608 | |
Accrued management fee | 580,330 | |
Distribution and service plan fees payable | 60,982 | |
Other affiliated payables | 191,189 | |
Other payables and accrued expenses | 98,746 | |
Collateral on securities loaned, at value | 12,132,000 | |
Total liabilities | | 15,790,407 |
| | |
Net Assets | | $ 936,791,107 |
Net Assets consist of: | | |
Paid in capital | | $ 850,335,068 |
Undistributed net investment income | | 6,829,762 |
Accumulated undistributed net realized gain (loss) on investments and foreign currency transactions | | (9,108,156) |
Net unrealized appreciation (depreciation) on investments and assets and liabilities in foreign currencies | | 88,734,433 |
Net Assets | | $ 936,791,107 |
See accompanying notes which are an integral part of the financial statements.
Annual Report
Statement of Assets and Liabilities - continued
| October 31, 2014 |
| | |
Calculation of Maximum Offering Price
Class A:
Net Asset Value and redemption price per share
($119,017,195 ÷ 10,806,546 shares) | | $ 11.01 |
| | |
Maximum offering price per share (100/94.25 of $11.01) | | $ 11.68 |
Class T:
Net Asset Value and redemption price per share ($26,368,504 ÷ 2,404,861 shares) | | $ 10.96 |
| | |
Maximum offering price per share (100/96.50 of $10.96) | | $ 11.36 |
Class B:
Net Asset Value and offering price per share ($1,404,031 ÷ 128,735 shares)A | | $ 10.91 |
| | |
Class C:
Net Asset Value and offering price per share ($32,737,168 ÷ 3,011,271 shares)A | | $ 10.87 |
| | |
International Growth:
Net Asset Value, offering price and redemption price per share ($635,606,779 ÷ 57,274,082 shares) | | $ 11.10 |
| | |
Institutional Class:
Net Asset Value, offering price and redemption price per share ($121,553,795 ÷ 10,967,024 shares) | | $ 11.08 |
| | |
Class Z:
Net Asset Value, offering price and redemption price per share ($103,635 ÷ 9,336 shares) | | $ 11.10 |
A Redemption price per share is equal to net asset value less any applicable contingent deferred sales charge.
See accompanying notes which are an integral part of the financial statements.
Annual Report
Financial Statements - continued
Statement of Operations
| Year ended October 31, 2014 |
| | |
Investment Income | | |
Dividends | | $ 17,871,194 |
Income from Fidelity Central Funds | | 347,772 |
Income before foreign taxes withheld | | 18,218,966 |
Less foreign taxes withheld | | (1,316,845) |
Total income | | 16,902,121 |
| | |
Expenses | | |
Management fee
Basic fee | $ 5,413,678 | |
Performance adjustment | 364,493 | |
Transfer agent fees | 1,687,661 | |
Distribution and service plan fees | 677,617 | |
Accounting and security lending fees | 377,289 | |
Custodian fees and expenses | 106,805 | |
Independent trustees' compensation | 3,045 | |
Registration fees | 139,931 | |
Audit | 71,897 | |
Legal | 2,124 | |
Miscellaneous | 3,622 | |
Total expenses before reductions | 8,848,162 | |
Expense reductions | (10,690) | 8,837,472 |
Net investment income (loss) | | 8,064,649 |
Realized and Unrealized Gain (Loss) Net realized gain (loss) on: | | |
Investment securities: | | |
Unaffiliated issuers | (8,867,777) | |
Foreign currency transactions | (61,847) | |
Total net realized gain (loss) | | (8,929,624) |
Change in net unrealized appreciation (depreciation) on: Investment securities (net of increase in deferred foreign taxes of $11,698) | 17,936,446 | |
Assets and liabilities in foreign currencies | (63,604) | |
Total change in net unrealized appreciation (depreciation) | | 17,872,842 |
Net gain (loss) | | 8,943,218 |
Net increase (decrease) in net assets resulting from operations | | $ 17,007,867 |
See accompanying notes which are an integral part of the financial statements.
Annual Report
Statement of Changes in Net Assets
| Year ended
October 31,
2014 | Year ended
October 31,
2013 |
Increase (Decrease) in Net Assets | | |
Operations | | |
Net investment income (loss) | $ 8,064,649 | $ 3,493,326 |
Net realized gain (loss) | (8,929,624) | 6,317,113 |
Change in net unrealized appreciation (depreciation) | 17,872,842 | 60,869,889 |
Net increase (decrease) in net assets resulting
from operations | 17,007,867 | 70,680,328 |
Distributions to shareholders from net investment income | (2,592,643) | (2,081,336) |
Distributions to shareholders from net realized gain | (513,441) | (113,769) |
Total distributions | (3,106,084) | (2,195,105) |
Share transactions - net increase (decrease) | 336,569,228 | 324,915,158 |
Redemption fees | 42,228 | 31,216 |
Total increase (decrease) in net assets | 350,513,239 | 393,431,597 |
| | |
Net Assets | | |
Beginning of period | 586,277,868 | 192,846,271 |
End of period (including undistributed net investment income of $6,829,762 and undistributed net investment income of $2,476,993, respectively) | $ 936,791,107 | $ 586,277,868 |
See accompanying notes which are an integral part of the financial statements.
Annual Report
Financial Highlights - Class A
Years ended October 31, | 2014 | 2013 | 2012 | 2011 | 2010 |
Selected Per-Share Data | | | | | |
Net asset value, beginning of period | $ 10.78 | $ 8.91 | $ 8.09 | $ 8.38 | $ 7.01 |
Income from Investment Operations | | | | | |
Net investment income (loss) C | .09 | .08 | .08 | .08 | .05 |
Net realized and unrealized gain (loss) | .18 | 1.88 | .81 | (.31) | 1.39 |
Total from investment operations | .27 | 1.96 | .89 | (.23) | 1.44 |
Distributions from net investment income | (.03) | (.08) | (.06) | (.05) | (.05) |
Distributions from net realized gain | (.01) | (.01) | (.01) | (.01) | (.03) |
Total distributions | (.04) | (.09) | (.07) | (.06) | (.07) H |
Redemption fees added to paid in capital C, G | - | - | - | - | - |
Net asset value, end of period | $ 11.01 | $ 10.78 | $ 8.91 | $ 8.09 | $ 8.38 |
Total ReturnA, B | 2.54% | 22.18% | 11.10% | (2.76)% | 20.68% |
Ratios to Average Net Assets D, F | | | | | |
Expenses before reductions | 1.35% | 1.44% | 1.58% | 1.77% | 2.13% |
Expenses net of fee waivers, if any | 1.35% | 1.43% | 1.45% | 1.45% | 1.50% |
Expenses net of all reductions | 1.34% | 1.42% | 1.44% | 1.43% | 1.48% |
Net investment income (loss) | .84% | .80% | .99% | .92% | .74% |
Supplemental Data | | | | | |
Net assets, end of period (000 omitted) | $ 119,017 | $ 74,595 | $ 21,874 | $ 6,352 | $ 3,084 |
Portfolio turnover rateE | 27% | 32% | 32% | 68% | 87% |
A Total returns would have been lower if certain expenses had not been reduced during the applicable periods shown.
B Total returns do not include the effect of the sales charges.
C Calculated based on average shares outstanding during the period.
D Fees and expenses of any underlying Fidelity Central Funds are not included in the Fund's expense ratio. The Fund indirectly bears its proportionate share of the expenses of any underlying Fidelity Central Funds.
E Amount does not include the portfolio activity of any underlying Fidelity Central Funds.
F Expense ratios reflect operating expenses of the class. Expenses before reductions do not reflect amounts reimbursed by the investment adviser or reductions from brokerage service arrangements or reductions from other expense offset arrangements and do not represent the amount paid by the class during periods when reimbursements or reductions occur. Expenses net of fee waivers reflect expenses after reimbursement by the investment adviser but prior to reductions from brokerage service arrangements or other expense offset arrangements. Expenses net of all reductions represent the net expenses paid by the class.
G Amount represents less than $.01 per share.
H Total distributions of $.07 per share is comprised of distributions from net investment income of $.046 and distributions from net realized gain of $.025 per share.
See accompanying notes which are an integral part of the financial statements.
Annual Report
Financial Highlights - Class T
Years ended October 31, | 2014 | 2013 | 2012 | 2011 | 2010 |
Selected Per-Share Data | | | | | |
Net asset value, beginning of period | $ 10.75 | $ 8.89 | $ 8.08 | $ 8.38 | $ 7.00 |
Income from Investment Operations | | | | | |
Net investment income (loss) C | .06 | .05 | .06 | .06 | .04 |
Net realized and unrealized gain (loss) | .18 | 1.88 | .81 | (.31) | 1.39 |
Total from investment operations | .24 | 1.93 | .87 | (.25) | 1.43 |
Distributions from net investment income | (.02) | (.07) | (.05) | (.04) | (.02) |
Distributions from net realized gain | (.01) | (.01) | (.01) | (.01) | (.03) |
Total distributions | (.03) | (.07) H | (.06) | (.05) | (.05) |
Redemption fees added to paid in capital C, G | - | - | - | - | - |
Net asset value, end of period | $ 10.96 | $ 10.75 | $ 8.89 | $ 8.08 | $ 8.38 |
Total ReturnA, B | 2.21% | 21.91% | 10.82% | (3.03)% | 20.47% |
Ratios to Average Net Assets D, F | | | | | |
Expenses before reductions | 1.65% | 1.69% | 1.85% | 2.03% | 2.41% |
Expenses net of fee waivers, if any | 1.65% | 1.69% | 1.70% | 1.70% | 1.75% |
Expenses net of all reductions | 1.65% | 1.68% | 1.69% | 1.68% | 1.73% |
Net investment income (loss) | .53% | .54% | .74% | .67% | .49% |
Supplemental Data | | | | | |
Net assets, end of period (000 omitted) | $ 26,369 | $ 23,118 | $ 10,690 | $ 2,917 | $ 1,034 |
Portfolio turnover rateE | 27% | 32% | 32% | 68% | 87% |
A Total returns would have been lower if certain expenses had not been reduced during the applicable periods shown.
B Total returns do not include the effect of the sales charges.
C Calculated based on average shares outstanding during the period.
D Fees and expenses of any underlying Fidelity Central Funds are not included in the Fund's expense ratio. The Fund indirectly bears its proportionate share of the expenses of any underlying Fidelity Central Funds.
E Amount does not include the portfolio activity of any underlying Fidelity Central Funds.
F Expense ratios reflect operating expenses of the class. Expenses before reductions do not reflect amounts reimbursed by the investment adviser or reductions from brokerage service arrangements or reductions from other expense offset arrangements and do not represent the amount paid by the class during periods when reimbursements or reductions occur. Expenses net of fee waivers reflect expenses after reimbursement by the investment adviser but prior to reductions from brokerage service arrangements or other expense offset arrangements. Expenses net of all reductions represent the net expenses paid by the class.
G Amount represents less than $.01 per share.
H Total distributions of $.07 per share is comprised of distributions from net investment income of $.069 and distributions from net realized gain of $.005 per share.
See accompanying notes which are an integral part of the financial statements.
Annual Report
Financial Highlights - Class B
Years ended October 31, | 2014 | 2013 | 2012 | 2011 | 2010 |
Selected Per-Share Data | | | | | |
Net asset value, beginning of period | $ 10.73 | $ 8.88 | $ 8.06 | $ 8.36 | $ 6.98 |
Income from Investment Operations | | | | | |
Net investment income (loss) C | - G | - G | .02 | .01 | - G |
Net realized and unrealized gain (loss) | .19 | 1.89 | .80 | (.30) | 1.38 |
Total from investment operations | .19 | 1.89 | .82 | (.29) | 1.38 |
Distributions from net investment income | - | (.03) | - | (.01) | - |
Distributions from net realized gain | (.01) | (.01) | - | - G | - |
Total distributions | (.01) | (.04) | - | (.01) | - |
Redemption fees added to paid in capital C, G | - | - | - | - | - |
Net asset value, end of period | $ 10.91 | $ 10.73 | $ 8.88 | $ 8.06 | $ 8.36 |
Total ReturnA, B | 1.76% | 21.35% | 10.17% | (3.47)% | 19.77% |
Ratios to Average Net Assets D, F | | | | | |
Expenses before reductions | 2.14% | 2.19% | 2.35% | 2.55% | 2.87% |
Expenses net of fee waivers, if any | 2.14% | 2.18% | 2.20% | 2.20% | 2.25% |
Expenses net of all reductions | 2.14% | 2.17% | 2.19% | 2.18% | 2.23% |
Net investment income (loss) | .04% | .05% | .24% | .17% | (.01)% |
Supplemental Data | | | | | |
Net assets, end of period (000 omitted) | $ 1,404 | $ 1,579 | $ 1,116 | $ 473 | $ 581 |
Portfolio turnover rateE | 27% | 32% | 32% | 68% | 87% |
A Total returns would have been lower if certain expenses had not been reduced during the applicable periods shown.
B Total returns do not include the effect of the contingent deferred sales charge.
C Calculated based on average shares outstanding during the period.
D Fees and expenses of any underlying Fidelity Central Funds are not included in the Fund's expense ratio. The Fund indirectly bears its proportionate share of the expenses of any underlying Fidelity Central Funds.
E Amount does not include the portfolio activity of any underlying Fidelity Central Funds.
F Expense ratios reflect operating expenses of the class. Expenses before reductions do not reflect amounts reimbursed by the investment adviser or reductions from brokerage service arrangements or reductions from other expense offset arrangements and do not represent the amount paid by the class during periods when reimbursements or reductions occur. Expenses net of fee waivers reflect expenses after reimbursement by the investment adviser but prior to reductions from brokerage service arrangements or other expense offset arrangements. Expenses net of all reductions represent the net expenses paid by the class.
G Amount represents less than $.01 per share.
See accompanying notes which are an integral part of the financial statements.
Annual Report
Financial Highlights - Class C
Years ended October 31, | 2014 | 2013 | 2012 | 2011 | 2010 |
Selected Per-Share Data | | | | | |
Net asset value, beginning of period | $ 10.69 | $ 8.84 | $ 8.03 | $ 8.34 | $ 6.98 |
Income from Investment Operations | | | | | |
Net investment income (loss) C | .01 | .01 | .02 | .01 | -G |
Net realized and unrealized gain (loss) | .18 | 1.87 | .80 | (.31) | 1.38 |
Total from investment operations | .19 | 1.88 | .82 | (.30) | 1.38 |
Distributions from net investment income | - | (.02) | (.01) | (.01) | - |
Distributions from net realized gain | (.01) | (.01) | (.01) | (.01) | (.02) |
Total distributions | (.01) | (.03) | (.01)I | (.01)H | (.02) |
Redemption fees added to paid in capital C, G | - | - | - | - | - |
Net asset value, end of period | $ 10.87 | $ 10.69 | $ 8.84 | $ 8.03 | $ 8.34 |
Total ReturnA, B | 1.77% | 21.29% | 10.27% | (3.57)% | 19.82% |
Ratios to Average Net Assets D, F | | | | | |
Expenses before reductions | 2.12% | 2.19% | 2.33% | 2.52% | 2.89% |
Expenses net of fee waivers, if any | 2.12% | 2.18% | 2.20% | 2.20% | 2.25% |
Expenses net of all reductions | 2.12% | 2.17% | 2.19% | 2.18% | 2.24% |
Net investment income (loss) | .06% | .05% | .24% | .17% | (.01)% |
Supplemental Data | | | | | |
Net assets, end of period (000 omitted) | $ 32,737 | $ 17,196 | $ 5,648 | $ 2,767 | $ 1,261 |
Portfolio turnover rateE | 27% | 32% | 32% | 68% | 87% |
A Total returns would have been lower if certain expenses had not been reduced during the applicable periods shown.
B Total returns do not include the effect of the contingent deferred sales charge.
C Calculated based on average shares outstanding during the period.
D Fees and expenses of any underlying Fidelity Central Funds are not included in the Fund's expense ratio. The Fund indirectly bears its proportionate share of the expenses of any underlying Fidelity Central Funds.
E Amount does not include the portfolio activity of any underlying Fidelity Central Funds.
F Expense ratios reflect operating expenses of the class. Expenses before reductions do not reflect amounts reimbursed by the investment adviser or reductions from brokerage service arrangements or reductions from other expense offset arrangements and do not represent the amount paid by the class during periods when reimbursements or reductions occur. Expenses net of fee waivers reflect expenses after reimbursement by the investment adviser but prior to reductions from brokerage service arrangements or other expense offset arrangements. Expenses net of all reductions represent the net expenses paid by the class.
G Amount represents less than $.01 per share.
H Total distributions of $.01 per share is comprised of distributions from net investment income of $.008 and distributions from net realized gain of $.005 per share.
I Total distributions of $.01 per share is comprised of distributions from net investment income of $.007 and distributions from net realized gain of $.006 per share.
See accompanying notes which are an integral part of the financial statements.
Annual Report
Financial Highlights - International Growth
Years ended October 31, | 2014 | 2013 | 2012 | 2011 | 2010 |
Selected Per-Share Data | | | | | |
Net asset value, beginning of period | $ 10.84 | $ 8.95 | $ 8.12 | $ 8.40 | $ 7.02 |
Income from Investment Operations | | | | | |
Net investment income (loss) B | .13 | .11 | .11 | .10 | .07 |
Net realized and unrealized gain (loss) | .19 | 1.88 | .81 | (.30) | 1.39 |
Total from investment operations | .32 | 1.99 | .92 | (.20) | 1.46 |
Distributions from net investment income | (.05) | (.10) | (.08) | (.07) | (.06) |
Distributions from net realized gain | (.01) | (.01) | (.01) | (.01) | (.03) |
Total distributions | (.06) | (.10)H | (.09) | (.08) | (.08)G |
Redemption fees added to paid in capital B,F | - | - | - | - | - |
Net asset value, end of period | $ 11.10 | $ 10.84 | $ 8.95 | $ 8.12 | $ 8.40 |
Total ReturnA | 2.96% | 22.48% | 11.41% | (2.47)% | 20.97% |
Ratios to Average Net Assets C, E | | | | | |
Expenses before reductions | 1.04% | 1.13% | 1.28% | 1.52% | 1.89% |
Expenses net of fee waivers, if any | 1.04% | 1.13% | 1.20% | 1.20% | 1.25% |
Expenses net of all reductions | 1.04% | 1.11% | 1.19% | 1.18% | 1.23% |
Net investment income (loss) | 1.14% | 1.11% | 1.24% | 1.17% | .99% |
Supplemental Data | | | | | |
Net assets, end of period (000 omitted) | $ 635,607 | $ 430,914 | $ 149,526 | $ 53,437 | $ 28,454 |
Portfolio turnover rateD | 27% | 32% | 32% | 68% | 87% |
A Total returns would have been lower if certain expenses had not been reduced during the applicable periods shown.
B Calculated based on average shares outstanding during the period.
C Fees and expenses of any underlying Fidelity Central Funds are not included in the Fund's expense ratio. The Fund indirectly bears its proportionate share of the expenses of any underlying Fidelity Central Funds.
D Amount does not include the portfolio activity of any underlying Fidelity Central Funds.
E Expense ratios reflect operating expenses of the class. Expenses before reductions do not reflect amounts reimbursed by the investment adviser or reductions from brokerage service arrangements or reductions from other expense offset arrangements and do not represent the amount paid by the class during periods when reimbursements or reductions occur. Expenses net of fee waivers reflect expenses after reimbursement by the investment adviser but prior to reductions from brokerage service arrangements or other expense offset arrangements. Expenses net of all reductions represent the net expenses paid by the class.
F Amount represents less than $.01 per share.
G Total distributions of $.08 per share is comprised of distributions from net investment income of $.057 and distributions from net realized gain of $.025 per share.
H Total distributions of $.10 per share is comprised of distributions from net investment income of $.097 and distributions from net realized gain of $.005 per share.
See accompanying notes which are an integral part of the financial statements.
Annual Report
Financial Highlights - Institutional Class
Years ended October 31, | 2014 | 2013 | 2012 | 2011 | 2010 |
Selected Per-Share Data | | | | | |
Net asset value, beginning of period | $ 10.84 | $ 8.94 | $ 8.12 | $ 8.40 | $ 7.02 |
Income from Investment Operations | | | | | |
Net investment income (loss) B | .13 | .11 | .10 | .10 | .07 |
Net realized and unrealized gain (loss) | .18 | 1.90 | .81 | (.30) | 1.39 |
Total from investment operations | .31 | 2.01 | .91 | (.20) | 1.46 |
Distributions from net investment income | (.06) | (.10) | (.08) | (.07) | (.06) |
Distributions from net realized gain | (.01) | (.01) | (.01) | (.01) | (.03) |
Total distributions | (.07) | (.11) | (.09) | (.08) | (.08)G |
Redemption fees added to paid in capital B,F | - | - | - | - | - |
Net asset value, end of period | $ 11.08 | $ 10.84 | $ 8.94 | $ 8.12 | $ 8.40 |
Total ReturnA | 2.84% | 22.66% | 11.28% | (2.47)% | 20.97% |
Ratios to Average Net Assets C, E | | | | | |
Expenses before reductions | 1.04% | 1.11% | 1.27% | 1.50% | 1.92% |
Expenses net of fee waivers, if any | 1.04% | 1.11% | 1.20% | 1.20% | 1.25% |
Expenses net of all reductions | 1.04% | 1.09% | 1.19% | 1.18% | 1.23% |
Net investment income (loss) | 1.14% | 1.13% | 1.24% | 1.17% | .99% |
Supplemental Data | | | | | |
Net assets, end of period (000 omitted) | $ 121,554 | $ 38,771 | $ 3,992 | $ 493 | $ 113 |
Portfolio turnover rateD | 27% | 32% | 32% | 68% | 87% |
A Total returns would have been lower if certain expenses had not been reduced during the applicable periods shown.
B Calculated based on average shares outstanding during the period.
C Fees and expenses of any underlying Fidelity Central Funds are not included in the Fund's expense ratio. The Fund indirectly bears its proportionate share of the expenses of any underlying Fidelity Central Funds.
D Amount does not include the portfolio activity of any underlying Fidelity Central Funds.
E Expense ratios reflect operating expenses of the class. Expenses before reductions do not reflect amounts reimbursed by the investment adviser or reductions from brokerage service arrangements or reductions from other expense offset arrangements and do not represent the amount paid by the class during periods when reimbursements or reductions occur. Expenses net of fee waivers reflect expenses after reimbursement by the investment adviser but prior to reductions from brokerage service arrangements or other expense offset arrangements. Expenses net of all reductions represent the net expenses paid by the class.
F Amount represents less than $.01 per share.
G Total distributions of $.08 per share is comprised of distributions from net investment income of $.057 and distributions from net realized gain of $.025 per share.
See accompanying notes which are an integral part of the financial statements.
Annual Report
Financial Highlights - Class Z
Years ended October 31, | 2014 | 2013 G |
Selected Per-Share Data | | |
Net asset value, beginning of period | $ 10.84 | $ 10.26 |
Income from Investment Operations | | |
Net investment income (loss) D | .14 | .02 |
Net realized and unrealized gain (loss) | .19 | .56 |
Total from investment operations | .33 | .58 |
Distributions from net investment income | (.06) | - |
Distributions from net realized gain | (.01) | - |
Total distributions | (.07) | - |
Redemption fees added to paid in capital D,I | - | - |
Net asset value, end of period | $ 11.10 | $ 10.84 |
Total ReturnB, C | 3.07% | 5.65% |
Ratios to Average Net Assets E, H | | |
Expenses before reductions | .88% | .94%A |
Expenses net of fee waivers, if any | .88% | .94%A |
Expenses net of all reductions | .88% | .93%A |
Net investment income (loss) | 1.30% | .65%A |
Supplemental Data | | |
Net assets, end of period (000 omitted) | $ 104 | $ 106 |
Portfolio turnover rateF | 27% | 32% |
A Annualized
B Total returns for periods of less than one year are not annualized.
C Total returns would have been lower if certain expenses had not been reduced during the applicable periods shown.
D Calculated based on average shares outstanding during the period.
E Fees and expenses of any underlying Fidelity Central Funds are not included in the Fund's expense ratio. The Fund indirectly bears its proportionate share of the expenses of any underlying Fidelity Central Funds.
F Amount does not include the portfolio activity of any underlying Fidelity Central Funds.
G For the period August 13, 2013 (commencement of sale of shares) to October 31, 2013.
H Expense ratios reflect operating expenses of the class. Expenses before reductions do not reflect amounts reimbursed by the investment adviser or reductions from brokerage service arrangements or reductions from other expense offset arrangements and do not represent the amount paid by the class during periods when reimbursements or reductions occur. Expense ratios before reductions for start-up periods may not be representative of longer-term operating periods. Expenses net of fee waivers reflect expenses after reimbursement by the investment adviser but prior to reductions from brokerage service arrangements or other expense offset arrangements. Expenses net of all reductions represent the net expenses paid by the class.
I Amount represents less than $.01 per share.
See accompanying notes which are an integral part of the financial statements.
Annual Report
Notes to Financial Statements
For the period ended October 31, 2014
1. Organization.
Fidelity International Growth Fund (the Fund) is a fund of Fidelity Investment Trust (the Trust) and is authorized to issue an unlimited number of shares. The Trust is registered under the Investment Company Act of 1940, as amended (the 1940 Act), as an open-end management investment company organized as a Massachusetts business trust. The Fund offers Class A, Class T, Class C, International Growth, Institutional Class and Class Z shares, each of which, along with Class B shares, has equal rights as to assets and voting privileges. Class B shares are closed to new accounts and additional purchases, except for exchanges and reinvestments. Each class has exclusive voting rights with respect to matters that affect that class. Class B shares will automatically convert to Class A shares after a holding period of seven years from the initial date of purchase.
2. Investments in Fidelity Central Funds.
The Fund invests in Fidelity Central Funds, which are open-end investment companies generally available only to other investment companies and accounts managed by the investment adviser and its affiliates. The Fund's Schedule of Investments lists each of the Fidelity Central Funds held as of period end, if any, as an investment of the Fund, but does not include the underlying holdings of each Fidelity Central Fund. As an Investing Fund, the Fund indirectly bears its proportionate share of the expenses of the underlying Fidelity Central Funds.
The Money Market Central Funds seek preservation of capital and current income and are managed by Fidelity Investments Money Management, Inc. (FIMM), an affiliate of the investment adviser. Annualized expenses of the Money Market Central Funds as of their most recent shareholder report date are less than .01%.
A complete unaudited list of holdings for each Fidelity Central Fund is available upon request or at the Securities and Exchange Commission (the SEC) website at www.sec.gov. In addition, the financial statements of the Fidelity Central Funds, which are not covered by the Fund's Report of Independent Registered Public Accounting Firm, are available on the SEC website or upon request.
3. Significant Accounting Policies.
The financial statements have been prepared in conformity with accounting principles generally accepted in the United States of America (GAAP), which require management to make certain estimates and assumptions at the date of the financial statements. Actual results could differ from those estimates. Subsequent events, if any, through the date that the financial statements were issued have been evaluated in the preparation of the financial statements. The following summarizes the significant accounting policies of the Fund:
Annual Report
3. Significant Accounting Policies - continued
Investment Valuation. Investments are valued as of 4:00 p.m. Eastern time on the last calendar day of the period. In accordance with valuation policies and procedures approved by the Board of Trustees (the Board), the Fund attempts to obtain prices from one or more third party pricing vendors or brokers to value its investments. When current market prices, quotations or currency exchange rates are not readily available or reliable, investments will be fair valued in good faith by the Fidelity Management & Research Company (FMR) Fair Value Committee (the Committee), in accordance with procedures adopted by the Board. Factors used in determining fair value vary by investment type and may include market or investment specific events. The frequency with which these procedures are used cannot be predicted and they may be utilized to a significant extent. The Committee oversees the Fund's valuation policies and procedures and is responsible for approving and reporting to the Board all fair value determinations.
The Fund categorizes the inputs to valuation techniques used to value its investments into a disclosure hierarchy consisting of three levels as shown below:
Level 1 - quoted prices in active markets for identical investments
Level 2 - other significant observable inputs (including quoted prices for similar investments, interest rates, prepayment speeds, etc.)
Level 3 - unobservable inputs (including the Fund's own assumptions based on the best information available)
Valuation techniques used to value the Fund's investments by major category are as follows:
Equity securities, including restricted securities, for which market quotations are readily available, are valued at the last reported sale price or official closing price as reported by a third party pricing vendor on the primary market or exchange on which they are traded and are categorized as Level 1 in the hierarchy. In the event there were no sales during the day or closing prices are not available, securities are valued at the last quoted bid price or may be valued using the last available price and are generally categorized as Level 2 in the hierarchy. For foreign equity securities, when market or security specific events arise, comparisons to the valuation of American Depositary Receipts (ADRs), futures contracts, Exchange-Traded Funds (ETFs) and certain indexes as well as quoted prices for similar securities may be used and would be categorized as Level 2 in the hierarchy. Utilizing these techniques may result in transfers between Level 1 and Level 2. For equity securities, including restricted securities, where observable inputs are limited, assumptions about market activity and risk are used and these securities may be categorized as Level 3 in the hierarchy.
Annual Report
Notes to Financial Statements - continued
3. Significant Accounting Policies - continued
Investment Valuation - continued
Investments in open-end mutual funds, including the Fidelity Central Funds, are valued at their closing net asset value (NAV) each business day and are categorized as Level 1 in the hierarchy.
Changes in valuation techniques may result in transfers in or out of an assigned level within the disclosure hierarchy. The aggregate value of investments by input level, as of October 31, 2014, including information on transfers between Levels 1 and 2, is included at the end of the Fund's Schedule of Investments.
Foreign Currency. The Fund may use foreign currency contracts to facilitate transactions in foreign-denominated securities. Gains and losses from these transactions may arise from changes in the value of the foreign currency or if the counterparties do not perform under the contracts' terms.
Foreign-denominated assets, including investment securities, and liabilities are translated into U.S. dollars at the exchange rates at period end. Purchases and sales of investment securities, income and dividends received and expenses denominated in foreign currencies are translated into U.S. dollars at the exchange rate in effect on the transaction date.
The effects of exchange rate fluctuations on investments are included with the net realized and unrealized gain (loss) on investment securities. Other foreign currency transactions resulting in realized and unrealized gain (loss) are disclosed separately.
Investment Transactions and Income. For financial reporting purposes, the Fund's investment holdings and NAV include trades executed through the end of the last business day of the period. The NAV per share for processing shareholder transactions is calculated as of the close of business of the New York Stock Exchange (NYSE), normally 4:00 p.m. Eastern time and includes trades executed through the end of the prior business day. Gains and losses on securities sold are determined on the basis of identified cost and may include proceeds received from litigation. Dividend income is recorded on the ex-dividend date, except for certain dividends from foreign securities where the ex-dividend date may have passed, which are recorded as soon as the Fund is informed of the ex-dividend date. Non-cash dividends included in dividend income, if any, are recorded at the fair market value of the securities received. Income and capital gain distributions from Fidelity Central Funds, if any, are recorded on the ex-dividend date. Investment income is recorded net of foreign taxes withheld where recovery of such taxes is uncertain.
Annual Report
3. Significant Accounting Policies - continued
Class Allocations and Expenses. Investment income, realized and unrealized capital gains and losses, common expenses of the Fund, and certain fund-level expense reductions, if any, are allocated daily on a pro-rata basis to each class based on the relative net assets of each class to the total net assets of the Fund. Each class differs with respect to transfer agent and distribution and service plan fees incurred. Certain expense reductions may also differ by class. For the reporting period, the allocated portion of income and expenses to each class as a percent of its average net assets may vary due to the timing of recording these transactions in relation to fluctuating net assets of the classes. Expenses directly attributable to a fund are charged to that fund. Expenses attributable to more than one fund are allocated among the respective funds on the basis of relative net assets or other appropriate methods. Expense estimates are accrued in the period to which they relate and adjustments are made when actual amounts are known.
Income Tax Information and Distributions to Shareholders. Each year, the Fund intends to qualify as a regulated investment company under Subchapter M of the Internal Revenue Code, including distributing substantially all of its taxable income and realized gains. As a result, no provision for U.S. Federal income taxes is required. As of October 31, 2014, the Fund did not have any unrecognized tax benefits in the financial statements; nor is the Fund aware of any tax positions for which it is reasonably possible that the total amounts of unrecognized tax benefits will significantly change in the next twelve months. The Fund files a U.S. federal tax return, in addition to state and local tax returns as required. The Fund's federal income tax returns are subject to examination by the Internal Revenue Service (IRS) for a period of three fiscal years after they are filed. State and local tax returns may be subject to examination for an additional fiscal year depending on the jurisdiction. Foreign taxes are provided for based on the Fund's understanding of the tax rules and rates that exist in the foreign markets in which it invests. The Fund is subject to a tax imposed on capital gains by certain countries in which it invests. An estimated deferred tax liability for net unrealized appreciation on the applicable securities is included in Other payables and accrued expenses on the Statement of Assets & Liabilities.
Distributions are declared and recorded on the ex-dividend date. Income dividends and capital gain distributions are declared separately for each class. Income and capital gain distributions are determined in accordance with income tax regulations, which may differ from GAAP. In addition, the Fund claimed a portion of the payment made to redeeming shareholders as a distribution for income tax purposes.
Capital accounts within the financial statements are adjusted for permanent book-tax differences. These adjustments have no impact on net assets or the results of operations. Capital accounts are not adjusted for temporary book-tax differences which will reverse in a subsequent period.
Annual Report
Notes to Financial Statements - continued
3. Significant Accounting Policies - continued
Income Tax Information and Distributions to Shareholders - continued
Book-tax differences are primarily due to foreign currency transactions, passive foreign investment companies (PFIC), partnerships, capital loss carryforwards and losses deferred due to wash sales.
The federal tax cost of investment securities and unrealized appreciation (depreciation) as of period end were as follows:
Gross unrealized appreciation | $ 110,999,674 |
Gross unrealized depreciation | (22,777,849) |
Net unrealized appreciation (depreciation) on securities | $ 88,221,825 |
| |
Tax Cost | $ 854,018,108 |
The tax-based components of distributable earnings as of period end were as follows:
Undistributed ordinary income | $ 6,829,762 |
Capital loss carryforward | $ (8,517,174) |
Net unrealized appreciation (depreciation) on securities and other investments | $ 88,155,149 |
Capital loss carryforwards are only available to offset future capital gains of the Fund to the extent provided by regulations and may be limited. Under the Regulated Investment Company Modernization Act of 2010 (the Act), the Fund is permitted to carry forward capital losses incurred in taxable years beginning after December 22, 2010 for an unlimited period and such capital losses are required to be used prior to any losses that expire. The capital loss carryforward information presented below, including any applicable limitation, is estimated as of fiscal period end and is subject to adjustment.
No expiration | |
Short-term | (7,236,154) |
Long-term | (1,281,020) |
Total no expiration | (8,517,174) |
The tax character of distributions paid was as follows:
| October 31, 2014 | October 31, 2013 |
Ordinary Income | $ 2,592,642 | $ 2,195,105 |
Long-term Capital Gains | 513,442 | - |
Total | $ 3,106,084 | $ 2,195,105 |
Annual Report
3. Significant Accounting Policies - continued
Short-Term Trading (Redemption) Fees. Shares held by investors in the Fund less than 30 days may have been subject to a redemption fee equal to 1.00% of the NAV of shares redeemed. All redemption fees, which reduce the proceeds of the shareholder redemption, are retained by the Fund and accounted for as an addition to paid in capital.
New Accounting Pronouncement. In June 2014, the Financial Accounting Standards Board issued Accounting Standard Update No. 2014-11, Repurchase-to-Maturity Transactions, Repurchase Financings, and Disclosures. The Update amends the accounting for certain repurchase agreements and expands disclosure requirements for reverse repurchase agreements, securities lending and other similar transactions. The disclosure requirements are effective for annual and interim reporting periods beginning after December 15, 2014. Management is currently evaluating the impact of the Update on the Fund's financial statements and related disclosures.
4. Purchases and Sales of Investments.
Purchases and sales of securities, other than short-term securities, aggregated $523,591,304 and $200,715,697, respectively.
5. Fees and Other Transactions with Affiliates.
Management Fee. Fidelity Management & Research Company and its affiliates provide the Fund with investment management related services for which the Fund pays a monthly management fee. The management fee is the sum of an individual fund fee rate that is based on an annual rate of .45% of the Fund's average net assets and an annualized group fee rate that averaged .25% during the period. The group fee rate is based upon the average net assets of all the mutual funds advised by the investment adviser, including any mutual funds previously advised by the investment adviser that are currently advised by Fidelity SelectCo, LLC, an affiliate of the investment adviser. The group fee rate decreases as assets under management increase and increases as assets under management decrease. In addition, the management fee is subject to a performance adjustment (up to a maximum of ± .20% of the Fund's average net assets over a 36 month performance period). The upward or downward adjustment to the management fee is based on the relative investment performance of International Growth as compared to its benchmark index, the MSCI EAFE Growth Index, over the same 36 month performance period. For the reporting period, the total annual management fee rate, including the performance adjustment, was .75% of the Fund's average net assets. The performance adjustment included in the management fee rate may be higher or lower than the maximum performance adjustment rate due to the difference between the average net assets for the reporting and performance periods.
Annual Report
Notes to Financial Statements - continued
5. Fees and Other Transactions with Affiliates - continued
Distribution and Service Plan Fees. In accordance with Rule 12b-1 of the 1940 Act, the Fund has adopted separate Distribution and Service Plans for each class of shares. Certain classes pay Fidelity Distributors Corporation (FDC), an affiliate of the investment adviser, separate Distribution and Service Fees, each of which is based on an annual percentage of each class' average net assets. In addition, FDC may pay financial intermediaries for selling shares of the Fund and providing shareholder support services. For the period, the Distribution and Service Fee rates, total fees and amounts retained by FDC were as follows:
| Distribution
Fee | Service
Fee | Total Fees | Retained
by FDC |
Class A | -% | .25% | $ 254,598 | $ 7,801 |
Class T | .25% | .25% | 131,110 | - |
Class B | .75% | .25% | 15,512 | 11,650 |
Class C | .75% | .25% | 276,397 | 95,761 |
| | | $ 677,617 | $ 115,212 |
Sales Load. FDC may receive a front-end sales charge of up to 5.75% for selling Class A shares and 3.50% for selling Class T shares, some of which is paid to financial intermediaries for selling shares of the Fund. Depending on the holding period, FDC may receive contingent deferred sales charges levied on Class A, Class T, Class B, and Class C redemptions. The deferred sales charges range from 5.00% to 1.00% for Class B shares, 1.00% for Class C shares, 1.00% for certain purchases of Class A shares and .25% for certain purchases of Class T shares.
For the period, sales charge amounts retained by FDC were as follows:
| Retained
by FDC |
Class A | $ 86,435 |
Class T | 14,136 |
Class B* | 528 |
Class C* | 3,947 |
| $ 105,046 |
* When Class B and Class C shares are initially sold, FDC pays commissions from its own resources to financial intermediaries through which the sales are made.
Transfer Agent Fees. Fidelity Investments Institutional Operations Company, Inc., (FIIOC), an affiliate of the investment adviser, is the transfer, dividend disbursing and shareholder servicing agent for each class of the Fund. FIIOC receives account fees and asset-based fees that vary according to the account size and type of account of the
Annual Report
5. Fees and Other Transactions with Affiliates - continued
Transfer Agent Fees - continued
shareholders of the respective classes of the Fund, except for Class Z. FIIOC receives an asset-based fee of Class Z's average net assets. FIIOC pays for typesetting, printing and mailing of shareholder reports, except proxy statements.
For the period, transfer agent fees for each class were as follows:
| Amount | % of
Class-Level Average
Net Assets |
Class A | $ 265,803 | .26 |
Class T | 81,975 | .31 |
Class B | 4,755 | .31 |
Class C | 79,887 | .29 |
International Growth | 1,083,784 | .20 |
Institutional Class | 171,407 | .21 |
Class Z | 50 | .05 |
| $ 1,687,661 | |
Accounting and Security Lending Fees. Fidelity Service Company, Inc. (FSC), an affiliate of the investment adviser, maintains the Fund's accounting records. The accounting fee is based on the level of average net assets for each month. Under a separate contract, FSC administers the security lending program. The security lending fee is based on the number and duration of lending transactions.
Brokerage Commissions. The Fund placed a portion of its portfolio transactions with brokerage firms which are affiliates of the investment adviser. Brokerage commissions are included in net realized gain (loss) and change in net unrealized appreciation (depreciation) in the Statement of Operations. The commissions paid to these affiliated firms were $1,309 for the period.
Other. During the period, the investment adviser reimbursed the Fund for certain losses in the amount of $4,581.
6. Committed Line of Credit.
The Fund participates with other funds managed by the investment adviser or an affiliate in a $4.25 billion credit facility (the "line of credit") to be utilized for temporary or emergency purposes to fund shareholder redemptions or for other short-term liquidity purposes. The Fund has agreed to pay commitment fees on its pro-rata portion of the line of credit, which amounted to $1,181 and is reflected in Miscellaneous expenses on the Statement of Operations. During the period, the Fund did not borrow on this line of credit.
Annual Report
Notes to Financial Statements - continued
7. Security Lending.
The Fund lends portfolio securities through a lending agent from time to time in order to earn additional income. For equity securities, a lending agent is used and may loan securities to certain qualified borrowers, including Fidelity Capital Markets (FCM), a broker-dealer affiliated with the Fund. On the settlement date of the loan, the Fund receives collateral (in the form of U.S. Treasury obligations, letters of credit and/or cash) against the loaned securities and maintains collateral in an amount not less than 100% of the market value of the loaned securities during the period of the loan. The market value of the loaned securities is determined at the close of business of the Fund and any additional required collateral is delivered to the Fund on the next business day. If the borrower defaults on its obligation to return the securities loaned because of insolvency or other reasons, the Fund may apply collateral received from the borrower against the obligation. The Fund may experience delays and costs in recovering the securities loaned. Any cash collateral received is invested in the Fidelity Securities Lending Cash Central Fund. The value of loaned securities and cash collateral at period end are disclosed on the Fund's Statement of Assets and Liabilities. The value of securities loaned to FCM at period end was $819,854. Security lending income represents the income earned on investing cash collateral, less rebates paid to borrowers and any lending agent fees associated with the loan, plus any premium payments received for lending certain types of securities. Security lending income is presented in the Statement of Operations as a component of income from Fidelity Central Funds. Total security lending income during the period amounted to $325,646, including $14,631 from securities loaned to FCM.
8. Expense Reductions.
Commissions paid to certain brokers with whom the investment adviser, or its affiliates, places trades on behalf of the Fund include an amount in addition to trade execution, which may be rebated back to the Fund to offset certain expenses. This amount totaled $6,405 for the period. In addition, through arrangements with the Fund's custodian, credits realized as a result of uninvested cash balances were used to reduce the Fund's expenses. During the period, these credits reduced the Fund's custody expenses by $37.
In addition, the investment adviser reimbursed a portion of the Fund's operating expenses during the period in the amount of $4,248.
Annual Report
9. Distributions to Shareholders.
Distributions to shareholders of each class were as follows:
Years ended October 31, | 2014 | 2013 |
From net investment income | | |
Class A | $ 253,092 | $ 226,330 |
Class T | 40,595 | 86,155 |
Class B | - | 4,290 |
Class C | - | 14,481 |
International Growth | 2,051,403 | 1,698,830 |
Institutional Class | 246,949 | 51,250 |
Class Z | 604 | - |
Total | $ 2,592,643 | $ 2,081,336 |
From net realized gain | | |
Class A | $ 66,995 | $ 13,472 |
Class T | 20,298 | 6,243 |
Class B | 1,337 | 631 |
Class C | 16,479 | 3,291 |
International Growth | 369,252 | 87,569 |
Institutional Class | 38,992 | 2,563 |
Class Z | 88 | - |
Total | $ 513,441 | $ 113,769 |
10. Share Transactions.
Share transactions for each class were as follows and may contain automatic conversions between classes or exchanges between funds:
| Shares | Dollars |
Years ended October 31, | 2014 | 2013A | 2014 | 2013A |
Class A | | | | |
Shares sold | 6,584,484 | 5,907,169 | $ 72,326,606 | $ 58,500,264 |
Reinvestment of distributions | 27,068 | 24,178 | 291,793 | 218,566 |
Shares redeemed | (2,724,911) | (1,466,703) | (30,099,985) | (14,226,261) |
Net increase (decrease) | 3,886,641 | 4,464,644 | $ 42,518,414 | $ 44,492,569 |
Class T | | | | |
Shares sold | 834,072 | 1,144,706 | $ 9,114,198 | $ 11,429,141 |
Reinvestment of distributions | 5,459 | 10,086 | 58,733 | 91,076 |
Shares redeemed | (585,464) | (206,178) | (6,459,248) | (2,020,899) |
Net increase (decrease) | 254,067 | 948,614 | $ 2,713,683 | $ 9,499,318 |
Class B | | | | |
Shares sold | 35,020 | 70,442 | $ 380,789 | $ 702,618 |
Reinvestment of distributions | 123 | 531 | 1,323 | 4,806 |
Shares redeemed | (53,583) | (49,437) | (587,919) | (483,935) |
Net increase (decrease) | (18,440) | 21,536 | $ (205,807) | $ 223,489 |
Annual Report
Notes to Financial Statements - continued
10. Share Transactions - continued
| Shares | Dollars |
Years ended October 31, | 2014 | 2013A | 2014 | 2013A |
Class C | | | | |
Shares sold | 1,827,859 | 1,392,365 | $ 19,884,401 | $ 13,520,584 |
Reinvestment of distributions | 1,498 | 1,911 | 16,049 | 17,237 |
Shares redeemed | (426,678) | (424,469) | (4,637,384) | (4,120,400) |
Net increase (decrease) | 1,402,679 | 969,807 | $ 15,263,066 | $ 9,417,421 |
International Growth | | | | |
Shares sold | 27,835,093 | 29,198,608 | $ 307,440,711 | $ 290,678,738 |
Reinvestment of distributions | 197,948 | 192,126 | 2,143,781 | 1,742,585 |
Shares redeemed | (10,494,762) | (6,365,570) | (115,997,211) | (62,814,771) |
Net increase (decrease) | 17,538,279 | 23,025,164 | $ 193,587,281 | $ 229,606,552 |
Institutional Class | | | | |
Shares sold | 10,292,704 | 3,568,741 | $ 113,864,505 | $ 35,951,935 |
Reinvestment of distributions | 24,180 | 5,682 | 261,623 | 51,476 |
Shares redeemed | (2,927,192) | (443,392) | (31,428,962) | (4,427,602) |
Net increase (decrease) | 7,389,692 | 3,131,031 | $ 82,697,166 | $ 31,575,809 |
Class Z | | | | |
Shares sold | - | 9,747 | $ - | $ 100,000 |
Reinvestment of distributions | 64 | - | 692 | - |
Shares redeemed | (475) | - | (5,267) | - |
Net increase (decrease) | (411) | 9,747 | $ (4,575) | $ 100,000 |
A Share transactions for Class Z are for the period August 13, 2013 (commencement of sale of shares) to October 31, 2013.
11. Other.
The Fund's organizational documents provide former and current trustees and officers with a limited indemnification against liabilities arising in connection with the performance of their duties to the Fund. In the normal course of business, the Fund may also enter into contracts that provide general indemnifications. The Fund's maximum exposure under these arrangements is unknown as this would be dependent on future claims that may be made against the Fund. The risk of material loss from such claims is considered remote.
Annual Report
To the Trustees of Fidelity Investment Trust and the Shareholders of Fidelity International Growth Fund:
In our opinion, the accompanying statement of assets and liabilities, including the schedule of investments, and the related statements of operations and of changes in net assets and the financial highlights present fairly, in all material respects, the financial position of Fidelity International Growth Fund (a fund of Fidelity Investment Trust) at October 31, 2014, the results of its operations for the year then ended, the changes in its net assets for each of the two years in the period then ended and the financial highlights for each of the periods indicated, in conformity with accounting principles generally accepted in the United States of America. These financial statements and financial highlights (hereafter referred to as "financial statements") are the responsibility of the Fidelity International Growth Fund's management. Our responsibility is to express an opinion on these financial statements based on our audits. We conducted our audits of these financial statements in accordance with the standards of the Public Company Accounting Oversight Board (United States). Those standards require that we plan and perform the audit to obtain reasonable assurance about whether the financial statements are free of material misstatement. An audit includes examining, on a test basis, evidence supporting the amounts and disclosures in the financial statements, assessing the accounting principles used and significant estimates made by management, and evaluating the overall financial statement presentation. We believe that our audits, which included confirmation of securities at October 31, 2014 by correspondence with the custodian and brokers, provide a reasonable basis for our opinion.
PricewaterhouseCoopers LLP
Boston, Massachusetts
December 18, 2014
Annual Report
The Trustees, Member of the Advisory Board, and officers of the trust and fund, as applicable, are listed below. The Board of Trustees governs the fund and is responsible for protecting the interests of shareholders. The Trustees are experienced executives who meet periodically throughout the year to oversee the fund's activities, review contractual arrangements with companies that provide services to the fund, oversee management of the risks associated with such activities and contractual arrangements, and review the fund's performance. Except for James C. Curvey, each of the Trustees oversees 174 funds. Mr. Curvey oversees 407 funds.
The Trustees hold office without limit in time except that (a) any Trustee may resign; (b) any Trustee may be removed by written instrument, signed by at least two-thirds of the number of Trustees prior to such removal; (c) any Trustee who requests to be retired or who has become incapacitated by illness or injury may be retired by written instrument signed by a majority of the other Trustees; and (d) any Trustee may be removed at any special meeting of shareholders by a two-thirds vote of the outstanding voting securities of the trust. Each Trustee who is not an interested person (as defined in the 1940 Act) of the trust and the fund (Independent Trustee), shall retire not later than the last day of the calendar year in which his or her 75th birthday occurs. The Independent Trustees may waive this mandatory retirement age policy with respect to individual Trustees. The officers and Advisory Board Member hold office without limit in time, except that any officer and Advisory Board Member may resign or may be removed by a vote of a majority of the Trustees at any regular meeting or any special meeting of the Trustees. Except as indicated, each individual has held the office shown or other offices in the same company for the past five years.
Experience, Skills, Attributes, and Qualifications of the Fund's Trustees. The Governance and Nominating Committee has adopted a statement of policy that describes the experience, qualifications, attributes, and skills that are necessary and desirable for potential Independent Trustee candidates (Statement of Policy). The Board believes that each Trustee satisfied at the time he or she was initially elected or appointed a Trustee, and continues to satisfy, the standards contemplated by the Statement of Policy. The Governance and Nominating Committee also engages professional search firms to help identify potential Independent Trustee candidates who have the experience, qualifications, attributes, and skills consistent with the Statement of Policy. From time to time, additional criteria based on the composition and skills of the current Independent Trustees, as well as experience or skills that may be appropriate in light of future changes to board composition, business conditions, and regulatory or other developments, have also been considered by the professional search firms and the Governance and Nominating Committee. In addition, the Board takes into account the Trustees' commitment and participation in Board and committee meetings, as well as their leadership of standing and ad hoc committees throughout their tenure.
In determining that a particular Trustee was and continues to be qualified to serve as a Trustee, the Board has considered a variety of criteria, none of which, in isolation, was controlling. The Board believes that, collectively, the Trustees have balanced and diverse experience, qualifications, attributes, and skills, which allow the Board to operate effectively in governing the fund and protecting the interests of shareholders. Information about the specific experience, skills, attributes, and qualifications of each Trustee, which in each case led to the Board's conclusion that the Trustee should serve (or continue to serve) as a trustee of the fund, is provided below.
Annual Report
Board Structure and Oversight Function. James C. Curvey is an interested person (as defined in the 1940 Act) and currently serves as Chairman. The Trustees have determined that an interested Chairman is appropriate and benefits shareholders because an interested Chairman has a personal and professional stake in the quality and continuity of services provided to the fund. Independent Trustees exercise their informed business judgment to appoint an individual of their choosing to serve as Chairman, regardless of whether the Trustee happens to be independent or a member of management. The Independent Trustees have determined that they can act independently and effectively without having an Independent Trustee serve as Chairman and that a key structural component for assuring that they are in a position to do so is for the Independent Trustees to constitute a substantial majority for the Board. The Independent Trustees also regularly meet in executive session. Ned C. Lautenbach serves as Chairman of the Independent Trustees and as such (i) acts as a liaison between the Independent Trustees and management with respect to matters important to the Independent Trustees and (ii) with management prepares agendas for Board meetings.
Fidelity funds are overseen by different Boards of Trustees. The fund's Board oversees Fidelity's equity and high income funds and another Board oversees Fidelity's investment-grade bond, money market, and asset allocation funds. The asset allocation funds may invest in Fidelity funds overseen by the fund's Board. The use of separate Boards, each with its own committee structure, allows the Trustees of each group of Fidelity funds to focus on the unique issues of the funds they oversee, including common research, investment, and operational issues. On occasion, the separate Boards establish joint committees to address issues of overlapping consequences for the Fidelity funds overseen by each Board.
The Trustees operate using a system of committees to facilitate the timely and efficient consideration of all matters of importance to the Trustees, the fund, and fund shareholders and to facilitate compliance with legal and regulatory requirements and oversight of the fund's activities and associated risks. The Board, acting through its committees, has charged FMR and its affiliates with (i) identifying events or circumstances the occurrence of which could have demonstrably adverse effects on the fund's business and/or reputation; (ii) implementing processes and controls to lessen the possibility that such events or circumstances occur or to mitigate the effects of such events or circumstances if they do occur; and (iii) creating and maintaining a system designed to evaluate continuously business and market conditions in order to facilitate the identification and implementation processes described in (i) and (ii) above. Because the day-to-day operations and activities of the fund are carried out by or through FMR, its affiliates and other service providers, the fund's exposure to risks is mitigated but not eliminated by the processes overseen by the Trustees. While each of the Board's committees has responsibility for overseeing different aspects of the fund's activities, oversight is exercised primarily through the Operations, Audit, and Compliance Committees. In addition, the Independent Trustees have worked with FMR to enhance the Board's oversight of investment and financial risks, legal and regulatory risks, technology risks, and operational risks, including the development of additional risk reporting to the Board. For example, a working group comprised of Independent Trustees and FMR has worked and continues to work to review the Fidelity funds' valuation-related activities, reporting and risk management. Appropriate personnel, including but not limited to the fund's Chief Compliance Officer (CCO), FMR's internal auditor, the independent accountants, the fund's Treasurer and portfolio management personnel, make periodic reports to the Board's committees, as appropriate, including an annual review of FMR's risk management program for the Fidelity funds. The responsibilities of each standing committee, including their oversight responsibilities, are described further under "Standing Committees of the Fund's Trustees."
Annual Report
Trustees and Officers - continued
The fund's Statement of Additional Information (SAI) includes more information about the Trustees. To request a free copy, call Fidelity at 1-877-208-0098.
Interested Trustees*:
Correspondence intended for each Trustee who is an interested person may be sent to Fidelity Investments, 245 Summer Street, Boston, Massachusetts 02210.
Name, Year of Birth; Principal Occupations and Other Relevant Experience+ |
James C. Curvey (1935) |
Year of Election or Appointment: 2007 Trustee Chairman of the Board of Trustees |
| Mr. Curvey also serves as Trustee of other Fidelity funds. Mr. Curvey is a Director of Fidelity Research & Analysis Co. (2009-present), and Vice Chairman (2007-present) and Director of FMR LLC. In addition, Mr. Curvey serves as an Overseer for the Boston Symphony Orchestra and a member of the board of Artis-Naples, Naples, Florida, and as a Trustee for Brewster Academy, Wolfeboro, New Hampshire. Previously, Mr. Curvey served as a Director of Fidelity Investments Money Management, Inc. (2009-2014), a Director of FMR (2007-2014), and a Director of FMR Co., Inc. (2007-2014). |
Charles S. Morrison (1960) |
Year of Election or Appointment: 2014 Trustee |
| Mr. Morrison also serves as Trustee of other funds. He serves as a Director of Fidelity Investments Money Management, Inc. (FIMM) (2014-present), Director of Fidelity SelectCo, LLC (2014-present), President, Asset Management (2014-present), and is an employee of Fidelity Investments. Previously, Mr. Morrison served as Vice President of Fidelity's Fixed Income and Asset Allocation Funds (2012-2014), President, Fixed Income (2011-2014), Vice President of Fidelity's Money Market Funds (2005-2009), President, Money Market Group Leader of FMR (2009), and Senior Vice President, Money Market Group of FMR (2004-2009). Mr. Morrison also served as Vice President of Fidelity's Bond Funds (2002-2005), certain Balanced Funds (2002-2005), and certain Asset Allocation Funds (2002-2007), and as Senior Vice President (2002-2005) of Fidelity's Bond Division. |
* Trustees have been determined to be "Interested Trustees" by virtue of, among other things, their affiliation with the trust or various entities under common control with FMR.
+ The information above includes each Trustee's principal occupation during the last five years and other information relating to the experience, attributes, and skills relevant to each Trustee's qualifications to serve as a Trustee, which led to the conclusion that each Trustee should serve as a Trustee for the fund.
Annual Report
Trustees and Officers - continued
Independent Trustees:
Correspondence intended for each Independent Trustee (that is, the Trustees other than the Interested Trustees) may be sent to Fidelity Investments, P.O. Box 55235, Boston, Massachusetts 02205-5235.
Name, Year of Birth; Principal Occupations and Other Relevant Experience+ |
Dennis J. Dirks (1948) |
Year of Election or Appointment: 2005 Trustee |
| Mr. Dirks also serves as Trustee of other Fidelity funds. Prior to his retirement in May 2003, Mr. Dirks was Chief Operating Officer and a member of the Board of The Depository Trust & Clearing Corporation (DTCC). He also served as President, Chief Operating Officer, and Board member of The Depository Trust Company (DTC) and President and Board member of the National Securities Clearing Corporation (NSCC). In addition, Mr. Dirks served as Chief Executive Officer and Board member of the Government Securities Clearing Corporation, Chief Executive Officer and Board member of the Mortgage-Backed Securities Clearing Corporation, as a Trustee and a member of the Finance Committee of Manhattan College (2005-2008), and as a Trustee and a member of the Finance Committee of AHRC of Nassau County (2006-2008). Mr. Dirks is a member of the Independent Directors Council (IDC) Governing Council (2010-present) and Board of Directors for The Brookville Center for Children's Services, Inc. (2009-present). |
Alan J. Lacy (1953) |
Year of Election or Appointment: 2008 Trustee |
| Mr. Lacy also serves as Trustee of other Fidelity funds. Mr. Lacy serves as Senior Adviser (2007-present) of Oak Hill Capital Partners, L.P. (private equity). Mr. Lacy also served as Chief Executive Officer (2000-2005) and Vice Chairman (2005-2006) of Sears Holdings Corporation and Sears, Roebuck and Co. (retail). In addition, Mr. Lacy serves as a member of the Board of Directors of Dave & Buster's Entertainment, Inc. (restaurant and entertainment complexes, 2010-present), Earth Fare, Inc. (retail grocery, 2012-present), The Hillman Companies, Inc. (hardware wholesalers, 2010-present), and Bristol-Myers Squibb Company (global pharmaceuticals, 2008-present). Mr. Lacy is a member of the Board of Trustees of The National Parks Conservation Association (2006-present). Previously, Mr. Lacy served as Chairman of the Board of Trustees of the National Parks Conservation Association (2008-2011) and as a member of the Board of Directors for the Western Union Company (global money transfer, 2006-2011). |
Ned C. Lautenbach (1944) |
Year of Election or Appointment: 2000 Trustee Chairman of the Independent Trustees |
| Mr. Lautenbach also serves as Trustee of other Fidelity funds. Mr. Lautenbach currently serves as the Lead Director of the Eaton Corporation Board of Directors (diversified industrial, 1997-present). Mr. Lautenbach is Chairman of the Board of Directors of the Philharmonic Center for the Arts in Naples, Florida (2012-present) and a member of the Council on Foreign Relations (1994-present). Previously, Mr. Lautenbach was a Partner/Advisory Partner at Clayton, Dubilier & Rice, LLC (private equity investment, 1998-2010), as well as a Director of Sony Corporation (2006-2007). |
Joseph Mauriello (1944) |
Year of Election or Appointment: 2008 Trustee |
| Mr. Mauriello also serves as Trustee of other Fidelity funds. Prior to his retirement in January 2006, Mr. Mauriello served in numerous senior management positions including Deputy Chairman and Chief Operating Officer (2004-2005), and Vice Chairman of Financial Services (2002-2004) of KPMG LLP US (professional services, 1965-2005). Mr. Mauriello currently serves as a member of the Board of Directors of XL Group plc. (global insurance and re-insurance, 2006-present). Previously, Mr. Mauriello served as a Director of the Hamilton Funds of the Bank of New York (2006-2007) and of Arcadia Resources Inc. (health care services and products, 2007-2012). |
Robert W. Selander (1950) |
Year of Election or Appointment: 2011 Trustee |
| Mr. Selander also serves as Trustee of other Fidelity funds. Previously, Mr. Selander served as a Member of the Advisory Board of other Fidelity funds (2011), and Executive Vice Chairman (2010), Chief Executive Officer (2009-2010), and President and Chief Executive Officer (1997-2009) of Mastercard, Inc. |
Cornelia M. Small (1944) |
Year of Election or Appointment: 2005 Trustee |
| Ms. Small also serves as Trustee of other Fidelity funds. Ms. Small is a member of the Board of Directors (2009-present) and Chair of the Investment Committee (2010-present) of the Teagle Foundation. Ms. Small also serves on the Investment Committee of the Berkshire Taconic Community Foundation (2008-present). Previously, Ms. Small served as Chairperson (2002-2008) and a member of the Investment Committee and Chairperson (2008-2012) and a member of the Board of Trustees of Smith College. In addition, Ms. Small served as Chief Investment Officer, Director of Global Equity Investments, and a member of the Board of Directors of Scudder, Stevens & Clark and Scudder Kemper Investments. |
William S. Stavropoulos (1939) |
Year of Election or Appointment: 2001 Trustee Vice Chairman of the Independent Trustees |
| Mr. Stavropoulos also serves as Trustee of other Fidelity funds. Mr. Stavropoulos serves as President and Founder of the Michigan Baseball Foundation, the Great Lakes Loons (2007-present). Mr. Stavropoulos is Chairman Emeritus of the Board of Directors of The Dow Chemical Company, where he previously served in numerous senior management positions, including President, CEO (1995-2000; 2002-2004), Chairman of the Executive Committee (2000-2006), and as a member of the Board of Directors (1990-2006). Currently, Mr. Stavropoulos is Chairman of the Board of Directors of Univar Inc. (global distributor of commodity and specialty chemicals), a Director of Teradata Corporation (data warehousing and technology solutions), and Maersk Inc. (industrial conglomerate), and a member of the Advisory Board for Metalmark Capital LLC (private equity investment, 2005-present). Mr. Stavropoulos is an operating advisor to Clayton, Dubilier & Rice, LLC (private equity investment). In addition, Mr. Stavropoulos is a member of the University of Notre Dame Advisory Council for the College of Science, a Trustee of the Rollin L. Gerstacker Foundation, and a Director of the Naples Philharmonic Center for the Arts. Previously, Mr. Stavropoulos served as a Director of Chemical Financial Corporation (bank holding company, 1993-2012) and Tyco International, Ltd. (multinational manufacturing and services, 2007-2012). |
David M. Thomas (1949) |
Year of Election or Appointment: 2008 Trustee |
| Mr. Thomas also serves as Trustee of other Fidelity funds. Mr. Thomas serves as Non-Executive Chairman of the Board of Directors of Fortune Brands Home and Security (home and security products, 2011-present), and as a member of the Board of Directors of Interpublic Group of Companies, Inc. (marketing communication, 2004-present). Previously, Mr. Thomas served as Executive Chairman (2005-2006) and Chairman and Chief Executive Officer (2000-2005) of IMS Health, Inc. (pharmaceutical and healthcare information solutions), and a Director of Fortune Brands, Inc. (consumer products, 2000-2011). |
+ The information above includes each Trustee's principal occupation during the last five years and other information relating to the experience, attributes, and skills relevant to each Trustee's qualifications to serve as a Trustee, which led to the conclusion that each Trustee should serve as a Trustee for the fund.
Advisory Board Member and Officers:
Correspondence intended for each officer and Peter S. Lynch may be sent to Fidelity Investments, 245 Summer Street, Boston, Massachusetts 02210. Officers appear below in alphabetical order.
Name, Year of Birth; Principal Occupation |
Peter S. Lynch (1944) |
Year of Election or Appointment: 2003 Member of the Advisory Board |
| Mr. Lynch also serves as Member of the Advisory Board of other Fidelity funds. Mr. Lynch is Vice Chairman and a Director of FMR and FMR Co., Inc. In addition, Mr. Lynch serves as a Trustee of Boston College and as the Chairman of the Inner-City Scholarship Fund. Previously, Mr. Lynch served on the Special Olympics International Board of Directors (1997-2006). |
Elizabeth Paige Baumann (1968) |
Year of Election or Appointment: 2012 Anti-Money Laundering (AML) Officer |
| Ms. Baumann also serves as AML Officer of other funds. She is Chief AML Officer of FMR LLC (2012-present) and is an employee of Fidelity Investments. Previously, Ms. Baumann served as Vice President and Deputy Anti-Money Laundering Officer (2007-2012). |
William C. Coffey (1969) |
Year of Election or Appointment: 2009 Assistant Secretary |
| Mr. Coffey also serves as Assistant Secretary of other funds. He is Senior Vice President and Deputy General Counsel of FMR LLC (2010-present), and is an employee of Fidelity Investments. Previously, Mr. Coffey served as Vice President and Associate General Counsel of FMR LLC (2005-2009). |
Timothy M. Cohen (1969) |
Year of Election or Appointment: 2014 Vice President of certain Equity Funds |
| Mr. Cohen also serves as Vice President of other funds. Mr. Cohen serves as a Director and Chief Compliance Officer of Fidelity Management & Research (U.K.) Inc. (2013-present) and is an employee of Fidelity Investments. |
Jonathan Davis (1968) |
Year of Election or Appointment: 2010 Assistant Treasurer |
| Mr. Davis also serves as Assistant Treasurer of other funds. Mr. Davis is an employee of Fidelity Investments. Previously, Mr. Davis served as Vice President and Associate General Counsel of FMR LLC (2003-2010). |
Adrien E. Deberghes (1967) |
Year of Election or Appointment: 2008 Deputy Treasurer |
| Mr. Deberghes also serves as an officer of other funds. He is an employee of Fidelity Investments (2008-present). Prior to joining Fidelity Investments, Mr. Deberghes was Senior Vice President of Mutual Fund Administration at State Street Corporation (2007-2008), Senior Director of Mutual Fund Administration at Investors Bank & Trust (2005-2007), and Director of Finance for Dunkin' Brands (2000-2005). |
Stephanie J. Dorsey (1969) |
Year of Election or Appointment: 2010 Assistant Treasurer |
| Ms. Dorsey also serves as an officer of other funds. She is an employee of Fidelity Investments (2008-present) and has served in other fund officer roles. Prior to joining Fidelity Investments, Ms. Dorsey served as Treasurer (2004-2008) of the JPMorgan Mutual Funds and Vice President (2004-2008) of JPMorgan Chase Bank. |
Howard J. Galligan III (1966) |
Year of Election or Appointment: 2014 Chief Financial Officer |
| Mr. Galligan also serves as Chief Financial Officer of other funds. Mr. Galligan serves as President of Fidelity Pricing and Cash Management Services (FPCMS) (2014-present) and as a Director of Strategic Advisers, Inc. (2008-present). Previously, Mr. Galligan served as Chief Administrative Officer of Asset Management (2011-2014) and Chief Operating Officer and Senior Vice President of Investment Support for Strategic Advisers, Inc. (2003-2011). |
Scott C. Goebel (1968) |
Year of Election or Appointment: 2008 Secretary and Chief Legal Officer (CLO) |
| Mr. Goebel serves as Secretary and CLO of other funds. Mr. Goebel also serves as Secretary of Fidelity SelectCo, LLC (2013-present), Fidelity Investments Money Management, Inc. (FIMM) (2010-present) and Fidelity Research and Analysis Company (FRAC) (2010-present); General Counsel, Secretary, and Senior Vice President of FMR (2008-present) and FMR Co., Inc. (2008-present); Chief Legal Officer of Fidelity Management & Research (Hong Kong) Limited (2008-present); and Assistant Secretary of Fidelity Management & Research (Japan) Limited (2008-present) and Fidelity Management & Research (U.K.) Inc. (2008-present). Previously, Mr. Goebel served as Secretary and CLO of other Fidelity funds (2008-2013), Assistant Secretary of FIMM (2008-2010), FRAC (2008-2010), and certain funds (2007-2008); and as Vice President and Secretary of Fidelity Distributors Corporation (FDC) (2005-2007). Mr. Goebel has been employed by FMR LLC or an affiliate since 2001. |
Brian B. Hogan (1964) |
Year of Election or Appointment: 2009 Vice President |
| Mr. Hogan also serves as Trustee or Vice President of other funds. Mr. Hogan serves as a Director of Fidelity SelectCo, LLC (2014-present) and President of FMR's Equity Division (2009-present). Previously, Mr. Hogan served as Senior Vice President, Equity Research of FMR (2006-2009) and as a portfolio manager. |
Chris Maher (1972) |
Year of Election or Appointment: 2013 Assistant Treasurer |
| Mr. Maher serves as Assistant Treasurer of other funds. Mr. Maher is Vice President of Valuation Oversight and is an employee of Fidelity Investments. Previously, Mr. Maher served as Vice President of Asset Management Compliance (2013), Vice President of FMR's Program Management Group (2010-2013), and Vice President of Valuation Oversight (2008-2010). |
Kenneth B. Robins (1969) |
Year of Election or Appointment: 2008 President and Treasurer |
| Mr. Robins also serves as an officer of other funds. Mr. Robins serves as Executive Vice President of Fidelity Investments Money Management, Inc. (FIMM) (2013-present) and is an employee of Fidelity Investments (2004-present). Previously, Mr. Robins served in other fund officer roles. |
Stephen Sadoski (1971) |
Year of Election or Appointment: 2012 Deputy Treasurer |
| Mr. Sadoski also serves as Deputy Treasurer of other funds. He is an employee of Fidelity Investments (2012-present) and has served in another fund officer role. Prior to joining Fidelity Investments, Mr. Sadoski served as an assistant chief accountant in the Division of Investment Management of the Securities and Exchange Commission (SEC) (2009-2012) and as a senior manager at Deloitte & Touche LLP (1997-2009). |
Stacie M. Smith (1974) |
Year of Election or Appointment: 2013 Deputy Treasurer |
| Ms. Smith also serves as an officer of other funds. She is an employee of Fidelity Investments (2009-present) and has served in other fund officer roles. Prior to joining Fidelity Investments, Ms. Smith served as Senior Audit Manager of Ernst & Young LLP (1996-2009). |
Renee Stagnone (1975) |
Year of Election or Appointment: 2013 Deputy Treasurer |
| Ms. Stagnone also serves as Deputy Treasurer of other funds. Ms. Stagnone is an employee of Fidelity Investments. |
Linda J. Wondrack (1964) |
Year of Election or Appointment: 2014 Chief Compliance Officer |
| Ms. Wondrack also serves as Chief Compliance Officer of other funds. Ms. Wondrack is Executive Vice President and head of the Ethics Office and Asset Management Compliance for Fidelity Investments (2012-present). Ms. Wondrack also serves as Chief Compliance Officer of Fidelity SelectCo, LLC (2014-present); Chief Compliance Officer of Impresa Management LLC (2013-present); and Chief Compliance Officer of FMR Co., Inc., Fidelity Investments Money Management, Inc., Fidelity Management & Research (Japan) Limited, Fidelity Management & Research (U.K.) Inc., Fidelity Management & Research (Hong Kong), Fidelity Management & Research Company, Pyramis Global Advisors, LLC, and Strategic Advisers, Inc., Ballyrock Investment Advisors LLC, and Northern Neck Investors LLC (2012-present). Previously, Ms. Wondrack served as Senior Vice President and Chief Compliance Officer for Columbia Management Investment Advisers, LLC (2005-2012); Chief Compliance Officer for certain funds within the Columbia Family of Funds (2007-2012); and Senior Vice President of Compliance Risk Management at Bank of America (2005-2010). |
Joseph F. Zambello (1957) |
Year of Election or Appointment: 2011 Deputy Treasurer |
| Mr. Zambello also serves as Deputy Treasurer of other funds. Mr. Zambello is an employee of Fidelity Investments. Previously, Mr. Zambello served as Vice President of FMR's Program Management Group (2009-2011) and Vice President of the Transfer Agent Oversight Group (2005-2009). |
Annual Report
Institutional Class designates 15% of the dividends distributed in December 2013 as indicated in the Corporate Qualifying memo distributed by the Tax department, during the fiscal year as qualifying for the dividends-received deduction for corporate shareholders.
Institutional Class designates 100% of the dividends distributed in December during the fiscal year as amounts which may be taken into account as a dividend for purposes of the maximum rate under section 1(h)(11) of the Internal Revenue Code.
The amounts per share which represent income derived from sources within, and taxes paid to, foreign countries or possessions of the United States are as follows:
| Pay Date | Income | Taxes |
Class Z | 12/09/2013 | $0.0679 | $0.0059 |
The fund will notify shareholders in January 2015 of amounts for use in preparing 2014 income tax returns.
Annual Report
Board Approval of Investment Advisory Contracts and Management Fees
Fidelity International Growth Fund
Each year, the Board of Trustees, including the Independent Trustees (together, the Board), votes on the renewal of the management contract with Fidelity Management & Research Company (FMR) and the sub-advisory agreements (together, the Advisory Contracts) for the fund. The Board, assisted by the advice of fund counsel and Independent Trustees' counsel, requests and considers a broad range of information relevant to the renewal of the Advisory Contracts throughout the year.
The Board meets regularly and, at each of its meetings, covers an extensive agenda of topics and materials and considers factors that are relevant to its annual consideration of the renewal of the fund's Advisory Contracts, including the services and support provided to the fund and its shareholders. The Board has established various standing committees (Committees), each composed of and chaired by Independent Trustees with varying backgrounds, to which the Board has assigned specific subject matter responsibilities in order to enhance effective decision-making by the Board. The Board, acting directly and through its Committees, requests and receives information concerning the annual consideration of the renewal of the fund's Advisory Contracts. The Board also meets as needed to consider matters specifically related to the Board's annual consideration of the renewal of the Advisory Contracts. Members of the Board may also meet with trustees of other Fidelity funds through ad hoc joint committees to discuss certain matters relevant to the Fidelity funds.
At its July 2014 meeting, the Board, including the Independent Trustees, unanimously determined to renew the fund's Advisory Contracts. In reaching its determination, the Board considered all factors it believed relevant, including (i) the nature, extent, and quality of the services to be provided to the fund and its shareholders (including the investment performance of the fund); (ii) the competitiveness of the fund's management fee and total expense ratio relative to peer funds; (iii) the total costs of the services to be provided by and the profits to be realized by Fidelity from its relationship with the fund; (iv) the extent to which economies of scale exist and would be realized as the fund grows; and (v) whether fee levels reflect these economies of scale, if any, for the benefit of fund shareholders. In connection with separate internal corporate reorganizations involving Fidelity Management & Research (U.K.) Inc. (FMR U.K.) and Fidelity Management & Research (Japan) Inc. (FMR Japan), the Board approved certain non-material amendments to the fund's sub-advisory agreements with FMR U.K. and FMR Japan to reflect that, after these reorganizations, FMR Investment Management (UK) Limited and Fidelity Management & Research (Japan) Limited will carry on the business of FMR U.K. and FMR Japan, respectively. The Board noted that no changes to the portfolio managers or to the foreign research or investment advisory services provided to the fund were expected in connection with either reorganization and that the same personnel and resources would continue to be available to the fund at the new entities.
Annual Report
Board Approval of Investment Advisory Contracts and
Management Fees - continued
In considering whether to renew the Advisory Contracts for the fund, the Board reached a determination, with the assistance of fund counsel and Independent Trustees' counsel and through the exercise of its business judgment, that the renewal of the Advisory Contracts was in the best interests of the fund and its shareholders and that the compensation payable under the Advisory Contracts was fair and reasonable. The Board's decision to renew the Advisory Contracts was not based on any single factor, but rather was based on a comprehensive consideration of all the information provided to the Board at its meetings throughout the year. The Board, in reaching its determination to renew the Advisory Contracts, was aware that shareholders of the fund have a broad range of investment choices available to them, including a wide choice among funds offered by Fidelity's competitors, and that the fund's shareholders, who have the opportunity to review and weigh the disclosure provided by the fund in its prospectus and other public disclosures, have chosen to invest in this fund, which is part of the Fidelity family of funds.
Nature, Extent, and Quality of Services Provided. The Board considered Fidelity's staffing as it relates to the fund, including the backgrounds of investment personnel of FMR and the sub-advisers (together, the Investment Advisers), and also considered the fund's investment objective, strategies, and related investment philosophy. The Independent Trustees also had discussions with senior management of Fidelity's investment operations and investment groups. The Board considered the structure of the portfolio manager compensation program and whether this structure provides appropriate incentives to act in the best interests of the fund. Additionally, the Board considered the portfolio managers' investments, if any, in the funds that they manage.
Resources Dedicated to Investment Management and Support Services. The Board and the Fund Oversight and Research Committees reviewed the general qualifications and capabilities of Fidelity's investment staff, including its size, education, experience, and resources, as well as Fidelity's approach to recruiting, training, managing, and compensating investment personnel. The Board noted that Fidelity has continued to increase the resources devoted to non-U.S. offices, including expansion of Fidelity's global investment organization. The Board also noted that Fidelity's analysts have extensive resources, tools and capabilities that allow them to conduct sophisticated quantitative and fundamental analysis, as well as credit analysis of issuers, counterparties and guarantors. Further, the Board believes that Fidelity's investment professionals have sufficient access to global information and data so as to provide competitive investment results over time, and that those professionals also have access to sophisticated tools that permit them to assess portfolio construction and risk and performance attribution characteristics continuously, as well as to transmit new information and research conclusions rapidly around the world. Additionally, in its deliberations, the Board considered Fidelity's trading and risk management capabilities and resources and global compliance infrastructure, which are an integral part of the investment management process.
Annual Report
Shareholder and Administrative Services. The Board considered (i) the nature, extent, quality, and cost of advisory, administrative, and shareholder services performed by the Investment Advisers and their affiliates under the Advisory Contracts and under separate agreements covering transfer agency, pricing and bookkeeping, and securities lending services for the fund; (ii) the nature and extent of the supervision of third party service providers, principally custodians and subcustodians; and (iii) the resources devoted to, and the record of compliance with, the fund's compliance policies and procedures. The Board also reviewed the allocation of fund brokerage, including allocations to brokers affiliated with the Investment Advisers, the use of brokerage commissions to pay fund expenses, and the use of "soft" commission dollars to pay for research services.
The Board noted that the growth of fund assets over time across the complex allows Fidelity to reinvest in the development of services designed to enhance the value or convenience of the Fidelity funds as investment vehicles. These services include 24-hour access to account information and market information through telephone representatives and over the Internet, investor education materials and asset allocation tools, and the expanded availability of Fidelity Investor Centers.
In 2014, the Board formed an ad hoc Committee on Transfer Agency Fees to review the variety of transfer agency fee structures throughout the industry and Fidelity's competitive positioning with respect to industry participants.
Investment in a Large Fund Family. The Board considered the benefits to shareholders of investing in a Fidelity fund, including the benefits of investing in a fund that is part of a large family of funds offering a variety of investment disciplines and providing a large variety of mutual fund investor services. The Board noted that Fidelity had taken, or had made recommendations that resulted in the Fidelity funds taking, a number of actions over the previous year that benefited particular funds, including (i) continuing to dedicate additional resources to investment research and to the support of the senior management team that oversees asset management; (ii) persisting in efforts to enhance Fidelity's global research capabilities; (iii) launching new funds and making other enhancements to meet client needs for income-oriented solutions; (iv) reducing fund expenses for certain index funds; (v) continuing to launch dedicated lower cost underlying funds to meet portfolio construction needs related to expanding underlying fund options for Fidelity funds of funds, specifically for the Freedom Fund product lines; (vi) rationalizing product lines and gaining increased efficiencies through fund mergers; (vii) launching sector-based exchange-traded funds and establishing a new Fidelity adviser to manage sector-based funds and products; (viii) continuing to develop and implement technology to improve security and increase efficiency; (ix) modifying the eligibility criteria for certain share classes to increase their marketability to a portion of the defined contribution plan market; (x) waiving redemption fees for certain qualified fund-of-fund and wrap programs and certain retirement plan transactions; and (xi) launching new Institutional Class shares of certain money market funds to attract and retain assets and to fill a gap in the money market fund lineup.
Annual Report
Board Approval of Investment Advisory Contracts and
Management Fees - continued
Investment Performance. The Board considered whether the fund has operated in accordance with its investment objective, as well as its record of compliance with its investment restrictions and its performance history.
The Board took into account discussions with the Investment Advisers about fund investment performance that occur at Board meetings throughout the year. In this regard the Board noted that as part of regularly scheduled fund reviews and other reports to the Board on fund performance, the Board periodically considers annualized return information for the fund, for different time periods, measured against a securities market index ("benchmark index") and a peer group of funds with similar objectives ("peer group"). In its evaluation of fund investment performance, the Board gave particular attention to information indicating changes in performance of certain Fidelity funds for specific time periods and the Investment Advisers' explanations for any overperformance or underperformance.
In addition to reviewing absolute and relative fund performance, the Independent Trustees periodically consider the appropriateness of fund performance metrics in evaluating the results achieved. In general, the Independent Trustees believe that fund performance should be evaluated based on net performance (after fees and expenses) of both the highest performing and lowest performing classes, where applicable, compared to appropriate benchmark indices, over appropriate time periods which may include full market cycles, and compared to peer groups, as applicable, over the same periods, taking into account relevant factors including the following: general market conditions; issuer-specific information; tactical opportunities for investment; and fund cash flows and other factors.
The Independent Trustees recognize that shareholders evaluate performance on a net basis over their own holding periods, for which one-, three-, and five-year periods are often used as a proxy. For this reason, the performance information reviewed by the Board also included net cumulative calendar year total return information for the fund and an appropriate benchmark index and peer group for the most recent one-, three-, and five-year periods, as shown below. Returns are shown compared to the 25th percentile (top of box, 75% beaten) and 75th percentile (bottom of box, 25% beaten) of the peer universe. Returns of the benchmark index are "net MA," i.e., adjusted for tax withholding rates applicable to U.S.-based funds organized as Massachusetts business trusts.
Annual Report
Fidelity International Growth Fund

The Board also considered that the fund's management fee is subject to upward or downward adjustment depending upon whether, and to what extent, the fund's investment performance for the performance period exceeds, or is exceeded by, a securities index, thus leading to a performance adjustment for the same period. The Board noted that the performance adjustment provides FMR with a strong economic incentive to seek to achieve superior performance for the fund's shareholders and helps to more closely align the interests of FMR and the fund's shareholders.
Based on its review, the Board concluded that the nature, extent, and quality of services provided to the fund under the Advisory Contracts should benefit the fund's shareholders.
Competitiveness of Management Fee and Total Expense Ratio. The Board considered the fund's management fee and total expense ratio compared to "mapped groups" of competitive funds and classes. Fidelity creates "mapped groups" by combining similar Lipper investment objective categories that have comparable investment mandates. Combining Lipper investment objective categories aids the Board's management fee and total expense ratio comparisons by broadening the competitive group used for comparison and by reducing the number of universes to which various Fidelity funds are compared.
Management Fee. The Board considered two proprietary management fee comparisons for the 12-month periods shown in the chart below. The group of Lipper funds used by the Board for management fee comparisons is referred to below as the "Total Mapped Group." The Total Mapped Group comparison focuses on a fund's standing in terms of gross management fees before expense reimbursements or caps, and without giving effect to the fund's performance adjustment, relative to the total universe of funds with comparable investment mandates, regardless of whether their management fee structures also are comparable. Funds with comparable investment mandates offer exposure to similar types of securities. Funds with comparable management fee structures have similar management fee contractual arrangements (e.g., flat rate charged for advisory services, all-inclusive fee rate, etc.). "TMG %" represents the percentage of funds in the Total Mapped Group that had management fees that were lower than the fund's. For example, a hypothetical TMG % of 20% would mean that 80% of the funds in the Total Mapped Group had higher, and 20% had lower, management fees than the fund. The fund's actual TMG %s are in the chart below. The "Asset-Size Peer Group" (ASPG) comparison focuses on a fund's standing relative to a subset of non-Fidelity funds within the Total Mapped Group that are similar in size and management fee structure. For example, if a fund is in the first quartile of the ASPG, the fund's management fee ranks in the least expensive or lowest 25% of funds in the ASPG. The ASPG represents at least 15% of the funds in the Total Mapped Group with comparable asset size and management fee structures, subject to a minimum of 50 funds (or all funds in the Total Mapped Group if fewer than 50). Additional information, such as the ASPG quartile in which the fund's management fee rate ranked and the impact of the fund's performance adjustment, is also included in the chart and considered by the Board.
Annual Report
Board Approval of Investment Advisory Contracts and
Management Fees - continued
Fidelity International Growth Fund

The Board noted that the fund's management fee rate ranked below the median of its Total Mapped Group and below the median of its ASPG for 2013. The Board also noted the effect of the fund's positive performance adjustment on the fund's management fee ranking.
Annual Report
The Board also noted that, in August 2013, the ad hoc Committee on Management Fees was formed to conduct an in-depth review of the management fee rates of Fidelity's active equity mutual funds. The Committee focused on the following areas: (i) standard fee structures; (ii) research consumption and trading evolution; (iii) management fee competitiveness/profitability by category; and (iv) factors that drive institutional pricing.
Based on its review, the Board concluded that the fund's management fee is fair and reasonable in light of the services that the fund receives and the other factors considered.
Total Expense Ratio. In its review of each class's total expense ratio, the Board considered the fund's management fee as well as other fund or class expenses, as applicable, such as transfer agent fees, pricing and bookkeeping fees, fund-paid 12b-1 fees, and custodial, legal, and audit fees. The Board also noted the effects of any waivers and reimbursements on fees and expenses, as well as the impact of the fund's performance adjustment. As part of its review, the Board also considered the current and historical total expense ratios of each class of the fund compared to competitive fund median expenses. Each class of the fund is compared to those funds and classes in the Total Mapped Group (used by the Board for management fee comparisons) that have a similar sales load structure.
The Board noted that the total expense ratio of each of Institutional Class, Class Z, and the retail class ranked below its competitive median for 2013, the total expense ratio of Class A ranked equal to its competitive median for 2013, and the total expense ratio of each of Class T, Class B, and Class C ranked above its competitive median for 2013.The Board considered that, in general, various factors can affect total expense ratios. The Board noted that the total expense ratio of Class T was above the competitive median primarily because of higher 12b-1 fees on Class T as compared to most competitor funds. Class T has a higher 12b-1 fee, but a lower front-end sales charge, than traditionally priced front-end sales charge classes. The Board considered that Class T is primarily sold load-waived in the retirement plan market where its 0.50% 12b-1 fee is comparable to competing no-load, higher 12b-1 fee classes designed specifically for retirement plans. The Board noted that the fund offers multiple classes, each of which has a different sales load and 12b-1 fee structure, and that the multiple structures are intended to offer a range of pricing options for the intermediary market. The Board also noted that the total expense ratios of the classes vary primarily by the level of their 12b-1 fees, although differences in transfer agent fees may also cause expenses to vary from class to class.
The Board further considered that FMR contractually agreed to reimburse Class A, Class T, Class B, Class C, Institutional Class, Class Z, and the retail class of the fund to the extent that total operating expenses (excluding interest, certain taxes, certain securities lending costs, brokerage commissions, extraordinary expenses, and acquired fund fees and expenses, if any), as a percentage of their respective average net assets, exceed 1.45%, 1.70%, 2.20%, 2.20%, 1.20%, 1.05%, and 1.20% through December 31, 2014.
Annual Report
Board Approval of Investment Advisory Contracts and
Management Fees - continued
Fees Charged to Other Fidelity Clients. The Board also considered Fidelity fee structures and other information with respect to clients of Fidelity, such as other funds advised or subadvised by Fidelity, pension plan clients, and other institutional clients. The Board noted the findings of the 2013 ad hoc joint committee (created with the board of other Fidelity funds), which reviewed and compared Fidelity's institutional investment advisory business with its business of providing services to the Fidelity funds, including the differences in services provided, fees charged, and costs incurred, as well as competition in their respective marketplaces.
Based on its review of total expense ratios and fees charged to other Fidelity clients, the Board concluded that the total expense ratio of each class of the fund was reasonable, although in some cases above the median of the universe presented for comparison, in light of the services that the fund and its shareholders receive and the other factors considered.
Costs of the Services and Profitability. The Board considered the revenues earned and the expenses incurred by Fidelity in conducting the business of developing, marketing, distributing, managing, administering and servicing the fund and servicing the fund's shareholders. The Board also considered the level of Fidelity's profits in respect of all the Fidelity funds.
On an annual basis, Fidelity presents to the Board Fidelity's profitability for the fund. Fidelity calculates the profitability for each fund, as well as aggregate profitability for groups of Fidelity funds and all Fidelity funds, using a series of detailed revenue and cost allocation methodologies which originate with the books and records of Fidelity on which Fidelity's audited financial statements are based. The Audit Committee of the Board reviews any significant changes from the prior year's methodologies.
PricewaterhouseCoopers LLP (PwC), independent registered public accounting firm and auditor to Fidelity and certain Fidelity funds, has been engaged annually by the Board as part of the Board's assessment of Fidelity's profitability analysis. PwC's engagement includes the review and assessment of the methodologies used by Fidelity in determining the revenues and expenses attributable to Fidelity's mutual fund business, and completion of agreed-upon procedures in respect of the mathematical accuracy of fund profitability and its conformity to established allocation methodologies. After considering PwC's reports issued under the engagement and information provided by Fidelity, the Board concluded that while other allocation methods may also be reasonable, Fidelity's profitability methodologies are reasonable in all material respects.
The Board also reviewed Fidelity's non-fund businesses and fall-out benefits related to the mutual fund business as well as cases where Fidelity's affiliates may benefit from or be related to the fund's business.
Annual Report
The Board considered the costs of the services provided by and the profits realized by Fidelity in connection with the operation of the fund and was satisfied that the profitability was not excessive in the circumstances.
Economies of Scale. The Board considered whether there have been economies of scale in respect of the management of the Fidelity funds, whether the Fidelity funds (including the fund) have appropriately benefited from any such economies of scale, and whether there is potential for realization of any further economies of scale. The Board considered the extent to which the fund will benefit from economies of scale through increased services to the fund, through waivers or reimbursements, or through fee or expense ratio reductions. The Board also noted that in 2013, it and the boards of other Fidelity funds created an ad hoc committee (the Economies of Scale Committee) to analyze whether Fidelity attains economies of scale in respect of the management and servicing of the Fidelity funds, whether the Fidelity funds have appropriately benefited from such economies of scale, and whether there is potential for realization of any further economies of scale.
The Board recognized that the fund's management contract incorporates a "group fee" structure, which provides for lower group fee rates as total group assets increase, and for higher group fee rates as total group assets decrease (with "group assets" defined to include fund assets under FMR's management plus sector fund assets previously under FMR's management and currently managed by Fidelity SelectCo, LLC). FMR calculates the group fee rates based on a tiered asset "breakpoint" schedule that varies based on asset class. The Board considered that the group fee is designed to deliver the benefits of economies of scale to fund shareholders when total Fidelity fund assets increase, even if assets of any particular fund are unchanged or have declined, because some portion of Fidelity's costs are attributable to services provided to all Fidelity funds, and all funds benefit if those costs can be allocated among more assets. The Board concluded that, given the group fee structure, fund shareholders will benefit from lower management fees as group assets increase at the fund complex level, regardless of whether Fidelity achieves any such economies of scale.
The Board concluded, taking into account the analysis of the Economies of Scale Committee, that economies of scale, if any, are being appropriately shared between fund shareholders and Fidelity.
Additional Information Requested by the Board. In order to develop fully the factual basis for consideration of the Fidelity funds' Advisory Contracts, the Board requested and received additional information on certain topics, including: (i) fund performance trends and Fidelity's long-term strategies for certain funds; (ii) Fidelity's strategic marketing and product lineup goals; (iii) the methodology with respect to competitive fund data and peer group classifications; (iv) the arrangements with, and performance of, certain sub-advisers on behalf of the Fidelity funds, as well as certain proposed participating affiliate arrangements; (v) the realization of fall-out benefits in certain Fidelity business units; (vi) Fidelity's group fee structures, including the rationale for the individual fee rates of certain categories of funds and the definition of group assets; (vii) trends regarding industry use of performance fee structures and the performance adjustment methodologies applicable to the Fidelity funds; (viii) additional competitive analysis regarding the total expenses for certain classes; (ix) fund profitability methodology, including Fidelity's cost allocation methodology, and the impact of certain factors on fund profitability results; and (x) the process by which Fidelity determines sub-advisory fees for funds it advises.
Annual Report
Board Approval of Investment Advisory Contracts and
Management Fees - continued
Based on its evaluation of all of the conclusions noted above, and after considering all factors it believed relevant, the Board ultimately concluded that the advisory fee structures are fair and reasonable, and that the fund's Advisory Contracts should be renewed.
Annual Report
Investment Adviser
Fidelity Management & Research Company
Boston, MA
Investment Sub-Advisers
FMR Co., Inc.
Fidelity Management & Research
(U.K.) Inc.
Fidelity Management & Research
(Hong Kong) Limited
Fidelity Management & Research
(Japan) Limited
FIL Investment Advisors
FIL Investments (Japan) Limited
FIL Investment Advisors (UK) Limited
General Distributor
Fidelity Distributors Corporation
Smithfield, RI
Transfer and Service Agents
Fidelity Investments Institutional Operations Company, Inc.
Boston, MA
Fidelity Service Company, Inc.
Boston, MA
Custodian
State Street Bank and Trust Company
Quincy, MA
(Fidelity Investment logo)(registered trademark)
AIGFZ-UANN-1214
1.9585036.101
Fidelity®
International Growth Fund
Annual Report
October 31, 2014
(Fidelity Cover Art)
Contents
Performance | (Click Here) | How the fund has done over time. |
Management's Discussion of Fund Performance | (Click Here) | The Portfolio Manager's review of fund performance and strategy. |
Shareholder Expense Example | (Click Here) | An example of shareholder expenses. |
Investment Changes | (Click Here) | A summary of major shifts in the fund's investments over the past six months. |
Investments | (Click Here) | A complete list of the fund's investments with their market values. |
Financial Statements | (Click Here) | Statements of assets and liabilities, operations, and changes in net assets, as well as financial highlights. |
Notes | (Click Here) | Notes to financial statements. |
Report of Independent Registered Public Accounting Firm | (Click Here) | |
Trustees and Officers | (Click Here) | |
Distributions | (Click Here) | |
Board Approval of Investment Advisory Contracts and Management Fees | (Click Here) | |
To view a fund's proxy voting guidelines and proxy voting record for the 12-month period ended June 30, visit http://www.fidelity.com/proxyvotingresults or visit the Securities and Exchange Commission's (SEC) web site at http://www.sec.gov. You may also call 1-800-544-8544 to request a free copy of the proxy voting guidelines.
Standard & Poor's, S&P and S&P 500 are registered service marks of The McGraw-Hill Companies, Inc. and have been licensed for use by Fidelity Distributors Corporation.
Other third-party marks appearing herein are the property of their respective owners.
All other marks appearing herein are registered or unregistered trademarks or service marks of FMR LLC or an affiliated company. © 2014 FMR LLC. All rights reserved.
Annual Report
This report and the financial statements contained herein are submitted for the general information of the shareholders of the fund. This report is not authorized for distribution to prospective investors in the fund unless preceded or accompanied by an effective prospectus.
A fund files its complete schedule of portfolio holdings with the SEC for the first and third quarters of each fiscal year on Form N-Q. Forms N-Q are available on the SEC's web site at http://www.sec.gov. A fund's Forms N-Q may be reviewed and copied at the SEC's Public Reference Room in Washington, DC. Information regarding the operation of the SEC's Public Reference Room may be obtained by calling 1-800-SEC-0330. For a complete list of a fund's portfolio holdings, view the most recent holdings listing, semiannual report, or annual report on Fidelity's web site at http://www.fidelity.com, http://www.advisor.fidelity.com, or http://www.401k.com, as applicable.
NOT FDIC INSURED • MAY LOSE VALUE • NO BANK GUARANTEE
Neither the fund nor Fidelity Distributors Corporation is a bank.
Annual Report
Average annual total return reflects the change in the value of an investment, assuming reinvestment of the class' distributions from dividend income and capital gains (the profits earned upon the sale of securities that have grown in value, if any) and assuming a constant rate of performance each year. The $10,000 table and the fund's returns do not reflect the deduction of taxes that a shareholder would pay on fund distributions or the redemption of fund shares. During periods of reimbursement by Fidelity, a fund's total return will be greater than it would be had the reimbursement not occurred. How a fund did yesterday is no guarantee of how it will do tomorrow.
Average Annual Total Returns
Periods ended October 31, 2014 | Past 1
year | Past 5
years | Life of
fundA |
Fidelity® International Growth Fund | 2.96% | 10.63% | 2.38% |
A From November 1, 2007.
$10,000 Over Life of Fund
Let's say hypothetically that $10,000 was invested in Fidelity® International Growth Fund, a class of the fund, on November 1, 2007, when the fund started. The chart shows how the value of your investment would have changed, and also shows how the MSCI EAFE Growth Index performed over the same period.
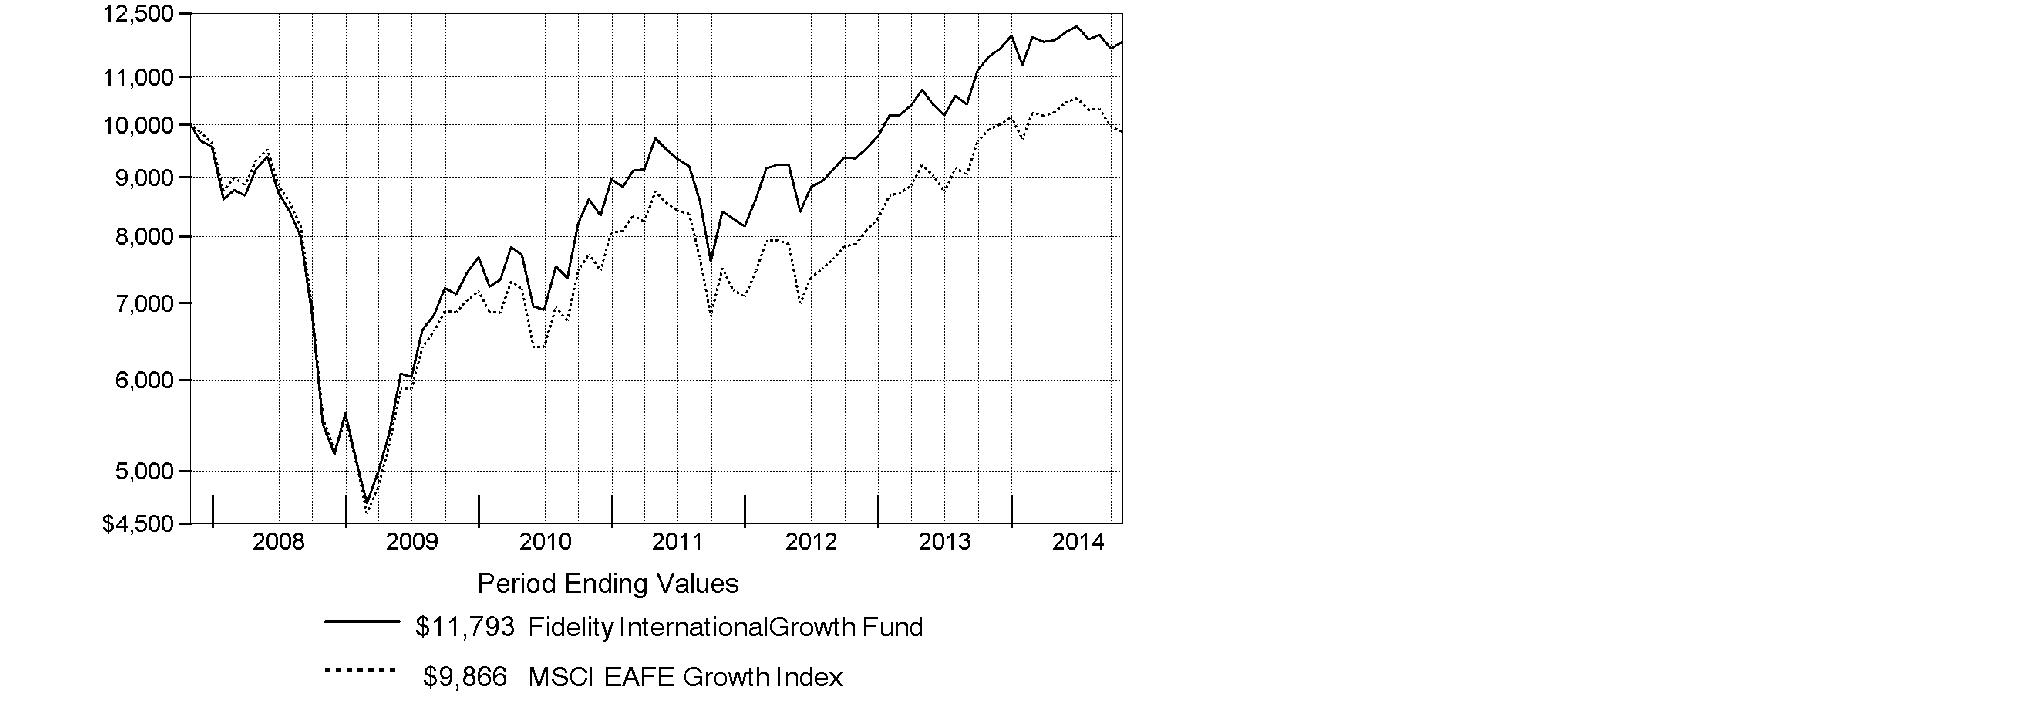
Annual Report
Market Recap: Global equities posted a healthy gain for the 12 months ending October 31, 2014, overcoming an October market decline driven by recessionary pressures in China and tepid growth in Europe. The MSCI ACWI (All Country World Index) Index rose 8.15%, helped by subdued market volatility for much of the period and supported by solid corporate earnings, especially in the United States. Stocks also benefited from easy monetary policies in Japan and the eurozone, as well as increased stimulus efforts in China. All but three of the 24 industry groups that compose the index marked a positive return. The U.S. (+17%) remained a pillar of strength, while a strongly rising dollar in the latter part of the period detracted from investors' returns in most non-U.S. markets. Canada (+5%) notched broad gains outside of its energy and materials sectors, as did Asia-Pacific ex Japan (+4%), led by investor enthusiasm for companies in India. The U.K., Europe and Japan, meanwhile, all underperformed. Among sectors, health care (+24%) led the index, with a strong contribution from the pharmaceuticals, biotechnology & life sciences industry. Information technology (+21%) also outperformed. Conversely, materials (-4%) and energy (-1%) lagged the index due to a higher supply of and lower demand for commodities.
Comments from Jed Weiss, Portfolio Manager of Fidelity® International Growth Fund: For the year ending October 31, 2014, the fund's Retail Class shares gained 2.96%, well ahead of the MSCI EAFE Growth Index, which returned -0.51%. The fund benefited from its positioning in the U.S. - where some fund holdings happen to be domiciled while doing most or all of their business abroad - and also a beneficial underweighting in Europe. My stance in Japan was a modest negative. On an individual basis, U.K.-based hotel company Intercontinental Hotels Group was the fund's top individual contributor. I continued to like this stock for its strong operations and ability to benefit from a cyclically improving hotel business, especially in the U.S. Visa and MasterCard, two U.S.-based payment-processing software companies not found in the index, also were significant contributors. One notable laggard was Andritz, an Austrian industrial engineering firm with a dominant competitive position in several industries. The value of our stake fell during the 12 months, most likely because of investors' concerns about a slowing global economy. Another disappointment was Nokian Tyres, a Finland-based tire manufacturer that encountered a difficult business environment. I ultimately sold the fund's stake in search of other opportunities.
The views expressed above reflect those of the portfolio manager(s) only through the end of the period as stated on the cover of this report and do not necessarily represent the views of Fidelity or any other person in the Fidelity organization. Any such views are subject to change at any time based upon market or other conditions and Fidelity disclaims any responsibility to update such views. These views may not be relied on as investment advice and, because investment decisions for a Fidelity fund are based on numerous factors, may not be relied on as an indication of trading intent on behalf of any Fidelity fund.
Annual Report
Shareholder Expense Example
As a shareholder of the Fund, you incur two types of costs: (1) transaction costs, including sales charges (loads) on purchase payments or redemption proceeds, redemption fees and (2) ongoing costs, including management fees, distribution and/or service (12b-1) fees and other Fund expenses. This Example is intended to help you understand your ongoing costs (in dollars) of investing in the Fund and to compare these costs with the ongoing costs of investing in other mutual funds.
The Example is based on an investment of $1,000 invested at the beginning of the period and held for the entire period (May 1, 2014 to October 31, 2014).
Actual Expenses
The first line of the accompanying table for each class of the Fund provides information about actual account values and actual expenses. You may use the information in this line, together with the amount you invested, to estimate the expenses that you paid over the period. Simply divide your account value by $1,000.00 (for example, an $8,600 account value divided by $1,000.00 = 8.6), then multiply the result by the number in the first line for a class of the Fund under the heading entitled "Expenses Paid During Period" to estimate the expenses you paid on your account during this period. A small balance maintenance fee of $12.00 that is charged once a year may apply for certain accounts with a value of less than $2,000. This fee is not included in the table below. If it was, the estimate of expenses you paid during the period would be higher, and your ending account value lower, by this amount. In addition, the Fund, as a shareholder in the underlying Fidelity Central Funds, will indirectly bear its pro-rata share of the fees and expenses incurred by the underlying Fidelity Central Funds. These fees and expenses are not included in the Fund's annualized expense ratio used to calculate the expense estimate in the table below.
Hypothetical Example for Comparison Purposes
The second line of the accompanying table for each class of the Fund provides information about hypothetical account values and hypothetical expenses based on a Class' actual expense ratio and an assumed rate of return of 5% per year before expenses, which is not the Class' actual return. The hypothetical account values and expenses may not be used to estimate the actual ending account balance or expenses you paid for the period. You may use this information to compare the ongoing costs of investing in the Fund and other funds. To do so, compare this 5% hypothetical example with the 5% hypothetical examples that appear in the shareholder reports of the other funds. A small balance maintenance fee of $12.00 that is charged once a year may apply for certain accounts with a value of less than $2,000. This fee is not included in the table below. If it was, the estimate of expenses you paid during the period would be higher, and your ending account value lower, by this amount. In addition, the Fund, as a shareholder in the underlying Fidelity Central Funds, will indirectly bear its pro-rata share of the fees and expenses incurred by the underlying Fidelity Central Funds. These fees and expenses are not included in the Fund's annualized expense ratio used to calculate the expense estimate in the table below.
Please note that the expenses shown in the table are meant to highlight your ongoing costs only and do not reflect any transaction costs. Therefore, the second line of the table is useful in comparing ongoing costs only, and will not help you determine the relative total costs of owning different funds. In addition, if these transactional costs were included, your costs would have been higher.
Annual Report
Shareholder Expense Example - continued
| Annualized
Expense RatioB | Beginning
Account Value
May 1, 2014 | Ending
Account Value
October 31, 2014 | Expenses Paid
During Period*
May 1, 2014 to
October 31, 2014 |
Class A | 1.34% | | | |
Actual | | $ 1,000.00 | $ 993.70 | $ 6.73 |
HypotheticalA | | $ 1,000.00 | $ 1,018.45 | $ 6.82 |
Class T | 1.64% | | | |
Actual | | $ 1,000.00 | $ 991.90 | $ 8.23 |
HypotheticalA | | $ 1,000.00 | $ 1,016.94 | $ 8.34 |
Class B | 2.13% | | | |
Actual | | $ 1,000.00 | $ 990.90 | $ 10.69 |
HypotheticalA | | $ 1,000.00 | $ 1,014.47 | $ 10.82 |
Class C | 2.12% | | | |
Actual | | $ 1,000.00 | $ 990.00 | $ 10.63 |
HypotheticalA | | $ 1,000.00 | $ 1,014.52 | $ 10.76 |
International Growth | 1.03% | | | |
Actual | | $ 1,000.00 | $ 995.50 | $ 5.18 |
HypotheticalA | | $ 1,000.00 | $ 1,020.01 | $ 5.24 |
Institutional Class | 1.05% | | | |
Actual | | $ 1,000.00 | $ 995.50 | $ 5.28 |
HypotheticalA | | $ 1,000.00 | $ 1,019.91 | $ 5.35 |
Class Z | .88% | | | |
Actual | | $ 1,000.00 | $ 996.40 | $ 4.43 |
HypotheticalA | | $ 1,000.00 | $ 1,020.77 | $ 4.48 |
A 5% return per year before expenses
B Annualized expense ratio reflects expenses net of applicable fee waivers.
* Expenses are equal to each Class' annualized expense ratio, multiplied by the average account value over the period, multiplied by 184/365 (to reflect the one-half year period).
Annual Report
Investment Changes (Unaudited)
Geographic Diversification (% of fund's net assets) |
As of October 31, 2014 |
 | United States of America* 18.8% | |
 | United Kingdom 15.5% | |
 | Japan 14.2% | |
 | Switzerland 12.4% | |
 | Sweden 5.6% | |
 | Germany 4.6% | |
 | Belgium 4.5% | |
 | Australia 3.5% | |
 | Denmark 2.8% | |
 | Other 18.1% | |

Percentages are based on country or territory of incorporation and are adjusted for the effect of futures contracts, if applicable. |
* Includes Short-Term Investments and Net Other Assets (Liabilities) |
As of April 30, 2014 |
| United States of America* 17.7% | |
| United Kingdom 14.4% | |
| Japan 13.9% | |
| Switzerland 13.4% | |
| Sweden 6.7% | |
| Belgium 4.7% | |
| Germany 4.2% | |
| Australia 3.0% | |
| Denmark 3.0% | |
| Other 19.0% | |

Percentages are based on country or territory of incorporation and are adjusted for the effect of futures contracts, if applicable. |
* Includes Short-Term Investments and Net Other Assets (Liabilities) |
Asset Allocation as of October 31, 2014 |
| % of fund's
net assets | % of fund's net assets
6 months ago |
Stocks | 96.7 | 96.7 |
Short-Term Investments and Net Other Assets (Liabilities) | 3.3 | 3.3 |
Top Ten Stocks as of October 31, 2014 |
| % of fund's
net assets | % of fund's net assets
6 months ago |
Roche Holding AG (participation certificate) (Switzerland, Pharmaceuticals) | 4.5 | 4.2 |
Nestle SA (Switzerland, Food Products) | 3.7 | 3.7 |
Prudential PLC (United Kingdom, Insurance) | 3.0 | 2.8 |
Anheuser-Busch InBev SA NV (Belgium, Beverages) | 3.0 | 3.2 |
DENSO Corp. (Japan, Auto Components) | 2.6 | 2.7 |
Linde AG (Germany, Chemicals) | 2.6 | 2.6 |
Keyence Corp. (Japan, Electronic Equipment & Components) | 2.3 | 1.7 |
CSL Ltd. (Australia, Biotechnology) | 2.3 | 2.0 |
Novo Nordisk A/S Series B sponsored ADR (Denmark, Pharmaceuticals) | 2.2 | 2.5 |
Reckitt Benckiser Group PLC (United Kingdom, Household Products) | 2.2 | 2.1 |
| 28.4 | |
Market Sectors as of October 31, 2014 |
| % of fund's
net assets | % of fund's net assets
6 months ago |
Health Care | 16.1 | 12.2 |
Consumer Discretionary | 15.5 | 17.2 |
Financials | 15.2 | 15.9 |
Industrials | 14.8 | 14.9 |
Consumer Staples | 14.8 | 15.7 |
Information Technology | 9.9 | 7.8 |
Materials | 7.4 | 8.3 |
Energy | 2.2 | 2.3 |
Telecommunication Services | 0.8 | 2.4 |
Annual Report
Investments October 31, 2014
Showing Percentage of Net Assets
Common Stocks - 96.7% |
| Shares | | Value |
Australia - 3.5% |
CSL Ltd. | 298,127 | | $ 21,048,639 |
Sydney Airport unit | 1,294,562 | | 5,032,913 |
Transurban Group unit | 939,495 | | 6,728,575 |
TOTAL AUSTRALIA | | 32,810,127 |
Austria - 1.0% |
Andritz AG | 190,697 | | 9,205,199 |
Bailiwick of Jersey - 1.0% |
Shire PLC | 138,400 | | 9,286,215 |
Belgium - 4.5% |
Anheuser-Busch InBev SA NV | 251,991 | | 27,944,391 |
KBC Groupe SA (a) | 265,383 | | 14,217,141 |
TOTAL BELGIUM | | 42,161,532 |
Bermuda - 0.5% |
Lazard Ltd. Class A | 99,692 | | 4,905,843 |
Canada - 0.7% |
Canadian Pacific Railway Ltd. | 33,200 | | 6,905,706 |
Cayman Islands - 2.7% |
Sands China Ltd. | 1,690,400 | | 10,543,212 |
Tencent Holdings Ltd. | 343,200 | | 5,516,004 |
Wynn Macau Ltd. | 2,474,400 | | 8,945,222 |
TOTAL CAYMAN ISLANDS | | 25,004,438 |
Denmark - 2.8% |
Jyske Bank A/S (Reg.) (a) | 101,100 | | 5,446,923 |
Novo Nordisk A/S Series B sponsored ADR | 452,400 | | 20,439,432 |
TOTAL DENMARK | | 25,886,355 |
Finland - 0.2% |
Tikkurila Oyj | 108,900 | | 2,248,993 |
France - 1.0% |
Safran SA | 152,700 | | 9,663,478 |
Germany - 4.6% |
Bayer AG | 133,500 | | 18,979,677 |
Linde AG | 129,941 | | 23,961,253 |
TOTAL GERMANY | | 42,940,930 |
India - 0.5% |
Housing Development Finance Corp. Ltd. | 235,780 | | 4,246,218 |
Common Stocks - continued |
| Shares | | Value |
Ireland - 2.3% |
CRH PLC sponsored ADR | 444,566 | | $ 9,962,724 |
James Hardie Industries PLC: | | | |
CDI | 445,857 | | 4,755,798 |
sponsored ADR | 132,300 | | 7,055,559 |
TOTAL IRELAND | | 21,774,081 |
Israel - 0.2% |
Azrieli Group | 67,500 | | 2,166,849 |
Italy - 0.6% |
Azimut Holding SpA | 111,600 | | 2,606,833 |
Interpump Group SpA | 252,351 | | 3,288,830 |
TOTAL ITALY | | 5,895,663 |
Japan - 14.2% |
Aozora Bank Ltd. | 1,240,000 | | 4,358,487 |
Astellas Pharma, Inc. | 797,900 | | 12,383,805 |
Coca-Cola Central Japan Co. Ltd. | 174,500 | | 3,139,790 |
DENSO Corp. | 533,800 | | 24,465,988 |
East Japan Railway Co. | 68,800 | | 5,373,503 |
Fanuc Corp. | 51,900 | | 9,146,637 |
Fast Retailing Co. Ltd. | 27,400 | | 10,186,156 |
Japan Tobacco, Inc. | 144,500 | | 4,930,203 |
Keyence Corp. | 43,762 | | 21,206,307 |
Mitsui Fudosan Co. Ltd. | 439,000 | | 14,121,067 |
Seven Bank Ltd. | 1,300,000 | | 5,429,321 |
SHO-BOND Holdings Co. Ltd. | 121,100 | | 4,679,336 |
USS Co. Ltd. | 566,700 | | 8,918,724 |
Yamato Kogyo Co. Ltd. | 142,400 | | 4,613,045 |
TOTAL JAPAN | | 132,952,369 |
Kenya - 0.4% |
Safaricom Ltd. | 25,598,200 | | 3,491,314 |
Korea (South) - 0.4% |
NAVER Corp. | 5,695 | | 3,996,510 |
Mexico - 0.5% |
Fomento Economico Mexicano S.A.B. de CV sponsored ADR | 44,855 | | 4,316,845 |
Netherlands - 1.6% |
ING Groep NV (Certificaten Van Aandelen) (a) | 1,049,764 | | 15,033,001 |
South Africa - 1.6% |
Clicks Group Ltd. | 649,951 | | 4,425,424 |
Common Stocks - continued |
| Shares | | Value |
South Africa - continued |
MTN Group Ltd. | 164,900 | | $ 3,647,916 |
Naspers Ltd. Class N | 52,500 | | 6,533,566 |
TOTAL SOUTH AFRICA | | 14,606,906 |
Spain - 2.0% |
Inditex SA | 570,726 | | 16,031,326 |
Prosegur Compania de Seguridad SA (Reg.) | 419,349 | | 2,459,374 |
TOTAL SPAIN | | 18,490,700 |
Sweden - 5.6% |
ASSA ABLOY AB (B Shares) | 303,961 | | 16,099,232 |
Atlas Copco AB (A Shares) | 333,509 | | 9,624,773 |
Fagerhult AB | 228,152 | | 4,202,064 |
H&M Hennes & Mauritz AB (B Shares) | 254,482 | | 10,121,864 |
Intrum Justitia AB | 88,300 | | 2,623,595 |
Svenska Handelsbanken AB (A Shares) | 210,740 | | 10,048,760 |
TOTAL SWEDEN | | 52,720,288 |
Switzerland - 12.4% |
Nestle SA | 475,669 | | 34,882,777 |
Novartis AG | 141,366 | | 13,119,171 |
Roche Holding AG (participation certificate) | 142,215 | | 41,967,880 |
Schindler Holding AG: | | | |
(participation certificate) | 50,627 | | 7,071,942 |
(Reg.) | 8,980 | | 1,215,191 |
UBS AG (NY Shares) | 1,028,161 | | 17,869,438 |
TOTAL SWITZERLAND | | 116,126,399 |
Taiwan - 0.4% |
Taiwan Semiconductor Manufacturing Co. Ltd. | 864,000 | | 3,739,490 |
Turkey - 0.5% |
Coca-Cola Icecek Sanayi A/S | 226,534 | | 5,167,378 |
United Kingdom - 15.5% |
Babcock International Group PLC | 315,784 | | 5,531,498 |
BAE Systems PLC | 677,000 | | 4,967,707 |
Berendsen PLC | 226,573 | | 3,660,733 |
BG Group PLC | 614,495 | | 10,241,193 |
GlaxoSmithKline PLC | 418,600 | | 9,466,206 |
Informa PLC | 557,755 | | 4,291,678 |
InterContinental Hotel Group PLC ADR | 407,996 | | 15,507,928 |
Johnson Matthey PLC | 182,777 | | 8,695,630 |
Prudential PLC | 1,228,409 | | 28,445,074 |
Common Stocks - continued |
| Shares | | Value |
United Kingdom - continued |
Reckitt Benckiser Group PLC | 241,345 | | $ 20,269,179 |
Rolls-Royce Group PLC | 560,137 | | 7,553,711 |
Rotork PLC | 51,700 | | 2,113,100 |
SABMiller PLC | 339,166 | | 19,125,376 |
Shaftesbury PLC | 249,233 | | 2,854,678 |
Unite Group PLC | 377,876 | | 2,581,165 |
TOTAL UNITED KINGDOM | | 145,304,856 |
United States of America - 15.5% |
Autoliv, Inc. (d) | 111,169 | | 10,198,644 |
Berkshire Hathaway, Inc. Class B (a) | 50,184 | | 7,033,789 |
BorgWarner, Inc. | 198,192 | | 11,300,908 |
Cummins, Inc. | 50,782 | | 7,423,313 |
FMC Technologies, Inc. (a) | 77,152 | | 4,323,598 |
Google, Inc.: | | | |
Class A (a) | 20,533 | | 11,660,075 |
Class C (a) | 9,003 | | 5,033,397 |
Martin Marietta Materials, Inc. | 70,300 | | 8,219,476 |
MasterCard, Inc. Class A | 172,900 | | 14,480,375 |
Mead Johnson Nutrition Co. Class A | 38,844 | | 3,857,598 |
Mohawk Industries, Inc. (a) | 54,100 | | 7,684,364 |
National Oilwell Varco, Inc. | 27,772 | | 2,017,358 |
Oceaneering International, Inc. | 54,213 | | 3,809,548 |
Philip Morris International, Inc. | 87,408 | | 7,780,186 |
PriceSmart, Inc. | 43,000 | | 3,828,290 |
ResMed, Inc. (d) | 67,200 | | 3,509,184 |
Solera Holdings, Inc. | 112,389 | | 5,838,609 |
SS&C Technologies Holdings, Inc. (a) | 124,300 | | 6,006,176 |
Union Pacific Corp. | 51,400 | | 5,985,530 |
Visa, Inc. Class A | 61,275 | | 14,793,623 |
TOTAL UNITED STATES OF AMERICA | | 144,784,041 |
TOTAL COMMON STOCKS (Cost $817,018,791) |
905,831,724
|
Nonconvertible Preferred Stocks - 0.0% |
| | | |
United Kingdom - 0.0% |
Rolls-Royce Group PLC
(Cost $80,771) | 50,412,330 | |
80,645
|
Money Market Funds - 3.9% |
| Shares | | Value |
Fidelity Cash Central Fund, 0.11% (b) | 24,195,564 | | $ 24,195,564 |
Fidelity Securities Lending Cash Central Fund, 0.11% (b)(c) | 12,132,000 | | 12,132,000 |
TOTAL MONEY MARKET FUNDS (Cost $36,327,564) |
36,327,564
|
TOTAL INVESTMENT PORTFOLIO - 100.6% (Cost $853,427,126) | 942,239,933 |
NET OTHER ASSETS (LIABILITIES) - (0.6)% | (5,448,826) |
NET ASSETS - 100% | $ 936,791,107 |
Legend |
(a) Non-income producing |
(b) Affiliated fund that is generally available only to investment companies and other accounts managed by Fidelity Investments. The rate quoted is the annualized seven-day yield of the fund at period end. A complete unaudited listing of the fund's holdings as of its most recent quarter end is available upon request. In addition, each Fidelity Central Fund's financial statements, which are not covered by the Fund's Report of Independent Registered Public Accounting Firm, are available on the SEC's website or upon request. |
(c) Investment made with cash collateral received from securities on loan. |
(d) Security or a portion of the security is on loan at period end. |
Affiliated Central Funds |
Information regarding fiscal year to date income earned by the Fund from investments in Fidelity Central Funds is as follows: |
Fund | Income earned |
Fidelity Cash Central Fund | $ 22,126 |
Fidelity Securities Lending Cash Central Fund | 325,646 |
Total | $ 347,772 |
Other Information |
Categorizations in the Schedule of Investments are based on country or territory of incorporation. |
The following is a summary of the inputs used, as of October 31, 2014, involving the Fund's assets and liabilities carried at fair value. The inputs or methodology used for valuing securities may not be an indication of the risk associated with investing in those securities. For more information on valuation inputs, and their aggregation into the levels used in the table below, please refer to the Investment Valuation section in the accompanying Notes to Financial Statements. |
Valuation Inputs at Reporting Date: |
Description | Total | Level 1 | Level 2 | Level 3 |
Investments in Securities: | | | | |
Equities: | | | | |
Consumer Discretionary | $ 144,729,580 | $ 81,670,278 | $ 63,059,302 | $ - |
Consumer Staples | 139,667,437 | 68,770,276 | 70,897,161 | - |
Energy | 20,391,697 | 10,150,504 | 10,241,193 | - |
Financials | 141,364,587 | 69,731,419 | 71,633,168 | - |
Health Care | 150,200,209 | 42,928,293 | 107,271,916 | - |
Industrials | 140,636,585 | 109,675,621 | 30,960,964 | - |
Information Technology | 92,270,566 | 61,808,765 | 30,461,801 | - |
Materials | 69,512,478 | 60,143,635 | 9,368,843 | - |
Telecommunication Services | 7,139,230 | 7,139,230 | - | - |
Money Market Funds | 36,327,564 | 36,327,564 | - | - |
Total Investments in Securities: | $ 942,239,933 | $ 548,345,585 | $ 393,894,348 | $ - |
The following is a summary of transfers between Level 1 and Level 2 for the period ended October 31, 2014. Transfers are assumed to have occurred at the beginning of the period, and are primarily attributable to the valuation techniques used for foreign equity securities, as discussed in the accompanying Notes to Financial Statements: |
Transfers | Total |
Level 1 to Level 2 | $ 60,817,931 |
Level 2 to Level 1 | $ 0 |
See accompanying notes which are an integral part of the financial statements.
Annual Report
Statement of Assets and Liabilities
| October 31, 2014 |
| | |
Assets | | |
Investment in securities, at value (including securities loaned of $12,004,474) - See accompanying schedule: Unaffiliated issuers (cost $817,099,562) | $ 905,912,369 | |
Fidelity Central Funds (cost $36,327,564) | 36,327,564 | |
Total Investments (cost $853,427,126) | | $ 942,239,933 |
Foreign currency held at value (cost $43) | | 42 |
Receivable for investments sold | | 4,073,580 |
Receivable for fund shares sold | | 4,531,915 |
Dividends receivable | | 1,723,029 |
Distributions receivable from Fidelity Central Funds | | 6,903 |
Prepaid expenses | | 3,337 |
Other receivables | | 2,775 |
Total assets | | 952,581,514 |
| | |
Liabilities | | |
Payable for investments purchased | $ 1,884,552 | |
Payable for fund shares redeemed | 842,608 | |
Accrued management fee | 580,330 | |
Distribution and service plan fees payable | 60,982 | |
Other affiliated payables | 191,189 | |
Other payables and accrued expenses | 98,746 | |
Collateral on securities loaned, at value | 12,132,000 | |
Total liabilities | | 15,790,407 |
| | |
Net Assets | | $ 936,791,107 |
Net Assets consist of: | | |
Paid in capital | | $ 850,335,068 |
Undistributed net investment income | | 6,829,762 |
Accumulated undistributed net realized gain (loss) on investments and foreign currency transactions | | (9,108,156) |
Net unrealized appreciation (depreciation) on investments and assets and liabilities in foreign currencies | | 88,734,433 |
Net Assets | | $ 936,791,107 |
See accompanying notes which are an integral part of the financial statements.
Annual Report
Statement of Assets and Liabilities - continued
| October 31, 2014 |
| | |
Calculation of Maximum Offering Price
Class A:
Net Asset Value and redemption price per share
($119,017,195 ÷ 10,806,546 shares) | | $ 11.01 |
| | |
Maximum offering price per share (100/94.25 of $11.01) | | $ 11.68 |
Class T:
Net Asset Value and redemption price per share ($26,368,504 ÷ 2,404,861 shares) | | $ 10.96 |
| | |
Maximum offering price per share (100/96.50 of $10.96) | | $ 11.36 |
Class B:
Net Asset Value and offering price per share ($1,404,031 ÷ 128,735 shares)A | | $ 10.91 |
| | |
Class C:
Net Asset Value and offering price per share ($32,737,168 ÷ 3,011,271 shares)A | | $ 10.87 |
| | |
International Growth:
Net Asset Value, offering price and redemption price per share ($635,606,779 ÷ 57,274,082 shares) | | $ 11.10 |
| | |
Institutional Class:
Net Asset Value, offering price and redemption price per share ($121,553,795 ÷ 10,967,024 shares) | | $ 11.08 |
| | |
Class Z:
Net Asset Value, offering price and redemption price per share ($103,635 ÷ 9,336 shares) | | $ 11.10 |
A Redemption price per share is equal to net asset value less any applicable contingent deferred sales charge.
See accompanying notes which are an integral part of the financial statements.
Annual Report
Financial Statements - continued
Statement of Operations
| Year ended October 31, 2014 |
| | |
Investment Income | | |
Dividends | | $ 17,871,194 |
Income from Fidelity Central Funds | | 347,772 |
Income before foreign taxes withheld | | 18,218,966 |
Less foreign taxes withheld | | (1,316,845) |
Total income | | 16,902,121 |
| | |
Expenses | | |
Management fee
Basic fee | $ 5,413,678 | |
Performance adjustment | 364,493 | |
Transfer agent fees | 1,687,661 | |
Distribution and service plan fees | 677,617 | |
Accounting and security lending fees | 377,289 | |
Custodian fees and expenses | 106,805 | |
Independent trustees' compensation | 3,045 | |
Registration fees | 139,931 | |
Audit | 71,897 | |
Legal | 2,124 | |
Miscellaneous | 3,622 | |
Total expenses before reductions | 8,848,162 | |
Expense reductions | (10,690) | 8,837,472 |
Net investment income (loss) | | 8,064,649 |
Realized and Unrealized Gain (Loss) Net realized gain (loss) on: | | |
Investment securities: | | |
Unaffiliated issuers | (8,867,777) | |
Foreign currency transactions | (61,847) | |
Total net realized gain (loss) | | (8,929,624) |
Change in net unrealized appreciation (depreciation) on: Investment securities (net of increase in deferred foreign taxes of $11,698) | 17,936,446 | |
Assets and liabilities in foreign currencies | (63,604) | |
Total change in net unrealized appreciation (depreciation) | | 17,872,842 |
Net gain (loss) | | 8,943,218 |
Net increase (decrease) in net assets resulting from operations | | $ 17,007,867 |
See accompanying notes which are an integral part of the financial statements.
Annual Report
Statement of Changes in Net Assets
| Year ended
October 31,
2014 | Year ended
October 31,
2013 |
Increase (Decrease) in Net Assets | | |
Operations | | |
Net investment income (loss) | $ 8,064,649 | $ 3,493,326 |
Net realized gain (loss) | (8,929,624) | 6,317,113 |
Change in net unrealized appreciation (depreciation) | 17,872,842 | 60,869,889 |
Net increase (decrease) in net assets resulting
from operations | 17,007,867 | 70,680,328 |
Distributions to shareholders from net investment income | (2,592,643) | (2,081,336) |
Distributions to shareholders from net realized gain | (513,441) | (113,769) |
Total distributions | (3,106,084) | (2,195,105) |
Share transactions - net increase (decrease) | 336,569,228 | 324,915,158 |
Redemption fees | 42,228 | 31,216 |
Total increase (decrease) in net assets | 350,513,239 | 393,431,597 |
| | |
Net Assets | | |
Beginning of period | 586,277,868 | 192,846,271 |
End of period (including undistributed net investment income of $6,829,762 and undistributed net investment income of $2,476,993, respectively) | $ 936,791,107 | $ 586,277,868 |
See accompanying notes which are an integral part of the financial statements.
Annual Report
Financial Highlights - Class A
Years ended October 31, | 2014 | 2013 | 2012 | 2011 | 2010 |
Selected Per-Share Data | | | | | |
Net asset value, beginning of period | $ 10.78 | $ 8.91 | $ 8.09 | $ 8.38 | $ 7.01 |
Income from Investment Operations | | | | | |
Net investment income (loss) C | .09 | .08 | .08 | .08 | .05 |
Net realized and unrealized gain (loss) | .18 | 1.88 | .81 | (.31) | 1.39 |
Total from investment operations | .27 | 1.96 | .89 | (.23) | 1.44 |
Distributions from net investment income | (.03) | (.08) | (.06) | (.05) | (.05) |
Distributions from net realized gain | (.01) | (.01) | (.01) | (.01) | (.03) |
Total distributions | (.04) | (.09) | (.07) | (.06) | (.07) H |
Redemption fees added to paid in capital C, G | - | - | - | - | - |
Net asset value, end of period | $ 11.01 | $ 10.78 | $ 8.91 | $ 8.09 | $ 8.38 |
Total ReturnA, B | 2.54% | 22.18% | 11.10% | (2.76)% | 20.68% |
Ratios to Average Net Assets D, F | | | | | |
Expenses before reductions | 1.35% | 1.44% | 1.58% | 1.77% | 2.13% |
Expenses net of fee waivers, if any | 1.35% | 1.43% | 1.45% | 1.45% | 1.50% |
Expenses net of all reductions | 1.34% | 1.42% | 1.44% | 1.43% | 1.48% |
Net investment income (loss) | .84% | .80% | .99% | .92% | .74% |
Supplemental Data | | | | | |
Net assets, end of period (000 omitted) | $ 119,017 | $ 74,595 | $ 21,874 | $ 6,352 | $ 3,084 |
Portfolio turnover rateE | 27% | 32% | 32% | 68% | 87% |
A Total returns would have been lower if certain expenses had not been reduced during the applicable periods shown.
B Total returns do not include the effect of the sales charges.
C Calculated based on average shares outstanding during the period.
D Fees and expenses of any underlying Fidelity Central Funds are not included in the Fund's expense ratio. The Fund indirectly bears its proportionate share of the expenses of any underlying Fidelity Central Funds.
E Amount does not include the portfolio activity of any underlying Fidelity Central Funds.
F Expense ratios reflect operating expenses of the class. Expenses before reductions do not reflect amounts reimbursed by the investment adviser or reductions from brokerage service arrangements or reductions from other expense offset arrangements and do not represent the amount paid by the class during periods when reimbursements or reductions occur. Expenses net of fee waivers reflect expenses after reimbursement by the investment adviser but prior to reductions from brokerage service arrangements or other expense offset arrangements. Expenses net of all reductions represent the net expenses paid by the class.
G Amount represents less than $.01 per share.
H Total distributions of $.07 per share is comprised of distributions from net investment income of $.046 and distributions from net realized gain of $.025 per share.
See accompanying notes which are an integral part of the financial statements.
Annual Report
Financial Highlights - Class T
Years ended October 31, | 2014 | 2013 | 2012 | 2011 | 2010 |
Selected Per-Share Data | | | | | |
Net asset value, beginning of period | $ 10.75 | $ 8.89 | $ 8.08 | $ 8.38 | $ 7.00 |
Income from Investment Operations | | | | | |
Net investment income (loss) C | .06 | .05 | .06 | .06 | .04 |
Net realized and unrealized gain (loss) | .18 | 1.88 | .81 | (.31) | 1.39 |
Total from investment operations | .24 | 1.93 | .87 | (.25) | 1.43 |
Distributions from net investment income | (.02) | (.07) | (.05) | (.04) | (.02) |
Distributions from net realized gain | (.01) | (.01) | (.01) | (.01) | (.03) |
Total distributions | (.03) | (.07) H | (.06) | (.05) | (.05) |
Redemption fees added to paid in capital C, G | - | - | - | - | - |
Net asset value, end of period | $ 10.96 | $ 10.75 | $ 8.89 | $ 8.08 | $ 8.38 |
Total ReturnA, B | 2.21% | 21.91% | 10.82% | (3.03)% | 20.47% |
Ratios to Average Net Assets D, F | | | | | |
Expenses before reductions | 1.65% | 1.69% | 1.85% | 2.03% | 2.41% |
Expenses net of fee waivers, if any | 1.65% | 1.69% | 1.70% | 1.70% | 1.75% |
Expenses net of all reductions | 1.65% | 1.68% | 1.69% | 1.68% | 1.73% |
Net investment income (loss) | .53% | .54% | .74% | .67% | .49% |
Supplemental Data | | | | | |
Net assets, end of period (000 omitted) | $ 26,369 | $ 23,118 | $ 10,690 | $ 2,917 | $ 1,034 |
Portfolio turnover rateE | 27% | 32% | 32% | 68% | 87% |
A Total returns would have been lower if certain expenses had not been reduced during the applicable periods shown.
B Total returns do not include the effect of the sales charges.
C Calculated based on average shares outstanding during the period.
D Fees and expenses of any underlying Fidelity Central Funds are not included in the Fund's expense ratio. The Fund indirectly bears its proportionate share of the expenses of any underlying Fidelity Central Funds.
E Amount does not include the portfolio activity of any underlying Fidelity Central Funds.
F Expense ratios reflect operating expenses of the class. Expenses before reductions do not reflect amounts reimbursed by the investment adviser or reductions from brokerage service arrangements or reductions from other expense offset arrangements and do not represent the amount paid by the class during periods when reimbursements or reductions occur. Expenses net of fee waivers reflect expenses after reimbursement by the investment adviser but prior to reductions from brokerage service arrangements or other expense offset arrangements. Expenses net of all reductions represent the net expenses paid by the class.
G Amount represents less than $.01 per share.
H Total distributions of $.07 per share is comprised of distributions from net investment income of $.069 and distributions from net realized gain of $.005 per share.
See accompanying notes which are an integral part of the financial statements.
Annual Report
Financial Highlights - Class B
Years ended October 31, | 2014 | 2013 | 2012 | 2011 | 2010 |
Selected Per-Share Data | | | | | |
Net asset value, beginning of period | $ 10.73 | $ 8.88 | $ 8.06 | $ 8.36 | $ 6.98 |
Income from Investment Operations | | | | | |
Net investment income (loss) C | - G | - G | .02 | .01 | - G |
Net realized and unrealized gain (loss) | .19 | 1.89 | .80 | (.30) | 1.38 |
Total from investment operations | .19 | 1.89 | .82 | (.29) | 1.38 |
Distributions from net investment income | - | (.03) | - | (.01) | - |
Distributions from net realized gain | (.01) | (.01) | - | - G | - |
Total distributions | (.01) | (.04) | - | (.01) | - |
Redemption fees added to paid in capital C, G | - | - | - | - | - |
Net asset value, end of period | $ 10.91 | $ 10.73 | $ 8.88 | $ 8.06 | $ 8.36 |
Total ReturnA, B | 1.76% | 21.35% | 10.17% | (3.47)% | 19.77% |
Ratios to Average Net Assets D, F | | | | | |
Expenses before reductions | 2.14% | 2.19% | 2.35% | 2.55% | 2.87% |
Expenses net of fee waivers, if any | 2.14% | 2.18% | 2.20% | 2.20% | 2.25% |
Expenses net of all reductions | 2.14% | 2.17% | 2.19% | 2.18% | 2.23% |
Net investment income (loss) | .04% | .05% | .24% | .17% | (.01)% |
Supplemental Data | | | | | |
Net assets, end of period (000 omitted) | $ 1,404 | $ 1,579 | $ 1,116 | $ 473 | $ 581 |
Portfolio turnover rateE | 27% | 32% | 32% | 68% | 87% |
A Total returns would have been lower if certain expenses had not been reduced during the applicable periods shown.
B Total returns do not include the effect of the contingent deferred sales charge.
C Calculated based on average shares outstanding during the period.
D Fees and expenses of any underlying Fidelity Central Funds are not included in the Fund's expense ratio. The Fund indirectly bears its proportionate share of the expenses of any underlying Fidelity Central Funds.
E Amount does not include the portfolio activity of any underlying Fidelity Central Funds.
F Expense ratios reflect operating expenses of the class. Expenses before reductions do not reflect amounts reimbursed by the investment adviser or reductions from brokerage service arrangements or reductions from other expense offset arrangements and do not represent the amount paid by the class during periods when reimbursements or reductions occur. Expenses net of fee waivers reflect expenses after reimbursement by the investment adviser but prior to reductions from brokerage service arrangements or other expense offset arrangements. Expenses net of all reductions represent the net expenses paid by the class.
G Amount represents less than $.01 per share.
See accompanying notes which are an integral part of the financial statements.
Annual Report
Financial Highlights - Class C
Years ended October 31, | 2014 | 2013 | 2012 | 2011 | 2010 |
Selected Per-Share Data | | | | | |
Net asset value, beginning of period | $ 10.69 | $ 8.84 | $ 8.03 | $ 8.34 | $ 6.98 |
Income from Investment Operations | | | | | |
Net investment income (loss) C | .01 | .01 | .02 | .01 | -G |
Net realized and unrealized gain (loss) | .18 | 1.87 | .80 | (.31) | 1.38 |
Total from investment operations | .19 | 1.88 | .82 | (.30) | 1.38 |
Distributions from net investment income | - | (.02) | (.01) | (.01) | - |
Distributions from net realized gain | (.01) | (.01) | (.01) | (.01) | (.02) |
Total distributions | (.01) | (.03) | (.01)I | (.01)H | (.02) |
Redemption fees added to paid in capital C, G | - | - | - | - | - |
Net asset value, end of period | $ 10.87 | $ 10.69 | $ 8.84 | $ 8.03 | $ 8.34 |
Total ReturnA, B | 1.77% | 21.29% | 10.27% | (3.57)% | 19.82% |
Ratios to Average Net Assets D, F | | | | | |
Expenses before reductions | 2.12% | 2.19% | 2.33% | 2.52% | 2.89% |
Expenses net of fee waivers, if any | 2.12% | 2.18% | 2.20% | 2.20% | 2.25% |
Expenses net of all reductions | 2.12% | 2.17% | 2.19% | 2.18% | 2.24% |
Net investment income (loss) | .06% | .05% | .24% | .17% | (.01)% |
Supplemental Data | | | | | |
Net assets, end of period (000 omitted) | $ 32,737 | $ 17,196 | $ 5,648 | $ 2,767 | $ 1,261 |
Portfolio turnover rateE | 27% | 32% | 32% | 68% | 87% |
A Total returns would have been lower if certain expenses had not been reduced during the applicable periods shown.
B Total returns do not include the effect of the contingent deferred sales charge.
C Calculated based on average shares outstanding during the period.
D Fees and expenses of any underlying Fidelity Central Funds are not included in the Fund's expense ratio. The Fund indirectly bears its proportionate share of the expenses of any underlying Fidelity Central Funds.
E Amount does not include the portfolio activity of any underlying Fidelity Central Funds.
F Expense ratios reflect operating expenses of the class. Expenses before reductions do not reflect amounts reimbursed by the investment adviser or reductions from brokerage service arrangements or reductions from other expense offset arrangements and do not represent the amount paid by the class during periods when reimbursements or reductions occur. Expenses net of fee waivers reflect expenses after reimbursement by the investment adviser but prior to reductions from brokerage service arrangements or other expense offset arrangements. Expenses net of all reductions represent the net expenses paid by the class.
G Amount represents less than $.01 per share.
H Total distributions of $.01 per share is comprised of distributions from net investment income of $.008 and distributions from net realized gain of $.005 per share.
I Total distributions of $.01 per share is comprised of distributions from net investment income of $.007 and distributions from net realized gain of $.006 per share.
See accompanying notes which are an integral part of the financial statements.
Annual Report
Financial Highlights - International Growth
Years ended October 31, | 2014 | 2013 | 2012 | 2011 | 2010 |
Selected Per-Share Data | | | | | |
Net asset value, beginning of period | $ 10.84 | $ 8.95 | $ 8.12 | $ 8.40 | $ 7.02 |
Income from Investment Operations | | | | | |
Net investment income (loss) B | .13 | .11 | .11 | .10 | .07 |
Net realized and unrealized gain (loss) | .19 | 1.88 | .81 | (.30) | 1.39 |
Total from investment operations | .32 | 1.99 | .92 | (.20) | 1.46 |
Distributions from net investment income | (.05) | (.10) | (.08) | (.07) | (.06) |
Distributions from net realized gain | (.01) | (.01) | (.01) | (.01) | (.03) |
Total distributions | (.06) | (.10)H | (.09) | (.08) | (.08)G |
Redemption fees added to paid in capital B,F | - | - | - | - | - |
Net asset value, end of period | $ 11.10 | $ 10.84 | $ 8.95 | $ 8.12 | $ 8.40 |
Total ReturnA | 2.96% | 22.48% | 11.41% | (2.47)% | 20.97% |
Ratios to Average Net Assets C, E | | | | | |
Expenses before reductions | 1.04% | 1.13% | 1.28% | 1.52% | 1.89% |
Expenses net of fee waivers, if any | 1.04% | 1.13% | 1.20% | 1.20% | 1.25% |
Expenses net of all reductions | 1.04% | 1.11% | 1.19% | 1.18% | 1.23% |
Net investment income (loss) | 1.14% | 1.11% | 1.24% | 1.17% | .99% |
Supplemental Data | | | | | |
Net assets, end of period (000 omitted) | $ 635,607 | $ 430,914 | $ 149,526 | $ 53,437 | $ 28,454 |
Portfolio turnover rateD | 27% | 32% | 32% | 68% | 87% |
A Total returns would have been lower if certain expenses had not been reduced during the applicable periods shown.
B Calculated based on average shares outstanding during the period.
C Fees and expenses of any underlying Fidelity Central Funds are not included in the Fund's expense ratio. The Fund indirectly bears its proportionate share of the expenses of any underlying Fidelity Central Funds.
D Amount does not include the portfolio activity of any underlying Fidelity Central Funds.
E Expense ratios reflect operating expenses of the class. Expenses before reductions do not reflect amounts reimbursed by the investment adviser or reductions from brokerage service arrangements or reductions from other expense offset arrangements and do not represent the amount paid by the class during periods when reimbursements or reductions occur. Expenses net of fee waivers reflect expenses after reimbursement by the investment adviser but prior to reductions from brokerage service arrangements or other expense offset arrangements. Expenses net of all reductions represent the net expenses paid by the class.
F Amount represents less than $.01 per share.
G Total distributions of $.08 per share is comprised of distributions from net investment income of $.057 and distributions from net realized gain of $.025 per share.
H Total distributions of $.10 per share is comprised of distributions from net investment income of $.097 and distributions from net realized gain of $.005 per share.
See accompanying notes which are an integral part of the financial statements.
Annual Report
Financial Highlights - Institutional Class
Years ended October 31, | 2014 | 2013 | 2012 | 2011 | 2010 |
Selected Per-Share Data | | | | | |
Net asset value, beginning of period | $ 10.84 | $ 8.94 | $ 8.12 | $ 8.40 | $ 7.02 |
Income from Investment Operations | | | | | |
Net investment income (loss) B | .13 | .11 | .10 | .10 | .07 |
Net realized and unrealized gain (loss) | .18 | 1.90 | .81 | (.30) | 1.39 |
Total from investment operations | .31 | 2.01 | .91 | (.20) | 1.46 |
Distributions from net investment income | (.06) | (.10) | (.08) | (.07) | (.06) |
Distributions from net realized gain | (.01) | (.01) | (.01) | (.01) | (.03) |
Total distributions | (.07) | (.11) | (.09) | (.08) | (.08)G |
Redemption fees added to paid in capital B,F | - | - | - | - | - |
Net asset value, end of period | $ 11.08 | $ 10.84 | $ 8.94 | $ 8.12 | $ 8.40 |
Total ReturnA | 2.84% | 22.66% | 11.28% | (2.47)% | 20.97% |
Ratios to Average Net Assets C, E | | | | | |
Expenses before reductions | 1.04% | 1.11% | 1.27% | 1.50% | 1.92% |
Expenses net of fee waivers, if any | 1.04% | 1.11% | 1.20% | 1.20% | 1.25% |
Expenses net of all reductions | 1.04% | 1.09% | 1.19% | 1.18% | 1.23% |
Net investment income (loss) | 1.14% | 1.13% | 1.24% | 1.17% | .99% |
Supplemental Data | | | | | |
Net assets, end of period (000 omitted) | $ 121,554 | $ 38,771 | $ 3,992 | $ 493 | $ 113 |
Portfolio turnover rateD | 27% | 32% | 32% | 68% | 87% |
A Total returns would have been lower if certain expenses had not been reduced during the applicable periods shown.
B Calculated based on average shares outstanding during the period.
C Fees and expenses of any underlying Fidelity Central Funds are not included in the Fund's expense ratio. The Fund indirectly bears its proportionate share of the expenses of any underlying Fidelity Central Funds.
D Amount does not include the portfolio activity of any underlying Fidelity Central Funds.
E Expense ratios reflect operating expenses of the class. Expenses before reductions do not reflect amounts reimbursed by the investment adviser or reductions from brokerage service arrangements or reductions from other expense offset arrangements and do not represent the amount paid by the class during periods when reimbursements or reductions occur. Expenses net of fee waivers reflect expenses after reimbursement by the investment adviser but prior to reductions from brokerage service arrangements or other expense offset arrangements. Expenses net of all reductions represent the net expenses paid by the class.
F Amount represents less than $.01 per share.
G Total distributions of $.08 per share is comprised of distributions from net investment income of $.057 and distributions from net realized gain of $.025 per share.
See accompanying notes which are an integral part of the financial statements.
Annual Report
Financial Highlights - Class Z
Years ended October 31, | 2014 | 2013 G |
Selected Per-Share Data | | |
Net asset value, beginning of period | $ 10.84 | $ 10.26 |
Income from Investment Operations | | |
Net investment income (loss) D | .14 | .02 |
Net realized and unrealized gain (loss) | .19 | .56 |
Total from investment operations | .33 | .58 |
Distributions from net investment income | (.06) | - |
Distributions from net realized gain | (.01) | - |
Total distributions | (.07) | - |
Redemption fees added to paid in capital D,I | - | - |
Net asset value, end of period | $ 11.10 | $ 10.84 |
Total ReturnB, C | 3.07% | 5.65% |
Ratios to Average Net Assets E, H | | |
Expenses before reductions | .88% | .94%A |
Expenses net of fee waivers, if any | .88% | .94%A |
Expenses net of all reductions | .88% | .93%A |
Net investment income (loss) | 1.30% | .65%A |
Supplemental Data | | |
Net assets, end of period (000 omitted) | $ 104 | $ 106 |
Portfolio turnover rateF | 27% | 32% |
A Annualized
B Total returns for periods of less than one year are not annualized.
C Total returns would have been lower if certain expenses had not been reduced during the applicable periods shown.
D Calculated based on average shares outstanding during the period.
E Fees and expenses of any underlying Fidelity Central Funds are not included in the Fund's expense ratio. The Fund indirectly bears its proportionate share of the expenses of any underlying Fidelity Central Funds.
F Amount does not include the portfolio activity of any underlying Fidelity Central Funds.
G For the period August 13, 2013 (commencement of sale of shares) to October 31, 2013.
H Expense ratios reflect operating expenses of the class. Expenses before reductions do not reflect amounts reimbursed by the investment adviser or reductions from brokerage service arrangements or reductions from other expense offset arrangements and do not represent the amount paid by the class during periods when reimbursements or reductions occur. Expense ratios before reductions for start-up periods may not be representative of longer-term operating periods. Expenses net of fee waivers reflect expenses after reimbursement by the investment adviser but prior to reductions from brokerage service arrangements or other expense offset arrangements. Expenses net of all reductions represent the net expenses paid by the class.
I Amount represents less than $.01 per share.
See accompanying notes which are an integral part of the financial statements.
Annual Report
Notes to Financial Statements
For the period ended October 31, 2014
1. Organization.
Fidelity International Growth Fund (the Fund) is a fund of Fidelity Investment Trust (the Trust) and is authorized to issue an unlimited number of shares. The Trust is registered under the Investment Company Act of 1940, as amended (the 1940 Act), as an open-end management investment company organized as a Massachusetts business trust. The Fund offers Class A, Class T, Class C, International Growth, Institutional Class and Class Z shares, each of which, along with Class B shares, has equal rights as to assets and voting privileges. Class B shares are closed to new accounts and additional purchases, except for exchanges and reinvestments. Each class has exclusive voting rights with respect to matters that affect that class. Class B shares will automatically convert to Class A shares after a holding period of seven years from the initial date of purchase.
2. Investments in Fidelity Central Funds.
The Fund invests in Fidelity Central Funds, which are open-end investment companies generally available only to other investment companies and accounts managed by the investment adviser and its affiliates. The Fund's Schedule of Investments lists each of the Fidelity Central Funds held as of period end, if any, as an investment of the Fund, but does not include the underlying holdings of each Fidelity Central Fund. As an Investing Fund, the Fund indirectly bears its proportionate share of the expenses of the underlying Fidelity Central Funds.
The Money Market Central Funds seek preservation of capital and current income and are managed by Fidelity Investments Money Management, Inc. (FIMM), an affiliate of the investment adviser. Annualized expenses of the Money Market Central Funds as of their most recent shareholder report date are less than .01%.
A complete unaudited list of holdings for each Fidelity Central Fund is available upon request or at the Securities and Exchange Commission (the SEC) website at www.sec.gov. In addition, the financial statements of the Fidelity Central Funds, which are not covered by the Fund's Report of Independent Registered Public Accounting Firm, are available on the SEC website or upon request.
3. Significant Accounting Policies.
The financial statements have been prepared in conformity with accounting principles generally accepted in the United States of America (GAAP), which require management to make certain estimates and assumptions at the date of the financial statements. Actual results could differ from those estimates. Subsequent events, if any, through the date that the financial statements were issued have been evaluated in the preparation of the financial statements. The following summarizes the significant accounting policies of the Fund:
Annual Report
3. Significant Accounting Policies - continued
Investment Valuation. Investments are valued as of 4:00 p.m. Eastern time on the last calendar day of the period. In accordance with valuation policies and procedures approved by the Board of Trustees (the Board), the Fund attempts to obtain prices from one or more third party pricing vendors or brokers to value its investments. When current market prices, quotations or currency exchange rates are not readily available or reliable, investments will be fair valued in good faith by the Fidelity Management & Research Company (FMR) Fair Value Committee (the Committee), in accordance with procedures adopted by the Board. Factors used in determining fair value vary by investment type and may include market or investment specific events. The frequency with which these procedures are used cannot be predicted and they may be utilized to a significant extent. The Committee oversees the Fund's valuation policies and procedures and is responsible for approving and reporting to the Board all fair value determinations.
The Fund categorizes the inputs to valuation techniques used to value its investments into a disclosure hierarchy consisting of three levels as shown below:
Level 1 - quoted prices in active markets for identical investments
Level 2 - other significant observable inputs (including quoted prices for similar investments, interest rates, prepayment speeds, etc.)
Level 3 - unobservable inputs (including the Fund's own assumptions based on the best information available)
Valuation techniques used to value the Fund's investments by major category are as follows:
Equity securities, including restricted securities, for which market quotations are readily available, are valued at the last reported sale price or official closing price as reported by a third party pricing vendor on the primary market or exchange on which they are traded and are categorized as Level 1 in the hierarchy. In the event there were no sales during the day or closing prices are not available, securities are valued at the last quoted bid price or may be valued using the last available price and are generally categorized as Level 2 in the hierarchy. For foreign equity securities, when market or security specific events arise, comparisons to the valuation of American Depositary Receipts (ADRs), futures contracts, Exchange-Traded Funds (ETFs) and certain indexes as well as quoted prices for similar securities may be used and would be categorized as Level 2 in the hierarchy. Utilizing these techniques may result in transfers between Level 1 and Level 2. For equity securities, including restricted securities, where observable inputs are limited, assumptions about market activity and risk are used and these securities may be categorized as Level 3 in the hierarchy.
Annual Report
Notes to Financial Statements - continued
3. Significant Accounting Policies - continued
Investment Valuation - continued
Investments in open-end mutual funds, including the Fidelity Central Funds, are valued at their closing net asset value (NAV) each business day and are categorized as Level 1 in the hierarchy.
Changes in valuation techniques may result in transfers in or out of an assigned level within the disclosure hierarchy. The aggregate value of investments by input level, as of October 31, 2014, including information on transfers between Levels 1 and 2, is included at the end of the Fund's Schedule of Investments.
Foreign Currency. The Fund may use foreign currency contracts to facilitate transactions in foreign-denominated securities. Gains and losses from these transactions may arise from changes in the value of the foreign currency or if the counterparties do not perform under the contracts' terms.
Foreign-denominated assets, including investment securities, and liabilities are translated into U.S. dollars at the exchange rates at period end. Purchases and sales of investment securities, income and dividends received and expenses denominated in foreign currencies are translated into U.S. dollars at the exchange rate in effect on the transaction date.
The effects of exchange rate fluctuations on investments are included with the net realized and unrealized gain (loss) on investment securities. Other foreign currency transactions resulting in realized and unrealized gain (loss) are disclosed separately.
Investment Transactions and Income. For financial reporting purposes, the Fund's investment holdings and NAV include trades executed through the end of the last business day of the period. The NAV per share for processing shareholder transactions is calculated as of the close of business of the New York Stock Exchange (NYSE), normally 4:00 p.m. Eastern time and includes trades executed through the end of the prior business day. Gains and losses on securities sold are determined on the basis of identified cost and may include proceeds received from litigation. Dividend income is recorded on the ex-dividend date, except for certain dividends from foreign securities where the ex-dividend date may have passed, which are recorded as soon as the Fund is informed of the ex-dividend date. Non-cash dividends included in dividend income, if any, are recorded at the fair market value of the securities received. Income and capital gain distributions from Fidelity Central Funds, if any, are recorded on the ex-dividend date. Investment income is recorded net of foreign taxes withheld where recovery of such taxes is uncertain.
Annual Report
3. Significant Accounting Policies - continued
Class Allocations and Expenses. Investment income, realized and unrealized capital gains and losses, common expenses of the Fund, and certain fund-level expense reductions, if any, are allocated daily on a pro-rata basis to each class based on the relative net assets of each class to the total net assets of the Fund. Each class differs with respect to transfer agent and distribution and service plan fees incurred. Certain expense reductions may also differ by class. For the reporting period, the allocated portion of income and expenses to each class as a percent of its average net assets may vary due to the timing of recording these transactions in relation to fluctuating net assets of the classes. Expenses directly attributable to a fund are charged to that fund. Expenses attributable to more than one fund are allocated among the respective funds on the basis of relative net assets or other appropriate methods. Expense estimates are accrued in the period to which they relate and adjustments are made when actual amounts are known.
Income Tax Information and Distributions to Shareholders. Each year, the Fund intends to qualify as a regulated investment company under Subchapter M of the Internal Revenue Code, including distributing substantially all of its taxable income and realized gains. As a result, no provision for U.S. Federal income taxes is required. As of October 31, 2014, the Fund did not have any unrecognized tax benefits in the financial statements; nor is the Fund aware of any tax positions for which it is reasonably possible that the total amounts of unrecognized tax benefits will significantly change in the next twelve months. The Fund files a U.S. federal tax return, in addition to state and local tax returns as required. The Fund's federal income tax returns are subject to examination by the Internal Revenue Service (IRS) for a period of three fiscal years after they are filed. State and local tax returns may be subject to examination for an additional fiscal year depending on the jurisdiction. Foreign taxes are provided for based on the Fund's understanding of the tax rules and rates that exist in the foreign markets in which it invests. The Fund is subject to a tax imposed on capital gains by certain countries in which it invests. An estimated deferred tax liability for net unrealized appreciation on the applicable securities is included in Other payables and accrued expenses on the Statement of Assets & Liabilities.
Distributions are declared and recorded on the ex-dividend date. Income dividends and capital gain distributions are declared separately for each class. Income and capital gain distributions are determined in accordance with income tax regulations, which may differ from GAAP. In addition, the Fund claimed a portion of the payment made to redeeming shareholders as a distribution for income tax purposes.
Capital accounts within the financial statements are adjusted for permanent book-tax differences. These adjustments have no impact on net assets or the results of operations. Capital accounts are not adjusted for temporary book-tax differences which will reverse in a subsequent period.
Annual Report
Notes to Financial Statements - continued
3. Significant Accounting Policies - continued
Income Tax Information and Distributions to Shareholders - continued
Book-tax differences are primarily due to foreign currency transactions, passive foreign investment companies (PFIC), partnerships, capital loss carryforwards and losses deferred due to wash sales.
The federal tax cost of investment securities and unrealized appreciation (depreciation) as of period end were as follows:
Gross unrealized appreciation | $ 110,999,674 |
Gross unrealized depreciation | (22,777,849) |
Net unrealized appreciation (depreciation) on securities | $ 88,221,825 |
| |
Tax Cost | $ 854,018,108 |
The tax-based components of distributable earnings as of period end were as follows:
Undistributed ordinary income | $ 6,829,762 |
Capital loss carryforward | $ (8,517,174) |
Net unrealized appreciation (depreciation) on securities and other investments | $ 88,155,149 |
Capital loss carryforwards are only available to offset future capital gains of the Fund to the extent provided by regulations and may be limited. Under the Regulated Investment Company Modernization Act of 2010 (the Act), the Fund is permitted to carry forward capital losses incurred in taxable years beginning after December 22, 2010 for an unlimited period and such capital losses are required to be used prior to any losses that expire. The capital loss carryforward information presented below, including any applicable limitation, is estimated as of fiscal period end and is subject to adjustment.
No expiration | |
Short-term | (7,236,154) |
Long-term | (1,281,020) |
Total no expiration | (8,517,174) |
The tax character of distributions paid was as follows:
| October 31, 2014 | October 31, 2013 |
Ordinary Income | $ 2,592,642 | $ 2,195,105 |
Long-term Capital Gains | 513,442 | - |
Total | $ 3,106,084 | $ 2,195,105 |
Annual Report
3. Significant Accounting Policies - continued
Short-Term Trading (Redemption) Fees. Shares held by investors in the Fund less than 30 days may have been subject to a redemption fee equal to 1.00% of the NAV of shares redeemed. All redemption fees, which reduce the proceeds of the shareholder redemption, are retained by the Fund and accounted for as an addition to paid in capital.
New Accounting Pronouncement. In June 2014, the Financial Accounting Standards Board issued Accounting Standard Update No. 2014-11, Repurchase-to-Maturity Transactions, Repurchase Financings, and Disclosures. The Update amends the accounting for certain repurchase agreements and expands disclosure requirements for reverse repurchase agreements, securities lending and other similar transactions. The disclosure requirements are effective for annual and interim reporting periods beginning after December 15, 2014. Management is currently evaluating the impact of the Update on the Fund's financial statements and related disclosures.
4. Purchases and Sales of Investments.
Purchases and sales of securities, other than short-term securities, aggregated $523,591,304 and $200,715,697, respectively.
5. Fees and Other Transactions with Affiliates.
Management Fee. Fidelity Management & Research Company and its affiliates provide the Fund with investment management related services for which the Fund pays a monthly management fee. The management fee is the sum of an individual fund fee rate that is based on an annual rate of .45% of the Fund's average net assets and an annualized group fee rate that averaged .25% during the period. The group fee rate is based upon the average net assets of all the mutual funds advised by the investment adviser, including any mutual funds previously advised by the investment adviser that are currently advised by Fidelity SelectCo, LLC, an affiliate of the investment adviser. The group fee rate decreases as assets under management increase and increases as assets under management decrease. In addition, the management fee is subject to a performance adjustment (up to a maximum of ± .20% of the Fund's average net assets over a 36 month performance period). The upward or downward adjustment to the management fee is based on the relative investment performance of International Growth as compared to its benchmark index, the MSCI EAFE Growth Index, over the same 36 month performance period. For the reporting period, the total annual management fee rate, including the performance adjustment, was .75% of the Fund's average net assets. The performance adjustment included in the management fee rate may be higher or lower than the maximum performance adjustment rate due to the difference between the average net assets for the reporting and performance periods.
Annual Report
Notes to Financial Statements - continued
5. Fees and Other Transactions with Affiliates - continued
Distribution and Service Plan Fees. In accordance with Rule 12b-1 of the 1940 Act, the Fund has adopted separate Distribution and Service Plans for each class of shares. Certain classes pay Fidelity Distributors Corporation (FDC), an affiliate of the investment adviser, separate Distribution and Service Fees, each of which is based on an annual percentage of each class' average net assets. In addition, FDC may pay financial intermediaries for selling shares of the Fund and providing shareholder support services. For the period, the Distribution and Service Fee rates, total fees and amounts retained by FDC were as follows:
| Distribution
Fee | Service
Fee | Total Fees | Retained
by FDC |
Class A | -% | .25% | $ 254,598 | $ 7,801 |
Class T | .25% | .25% | 131,110 | - |
Class B | .75% | .25% | 15,512 | 11,650 |
Class C | .75% | .25% | 276,397 | 95,761 |
| | | $ 677,617 | $ 115,212 |
Sales Load. FDC may receive a front-end sales charge of up to 5.75% for selling Class A shares and 3.50% for selling Class T shares, some of which is paid to financial intermediaries for selling shares of the Fund. Depending on the holding period, FDC may receive contingent deferred sales charges levied on Class A, Class T, Class B, and Class C redemptions. The deferred sales charges range from 5.00% to 1.00% for Class B shares, 1.00% for Class C shares, 1.00% for certain purchases of Class A shares and .25% for certain purchases of Class T shares.
For the period, sales charge amounts retained by FDC were as follows:
| Retained
by FDC |
Class A | $ 86,435 |
Class T | 14,136 |
Class B* | 528 |
Class C* | 3,947 |
| $ 105,046 |
* When Class B and Class C shares are initially sold, FDC pays commissions from its own resources to financial intermediaries through which the sales are made.
Transfer Agent Fees. Fidelity Investments Institutional Operations Company, Inc., (FIIOC), an affiliate of the investment adviser, is the transfer, dividend disbursing and shareholder servicing agent for each class of the Fund. FIIOC receives account fees and asset-based fees that vary according to the account size and type of account of the
Annual Report
5. Fees and Other Transactions with Affiliates - continued
Transfer Agent Fees - continued
shareholders of the respective classes of the Fund, except for Class Z. FIIOC receives an asset-based fee of Class Z's average net assets. FIIOC pays for typesetting, printing and mailing of shareholder reports, except proxy statements.
For the period, transfer agent fees for each class were as follows:
| Amount | % of
Class-Level Average
Net Assets |
Class A | $ 265,803 | .26 |
Class T | 81,975 | .31 |
Class B | 4,755 | .31 |
Class C | 79,887 | .29 |
International Growth | 1,083,784 | .20 |
Institutional Class | 171,407 | .21 |
Class Z | 50 | .05 |
| $ 1,687,661 | |
Accounting and Security Lending Fees. Fidelity Service Company, Inc. (FSC), an affiliate of the investment adviser, maintains the Fund's accounting records. The accounting fee is based on the level of average net assets for each month. Under a separate contract, FSC administers the security lending program. The security lending fee is based on the number and duration of lending transactions.
Brokerage Commissions. The Fund placed a portion of its portfolio transactions with brokerage firms which are affiliates of the investment adviser. Brokerage commissions are included in net realized gain (loss) and change in net unrealized appreciation (depreciation) in the Statement of Operations. The commissions paid to these affiliated firms were $1,309 for the period.
Other. During the period, the investment adviser reimbursed the Fund for certain losses in the amount of $4,581.
6. Committed Line of Credit.
The Fund participates with other funds managed by the investment adviser or an affiliate in a $4.25 billion credit facility (the "line of credit") to be utilized for temporary or emergency purposes to fund shareholder redemptions or for other short-term liquidity purposes. The Fund has agreed to pay commitment fees on its pro-rata portion of the line of credit, which amounted to $1,181 and is reflected in Miscellaneous expenses on the Statement of Operations. During the period, the Fund did not borrow on this line of credit.
Annual Report
Notes to Financial Statements - continued
7. Security Lending.
The Fund lends portfolio securities through a lending agent from time to time in order to earn additional income. For equity securities, a lending agent is used and may loan securities to certain qualified borrowers, including Fidelity Capital Markets (FCM), a broker-dealer affiliated with the Fund. On the settlement date of the loan, the Fund receives collateral (in the form of U.S. Treasury obligations, letters of credit and/or cash) against the loaned securities and maintains collateral in an amount not less than 100% of the market value of the loaned securities during the period of the loan. The market value of the loaned securities is determined at the close of business of the Fund and any additional required collateral is delivered to the Fund on the next business day. If the borrower defaults on its obligation to return the securities loaned because of insolvency or other reasons, the Fund may apply collateral received from the borrower against the obligation. The Fund may experience delays and costs in recovering the securities loaned. Any cash collateral received is invested in the Fidelity Securities Lending Cash Central Fund. The value of loaned securities and cash collateral at period end are disclosed on the Fund's Statement of Assets and Liabilities. The value of securities loaned to FCM at period end was $819,854. Security lending income represents the income earned on investing cash collateral, less rebates paid to borrowers and any lending agent fees associated with the loan, plus any premium payments received for lending certain types of securities. Security lending income is presented in the Statement of Operations as a component of income from Fidelity Central Funds. Total security lending income during the period amounted to $325,646, including $14,631 from securities loaned to FCM.
8. Expense Reductions.
Commissions paid to certain brokers with whom the investment adviser, or its affiliates, places trades on behalf of the Fund include an amount in addition to trade execution, which may be rebated back to the Fund to offset certain expenses. This amount totaled $6,405 for the period. In addition, through arrangements with the Fund's custodian, credits realized as a result of uninvested cash balances were used to reduce the Fund's expenses. During the period, these credits reduced the Fund's custody expenses by $37.
In addition, the investment adviser reimbursed a portion of the Fund's operating expenses during the period in the amount of $4,248.
Annual Report
9. Distributions to Shareholders.
Distributions to shareholders of each class were as follows:
Years ended October 31, | 2014 | 2013 |
From net investment income | | |
Class A | $ 253,092 | $ 226,330 |
Class T | 40,595 | 86,155 |
Class B | - | 4,290 |
Class C | - | 14,481 |
International Growth | 2,051,403 | 1,698,830 |
Institutional Class | 246,949 | 51,250 |
Class Z | 604 | - |
Total | $ 2,592,643 | $ 2,081,336 |
From net realized gain | | |
Class A | $ 66,995 | $ 13,472 |
Class T | 20,298 | 6,243 |
Class B | 1,337 | 631 |
Class C | 16,479 | 3,291 |
International Growth | 369,252 | 87,569 |
Institutional Class | 38,992 | 2,563 |
Class Z | 88 | - |
Total | $ 513,441 | $ 113,769 |
10. Share Transactions.
Share transactions for each class were as follows and may contain automatic conversions between classes or exchanges between funds:
| Shares | Dollars |
Years ended October 31, | 2014 | 2013A | 2014 | 2013A |
Class A | | | | |
Shares sold | 6,584,484 | 5,907,169 | $ 72,326,606 | $ 58,500,264 |
Reinvestment of distributions | 27,068 | 24,178 | 291,793 | 218,566 |
Shares redeemed | (2,724,911) | (1,466,703) | (30,099,985) | (14,226,261) |
Net increase (decrease) | 3,886,641 | 4,464,644 | $ 42,518,414 | $ 44,492,569 |
Class T | | | | |
Shares sold | 834,072 | 1,144,706 | $ 9,114,198 | $ 11,429,141 |
Reinvestment of distributions | 5,459 | 10,086 | 58,733 | 91,076 |
Shares redeemed | (585,464) | (206,178) | (6,459,248) | (2,020,899) |
Net increase (decrease) | 254,067 | 948,614 | $ 2,713,683 | $ 9,499,318 |
Class B | | | | |
Shares sold | 35,020 | 70,442 | $ 380,789 | $ 702,618 |
Reinvestment of distributions | 123 | 531 | 1,323 | 4,806 |
Shares redeemed | (53,583) | (49,437) | (587,919) | (483,935) |
Net increase (decrease) | (18,440) | 21,536 | $ (205,807) | $ 223,489 |
Annual Report
Notes to Financial Statements - continued
10. Share Transactions - continued
| Shares | Dollars |
Years ended October 31, | 2014 | 2013A | 2014 | 2013A |
Class C | | | | |
Shares sold | 1,827,859 | 1,392,365 | $ 19,884,401 | $ 13,520,584 |
Reinvestment of distributions | 1,498 | 1,911 | 16,049 | 17,237 |
Shares redeemed | (426,678) | (424,469) | (4,637,384) | (4,120,400) |
Net increase (decrease) | 1,402,679 | 969,807 | $ 15,263,066 | $ 9,417,421 |
International Growth | | | | |
Shares sold | 27,835,093 | 29,198,608 | $ 307,440,711 | $ 290,678,738 |
Reinvestment of distributions | 197,948 | 192,126 | 2,143,781 | 1,742,585 |
Shares redeemed | (10,494,762) | (6,365,570) | (115,997,211) | (62,814,771) |
Net increase (decrease) | 17,538,279 | 23,025,164 | $ 193,587,281 | $ 229,606,552 |
Institutional Class | | | | |
Shares sold | 10,292,704 | 3,568,741 | $ 113,864,505 | $ 35,951,935 |
Reinvestment of distributions | 24,180 | 5,682 | 261,623 | 51,476 |
Shares redeemed | (2,927,192) | (443,392) | (31,428,962) | (4,427,602) |
Net increase (decrease) | 7,389,692 | 3,131,031 | $ 82,697,166 | $ 31,575,809 |
Class Z | | | | |
Shares sold | - | 9,747 | $ - | $ 100,000 |
Reinvestment of distributions | 64 | - | 692 | - |
Shares redeemed | (475) | - | (5,267) | - |
Net increase (decrease) | (411) | 9,747 | $ (4,575) | $ 100,000 |
A Share transactions for Class Z are for the period August 13, 2013 (commencement of sale of shares) to October 31, 2013.
11. Other.
The Fund's organizational documents provide former and current trustees and officers with a limited indemnification against liabilities arising in connection with the performance of their duties to the Fund. In the normal course of business, the Fund may also enter into contracts that provide general indemnifications. The Fund's maximum exposure under these arrangements is unknown as this would be dependent on future claims that may be made against the Fund. The risk of material loss from such claims is considered remote.
Annual Report
To the Trustees of Fidelity Investment Trust and the Shareholders of Fidelity International Growth Fund:
In our opinion, the accompanying statement of assets and liabilities, including the schedule of investments, and the related statements of operations and of changes in net assets and the financial highlights present fairly, in all material respects, the financial position of Fidelity International Growth Fund (a fund of Fidelity Investment Trust) at October 31, 2014, the results of its operations for the year then ended, the changes in its net assets for each of the two years in the period then ended and the financial highlights for each of the periods indicated, in conformity with accounting principles generally accepted in the United States of America. These financial statements and financial highlights (hereafter referred to as "financial statements") are the responsibility of the Fidelity International Growth Fund's management. Our responsibility is to express an opinion on these financial statements based on our audits. We conducted our audits of these financial statements in accordance with the standards of the Public Company Accounting Oversight Board (United States). Those standards require that we plan and perform the audit to obtain reasonable assurance about whether the financial statements are free of material misstatement. An audit includes examining, on a test basis, evidence supporting the amounts and disclosures in the financial statements, assessing the accounting principles used and significant estimates made by management, and evaluating the overall financial statement presentation. We believe that our audits, which included confirmation of securities at October 31, 2014 by correspondence with the custodian and brokers, provide a reasonable basis for our opinion.
PricewaterhouseCoopers LLP
Boston, Massachusetts
December 18, 2014
Annual Report
The Trustees, Member of the Advisory Board, and officers of the trust and fund, as applicable, are listed below. The Board of Trustees governs the fund and is responsible for protecting the interests of shareholders. The Trustees are experienced executives who meet periodically throughout the year to oversee the fund's activities, review contractual arrangements with companies that provide services to the fund, oversee management of the risks associated with such activities and contractual arrangements, and review the fund's performance. Except for James C. Curvey, each of the Trustees oversees 174 funds. Mr. Curvey oversees 407 funds.
The Trustees hold office without limit in time except that (a) any Trustee may resign; (b) any Trustee may be removed by written instrument, signed by at least two-thirds of the number of Trustees prior to such removal; (c) any Trustee who requests to be retired or who has become incapacitated by illness or injury may be retired by written instrument signed by a majority of the other Trustees; and (d) any Trustee may be removed at any special meeting of shareholders by a two-thirds vote of the outstanding voting securities of the trust. Each Trustee who is not an interested person (as defined in the 1940 Act) of the trust and the fund (Independent Trustee), shall retire not later than the last day of the calendar year in which his or her 75th birthday occurs. The Independent Trustees may waive this mandatory retirement age policy with respect to individual Trustees. The officers and Advisory Board Member hold office without limit in time, except that any officer and Advisory Board Member may resign or may be removed by a vote of a majority of the Trustees at any regular meeting or any special meeting of the Trustees. Except as indicated, each individual has held the office shown or other offices in the same company for the past five years.
Experience, Skills, Attributes, and Qualifications of the Fund's Trustees. The Governance and Nominating Committee has adopted a statement of policy that describes the experience, qualifications, attributes, and skills that are necessary and desirable for potential Independent Trustee candidates (Statement of Policy). The Board believes that each Trustee satisfied at the time he or she was initially elected or appointed a Trustee, and continues to satisfy, the standards contemplated by the Statement of Policy. The Governance and Nominating Committee also engages professional search firms to help identify potential Independent Trustee candidates who have the experience, qualifications, attributes, and skills consistent with the Statement of Policy. From time to time, additional criteria based on the composition and skills of the current Independent Trustees, as well as experience or skills that may be appropriate in light of future changes to board composition, business conditions, and regulatory or other developments, have also been considered by the professional search firms and the Governance and Nominating Committee. In addition, the Board takes into account the Trustees' commitment and participation in Board and committee meetings, as well as their leadership of standing and ad hoc committees throughout their tenure.
In determining that a particular Trustee was and continues to be qualified to serve as a Trustee, the Board has considered a variety of criteria, none of which, in isolation, was controlling. The Board believes that, collectively, the Trustees have balanced and diverse experience, qualifications, attributes, and skills, which allow the Board to operate effectively in governing the fund and protecting the interests of shareholders. Information about the specific experience, skills, attributes, and qualifications of each Trustee, which in each case led to the Board's conclusion that the Trustee should serve (or continue to serve) as a trustee of the fund, is provided below.
Annual Report
Board Structure and Oversight Function. James C. Curvey is an interested person (as defined in the 1940 Act) and currently serves as Chairman. The Trustees have determined that an interested Chairman is appropriate and benefits shareholders because an interested Chairman has a personal and professional stake in the quality and continuity of services provided to the fund. Independent Trustees exercise their informed business judgment to appoint an individual of their choosing to serve as Chairman, regardless of whether the Trustee happens to be independent or a member of management. The Independent Trustees have determined that they can act independently and effectively without having an Independent Trustee serve as Chairman and that a key structural component for assuring that they are in a position to do so is for the Independent Trustees to constitute a substantial majority for the Board. The Independent Trustees also regularly meet in executive session. Ned C. Lautenbach serves as Chairman of the Independent Trustees and as such (i) acts as a liaison between the Independent Trustees and management with respect to matters important to the Independent Trustees and (ii) with management prepares agendas for Board meetings.
Fidelity funds are overseen by different Boards of Trustees. The fund's Board oversees Fidelity's equity and high income funds and another Board oversees Fidelity's investment-grade bond, money market, and asset allocation funds. The asset allocation funds may invest in Fidelity funds overseen by the fund's Board. The use of separate Boards, each with its own committee structure, allows the Trustees of each group of Fidelity funds to focus on the unique issues of the funds they oversee, including common research, investment, and operational issues. On occasion, the separate Boards establish joint committees to address issues of overlapping consequences for the Fidelity funds overseen by each Board.
The Trustees operate using a system of committees to facilitate the timely and efficient consideration of all matters of importance to the Trustees, the fund, and fund shareholders and to facilitate compliance with legal and regulatory requirements and oversight of the fund's activities and associated risks. The Board, acting through its committees, has charged FMR and its affiliates with (i) identifying events or circumstances the occurrence of which could have demonstrably adverse effects on the fund's business and/or reputation; (ii) implementing processes and controls to lessen the possibility that such events or circumstances occur or to mitigate the effects of such events or circumstances if they do occur; and (iii) creating and maintaining a system designed to evaluate continuously business and market conditions in order to facilitate the identification and implementation processes described in (i) and (ii) above. Because the day-to-day operations and activities of the fund are carried out by or through FMR, its affiliates and other service providers, the fund's exposure to risks is mitigated but not eliminated by the processes overseen by the Trustees. While each of the Board's committees has responsibility for overseeing different aspects of the fund's activities, oversight is exercised primarily through the Operations, Audit, and Compliance Committees. In addition, the Independent Trustees have worked with FMR to enhance the Board's oversight of investment and financial risks, legal and regulatory risks, technology risks, and operational risks, including the development of additional risk reporting to the Board. For example, a working group comprised of Independent Trustees and FMR has worked and continues to work to review the Fidelity funds' valuation-related activities, reporting and risk management. Appropriate personnel, including but not limited to the fund's Chief Compliance Officer (CCO), FMR's internal auditor, the independent accountants, the fund's Treasurer and portfolio management personnel, make periodic reports to the Board's committees, as appropriate, including an annual review of FMR's risk management program for the Fidelity funds. The responsibilities of each standing committee, including their oversight responsibilities, are described further under "Standing Committees of the Fund's Trustees."
Annual Report
Trustees and Officers - continued
The fund's Statement of Additional Information (SAI) includes more information about the Trustees. To request a free copy, call Fidelity at 1-800-544-8544.
Interested Trustees*:
Correspondence intended for each Trustee who is an interested person may be sent to Fidelity Investments, 245 Summer Street, Boston, Massachusetts 02210.
Name, Year of Birth; Principal Occupations and Other Relevant Experience+ |
James C. Curvey (1935) |
Year of Election or Appointment: 2007 Trustee Chairman of the Board of Trustees |
| Mr. Curvey also serves as Trustee of other Fidelity funds. Mr. Curvey is a Director of Fidelity Research & Analysis Co. (2009-present), and Vice Chairman (2007-present) and Director of FMR LLC. In addition, Mr. Curvey serves as an Overseer for the Boston Symphony Orchestra and a member of the board of Artis-Naples, Naples, Florida, and as a Trustee for Brewster Academy, Wolfeboro, New Hampshire. Previously, Mr. Curvey served as a Director of Fidelity Investments Money Management, Inc. (2009-2014), a Director of FMR (2007-2014), and a Director of FMR Co., Inc. (2007-2014). |
Charles S. Morrison (1960) |
Year of Election or Appointment: 2014 Trustee |
| Mr. Morrison also serves as Trustee of other funds. He serves as a Director of Fidelity Investments Money Management, Inc. (FIMM) (2014-present), Director of Fidelity SelectCo, LLC (2014-present), President, Asset Management (2014-present), and is an employee of Fidelity Investments. Previously, Mr. Morrison served as Vice President of Fidelity's Fixed Income and Asset Allocation Funds (2012-2014), President, Fixed Income (2011-2014), Vice President of Fidelity's Money Market Funds (2005-2009), President, Money Market Group Leader of FMR (2009), and Senior Vice President, Money Market Group of FMR (2004-2009). Mr. Morrison also served as Vice President of Fidelity's Bond Funds (2002-2005), certain Balanced Funds (2002-2005), and certain Asset Allocation Funds (2002-2007), and as Senior Vice President (2002-2005) of Fidelity's Bond Division. |
* Trustees have been determined to be "Interested Trustees" by virtue of, among other things, their affiliation with the trust or various entities under common control with FMR.
+ The information above includes each Trustee's principal occupation during the last five years and other information relating to the experience, attributes, and skills relevant to each Trustee's qualifications to serve as a Trustee, which led to the conclusion that each Trustee should serve as a Trustee for the fund.
Annual Report
Trustees and Officers - continued
Independent Trustees:
Correspondence intended for each Independent Trustee (that is, the Trustees other than the Interested Trustees) may be sent to Fidelity Investments, P.O. Box 55235, Boston, Massachusetts 02205-5235.
Name, Year of Birth; Principal Occupations and Other Relevant Experience+ |
Dennis J. Dirks (1948) |
Year of Election or Appointment: 2005 Trustee |
| Mr. Dirks also serves as Trustee of other Fidelity funds. Prior to his retirement in May 2003, Mr. Dirks was Chief Operating Officer and a member of the Board of The Depository Trust & Clearing Corporation (DTCC). He also served as President, Chief Operating Officer, and Board member of The Depository Trust Company (DTC) and President and Board member of the National Securities Clearing Corporation (NSCC). In addition, Mr. Dirks served as Chief Executive Officer and Board member of the Government Securities Clearing Corporation, Chief Executive Officer and Board member of the Mortgage-Backed Securities Clearing Corporation, as a Trustee and a member of the Finance Committee of Manhattan College (2005-2008), and as a Trustee and a member of the Finance Committee of AHRC of Nassau County (2006-2008). Mr. Dirks is a member of the Independent Directors Council (IDC) Governing Council (2010-present) and Board of Directors for The Brookville Center for Children's Services, Inc. (2009-present). |
Alan J. Lacy (1953) |
Year of Election or Appointment: 2008 Trustee |
| Mr. Lacy also serves as Trustee of other Fidelity funds. Mr. Lacy serves as Senior Adviser (2007-present) of Oak Hill Capital Partners, L.P. (private equity). Mr. Lacy also served as Chief Executive Officer (2000-2005) and Vice Chairman (2005-2006) of Sears Holdings Corporation and Sears, Roebuck and Co. (retail). In addition, Mr. Lacy serves as a member of the Board of Directors of Dave & Buster's Entertainment, Inc. (restaurant and entertainment complexes, 2010-present), Earth Fare, Inc. (retail grocery, 2012-present), The Hillman Companies, Inc. (hardware wholesalers, 2010-present), and Bristol-Myers Squibb Company (global pharmaceuticals, 2008-present). Mr. Lacy is a member of the Board of Trustees of The National Parks Conservation Association (2006-present). Previously, Mr. Lacy served as Chairman of the Board of Trustees of the National Parks Conservation Association (2008-2011) and as a member of the Board of Directors for the Western Union Company (global money transfer, 2006-2011). |
Ned C. Lautenbach (1944) |
Year of Election or Appointment: 2000 Trustee Chairman of the Independent Trustees |
| Mr. Lautenbach also serves as Trustee of other Fidelity funds. Mr. Lautenbach currently serves as the Lead Director of the Eaton Corporation Board of Directors (diversified industrial, 1997-present). Mr. Lautenbach is Chairman of the Board of Directors of the Philharmonic Center for the Arts in Naples, Florida (2012-present) and a member of the Council on Foreign Relations (1994-present). Previously, Mr. Lautenbach was a Partner/Advisory Partner at Clayton, Dubilier & Rice, LLC (private equity investment, 1998-2010), as well as a Director of Sony Corporation (2006-2007). |
Joseph Mauriello (1944) |
Year of Election or Appointment: 2008 Trustee |
| Mr. Mauriello also serves as Trustee of other Fidelity funds. Prior to his retirement in January 2006, Mr. Mauriello served in numerous senior management positions including Deputy Chairman and Chief Operating Officer (2004-2005), and Vice Chairman of Financial Services (2002-2004) of KPMG LLP US (professional services, 1965-2005). Mr. Mauriello currently serves as a member of the Board of Directors of XL Group plc. (global insurance and re-insurance, 2006-present). Previously, Mr. Mauriello served as a Director of the Hamilton Funds of the Bank of New York (2006-2007) and of Arcadia Resources Inc. (health care services and products, 2007-2012). |
Robert W. Selander (1950) |
Year of Election or Appointment: 2011 Trustee |
| Mr. Selander also serves as Trustee of other Fidelity funds. Previously, Mr. Selander served as a Member of the Advisory Board of other Fidelity funds (2011), and Executive Vice Chairman (2010), Chief Executive Officer (2009-2010), and President and Chief Executive Officer (1997-2009) of Mastercard, Inc. |
Cornelia M. Small (1944) |
Year of Election or Appointment: 2005 Trustee |
| Ms. Small also serves as Trustee of other Fidelity funds. Ms. Small is a member of the Board of Directors (2009-present) and Chair of the Investment Committee (2010-present) of the Teagle Foundation. Ms. Small also serves on the Investment Committee of the Berkshire Taconic Community Foundation (2008-present). Previously, Ms. Small served as Chairperson (2002-2008) and a member of the Investment Committee and Chairperson (2008-2012) and a member of the Board of Trustees of Smith College. In addition, Ms. Small served as Chief Investment Officer, Director of Global Equity Investments, and a member of the Board of Directors of Scudder, Stevens & Clark and Scudder Kemper Investments. |
William S. Stavropoulos (1939) |
Year of Election or Appointment: 2001 Trustee Vice Chairman of the Independent Trustees |
| Mr. Stavropoulos also serves as Trustee of other Fidelity funds. Mr. Stavropoulos serves as President and Founder of the Michigan Baseball Foundation, the Great Lakes Loons (2007-present). Mr. Stavropoulos is Chairman Emeritus of the Board of Directors of The Dow Chemical Company, where he previously served in numerous senior management positions, including President, CEO (1995-2000; 2002-2004), Chairman of the Executive Committee (2000-2006), and as a member of the Board of Directors (1990-2006). Currently, Mr. Stavropoulos is Chairman of the Board of Directors of Univar Inc. (global distributor of commodity and specialty chemicals), a Director of Teradata Corporation (data warehousing and technology solutions), and Maersk Inc. (industrial conglomerate), and a member of the Advisory Board for Metalmark Capital LLC (private equity investment, 2005-present). Mr. Stavropoulos is an operating advisor to Clayton, Dubilier & Rice, LLC (private equity investment). In addition, Mr. Stavropoulos is a member of the University of Notre Dame Advisory Council for the College of Science, a Trustee of the Rollin L. Gerstacker Foundation, and a Director of the Naples Philharmonic Center for the Arts. Previously, Mr. Stavropoulos served as a Director of Chemical Financial Corporation (bank holding company, 1993-2012) and Tyco International, Ltd. (multinational manufacturing and services, 2007-2012). |
David M. Thomas (1949) |
Year of Election or Appointment: 2008 Trustee |
| Mr. Thomas also serves as Trustee of other Fidelity funds. Mr. Thomas serves as Non-Executive Chairman of the Board of Directors of Fortune Brands Home and Security (home and security products, 2011-present), and as a member of the Board of Directors of Interpublic Group of Companies, Inc. (marketing communication, 2004-present). Previously, Mr. Thomas served as Executive Chairman (2005-2006) and Chairman and Chief Executive Officer (2000-2005) of IMS Health, Inc. (pharmaceutical and healthcare information solutions), and a Director of Fortune Brands, Inc. (consumer products, 2000-2011). |
+ The information above includes each Trustee's principal occupation during the last five years and other information relating to the experience, attributes, and skills relevant to each Trustee's qualifications to serve as a Trustee, which led to the conclusion that each Trustee should serve as a Trustee for the fund.
Advisory Board Member and Officers:
Correspondence intended for each officer and Peter S. Lynch may be sent to Fidelity Investments, 245 Summer Street, Boston, Massachusetts 02210. Officers appear below in alphabetical order.
Name, Year of Birth; Principal Occupation |
Peter S. Lynch (1944) |
Year of Election or Appointment: 2003 Member of the Advisory Board |
| Mr. Lynch also serves as Member of the Advisory Board of other Fidelity funds. Mr. Lynch is Vice Chairman and a Director of FMR and FMR Co., Inc. In addition, Mr. Lynch serves as a Trustee of Boston College and as the Chairman of the Inner-City Scholarship Fund. Previously, Mr. Lynch served on the Special Olympics International Board of Directors (1997-2006). |
Elizabeth Paige Baumann (1968) |
Year of Election or Appointment: 2012 Anti-Money Laundering (AML) Officer |
| Ms. Baumann also serves as AML Officer of other funds. She is Chief AML Officer of FMR LLC (2012-present) and is an employee of Fidelity Investments. Previously, Ms. Baumann served as Vice President and Deputy Anti-Money Laundering Officer (2007-2012). |
William C. Coffey (1969) |
Year of Election or Appointment: 2009 Assistant Secretary |
| Mr. Coffey also serves as Assistant Secretary of other funds. He is Senior Vice President and Deputy General Counsel of FMR LLC (2010-present), and is an employee of Fidelity Investments. Previously, Mr. Coffey served as Vice President and Associate General Counsel of FMR LLC (2005-2009). |
Timothy M. Cohen (1969) |
Year of Election or Appointment: 2014 Vice President of certain Equity Funds |
| Mr. Cohen also serves as Vice President of other funds. Mr. Cohen serves as a Director and Chief Compliance Officer of Fidelity Management & Research (U.K.) Inc. (2013-present) and is an employee of Fidelity Investments. |
Jonathan Davis (1968) |
Year of Election or Appointment: 2010 Assistant Treasurer |
| Mr. Davis also serves as Assistant Treasurer of other funds. Mr. Davis is an employee of Fidelity Investments. Previously, Mr. Davis served as Vice President and Associate General Counsel of FMR LLC (2003-2010). |
Adrien E. Deberghes (1967) |
Year of Election or Appointment: 2008 Deputy Treasurer |
| Mr. Deberghes also serves as an officer of other funds. He is an employee of Fidelity Investments (2008-present). Prior to joining Fidelity Investments, Mr. Deberghes was Senior Vice President of Mutual Fund Administration at State Street Corporation (2007-2008), Senior Director of Mutual Fund Administration at Investors Bank & Trust (2005-2007), and Director of Finance for Dunkin' Brands (2000-2005). |
Stephanie J. Dorsey (1969) |
Year of Election or Appointment: 2010 Assistant Treasurer |
| Ms. Dorsey also serves as an officer of other funds. She is an employee of Fidelity Investments (2008-present) and has served in other fund officer roles. Prior to joining Fidelity Investments, Ms. Dorsey served as Treasurer (2004-2008) of the JPMorgan Mutual Funds and Vice President (2004-2008) of JPMorgan Chase Bank. |
Howard J. Galligan III (1966) |
Year of Election or Appointment: 2014 Chief Financial Officer |
| Mr. Galligan also serves as Chief Financial Officer of other funds. Mr. Galligan serves as President of Fidelity Pricing and Cash Management Services (FPCMS) (2014-present) and as a Director of Strategic Advisers, Inc. (2008-present). Previously, Mr. Galligan served as Chief Administrative Officer of Asset Management (2011-2014) and Chief Operating Officer and Senior Vice President of Investment Support for Strategic Advisers, Inc. (2003-2011). |
Scott C. Goebel (1968) |
Year of Election or Appointment: 2008 Secretary and Chief Legal Officer (CLO) |
| Mr. Goebel serves as Secretary and CLO of other funds. Mr. Goebel also serves as Secretary of Fidelity SelectCo, LLC (2013-present), Fidelity Investments Money Management, Inc. (FIMM) (2010-present) and Fidelity Research and Analysis Company (FRAC) (2010-present); General Counsel, Secretary, and Senior Vice President of FMR (2008-present) and FMR Co., Inc. (2008-present); Chief Legal Officer of Fidelity Management & Research (Hong Kong) Limited (2008-present); and Assistant Secretary of Fidelity Management & Research (Japan) Limited (2008-present) and Fidelity Management & Research (U.K.) Inc. (2008-present). Previously, Mr. Goebel served as Secretary and CLO of other Fidelity funds (2008-2013), Assistant Secretary of FIMM (2008-2010), FRAC (2008-2010), and certain funds (2007-2008); and as Vice President and Secretary of Fidelity Distributors Corporation (FDC) (2005-2007). Mr. Goebel has been employed by FMR LLC or an affiliate since 2001. |
Brian B. Hogan (1964) |
Year of Election or Appointment: 2009 Vice President |
| Mr. Hogan also serves as Trustee or Vice President of other funds. Mr. Hogan serves as a Director of Fidelity SelectCo, LLC (2014-present) and President of FMR's Equity Division (2009-present). Previously, Mr. Hogan served as Senior Vice President, Equity Research of FMR (2006-2009) and as a portfolio manager. |
Chris Maher (1972) |
Year of Election or Appointment: 2013 Assistant Treasurer |
| Mr. Maher serves as Assistant Treasurer of other funds. Mr. Maher is Vice President of Valuation Oversight and is an employee of Fidelity Investments. Previously, Mr. Maher served as Vice President of Asset Management Compliance (2013), Vice President of FMR's Program Management Group (2010-2013), and Vice President of Valuation Oversight (2008-2010). |
Kenneth B. Robins (1969) |
Year of Election or Appointment: 2008 President and Treasurer |
| Mr. Robins also serves as an officer of other funds. Mr. Robins serves as Executive Vice President of Fidelity Investments Money Management, Inc. (FIMM) (2013-present) and is an employee of Fidelity Investments (2004-present). Previously, Mr. Robins served in other fund officer roles. |
Stephen Sadoski (1971) |
Year of Election or Appointment: 2012 Deputy Treasurer |
| Mr. Sadoski also serves as Deputy Treasurer of other funds. He is an employee of Fidelity Investments (2012-present) and has served in another fund officer role. Prior to joining Fidelity Investments, Mr. Sadoski served as an assistant chief accountant in the Division of Investment Management of the Securities and Exchange Commission (SEC) (2009-2012) and as a senior manager at Deloitte & Touche LLP (1997-2009). |
Stacie M. Smith (1974) |
Year of Election or Appointment: 2013 Deputy Treasurer |
| Ms. Smith also serves as an officer of other funds. She is an employee of Fidelity Investments (2009-present) and has served in other fund officer roles. Prior to joining Fidelity Investments, Ms. Smith served as Senior Audit Manager of Ernst & Young LLP (1996-2009). |
Renee Stagnone (1975) |
Year of Election or Appointment: 2013 Deputy Treasurer |
| Ms. Stagnone also serves as Deputy Treasurer of other funds. Ms. Stagnone is an employee of Fidelity Investments. |
Linda J. Wondrack (1964) |
Year of Election or Appointment: 2014 Chief Compliance Officer |
| Ms. Wondrack also serves as Chief Compliance Officer of other funds. Ms. Wondrack is Executive Vice President and head of the Ethics Office and Asset Management Compliance for Fidelity Investments (2012-present). Ms. Wondrack also serves as Chief Compliance Officer of Fidelity SelectCo, LLC (2014-present); Chief Compliance Officer of Impresa Management LLC (2013-present); and Chief Compliance Officer of FMR Co., Inc., Fidelity Investments Money Management, Inc., Fidelity Management & Research (Japan) Limited, Fidelity Management & Research (U.K.) Inc., Fidelity Management & Research (Hong Kong), Fidelity Management & Research Company, Pyramis Global Advisors, LLC, and Strategic Advisers, Inc., Ballyrock Investment Advisors LLC, and Northern Neck Investors LLC (2012-present). Previously, Ms. Wondrack served as Senior Vice President and Chief Compliance Officer for Columbia Management Investment Advisers, LLC (2005-2012); Chief Compliance Officer for certain funds within the Columbia Family of Funds (2007-2012); and Senior Vice President of Compliance Risk Management at Bank of America (2005-2010). |
Joseph F. Zambello (1957) |
Year of Election or Appointment: 2011 Deputy Treasurer |
| Mr. Zambello also serves as Deputy Treasurer of other funds. Mr. Zambello is an employee of Fidelity Investments. Previously, Mr. Zambello served as Vice President of FMR's Program Management Group (2009-2011) and Vice President of the Transfer Agent Oversight Group (2005-2009). |
Annual Report
The fund designates 19% of the dividends distributed during the fiscal year as qualifying for the dividends-received deduction for corporate shareholders.
The fund designates 100% of the dividends distributed in December 2013 during the fiscal year as amounts which may be taken into account as a dividend for the purposes of the maximum rate under section 1(h)(11) of the Internal Revenue Code.
The amounts per share which represent income derived from sources within, and taxes paid to, foreign countries or possessions of the United States are as follows:
| Pay Date | Income | Taxes |
International Value Fund | 12/09/2013 | $0.0559 | $0.0059 |
The fund will notify shareholders in January 2015 of amounts for use in preparing 2014 income tax returns.
Annual Report
Board Approval of Investment Advisory Contracts and Management Fees
Fidelity International Growth Fund
Each year, the Board of Trustees, including the Independent Trustees (together, the Board), votes on the renewal of the management contract with Fidelity Management & Research Company (FMR) and the sub-advisory agreements (together, the Advisory Contracts) for the fund. The Board, assisted by the advice of fund counsel and Independent Trustees' counsel, requests and considers a broad range of information relevant to the renewal of the Advisory Contracts throughout the year.
The Board meets regularly and, at each of its meetings, covers an extensive agenda of topics and materials and considers factors that are relevant to its annual consideration of the renewal of the fund's Advisory Contracts, including the services and support provided to the fund and its shareholders. The Board has established various standing committees (Committees), each composed of and chaired by Independent Trustees with varying backgrounds, to which the Board has assigned specific subject matter responsibilities in order to enhance effective decision-making by the Board. The Board, acting directly and through its Committees, requests and receives information concerning the annual consideration of the renewal of the fund's Advisory Contracts. The Board also meets as needed to consider matters specifically related to the Board's annual consideration of the renewal of the Advisory Contracts. Members of the Board may also meet with trustees of other Fidelity funds through ad hoc joint committees to discuss certain matters relevant to the Fidelity funds.
At its July 2014 meeting, the Board, including the Independent Trustees, unanimously determined to renew the fund's Advisory Contracts. In reaching its determination, the Board considered all factors it believed relevant, including (i) the nature, extent, and quality of the services to be provided to the fund and its shareholders (including the investment performance of the fund); (ii) the competitiveness of the fund's management fee and total expense ratio relative to peer funds; (iii) the total costs of the services to be provided by and the profits to be realized by Fidelity from its relationship with the fund; (iv) the extent to which economies of scale exist and would be realized as the fund grows; and (v) whether fee levels reflect these economies of scale, if any, for the benefit of fund shareholders. In connection with separate internal corporate reorganizations involving Fidelity Management & Research (U.K.) Inc. (FMR U.K.) and Fidelity Management & Research (Japan) Inc. (FMR Japan), the Board approved certain non-material amendments to the fund's sub-advisory agreements with FMR U.K. and FMR Japan to reflect that, after these reorganizations, FMR Investment Management (UK) Limited and Fidelity Management & Research (Japan) Limited will carry on the business of FMR U.K. and FMR Japan, respectively. The Board noted that no changes to the portfolio managers or to the foreign research or investment advisory services provided to the fund were expected in connection with either reorganization and that the same personnel and resources would continue to be available to the fund at the new entities.
Annual Report
Board Approval of Investment Advisory Contracts and
Management Fees - continued
In considering whether to renew the Advisory Contracts for the fund, the Board reached a determination, with the assistance of fund counsel and Independent Trustees' counsel and through the exercise of its business judgment, that the renewal of the Advisory Contracts was in the best interests of the fund and its shareholders and that the compensation payable under the Advisory Contracts was fair and reasonable. The Board's decision to renew the Advisory Contracts was not based on any single factor, but rather was based on a comprehensive consideration of all the information provided to the Board at its meetings throughout the year. The Board, in reaching its determination to renew the Advisory Contracts, was aware that shareholders of the fund have a broad range of investment choices available to them, including a wide choice among funds offered by Fidelity's competitors, and that the fund's shareholders, who have the opportunity to review and weigh the disclosure provided by the fund in its prospectus and other public disclosures, have chosen to invest in this fund, which is part of the Fidelity family of funds.
Nature, Extent, and Quality of Services Provided. The Board considered Fidelity's staffing as it relates to the fund, including the backgrounds of investment personnel of FMR and the sub-advisers (together, the Investment Advisers), and also considered the fund's investment objective, strategies, and related investment philosophy. The Independent Trustees also had discussions with senior management of Fidelity's investment operations and investment groups. The Board considered the structure of the portfolio manager compensation program and whether this structure provides appropriate incentives to act in the best interests of the fund. Additionally, the Board considered the portfolio managers' investments, if any, in the funds that they manage.
Resources Dedicated to Investment Management and Support Services. The Board and the Fund Oversight and Research Committees reviewed the general qualifications and capabilities of Fidelity's investment staff, including its size, education, experience, and resources, as well as Fidelity's approach to recruiting, training, managing, and compensating investment personnel. The Board noted that Fidelity has continued to increase the resources devoted to non-U.S. offices, including expansion of Fidelity's global investment organization. The Board also noted that Fidelity's analysts have extensive resources, tools and capabilities that allow them to conduct sophisticated quantitative and fundamental analysis, as well as credit analysis of issuers, counterparties and guarantors. Further, the Board believes that Fidelity's investment professionals have sufficient access to global information and data so as to provide competitive investment results over time, and that those professionals also have access to sophisticated tools that permit them to assess portfolio construction and risk and performance attribution characteristics continuously, as well as to transmit new information and research conclusions rapidly around the world. Additionally, in its deliberations, the Board considered Fidelity's trading and risk management capabilities and resources and global compliance infrastructure, which are an integral part of the investment management process.
Annual Report
Shareholder and Administrative Services. The Board considered (i) the nature, extent, quality, and cost of advisory, administrative, and shareholder services performed by the Investment Advisers and their affiliates under the Advisory Contracts and under separate agreements covering transfer agency, pricing and bookkeeping, and securities lending services for the fund; (ii) the nature and extent of the supervision of third party service providers, principally custodians and subcustodians; and (iii) the resources devoted to, and the record of compliance with, the fund's compliance policies and procedures. The Board also reviewed the allocation of fund brokerage, including allocations to brokers affiliated with the Investment Advisers, the use of brokerage commissions to pay fund expenses, and the use of "soft" commission dollars to pay for research services.
The Board noted that the growth of fund assets over time across the complex allows Fidelity to reinvest in the development of services designed to enhance the value or convenience of the Fidelity funds as investment vehicles. These services include 24-hour access to account information and market information through telephone representatives and over the Internet, investor education materials and asset allocation tools, and the expanded availability of Fidelity Investor Centers.
In 2014, the Board formed an ad hoc Committee on Transfer Agency Fees to review the variety of transfer agency fee structures throughout the industry and Fidelity's competitive positioning with respect to industry participants.
Investment in a Large Fund Family. The Board considered the benefits to shareholders of investing in a Fidelity fund, including the benefits of investing in a fund that is part of a large family of funds offering a variety of investment disciplines and providing a large variety of mutual fund investor services. The Board noted that Fidelity had taken, or had made recommendations that resulted in the Fidelity funds taking, a number of actions over the previous year that benefited particular funds, including (i) continuing to dedicate additional resources to investment research and to the support of the senior management team that oversees asset management; (ii) persisting in efforts to enhance Fidelity's global research capabilities; (iii) launching new funds and making other enhancements to meet client needs for income-oriented solutions; (iv) reducing fund expenses for certain index funds; (v) continuing to launch dedicated lower cost underlying funds to meet portfolio construction needs related to expanding underlying fund options for Fidelity funds of funds, specifically for the Freedom Fund product lines; (vi) rationalizing product lines and gaining increased efficiencies through fund mergers; (vii) launching sector-based exchange-traded funds and establishing a new Fidelity adviser to manage sector-based funds and products; (viii) continuing to develop and implement technology to improve security and increase efficiency; (ix) modifying the eligibility criteria for certain share classes to increase their marketability to a portion of the defined contribution plan market; (x) waiving redemption fees for certain qualified fund-of-fund and wrap programs and certain retirement plan transactions; and (xi) launching new Institutional Class shares of certain money market funds to attract and retain assets and to fill a gap in the money market fund lineup.
Annual Report
Board Approval of Investment Advisory Contracts and
Management Fees - continued
Investment Performance. The Board considered whether the fund has operated in accordance with its investment objective, as well as its record of compliance with its investment restrictions and its performance history.
The Board took into account discussions with the Investment Advisers about fund investment performance that occur at Board meetings throughout the year. In this regard the Board noted that as part of regularly scheduled fund reviews and other reports to the Board on fund performance, the Board periodically considers annualized return information for the fund, for different time periods, measured against a securities market index ("benchmark index") and a peer group of funds with similar objectives ("peer group"). In its evaluation of fund investment performance, the Board gave particular attention to information indicating changes in performance of certain Fidelity funds for specific time periods and the Investment Advisers' explanations for any overperformance or underperformance.
In addition to reviewing absolute and relative fund performance, the Independent Trustees periodically consider the appropriateness of fund performance metrics in evaluating the results achieved. In general, the Independent Trustees believe that fund performance should be evaluated based on net performance (after fees and expenses) of both the highest performing and lowest performing classes, where applicable, compared to appropriate benchmark indices, over appropriate time periods which may include full market cycles, and compared to peer groups, as applicable, over the same periods, taking into account relevant factors including the following: general market conditions; issuer-specific information; tactical opportunities for investment; and fund cash flows and other factors.
The Independent Trustees recognize that shareholders evaluate performance on a net basis over their own holding periods, for which one-, three-, and five-year periods are often used as a proxy. For this reason, the performance information reviewed by the Board also included net cumulative calendar year total return information for the fund and an appropriate benchmark index and peer group for the most recent one-, three-, and five-year periods, as shown below. Returns are shown compared to the 25th percentile (top of box, 75% beaten) and 75th percentile (bottom of box, 25% beaten) of the peer universe. Returns of the benchmark index are "net MA," i.e., adjusted for tax withholding rates applicable to U.S.-based funds organized as Massachusetts business trusts.
Annual Report
Fidelity International Growth Fund

The Board also considered that the fund's management fee is subject to upward or downward adjustment depending upon whether, and to what extent, the fund's investment performance for the performance period exceeds, or is exceeded by, a securities index, thus leading to a performance adjustment for the same period. The Board noted that the performance adjustment provides FMR with a strong economic incentive to seek to achieve superior performance for the fund's shareholders and helps to more closely align the interests of FMR and the fund's shareholders.
Based on its review, the Board concluded that the nature, extent, and quality of services provided to the fund under the Advisory Contracts should benefit the fund's shareholders.
Competitiveness of Management Fee and Total Expense Ratio. The Board considered the fund's management fee and total expense ratio compared to "mapped groups" of competitive funds and classes. Fidelity creates "mapped groups" by combining similar Lipper investment objective categories that have comparable investment mandates. Combining Lipper investment objective categories aids the Board's management fee and total expense ratio comparisons by broadening the competitive group used for comparison and by reducing the number of universes to which various Fidelity funds are compared.
Management Fee. The Board considered two proprietary management fee comparisons for the 12-month periods shown in the chart below. The group of Lipper funds used by the Board for management fee comparisons is referred to below as the "Total Mapped Group." The Total Mapped Group comparison focuses on a fund's standing in terms of gross management fees before expense reimbursements or caps, and without giving effect to the fund's performance adjustment, relative to the total universe of funds with comparable investment mandates, regardless of whether their management fee structures also are comparable. Funds with comparable investment mandates offer exposure to similar types of securities. Funds with comparable management fee structures have similar management fee contractual arrangements (e.g., flat rate charged for advisory services, all-inclusive fee rate, etc.). "TMG %" represents the percentage of funds in the Total Mapped Group that had management fees that were lower than the fund's. For example, a hypothetical TMG % of 20% would mean that 80% of the funds in the Total Mapped Group had higher, and 20% had lower, management fees than the fund. The fund's actual TMG %s are in the chart below. The "Asset-Size Peer Group" (ASPG) comparison focuses on a fund's standing relative to a subset of non-Fidelity funds within the Total Mapped Group that are similar in size and management fee structure. For example, if a fund is in the first quartile of the ASPG, the fund's management fee ranks in the least expensive or lowest 25% of funds in the ASPG. The ASPG represents at least 15% of the funds in the Total Mapped Group with comparable asset size and management fee structures, subject to a minimum of 50 funds (or all funds in the Total Mapped Group if fewer than 50). Additional information, such as the ASPG quartile in which the fund's management fee rate ranked and the impact of the fund's performance adjustment, is also included in the chart and considered by the Board.
Annual Report
Board Approval of Investment Advisory Contracts and
Management Fees - continued
Fidelity International Growth Fund
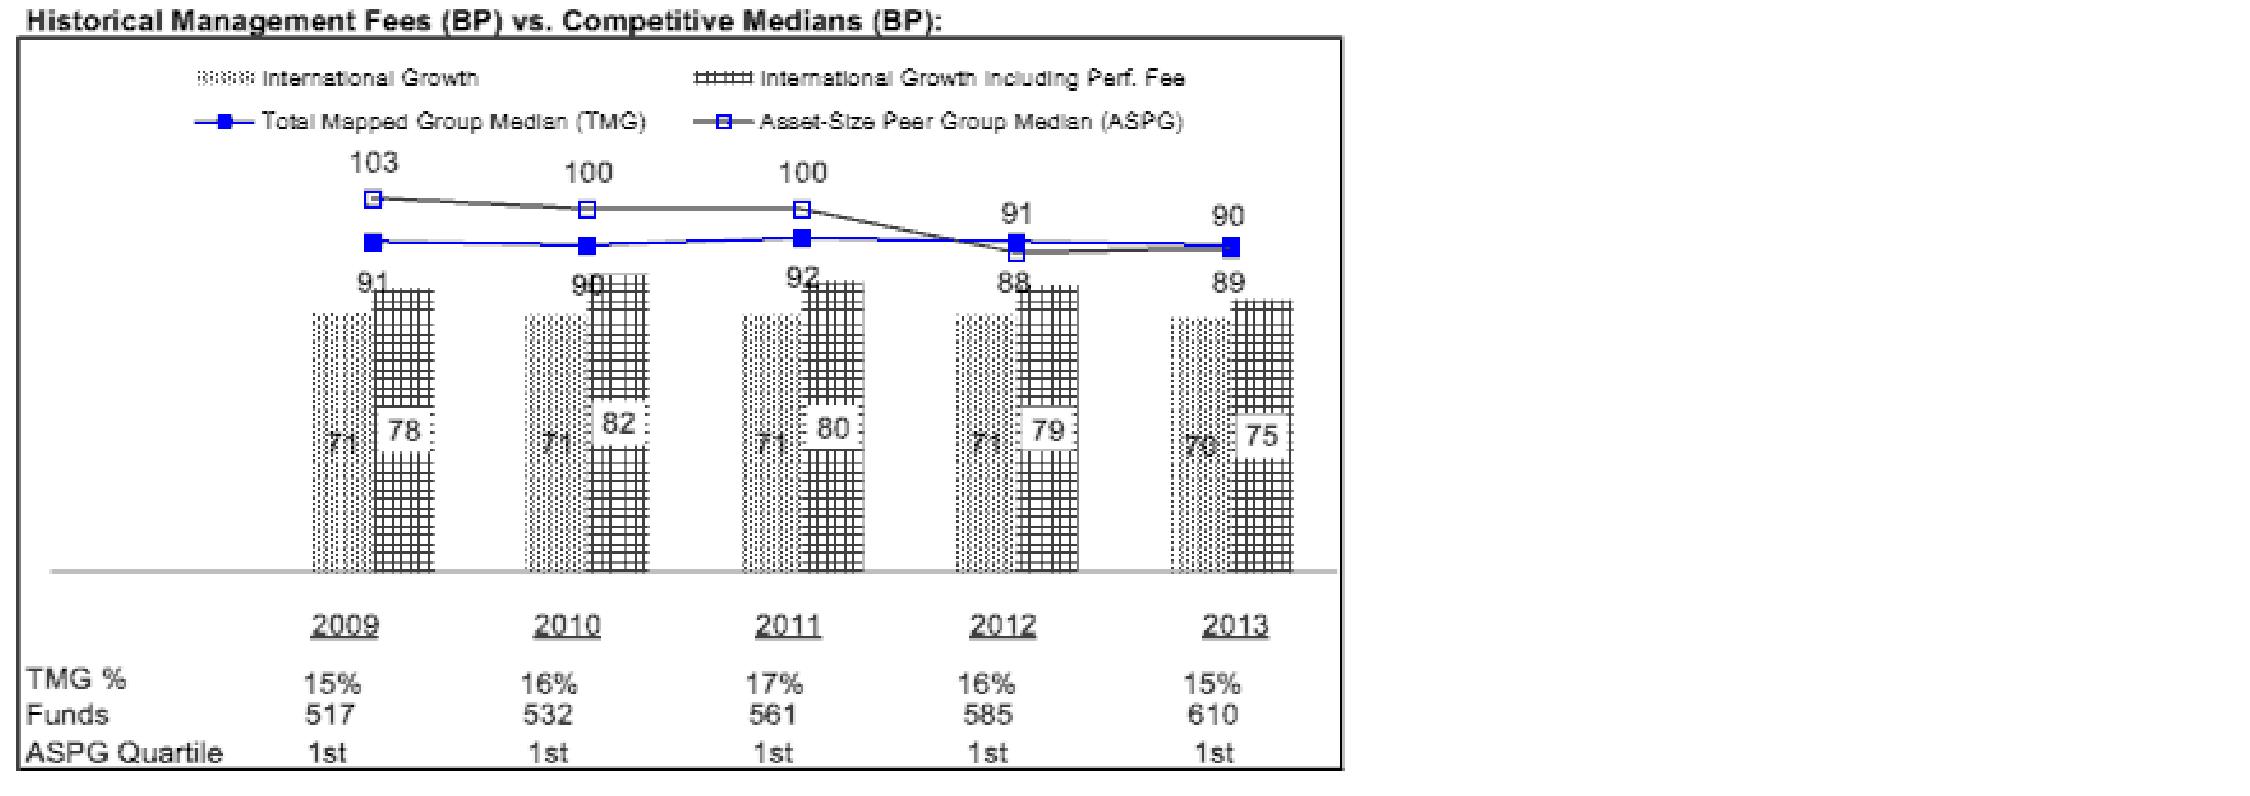
The Board noted that the fund's management fee rate ranked below the median of its Total Mapped Group and below the median of its ASPG for 2013. The Board also noted the effect of the fund's positive performance adjustment on the fund's management fee ranking.
Annual Report
The Board also noted that, in August 2013, the ad hoc Committee on Management Fees was formed to conduct an in-depth review of the management fee rates of Fidelity's active equity mutual funds. The Committee focused on the following areas: (i) standard fee structures; (ii) research consumption and trading evolution; (iii) management fee competitiveness/profitability by category; and (iv) factors that drive institutional pricing.
Based on its review, the Board concluded that the fund's management fee is fair and reasonable in light of the services that the fund receives and the other factors considered.
Total Expense Ratio. In its review of each class's total expense ratio, the Board considered the fund's management fee as well as other fund or class expenses, as applicable, such as transfer agent fees, pricing and bookkeeping fees, fund-paid 12b-1 fees, and custodial, legal, and audit fees. The Board also noted the effects of any waivers and reimbursements on fees and expenses, as well as the impact of the fund's performance adjustment. As part of its review, the Board also considered the current and historical total expense ratios of each class of the fund compared to competitive fund median expenses. Each class of the fund is compared to those funds and classes in the Total Mapped Group (used by the Board for management fee comparisons) that have a similar sales load structure.
The Board noted that the total expense ratio of each of Institutional Class, Class Z, and the retail class ranked below its competitive median for 2013, the total expense ratio of Class A ranked equal to its competitive median for 2013, and the total expense ratio of each of Class T, Class B, and Class C ranked above its competitive median for 2013.The Board considered that, in general, various factors can affect total expense ratios. The Board noted that the total expense ratio of Class T was above the competitive median primarily because of higher 12b-1 fees on Class T as compared to most competitor funds. Class T has a higher 12b-1 fee, but a lower front-end sales charge, than traditionally priced front-end sales charge classes. The Board considered that Class T is primarily sold load-waived in the retirement plan market where its 0.50% 12b-1 fee is comparable to competing no-load, higher 12b-1 fee classes designed specifically for retirement plans. The Board noted that the fund offers multiple classes, each of which has a different sales load and 12b-1 fee structure, and that the multiple structures are intended to offer a range of pricing options for the intermediary market. The Board also noted that the total expense ratios of the classes vary primarily by the level of their 12b-1 fees, although differences in transfer agent fees may also cause expenses to vary from class to class.
The Board further considered that FMR contractually agreed to reimburse Class A, Class T, Class B, Class C, Institutional Class, Class Z, and the retail class of the fund to the extent that total operating expenses (excluding interest, certain taxes, certain securities lending costs, brokerage commissions, extraordinary expenses, and acquired fund fees and expenses, if any), as a percentage of their respective average net assets, exceed 1.45%, 1.70%, 2.20%, 2.20%, 1.20%, 1.05%, and 1.20% through December 31, 2014.
Annual Report
Board Approval of Investment Advisory Contracts and
Management Fees - continued
Fees Charged to Other Fidelity Clients. The Board also considered Fidelity fee structures and other information with respect to clients of Fidelity, such as other funds advised or subadvised by Fidelity, pension plan clients, and other institutional clients. The Board noted the findings of the 2013 ad hoc joint committee (created with the board of other Fidelity funds), which reviewed and compared Fidelity's institutional investment advisory business with its business of providing services to the Fidelity funds, including the differences in services provided, fees charged, and costs incurred, as well as competition in their respective marketplaces.
Based on its review of total expense ratios and fees charged to other Fidelity clients, the Board concluded that the total expense ratio of each class of the fund was reasonable, although in some cases above the median of the universe presented for comparison, in light of the services that the fund and its shareholders receive and the other factors considered.
Costs of the Services and Profitability. The Board considered the revenues earned and the expenses incurred by Fidelity in conducting the business of developing, marketing, distributing, managing, administering and servicing the fund and servicing the fund's shareholders. The Board also considered the level of Fidelity's profits in respect of all the Fidelity funds.
On an annual basis, Fidelity presents to the Board Fidelity's profitability for the fund. Fidelity calculates the profitability for each fund, as well as aggregate profitability for groups of Fidelity funds and all Fidelity funds, using a series of detailed revenue and cost allocation methodologies which originate with the books and records of Fidelity on which Fidelity's audited financial statements are based. The Audit Committee of the Board reviews any significant changes from the prior year's methodologies.
PricewaterhouseCoopers LLP (PwC), independent registered public accounting firm and auditor to Fidelity and certain Fidelity funds, has been engaged annually by the Board as part of the Board's assessment of Fidelity's profitability analysis. PwC's engagement includes the review and assessment of the methodologies used by Fidelity in determining the revenues and expenses attributable to Fidelity's mutual fund business, and completion of agreed-upon procedures in respect of the mathematical accuracy of fund profitability and its conformity to established allocation methodologies. After considering PwC's reports issued under the engagement and information provided by Fidelity, the Board concluded that while other allocation methods may also be reasonable, Fidelity's profitability methodologies are reasonable in all material respects.
The Board also reviewed Fidelity's non-fund businesses and fall-out benefits related to the mutual fund business as well as cases where Fidelity's affiliates may benefit from or be related to the fund's business.
Annual Report
The Board considered the costs of the services provided by and the profits realized by Fidelity in connection with the operation of the fund and was satisfied that the profitability was not excessive in the circumstances.
Economies of Scale. The Board considered whether there have been economies of scale in respect of the management of the Fidelity funds, whether the Fidelity funds (including the fund) have appropriately benefited from any such economies of scale, and whether there is potential for realization of any further economies of scale. The Board considered the extent to which the fund will benefit from economies of scale through increased services to the fund, through waivers or reimbursements, or through fee or expense ratio reductions. The Board also noted that in 2013, it and the boards of other Fidelity funds created an ad hoc committee (the Economies of Scale Committee) to analyze whether Fidelity attains economies of scale in respect of the management and servicing of the Fidelity funds, whether the Fidelity funds have appropriately benefited from such economies of scale, and whether there is potential for realization of any further economies of scale.
The Board recognized that the fund's management contract incorporates a "group fee" structure, which provides for lower group fee rates as total group assets increase, and for higher group fee rates as total group assets decrease (with "group assets" defined to include fund assets under FMR's management plus sector fund assets previously under FMR's management and currently managed by Fidelity SelectCo, LLC). FMR calculates the group fee rates based on a tiered asset "breakpoint" schedule that varies based on asset class. The Board considered that the group fee is designed to deliver the benefits of economies of scale to fund shareholders when total Fidelity fund assets increase, even if assets of any particular fund are unchanged or have declined, because some portion of Fidelity's costs are attributable to services provided to all Fidelity funds, and all funds benefit if those costs can be allocated among more assets. The Board concluded that, given the group fee structure, fund shareholders will benefit from lower management fees as group assets increase at the fund complex level, regardless of whether Fidelity achieves any such economies of scale.
The Board concluded, taking into account the analysis of the Economies of Scale Committee, that economies of scale, if any, are being appropriately shared between fund shareholders and Fidelity.
Additional Information Requested by the Board. In order to develop fully the factual basis for consideration of the Fidelity funds' Advisory Contracts, the Board requested and received additional information on certain topics, including: (i) fund performance trends and Fidelity's long-term strategies for certain funds; (ii) Fidelity's strategic marketing and product lineup goals; (iii) the methodology with respect to competitive fund data and peer group classifications; (iv) the arrangements with, and performance of, certain sub-advisers on behalf of the Fidelity funds, as well as certain proposed participating affiliate arrangements; (v) the realization of fall-out benefits in certain Fidelity business units; (vi) Fidelity's group fee structures, including the rationale for the individual fee rates of certain categories of funds and the definition of group assets; (vii) trends regarding industry use of performance fee structures and the performance adjustment methodologies applicable to the Fidelity funds; (viii) additional competitive analysis regarding the total expenses for certain classes; (ix) fund profitability methodology, including Fidelity's cost allocation methodology, and the impact of certain factors on fund profitability results; and (x) the process by which Fidelity determines sub-advisory fees for funds it advises.
Annual Report
Board Approval of Investment Advisory Contracts and
Management Fees - continued
Based on its evaluation of all of the conclusions noted above, and after considering all factors it believed relevant, the Board ultimately concluded that the advisory fee structures are fair and reasonable, and that the fund's Advisory Contracts should be renewed.
Annual Report
Investment Adviser
Fidelity Management & Research Company
Boston, MA
Investment Sub-Advisers
FMR Co., Inc.
Fidelity Management & Research
(U.K.) Inc.
Fidelity Management & Research
(Hong Kong) Limited
Fidelity Management & Research
(Japan) Limited
FIL Investment Advisors
FIL Investments (Japan) Limited
FIL Investment Advisors (U.K.) Ltd.
General Distributor
Fidelity Distributors Corporation
Smithfield, RI
Transfer and Service Agent
Fidelity Investments Institutional
Operations Company, Inc.
Boston, MA
Fidelity Service Company, Inc.
Boston, MA
Custodian
State Street Bank and Trust Company
Quincy, MA
The Fidelity Telephone Connection
Mutual Fund 24-Hour Service
Exchanges/Redemptions
and Account Assistance 1-800-544-6666
Product Information 1-800-544-8888
Retirement Accounts 1-800-544-4774
(8 a.m. - 9 p.m.)
TDD Service 1-800-544-0118
for the deaf and hearing impaired
(9 a.m. - 9 p.m. Eastern time)
Fidelity Automated Service
Telephone (FAST®)
1-800-544-5555
Automated line for quickest service
(Fidelity Investment logo)(registered trademark)
Corporate Headquarters
245 Summer St., Boston, MA 02210
www.fidelity.com
IGF-UANN-1214
1.912349.104
(Fidelity Investment logo)(registered trademark)
Fidelity Advisor®
International Small Cap
Fund - Class A, Class T, Class B
and Class C
Annual Report
October 31, 2014
(Fidelity Cover Art)
Class A, Class T, Class B, and
Class C are classes of Fidelity®
International Small Cap Fund
Contents
Performance | (Click Here) | How the fund has done over time. |
Management's Discussion of Fund Performance | (Click Here) | The Portfolio Manager's review of fund performance and strategy. |
Shareholder Expense Example | (Click Here) | An example of shareholder expenses. |
Investment Changes | (Click Here) | A summary of major shifts in the fund's investments over the past six months. |
Investments | (Click Here) | A complete list of the fund's investments with their market values. |
Financial Statements | (Click Here) | Statements of assets and liabilities, operations, and changes in net assets, as well as financial highlights. |
Notes | (Click Here) | Notes to financial statements. |
Report of Independent Registered Public Accounting Firm | (Click Here) | |
Trustees and Officers | (Click Here) | |
Distributions | (Click Here) | |
Proxy Voting Results | (Click Here) | |
Board Approval of Investment Advisory Contracts and Management Fees | (Click Here) | |
To view a fund's proxy voting guidelines and proxy voting record for the 12-month period ended June 30, visit http://www.fidelity.com/proxyvotingresults or visit the Securities and Exchange Commission's (SEC) web site at http://www.sec.gov. You may also call 1-877-208-0098 to request a free copy of the proxy voting guidelines.
Standard & Poor's, S&P and S&P 500 are registered service marks of The McGraw-Hill Companies, Inc. and have been licensed for use by Fidelity Distributors Corporation.
Other third-party marks appearing herein are the property of their respective owners.
All other marks appearing herein are registered or unregistered trademarks or service marks of FMR LLC or an affiliated company. © 2014 FMR LLC. All rights reserved.
Annual Report
This report and the financial statements contained herein are submitted for the general information of the shareholders of the fund. This report is not authorized for distribution to prospective investors in the fund unless preceded or accompanied by an effective prospectus.
A fund files its complete schedule of portfolio holdings with the SEC for the first and third quarters of each fiscal year on Form N-Q. Forms N-Q are available on the SEC's web site at http://www.sec.gov. A fund's Forms N-Q may be reviewed and copied at the SEC's Public Reference Room in Washington, DC. Information regarding the operation of the SEC's Public Reference Room may be obtained by calling 1-800-SEC-0330. For a complete list of a fund's portfolio holdings, view the most recent holdings listing, semiannual report, or annual report on Fidelity's web site at http://www.fidelity.com, http://www.advisor.fidelity.com, or http://www.401k.com, as applicable.
NOT FDIC INSURED • MAY LOSE VALUE • NO BANK GUARANTEE
Neither the fund nor Fidelity Distributors Corporation is a bank.
Annual Report
Average annual total return reflects the change in the value of an investment, assuming reinvestment of the class' distributions from dividend income and capital gains (the profits earned upon the sale of securities that have grown in value, if any) and assuming a constant rate of performance each year. The $10,000 table and the fund's returns do not reflect the deduction of taxes that a shareholder would pay on fund distributions or the redemption of fund shares. During periods of reimbursement by Fidelity, a fund's total return will be greater than it would be had the reimbursement not occurred. How a fund did yesterday is no guarantee of how it will do tomorrow. Returns reflect the conversion of Class B shares to Class A shares after a maximum of seven years.
Average Annual Total Returns
Periods ended October 31, 2014 | Past 1
year | Past 5
years | Past 10
years |
Class A (incl. 5.75% sales charge)† | -8.38% | 9.00% | 8.07% |
Class T (incl. 3.50% sales charge)† | -6.39% | 9.23% | 8.05% |
Class B (incl. contingent deferred sales charge) A,† | -8.25% | 9.18% | 8.14% |
Class C (incl. contingent deferred sales charge) B,† | -4.37% | 9.49% | 7.92% |
A Class B shares' contingent deferred sales charges included in the past one year, past five years, and past ten years total return figures are 5%, 2%, and 0%, respectively.
B Class C shares' contingent deferred sales charges included in the past one year, past five years, and past ten years total return figures are 1%, 0%, and 0%, respectively.
† Prior to April 1, 2014, the fund compared its performance to a different benchmark. The fund's historical performance may not represent its current investment policies.
Annual Report
$10,000 Over 10 Years
Let's say hypothetically that $10,000 was invested in Fidelity Advisor® International Small Cap Fund - Class A on October 31, 2004, and the current 5.75% sales charge was paid. The chart shows how the value of your investment would have changed, and also shows how the MSCI ACWI (All Country World Index) ex USA Small Cap Index and MSCI EAFE Small Cap Index performed over the same period.
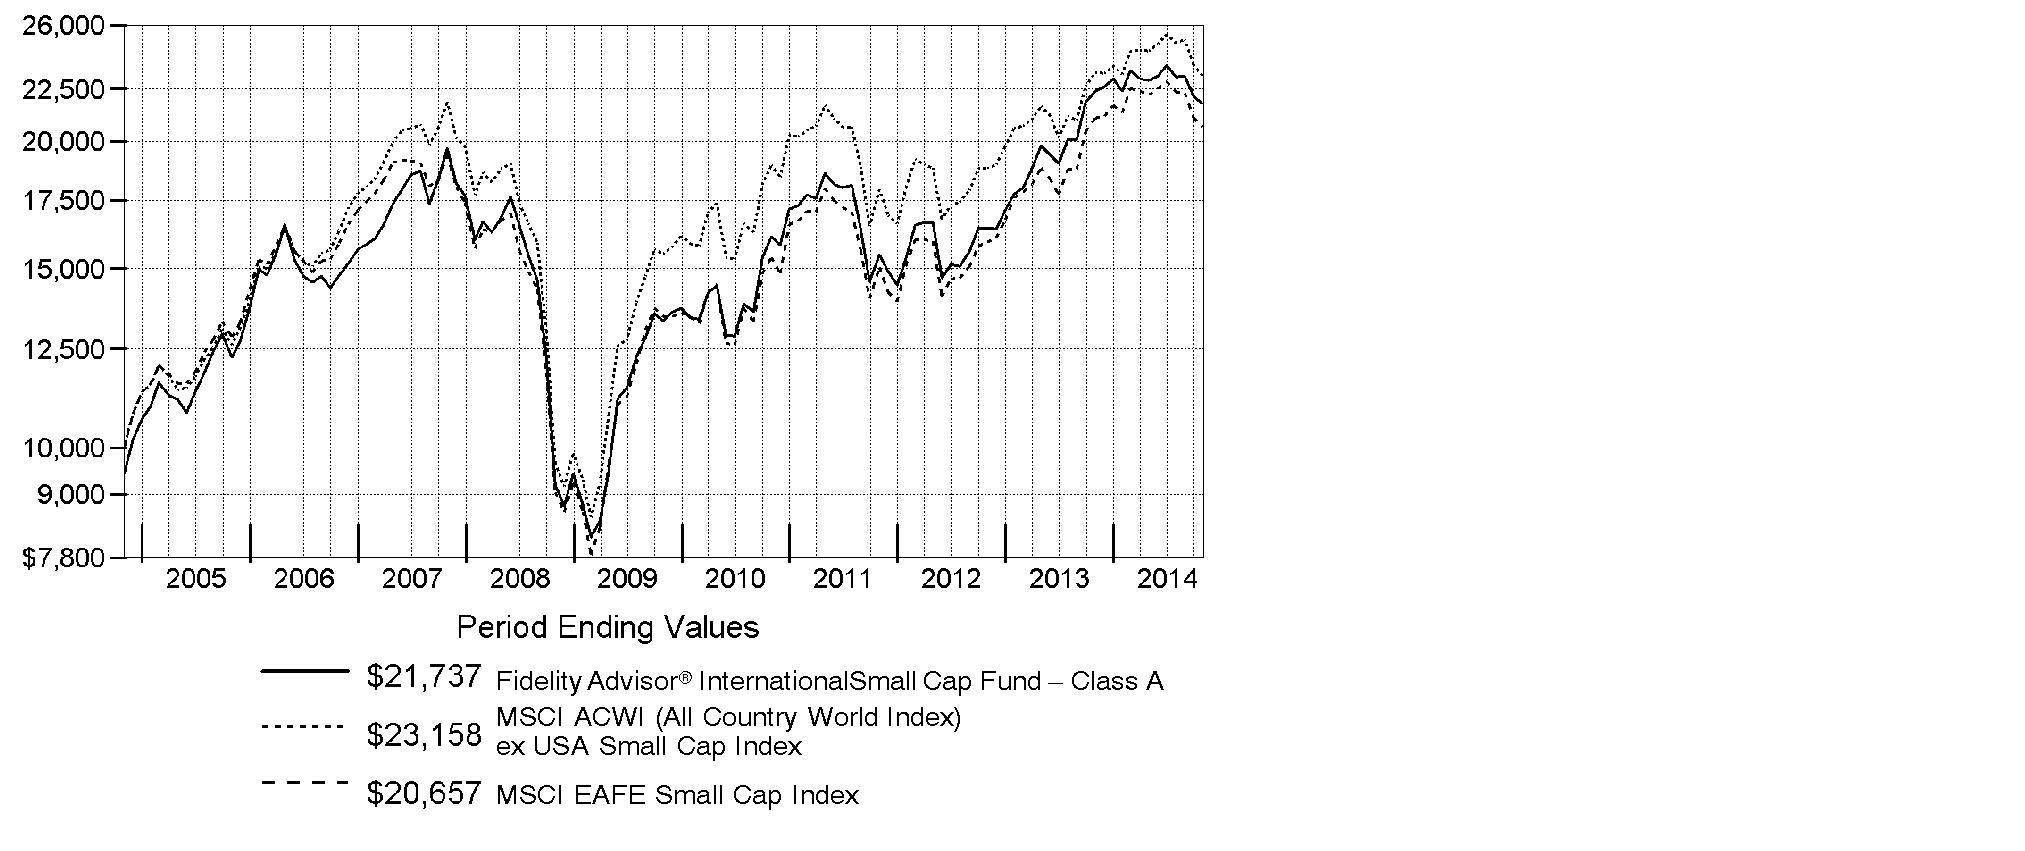
Effective April 1, 2014, the fund began comparing its performance to the MSCI ACWI (All Country World Index) ex USA Small Cap Index rather than the MSCI EAFE Small Cap Index because the MSCI ACWI (All Country World Index) ex USA Small Cap Index provides a more appropriate performance comparison for the fund.
Annual Report
Market Recap: Global equities posted a healthy gain for the 12 months ending October 31, 2014, overcoming an October market decline driven by recessionary pressures in China and tepid growth in Europe. The MSCI ACWI (All Country World Index) Index rose 8.15%, helped by subdued market volatility for much of the period and supported by solid corporate earnings, especially in the United States. Stocks also benefited from easy monetary policies in Japan and the eurozone, as well as increased stimulus efforts in China. All but three of the 24 industry groups that compose the index marked a positive return. The U.S. (+17%) remained a pillar of strength, while a strongly rising dollar in the latter part of the period detracted from investors' returns in most non-U.S. markets. Canada (+5%) notched broad gains outside of its energy and materials sectors, as did Asia-Pacific ex Japan (+4%), led by investor enthusiasm for companies in India. The U.K., Europe and Japan, meanwhile, all underperformed. Among sectors, health care (+24%) led the index, with a strong contribution from the pharmaceuticals, biotechnology & life sciences industry. Information technology (+21%) also outperformed. Conversely, materials (-4%) and energy (-1%) lagged the index due to a higher supply of and lower demand for commodities.
Comments from Samuel Chamovitz, who became Portfolio Manager of Fidelity Advisor® International Small Cap Fund on March 1, 2014: For the year, the fund's Class A, Class T, Class B and Class C shares returned -2.79%, -3.00%, -3.52% and -3.43%, respectively (excluding sales charges), trailing the -0.79% return of the MSCI ACWI (All Country World Index) ex USA Small Cap Index, which became the fund's primary benchmark on April 1, 2014, and the -1.91% result of the old benchmark, the MSCI EAFE Small Cap Index. Additionally, the fund's performance fell short of the 0.29% return of a linked index combining the returns of the MSCI EAFE Small Cap Index, with which the fund was compared through March, and the new MSCI benchmark, with which the fund was compared during the period's final seven months. The fund's benchmark was changed to reflect a broadened investment focus. Stock selection in Japan meaningfully weighed on the fund's relative results. A sizable overweighting in Japanese utility Hokkaido Electric Power was by far the biggest relative detractor. GFK, a Luxembourg-based consumer research provider, also hampered performance. Both detractors I mentioned were sold from the fund. Conversely, the top relative contributor was a non-index position in Japan-based home furnishings retailer Nitori Holdings.
The views expressed above reflect those of the portfolio manager(s) only through the end of the period as stated on the cover of this report and do not necessarily represent the views of Fidelity or any other person in the Fidelity organization. Any such views are subject to change at any time based upon market or other conditions and Fidelity disclaims any responsibility to update such views. These views may not be relied on as investment advice and, because investment decisions for a Fidelity fund are based on numerous factors, may not be relied on as an indication of trading intent on behalf of any Fidelity fund.
Annual Report
Shareholder Expense Example
As a shareholder of the Fund, you incur two types of costs: (1) transaction costs, including sales charges (loads) on purchase payments or redemption proceeds, redemption fees and (2) ongoing costs, including management fees, distribution and/or service (12b-1) fees and other Fund expenses. This Example is intended to help you understand your ongoing costs (in dollars) of investing in the Fund and to compare these costs with the ongoing costs of investing in other mutual funds.
The Example is based on an investment of $1,000 invested at the beginning of the period and held for the entire period (May 1, 2014 to October 31, 2014).
Actual Expenses
The first line of the accompanying table for each class of the Fund provides information about actual account values and actual expenses. You may use the information in this line, together with the amount you invested, to estimate the expenses that you paid over the period. Simply divide your account value by $1,000.00 (for example, an $8,600 account value divided by $1,000.00 = 8.6), then multiply the result by the number in the first line for a class of the Fund under the heading entitled "Expenses Paid During Period" to estimate the expenses you paid on your account during this period. A small balance maintenance fee of $12.00 that is charged once a year may apply for certain accounts with a value of less than $2,000. This fee is not included in the table below. If it was, the estimate of expenses you paid during the period would be higher, and your ending account value lower, by this amount. In addition, the Fund, as a shareholder in the underlying Fidelity Central Funds, will indirectly bear its pro-rata share of the fees and expenses incurred by the underlying Fidelity Central Funds. These fees and expenses are not included in the Fund's annualized expense ratio used to calculate the expense estimate in the table below.
Hypothetical Example for Comparison Purposes
The second line of the accompanying table for each class of the Fund provides information about hypothetical account values and hypothetical expenses based on a Class' actual expense ratio and an assumed rate of return of 5% per year before expenses, which is not the Class' actual return. The hypothetical account values and expenses may not be used to estimate the actual ending account balance or expenses you paid for the period. You may use this information to compare the ongoing costs of investing in the Fund and other funds. To do so, compare this 5% hypothetical example with the 5% hypothetical examples that appear in the shareholder reports of the other funds. A small balance maintenance fee of $12.00 that is charged once a year may apply for certain accounts with a value of less than $2,000. This fee is not included in the table below. If it was, the estimate of expenses you paid during the period would be higher, and your ending account value lower, by this amount. In addition, the Fund, as a shareholder in the underlying Fidelity Central Funds, will indirectly bear its pro-rata share of the fees and expenses incurred by the underlying Fidelity Central Funds. These fees and expenses are not included in the Fund's annualized expense ratio used to calculate the expense estimate in the table below.
Please note that the expenses shown in the table are meant to highlight your ongoing costs only and do not reflect any transaction costs. Therefore, the second line of the table is useful in comparing ongoing costs only, and will not help you determine the relative total costs of owning different funds. In addition, if these transactional costs were included, your costs would have been higher.
Annual Report
| Annualized
Expense Ratio B | Beginning
Account Value
May 1, 2014 | Ending
Account Value
October 31, 2014 | Expenses Paid
During Period*
May 1, 2014
to October 31, 2014 |
Class A | 1.49% | | | |
Actual | | $ 1,000.00 | $ 947.30 | $ 7.31 |
HypotheticalA | | $ 1,000.00 | $ 1,017.69 | $ 7.58 |
Class T | 1.75% | | | |
Actual | | $ 1,000.00 | $ 946.20 | $ 8.58 |
HypotheticalA | | $ 1,000.00 | $ 1,016.38 | $ 8.89 |
Class B | 2.23% | | | |
Actual | | $ 1,000.00 | $ 943.80 | $ 10.93 |
HypotheticalA | | $ 1,000.00 | $ 1,013.96 | $ 11.32 |
Class C | 2.21% | | | |
Actual | | $ 1,000.00 | $ 944.00 | $ 10.83 |
HypotheticalA | | $ 1,000.00 | $ 1,014.06 | $ 11.22 |
International Small Cap | 1.19% | | | |
Actual | | $ 1,000.00 | $ 948.70 | $ 5.85 |
HypotheticalA | | $ 1,000.00 | $ 1,019.21 | $ 6.06 |
Institutional Class | 1.08% | | | |
Actual | | $ 1,000.00 | $ 949.40 | $ 5.31 |
HypotheticalA | | $ 1,000.00 | $ 1,019.76 | $ 5.50 |
A 5% return per year before expenses
B Annualized expense ratio reflects expenses net of applicable fee waivers.
* Expenses are equal to each Class' annualized expense ratio, multiplied by the average account value over the period, multiplied by 184/365 (to reflect the one-half year period).
Annual Report
Investment Changes (Unaudited)
Geographic Diversification (% of fund's net assets) |
As of October 31, 2014 |
 | Japan 21.2% | |
 | United Kingdom 16.9% | |
 | United States of America* 5.7% | |
 | Australia 5.4% | |
 | Switzerland 4.3% | |
 | Canada 4.2% | |
 | France 3.5% | |
 | Germany 3.4% | |
 | Cayman Islands 3.2% | |
 | Other 32.2% | |

* Includes Short-Term Investments and Net Other Assets (Liabilities). |
Percentages are based on country or territory of incorporation and are adjusted for the effect of futures contracts, if applicable. |
As of April 30, 2014 |
| Japan 19.0% | |
| United Kingdom 16.1% | |
| United States of America* 9.8% | |
| Germany 6.1% | |
| France 5.6% | |
| Australia 5.0% | |
| Cayman Islands 3.7% | |
| Bermuda 3.6% | |
| Switzerland 2.8% | |
| Other 28.3% | |

* Includes Short-Term Investments and Net Other Assets (Liabilities). |
Percentages are based on country or territory of incorporation and are adjusted for the effect of futures contracts, if applicable. |
Asset Allocation as of October 31, 2014 |
| % of fund's
net assets | % of fund's net assets
6 months ago |
Stocks | 95.5 | 91.4 |
Bonds | 0.0 | 0.2 |
Investment Companies | 0.0 | 4.5 |
Short-Term Investments and Net Other Assets (Liabilities) | 4.5 | 3.9 |
Top Ten Stocks as of October 31, 2014 |
| % of fund's
net assets | % of fund's net assets
6 months ago |
Tsuruha Holdings, Inc. (Japan, Food & Staples Retailing) | 2.2 | 1.5 |
Ultra Electronics Holdings PLC (United Kingdom, Aerospace & Defense) | 1.3 | 1.0 |
Close Brothers Group PLC (United Kingdom, Capital Markets) | 1.3 | 1.0 |
Dillard's, Inc. Class A (United States of America, Multiline Retail) | 1.2 | 0.9 |
EBOS Group Ltd. (New Zealand, Health Care Providers & Services) | 1.2 | 0.9 |
Nitori Holdings Co. Ltd. (Japan, Specialty Retail) | 1.1 | 1.1 |
Clicks Group Ltd. (South Africa, Food & Staples Retailing) | 1.1 | 0.9 |
Moneysupermarket.com Group PLC (United Kingdom, Internet Software & Services) | 1.0 | 1.1 |
Jyske Bank A/S (Reg.) (Denmark, Banks) | 1.0 | 0.5 |
Pargesa Holding SA (Switzerland, Diversified Financial Services) | 0.9 | 0.9 |
| 12.3 | |
Market Sectors as of October 31, 2014 |
| % of fund's
net assets | % of fund's net assets
6 months ago |
Industrials | 19.4 | 18.6 |
Financials | 18.8 | 17.9 |
Consumer Discretionary | 15.8 | 15.6 |
Information Technology | 11.1 | 11.4 |
Materials | 8.4 | 9.0 |
Health Care | 7.9 | 7.4 |
Consumer Staples | 7.7 | 5.2 |
Energy | 5.2 | 5.6 |
Telecommunication Services | 0.8 | 0.6 |
Utilities | 0.4 | 0.3 |
Annual Report
Investments October 31, 2014
Showing Percentage of Net Assets
Common Stocks - 95.5% |
| Shares | | Value |
Australia - 5.4% |
Austal Ltd. (a) | 3,396,893 | | $ 3,834,820 |
Bradken Ltd. | 1,369,055 | | 4,670,117 |
Challenger Ltd. | 845,650 | | 5,201,309 |
Charter Hall Group unit | 1,196,020 | | 4,604,097 |
GUD Holdings Ltd. (d) | 1,213,118 | | 7,678,736 |
iiNet Ltd. | 455,468 | | 3,214,157 |
Imdex Ltd. (a) | 7,363,809 | | 3,899,196 |
Life Healthcare Group Ltd. | 1,826,612 | | 3,657,331 |
Nanosonics Ltd. (a) | 1,455,582 | | 1,255,061 |
RCG Corp. Ltd. | 2,518,231 | | 1,362,204 |
Slater & Gordon Ltd. | 1,258,177 | | 6,797,893 |
SomnoMed Ltd. (a) | 584,445 | | 1,273,029 |
Vision Group Holdings Ltd. | 1,221,604 | | 809,573 |
TOTAL AUSTRALIA | | 48,257,523 |
Austria - 1.1% |
Andritz AG | 106,312 | | 5,131,822 |
RHI AG | 195,100 | | 4,998,589 |
TOTAL AUSTRIA | | 10,130,411 |
Bailiwick of Jersey - 1.1% |
Kennedy Wilson Europe Real Estate PLC | 236,185 | | 3,929,382 |
Regus PLC (d) | 2,000,300 | | 6,313,363 |
TOTAL BAILIWICK OF JERSEY | | 10,242,745 |
Belgium - 1.3% |
Barco NV | 94,703 | | 6,978,211 |
Econocom Group SA | 735,085 | | 4,748,640 |
TOTAL BELGIUM | | 11,726,851 |
Bermuda - 2.9% |
APT Satellite Holdings Ltd. | 2,096,000 | | 3,051,814 |
BW Offshore Ltd. | 5,156,413 | | 6,322,291 |
Hiscox Ltd. | 604,895 | | 6,589,700 |
Petra Diamonds Ltd. (a) | 1,917,200 | | 5,091,128 |
STELUX Holdings International | 5,614,000 | | 1,245,301 |
Travelport Worldwide Ltd. (d) | 265,100 | | 3,830,695 |
TOTAL BERMUDA | | 26,130,929 |
British Virgin Islands - 0.2% |
Mail.Ru Group Ltd. GDR (Reg. S) (a) | 72,524 | | 1,757,982 |
Canada - 4.2% |
Constellation Software, Inc. | 18,966 | | 5,342,891 |
Common Stocks - continued |
| Shares | | Value |
Canada - continued |
Dorel Industries, Inc. Class B (sub. vtg.) | 104,700 | | $ 3,253,266 |
Genesis Land Development Corp. | 886,300 | | 3,483,704 |
Jean Coutu Group, Inc. Class A (sub. vtg.) | 319,160 | | 7,317,417 |
Lassonde Industries, Inc. Class A (sub. vtg.) | 26,600 | | 2,912,653 |
McCoy Global, Inc. | 244,300 | | 1,036,116 |
ShawCor Ltd. Class A | 154,929 | | 6,825,096 |
Whitecap Resources, Inc. (d) | 585,981 | | 7,585,700 |
TOTAL CANADA | | 37,756,843 |
Cayman Islands - 3.2% |
AMVIG Holdings Ltd. | 11,576,000 | | 5,420,308 |
Bonjour Holdings Ltd. | 47,792,800 | | 6,048,786 |
China High Precision Automation Group Ltd. (a) | 712,000 | | 27,543 |
China Metal Recycling (Holdings) Ltd. (a) | 436,800 | | 1 |
Lifestyle International Holdings Ltd. | 3,661,500 | | 6,956,149 |
Pico Far East Holdings Ltd. | 18,482,000 | | 4,577,046 |
SITC International Holdings Co. Ltd. | 10,248,000 | | 5,459,089 |
TOTAL CAYMAN ISLANDS | | 28,488,922 |
Chile - 0.5% |
Quinenco SA | 2,290,914 | | 4,757,642 |
Denmark - 1.0% |
Jyske Bank A/S (Reg.) (a) | 161,979 | | 8,726,876 |
Finland - 1.9% |
Amer Group PLC (A Shares) | 297,916 | | 5,700,802 |
Kemira Oyj | 358,900 | | 4,632,482 |
Rakentajain Konevuokraamo Oyj (B Shares) (d) | 173,356 | | 2,522,169 |
Tikkurila Oyj | 205,600 | | 4,246,033 |
TOTAL FINLAND | | 17,101,486 |
France - 3.5% |
ALTEN | 112,000 | | 4,788,838 |
Faurecia SA | 119,873 | | 3,874,144 |
Parrot SA (a) | 192,714 | | 3,656,303 |
Sopra Group SA | 61,000 | | 4,572,005 |
The Lisi Group | 170,500 | | 4,275,378 |
The Vicat Group | 93,298 | | 6,378,958 |
Wendel SA | 39,952 | | 4,402,791 |
TOTAL FRANCE | | 31,948,417 |
Germany - 3.4% |
AURELIUS AG | 158,535 | | 5,507,081 |
Common Stocks - continued |
| Shares | | Value |
Germany - continued |
CompuGroup Medical AG | 239,549 | | $ 5,493,492 |
GEA Group AG | 170,762 | | 7,852,378 |
LEG Immobilien AG | 75,836 | | 5,231,615 |
LEONI AG | 82,747 | | 4,733,649 |
SHW Group | 49,128 | | 2,236,032 |
TOTAL GERMANY | | 31,054,247 |
Greece - 0.8% |
Metka SA | 359,600 | | 3,514,935 |
Motor Oil (HELLAS) Corinth Refineries SA | 552,490 | | 4,043,341 |
TOTAL GREECE | | 7,558,276 |
Hong Kong - 1.9% |
Dah Sing Banking Group Ltd. | 3,094,000 | | 5,621,581 |
Far East Horizon Ltd. | 3,161,000 | | 2,939,913 |
Magnificent Estates Ltd. (a) | 91,044,000 | | 4,342,986 |
Singamas Container Holdings Ltd. | 3,360,000 | | 580,876 |
Techtronic Industries Co. Ltd. | 1,184,500 | | 3,708,198 |
TOTAL HONG KONG | | 17,193,554 |
India - 0.7% |
McLeod Russel India Ltd. | 748,354 | | 3,168,801 |
Shriram Transport Finance Co. Ltd. | 186,687 | | 2,887,986 |
TOTAL INDIA | | 6,056,787 |
Ireland - 1.7% |
C&C Group PLC | 1,099,500 | | 4,896,838 |
Mincon Group PLC | 3,000,521 | | 2,782,476 |
United Drug PLC (United Kingdom) | 1,479,749 | | 7,792,673 |
TOTAL IRELAND | | 15,471,987 |
Isle of Man - 0.6% |
Lamprell PLC (a) | 2,352,546 | | 5,522,742 |
Israel - 0.8% |
Frutarom Industries Ltd. | 283,210 | | 7,030,974 |
Italy - 1.0% |
Danieli & C. Officine Meccaniche SpA | 180,697 | | 4,211,792 |
Prysmian SpA | 263,900 | | 4,563,747 |
TOTAL ITALY | | 8,775,539 |
Japan - 21.2% |
A/S One Corp. | 128,900 | | 3,683,560 |
Common Stocks - continued |
| Shares | | Value |
Japan - continued |
ACOM Co. Ltd. (a) | 461,000 | | $ 1,536,627 |
Aeon Delight Co. Ltd. | 146,700 | | 3,583,755 |
Ain Pharmaciez, Inc. | 136,300 | | 3,692,400 |
Arc Land Sakamoto Co. Ltd. | 172,100 | | 3,836,649 |
Asahi Co. Ltd. | 239,400 | | 2,661,849 |
Broadleaf Co. Ltd. | 471,200 | | 7,447,388 |
Daiwa Industries Ltd. | 446,000 | | 3,400,792 |
Fuji Corp. | 147,800 | | 1,523,684 |
Fukuda Denshi Co. Ltd. | 148,400 | | 7,595,265 |
GMO Internet, Inc. | 676,800 | | 5,682,740 |
Higashi Nihon House Co. Ltd. (d) | 1,224,500 | | 5,189,887 |
Hoshizaki Electric Co. Ltd. | 92,000 | | 4,456,265 |
Iida Group Holdings Co. Ltd. | 325,351 | | 3,615,353 |
JSR Corp. | 479,800 | | 8,640,363 |
KAWAI Musical Instruments Manufacturing Co. Ltd. | 234,400 | | 4,407,999 |
Kinugawa Rubber Industrial Co. Ltd. | 601,000 | | 2,547,457 |
Kotobuki Spirits Co. Ltd. | 87,700 | | 1,744,625 |
Leopalace21 Corp. (a) | 1,288,500 | | 8,070,463 |
Meitec Corp. | 164,700 | | 5,164,819 |
Miraca Holdings, Inc. | 139,600 | | 5,860,332 |
Mitani Shoji Co. Ltd. | 234,300 | | 5,943,325 |
Nitori Holdings Co. Ltd. | 155,300 | | 9,842,226 |
Paramount Bed Holdings Co. Ltd. | 182,000 | | 5,176,488 |
Ricoh Leasing Co. Ltd. | 258,900 | | 7,223,343 |
San-Ai Oil Co. Ltd. | 740,000 | | 5,122,345 |
Ship Healthcare Holdings, Inc. | 94,400 | | 2,209,544 |
TFP Consulting Group Co. Ltd. | 171,500 | | 5,003,205 |
TKC Corp. | 354,500 | | 6,959,278 |
Tokyo Ohka Kogyo Co. Ltd. | 166,400 | | 4,693,072 |
Toshiba Plant Systems & Services Corp. | 390,500 | | 6,536,302 |
Toyo Suisan Kaisha Ltd. | 195,000 | | 6,734,567 |
Tsuruha Holdings, Inc. | 340,600 | | 20,109,285 |
Uchiyama Holdings Co. Ltd. | 451,600 | | 2,622,789 |
VT Holdings Co. Ltd. | 1,240,900 | | 4,900,603 |
Welcia Holdings Co. Ltd. (d) | 110,400 | | 3,688,167 |
TOTAL JAPAN | | 191,106,811 |
Korea (South) - 1.9% |
Hy-Lok Corp. | 120,010 | | 3,255,906 |
KEPCO Plant Service & Engineering Co. Ltd. | 77,030 | | 6,287,461 |
Koh Young Technology, Inc. | 104,779 | | 3,218,133 |
Common Stocks - continued |
| Shares | | Value |
Korea (South) - continued |
Soulbrain Co. Ltd. | 69,713 | | $ 1,751,836 |
TK Corp. (a) | 172,528 | | 2,215,922 |
TOTAL KOREA (SOUTH) | | 16,729,258 |
Luxembourg - 0.7% |
Grand City Properties SA (a)(d) | 471,873 | | 6,046,325 |
Malaysia - 0.3% |
Kossan Rubber Industries Bhd | 2,012,100 | | 2,813,406 |
Netherlands - 1.7% |
Amsterdam Commodities NV | 270,721 | | 6,079,432 |
BinckBank NV | 467,100 | | 4,624,822 |
IMCD Group BV | 173,500 | | 4,783,274 |
TOTAL NETHERLANDS | | 15,487,528 |
New Zealand - 1.9% |
EBOS Group Ltd. | 1,408,656 | | 10,508,313 |
Nuplex Industries Ltd. | 2,588,739 | | 6,356,454 |
TOTAL NEW ZEALAND | | 16,864,767 |
Norway - 1.7% |
ABG Sundal Collier ASA (a) | 6,803,251 | | 4,992,786 |
Ekornes A/S | 444,997 | | 4,750,189 |
Kongsberg Gruppen ASA | 282,200 | | 5,710,984 |
TOTAL NORWAY | | 15,453,959 |
Singapore - 2.0% |
Amtek Engineering Ltd. | 6,985,000 | | 3,288,012 |
Boustead Singapore Ltd. | 2,261,000 | | 3,234,692 |
Hour Glass Ltd. | 2,454,000 | | 3,529,772 |
Mapletree Industrial (REIT) | 2,909,778 | | 3,341,974 |
OSIM International Ltd. | 2,886,000 | | 4,180,724 |
TOTAL SINGAPORE | | 17,575,174 |
South Africa - 1.3% |
Clicks Group Ltd. | 1,411,540 | | 9,610,975 |
Pinnacle Technology Holdings Ltd. | 1,900,130 | | 2,098,287 |
TOTAL SOUTH AFRICA | | 11,709,262 |
Sweden - 1.0% |
AddTech AB (B Shares) (d) | 211,656 | | 3,016,839 |
Meda AB (A Shares) (d) | 425,000 | | 5,582,904 |
TOTAL SWEDEN | | 8,599,743 |
Common Stocks - continued |
| Shares | | Value |
Switzerland - 4.3% |
Allied World Assurance Co. | 206,900 | | $ 7,862,200 |
Clariant AG (Reg.) | 307,372 | | 5,351,017 |
Daetwyler Holdings AG | 20,416 | | 2,584,492 |
Pargesa Holding SA | 111,676 | | 8,676,174 |
Vontobel Holdings AG | 227,903 | | 8,278,553 |
VZ Holding AG | 37,391 | | 6,159,615 |
TOTAL SWITZERLAND | | 38,912,051 |
Taiwan - 0.8% |
Richtek Technology Corp. | 251,000 | | 1,209,316 |
Tripod Technology Corp. | 3,369,000 | | 6,296,218 |
TOTAL TAIWAN | | 7,505,534 |
Thailand - 1.0% |
Delta Electronics PCL (For. Reg.) | 3,795,000 | | 7,532,319 |
TISCO Financial Group PCL | 916,800 | | 1,253,009 |
TOTAL THAILAND | | 8,785,328 |
Turkey - 0.4% |
Aygaz A/S | 821,000 | | 3,461,080 |
United Kingdom - 16.9% |
Aberdeen Asset Management PLC | 996,500 | | 6,918,399 |
Alent PLC | 472,808 | | 2,556,466 |
AMEC PLC | 469,241 | | 7,806,706 |
Ashmore Group PLC (d) | 1,091,793 | | 5,564,480 |
Balfour Beatty PLC | 644,000 | | 1,583,428 |
BBA Aviation PLC | 1,384,681 | | 7,834,717 |
Bond International Software PLC | 843,266 | | 1,254,545 |
Brammer PLC | 377,864 | | 1,959,991 |
Brewin Dolphin Holding PLC | 763,663 | | 3,468,212 |
Cineworld Group PLC | 1,024,176 | | 5,488,554 |
Close Brothers Group PLC | 485,800 | | 11,377,246 |
Countrywide PLC | 951,700 | | 6,972,750 |
Craneware PLC | 354,064 | | 2,817,821 |
Diploma PLC | 551,052 | | 6,130,957 |
Informa PLC | 753,906 | | 5,800,973 |
ITE Group PLC | 1,169,900 | | 3,186,210 |
Luxfer Holdings PLC sponsored ADR | 386,100 | | 6,150,573 |
Mears Group PLC | 750,060 | | 5,303,430 |
Meggitt PLC | 982,183 | | 7,087,675 |
Micro Focus International PLC | 434,227 | | 6,890,759 |
Moneysupermarket.com Group PLC | 2,757,200 | | 8,821,386 |
Common Stocks - continued |
| Shares | | Value |
United Kingdom - continued |
Morgan Advanced Materials PLC | 560,608 | | $ 2,533,473 |
Provident Financial PLC | 201,078 | | 6,828,937 |
Pureprofile Media PLC (a)(e) | 1,108,572 | | 993,094 |
Silverdell PLC (a) | 12,644,400 | | 202 |
Sinclair Pharma PLC (a) | 8,403,003 | | 3,847,854 |
Spectris PLC | 209,600 | | 6,042,054 |
Spirent Communications PLC | 4,227,000 | | 5,074,830 |
Ultra Electronics Holdings PLC | 416,244 | | 11,619,353 |
TOTAL UNITED KINGDOM | | 151,915,075 |
United States of America - 1.2% |
Dillard's, Inc. Class A | 104,271 | | 11,027,701 |
YOU On Demand Holdings, Inc. warrants 8/30/17 (a)(e) | 27,500 | | 7,176 |
TOTAL UNITED STATES OF AMERICA | | 11,034,877 |
TOTAL COMMON STOCKS (Cost $867,303,447) |
859,690,911
|
Money Market Funds - 5.4% |
| | | |
Fidelity Cash Central Fund, 0.11% (b) | 32,958,996 | | 32,958,996 |
Fidelity Securities Lending Cash Central Fund, 0.11% (b)(c) | 15,223,760 | | 15,223,760 |
TOTAL MONEY MARKET FUNDS (Cost $48,182,756) |
48,182,756
|
TOTAL INVESTMENT PORTFOLIO - 100.9% (Cost $915,486,203) | | 907,873,667 |
NET OTHER ASSETS (LIABILITIES) - (0.9)% | | (7,799,874) |
NET ASSETS - 100% | $ 900,073,793 |
Legend |
(a) Non-income producing |
(b) Affiliated fund that is generally available only to investment companies and other accounts managed by Fidelity Investments. The rate quoted is the annualized seven-day yield of the fund at period end. A complete unaudited listing of the fund's holdings as of its most recent quarter end is available upon request. In addition, each Fidelity Central Fund's financial statements, which are not covered by the Fund's Report of Independent Registered Public Accounting Firm, are available on the SEC's website or upon request. |
(c) Investment made with cash collateral received from securities on loan. |
(d) Security or a portion of the security is on loan at period end. |
(e) Restricted securities - Investment in securities not registered under the Securities Act of 1933 (excluding 144A issues). At the end of the period, the value of restricted securities (excluding 144A issues) amounted to $1,000,270 or 0.1% of net assets. |
Additional information on each restricted holding is as follows: |
Security | Acquisition Date | Acquisition Cost |
Pureprofile Media PLC | 5/3/05 - 1/11/06 | $ 1,173,341 |
YOU On Demand Holdings, Inc. warrants 8/30/17 | 9/14/12 | $ 0 |
Affiliated Central Funds |
Information regarding fiscal year to date income earned by the Fund from investments in Fidelity Central Funds is as follows: |
Fund | Income earned |
Fidelity Cash Central Fund | $ 50,747 |
Fidelity Securities Lending Cash Central Fund | 303,427 |
Total | $ 354,174 |
Other Affiliated Issuers |
An affiliated company is a company in which the Fund has ownership of at least 5% of the voting securities. Fiscal year to date transactions with companies which are or were affiliates are as follows: |
Affiliate | Value, beginning of period | Purchases | Sales
Proceeds | Dividend Income | Value,
end of
period |
Pertama Holdings Ltd. | $ 12,066,495 | $ - | $ 12,052,911 | $ 64,973 | $ - |
Other Information |
Categorizations in the Schedule of Investments are based on country or territory of incorporation. |
The following is a summary of the inputs used, as of October 31, 2014, involving the Fund's assets and liabilities carried at fair value. The inputs or methodology used for valuing securities may not be an indication of the risk associated with investing in those securities. For more information on valuation inputs, and their aggregation into the levels used in the tables below, please refer to the Investment Valuation section in the accompanying Notes to Financial Statements. |
Valuation Inputs at Reporting Date: |
Description | Total | Level 1 | Level 2 | Level 3 |
Investments in Securities: | | | | |
Equities: | | | | |
Consumer Discretionary | $ 142,842,893 | $ 53,882,215 | $ 88,960,678 | $ - |
Consumer Staples | 69,955,160 | 30,817,315 | 39,137,845 | - |
Energy | 47,499,029 | 39,141,992 | 8,357,037 | - |
Financials | 168,321,950 | 125,641,648 | 42,680,302 | - |
Health Care | 72,999,435 | 36,043,057 | 36,956,378 | - |
Industrials | 171,122,482 | 119,200,903 | 51,921,377 | 202 |
Information Technology | 101,392,760 | 65,244,864 | 35,127,259 | 1,020,637 |
Materials | 75,830,151 | 53,177,211 | 22,652,939 | 1 |
Telecommunication Services | 6,265,971 | - | 6,265,971 | - |
Utilities | 3,461,080 | 3,461,080 | - | - |
Money Market Funds | 48,182,756 | 48,182,756 | - | - |
Total Investments in Securities: | $ 907,873,667 | $ 574,793,041 | $ 332,059,786 | $ 1,020,840 |
The following is a summary of transfers between Level 1 and Level 2 for the period ended October 31, 2014. Transfers are assumed to have occurred at the beginning of the period, and are primarily attributable to the valuation techniques used for foreign equity securities, as discussed in the accompanying Notes to Financial Statements: |
Transfers | Total |
Level 1 to Level 2 | $ 21,867,578 |
Level 2 to Level 1 | $ 0 |
Valuation Inputs at Reporting Date: |
The following is a reconciliation of Investments in Securities for which Level 3 inputs were used in determining value: |
Investments in Securities: | |
Beginning Balance | $ 11,069,913 |
Net Realized Gain (Loss) on Investment Securities | (13,418,381) |
Net Unrealized Gain (Loss) on Investment Securities | 12,110,008 |
Cost of Purchases | - |
Proceeds of Sales | (8,740,700) |
Amortization/Accretion | - |
Transfers into Level 3 | - |
Transfers out of Level 3 | - |
Ending Balance | $ 1,020,840 |
The change in unrealized gain (loss) for the period attributable to Level 3 securities held at October 31, 2014 | $ (1,179,794) |
The information used in the above reconciliation represents fiscal year to date activity for any Investments in Securities identified as using Level 3 inputs at either the beginning or the end of the current fiscal period. Transfers in or out of Level 3 represent the beginning value of any Security or Instrument where a change in the pricing level occurred from the beginning to the end of the period. The cost of purchases and the proceeds of sales may include securities received or delivered through corporate actions or exchanges. Realized and unrealized gains (losses) disclosed in the reconciliation are included in Net Gain (Loss) on the Fund's Statement of Operations. |
See accompanying notes which are an integral part of the financial statements.
Annual Report
Statement of Assets and Liabilities
| October 31, 2014 |
| | |
Assets | | |
Investment in securities, at value (including securities loaned of $14,662,713) - See accompanying schedule: Unaffiliated issuers (cost $867,303,447) | $ 859,690,911 | |
Fidelity Central Funds (cost $48,182,756) | 48,182,756 | |
Total Investments (cost $915,486,203) | | $ 907,873,667 |
Foreign currency held at value (cost $28,166) | | 28,224 |
Receivable for investments sold | | 9,322,189 |
Receivable for fund shares sold | | 473,019 |
Dividends receivable | | 2,328,647 |
Distributions receivable from Fidelity Central Funds | | 9,252 |
Prepaid expenses | | 3,248 |
Other receivables | | 22,671 |
Total assets | | 920,060,917 |
| | |
Liabilities | | |
Payable for investments purchased | $ 2,303,470 | |
Payable for fund shares redeemed | 1,314,911 | |
Accrued management fee | 648,973 | |
Distribution and service plan fees payable | 21,325 | |
Other affiliated payables | 236,320 | |
Other payables and accrued expenses | 238,365 | |
Collateral on securities loaned, at value | 15,223,760 | |
Total liabilities | | 19,987,124 |
| | |
Net Assets | | $ 900,073,793 |
Net Assets consist of: | | |
Paid in capital | | $ 792,123,948 |
Undistributed net investment income | | 7,150,729 |
Accumulated undistributed net realized gain (loss) on investments and foreign currency transactions | | 108,515,351 |
Net unrealized appreciation (depreciation) on investments and assets and liabilities in foreign currencies | | (7,716,235) |
Net Assets | | $ 900,073,793 |
See accompanying notes which are an integral part of the financial statements.
Annual Report
Statement of Assets and Liabilities - continued
| October 31, 2014 |
| | |
Calculation of Maximum Offering Price Class A:
Net Asset Value and redemption price per share ($24,571,948 ÷ 983,534 shares) | | $ 24.98 |
| | |
Maximum offering price per share (100/94.25 of $24.98) | | $ 26.50 |
Class T:
Net Asset Value and redemption price per share ($12,295,831 ÷ 495,632 shares) | | $ 24.81 |
| | |
Maximum offering price per share (100/96.50 of $24.81) | | $ 25.71 |
Class B:
Net Asset Value and offering price per share ($506,850 ÷ 20,678 shares)A | | $ 24.51 |
| | |
Class C:
Net Asset Value and offering price per share ($12,576,184 ÷ 518,246 shares)A | | $ 24.27 |
| | |
International Small Cap:
Net Asset Value, offering price and redemption price per share ($842,030,670 ÷ 33,228,137 shares) | | $ 25.34 |
| | |
Institutional Class:
Net Asset Value, offering price and redemption price per share ($8,092,310 ÷ 319,321 shares) | | $ 25.34 |
A Redemption price per share is equal to net asset value less any applicable contingent deferred sales charge.
See accompanying notes which are an integral part of the financial statements.
Annual Report
Financial Statements - continued
Statement of Operations
| Year ended October 31, 2014 |
| | |
Investment Income | | |
Dividends (including $64,973 earned from other affiliated issuers) | | $ 25,627,606 |
Interest | | 79,016 |
Income from Fidelity Central Funds | | 354,174 |
Income before foreign taxes withheld | | 26,060,796 |
Less foreign taxes withheld | | (1,980,834) |
Total income | | 24,079,962 |
| | |
Expenses | | |
Management fee
Basic fee | $ 9,557,249 | |
Performance adjustment | (582) | |
Transfer agent fees | 2,603,537 | |
Distribution and service plan fees | 294,101 | |
Accounting and security lending fees | 522,545 | |
Custodian fees and expenses | 385,115 | |
Independent trustees' compensation | 4,685 | |
Registration fees | 117,677 | |
Audit | 151,972 | |
Legal | 9,683 | |
Miscellaneous | 108,677 | |
Total expenses before reductions | 13,754,659 | |
Expense reductions | (43,342) | 13,711,317 |
Net investment income (loss) | | 10,368,645 |
Realized and Unrealized Gain (Loss) Net realized gain (loss) on: | | |
Investment securities: | | |
Unaffiliated issuers (net of foreign taxes of $20,368) | 221,431,771 | |
Other affiliated issuers | 5,640,625 | |
Foreign currency transactions | (336,386) | |
Total net realized gain (loss) | | 226,736,010 |
Change in net unrealized appreciation (depreciation) on: Investment securities (net of increase in deferred foreign taxes of $56,345) | (253,641,424) | |
Assets and liabilities in foreign currencies | (27,887) | |
Total change in net unrealized appreciation (depreciation) | | (253,669,311) |
Net gain (loss) | | (26,933,301) |
Net increase (decrease) in net assets resulting from operations | | $ (16,564,656) |
See accompanying notes which are an integral part of the financial statements.
Annual Report
Statement of Changes in Net Assets
| Year ended
October 31,
2014 | Year ended
October 31,
2013 |
Increase (Decrease) in Net Assets | | |
Operations | | |
Net investment income (loss) | $ 10,368,645 | $ 4,434,071 |
Net realized gain (loss) | 226,736,010 | 66,068,952 |
Change in net unrealized appreciation (depreciation) | (253,669,311) | 198,875,293 |
Net increase (decrease) in net assets resulting from operations | (16,564,656) | 269,378,316 |
Distributions to shareholders from net investment income | (4,012,676) | (4,769,550) |
Distributions to shareholders from net realized gain | (26,257,450) | (11,754,787) |
Total distributions | (30,270,126) | (16,524,337) |
Share transactions - net increase (decrease) | (201,807,331) | 162,217,941 |
Redemption fees | 276,780 | 119,206 |
Total increase (decrease) in net assets | (248,365,333) | 415,191,126 |
| | |
Net Assets | | |
Beginning of period | 1,148,439,126 | 733,248,000 |
End of period (including undistributed net investment income of $7,150,729 and undistributed net investment income of $4,006,124, respectively) | $ 900,073,793 | $ 1,148,439,126 |
See accompanying notes which are an integral part of the financial statements.
Annual Report
Financial Highlights - Class A
Years ended October 31, | 2014 | 2013 | 2012 | 2011 | 2010 |
Selected Per-Share Data | | | | | |
Net asset value, beginning of period | $ 26.34 | $ 19.74 | $ 18.97 | $ 20.42 | $ 17.28 |
Income from Investment Operations | | | | | |
Net investment income (loss) C | .17 | .06 | .06 | .10 | .03 |
Net realized and unrealized gain (loss) | (.89) | 6.94 | 1.09 | (.88) | 3.51 |
Total from investment operations | (.72) | 7.00 | 1.15 | (.78) | 3.54 |
Distributions from net investment income | (.05) | (.07) | (.11) | (.02) | (.06) |
Distributions from net realized gain | (.60) | (.33) | (.27) | (.66) | (.34) |
Total distributions | (.65) | (.40) | (.38) | (.68) | (.40) |
Redemption fees added to paid in capital C | .01 | - G | - G | .01 | - G |
Net asset value, end of period | $ 24.98 | $ 26.34 | $ 19.74 | $ 18.97 | $ 20.42 |
Total ReturnA, B | (2.79)% | 36.18% | 6.28% | (4.00)% | 20.85% |
Ratios to Average Net Assets E, F | | | | | |
Expenses before reductions | 1.50% | 1.61% | 1.63% | 1.56% | 1.71% |
Expenses net of fee waivers, if any | 1.50% | 1.61% | 1.63% | 1.55% | 1.65% |
Expenses net of all reductions | 1.50% | 1.60% | 1.60% | 1.54% | 1.63% |
Net investment income (loss) | .65% | .25% | .32% | .49% | .16% |
Supplemental Data | | | | | |
Net assets, end of period (000 omitted) | $ 24,572 | $ 24,020 | $ 14,125 | $ 17,185 | $ 19,720 |
Portfolio turnover rate D | 102% | 54% | 68% | 47% | 66% |
A Total returns would have been lower if certain expenses had not been reduced during the applicable periods shown.
B Total returns do not include the effect of the sales charges.
C Calculated based on average shares outstanding during the period.
D Amounts do not include the activity of the Underlying Funds.
E Fees and expenses of any underlying Fidelity Central Funds are not included in the Fund's expense ratio. The Fund indirectly bears its proportionate share of the expenses of any underlying Fidelity Central Funds.
F Expense ratios reflect operating expenses of the class. Expenses before reductions do not reflect amounts reimbursed by the investment adviser or reductions from brokerage service arrangements or reductions from other expense offset arrangements and do not represent the amount paid by the class during periods when reimbursements or reductions occur. Expenses net of fee waivers reflect expenses after reimbursement by the investment adviser but prior to reductions from brokerage service arrangements or other expense offset arrangements. Expenses net of all reductions represent the net expenses paid by the class.
G Amount represents less than $.01 per share.
See accompanying notes which are an integral part of the financial statements.
Annual Report
Financial Highlights - Class T
Years ended October 31, | 2014 | 2013 | 2012 | 2011 | 2010 |
Selected Per-Share Data | | | | | |
Net asset value, beginning of period | $ 26.17 | $ 19.59 | $ 18.80 | $ 20.23 | $ 17.14 |
Income from Investment Operations | | | | | |
Net investment income (loss) C | .10 | - G | .01 | .05 | (.02) |
Net realized and unrealized gain (loss) | (.87) | 6.90 | 1.08 | (.86) | 3.47 |
Total from investment operations | (.77) | 6.90 | 1.09 | (.81) | 3.45 |
Distributions from net investment income | - | - | (.03) | - | (.02) |
Distributions from net realized gain | (.60) | (.32) | (.27) | (.63) | (.34) |
Total distributions | (.60) | (.32) | (.30) | (.63) | (.36) |
Redemption fees added to paid in capital C | .01 | - G | - G | .01 | - G |
Net asset value, end of period | $ 24.81 | $ 26.17 | $ 19.59 | $ 18.80 | $ 20.23 |
Total ReturnA, B | (3.00)% | 35.80% | 5.97% | (4.18)% | 20.46% |
Ratios to Average Net Assets E, F | | | | | |
Expenses before reductions | 1.77% | 1.87% | 1.88% | 1.82% | 1.97% |
Expenses net of fee waivers, if any | 1.77% | 1.87% | 1.88% | 1.81% | 1.90% |
Expenses net of all reductions | 1.76% | 1.85% | 1.85% | 1.79% | 1.88% |
Net investment income (loss) | .38% | (.01)% | .07% | .24% | (.09)% |
Supplemental Data | | | | | |
Net assets, end of period (000 omitted) | $ 12,296 | $ 13,530 | $ 9,262 | $ 13,744 | $ 16,092 |
Portfolio turnover rate D | 102% | 54% | 68% | 47% | 66% |
A Total returns would have been lower if certain expenses had not been reduced during the applicable periods shown.
B Total returns do not include the effect of the sales charges.
C Calculated based on average shares outstanding during the period.
D Amounts do not include the activity of the Underlying Funds.
E Fees and expenses of any underlying Fidelity Central Funds are not included in the Fund's expense ratio. The Fund indirectly bears its proportionate share of the expenses of any underlying Fidelity Central Funds.
F Expense ratios reflect operating expenses of the class. Expenses before reductions do not reflect amounts reimbursed by the investment adviser or reductions from brokerage service arrangements or reductions from other expense offset arrangements and do not represent the amount paid by the class during periods when reimbursements or reductions occur. Expenses net of fee waivers reflect expenses after reimbursement by the investment adviser but prior to reductions from brokerage service arrangements or other expense offset arrangements. Expenses net of all reductions represent the net expenses paid by the class.
G Amount represents less than $.01 per share.
See accompanying notes which are an integral part of the financial statements.
Annual Report
Financial Highlights - Class B
Years ended October 31, | 2014 | 2013 | 2012 | 2011 | 2010 |
Selected Per-Share Data | | | | | |
Net asset value, beginning of period | $ 25.87 | $ 19.22 | $ 18.38 | $ 19.79 | $ 16.78 |
Income from Investment Operations | | | | | |
Net investment income (loss) C | (.03) | (.11) | (.08) | (.05) | (.10) |
Net realized and unrealized gain (loss) | (.87) | 6.84 | 1.07 | (.85) | 3.39 |
Total from investment operations | (.90) | 6.73 | .99 | (.90) | 3.29 |
Distributions from net realized gain | (.47) | (.08) | (.15) | (.52) | (.28) |
Redemption fees added to paid in capital C | .01 | - G | - G | .01 | - G |
Net asset value, end of period | $ 24.51 | $ 25.87 | $ 19.22 | $ 18.38 | $ 19.79 |
Total ReturnA, B | (3.52)% | 35.14% | 5.45% | (4.68)% | 19.90% |
Ratios to Average Net Assets E, F | | | | | |
Expenses before reductions | 2.28% | 2.37% | 2.38% | 2.32% | 2.47% |
Expenses net of fee waivers, if any | 2.28% | 2.36% | 2.38% | 2.30% | 2.40% |
Expenses net of all reductions | 2.27% | 2.35% | 2.35% | 2.29% | 2.38% |
Net investment income (loss) | (.13)% | (.51)% | (.43)% | (.26)% | (.59)% |
Supplemental Data | | | | | |
Net assets, end of period (000 omitted) | $ 507 | $ 795 | $ 790 | $ 2,067 | $ 3,457 |
Portfolio turnover rate D | 102% | 54% | 68% | 47% | 66% |
A Total returns would have been lower if certain expenses had not been reduced during the applicable periods shown.
B Total returns do not include the effect of the contingent deferred sales charge.
C Calculated based on average shares outstanding during the period.
D Amounts do not include the activity of the Underlying Funds.
E Fees and expenses of any underlying Fidelity Central Funds are not included in the Fund's expense ratio. The Fund indirectly bears its proportionate share of the expenses of any underlying Fidelity Central Funds.
F Expense ratios reflect operating expenses of the class. Expenses before reductions do not reflect amounts reimbursed by the investment adviser or reductions from brokerage service arrangements or reductions from other expense offset arrangements and do not represent the amount paid by the class during periods when reimbursements or reductions occur. Expenses net of fee waivers reflect expenses after reimbursement by the investment adviser but prior to reductions from brokerage service arrangements or other expense offset arrangements. Expenses net of all reductions represent the net expenses paid by the class.
G Amount represents less than $.01 per share.
See accompanying notes which are an integral part of the financial statements.
Annual Report
Financial Highlights - Class C
Years ended October 31, | 2014 | 2013 | 2012 | 2011 | 2010 |
Selected Per-Share Data | | | | | |
Net asset value, beginning of period | $ 25.68 | $ 19.18 | $ 18.38 | $ 19.85 | $ 16.85 |
Income from Investment Operations | | | | | |
Net investment income (loss) C | (.02) | (.11) | (.08) | (.04) | (.10) |
Net realized and unrealized gain (loss) | (.85) | 6.79 | 1.07 | (.85) | 3.40 |
Total from investment operations | (.87) | 6.68 | .99 | (.89) | 3.30 |
Distributions from net realized gain | (.55) | (.18) | (.19) | (.59) | (.30) |
Redemption fees added to paid in capital C | .01 | - G | - G | .01 | - G |
Net asset value, end of period | $ 24.27 | $ 25.68 | $ 19.18 | $ 18.38 | $ 19.85 |
Total ReturnA, B | (3.43)% | 35.15% | 5.46% | (4.64)% | 19.86% |
Ratios to Average Net Assets E, F | | | | | |
Expenses before reductions | 2.23% | 2.33% | 2.38% | 2.27% | 2.42% |
Expenses net of fee waivers, if any | 2.22% | 2.33% | 2.38% | 2.26% | 2.40% |
Expenses net of all reductions | 2.22% | 2.32% | 2.35% | 2.24% | 2.37% |
Net investment income (loss) | (.07)% | (.47)% | (.43)% | (.21)% | (.59)% |
Supplemental Data | | | | | |
Net assets, end of period (000 omitted) | $ 12,576 | $ 13,426 | $ 6,799 | $ 9,545 | $ 13,501 |
Portfolio turnover rate D | 102% | 54% | 68% | 47% | 66% |
A Total returns would have been lower if certain expenses had not been reduced during the applicable periods shown.
B Total returns do not include the effect of the contingent deferred sales charge.
C Calculated based on average shares outstanding during the period.
D Amounts do not include the activity of the Underlying Funds.
E Fees and expenses of any underlying Fidelity Central Funds are not included in the Fund's expense ratio. The Fund indirectly bears its proportionate share of the expenses of any underlying Fidelity Central Funds.
F Expense ratios reflect operating expenses of the class. Expenses before reductions do not reflect amounts reimbursed by the investment adviser or reductions from brokerage service arrangements or reductions from other expense offset arrangements and do not represent the amount paid by the class during periods when reimbursements or reductions occur. Expenses net of fee waivers reflect expenses after reimbursement by the investment adviser but prior to reductions from brokerage service arrangements or other expense offset arrangements. Expenses net of all reductions represent the net expenses paid by the class.
G Amount represents less than $.01 per share.
See accompanying notes which are an integral part of the financial statements.
Annual Report
Financial Highlights - International Small Cap
Years ended October 31, | 2014 | 2013 | 2012 | 2011 | 2010 |
Selected Per-Share Data | | | | | |
Net asset value, beginning of period | $ 26.67 | $ 19.99 | $ 19.23 | $ 20.66 | $ 17.48 |
Income from Investment Operations | | | | | |
Net investment income (loss) B | .25 | .12 | .11 | .17 | .07 |
Net realized and unrealized gain (loss) | (.90) | 7.02 | 1.10 | (.89) | 3.53 |
Total from investment operations | (.65) | 7.14 | 1.21 | (.72) | 3.60 |
Distributions from net investment income | (.09) | (.14) | (.18) | (.06) | (.08) |
Distributions from net realized gain | (.60) | (.33) | (.27) | (.66) | (.34) |
Total distributions | (.69) | (.46) G | (.45) | (.72) | (.42) |
Redemption fees added to paid in capital B | .01 | - F | - F | .01 | - F |
Net asset value, end of period | $ 25.34 | $ 26.67 | $ 19.99 | $ 19.23 | $ 20.66 |
Total ReturnA | (2.48)% | 36.56% | 6.55% | (3.65)% | 21.02% |
Ratios to Average Net Assets D, E | | | | | |
Expenses before reductions | 1.21% | 1.33% | 1.35% | 1.26% | 1.44% |
Expenses net of fee waivers, if any | 1.20% | 1.32% | 1.35% | 1.25% | 1.44% |
Expenses net of all reductions | 1.20% | 1.31% | 1.33% | 1.23% | 1.42% |
Net investment income (loss) | .95% | .53% | .59% | .80% | .37% |
Supplemental Data | | | | | |
Net assets, end of period (000 omitted) | $ 842,031 | $ 1,029,629 | $ 692,769 | $ 856,692 | $ 808,478 |
Portfolio turnover rate C | 102% | 54% | 68% | 47% | 66% |
A Total returns would have been lower if certain expenses had not been reduced during the applicable periods shown.
B Calculated based on average shares outstanding during the period.
C Amounts do not include the activity of the Underlying Funds.
D Fees and expenses of any underlying Fidelity Central Funds are not included in the Fund's expense ratio. The Fund indirectly bears its proportionate share of the expenses of any underlying Fidelity Central Funds.
E Expense ratios reflect operating expenses of the class. Expenses before reductions do not reflect amounts reimbursed by the investment adviser or reductions from brokerage service arrangements or reductions from other expense offset arrangements and do not represent the amount paid by the class during periods when reimbursements or reductions occur. Expenses net of fee waivers reflect expenses after reimbursement by the investment adviser but prior to reductions from brokerage service arrangements or other expense offset arrangements. Expenses net of all reductions represent the net expenses paid by the class.
F Amount represents less than $.01 per share.
G Total distributions of $.46 per share is comprised of distributions from net investment income of $.136 and distributions from net realized gain of $.327 per share.
See accompanying notes which are an integral part of the financial statements.
Annual Report
Financial Highlights - Institutional Class
Years ended October 31, | 2014 | 2013 | 2012 | 2011 | 2010 |
Selected Per-Share Data | | | | | |
Net asset value, beginning of period | $ 26.67 | $ 20.00 | $ 19.24 | $ 20.66 | $ 17.47 |
Income from Investment Operations | | | | | |
Net investment income (loss) B | .29 | .16 | .13 | .18 | .09 |
Net realized and unrealized gain (loss) | (.90) | 7.00 | 1.10 | (.89) | 3.53 |
Total from investment operations | (.61) | 7.16 | 1.23 | (.71) | 3.62 |
Distributions from net investment income | (.13) | (.16) | (.20) | (.06) | (.09) |
Distributions from net realized gain | (.60) | (.33) | (.27) | (.66) | (.34) |
Total distributions | (.73) | (.49) | (.47) | (.72) | (.43) |
Redemption fees added to paid in capital B | .01 | - F | - F | .01 | - F |
Net asset value, end of period | $ 25.34 | $ 26.67 | $ 20.00 | $ 19.24 | $ 20.66 |
Total ReturnA | (2.35)% | 36.68% | 6.65% | (3.62)% | 21.15% |
Ratios to Average Net Assets D, E | | | | | |
Expenses before reductions | 1.08% | 1.20% | 1.25% | 1.22% | 1.34% |
Expenses net of fee waivers, if any | 1.08% | 1.20% | 1.25% | 1.21% | 1.34% |
Expenses net of all reductions | 1.08% | 1.18% | 1.22% | 1.19% | 1.31% |
Net investment income (loss) | 1.07% | .66% | .70% | .84% | .47% |
Supplemental Data | | | | | |
Net assets, end of period (000 omitted) | $ 8,092 | $ 67,038 | $ 9,503 | $ 15,752 | $ 8,231 |
Portfolio turnover rate C | 102% | 54% | 68% | 47% | 66% |
A Total returns would have been lower if certain expenses had not been reduced during the applicable periods shown.
B Calculated based on average shares outstanding during the period.
C Amounts do not include the activity of the Underlying Funds.
D Fees and expenses of any underlying Fidelity Central Funds are not included in the Fund's expense ratio. The Fund indirectly bears its proportionate share of the expenses of any underlying Fidelity Central Funds.
E Expense ratios reflect operating expenses of the class. Expenses before reductions do not reflect amounts reimbursed by the investment adviser or reductions from brokerage service arrangements or reductions from other expense offset arrangements and do not represent the amount paid by the class during periods when reimbursements or reductions occur. Expenses net of fee waivers reflect expenses after reimbursement by the investment adviser but prior to reductions from brokerage service arrangements or other expense offset arrangements. Expenses net of all reductions represent the net expenses paid by the class.
F Amount represents less than $.01 per share.
See accompanying notes which are an integral part of the financial statements.
Annual Report
Notes to Financial Statements
For the period ended October 31, 2014
1. Organization.
Fidelity International Small Cap Fund (the Fund) is a fund of Fidelity Investment Trust (the Trust) and is authorized to issue an unlimited number of shares. The Trust is registered under the Investment Company Act of 1940, as amended (the 1940 Act), as an open-end management investment company organized as a Massachusetts business trust. The Fund offers Class A, Class T, Class C, International Small Cap and Institutional Class shares, each of which, along with Class B shares, has equal rights as to assets and voting privileges. Class B shares are closed to new accounts and additional purchases, except for exchanges and reinvestments. Each class has exclusive voting rights with respect to matters that affect that class. Class B shares will automatically convert to Class A shares after a holding period of seven years from the initial date of purchase. The Fund's investments in emerging markets can be subject to social, economic, regulatory, and political uncertainties and can be extremely volatile.
2. Investments in Fidelity Central Funds.
The Fund invests in Fidelity Central Funds, which are open-end investment companies generally available only to other investment companies and accounts managed by the investment adviser and its affiliates. The Fund's Schedule of Investments lists each of the Fidelity Central Funds held as of period end, if any, as an investment of the Fund, but does not include the underlying holdings of each Fidelity Central Fund. As an Investing Fund, the Fund indirectly bears its proportionate share of the expenses of the underlying Fidelity Central Funds.
The Money Market Central Funds seek preservation of capital and current income and are managed by Fidelity Investments Money Management, Inc. (FIMM), an affiliate of the investment adviser. Annualized expenses of the Money Market Central Funds as of their most recent shareholder report date are less than .01%.
A complete unaudited list of holdings for each Fidelity Central Fund is available upon request or at the Securities and Exchange Commission (the SEC) website at www.sec.gov. In addition, the financial statements of the Fidelity Central Funds, which are not covered by the Fund's Report of Independent Registered Public Accounting Firm, are available on the SEC website or upon request.
3. Significant Accounting Policies.
The financial statements have been prepared in conformity with accounting principles generally accepted in the United States of America (GAAP), which require management to make certain estimates and assumptions at the date of the financial statements. Actual results could differ from those estimates. Subsequent events, if any, through the date that the financial statements were issued have been evaluated in the preparation of
Annual Report
3. Significant Accounting Policies - continued
the financial statements. The following summarizes the significant accounting policies of the Fund:
Investment Valuation. Investments are valued as of 4:00 p.m. Eastern time on the last calendar day of the period. In accordance with valuation policies and procedures approved by the Board of Trustees (the Board), the Fund attempts to obtain prices from one or more third party pricing vendors or brokers to value its investments. When current market prices, quotations or currency exchange rates are not readily available or reliable, investments will be fair valued in good faith by the Fidelity Management & Research Company (FMR) Fair Value Committee (the Committee), in accordance with procedures adopted by the Board. Factors used in determining fair value vary by investment type and may include market or investment specific events, changes in interest rates and credit quality. The frequency with which these procedures are used cannot be predicted and they may be utilized to a significant extent. The Committee oversees the Fund's valuation policies and procedures and is responsible for approving and reporting to the Board all fair value determinations.
The Fund categorizes the inputs to valuation techniques used to value its investments into a disclosure hierarchy consisting of three levels as shown below:
Level 1 - quoted prices in active markets for identical investments
Level 2 - other significant observable inputs (including quoted prices for similar investments, interest rates, prepayment speeds, etc.)
Level 3 - unobservable inputs (including the Fund's own assumptions based on the best information available)
Valuation techniques used to value the Fund's investments by major category are as follows:
Equity securities, including restricted securities, for which market quotations are readily available, are valued at the last reported sale price or official closing price as reported by a third party pricing vendor on the primary market or exchange on which they are traded and are categorized as Level 1 in the hierarchy. In the event there were no sales during the day or closing prices are not available, securities are valued at the last quoted bid price or may be valued using the last available price and are generally categorized as Level 2 in the hierarchy. For foreign equity securities, when market or security specific events arise, comparisons to the valuation of American Depositary Receipts (ADRs), futures contracts, Exchange-Traded Funds (ETFs) and certain indexes as well as quoted prices for similar securities may be used and would be categorized as Level 2 in the hierarchy. Utilizing these techniques may result in transfers between Level 1 and Level 2. For equity securities, including restricted securities, where observable inputs are
Annual Report
Notes to Financial Statements - continued
3. Significant Accounting Policies - continued
Investment Valuation - continued
limited, assumptions about market activity and risk are used and these securities may be categorized as Level 3 in the hierarchy.
Investment in open-end mutual funds, including the Fidelity Central Funds, are valued at their closing net asset value (NAV) each business day and are categorized as Level 1 in the hierarchy.
Changes in valuation techniques may result in transfers in or out of an assigned level within the disclosure hierarchy. The aggregate value of investments by input level, as of October 31, 2014, including information on transfers between Levels 1 and 2, as well as a roll forward of Level 3 investments, is included at the end of the Fund's Schedule of Investments.
Foreign Currency. The Fund may use foreign currency contracts to facilitate transactions in foreign-denominated securities. Gains and losses from these transactions may arise from changes in the value of the foreign currency or if the counterparties do not perform under the contracts' terms.
Foreign-denominated assets, including investment securities, and liabilities are translated into U.S. dollars at the exchange rates at period end. Purchases and sales of investment securities, income and dividends received and expenses denominated in foreign currencies are translated into U.S. dollars at the exchange rate in effect on the transaction date.
The effects of exchange rate fluctuations on investments are included with the net realized and unrealized gain (loss) on investment securities. Other foreign currency transactions resulting in realized and unrealized gain (loss) are disclosed separately.
Investment Transactions and Income. For financial reporting purposes, the Fund's investment holdings and NAV include trades executed through the end of the last business day of the period. The NAV per share for processing shareholder transactions is calculated as of the close of business of the New York Stock Exchange (NYSE), normally 4:00 p.m. Eastern time and includes trades executed through the end of the prior business day. Gains and losses on securities sold are determined on the basis of identified cost. Dividend income is recorded on the ex-dividend date, except for certain dividends from foreign securities where the ex-dividend date may have passed, which are recorded as soon as the Fund is informed of the ex-dividend date. Non-cash dividends included in dividend income, if any, are recorded at the fair market value of the securities received. Income and capital gain distributions from Fidelity Central Funds, if any, are recorded on the ex-dividend date. Interest income is accrued as earned and includes coupon interest and amortization of premium and accretion of discount on debt securities as applicable. Investment income is recorded net of foreign taxes withheld where recovery of such taxes is uncertain.
Annual Report
3. Significant Accounting Policies - continued
Class Allocations and Expenses. Investment income, realized and unrealized capital gains and losses, common expenses of the Fund, and certain fund-level expense reductions, if any, are allocated daily on a pro-rata basis to each class based on the relative net assets of each class to the total net assets of the Fund. Each class differs with respect to transfer agent and distribution and service plan fees incurred. Certain expense reductions may also differ by class. For the reporting period, the allocated portion of income and expenses to each class as a percent of its average net assets may vary due to the timing of recording these transactions in relation to fluctuating net assets of the classes. Expenses directly attributable to a fund are charged to that fund. Expenses attributable to more than one fund are allocated among the respective funds on the basis of relative net assets or other appropriate methods. Expense estimates are accrued in the period to which they relate and adjustments are made when actual amounts are known.
Income Tax Information and Distributions to Shareholders. Each year, the Fund intends to qualify as a regulated investment company under Subchapter M of the Internal Revenue Code, including distributing substantially all of its taxable income and realized gains. As a result, no provision for U.S. Federal income taxes is required. As of October 31, 2014, the Fund did not have any unrecognized tax benefits in the financial statements; nor is the Fund aware of any tax positions for which it is reasonably possible that the total amounts of unrecognized tax benefits will significantly change in the next twelve months. The Fund files a U.S. federal tax return, in addition to state and local tax returns as required. The Fund's federal income tax returns are subject to examination by the Internal Revenue Service (IRS) for a period of three fiscal years after they are filed. State and local tax returns may be subject to examination for an additional fiscal year depending on the jurisdiction. Foreign taxes are provided for based on the Fund's understanding of the tax rules and rates that exist in the foreign markets in which it invests. The Fund is subject to a tax imposed on capital gains by certain countries in which it invests. An estimated deferred tax liability for net unrealized appreciation on the applicable securities is included in Other payables and accrued expenses on the Statement of Assets & Liabilities.
Distributions are declared and recorded on the ex-dividend date. Income dividends and capital gain distributions are declared separately for each class. Income and capital gain distributions are determined in accordance with income tax regulations, which may differ from GAAP. In addition, the Fund claimed a portion of the payment made to redeeming shareholders as a distribution for income tax purposes.
Capital accounts within the financial statements are adjusted for permanent book-tax differences. These adjustments have no impact on net assets or the results of operations. Capital accounts are not adjusted for temporary book-tax differences which will reverse in a subsequent period.
Annual Report
Notes to Financial Statements - continued
3. Significant Accounting Policies - continued
Income Tax Information and Distributions to Shareholders - continued
Book-tax differences are primarily due to futures transactions, foreign currency transactions, passive foreign investment companies (PFIC), capital loss carryforwards and losses deferred due to wash sales.
The federal tax cost of investment securities and unrealized appreciation (depreciation) as of period end were as follows:
Gross unrealized appreciation | $ 73,615,138 |
Gross unrealized depreciation | (89,554,250) |
Net unrealized appreciation (depreciation) on securities | $ (15,939,112) |
| |
Tax Cost | $ 923,812,779 |
The tax-based components of distributable earnings as of period end were as follows:
Undistributed ordinary income | $ 8,272,083 |
Undistributed long-term capital gain | $ 115,833,054 |
Net unrealized appreciation (depreciation) on securities and other investments | $ (16,103,309) |
The tax character of distributions paid was as follows:
| October 31, 2014 | October 31, 2013 |
Ordinary Income | $ 30,270,126 | $ 16,524,337 |
Short-Term Trading (Redemption) Fees. Shares held by investors in the Fund less than 90 days may have been subject to a redemption fee equal to 2.00% of the NAV of shares redeemed. All redemption fees, which reduce the proceeds of the shareholder redemption, are retained by the Fund and accounted for as an addition to paid in capital.
New Accounting Pronouncement. In June 2014, the Financial Accounting Standards Board issued Accounting Standard Update No. 2014-11, Repurchase-to-Maturity Transactions, Repurchase Financings, and Disclosures. The Update amends the accounting for certain repurchase agreements and expands disclosure requirements for reverse repurchase agreements, securities lending and other similar transactions. The disclosure requirements are effective for annual and interim reporting periods beginning after December 15, 2014. Management is currently evaluating the impact of the Update on the Fund's financial statements and related disclosures.
Annual Report
3. Significant Accounting Policies - continued
Restricted Securities. The Fund may invest in securities that are subject to legal or contractual restrictions on resale. These securities generally may be resold in transactions exempt from registration or to the public if the securities are registered. Disposal of these securities may involve time-consuming negotiations and expense, and prompt sale at an acceptable price may be difficult. Information regarding restricted securities is included at the end of the Fund's Schedule of Investments.
4. Purchases and Sales of Investments.
Purchases and sales of securities, other than short-term securities, aggregated $1,082,370,255 and $1,280,273,199, respectively.
5. Fees and Other Transactions with Affiliates.
Management Fee. Fidelity Management & Research Company (the investment adviser) and its affiliates provide the Fund with investment management related services for which the Fund pays a monthly management fee. The management fee is the sum of an individual fund fee rate that is based on an annual rate of .60% of the Fund's average net assets and an annualized group fee rate that averaged .25% during the period. The group fee rate is based upon the average net assets of all the mutual funds advised by the investment adviser, including any mutual funds previously advised by the investment adviser that are currently advised by Fidelity SelectCo, LLC, an affiliate of the investment adviser. The group fee rate decreases as assets under management increase and increases as assets under management decrease. In addition, the management fee is subject to a performance adjustment (up to a maximum of ± .20% of the Fund's average net assets over a 36 month performance period). The upward or downward adjustment to the management fee is based on the relative investment performance of International Small Cap as compared to its benchmark index, the MSCI All Country World ex USA Small Cap Index effective April 1, 2014 (the MSCI EAFE Small Cap Index prior to April 1, 2014), over the same 36 month performance period. For the reporting period, the total annual management fee rate, including the performance adjustment, was .85% of the Fund's average net assets. The performance adjustment included in the management fee rate may be higher or lower than the maximum performance adjustment rate due to the difference between the average net assets for the reporting and performance periods.
Distribution and Service Plan Fees. In accordance with Rule 12b-1 of the 1940 Act, the Fund has adopted separate Distribution and Service Plans for each class of shares. Certain classes pay Fidelity Distributors Corporation (FDC), an affiliate of the investment adviser, separate Distribution and Service Fees, each of which is based on an annual percentage of each class' average net assets. In addition, FDC may pay financial intermediaries for selling shares of the Fund and providing shareholder support services.
Annual Report
Notes to Financial Statements - continued
5. Fees and Other Transactions with Affiliates - continued
Distribution and Service Plan Fees - continued
For the period, the Distribution and Service Fee rates, total fees and amounts retained by FDC were as follows:
| Distribution
Fee | Service
Fee | Total Fees | Retained
by FDC |
Class A | -% | .25% | $ 65,763 | $ 1,198 |
Class T | .25% | .25% | 70,560 | 154 |
Class B | .75% | .25% | 6,629 | 4,984 |
Class C | .75% | .25% | 151,149 | 28,282 |
| | | $ 294,101 | $ 34,618 |
Sales Load. FDC may receive a front-end sales charge of up to 5.75% for selling Class A shares and 3.50% for selling Class T shares, some of which is paid to financial intermediaries for selling shares of the Fund. Depending on the holding period, FDC may receive contingent deferred sales charges levied on Class A, Class T, Class B, and Class C redemptions. The deferred sales charges range from 5.00% to 1.00% for Class B shares, 1.00% for Class C shares, 1.00% for certain purchases of Class A shares and .25% for certain purchases of Class T shares.
For the period, sales charge amounts retained by FDC were as follows:
| Retained
by FDC |
Class A | $ 18,407 |
Class T | 3,814 |
Class B* | 689 |
Class C* | 1,952 |
| $ 24,862 |
* When Class B and Class C shares are initially sold, FDC pays commissions from its own resources to financial intermediaries through which the sales are made.
Transfer Agent Fees. Fidelity Investments Institutional Operations Company, Inc., (FIIOC), an affiliate of the investment adviser, is the transfer, dividend disbursing and shareholder servicing agent for each class of the Fund. FIIOC receives account fees and asset-based fees that vary according to the account size and type of account of the shareholders of the respective classes of the Fund. FIIOC pays for typesetting, printing and mailing of shareholder reports, except proxy statements.
Annual Report
5. Fees and Other Transactions with Affiliates - continued
Transfer Agent Fees - continued
For the period, transfer agent fees for each class were as follows:
| Amount | % of
Class-Level
Average
Net Assets |
Class A | $ 74,352 | .28 |
Class T | 42,039 | .30 |
Class B | 2,010 | .30 |
Class C | 38,581 | .26 |
International Small Cap | 2,374,942 | .24 |
Institutional Class | 71,613 | .12 |
| $ 2,603,537 | |
Accounting and Security Lending Fees. Fidelity Service Company, Inc. (FSC), an affiliate of the investment adviser, maintains the Fund's accounting records. The accounting fee is based on the level of average net assets for each month. Under a separate contract, FSC administers the security lending program. The security lending fee is based on the number and duration of lending transactions.
Brokerage Commissions. The Fund placed a portion of its portfolio transactions with brokerage firms which are affiliates of the investment adviser. Brokerage commissions are included in net realized gain (loss) and change in net unrealized appreciation (depreciation) in the Statement of Operations. The commissions paid to these affiliated firms were $1,930 for the period.
6. Committed Line of Credit.
The Fund participates with other funds managed by the investment adviser or an affiliate in a $4.25 billion credit facility (the "line of credit") to be utilized for temporary or emergency purposes to fund shareholder redemptions or for other short-term liquidity purposes. The Fund has agreed to pay commitment fees on its pro-rata portion of the line of credit, which amounted to $1,862 and is reflected in Miscellaneous expenses on the Statement of Operations. During the period, the Fund did not borrow on this line of credit.
7. Security Lending.
The Fund lends portfolio securities through a lending agent from time to time in order to earn additional income. For equity securities, a lending agent is used and may loan securities to certain qualified borrowers, including Fidelity Capital Markets (FCM), a
Annual Report
Notes to Financial Statements - continued
7. Security Lending - continued
broker-dealer affiliated with the Fund. On the settlement date of the loan, the Fund receives collateral (in the form of U.S. Treasury obligations, letters of credit and/or cash) against the loaned securities and maintains collateral in an amount not less than 100% of the market value of the loaned securities during the period of the loan. The market value of the loaned securities is determined at the close of business of the Fund and any additional required collateral is delivered to the Fund on the next business day. If the borrower defaults on its obligation to return the securities loaned because of insolvency or other reasons, the Fund may apply collateral received from the borrower against the obligation. The Fund may experience delays and costs in recovering the securities loaned. Any cash collateral received is invested in the Fidelity Securities Lending Cash Central Fund. The value of loaned securities and cash collateral at period end are disclosed on the Fund's Statement of Assets and Liabilities. The value of securities loaned to FCM at period end was $54,910. Security lending income represents the income earned on investing cash collateral, less rebates paid to borrowers and any lending agent fees associated with the loan, plus any premium payments received for lending certain types of securities. Security lending income is presented in the Statement of Operations as a component of income from Fidelity Central Funds. Total security lending income during the period amounted to $303,427, including $2,692 from securities loaned to FCM.
8. Expense Reductions.
Commissions paid to certain brokers with whom the investment adviser, or its affiliates, places trades on behalf of the Fund include an amount in addition to trade execution, which may be rebated back to the Fund to offset certain expenses. This amount totaled $29,569 for the period. Through arrangements with the Fund's custodian, credits realized as a result of uninvested cash balances were used to reduce the Fund's expenses. During the period, these credits reduced the Fund's custody expenses by $132.
In addition, the investment adviser reimbursed a portion of the Fund's operating expenses during the period in the amount of $13,641.
9. Distributions to Shareholders.
Distributions to shareholders of each class were as follows:
Years ended October 31, | 2014 | 2013 |
From net investment income | | |
Class A | $ 48,210 | $ 53,369 |
International Small Cap | 3,601,146 | 4,638,246 |
Institutional Class | 363,320 | 77,935 |
Total | $ 4,012,676 | $ 4,769,550 |
Annual Report
9. Distributions to Shareholders - continued
Years ended October 31, | 2014 | 2013 |
From net realized gain | | |
Class A | $ 564,345 | $ 235,834 |
Class T | 310,220 | 146,972 |
Class B | 14,343 | 3,106 |
Class C | 305,689 | 61,233 |
International Small Cap | 23,368,303 | 11,152,248 |
Institutional Class | 1,694,550 | 155,394 |
Total | $ 26,257,450 | $ 11,754,787 |
10. Share Transactions.
Share transactions for each class were as follows and may contain automatic conversions between classes or exchanges between funds:
| Shares | Shares | Dollars | Dollars |
Years ended October 31, | 2014 | 2013 | 2014 | 2013 |
Class A | | | | |
Shares sold | 355,842 | 398,633 | $ 9,376,508 | $ 9,321,444 |
Reinvestment of distributions | 22,103 | 13,843 | 571,356 | 269,801 |
Shares redeemed | (306,489) | (215,812) | (8,061,522) | (4,750,681) |
Net increase (decrease) | 71,456 | 196,664 | $ 1,886,342 | $ 4,840,564 |
Class T | | | | |
Shares sold | 115,645 | 141,247 | $ 3,022,509 | $ 3,379,516 |
Reinvestment of distributions | 11,686 | 7,380 | 300,676 | 143,239 |
Shares redeemed | (148,659) | (104,387) | (3,861,942) | (2,281,922) |
Net increase (decrease) | (21,328) | 44,240 | $ (538,757) | $ 1,240,833 |
Class B | | | | |
Shares sold | 3,137 | 4,525 | $ 80,198 | $ 108,233 |
Reinvestment of distributions | 538 | 157 | 13,734 | 3,023 |
Shares redeemed | (13,726) | (15,050) | (356,690) | (330,538) |
Net increase (decrease) | (10,051) | (10,368) | $ (262,758) | $ (219,282) |
Class C | | | | |
Shares sold | 207,733 | 275,046 | $ 5,326,341 | $ 6,270,694 |
Reinvestment of distributions | 10,499 | 2,855 | 265,425 | 54,609 |
Shares redeemed | (222,725) | (109,571) | (5,644,059) | (2,419,306) |
Net increase (decrease) | (4,493) | 168,330 | $ (52,293) | $ 3,905,997 |
Annual Report
Notes to Financial Statements - continued
10. Share Transactions - continued
| Shares | Shares | Dollars | Dollars |
Years ended October 31, | 2014 | 2013 | 2014 | 2013 |
International Small Cap | | | | |
Shares sold | 7,158,603 | 11,248,438 | $ 190,711,642 | $ 266,912,412 |
Reinvestment of distributions | 988,313 | 770,505 | 25,844,388 | 15,163,539 |
Shares redeemed | (13,529,838) | (8,061,607) | (360,297,655) | (180,218,306) |
Net increase (decrease) | (5,382,922) | 3,957,336 | $ (143,741,625) | $ 101,857,645 |
Institutional Class | | | | |
Shares sold | 1,844,038 | 2,333,500 | $ 48,462,558 | $ 57,218,863 |
Reinvestment of distributions | 61,170 | 8,409 | 1,598,368 | 165,323 |
Shares redeemed | (4,099,284) | (303,629) | (109,159,166) | (6,792,002) |
Net increase (decrease) | (2,194,076) | 2,038,280 | $ (59,098,240) | $ 50,592,184 |
11. Other.
The Fund's organizational documents provide former and current trustees and officers with a limited indemnification against liabilities arising in connection with the performance of their duties to the Fund. In the normal course of business, the Fund may also enter into contracts that provide general indemnifications. The Fund's maximum exposure under these arrangements is unknown as this would be dependent on future claims that may be made against the Fund. The risk of material loss from such claims is considered remote.
At the end of the period, the investment adviser or its affiliates were the owners of record of 18% of the total outstanding shares of the Fund.
Annual Report
To the Trustees of Fidelity Investment Trust and Shareholders of Fidelity International Small Cap Fund:
We have audited the accompanying statement of assets and liabilities of Fidelity International Small Cap Fund (the Fund), a fund of Fidelity Investment Trust, including the schedule of investments, as of October 31, 2014, and the related statement of operations for the year then ended, the statement of changes in net assets for each of the two years in the period then ended, and the financial highlights for each of the five years in the period then ended. These financial statements and financial highlights are the responsibility of the Fund's management. Our responsibility is to express an opinion on these financial statements and financial highlights based on our audits.
We conducted our audits in accordance with the standards of the Public Company Accounting Oversight Board (United States). Those standards require that we plan and perform the audit to obtain reasonable assurance about whether the financial statements and financial highlights are free of material misstatement. The Fund is not required to have, nor were we engaged to perform, an audit of its internal control over financial reporting. Our audits included consideration of internal control over financial reporting as a basis for designing audit procedures that are appropriate in the circumstances, but not for the purpose of expressing an opinion on the effectiveness of the Fund's internal control over financial reporting. Accordingly, we express no such opinion. An audit also includes examining, on a test basis, evidence supporting the amounts and disclosures in the financial statements, assessing the accounting principles used and significant estimates made by management, as well as evaluating the overall financial statement presentation. Our procedures included confirmation of securities owned as of October 31, 2014, by correspondence with the custodians and brokers; where replies were not received from brokers, we performed other auditing procedures. We believe that our audits provide a reasonable basis for our opinion.
In our opinion, the financial statements and financial highlights referred to above present fairly, in all material respects, the financial position of Fidelity International Small Cap Fund as of October 31, 2014, the results of its operations for the year then ended, the changes in its net assets for each of the two years in the period then ended, and the financial highlights for each of the five years in the period then ended, in conformity with accounting principles generally accepted in the United States of America.
DELOITTE & TOUCHE LLP
Boston, Massachusetts
December 19, 2014
Annual Report
The Trustees, Member of the Advisory Board, and officers of the trust and fund, as applicable, are listed below. The Board of Trustees governs the fund and is responsible for protecting the interests of shareholders. The Trustees are experienced executives who meet periodically throughout the year to oversee the fund's activities, review contractual arrangements with companies that provide services to the fund, oversee management of the risks associated with such activities and contractual arrangements, and review the fund's performance. Except for James C. Curvey, each of the Trustees oversees 174 funds. Mr. Curvey oversees 407 funds.
The Trustees hold office without limit in time except that (a) any Trustee may resign; (b) any Trustee may be removed by written instrument, signed by at least two-thirds of the number of Trustees prior to such removal; (c) any Trustee who requests to be retired or who has become incapacitated by illness or injury may be retired by written instrument signed by a majority of the other Trustees; and (d) any Trustee may be removed at any special meeting of shareholders by a two-thirds vote of the outstanding voting securities of the trust. Each Trustee who is not an interested person (as defined in the 1940 Act) of the trust and the fund (Independent Trustee), shall retire not later than the last day of the calendar year in which his or her 75th birthday occurs. The Independent Trustees may waive this mandatory retirement age policy with respect to individual Trustees. The officers and Advisory Board Member hold office without limit in time, except that any officer and Advisory Board Member may resign or may be removed by a vote of a majority of the Trustees at any regular meeting or any special meeting of the Trustees. Except as indicated, each individual has held the office shown or other offices in the same company for the past five years.
Experience, Skills, Attributes, and Qualifications of the Fund's Trustees. The Governance and Nominating Committee has adopted a statement of policy that describes the experience, qualifications, attributes, and skills that are necessary and desirable for potential Independent Trustee candidates (Statement of Policy). The Board believes that each Trustee satisfied at the time he or she was initially elected or appointed a Trustee, and continues to satisfy, the standards contemplated by the Statement of Policy. The Governance and Nominating Committee also engages professional search firms to help identify potential Independent Trustee candidates who have the experience, qualifications, attributes, and skills consistent with the Statement of Policy. From time to time, additional criteria based on the composition and skills of the current Independent Trustees, as well as experience or skills that may be appropriate in light of future changes to board composition, business conditions, and regulatory or other developments, have also been considered by the professional search firms and the Governance and Nominating Committee. In addition, the Board takes into account the Trustees' commitment and participation in Board and committee meetings, as well as their leadership of standing and ad hoc committees throughout their tenure.
In determining that a particular Trustee was and continues to be qualified to serve as a Trustee, the Board has considered a variety of criteria, none of which, in isolation, was controlling. The Board believes that, collectively, the Trustees have balanced and diverse experience, qualifications, attributes, and skills, which allow the Board to operate effectively in governing the fund and protecting the interests of shareholders. Information about the specific experience, skills, attributes, and qualifications of each Trustee, which in each case led to the Board's conclusion that the Trustee should serve (or continue to serve) as a trustee of the fund, is provided below.
Annual Report
Trustees and Officers - continued
Board Structure and Oversight Function. James C. Curvey is an interested person (as defined in the 1940 Act) and currently serves as Chairman. The Trustees have determined that an interested Chairman is appropriate and benefits shareholders because an interested Chairman has a personal and professional stake in the quality and continuity of services provided to the fund. Independent Trustees exercise their informed business judgment to appoint an individual of their choosing to serve as Chairman, regardless of whether the Trustee happens to be independent or a member of management. The Independent Trustees have determined that they can act independently and effectively without having an Independent Trustee serve as Chairman and that a key structural component for assuring that they are in a position to do so is for the Independent Trustees to constitute a substantial majority for the Board. The Independent Trustees also regularly meet in executive session. Ned C. Lautenbach serves as Chairman of the Independent Trustees and as such (i) acts as a liaison between the Independent Trustees and management with respect to matters important to the Independent Trustees and (ii) with management prepares agendas for Board meetings.
Fidelity funds are overseen by different Boards of Trustees. The fund's Board oversees Fidelity's equity and high income funds and another Board oversees Fidelity's investment-grade bond, money market, and asset allocation funds. The asset allocation funds may invest in Fidelity funds overseen by the fund's Board. The use of separate Boards, each with its own committee structure, allows the Trustees of each group of Fidelity funds to focus on the unique issues of the funds they oversee, including common research, investment, and operational issues. On occasion, the separate Boards establish joint committees to address issues of overlapping consequences for the Fidelity funds overseen by each Board.
The Trustees operate using a system of committees to facilitate the timely and efficient consideration of all matters of importance to the Trustees, the fund, and fund shareholders and to facilitate compliance with legal and regulatory requirements and oversight of the fund's activities and associated risks. The Board, acting through its committees, has charged FMR and its affiliates with (i) identifying events or circumstances the occurrence of which could have demonstrably adverse effects on the fund's business and/or reputation; (ii) implementing processes and controls to lessen the possibility that such events or circumstances occur or to mitigate the effects of such events or circumstances if they do occur; and (iii) creating and maintaining a system designed to evaluate continuously business and market conditions in order to facilitate the identification and implementation processes described in (i) and (ii) above. Because the day-to-day operations and activities of the fund are carried out by or through FMR, its affiliates and other service providers, the fund's exposure to risks is mitigated but not eliminated by the processes overseen by the Trustees. While each of the Board's committees has responsibility for overseeing different aspects of the fund's activities, oversight is exercised primarily through the Operations, Audit, and Compliance Committees. In addition, the Independent Trustees have worked with FMR to enhance the Board's oversight of investment and financial risks, legal and regulatory risks, technology risks, and operational risks, including the development of additional risk reporting to the Board. For example, a working group comprised of Independent Trustees and FMR has worked and continues to work to review the Fidelity funds' valuation-related activities, reporting and risk management. Appropriate personnel, including but not limited to the fund's Chief Compliance Officer (CCO), FMR's internal auditor, the independent accountants, the fund's Treasurer and portfolio management personnel, make periodic reports to the Board's committees, as appropriate, including an annual review of FMR's risk management program for the Fidelity funds. The responsibilities of each standing committee, including their oversight responsibilities, are described further under "Standing Committees of the Fund's Trustees."
Annual Report
The fund's Statement of Additional Information (SAI) includes more information about the Trustees. To request a free copy, call Fidelity at 1-877-208-0098.
Interested Trustees*:
Correspondence intended for each Trustee who is an interested person may be sent to Fidelity Investments, 245 Summer Street, Boston, Massachusetts 02210.
Name, Year of Birth; Principal Occupations and Other Relevant Experience+ |
James C. Curvey (1935) |
Year of Election or Appointment: 2007 Trustee Chairman of the Board of Trustees |
| Mr. Curvey also serves as Trustee of other Fidelity funds. Mr. Curvey is a Director of Fidelity Research & Analysis Co. (2009-present), and Vice Chairman (2007-present) and Director of FMR LLC. In addition, Mr. Curvey serves as an Overseer for the Boston Symphony Orchestra and a member of the board of Artis-Naples, Naples, Florida, and as a Trustee for Brewster Academy, Wolfeboro, New Hampshire. Previously, Mr. Curvey served as a Director of Fidelity Investments Money Management, Inc. (2009-2014), a Director of FMR (2007-2014), and a Director of FMR Co., Inc. (2007-2014). |
Charles S. Morrison (1960) |
Year of Election or Appointment: 2014 Trustee |
| Mr. Morrison also serves as Trustee of other funds. He serves as a Director of Fidelity Investments Money Management, Inc. (FIMM) (2014-present), Director of Fidelity SelectCo, LLC (2014-present), President, Asset Management (2014-present), and is an employee of Fidelity Investments. Previously, Mr. Morrison served as Vice President of Fidelity's Fixed Income and Asset Allocation Funds (2012-2014), President, Fixed Income (2011-2014), Vice President of Fidelity's Money Market Funds (2005-2009), President, Money Market Group Leader of FMR (2009), and Senior Vice President, Money Market Group of FMR (2004-2009). Mr. Morrison also served as Vice President of Fidelity's Bond Funds (2002-2005), certain Balanced Funds (2002-2005), and certain Asset Allocation Funds (2002-2007), and as Senior Vice President (2002-2005) of Fidelity's Bond Division. |
* Trustees have been determined to be "Interested Trustees" by virtue of, among other things, their affiliation with the trust or various entities under common control with FMR.
+ The information above includes each Trustee's principal occupation during the last five years and other information relating to the experience, attributes, and skills relevant to each Trustee's qualifications to serve as a Trustee, which led to the conclusion that each Trustee should serve as a Trustee for the fund.
Annual Report
Independent Trustees:
Correspondence intended for each Independent Trustee (that is, the Trustees other than the Interested Trustees) may be sent to Fidelity Investments, P.O. Box 55235, Boston, Massachusetts 02205-5235.
Name, Year of Birth; Principal Occupations and Other Relevant Experience+ |
Dennis J. Dirks (1948) |
Year of Election or Appointment: 2005 Trustee |
| Mr. Dirks also serves as Trustee of other Fidelity funds. Prior to his retirement in May 2003, Mr. Dirks was Chief Operating Officer and a member of the Board of The Depository Trust & Clearing Corporation (DTCC). He also served as President, Chief Operating Officer, and Board member of The Depository Trust Company (DTC) and President and Board member of the National Securities Clearing Corporation (NSCC). In addition, Mr. Dirks served as Chief Executive Officer and Board member of the Government Securities Clearing Corporation, Chief Executive Officer and Board member of the Mortgage-Backed Securities Clearing Corporation, as a Trustee and a member of the Finance Committee of Manhattan College (2005-2008), and as a Trustee and a member of the Finance Committee of AHRC of Nassau County (2006-2008). Mr. Dirks is a member of the Independent Directors Council (IDC) Governing Council (2010-present) and Board of Directors for The Brookville Center for Children's Services, Inc. (2009-present). |
Alan J. Lacy (1953) |
Year of Election or Appointment: 2008 Trustee |
| Mr. Lacy also serves as Trustee of other Fidelity funds. Mr. Lacy serves as Senior Adviser (2007-present) of Oak Hill Capital Partners, L.P. (private equity). Mr. Lacy also served as Chief Executive Officer (2000-2005) and Vice Chairman (2005-2006) of Sears Holdings Corporation and Sears, Roebuck and Co. (retail). In addition, Mr. Lacy serves as a member of the Board of Directors of Dave & Buster's Entertainment, Inc. (restaurant and entertainment complexes, 2010-present), Earth Fare, Inc. (retail grocery, 2012-present), The Hillman Companies, Inc. (hardware wholesalers, 2010-present), and Bristol-Myers Squibb Company (global pharmaceuticals, 2008-present). Mr. Lacy is a member of the Board of Trustees of The National Parks Conservation Association (2006-present). Previously, Mr. Lacy served as Chairman of the Board of Trustees of the National Parks Conservation Association (2008-2011) and as a member of the Board of Directors for the Western Union Company (global money transfer, 2006-2011). |
Ned C. Lautenbach (1944) |
Year of Election or Appointment: 2000 Trustee Chairman of the Independent Trustees |
| Mr. Lautenbach also serves as Trustee of other Fidelity funds. Mr. Lautenbach currently serves as the Lead Director of the Eaton Corporation Board of Directors (diversified industrial, 1997-present). Mr. Lautenbach is Chairman of the Board of Directors of the Philharmonic Center for the Arts in Naples, Florida (2012-present) and a member of the Council on Foreign Relations (1994-present). Previously, Mr. Lautenbach was a Partner/Advisory Partner at Clayton, Dubilier & Rice, LLC (private equity investment, 1998-2010), as well as a Director of Sony Corporation (2006-2007). |
Joseph Mauriello (1944) |
Year of Election or Appointment: 2008 Trustee |
| Mr. Mauriello also serves as Trustee of other Fidelity funds. Prior to his retirement in January 2006, Mr. Mauriello served in numerous senior management positions including Deputy Chairman and Chief Operating Officer (2004-2005), and Vice Chairman of Financial Services (2002-2004) of KPMG LLP US (professional services, 1965-2005). Mr. Mauriello currently serves as a member of the Board of Directors of XL Group plc. (global insurance and re-insurance, 2006-present). Previously, Mr. Mauriello served as a Director of the Hamilton Funds of the Bank of New York (2006-2007) and of Arcadia Resources Inc. (health care services and products, 2007-2012). |
Robert W. Selander (1950) |
Year of Election or Appointment: 2011 Trustee |
| Mr. Selander also serves as Trustee of other Fidelity funds. Previously, Mr. Selander served as a Member of the Advisory Board of other Fidelity funds (2011), and Executive Vice Chairman (2010), Chief Executive Officer (2009-2010), and President and Chief Executive Officer (1997-2009) of Mastercard, Inc. |
Cornelia M. Small (1944) |
Year of Election or Appointment: 2005 Trustee |
| Ms. Small also serves as Trustee of other Fidelity funds. Ms. Small is a member of the Board of Directors (2009-present) and Chair of the Investment Committee (2010-present) of the Teagle Foundation. Ms. Small also serves on the Investment Committee of the Berkshire Taconic Community Foundation (2008-present). Previously, Ms. Small served as Chairperson (2002-2008) and a member of the Investment Committee and Chairperson (2008-2012) and a member of the Board of Trustees of Smith College. In addition, Ms. Small served as Chief Investment Officer, Director of Global Equity Investments, and a member of the Board of Directors of Scudder, Stevens & Clark and Scudder Kemper Investments. |
William S. Stavropoulos (1939) |
Year of Election or Appointment: 2001 Trustee Vice Chairman of the Independent Trustees |
| Mr. Stavropoulos also serves as Trustee of other Fidelity funds. Mr. Stavropoulos serves as President and Founder of the Michigan Baseball Foundation, the Great Lakes Loons (2007-present). Mr. Stavropoulos is Chairman Emeritus of the Board of Directors of The Dow Chemical Company, where he previously served in numerous senior management positions, including President, CEO (1995-2000; 2002-2004), Chairman of the Executive Committee (2000-2006), and as a member of the Board of Directors (1990-2006). Currently, Mr. Stavropoulos is Chairman of the Board of Directors of Univar Inc. (global distributor of commodity and specialty chemicals), a Director of Teradata Corporation (data warehousing and technology solutions), and Maersk Inc. (industrial conglomerate), and a member of the Advisory Board for Metalmark Capital LLC (private equity investment, 2005-present). Mr. Stavropoulos is an operating advisor to Clayton, Dubilier & Rice, LLC (private equity investment). In addition, Mr. Stavropoulos is a member of the University of Notre Dame Advisory Council for the College of Science, a Trustee of the Rollin L. Gerstacker Foundation, and a Director of the Naples Philharmonic Center for the Arts. Previously, Mr. Stavropoulos served as a Director of Chemical Financial Corporation (bank holding company, 1993-2012) and Tyco International, Ltd. (multinational manufacturing and services, 2007-2012). |
David M. Thomas (1949) |
Year of Election or Appointment: 2008 Trustee |
| Mr. Thomas also serves as Trustee of other Fidelity funds. Mr. Thomas serves as Non-Executive Chairman of the Board of Directors of Fortune Brands Home and Security (home and security products, 2011-present), and as a member of the Board of Directors of Interpublic Group of Companies, Inc. (marketing communication, 2004-present). Previously, Mr. Thomas served as Executive Chairman (2005-2006) and Chairman and Chief Executive Officer (2000-2005) of IMS Health, Inc. (pharmaceutical and healthcare information solutions), and a Director of Fortune Brands, Inc. (consumer products, 2000-2011). |
+ The information above includes each Trustee's principal occupation during the last five years and other information relating to the experience, attributes, and skills relevant to each Trustee's qualifications to serve as a Trustee, which led to the conclusion that each Trustee should serve as a Trustee for the fund.
Advisory Board Member and Officers:
Correspondence intended for each officer and Peter S. Lynch may be sent to Fidelity Investments, 245 Summer Street, Boston, Massachusetts 02210. Officers appear below in alphabetical order.
Name, Year of Birth; Principal Occupation |
Peter S. Lynch (1944) |
Year of Election or Appointment: 2003 Member of the Advisory Board |
| Mr. Lynch also serves as Member of the Advisory Board of other Fidelity funds. Mr. Lynch is Vice Chairman and a Director of FMR and FMR Co., Inc. In addition, Mr. Lynch serves as a Trustee of Boston College and as the Chairman of the Inner-City Scholarship Fund. Previously, Mr. Lynch served on the Special Olympics International Board of Directors (1997-2006). |
Elizabeth Paige Baumann (1968) |
Year of Election or Appointment: 2012 Anti-Money Laundering (AML) Officer |
| Ms. Baumann also serves as AML Officer of other funds. She is Chief AML Officer of FMR LLC (2012-present) and is an employee of Fidelity Investments. Previously, Ms. Baumann served as Vice President and Deputy Anti-Money Laundering Officer (2007-2012). |
William C. Coffey (1969) |
Year of Election or Appointment: 2009 Assistant Secretary |
| Mr. Coffey also serves as Assistant Secretary of other funds. He is Senior Vice President and Deputy General Counsel of FMR LLC (2010-present), and is an employee of Fidelity Investments. Previously, Mr. Coffey served as Vice President and Associate General Counsel of FMR LLC (2005-2009). |
Jonathan Davis (1968) |
Year of Election or Appointment: 2010 Assistant Treasurer |
| Mr. Davis also serves as Assistant Treasurer of other funds. Mr. Davis is an employee of Fidelity Investments. Previously, Mr. Davis served as Vice President and Associate General Counsel of FMR LLC (2003-2010). |
Adrien E. Deberghes (1967) |
Year of Election or Appointment: 2008 Deputy Treasurer |
| Mr. Deberghes also serves as an officer of other funds. He is an employee of Fidelity Investments (2008-present). Prior to joining Fidelity Investments, Mr. Deberghes was Senior Vice President of Mutual Fund Administration at State Street Corporation (2007-2008), Senior Director of Mutual Fund Administration at Investors Bank & Trust (2005-2007), and Director of Finance for Dunkin' Brands (2000-2005). |
Stephanie J. Dorsey (1969) |
Year of Election or Appointment: 2010 Assistant Treasurer |
| Ms. Dorsey also serves as an officer of other funds. She is an employee of Fidelity Investments (2008-present) and has served in other fund officer roles. Prior to joining Fidelity Investments, Ms. Dorsey served as Treasurer (2004-2008) of the JPMorgan Mutual Funds and Vice President (2004-2008) of JPMorgan Chase Bank. |
Howard J. Galligan III (1966) |
Year of Election or Appointment: 2014 Chief Financial Officer |
| Mr. Galligan also serves as Chief Financial Officer of other funds. Mr. Galligan serves as President of Fidelity Pricing and Cash Management Services (FPCMS) (2014-present) and as a Director of Strategic Advisers, Inc. (2008-present). Previously, Mr. Galligan served as Chief Administrative Officer of Asset Management (2011-2014) and Chief Operating Officer and Senior Vice President of Investment Support for Strategic Advisers, Inc. (2003-2011). |
Scott C. Goebel (1968) |
Year of Election or Appointment: 2008 Secretary and Chief Legal Officer (CLO) |
| Mr. Goebel serves as Secretary and CLO of other funds. Mr. Goebel also serves as Secretary of Fidelity SelectCo, LLC (2013-present), Fidelity Investments Money Management, Inc. (FIMM) (2010-present) and Fidelity Research and Analysis Company (FRAC) (2010-present); General Counsel, Secretary, and Senior Vice President of FMR (2008-present) and FMR Co., Inc. (2008-present); Chief Legal Officer of Fidelity Management & Research (Hong Kong) Limited (2008-present); and Assistant Secretary of Fidelity Management & Research (Japan) Limited (2008-present) and Fidelity Management & Research (U.K.) Inc. (2008-present). Previously, Mr. Goebel served as Secretary and CLO of other Fidelity funds (2008-2013), Assistant Secretary of FIMM (2008-2010), FRAC (2008-2010), and certain funds (2007-2008); and as Vice President and Secretary of Fidelity Distributors Corporation (FDC) (2005-2007). Mr. Goebel has been employed by FMR LLC or an affiliate since 2001. |
Thomas C. Hense (1964) |
Year of Election or Appointment: 2008/2010 Vice President |
| Mr. Hense also serves as Vice President of other funds (High Income (2008), Small Cap (2008), and Value (2010) funds). Previously, Mr. Hense served as a portfolio manager for Fidelity's Institutional Money Management Group (Pyramis) (2003-2008). |
Brian B. Hogan (1964) |
Year of Election or Appointment: 2009 Vice President |
| Mr. Hogan also serves as Trustee or Vice President of other funds. Mr. Hogan serves as a Director of Fidelity SelectCo, LLC (2014-present) and President of FMR's Equity Division (2009-present). Previously, Mr. Hogan served as Senior Vice President, Equity Research of FMR (2006-2009) and as a portfolio manager. |
Chris Maher (1972) |
Year of Election or Appointment: 2013 Assistant Treasurer |
| Mr. Maher serves as Assistant Treasurer of other funds. Mr. Maher is Vice President of Valuation Oversight and is an employee of Fidelity Investments. Previously, Mr. Maher served as Vice President of Asset Management Compliance (2013), Vice President of FMR's Program Management Group (2010-2013), and Vice President of Valuation Oversight (2008-2010). |
Kenneth B. Robins (1969) |
Year of Election or Appointment: 2008 President and Treasurer |
| Mr. Robins also serves as an officer of other funds. Mr. Robins serves as Executive Vice President of Fidelity Investments Money Management, Inc. (FIMM) (2013-present) and is an employee of Fidelity Investments (2004-present). Previously, Mr. Robins served in other fund officer roles. |
Stephen Sadoski (1971) |
Year of Election or Appointment: 2012 Deputy Treasurer |
| Mr. Sadoski also serves as Deputy Treasurer of other funds. He is an employee of Fidelity Investments (2012-present) and has served in another fund officer role. Prior to joining Fidelity Investments, Mr. Sadoski served as an assistant chief accountant in the Division of Investment Management of the Securities and Exchange Commission (SEC) (2009-2012) and as a senior manager at Deloitte & Touche LLP (1997-2009). |
Stacie M. Smith (1974) |
Year of Election or Appointment: 2013 Deputy Treasurer |
| Ms. Smith also serves as an officer of other funds. She is an employee of Fidelity Investments (2009-present) and has served in other fund officer roles. Prior to joining Fidelity Investments, Ms. Smith served as Senior Audit Manager of Ernst & Young LLP (1996-2009). |
Renee Stagnone (1975) |
Year of Election or Appointment: 2013 Deputy Treasurer |
| Ms. Stagnone also serves as Deputy Treasurer of other funds. Ms. Stagnone is an employee of Fidelity Investments. |
Linda J. Wondrack (1964) |
Year of Election or Appointment: 2014 Chief Compliance Officer |
| Ms. Wondrack also serves as Chief Compliance Officer of other funds. Ms. Wondrack is Executive Vice President and head of the Ethics Office and Asset Management Compliance for Fidelity Investments (2012-present). Ms. Wondrack also serves as Chief Compliance Officer of Fidelity SelectCo, LLC (2014-present); Chief Compliance Officer of Impresa Management LLC (2013-present); and Chief Compliance Officer of FMR Co., Inc., Fidelity Investments Money Management, Inc., Fidelity Management & Research (Japan) Limited, Fidelity Management & Research (U.K.) Inc., Fidelity Management & Research (Hong Kong), Fidelity Management & Research Company, Pyramis Global Advisors, LLC, and Strategic Advisers, Inc., Ballyrock Investment Advisors LLC, and Northern Neck Investors LLC (2012-present). Previously, Ms. Wondrack served as Senior Vice President and Chief Compliance Officer for Columbia Management Investment Advisers, LLC (2005-2012); Chief Compliance Officer for certain funds within the Columbia Family of Funds (2007-2012); and Senior Vice President of Compliance Risk Management at Bank of America (2005-2010). |
Joseph F. Zambello (1957) |
Year of Election or Appointment: 2011 Deputy Treasurer |
| Mr. Zambello also serves as Deputy Treasurer of other funds. Mr. Zambello is an employee of Fidelity Investments. Previously, Mr. Zambello served as Vice President of FMR's Program Management Group (2009-2011) and Vice President of the Transfer Agent Oversight Group (2005-2009). |
Annual Report
The Board of Trustees of Advisor International Small Cap Fund voted to pay to shareholders of record at the opening of business on record date, the following distributions per share derived from capital gains realized from sales of portfolio securities, and dividends derived from net investment income:
| Pay Date | Record Date | Dividends | Capital Gains |
Class A | 12/08/14 | 12/05/14 | $0.159 | $3.452 |
Class T | 12/08/14 | 12/05/14 | $0.056 | $3.452 |
Class B | 12/08/14 | 12/05/14 | $0.000 | $3.420 |
Class C | 12/08/14 | 12/05/14 | $0.000 | $3.420 |
The fund hereby designates as a capital gain dividend with respect to the taxable year ended October 31, 2014, $165,246,247, or, if subsequently determined to be different, the net capital gain of such year.
Class A designates 32%, Class T designates 35%, Class B designates 44%, and Class C designates 38% of the dividends distributed during the fiscal year as amounts which may be taken into account as a dividend for purposes of the maximum rate under section 1(h)(11) of the Internal Revenue Code.
The amounts per share which represent income derived from sources within, and taxes paid to, foreign countries or possessions of the United States are as follows:
| Pay Date | Income | Taxes |
Class A | 12/09/13 | $0.2040 | $0.0122 |
| | | |
Class T | 12/09/13 | $0.1883 | $0.0122 |
| | | |
Class B | 12/09/13 | $0.1487 | $0.0122 |
| | | |
Class C | 12/09/13 | $0.1744 | $0.0122 |
| | | |
The fund will notify shareholders in January 2015 of amounts for use in preparing 2014 income tax returns.
Annual Report
A special meeting of the fund's shareholders was held on March 18, 2014. The results of votes taken among shareholders on the proposal before them are reported below. Each vote reported represents one dollar of net asset value held on the record date for the meeting.
PROPOSAL 1 |
To approve a change in the performance adjustment index for the fund. |
| # of
Votes | % of
Votes |
Affirmative | 659,102,813.34 | 91.252 |
Against | 41,779,512.26 | 5.784 |
Abstain | 21,410,547.93 | 2.964 |
TOTAL | 722,292,873.53 | 100.000 |
Annual Report
Board Approval of Investment Advisory Contracts and Management Fees
Fidelity International Small Cap Fund
Each year, the Board of Trustees, including the Independent Trustees (together, the Board), votes on the renewal of the management contract with Fidelity Management & Research Company (FMR) and the sub-advisory agreements (together, the Advisory Contracts) for the fund. The Board, assisted by the advice of fund counsel and Independent Trustees' counsel, requests and considers a broad range of information relevant to the renewal of the Advisory Contracts throughout the year.
The Board meets regularly and, at each of its meetings, covers an extensive agenda of topics and materials and considers factors that are relevant to its annual consideration of the renewal of the fund's Advisory Contracts, including the services and support provided to the fund and its shareholders. The Board has established various standing committees (Committees), each composed of and chaired by Independent Trustees with varying backgrounds, to which the Board has assigned specific subject matter responsibilities in order to enhance effective decision-making by the Board. The Board, acting directly and through its Committees, requests and receives information concerning the annual consideration of the renewal of the fund's Advisory Contracts. The Board also meets as needed to consider matters specifically related to the Board's annual consideration of the renewal of the Advisory Contracts. Members of the Board may also meet with trustees of other Fidelity funds through ad hoc joint committees to discuss certain matters relevant to the Fidelity funds.
At its July 2014 meeting, the Board, including the Independent Trustees, unanimously determined to renew the fund's Advisory Contracts. In reaching its determination, the Board considered all factors it believed relevant, including (i) the nature, extent, and quality of the services to be provided to the fund and its shareholders (including the investment performance of the fund); (ii) the competitiveness of the fund's management fee and total expense ratio relative to peer funds; (iii) the total costs of the services to be provided by and the profits to be realized by Fidelity from its relationship with the fund; (iv) the extent to which economies of scale exist and would be realized as the fund grows; and (v) whether fee levels reflect these economies of scale, if any, for the benefit of fund shareholders. In connection with separate internal corporate reorganizations involving Fidelity Management & Research (U.K.) Inc. (FMR U.K.) and Fidelity Management & Research (Japan) Inc. (FMR Japan), the Board approved certain non-material amendments to the fund's sub-advisory agreements with FMR U.K. and FMR Japan to reflect that, after these reorganizations, FMR Investment Management (UK) Limited and Fidelity Management & Research (Japan) Limited will carry on the business of FMR U.K. and FMR Japan, respectively. The Board noted that no changes to the portfolio managers or to the foreign research or investment advisory services provided to the fund were expected in connection with either reorganization and that the same personnel and resources would continue to be available to the fund at the new entities.
Annual Report
In considering whether to renew the Advisory Contracts for the fund, the Board reached a determination, with the assistance of fund counsel and Independent Trustees' counsel and through the exercise of its business judgment, that the renewal of the Advisory Contracts was in the best interests of the fund and its shareholders and that the compensation payable under the Advisory Contracts was fair and reasonable. The Board's decision to renew the Advisory Contracts was not based on any single factor, but rather was based on a comprehensive consideration of all the information provided to the Board at its meetings throughout the year. The Board, in reaching its determination to renew the Advisory Contracts, was aware that shareholders of the fund have a broad range of investment choices available to them, including a wide choice among funds offered by Fidelity's competitors, and that the fund's shareholders, who have the opportunity to review and weigh the disclosure provided by the fund in its prospectus and other public disclosures, have chosen to invest in this fund, which is part of the Fidelity family of funds.
Nature, Extent, and Quality of Services Provided. The Board considered Fidelity's staffing as it relates to the fund, including the backgrounds of investment personnel of FMR and the sub-advisers (together, the Investment Advisers), and also considered the fund's investment objective, strategies, and related investment philosophy. The Independent Trustees also had discussions with senior management of Fidelity's investment operations and investment groups. The Board considered the structure of the portfolio manager compensation program and whether this structure provides appropriate incentives to act in the best interests of the fund. Additionally, the Board considered the portfolio managers' investments, if any, in the funds that they manage.
Resources Dedicated to Investment Management and Support Services. The Board and the Fund Oversight and Research Committees reviewed the general qualifications and capabilities of Fidelity's investment staff, including its size, education, experience, and resources, as well as Fidelity's approach to recruiting, training, managing, and compensating investment personnel. The Board noted that Fidelity has continued to increase the resources devoted to non-U.S. offices, including expansion of Fidelity's global investment organization. The Board also noted that Fidelity's analysts have extensive resources, tools and capabilities that allow them to conduct sophisticated quantitative and fundamental analysis, as well as credit analysis of issuers, counterparties and guarantors. Further, the Board believes that Fidelity's investment professionals have sufficient access to global information and data so as to provide competitive investment results over time, and that those professionals also have access to sophisticated tools that permit them to assess portfolio construction and risk and performance attribution characteristics continuously, as well as to transmit new information and research conclusions rapidly around the world. Additionally, in its deliberations, the Board considered Fidelity's trading and risk management capabilities and resources and global compliance infrastructure, which are an integral part of the investment management process.
Annual Report
Board Approval of Investment Advisory Contracts and
Management Fees - continued
Shareholder and Administrative Services. The Board considered (i) the nature, extent, quality, and cost of advisory, administrative, and shareholder services performed by the Investment Advisers and their affiliates under the Advisory Contracts and under separate agreements covering transfer agency, pricing and bookkeeping, and securities lending services for the fund; (ii) the nature and extent of the supervision of third party service providers, principally custodians and subcustodians; and (iii) the resources devoted to, and the record of compliance with, the fund's compliance policies and procedures. The Board also reviewed the allocation of fund brokerage, including allocations to brokers affiliated with the Investment Advisers, the use of brokerage commissions to pay fund expenses, and the use of "soft" commission dollars to pay for research services.
The Board noted that the growth of fund assets over time across the complex allows Fidelity to reinvest in the development of services designed to enhance the value or convenience of the Fidelity funds as investment vehicles. These services include 24-hour access to account information and market information through telephone representatives and over the Internet, investor education materials and asset allocation tools, and the expanded availability of Fidelity Investor Centers.
In 2014, the Board formed an ad hoc Committee on Transfer Agency Fees to review the variety of transfer agency fee structures throughout the industry and Fidelity's competitive positioning with respect to industry participants.
Investment in a Large Fund Family. The Board considered the benefits to shareholders of investing in a Fidelity fund, including the benefits of investing in a fund that is part of a large family of funds offering a variety of investment disciplines and providing a large variety of mutual fund investor services. The Board noted that Fidelity had taken, or had made recommendations that resulted in the Fidelity funds taking, a number of actions over the previous year that benefited particular funds, including (i) continuing to dedicate additional resources to investment research and to the support of the senior management team that oversees asset management; (ii) persisting in efforts to enhance Fidelity's global research capabilities; (iii) launching new funds and making other enhancements to meet client needs for income-oriented solutions; (iv) reducing fund expenses for certain index funds; (v) continuing to launch dedicated lower cost underlying funds to meet portfolio construction needs related to expanding underlying fund options for Fidelity funds of funds, specifically for the Freedom Fund product lines; (vi) rationalizing product lines and gaining increased efficiencies through fund mergers; (vii) launching sector-based exchange-traded funds and establishing a new Fidelity adviser to manage sector-based funds and products; (viii) continuing to develop and implement technology to improve security and increase efficiency; (ix) modifying the eligibility criteria for certain share classes to increase their marketability to a portion of the defined contribution plan market; (x) waiving redemption fees for certain qualified fund-of-fund and wrap programs and certain retirement plan transactions; and (xi) launching new Institutional Class shares of certain money market funds to attract and retain assets and to fill a gap in the money market fund lineup.
Annual Report
Investment Performance. The Board considered whether the fund has operated in accordance with its investment objective, as well as its record of compliance with its investment restrictions and its performance history. The Board noted that there was a portfolio management change for the fund in March 2014.
The Board took into account discussions with the Investment Advisers about fund investment performance that occur at Board meetings throughout the year. In this regard the Board noted that as part of regularly scheduled fund reviews and other reports to the Board on fund performance, the Board periodically considers annualized return information for the fund, for different time periods, measured against a securities market index ("benchmark index") and a peer group of funds with similar objectives ("peer group"). In its evaluation of fund investment performance, the Board gave particular attention to information indicating changes in performance of certain Fidelity funds for specific time periods and the Investment Advisers' explanations for any overperformance or underperformance.
In addition to reviewing absolute and relative fund performance, the Independent Trustees periodically consider the appropriateness of fund performance metrics in evaluating the results achieved. In general, the Independent Trustees believe that fund performance should be evaluated based on net performance (after fees and expenses) of both the highest performing and lowest performing classes, where applicable, compared to appropriate benchmark indices, over appropriate time periods which may include full market cycles, and compared to peer groups, as applicable, over the same periods, taking into account relevant factors including the following: general market conditions; issuer-specific information; tactical opportunities for investment; and fund cash flows and other factors.
The Independent Trustees recognize that shareholders evaluate performance on a net basis over their own holding periods, for which one-, three-, and five-year periods are often used as a proxy. For this reason, the performance information reviewed by the Board also included net cumulative calendar year total return information for the fund and an appropriate benchmark index and peer group for the most recent one-, three-, and five-year periods, as shown below. Returns are shown compared to the 25th percentile (top of box, 75% beaten) and 75th percentile (bottom of box, 25% beaten) of the peer universe. Returns of the benchmark index are "net MA," i.e., adjusted for tax withholding rates applicable to U.S.-based funds organized as Massachusetts business trusts.
Annual Report
Board Approval of Investment Advisory Contracts and
Management Fees - continued
Fidelity International Small Cap Fund

The Board also considered that the fund's management fee is subject to upward or downward adjustment depending upon whether, and to what extent, the fund's investment performance for the performance period exceeds, or is exceeded by, a securities index, thus leading to a performance adjustment for the same period. The Board noted that the performance adjustment provides FMR with a strong economic incentive to seek to achieve superior performance for the fund's shareholders and helps to more closely align the interests of FMR and the fund's shareholders.
Based on its review, the Board concluded that the nature, extent, and quality of services provided to the fund under the Advisory Contracts should benefit the fund's shareholders.
Competitiveness of Management Fee and Total Expense Ratio. The Board considered the fund's management fee and total expense ratio compared to "mapped groups" of competitive funds and classes. Fidelity creates "mapped groups" by combining similar Lipper investment objective categories that have comparable investment mandates. Combining Lipper investment objective categories aids the Board's management fee and total expense ratio comparisons by broadening the competitive group used for comparison and by reducing the number of universes to which various Fidelity funds are compared.
Management Fee. The Board considered two proprietary management fee comparisons for the 12-month periods shown in the chart below. The group of Lipper funds used by the Board for management fee comparisons is referred to below as the "Total Mapped Group." The Total Mapped Group is broader than the Lipper peer group used by the Board for performance comparisons because the Total Mapped Group combines several Lipper investment objective categories while the Lipper peer group does not. The Total Mapped Group comparison focuses on a fund's standing in terms of gross management fees before expense reimbursements or caps, and without giving effect to the fund's performance adjustment, relative to the total universe of funds with comparable investment mandates, regardless of whether their management fee structures also are comparable. Funds with comparable investment mandates offer exposure to similar types of securities. Funds with comparable management fee structures have similar management fee contractual arrangements (e.g., flat rate charged for advisory services, all-inclusive fee rate, etc.). "TMG %" represents the percentage of funds in the Total Mapped Group that had management fees that were lower than the fund's. For example, a hypothetical TMG % of 20% would mean that 80% of the funds in the Total Mapped Group had higher, and 20% had lower, management fees than the fund. The fund's actual TMG %s are in the chart below. The "Asset-Size Peer Group" (ASPG) comparison focuses on a fund's standing relative to a subset of non-Fidelity funds within the Total Mapped Group that are similar in size and management fee structure. For example, if a fund is in the first quartile of the ASPG, the fund's management fee ranks in the least expensive or lowest 25% of funds in the ASPG. The ASPG represents at least 15% of the funds in the Total Mapped Group with comparable asset size and management fee structures, subject to a minimum of 50 funds (or all funds in the Total Mapped Group if fewer than 50). Additional information, such as the ASPG quartile in which the fund's management fee rate ranked and the impact of the fund's performance adjustment, is also included in the chart and considered by the Board.
Annual Report
Fidelity International Small Cap Fund

Annual Report
Board Approval of Investment Advisory Contracts and
Management Fees - continued
The Board noted that the fund's management fee rate ranked below the median of its Total Mapped Group and below the median of its ASPG for 2013. The Board also noted the effect of the fund's positive performance adjustment on the fund's management fee ranking.
The Board also noted that, in August 2013, the ad hoc Committee on Management Fees was formed to conduct an in-depth review of the management fee rates of Fidelity's active equity mutual funds. The Committee focused on the following areas: (i) standard fee structures; (ii) research consumption and trading evolution; (iii) management fee competitiveness/profitability by category; and (iv) factors that drive institutional pricing.
Based on its review, the Board concluded that the fund's management fee is fair and reasonable in light of the services that the fund receives and the other factors considered.
Total Expense Ratio. In its review of each class's total expense ratio, the Board considered the fund's management fee as well as other fund or class expenses, as applicable, such as transfer agent fees, pricing and bookkeeping fees, fund-paid 12b-1 fees, and custodial, legal, and audit fees. The Board also noted the effects of any waivers and reimbursements on fees and expenses, as well as the impact of the fund's performance adjustment. As part of its review, the Board also considered the current and historical total expense ratios of each class of the fund compared to competitive fund median expenses. Each class of the fund is compared to those funds and classes in the Total Mapped Group (used by the Board for management fee comparisons) that have a similar sales load structure.
The Board noted that the total expense ratio of each of Class A, Class C, Institutional Class, and the retail class ranked below its competitive median for 2013 and the total expense ratio of each of Class T and Class B ranked above its competitive median for 2013. The Board considered that, in general, various factors can affect total expense ratios. The Board noted that the total expense ratio of Class T was above the competitive median primarily because of higher 12b-1 fees on Class T as compared to most competitor funds. Class T has a higher 12b-1 fee, but a lower front-end sales charge, than traditionally priced front-end sales charge classes. The Board considered that Class T is primarily sold load-waived in the retirement plan market where its 0.50% 12b-1 fee is comparable to competing no-load, higher 12b-1 fee classes designed specifically for retirement plans. The Board noted that the fund offers multiple classes, each of which has a different sales load and 12b-1 fee structure, and that the multiple structures are intended to offer a range of pricing options for the intermediary market. The Board also noted that the total expense ratios of the classes vary primarily by the level of their 12b-1 fees, although differences in transfer agent fees may also cause expenses to vary from class to class.
Annual Report
Fees Charged to Other Fidelity Clients. The Board also considered Fidelity fee structures and other information with respect to clients of Fidelity, such as other funds advised or subadvised by Fidelity, pension plan clients, and other institutional clients. The Board noted the findings of the 2013 ad hoc joint committee (created with the board of other Fidelity funds), which reviewed and compared Fidelity's institutional investment advisory business with its business of providing services to the Fidelity funds, including the differences in services provided, fees charged, and costs incurred, as well as competition in their respective marketplaces.
Based on its review of total expense ratios and fees charged to other Fidelity clients, the Board concluded that the total expense ratio of each class of the fund was reasonable, although in some cases above the median of the universe presented for comparison, in light of the services that the fund and its shareholders receive and the other factors considered.
Costs of the Services and Profitability. The Board considered the revenues earned and the expenses incurred by Fidelity in conducting the business of developing, marketing, distributing, managing, administering and servicing the fund and servicing the fund's shareholders. The Board also considered the level of Fidelity's profits in respect of all the Fidelity funds.
On an annual basis, Fidelity presents to the Board Fidelity's profitability for the fund. Fidelity calculates the profitability for each fund, as well as aggregate profitability for groups of Fidelity funds and all Fidelity funds, using a series of detailed revenue and cost allocation methodologies which originate with the books and records of Fidelity on which Fidelity's audited financial statements are based. The Audit Committee of the Board reviews any significant changes from the prior year's methodologies.
PricewaterhouseCoopers LLP (PwC), independent registered public accounting firm and auditor to Fidelity and certain Fidelity funds, has been engaged annually by the Board as part of the Board's assessment of Fidelity's profitability analysis. PwC's engagement includes the review and assessment of the methodologies used by Fidelity in determining the revenues and expenses attributable to Fidelity's mutual fund business, and completion of agreed-upon procedures in respect of the mathematical accuracy of fund profitability and its conformity to established allocation methodologies. After considering PwC's reports issued under the engagement and information provided by Fidelity, the Board concluded that while other allocation methods may also be reasonable, Fidelity's profitability methodologies are reasonable in all material respects.
The Board also reviewed Fidelity's non-fund businesses and fall-out benefits related to the mutual fund business as well as cases where Fidelity's affiliates may benefit from or be related to the fund's business.
Annual Report
Board Approval of Investment Advisory Contracts and
Management Fees - continued
The Board considered the costs of the services provided by and the profits realized by Fidelity in connection with the operation of the fund and was satisfied that the profitability was not excessive in the circumstances.
Economies of Scale. The Board considered whether there have been economies of scale in respect of the management of the Fidelity funds, whether the Fidelity funds (including the fund) have appropriately benefited from any such economies of scale, and whether there is potential for realization of any further economies of scale. The Board considered the extent to which the fund will benefit from economies of scale through increased services to the fund, through waivers or reimbursements, or through fee or expense ratio reductions. The Board also noted that in 2013, it and the boards of other Fidelity funds created an ad hoc committee (the Economies of Scale Committee) to analyze whether Fidelity attains economies of scale in respect of the management and servicing of the Fidelity funds, whether the Fidelity funds have appropriately benefited from such economies of scale, and whether there is potential for realization of any further economies of scale.
The Board recognized that the fund's management contract incorporates a "group fee" structure, which provides for lower group fee rates as total group assets increase, and for higher group fee rates as total group assets decrease (with "group assets" defined to include fund assets under FMR's management plus sector fund assets previously under FMR's management and currently managed by Fidelity SelectCo, LLC). FMR calculates the group fee rates based on a tiered asset "breakpoint" schedule that varies based on asset class. The Board considered that the group fee is designed to deliver the benefits of economies of scale to fund shareholders when total Fidelity fund assets increase, even if assets of any particular fund are unchanged or have declined, because some portion of Fidelity's costs are attributable to services provided to all Fidelity funds, and all funds benefit if those costs can be allocated among more assets. The Board concluded that, given the group fee structure, fund shareholders will benefit from lower management fees as group assets increase at the fund complex level, regardless of whether Fidelity achieves any such economies of scale.
The Board concluded, taking into account the analysis of the Economies of Scale Committee, that economies of scale, if any, are being appropriately shared between fund shareholders and Fidelity.
Additional Information Requested by the Board. In order to develop fully the factual basis for consideration of the Fidelity funds' Advisory Contracts, the Board requested and received additional information on certain topics, including: (i) fund performance trends and Fidelity's long-term strategies for certain funds; (ii) Fidelity's strategic marketing and product lineup goals; (iii) the methodology with respect to competitive fund data and peer group classifications; (iv) the arrangements with, and performance of, certain sub-advisers on behalf of the Fidelity funds, as well as certain proposed participating affiliate arrangements; (v) the realization of fall-out benefits in certain Fidelity business units; (vi) Fidelity's group fee structures, including the rationale for the individual fee rates of certain categories of funds and the definition of group assets; (vii) trends regarding industry use of performance fee structures and the performance adjustment methodologies applicable to the Fidelity funds; (viii) additional competitive analysis regarding the total expenses for certain classes; (ix) fund profitability methodology, including Fidelity's cost allocation methodology, and the impact of certain factors on fund profitability results; and (x) the process by which Fidelity determines sub-advisory fees for funds it advises.
Annual Report
Based on its evaluation of all of the conclusions noted above, and after considering all factors it believed relevant, the Board ultimately concluded that the advisory fee structures are fair and reasonable, and that the fund's Advisory Contracts should be renewed.
Annual Report
Investment Adviser
Fidelity Management & Research Company
Boston, MA
Investment Sub-Advisers
FMR Co., Inc.
Fidelity Management & Research
(U.K.) Inc.
Fidelity Management & Research
(Hong Kong) Limited
Fidelity Management & Research
(Japan) Limited
FIL Investment Advisors
FIL Investments (Japan) Limited
FIL Investment Advisors (UK) Limited
General Distributor
Fidelity Distributors Corporation
Smithfield, RI
Transfer and Service Agents
Fidelity Investments Institutional Operations Company, Inc.
Boston, MA
Fidelity Service Company, Inc.
Boston, MA
Custodian
The Bank of New York Mellon
New York, NY
(Fidelity Investment logo)(registered trademark)
AISC-UANN-1214
1.793568.111
(Fidelity Investment logo)(registered trademark)
Fidelity Advisor®
International Small Cap
Fund - Institutional Class
Annual Report
October 31, 2014
(Fidelity Cover Art)
Institutional Class is a class of
Fidelity® International Small Cap Fund
Contents
Performance | (Click Here) | How the fund has done over time. |
Management's Discussion of Fund Performance | (Click Here) | The Portfolio Manager's review of fund performance and strategy. |
Shareholder Expense Example | (Click Here) | An example of shareholder expenses. |
Investment Changes | (Click Here) | A summary of major shifts in the fund's investments over the past six months. |
Investments | (Click Here) | A complete list of the fund's investments with their market values. |
Financial Statements | (Click Here) | Statements of assets and liabilities, operations, and changes in net assets, as well as financial highlights. |
Notes | (Click Here) | Notes to financial statements. |
Report of Independent Registered Public Accounting Firm | (Click Here) | |
Trustees and Officers | (Click Here) | |
Distributions | (Click Here) | |
Proxy Voting Results | (Click Here) | |
Board Approval of Investment Advisory Contracts and Management Fees | (Click Here) | |
To view a fund's proxy voting guidelines and proxy voting record for the 12-month period ended June 30, visit http://www.fidelity.com/proxyvotingresults or visit the Securities and Exchange Commission's (SEC) web site at http://www.sec.gov. You may also call 1-877-208-0098 to request a free copy of the proxy voting guidelines.
Standard & Poor's, S&P and S&P 500 are registered service marks of The McGraw-Hill Companies, Inc. and have been licensed for use by Fidelity Distributors Corporation.
Other third-party marks appearing herein are the property of their respective owners.
All other marks appearing herein are registered or unregistered trademarks or service marks of FMR LLC or an affiliated company. © 2014 FMR LLC. All rights reserved.
Annual Report
This report and the financial statements contained herein are submitted for the general information of the shareholders of the fund. This report is not authorized for distribution to prospective investors in the fund unless preceded or accompanied by an effective prospectus.
A fund files its complete schedule of portfolio holdings with the SEC for the first and third quarters of each fiscal year on Form N-Q. Forms N-Q are available on the SEC's web site at http://www.sec.gov. A fund's Forms N-Q may be reviewed and copied at the SEC's Public Reference Room in Washington, DC. Information regarding the operation of the SEC's Public Reference Room may be obtained by calling 1-800-SEC-0330. For a complete list of a fund's portfolio holdings, view the most recent holdings listing, semiannual report, or annual report on Fidelity's web site at http://www.fidelity.com, http://www.advisor.fidelity.com, or http://www.401k.com, as applicable.
NOT FDIC INSURED • MAY LOSE VALUE • NO BANK GUARANTEE
Neither the fund nor Fidelity Distributors Corporation is a bank.
Annual Report
Average annual total return reflects the change in the value of an investment, assuming reinvestment of the class' distributions from dividend income and capital gains (the profits earned upon the sale of securities that have grown in value, if any) and assuming a constant rate of performance each year. The $10,000 table and the fund's returns do not reflect the deduction of taxes that a shareholder would pay on fund distributions or the redemption of fund shares. During periods of reimbursement by Fidelity, a fund's total return will be greater than it would be had the reimbursement not occurred. How a fund did yesterday is no guarantee of how it will do tomorrow.
Average Annual Total Returns
Periods ended October 31, 2014 | Past 1
year | Past 5
years | Past 10
years |
Institutional Class † | -2.35% | 10.70% | 9.08% |
† Prior to April 1, 2014, the fund compared its performance to a different benchmark. The fund's historical performance may not represent its current investment policies.
$10,000 Over 10 Years
Let's say hypothetically that $10,000 was invested in Fidelity Advisor® International Small Cap Fund - Institutional Class on October 31, 2004. The chart shows how the value of your investment would have changed, and also shows how the MSCI ACWI (All Country World Index) ex USA Small Cap Index and MSCI EAFE Small Cap Index performed over the same period.
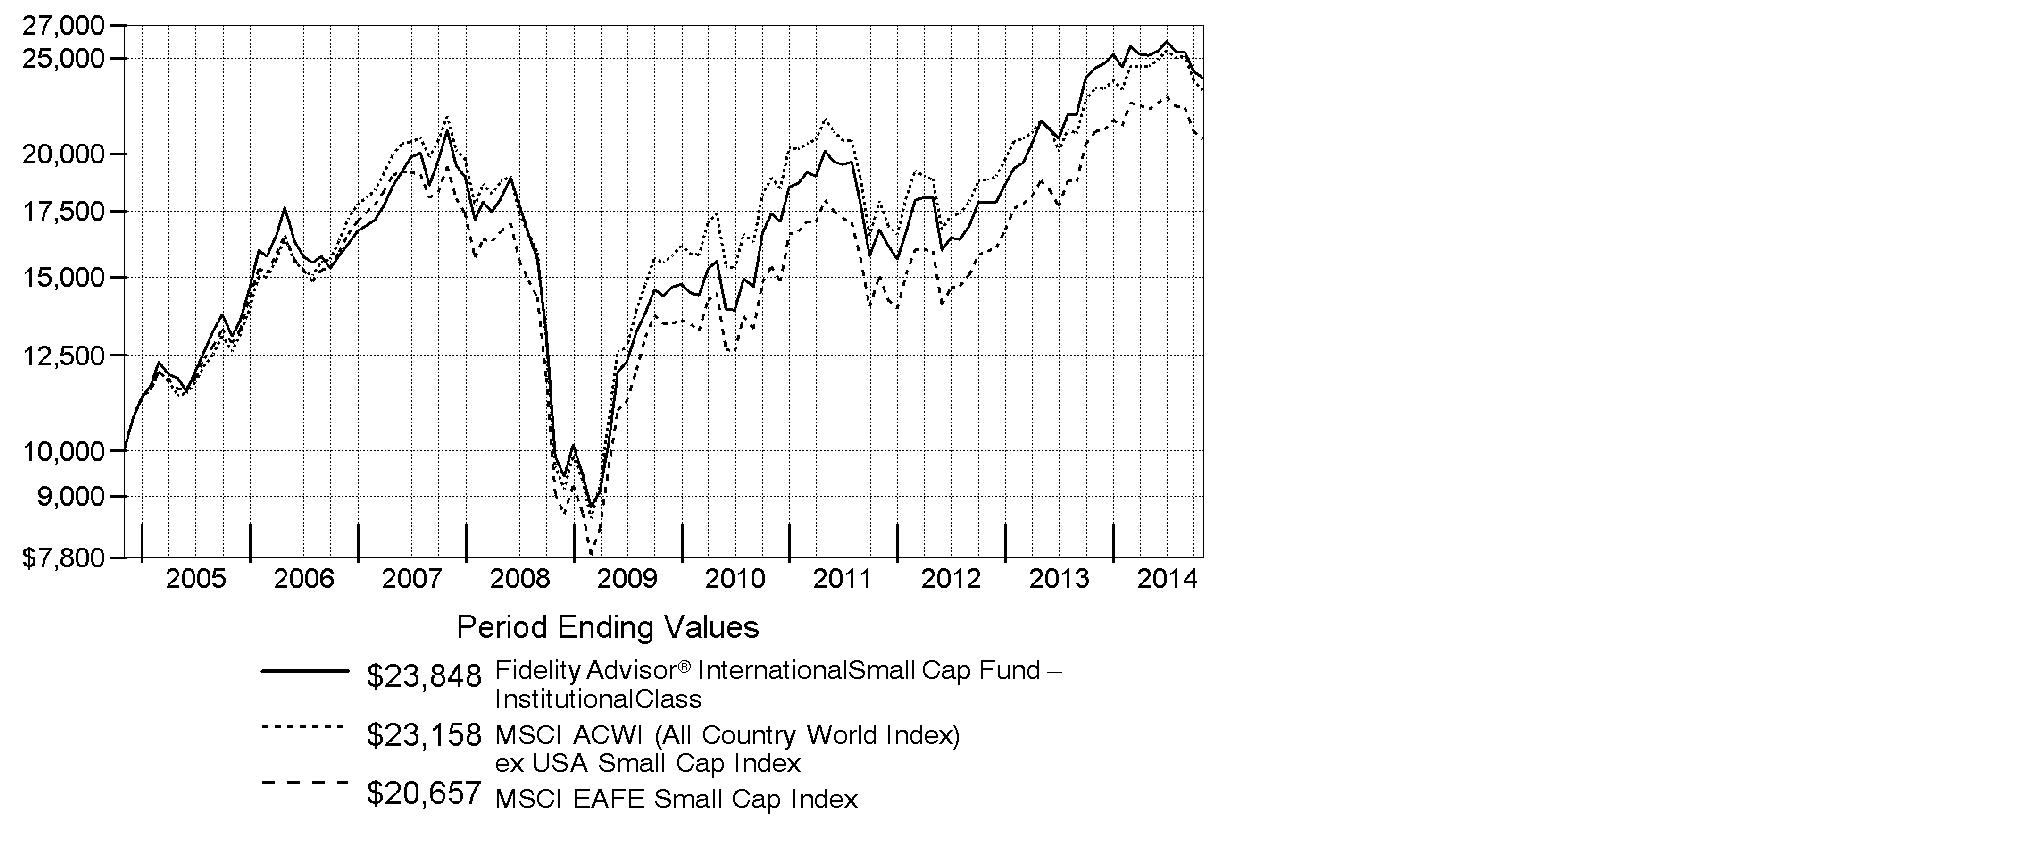
Effective April 1, 2014, the fund began comparing its performance to the MSCI ACWI (All Country World Index) ex USA Small Cap Index rather than the MSCI EAFE Small Cap Index because the MSCI ACWI (All Country World Index) ex USA Small Cap Index provides a more appropriate performance comparison for the fund.
Annual Report
Market Recap: Global equities posted a healthy gain for the 12 months ending October 31, 2014, overcoming an October market decline driven by recessionary pressures in China and tepid growth in Europe. The MSCI ACWI (All Country World Index) Index rose 8.15%, helped by subdued market volatility for much of the period and supported by solid corporate earnings, especially in the United States. Stocks also benefited from easy monetary policies in Japan and the eurozone, as well as increased stimulus efforts in China. All but three of the 24 industry groups that compose the index marked a positive return. The U.S. (+17%) remained a pillar of strength, while a strongly rising dollar in the latter part of the period detracted from investors' returns in most non-U.S. markets. Canada (+5%) notched broad gains outside of its energy and materials sectors, as did Asia-Pacific ex Japan (+4%), led by investor enthusiasm for companies in India. The U.K., Europe and Japan, meanwhile, all underperformed. Among sectors, health care (+24%) led the index, with a strong contribution from the pharmaceuticals, biotechnology & life sciences industry. Information technology (+21%) also outperformed. Conversely, materials (-4%) and energy (-1%) lagged the index due to a higher supply of and lower demand for commodities.
Comments from Samuel Chamovitz, who became Portfolio Manager of Fidelity Advisor® International Small Cap Fund on March 1, 2014: For the year, the fund's Institutional Class shares returned -2.35%, trailing the -0.79% return of the MSCI ACWI (All Country World Index) ex USA Small Cap Index, which became the fund's primary benchmark on April 1, 2014, and the -1.91% result of the old benchmark, the MSCI EAFE Small Cap Index. Additionally, the fund's performance fell short of the 0.29% return of a linked index combining the returns of the MSCI EAFE Small Cap Index, with which the fund was compared through March, and the new MSCI benchmark, with which the fund was compared during the period's final seven months. The fund's benchmark was changed to reflect a broadened investment focus. Stock selection in Japan meaningfully weighed on the fund's relative results. A sizable overweighting in Japanese utility Hokkaido Electric Power was by far the biggest relative detractor. GFK, a Luxembourg-based consumer research provider, also hampered performance. Both detractors I mentioned were sold from the fund. Conversely, the top relative contributor was a non-index position in Japan-based home furnishings retailer Nitori Holdings.
The views expressed above reflect those of the portfolio manager(s) only through the end of the period as stated on the cover of this report and do not necessarily represent the views of Fidelity or any other person in the Fidelity organization. Any such views are subject to change at any time based upon market or other conditions and Fidelity disclaims any responsibility to update such views. These views may not be relied on as investment advice and, because investment decisions for a Fidelity fund are based on numerous factors, may not be relied on as an indication of trading intent on behalf of any Fidelity fund.
Annual Report
Shareholder Expense Example
As a shareholder of the Fund, you incur two types of costs: (1) transaction costs, including sales charges (loads) on purchase payments or redemption proceeds, redemption fees and (2) ongoing costs, including management fees, distribution and/or service (12b-1) fees and other Fund expenses. This Example is intended to help you understand your ongoing costs (in dollars) of investing in the Fund and to compare these costs with the ongoing costs of investing in other mutual funds.
The Example is based on an investment of $1,000 invested at the beginning of the period and held for the entire period (May 1, 2014 to October 31, 2014).
Actual Expenses
The first line of the accompanying table for each class of the Fund provides information about actual account values and actual expenses. You may use the information in this line, together with the amount you invested, to estimate the expenses that you paid over the period. Simply divide your account value by $1,000.00 (for example, an $8,600 account value divided by $1,000.00 = 8.6), then multiply the result by the number in the first line for a class of the Fund under the heading entitled "Expenses Paid During Period" to estimate the expenses you paid on your account during this period. A small balance maintenance fee of $12.00 that is charged once a year may apply for certain accounts with a value of less than $2,000. This fee is not included in the table below. If it was, the estimate of expenses you paid during the period would be higher, and your ending account value lower, by this amount. In addition, the Fund, as a shareholder in the underlying Fidelity Central Funds, will indirectly bear its pro-rata share of the fees and expenses incurred by the underlying Fidelity Central Funds. These fees and expenses are not included in the Fund's annualized expense ratio used to calculate the expense estimate in the table below.
Hypothetical Example for Comparison Purposes
The second line of the accompanying table for each class of the Fund provides information about hypothetical account values and hypothetical expenses based on a Class' actual expense ratio and an assumed rate of return of 5% per year before expenses, which is not the Class' actual return. The hypothetical account values and expenses may not be used to estimate the actual ending account balance or expenses you paid for the period. You may use this information to compare the ongoing costs of investing in the Fund and other funds. To do so, compare this 5% hypothetical example with the 5% hypothetical examples that appear in the shareholder reports of the other funds. A small balance maintenance fee of $12.00 that is charged once a year may apply for certain accounts with a value of less than $2,000. This fee is not included in the table below. If it was, the estimate of expenses you paid during the period would be higher, and your ending account value lower, by this amount. In addition, the Fund, as a shareholder in the underlying Fidelity Central Funds, will indirectly bear its pro-rata share of the fees and expenses incurred by the underlying Fidelity Central Funds. These fees and expenses are not included in the Fund's annualized expense ratio used to calculate the expense estimate in the table below.
Please note that the expenses shown in the table are meant to highlight your ongoing costs only and do not reflect any transaction costs. Therefore, the second line of the table is useful in comparing ongoing costs only, and will not help you determine the relative total costs of owning different funds. In addition, if these transactional costs were included, your costs would have been higher.
Annual Report
| Annualized
Expense Ratio B | Beginning
Account Value
May 1, 2014 | Ending
Account Value
October 31, 2014 | Expenses Paid
During Period*
May 1, 2014
to October 31, 2014 |
Class A | 1.49% | | | |
Actual | | $ 1,000.00 | $ 947.30 | $ 7.31 |
HypotheticalA | | $ 1,000.00 | $ 1,017.69 | $ 7.58 |
Class T | 1.75% | | | |
Actual | | $ 1,000.00 | $ 946.20 | $ 8.58 |
HypotheticalA | | $ 1,000.00 | $ 1,016.38 | $ 8.89 |
Class B | 2.23% | | | |
Actual | | $ 1,000.00 | $ 943.80 | $ 10.93 |
HypotheticalA | | $ 1,000.00 | $ 1,013.96 | $ 11.32 |
Class C | 2.21% | | | |
Actual | | $ 1,000.00 | $ 944.00 | $ 10.83 |
HypotheticalA | | $ 1,000.00 | $ 1,014.06 | $ 11.22 |
International Small Cap | 1.19% | | | |
Actual | | $ 1,000.00 | $ 948.70 | $ 5.85 |
HypotheticalA | | $ 1,000.00 | $ 1,019.21 | $ 6.06 |
Institutional Class | 1.08% | | | |
Actual | | $ 1,000.00 | $ 949.40 | $ 5.31 |
HypotheticalA | | $ 1,000.00 | $ 1,019.76 | $ 5.50 |
A 5% return per year before expenses
B Annualized expense ratio reflects expenses net of applicable fee waivers.
* Expenses are equal to each Class' annualized expense ratio, multiplied by the average account value over the period, multiplied by 184/365 (to reflect the one-half year period).
Annual Report
Investment Changes (Unaudited)
Geographic Diversification (% of fund's net assets) |
As of October 31, 2014 |
 | Japan 21.2% | |
 | United Kingdom 16.9% | |
 | United States of America* 5.7% | |
 | Australia 5.4% | |
 | Switzerland 4.3% | |
 | Canada 4.2% | |
 | France 3.5% | |
 | Germany 3.4% | |
 | Cayman Islands 3.2% | |
 | Other 32.2% | |

* Includes Short-Term Investments and Net Other Assets (Liabilities). |
Percentages are based on country or territory of incorporation and are adjusted for the effect of futures contracts, if applicable. |
As of April 30, 2014 |
| Japan 19.0% | |
| United Kingdom 16.1% | |
| United States of America* 9.8% | |
| Germany 6.1% | |
| France 5.6% | |
| Australia 5.0% | |
| Cayman Islands 3.7% | |
| Bermuda 3.6% | |
| Switzerland 2.8% | |
| Other 28.3% | |

* Includes Short-Term Investments and Net Other Assets (Liabilities). |
Percentages are based on country or territory of incorporation and are adjusted for the effect of futures contracts, if applicable. |
Asset Allocation as of October 31, 2014 |
| % of fund's
net assets | % of fund's net assets
6 months ago |
Stocks | 95.5 | 91.4 |
Bonds | 0.0 | 0.2 |
Investment Companies | 0.0 | 4.5 |
Short-Term Investments and Net Other Assets (Liabilities) | 4.5 | 3.9 |
Top Ten Stocks as of October 31, 2014 |
| % of fund's
net assets | % of fund's net assets
6 months ago |
Tsuruha Holdings, Inc. (Japan, Food & Staples Retailing) | 2.2 | 1.5 |
Ultra Electronics Holdings PLC (United Kingdom, Aerospace & Defense) | 1.3 | 1.0 |
Close Brothers Group PLC (United Kingdom, Capital Markets) | 1.3 | 1.0 |
Dillard's, Inc. Class A (United States of America, Multiline Retail) | 1.2 | 0.9 |
EBOS Group Ltd. (New Zealand, Health Care Providers & Services) | 1.2 | 0.9 |
Nitori Holdings Co. Ltd. (Japan, Specialty Retail) | 1.1 | 1.1 |
Clicks Group Ltd. (South Africa, Food & Staples Retailing) | 1.1 | 0.9 |
Moneysupermarket.com Group PLC (United Kingdom, Internet Software & Services) | 1.0 | 1.1 |
Jyske Bank A/S (Reg.) (Denmark, Banks) | 1.0 | 0.5 |
Pargesa Holding SA (Switzerland, Diversified Financial Services) | 0.9 | 0.9 |
| 12.3 | |
Market Sectors as of October 31, 2014 |
| % of fund's
net assets | % of fund's net assets
6 months ago |
Industrials | 19.4 | 18.6 |
Financials | 18.8 | 17.9 |
Consumer Discretionary | 15.8 | 15.6 |
Information Technology | 11.1 | 11.4 |
Materials | 8.4 | 9.0 |
Health Care | 7.9 | 7.4 |
Consumer Staples | 7.7 | 5.2 |
Energy | 5.2 | 5.6 |
Telecommunication Services | 0.8 | 0.6 |
Utilities | 0.4 | 0.3 |
Annual Report
Investments October 31, 2014
Showing Percentage of Net Assets
Common Stocks - 95.5% |
| Shares | | Value |
Australia - 5.4% |
Austal Ltd. (a) | 3,396,893 | | $ 3,834,820 |
Bradken Ltd. | 1,369,055 | | 4,670,117 |
Challenger Ltd. | 845,650 | | 5,201,309 |
Charter Hall Group unit | 1,196,020 | | 4,604,097 |
GUD Holdings Ltd. (d) | 1,213,118 | | 7,678,736 |
iiNet Ltd. | 455,468 | | 3,214,157 |
Imdex Ltd. (a) | 7,363,809 | | 3,899,196 |
Life Healthcare Group Ltd. | 1,826,612 | | 3,657,331 |
Nanosonics Ltd. (a) | 1,455,582 | | 1,255,061 |
RCG Corp. Ltd. | 2,518,231 | | 1,362,204 |
Slater & Gordon Ltd. | 1,258,177 | | 6,797,893 |
SomnoMed Ltd. (a) | 584,445 | | 1,273,029 |
Vision Group Holdings Ltd. | 1,221,604 | | 809,573 |
TOTAL AUSTRALIA | | 48,257,523 |
Austria - 1.1% |
Andritz AG | 106,312 | | 5,131,822 |
RHI AG | 195,100 | | 4,998,589 |
TOTAL AUSTRIA | | 10,130,411 |
Bailiwick of Jersey - 1.1% |
Kennedy Wilson Europe Real Estate PLC | 236,185 | | 3,929,382 |
Regus PLC (d) | 2,000,300 | | 6,313,363 |
TOTAL BAILIWICK OF JERSEY | | 10,242,745 |
Belgium - 1.3% |
Barco NV | 94,703 | | 6,978,211 |
Econocom Group SA | 735,085 | | 4,748,640 |
TOTAL BELGIUM | | 11,726,851 |
Bermuda - 2.9% |
APT Satellite Holdings Ltd. | 2,096,000 | | 3,051,814 |
BW Offshore Ltd. | 5,156,413 | | 6,322,291 |
Hiscox Ltd. | 604,895 | | 6,589,700 |
Petra Diamonds Ltd. (a) | 1,917,200 | | 5,091,128 |
STELUX Holdings International | 5,614,000 | | 1,245,301 |
Travelport Worldwide Ltd. (d) | 265,100 | | 3,830,695 |
TOTAL BERMUDA | | 26,130,929 |
British Virgin Islands - 0.2% |
Mail.Ru Group Ltd. GDR (Reg. S) (a) | 72,524 | | 1,757,982 |
Canada - 4.2% |
Constellation Software, Inc. | 18,966 | | 5,342,891 |
Common Stocks - continued |
| Shares | | Value |
Canada - continued |
Dorel Industries, Inc. Class B (sub. vtg.) | 104,700 | | $ 3,253,266 |
Genesis Land Development Corp. | 886,300 | | 3,483,704 |
Jean Coutu Group, Inc. Class A (sub. vtg.) | 319,160 | | 7,317,417 |
Lassonde Industries, Inc. Class A (sub. vtg.) | 26,600 | | 2,912,653 |
McCoy Global, Inc. | 244,300 | | 1,036,116 |
ShawCor Ltd. Class A | 154,929 | | 6,825,096 |
Whitecap Resources, Inc. (d) | 585,981 | | 7,585,700 |
TOTAL CANADA | | 37,756,843 |
Cayman Islands - 3.2% |
AMVIG Holdings Ltd. | 11,576,000 | | 5,420,308 |
Bonjour Holdings Ltd. | 47,792,800 | | 6,048,786 |
China High Precision Automation Group Ltd. (a) | 712,000 | | 27,543 |
China Metal Recycling (Holdings) Ltd. (a) | 436,800 | | 1 |
Lifestyle International Holdings Ltd. | 3,661,500 | | 6,956,149 |
Pico Far East Holdings Ltd. | 18,482,000 | | 4,577,046 |
SITC International Holdings Co. Ltd. | 10,248,000 | | 5,459,089 |
TOTAL CAYMAN ISLANDS | | 28,488,922 |
Chile - 0.5% |
Quinenco SA | 2,290,914 | | 4,757,642 |
Denmark - 1.0% |
Jyske Bank A/S (Reg.) (a) | 161,979 | | 8,726,876 |
Finland - 1.9% |
Amer Group PLC (A Shares) | 297,916 | | 5,700,802 |
Kemira Oyj | 358,900 | | 4,632,482 |
Rakentajain Konevuokraamo Oyj (B Shares) (d) | 173,356 | | 2,522,169 |
Tikkurila Oyj | 205,600 | | 4,246,033 |
TOTAL FINLAND | | 17,101,486 |
France - 3.5% |
ALTEN | 112,000 | | 4,788,838 |
Faurecia SA | 119,873 | | 3,874,144 |
Parrot SA (a) | 192,714 | | 3,656,303 |
Sopra Group SA | 61,000 | | 4,572,005 |
The Lisi Group | 170,500 | | 4,275,378 |
The Vicat Group | 93,298 | | 6,378,958 |
Wendel SA | 39,952 | | 4,402,791 |
TOTAL FRANCE | | 31,948,417 |
Germany - 3.4% |
AURELIUS AG | 158,535 | | 5,507,081 |
Common Stocks - continued |
| Shares | | Value |
Germany - continued |
CompuGroup Medical AG | 239,549 | | $ 5,493,492 |
GEA Group AG | 170,762 | | 7,852,378 |
LEG Immobilien AG | 75,836 | | 5,231,615 |
LEONI AG | 82,747 | | 4,733,649 |
SHW Group | 49,128 | | 2,236,032 |
TOTAL GERMANY | | 31,054,247 |
Greece - 0.8% |
Metka SA | 359,600 | | 3,514,935 |
Motor Oil (HELLAS) Corinth Refineries SA | 552,490 | | 4,043,341 |
TOTAL GREECE | | 7,558,276 |
Hong Kong - 1.9% |
Dah Sing Banking Group Ltd. | 3,094,000 | | 5,621,581 |
Far East Horizon Ltd. | 3,161,000 | | 2,939,913 |
Magnificent Estates Ltd. (a) | 91,044,000 | | 4,342,986 |
Singamas Container Holdings Ltd. | 3,360,000 | | 580,876 |
Techtronic Industries Co. Ltd. | 1,184,500 | | 3,708,198 |
TOTAL HONG KONG | | 17,193,554 |
India - 0.7% |
McLeod Russel India Ltd. | 748,354 | | 3,168,801 |
Shriram Transport Finance Co. Ltd. | 186,687 | | 2,887,986 |
TOTAL INDIA | | 6,056,787 |
Ireland - 1.7% |
C&C Group PLC | 1,099,500 | | 4,896,838 |
Mincon Group PLC | 3,000,521 | | 2,782,476 |
United Drug PLC (United Kingdom) | 1,479,749 | | 7,792,673 |
TOTAL IRELAND | | 15,471,987 |
Isle of Man - 0.6% |
Lamprell PLC (a) | 2,352,546 | | 5,522,742 |
Israel - 0.8% |
Frutarom Industries Ltd. | 283,210 | | 7,030,974 |
Italy - 1.0% |
Danieli & C. Officine Meccaniche SpA | 180,697 | | 4,211,792 |
Prysmian SpA | 263,900 | | 4,563,747 |
TOTAL ITALY | | 8,775,539 |
Japan - 21.2% |
A/S One Corp. | 128,900 | | 3,683,560 |
Common Stocks - continued |
| Shares | | Value |
Japan - continued |
ACOM Co. Ltd. (a) | 461,000 | | $ 1,536,627 |
Aeon Delight Co. Ltd. | 146,700 | | 3,583,755 |
Ain Pharmaciez, Inc. | 136,300 | | 3,692,400 |
Arc Land Sakamoto Co. Ltd. | 172,100 | | 3,836,649 |
Asahi Co. Ltd. | 239,400 | | 2,661,849 |
Broadleaf Co. Ltd. | 471,200 | | 7,447,388 |
Daiwa Industries Ltd. | 446,000 | | 3,400,792 |
Fuji Corp. | 147,800 | | 1,523,684 |
Fukuda Denshi Co. Ltd. | 148,400 | | 7,595,265 |
GMO Internet, Inc. | 676,800 | | 5,682,740 |
Higashi Nihon House Co. Ltd. (d) | 1,224,500 | | 5,189,887 |
Hoshizaki Electric Co. Ltd. | 92,000 | | 4,456,265 |
Iida Group Holdings Co. Ltd. | 325,351 | | 3,615,353 |
JSR Corp. | 479,800 | | 8,640,363 |
KAWAI Musical Instruments Manufacturing Co. Ltd. | 234,400 | | 4,407,999 |
Kinugawa Rubber Industrial Co. Ltd. | 601,000 | | 2,547,457 |
Kotobuki Spirits Co. Ltd. | 87,700 | | 1,744,625 |
Leopalace21 Corp. (a) | 1,288,500 | | 8,070,463 |
Meitec Corp. | 164,700 | | 5,164,819 |
Miraca Holdings, Inc. | 139,600 | | 5,860,332 |
Mitani Shoji Co. Ltd. | 234,300 | | 5,943,325 |
Nitori Holdings Co. Ltd. | 155,300 | | 9,842,226 |
Paramount Bed Holdings Co. Ltd. | 182,000 | | 5,176,488 |
Ricoh Leasing Co. Ltd. | 258,900 | | 7,223,343 |
San-Ai Oil Co. Ltd. | 740,000 | | 5,122,345 |
Ship Healthcare Holdings, Inc. | 94,400 | | 2,209,544 |
TFP Consulting Group Co. Ltd. | 171,500 | | 5,003,205 |
TKC Corp. | 354,500 | | 6,959,278 |
Tokyo Ohka Kogyo Co. Ltd. | 166,400 | | 4,693,072 |
Toshiba Plant Systems & Services Corp. | 390,500 | | 6,536,302 |
Toyo Suisan Kaisha Ltd. | 195,000 | | 6,734,567 |
Tsuruha Holdings, Inc. | 340,600 | | 20,109,285 |
Uchiyama Holdings Co. Ltd. | 451,600 | | 2,622,789 |
VT Holdings Co. Ltd. | 1,240,900 | | 4,900,603 |
Welcia Holdings Co. Ltd. (d) | 110,400 | | 3,688,167 |
TOTAL JAPAN | | 191,106,811 |
Korea (South) - 1.9% |
Hy-Lok Corp. | 120,010 | | 3,255,906 |
KEPCO Plant Service & Engineering Co. Ltd. | 77,030 | | 6,287,461 |
Koh Young Technology, Inc. | 104,779 | | 3,218,133 |
Common Stocks - continued |
| Shares | | Value |
Korea (South) - continued |
Soulbrain Co. Ltd. | 69,713 | | $ 1,751,836 |
TK Corp. (a) | 172,528 | | 2,215,922 |
TOTAL KOREA (SOUTH) | | 16,729,258 |
Luxembourg - 0.7% |
Grand City Properties SA (a)(d) | 471,873 | | 6,046,325 |
Malaysia - 0.3% |
Kossan Rubber Industries Bhd | 2,012,100 | | 2,813,406 |
Netherlands - 1.7% |
Amsterdam Commodities NV | 270,721 | | 6,079,432 |
BinckBank NV | 467,100 | | 4,624,822 |
IMCD Group BV | 173,500 | | 4,783,274 |
TOTAL NETHERLANDS | | 15,487,528 |
New Zealand - 1.9% |
EBOS Group Ltd. | 1,408,656 | | 10,508,313 |
Nuplex Industries Ltd. | 2,588,739 | | 6,356,454 |
TOTAL NEW ZEALAND | | 16,864,767 |
Norway - 1.7% |
ABG Sundal Collier ASA (a) | 6,803,251 | | 4,992,786 |
Ekornes A/S | 444,997 | | 4,750,189 |
Kongsberg Gruppen ASA | 282,200 | | 5,710,984 |
TOTAL NORWAY | | 15,453,959 |
Singapore - 2.0% |
Amtek Engineering Ltd. | 6,985,000 | | 3,288,012 |
Boustead Singapore Ltd. | 2,261,000 | | 3,234,692 |
Hour Glass Ltd. | 2,454,000 | | 3,529,772 |
Mapletree Industrial (REIT) | 2,909,778 | | 3,341,974 |
OSIM International Ltd. | 2,886,000 | | 4,180,724 |
TOTAL SINGAPORE | | 17,575,174 |
South Africa - 1.3% |
Clicks Group Ltd. | 1,411,540 | | 9,610,975 |
Pinnacle Technology Holdings Ltd. | 1,900,130 | | 2,098,287 |
TOTAL SOUTH AFRICA | | 11,709,262 |
Sweden - 1.0% |
AddTech AB (B Shares) (d) | 211,656 | | 3,016,839 |
Meda AB (A Shares) (d) | 425,000 | | 5,582,904 |
TOTAL SWEDEN | | 8,599,743 |
Common Stocks - continued |
| Shares | | Value |
Switzerland - 4.3% |
Allied World Assurance Co. | 206,900 | | $ 7,862,200 |
Clariant AG (Reg.) | 307,372 | | 5,351,017 |
Daetwyler Holdings AG | 20,416 | | 2,584,492 |
Pargesa Holding SA | 111,676 | | 8,676,174 |
Vontobel Holdings AG | 227,903 | | 8,278,553 |
VZ Holding AG | 37,391 | | 6,159,615 |
TOTAL SWITZERLAND | | 38,912,051 |
Taiwan - 0.8% |
Richtek Technology Corp. | 251,000 | | 1,209,316 |
Tripod Technology Corp. | 3,369,000 | | 6,296,218 |
TOTAL TAIWAN | | 7,505,534 |
Thailand - 1.0% |
Delta Electronics PCL (For. Reg.) | 3,795,000 | | 7,532,319 |
TISCO Financial Group PCL | 916,800 | | 1,253,009 |
TOTAL THAILAND | | 8,785,328 |
Turkey - 0.4% |
Aygaz A/S | 821,000 | | 3,461,080 |
United Kingdom - 16.9% |
Aberdeen Asset Management PLC | 996,500 | | 6,918,399 |
Alent PLC | 472,808 | | 2,556,466 |
AMEC PLC | 469,241 | | 7,806,706 |
Ashmore Group PLC (d) | 1,091,793 | | 5,564,480 |
Balfour Beatty PLC | 644,000 | | 1,583,428 |
BBA Aviation PLC | 1,384,681 | | 7,834,717 |
Bond International Software PLC | 843,266 | | 1,254,545 |
Brammer PLC | 377,864 | | 1,959,991 |
Brewin Dolphin Holding PLC | 763,663 | | 3,468,212 |
Cineworld Group PLC | 1,024,176 | | 5,488,554 |
Close Brothers Group PLC | 485,800 | | 11,377,246 |
Countrywide PLC | 951,700 | | 6,972,750 |
Craneware PLC | 354,064 | | 2,817,821 |
Diploma PLC | 551,052 | | 6,130,957 |
Informa PLC | 753,906 | | 5,800,973 |
ITE Group PLC | 1,169,900 | | 3,186,210 |
Luxfer Holdings PLC sponsored ADR | 386,100 | | 6,150,573 |
Mears Group PLC | 750,060 | | 5,303,430 |
Meggitt PLC | 982,183 | | 7,087,675 |
Micro Focus International PLC | 434,227 | | 6,890,759 |
Moneysupermarket.com Group PLC | 2,757,200 | | 8,821,386 |
Common Stocks - continued |
| Shares | | Value |
United Kingdom - continued |
Morgan Advanced Materials PLC | 560,608 | | $ 2,533,473 |
Provident Financial PLC | 201,078 | | 6,828,937 |
Pureprofile Media PLC (a)(e) | 1,108,572 | | 993,094 |
Silverdell PLC (a) | 12,644,400 | | 202 |
Sinclair Pharma PLC (a) | 8,403,003 | | 3,847,854 |
Spectris PLC | 209,600 | | 6,042,054 |
Spirent Communications PLC | 4,227,000 | | 5,074,830 |
Ultra Electronics Holdings PLC | 416,244 | | 11,619,353 |
TOTAL UNITED KINGDOM | | 151,915,075 |
United States of America - 1.2% |
Dillard's, Inc. Class A | 104,271 | | 11,027,701 |
YOU On Demand Holdings, Inc. warrants 8/30/17 (a)(e) | 27,500 | | 7,176 |
TOTAL UNITED STATES OF AMERICA | | 11,034,877 |
TOTAL COMMON STOCKS (Cost $867,303,447) |
859,690,911
|
Money Market Funds - 5.4% |
| | | |
Fidelity Cash Central Fund, 0.11% (b) | 32,958,996 | | 32,958,996 |
Fidelity Securities Lending Cash Central Fund, 0.11% (b)(c) | 15,223,760 | | 15,223,760 |
TOTAL MONEY MARKET FUNDS (Cost $48,182,756) |
48,182,756
|
TOTAL INVESTMENT PORTFOLIO - 100.9% (Cost $915,486,203) | | 907,873,667 |
NET OTHER ASSETS (LIABILITIES) - (0.9)% | | (7,799,874) |
NET ASSETS - 100% | $ 900,073,793 |
Legend |
(a) Non-income producing |
(b) Affiliated fund that is generally available only to investment companies and other accounts managed by Fidelity Investments. The rate quoted is the annualized seven-day yield of the fund at period end. A complete unaudited listing of the fund's holdings as of its most recent quarter end is available upon request. In addition, each Fidelity Central Fund's financial statements, which are not covered by the Fund's Report of Independent Registered Public Accounting Firm, are available on the SEC's website or upon request. |
(c) Investment made with cash collateral received from securities on loan. |
(d) Security or a portion of the security is on loan at period end. |
(e) Restricted securities - Investment in securities not registered under the Securities Act of 1933 (excluding 144A issues). At the end of the period, the value of restricted securities (excluding 144A issues) amounted to $1,000,270 or 0.1% of net assets. |
Additional information on each restricted holding is as follows: |
Security | Acquisition Date | Acquisition Cost |
Pureprofile Media PLC | 5/3/05 - 1/11/06 | $ 1,173,341 |
YOU On Demand Holdings, Inc. warrants 8/30/17 | 9/14/12 | $ 0 |
Affiliated Central Funds |
Information regarding fiscal year to date income earned by the Fund from investments in Fidelity Central Funds is as follows: |
Fund | Income earned |
Fidelity Cash Central Fund | $ 50,747 |
Fidelity Securities Lending Cash Central Fund | 303,427 |
Total | $ 354,174 |
Other Affiliated Issuers |
An affiliated company is a company in which the Fund has ownership of at least 5% of the voting securities. Fiscal year to date transactions with companies which are or were affiliates are as follows: |
Affiliate | Value, beginning of period | Purchases | Sales
Proceeds | Dividend Income | Value,
end of
period |
Pertama Holdings Ltd. | $ 12,066,495 | $ - | $ 12,052,911 | $ 64,973 | $ - |
Other Information |
Categorizations in the Schedule of Investments are based on country or territory of incorporation. |
The following is a summary of the inputs used, as of October 31, 2014, involving the Fund's assets and liabilities carried at fair value. The inputs or methodology used for valuing securities may not be an indication of the risk associated with investing in those securities. For more information on valuation inputs, and their aggregation into the levels used in the tables below, please refer to the Investment Valuation section in the accompanying Notes to Financial Statements. |
Valuation Inputs at Reporting Date: |
Description | Total | Level 1 | Level 2 | Level 3 |
Investments in Securities: | | | | |
Equities: | | | | |
Consumer Discretionary | $ 142,842,893 | $ 53,882,215 | $ 88,960,678 | $ - |
Consumer Staples | 69,955,160 | 30,817,315 | 39,137,845 | - |
Energy | 47,499,029 | 39,141,992 | 8,357,037 | - |
Financials | 168,321,950 | 125,641,648 | 42,680,302 | - |
Health Care | 72,999,435 | 36,043,057 | 36,956,378 | - |
Industrials | 171,122,482 | 119,200,903 | 51,921,377 | 202 |
Information Technology | 101,392,760 | 65,244,864 | 35,127,259 | 1,020,637 |
Materials | 75,830,151 | 53,177,211 | 22,652,939 | 1 |
Telecommunication Services | 6,265,971 | - | 6,265,971 | - |
Utilities | 3,461,080 | 3,461,080 | - | - |
Money Market Funds | 48,182,756 | 48,182,756 | - | - |
Total Investments in Securities: | $ 907,873,667 | $ 574,793,041 | $ 332,059,786 | $ 1,020,840 |
The following is a summary of transfers between Level 1 and Level 2 for the period ended October 31, 2014. Transfers are assumed to have occurred at the beginning of the period, and are primarily attributable to the valuation techniques used for foreign equity securities, as discussed in the accompanying Notes to Financial Statements: |
Transfers | Total |
Level 1 to Level 2 | $ 21,867,578 |
Level 2 to Level 1 | $ 0 |
Valuation Inputs at Reporting Date: |
The following is a reconciliation of Investments in Securities for which Level 3 inputs were used in determining value: |
Investments in Securities: | |
Beginning Balance | $ 11,069,913 |
Net Realized Gain (Loss) on Investment Securities | (13,418,381) |
Net Unrealized Gain (Loss) on Investment Securities | 12,110,008 |
Cost of Purchases | - |
Proceeds of Sales | (8,740,700) |
Amortization/Accretion | - |
Transfers into Level 3 | - |
Transfers out of Level 3 | - |
Ending Balance | $ 1,020,840 |
The change in unrealized gain (loss) for the period attributable to Level 3 securities held at October 31, 2014 | $ (1,179,794) |
The information used in the above reconciliation represents fiscal year to date activity for any Investments in Securities identified as using Level 3 inputs at either the beginning or the end of the current fiscal period. Transfers in or out of Level 3 represent the beginning value of any Security or Instrument where a change in the pricing level occurred from the beginning to the end of the period. The cost of purchases and the proceeds of sales may include securities received or delivered through corporate actions or exchanges. Realized and unrealized gains (losses) disclosed in the reconciliation are included in Net Gain (Loss) on the Fund's Statement of Operations. |
See accompanying notes which are an integral part of the financial statements.
Annual Report
Statement of Assets and Liabilities
| October 31, 2014 |
| | |
Assets | | |
Investment in securities, at value (including securities loaned of $14,662,713) - See accompanying schedule: Unaffiliated issuers (cost $867,303,447) | $ 859,690,911 | |
Fidelity Central Funds (cost $48,182,756) | 48,182,756 | |
Total Investments (cost $915,486,203) | | $ 907,873,667 |
Foreign currency held at value (cost $28,166) | | 28,224 |
Receivable for investments sold | | 9,322,189 |
Receivable for fund shares sold | | 473,019 |
Dividends receivable | | 2,328,647 |
Distributions receivable from Fidelity Central Funds | | 9,252 |
Prepaid expenses | | 3,248 |
Other receivables | | 22,671 |
Total assets | | 920,060,917 |
| | |
Liabilities | | |
Payable for investments purchased | $ 2,303,470 | |
Payable for fund shares redeemed | 1,314,911 | |
Accrued management fee | 648,973 | |
Distribution and service plan fees payable | 21,325 | |
Other affiliated payables | 236,320 | |
Other payables and accrued expenses | 238,365 | |
Collateral on securities loaned, at value | 15,223,760 | |
Total liabilities | | 19,987,124 |
| | |
Net Assets | | $ 900,073,793 |
Net Assets consist of: | | |
Paid in capital | | $ 792,123,948 |
Undistributed net investment income | | 7,150,729 |
Accumulated undistributed net realized gain (loss) on investments and foreign currency transactions | | 108,515,351 |
Net unrealized appreciation (depreciation) on investments and assets and liabilities in foreign currencies | | (7,716,235) |
Net Assets | | $ 900,073,793 |
See accompanying notes which are an integral part of the financial statements.
Annual Report
Statement of Assets and Liabilities - continued
| October 31, 2014 |
| | |
Calculation of Maximum Offering Price Class A:
Net Asset Value and redemption price per share ($24,571,948 ÷ 983,534 shares) | | $ 24.98 |
| | |
Maximum offering price per share (100/94.25 of $24.98) | | $ 26.50 |
Class T:
Net Asset Value and redemption price per share ($12,295,831 ÷ 495,632 shares) | | $ 24.81 |
| | |
Maximum offering price per share (100/96.50 of $24.81) | | $ 25.71 |
Class B:
Net Asset Value and offering price per share ($506,850 ÷ 20,678 shares)A | | $ 24.51 |
| | |
Class C:
Net Asset Value and offering price per share ($12,576,184 ÷ 518,246 shares)A | | $ 24.27 |
| | |
International Small Cap:
Net Asset Value, offering price and redemption price per share ($842,030,670 ÷ 33,228,137 shares) | | $ 25.34 |
| | |
Institutional Class:
Net Asset Value, offering price and redemption price per share ($8,092,310 ÷ 319,321 shares) | | $ 25.34 |
A Redemption price per share is equal to net asset value less any applicable contingent deferred sales charge.
See accompanying notes which are an integral part of the financial statements.
Annual Report
Financial Statements - continued
Statement of Operations
| Year ended October 31, 2014 |
| | |
Investment Income | | |
Dividends (including $64,973 earned from other affiliated issuers) | | $ 25,627,606 |
Interest | | 79,016 |
Income from Fidelity Central Funds | | 354,174 |
Income before foreign taxes withheld | | 26,060,796 |
Less foreign taxes withheld | | (1,980,834) |
Total income | | 24,079,962 |
| | |
Expenses | | |
Management fee
Basic fee | $ 9,557,249 | |
Performance adjustment | (582) | |
Transfer agent fees | 2,603,537 | |
Distribution and service plan fees | 294,101 | |
Accounting and security lending fees | 522,545 | |
Custodian fees and expenses | 385,115 | |
Independent trustees' compensation | 4,685 | |
Registration fees | 117,677 | |
Audit | 151,972 | |
Legal | 9,683 | |
Miscellaneous | 108,677 | |
Total expenses before reductions | 13,754,659 | |
Expense reductions | (43,342) | 13,711,317 |
Net investment income (loss) | | 10,368,645 |
Realized and Unrealized Gain (Loss) Net realized gain (loss) on: | | |
Investment securities: | | |
Unaffiliated issuers (net of foreign taxes of $20,368) | 221,431,771 | |
Other affiliated issuers | 5,640,625 | |
Foreign currency transactions | (336,386) | |
Total net realized gain (loss) | | 226,736,010 |
Change in net unrealized appreciation (depreciation) on: Investment securities (net of increase in deferred foreign taxes of $56,345) | (253,641,424) | |
Assets and liabilities in foreign currencies | (27,887) | |
Total change in net unrealized appreciation (depreciation) | | (253,669,311) |
Net gain (loss) | | (26,933,301) |
Net increase (decrease) in net assets resulting from operations | | $ (16,564,656) |
See accompanying notes which are an integral part of the financial statements.
Annual Report
Statement of Changes in Net Assets
| Year ended
October 31,
2014 | Year ended
October 31,
2013 |
Increase (Decrease) in Net Assets | | |
Operations | | |
Net investment income (loss) | $ 10,368,645 | $ 4,434,071 |
Net realized gain (loss) | 226,736,010 | 66,068,952 |
Change in net unrealized appreciation (depreciation) | (253,669,311) | 198,875,293 |
Net increase (decrease) in net assets resulting from operations | (16,564,656) | 269,378,316 |
Distributions to shareholders from net investment income | (4,012,676) | (4,769,550) |
Distributions to shareholders from net realized gain | (26,257,450) | (11,754,787) |
Total distributions | (30,270,126) | (16,524,337) |
Share transactions - net increase (decrease) | (201,807,331) | 162,217,941 |
Redemption fees | 276,780 | 119,206 |
Total increase (decrease) in net assets | (248,365,333) | 415,191,126 |
| | |
Net Assets | | |
Beginning of period | 1,148,439,126 | 733,248,000 |
End of period (including undistributed net investment income of $7,150,729 and undistributed net investment income of $4,006,124, respectively) | $ 900,073,793 | $ 1,148,439,126 |
See accompanying notes which are an integral part of the financial statements.
Annual Report
Financial Highlights - Class A
Years ended October 31, | 2014 | 2013 | 2012 | 2011 | 2010 |
Selected Per-Share Data | | | | | |
Net asset value, beginning of period | $ 26.34 | $ 19.74 | $ 18.97 | $ 20.42 | $ 17.28 |
Income from Investment Operations | | | | | |
Net investment income (loss) C | .17 | .06 | .06 | .10 | .03 |
Net realized and unrealized gain (loss) | (.89) | 6.94 | 1.09 | (.88) | 3.51 |
Total from investment operations | (.72) | 7.00 | 1.15 | (.78) | 3.54 |
Distributions from net investment income | (.05) | (.07) | (.11) | (.02) | (.06) |
Distributions from net realized gain | (.60) | (.33) | (.27) | (.66) | (.34) |
Total distributions | (.65) | (.40) | (.38) | (.68) | (.40) |
Redemption fees added to paid in capital C | .01 | - G | - G | .01 | - G |
Net asset value, end of period | $ 24.98 | $ 26.34 | $ 19.74 | $ 18.97 | $ 20.42 |
Total ReturnA, B | (2.79)% | 36.18% | 6.28% | (4.00)% | 20.85% |
Ratios to Average Net Assets E, F | | | | | |
Expenses before reductions | 1.50% | 1.61% | 1.63% | 1.56% | 1.71% |
Expenses net of fee waivers, if any | 1.50% | 1.61% | 1.63% | 1.55% | 1.65% |
Expenses net of all reductions | 1.50% | 1.60% | 1.60% | 1.54% | 1.63% |
Net investment income (loss) | .65% | .25% | .32% | .49% | .16% |
Supplemental Data | | | | | |
Net assets, end of period (000 omitted) | $ 24,572 | $ 24,020 | $ 14,125 | $ 17,185 | $ 19,720 |
Portfolio turnover rate D | 102% | 54% | 68% | 47% | 66% |
A Total returns would have been lower if certain expenses had not been reduced during the applicable periods shown.
B Total returns do not include the effect of the sales charges.
C Calculated based on average shares outstanding during the period.
D Amounts do not include the activity of the Underlying Funds.
E Fees and expenses of any underlying Fidelity Central Funds are not included in the Fund's expense ratio. The Fund indirectly bears its proportionate share of the expenses of any underlying Fidelity Central Funds.
F Expense ratios reflect operating expenses of the class. Expenses before reductions do not reflect amounts reimbursed by the investment adviser or reductions from brokerage service arrangements or reductions from other expense offset arrangements and do not represent the amount paid by the class during periods when reimbursements or reductions occur. Expenses net of fee waivers reflect expenses after reimbursement by the investment adviser but prior to reductions from brokerage service arrangements or other expense offset arrangements. Expenses net of all reductions represent the net expenses paid by the class.
G Amount represents less than $.01 per share.
See accompanying notes which are an integral part of the financial statements.
Annual Report
Financial Highlights - Class T
Years ended October 31, | 2014 | 2013 | 2012 | 2011 | 2010 |
Selected Per-Share Data | | | | | |
Net asset value, beginning of period | $ 26.17 | $ 19.59 | $ 18.80 | $ 20.23 | $ 17.14 |
Income from Investment Operations | | | | | |
Net investment income (loss) C | .10 | - G | .01 | .05 | (.02) |
Net realized and unrealized gain (loss) | (.87) | 6.90 | 1.08 | (.86) | 3.47 |
Total from investment operations | (.77) | 6.90 | 1.09 | (.81) | 3.45 |
Distributions from net investment income | - | - | (.03) | - | (.02) |
Distributions from net realized gain | (.60) | (.32) | (.27) | (.63) | (.34) |
Total distributions | (.60) | (.32) | (.30) | (.63) | (.36) |
Redemption fees added to paid in capital C | .01 | - G | - G | .01 | - G |
Net asset value, end of period | $ 24.81 | $ 26.17 | $ 19.59 | $ 18.80 | $ 20.23 |
Total ReturnA, B | (3.00)% | 35.80% | 5.97% | (4.18)% | 20.46% |
Ratios to Average Net Assets E, F | | | | | |
Expenses before reductions | 1.77% | 1.87% | 1.88% | 1.82% | 1.97% |
Expenses net of fee waivers, if any | 1.77% | 1.87% | 1.88% | 1.81% | 1.90% |
Expenses net of all reductions | 1.76% | 1.85% | 1.85% | 1.79% | 1.88% |
Net investment income (loss) | .38% | (.01)% | .07% | .24% | (.09)% |
Supplemental Data | | | | | |
Net assets, end of period (000 omitted) | $ 12,296 | $ 13,530 | $ 9,262 | $ 13,744 | $ 16,092 |
Portfolio turnover rate D | 102% | 54% | 68% | 47% | 66% |
A Total returns would have been lower if certain expenses had not been reduced during the applicable periods shown.
B Total returns do not include the effect of the sales charges.
C Calculated based on average shares outstanding during the period.
D Amounts do not include the activity of the Underlying Funds.
E Fees and expenses of any underlying Fidelity Central Funds are not included in the Fund's expense ratio. The Fund indirectly bears its proportionate share of the expenses of any underlying Fidelity Central Funds.
F Expense ratios reflect operating expenses of the class. Expenses before reductions do not reflect amounts reimbursed by the investment adviser or reductions from brokerage service arrangements or reductions from other expense offset arrangements and do not represent the amount paid by the class during periods when reimbursements or reductions occur. Expenses net of fee waivers reflect expenses after reimbursement by the investment adviser but prior to reductions from brokerage service arrangements or other expense offset arrangements. Expenses net of all reductions represent the net expenses paid by the class.
G Amount represents less than $.01 per share.
See accompanying notes which are an integral part of the financial statements.
Annual Report
Financial Highlights - Class B
Years ended October 31, | 2014 | 2013 | 2012 | 2011 | 2010 |
Selected Per-Share Data | | | | | |
Net asset value, beginning of period | $ 25.87 | $ 19.22 | $ 18.38 | $ 19.79 | $ 16.78 |
Income from Investment Operations | | | | | |
Net investment income (loss) C | (.03) | (.11) | (.08) | (.05) | (.10) |
Net realized and unrealized gain (loss) | (.87) | 6.84 | 1.07 | (.85) | 3.39 |
Total from investment operations | (.90) | 6.73 | .99 | (.90) | 3.29 |
Distributions from net realized gain | (.47) | (.08) | (.15) | (.52) | (.28) |
Redemption fees added to paid in capital C | .01 | - G | - G | .01 | - G |
Net asset value, end of period | $ 24.51 | $ 25.87 | $ 19.22 | $ 18.38 | $ 19.79 |
Total ReturnA, B | (3.52)% | 35.14% | 5.45% | (4.68)% | 19.90% |
Ratios to Average Net Assets E, F | | | | | |
Expenses before reductions | 2.28% | 2.37% | 2.38% | 2.32% | 2.47% |
Expenses net of fee waivers, if any | 2.28% | 2.36% | 2.38% | 2.30% | 2.40% |
Expenses net of all reductions | 2.27% | 2.35% | 2.35% | 2.29% | 2.38% |
Net investment income (loss) | (.13)% | (.51)% | (.43)% | (.26)% | (.59)% |
Supplemental Data | | | | | |
Net assets, end of period (000 omitted) | $ 507 | $ 795 | $ 790 | $ 2,067 | $ 3,457 |
Portfolio turnover rate D | 102% | 54% | 68% | 47% | 66% |
A Total returns would have been lower if certain expenses had not been reduced during the applicable periods shown.
B Total returns do not include the effect of the contingent deferred sales charge.
C Calculated based on average shares outstanding during the period.
D Amounts do not include the activity of the Underlying Funds.
E Fees and expenses of any underlying Fidelity Central Funds are not included in the Fund's expense ratio. The Fund indirectly bears its proportionate share of the expenses of any underlying Fidelity Central Funds.
F Expense ratios reflect operating expenses of the class. Expenses before reductions do not reflect amounts reimbursed by the investment adviser or reductions from brokerage service arrangements or reductions from other expense offset arrangements and do not represent the amount paid by the class during periods when reimbursements or reductions occur. Expenses net of fee waivers reflect expenses after reimbursement by the investment adviser but prior to reductions from brokerage service arrangements or other expense offset arrangements. Expenses net of all reductions represent the net expenses paid by the class.
G Amount represents less than $.01 per share.
See accompanying notes which are an integral part of the financial statements.
Annual Report
Financial Highlights - Class C
Years ended October 31, | 2014 | 2013 | 2012 | 2011 | 2010 |
Selected Per-Share Data | | | | | |
Net asset value, beginning of period | $ 25.68 | $ 19.18 | $ 18.38 | $ 19.85 | $ 16.85 |
Income from Investment Operations | | | | | |
Net investment income (loss) C | (.02) | (.11) | (.08) | (.04) | (.10) |
Net realized and unrealized gain (loss) | (.85) | 6.79 | 1.07 | (.85) | 3.40 |
Total from investment operations | (.87) | 6.68 | .99 | (.89) | 3.30 |
Distributions from net realized gain | (.55) | (.18) | (.19) | (.59) | (.30) |
Redemption fees added to paid in capital C | .01 | - G | - G | .01 | - G |
Net asset value, end of period | $ 24.27 | $ 25.68 | $ 19.18 | $ 18.38 | $ 19.85 |
Total ReturnA, B | (3.43)% | 35.15% | 5.46% | (4.64)% | 19.86% |
Ratios to Average Net Assets E, F | | | | | |
Expenses before reductions | 2.23% | 2.33% | 2.38% | 2.27% | 2.42% |
Expenses net of fee waivers, if any | 2.22% | 2.33% | 2.38% | 2.26% | 2.40% |
Expenses net of all reductions | 2.22% | 2.32% | 2.35% | 2.24% | 2.37% |
Net investment income (loss) | (.07)% | (.47)% | (.43)% | (.21)% | (.59)% |
Supplemental Data | | | | | |
Net assets, end of period (000 omitted) | $ 12,576 | $ 13,426 | $ 6,799 | $ 9,545 | $ 13,501 |
Portfolio turnover rate D | 102% | 54% | 68% | 47% | 66% |
A Total returns would have been lower if certain expenses had not been reduced during the applicable periods shown.
B Total returns do not include the effect of the contingent deferred sales charge.
C Calculated based on average shares outstanding during the period.
D Amounts do not include the activity of the Underlying Funds.
E Fees and expenses of any underlying Fidelity Central Funds are not included in the Fund's expense ratio. The Fund indirectly bears its proportionate share of the expenses of any underlying Fidelity Central Funds.
F Expense ratios reflect operating expenses of the class. Expenses before reductions do not reflect amounts reimbursed by the investment adviser or reductions from brokerage service arrangements or reductions from other expense offset arrangements and do not represent the amount paid by the class during periods when reimbursements or reductions occur. Expenses net of fee waivers reflect expenses after reimbursement by the investment adviser but prior to reductions from brokerage service arrangements or other expense offset arrangements. Expenses net of all reductions represent the net expenses paid by the class.
G Amount represents less than $.01 per share.
See accompanying notes which are an integral part of the financial statements.
Annual Report
Financial Highlights - International Small Cap
Years ended October 31, | 2014 | 2013 | 2012 | 2011 | 2010 |
Selected Per-Share Data | | | | | |
Net asset value, beginning of period | $ 26.67 | $ 19.99 | $ 19.23 | $ 20.66 | $ 17.48 |
Income from Investment Operations | | | | | |
Net investment income (loss) B | .25 | .12 | .11 | .17 | .07 |
Net realized and unrealized gain (loss) | (.90) | 7.02 | 1.10 | (.89) | 3.53 |
Total from investment operations | (.65) | 7.14 | 1.21 | (.72) | 3.60 |
Distributions from net investment income | (.09) | (.14) | (.18) | (.06) | (.08) |
Distributions from net realized gain | (.60) | (.33) | (.27) | (.66) | (.34) |
Total distributions | (.69) | (.46) G | (.45) | (.72) | (.42) |
Redemption fees added to paid in capital B | .01 | - F | - F | .01 | - F |
Net asset value, end of period | $ 25.34 | $ 26.67 | $ 19.99 | $ 19.23 | $ 20.66 |
Total ReturnA | (2.48)% | 36.56% | 6.55% | (3.65)% | 21.02% |
Ratios to Average Net Assets D, E | | | | | |
Expenses before reductions | 1.21% | 1.33% | 1.35% | 1.26% | 1.44% |
Expenses net of fee waivers, if any | 1.20% | 1.32% | 1.35% | 1.25% | 1.44% |
Expenses net of all reductions | 1.20% | 1.31% | 1.33% | 1.23% | 1.42% |
Net investment income (loss) | .95% | .53% | .59% | .80% | .37% |
Supplemental Data | | | | | |
Net assets, end of period (000 omitted) | $ 842,031 | $ 1,029,629 | $ 692,769 | $ 856,692 | $ 808,478 |
Portfolio turnover rate C | 102% | 54% | 68% | 47% | 66% |
A Total returns would have been lower if certain expenses had not been reduced during the applicable periods shown.
B Calculated based on average shares outstanding during the period.
C Amounts do not include the activity of the Underlying Funds.
D Fees and expenses of any underlying Fidelity Central Funds are not included in the Fund's expense ratio. The Fund indirectly bears its proportionate share of the expenses of any underlying Fidelity Central Funds.
E Expense ratios reflect operating expenses of the class. Expenses before reductions do not reflect amounts reimbursed by the investment adviser or reductions from brokerage service arrangements or reductions from other expense offset arrangements and do not represent the amount paid by the class during periods when reimbursements or reductions occur. Expenses net of fee waivers reflect expenses after reimbursement by the investment adviser but prior to reductions from brokerage service arrangements or other expense offset arrangements. Expenses net of all reductions represent the net expenses paid by the class.
F Amount represents less than $.01 per share.
G Total distributions of $.46 per share is comprised of distributions from net investment income of $.136 and distributions from net realized gain of $.327 per share.
See accompanying notes which are an integral part of the financial statements.
Annual Report
Financial Highlights - Institutional Class
Years ended October 31, | 2014 | 2013 | 2012 | 2011 | 2010 |
Selected Per-Share Data | | | | | |
Net asset value, beginning of period | $ 26.67 | $ 20.00 | $ 19.24 | $ 20.66 | $ 17.47 |
Income from Investment Operations | | | | | |
Net investment income (loss) B | .29 | .16 | .13 | .18 | .09 |
Net realized and unrealized gain (loss) | (.90) | 7.00 | 1.10 | (.89) | 3.53 |
Total from investment operations | (.61) | 7.16 | 1.23 | (.71) | 3.62 |
Distributions from net investment income | (.13) | (.16) | (.20) | (.06) | (.09) |
Distributions from net realized gain | (.60) | (.33) | (.27) | (.66) | (.34) |
Total distributions | (.73) | (.49) | (.47) | (.72) | (.43) |
Redemption fees added to paid in capital B | .01 | - F | - F | .01 | - F |
Net asset value, end of period | $ 25.34 | $ 26.67 | $ 20.00 | $ 19.24 | $ 20.66 |
Total ReturnA | (2.35)% | 36.68% | 6.65% | (3.62)% | 21.15% |
Ratios to Average Net Assets D, E | | | | | |
Expenses before reductions | 1.08% | 1.20% | 1.25% | 1.22% | 1.34% |
Expenses net of fee waivers, if any | 1.08% | 1.20% | 1.25% | 1.21% | 1.34% |
Expenses net of all reductions | 1.08% | 1.18% | 1.22% | 1.19% | 1.31% |
Net investment income (loss) | 1.07% | .66% | .70% | .84% | .47% |
Supplemental Data | | | | | |
Net assets, end of period (000 omitted) | $ 8,092 | $ 67,038 | $ 9,503 | $ 15,752 | $ 8,231 |
Portfolio turnover rate C | 102% | 54% | 68% | 47% | 66% |
A Total returns would have been lower if certain expenses had not been reduced during the applicable periods shown.
B Calculated based on average shares outstanding during the period.
C Amounts do not include the activity of the Underlying Funds.
D Fees and expenses of any underlying Fidelity Central Funds are not included in the Fund's expense ratio. The Fund indirectly bears its proportionate share of the expenses of any underlying Fidelity Central Funds.
E Expense ratios reflect operating expenses of the class. Expenses before reductions do not reflect amounts reimbursed by the investment adviser or reductions from brokerage service arrangements or reductions from other expense offset arrangements and do not represent the amount paid by the class during periods when reimbursements or reductions occur. Expenses net of fee waivers reflect expenses after reimbursement by the investment adviser but prior to reductions from brokerage service arrangements or other expense offset arrangements. Expenses net of all reductions represent the net expenses paid by the class.
F Amount represents less than $.01 per share.
See accompanying notes which are an integral part of the financial statements.
Annual Report
Notes to Financial Statements
For the period ended October 31, 2014
1. Organization.
Fidelity International Small Cap Fund (the Fund) is a fund of Fidelity Investment Trust (the Trust) and is authorized to issue an unlimited number of shares. The Trust is registered under the Investment Company Act of 1940, as amended (the 1940 Act), as an open-end management investment company organized as a Massachusetts business trust. The Fund offers Class A, Class T, Class C, International Small Cap and Institutional Class shares, each of which, along with Class B shares, has equal rights as to assets and voting privileges. Class B shares are closed to new accounts and additional purchases, except for exchanges and reinvestments. Each class has exclusive voting rights with respect to matters that affect that class. Class B shares will automatically convert to Class A shares after a holding period of seven years from the initial date of purchase. The Fund's investments in emerging markets can be subject to social, economic, regulatory, and political uncertainties and can be extremely volatile.
2. Investments in Fidelity Central Funds.
The Fund invests in Fidelity Central Funds, which are open-end investment companies generally available only to other investment companies and accounts managed by the investment adviser and its affiliates. The Fund's Schedule of Investments lists each of the Fidelity Central Funds held as of period end, if any, as an investment of the Fund, but does not include the underlying holdings of each Fidelity Central Fund. As an Investing Fund, the Fund indirectly bears its proportionate share of the expenses of the underlying Fidelity Central Funds.
The Money Market Central Funds seek preservation of capital and current income and are managed by Fidelity Investments Money Management, Inc. (FIMM), an affiliate of the investment adviser. Annualized expenses of the Money Market Central Funds as of their most recent shareholder report date are less than .01%.
A complete unaudited list of holdings for each Fidelity Central Fund is available upon request or at the Securities and Exchange Commission (the SEC) website at www.sec.gov. In addition, the financial statements of the Fidelity Central Funds, which are not covered by the Fund's Report of Independent Registered Public Accounting Firm, are available on the SEC website or upon request.
3. Significant Accounting Policies.
The financial statements have been prepared in conformity with accounting principles generally accepted in the United States of America (GAAP), which require management to make certain estimates and assumptions at the date of the financial statements. Actual results could differ from those estimates. Subsequent events, if any, through the date that the financial statements were issued have been evaluated in the preparation of
Annual Report
3. Significant Accounting Policies - continued
the financial statements. The following summarizes the significant accounting policies of the Fund:
Investment Valuation. Investments are valued as of 4:00 p.m. Eastern time on the last calendar day of the period. In accordance with valuation policies and procedures approved by the Board of Trustees (the Board), the Fund attempts to obtain prices from one or more third party pricing vendors or brokers to value its investments. When current market prices, quotations or currency exchange rates are not readily available or reliable, investments will be fair valued in good faith by the Fidelity Management & Research Company (FMR) Fair Value Committee (the Committee), in accordance with procedures adopted by the Board. Factors used in determining fair value vary by investment type and may include market or investment specific events, changes in interest rates and credit quality. The frequency with which these procedures are used cannot be predicted and they may be utilized to a significant extent. The Committee oversees the Fund's valuation policies and procedures and is responsible for approving and reporting to the Board all fair value determinations.
The Fund categorizes the inputs to valuation techniques used to value its investments into a disclosure hierarchy consisting of three levels as shown below:
Level 1 - quoted prices in active markets for identical investments
Level 2 - other significant observable inputs (including quoted prices for similar investments, interest rates, prepayment speeds, etc.)
Level 3 - unobservable inputs (including the Fund's own assumptions based on the best information available)
Valuation techniques used to value the Fund's investments by major category are as follows:
Equity securities, including restricted securities, for which market quotations are readily available, are valued at the last reported sale price or official closing price as reported by a third party pricing vendor on the primary market or exchange on which they are traded and are categorized as Level 1 in the hierarchy. In the event there were no sales during the day or closing prices are not available, securities are valued at the last quoted bid price or may be valued using the last available price and are generally categorized as Level 2 in the hierarchy. For foreign equity securities, when market or security specific events arise, comparisons to the valuation of American Depositary Receipts (ADRs), futures contracts, Exchange-Traded Funds (ETFs) and certain indexes as well as quoted prices for similar securities may be used and would be categorized as Level 2 in the hierarchy. Utilizing these techniques may result in transfers between Level 1 and Level 2. For equity securities, including restricted securities, where observable inputs are
Annual Report
Notes to Financial Statements - continued
3. Significant Accounting Policies - continued
Investment Valuation - continued
limited, assumptions about market activity and risk are used and these securities may be categorized as Level 3 in the hierarchy.
Investment in open-end mutual funds, including the Fidelity Central Funds, are valued at their closing net asset value (NAV) each business day and are categorized as Level 1 in the hierarchy.
Changes in valuation techniques may result in transfers in or out of an assigned level within the disclosure hierarchy. The aggregate value of investments by input level, as of October 31, 2014, including information on transfers between Levels 1 and 2, as well as a roll forward of Level 3 investments, is included at the end of the Fund's Schedule of Investments.
Foreign Currency. The Fund may use foreign currency contracts to facilitate transactions in foreign-denominated securities. Gains and losses from these transactions may arise from changes in the value of the foreign currency or if the counterparties do not perform under the contracts' terms.
Foreign-denominated assets, including investment securities, and liabilities are translated into U.S. dollars at the exchange rates at period end. Purchases and sales of investment securities, income and dividends received and expenses denominated in foreign currencies are translated into U.S. dollars at the exchange rate in effect on the transaction date.
The effects of exchange rate fluctuations on investments are included with the net realized and unrealized gain (loss) on investment securities. Other foreign currency transactions resulting in realized and unrealized gain (loss) are disclosed separately.
Investment Transactions and Income. For financial reporting purposes, the Fund's investment holdings and NAV include trades executed through the end of the last business day of the period. The NAV per share for processing shareholder transactions is calculated as of the close of business of the New York Stock Exchange (NYSE), normally 4:00 p.m. Eastern time and includes trades executed through the end of the prior business day. Gains and losses on securities sold are determined on the basis of identified cost. Dividend income is recorded on the ex-dividend date, except for certain dividends from foreign securities where the ex-dividend date may have passed, which are recorded as soon as the Fund is informed of the ex-dividend date. Non-cash dividends included in dividend income, if any, are recorded at the fair market value of the securities received. Income and capital gain distributions from Fidelity Central Funds, if any, are recorded on the ex-dividend date. Interest income is accrued as earned and includes coupon interest and amortization of premium and accretion of discount on debt securities as applicable. Investment income is recorded net of foreign taxes withheld where recovery of such taxes is uncertain.
Annual Report
3. Significant Accounting Policies - continued
Class Allocations and Expenses. Investment income, realized and unrealized capital gains and losses, common expenses of the Fund, and certain fund-level expense reductions, if any, are allocated daily on a pro-rata basis to each class based on the relative net assets of each class to the total net assets of the Fund. Each class differs with respect to transfer agent and distribution and service plan fees incurred. Certain expense reductions may also differ by class. For the reporting period, the allocated portion of income and expenses to each class as a percent of its average net assets may vary due to the timing of recording these transactions in relation to fluctuating net assets of the classes. Expenses directly attributable to a fund are charged to that fund. Expenses attributable to more than one fund are allocated among the respective funds on the basis of relative net assets or other appropriate methods. Expense estimates are accrued in the period to which they relate and adjustments are made when actual amounts are known.
Income Tax Information and Distributions to Shareholders. Each year, the Fund intends to qualify as a regulated investment company under Subchapter M of the Internal Revenue Code, including distributing substantially all of its taxable income and realized gains. As a result, no provision for U.S. Federal income taxes is required. As of October 31, 2014, the Fund did not have any unrecognized tax benefits in the financial statements; nor is the Fund aware of any tax positions for which it is reasonably possible that the total amounts of unrecognized tax benefits will significantly change in the next twelve months. The Fund files a U.S. federal tax return, in addition to state and local tax returns as required. The Fund's federal income tax returns are subject to examination by the Internal Revenue Service (IRS) for a period of three fiscal years after they are filed. State and local tax returns may be subject to examination for an additional fiscal year depending on the jurisdiction. Foreign taxes are provided for based on the Fund's understanding of the tax rules and rates that exist in the foreign markets in which it invests. The Fund is subject to a tax imposed on capital gains by certain countries in which it invests. An estimated deferred tax liability for net unrealized appreciation on the applicable securities is included in Other payables and accrued expenses on the Statement of Assets & Liabilities.
Distributions are declared and recorded on the ex-dividend date. Income dividends and capital gain distributions are declared separately for each class. Income and capital gain distributions are determined in accordance with income tax regulations, which may differ from GAAP. In addition, the Fund claimed a portion of the payment made to redeeming shareholders as a distribution for income tax purposes.
Capital accounts within the financial statements are adjusted for permanent book-tax differences. These adjustments have no impact on net assets or the results of operations. Capital accounts are not adjusted for temporary book-tax differences which will reverse in a subsequent period.
Annual Report
Notes to Financial Statements - continued
3. Significant Accounting Policies - continued
Income Tax Information and Distributions to Shareholders - continued
Book-tax differences are primarily due to futures transactions, foreign currency transactions, passive foreign investment companies (PFIC), capital loss carryforwards and losses deferred due to wash sales.
The federal tax cost of investment securities and unrealized appreciation (depreciation) as of period end were as follows:
Gross unrealized appreciation | $ 73,615,138 |
Gross unrealized depreciation | (89,554,250) |
Net unrealized appreciation (depreciation) on securities | $ (15,939,112) |
| |
Tax Cost | $ 923,812,779 |
The tax-based components of distributable earnings as of period end were as follows:
Undistributed ordinary income | $ 8,272,083 |
Undistributed long-term capital gain | $ 115,833,054 |
Net unrealized appreciation (depreciation) on securities and other investments | $ (16,103,309) |
The tax character of distributions paid was as follows:
| October 31, 2014 | October 31, 2013 |
Ordinary Income | $ 30,270,126 | $ 16,524,337 |
Short-Term Trading (Redemption) Fees. Shares held by investors in the Fund less than 90 days may have been subject to a redemption fee equal to 2.00% of the NAV of shares redeemed. All redemption fees, which reduce the proceeds of the shareholder redemption, are retained by the Fund and accounted for as an addition to paid in capital.
New Accounting Pronouncement. In June 2014, the Financial Accounting Standards Board issued Accounting Standard Update No. 2014-11, Repurchase-to-Maturity Transactions, Repurchase Financings, and Disclosures. The Update amends the accounting for certain repurchase agreements and expands disclosure requirements for reverse repurchase agreements, securities lending and other similar transactions. The disclosure requirements are effective for annual and interim reporting periods beginning after December 15, 2014. Management is currently evaluating the impact of the Update on the Fund's financial statements and related disclosures.
Annual Report
3. Significant Accounting Policies - continued
Restricted Securities. The Fund may invest in securities that are subject to legal or contractual restrictions on resale. These securities generally may be resold in transactions exempt from registration or to the public if the securities are registered. Disposal of these securities may involve time-consuming negotiations and expense, and prompt sale at an acceptable price may be difficult. Information regarding restricted securities is included at the end of the Fund's Schedule of Investments.
4. Purchases and Sales of Investments.
Purchases and sales of securities, other than short-term securities, aggregated $1,082,370,255 and $1,280,273,199, respectively.
5. Fees and Other Transactions with Affiliates.
Management Fee. Fidelity Management & Research Company (the investment adviser) and its affiliates provide the Fund with investment management related services for which the Fund pays a monthly management fee. The management fee is the sum of an individual fund fee rate that is based on an annual rate of .60% of the Fund's average net assets and an annualized group fee rate that averaged .25% during the period. The group fee rate is based upon the average net assets of all the mutual funds advised by the investment adviser, including any mutual funds previously advised by the investment adviser that are currently advised by Fidelity SelectCo, LLC, an affiliate of the investment adviser. The group fee rate decreases as assets under management increase and increases as assets under management decrease. In addition, the management fee is subject to a performance adjustment (up to a maximum of ± .20% of the Fund's average net assets over a 36 month performance period). The upward or downward adjustment to the management fee is based on the relative investment performance of International Small Cap as compared to its benchmark index, the MSCI All Country World ex USA Small Cap Index effective April 1, 2014 (the MSCI EAFE Small Cap Index prior to April 1, 2014), over the same 36 month performance period. For the reporting period, the total annual management fee rate, including the performance adjustment, was .85% of the Fund's average net assets. The performance adjustment included in the management fee rate may be higher or lower than the maximum performance adjustment rate due to the difference between the average net assets for the reporting and performance periods.
Distribution and Service Plan Fees. In accordance with Rule 12b-1 of the 1940 Act, the Fund has adopted separate Distribution and Service Plans for each class of shares. Certain classes pay Fidelity Distributors Corporation (FDC), an affiliate of the investment adviser, separate Distribution and Service Fees, each of which is based on an annual percentage of each class' average net assets. In addition, FDC may pay financial intermediaries for selling shares of the Fund and providing shareholder support services.
Annual Report
Notes to Financial Statements - continued
5. Fees and Other Transactions with Affiliates - continued
Distribution and Service Plan Fees - continued
For the period, the Distribution and Service Fee rates, total fees and amounts retained by FDC were as follows:
| Distribution
Fee | Service
Fee | Total Fees | Retained
by FDC |
Class A | -% | .25% | $ 65,763 | $ 1,198 |
Class T | .25% | .25% | 70,560 | 154 |
Class B | .75% | .25% | 6,629 | 4,984 |
Class C | .75% | .25% | 151,149 | 28,282 |
| | | $ 294,101 | $ 34,618 |
Sales Load. FDC may receive a front-end sales charge of up to 5.75% for selling Class A shares and 3.50% for selling Class T shares, some of which is paid to financial intermediaries for selling shares of the Fund. Depending on the holding period, FDC may receive contingent deferred sales charges levied on Class A, Class T, Class B, and Class C redemptions. The deferred sales charges range from 5.00% to 1.00% for Class B shares, 1.00% for Class C shares, 1.00% for certain purchases of Class A shares and .25% for certain purchases of Class T shares.
For the period, sales charge amounts retained by FDC were as follows:
| Retained
by FDC |
Class A | $ 18,407 |
Class T | 3,814 |
Class B* | 689 |
Class C* | 1,952 |
| $ 24,862 |
* When Class B and Class C shares are initially sold, FDC pays commissions from its own resources to financial intermediaries through which the sales are made.
Transfer Agent Fees. Fidelity Investments Institutional Operations Company, Inc., (FIIOC), an affiliate of the investment adviser, is the transfer, dividend disbursing and shareholder servicing agent for each class of the Fund. FIIOC receives account fees and asset-based fees that vary according to the account size and type of account of the shareholders of the respective classes of the Fund. FIIOC pays for typesetting, printing and mailing of shareholder reports, except proxy statements.
Annual Report
5. Fees and Other Transactions with Affiliates - continued
Transfer Agent Fees - continued
For the period, transfer agent fees for each class were as follows:
| Amount | % of
Class-Level
Average
Net Assets |
Class A | $ 74,352 | .28 |
Class T | 42,039 | .30 |
Class B | 2,010 | .30 |
Class C | 38,581 | .26 |
International Small Cap | 2,374,942 | .24 |
Institutional Class | 71,613 | .12 |
| $ 2,603,537 | |
Accounting and Security Lending Fees. Fidelity Service Company, Inc. (FSC), an affiliate of the investment adviser, maintains the Fund's accounting records. The accounting fee is based on the level of average net assets for each month. Under a separate contract, FSC administers the security lending program. The security lending fee is based on the number and duration of lending transactions.
Brokerage Commissions. The Fund placed a portion of its portfolio transactions with brokerage firms which are affiliates of the investment adviser. Brokerage commissions are included in net realized gain (loss) and change in net unrealized appreciation (depreciation) in the Statement of Operations. The commissions paid to these affiliated firms were $1,930 for the period.
6. Committed Line of Credit.
The Fund participates with other funds managed by the investment adviser or an affiliate in a $4.25 billion credit facility (the "line of credit") to be utilized for temporary or emergency purposes to fund shareholder redemptions or for other short-term liquidity purposes. The Fund has agreed to pay commitment fees on its pro-rata portion of the line of credit, which amounted to $1,862 and is reflected in Miscellaneous expenses on the Statement of Operations. During the period, the Fund did not borrow on this line of credit.
7. Security Lending.
The Fund lends portfolio securities through a lending agent from time to time in order to earn additional income. For equity securities, a lending agent is used and may loan securities to certain qualified borrowers, including Fidelity Capital Markets (FCM), a
Annual Report
Notes to Financial Statements - continued
7. Security Lending - continued
broker-dealer affiliated with the Fund. On the settlement date of the loan, the Fund receives collateral (in the form of U.S. Treasury obligations, letters of credit and/or cash) against the loaned securities and maintains collateral in an amount not less than 100% of the market value of the loaned securities during the period of the loan. The market value of the loaned securities is determined at the close of business of the Fund and any additional required collateral is delivered to the Fund on the next business day. If the borrower defaults on its obligation to return the securities loaned because of insolvency or other reasons, the Fund may apply collateral received from the borrower against the obligation. The Fund may experience delays and costs in recovering the securities loaned. Any cash collateral received is invested in the Fidelity Securities Lending Cash Central Fund. The value of loaned securities and cash collateral at period end are disclosed on the Fund's Statement of Assets and Liabilities. The value of securities loaned to FCM at period end was $54,910. Security lending income represents the income earned on investing cash collateral, less rebates paid to borrowers and any lending agent fees associated with the loan, plus any premium payments received for lending certain types of securities. Security lending income is presented in the Statement of Operations as a component of income from Fidelity Central Funds. Total security lending income during the period amounted to $303,427, including $2,692 from securities loaned to FCM.
8. Expense Reductions.
Commissions paid to certain brokers with whom the investment adviser, or its affiliates, places trades on behalf of the Fund include an amount in addition to trade execution, which may be rebated back to the Fund to offset certain expenses. This amount totaled $29,569 for the period. Through arrangements with the Fund's custodian, credits realized as a result of uninvested cash balances were used to reduce the Fund's expenses. During the period, these credits reduced the Fund's custody expenses by $132.
In addition, the investment adviser reimbursed a portion of the Fund's operating expenses during the period in the amount of $13,641.
9. Distributions to Shareholders.
Distributions to shareholders of each class were as follows:
Years ended October 31, | 2014 | 2013 |
From net investment income | | |
Class A | $ 48,210 | $ 53,369 |
International Small Cap | 3,601,146 | 4,638,246 |
Institutional Class | 363,320 | 77,935 |
Total | $ 4,012,676 | $ 4,769,550 |
Annual Report
9. Distributions to Shareholders - continued
Years ended October 31, | 2014 | 2013 |
From net realized gain | | |
Class A | $ 564,345 | $ 235,834 |
Class T | 310,220 | 146,972 |
Class B | 14,343 | 3,106 |
Class C | 305,689 | 61,233 |
International Small Cap | 23,368,303 | 11,152,248 |
Institutional Class | 1,694,550 | 155,394 |
Total | $ 26,257,450 | $ 11,754,787 |
10. Share Transactions.
Share transactions for each class were as follows and may contain automatic conversions between classes or exchanges between funds:
| Shares | Shares | Dollars | Dollars |
Years ended October 31, | 2014 | 2013 | 2014 | 2013 |
Class A | | | | |
Shares sold | 355,842 | 398,633 | $ 9,376,508 | $ 9,321,444 |
Reinvestment of distributions | 22,103 | 13,843 | 571,356 | 269,801 |
Shares redeemed | (306,489) | (215,812) | (8,061,522) | (4,750,681) |
Net increase (decrease) | 71,456 | 196,664 | $ 1,886,342 | $ 4,840,564 |
Class T | | | | |
Shares sold | 115,645 | 141,247 | $ 3,022,509 | $ 3,379,516 |
Reinvestment of distributions | 11,686 | 7,380 | 300,676 | 143,239 |
Shares redeemed | (148,659) | (104,387) | (3,861,942) | (2,281,922) |
Net increase (decrease) | (21,328) | 44,240 | $ (538,757) | $ 1,240,833 |
Class B | | | | |
Shares sold | 3,137 | 4,525 | $ 80,198 | $ 108,233 |
Reinvestment of distributions | 538 | 157 | 13,734 | 3,023 |
Shares redeemed | (13,726) | (15,050) | (356,690) | (330,538) |
Net increase (decrease) | (10,051) | (10,368) | $ (262,758) | $ (219,282) |
Class C | | | | |
Shares sold | 207,733 | 275,046 | $ 5,326,341 | $ 6,270,694 |
Reinvestment of distributions | 10,499 | 2,855 | 265,425 | 54,609 |
Shares redeemed | (222,725) | (109,571) | (5,644,059) | (2,419,306) |
Net increase (decrease) | (4,493) | 168,330 | $ (52,293) | $ 3,905,997 |
Annual Report
Notes to Financial Statements - continued
10. Share Transactions - continued
| Shares | Shares | Dollars | Dollars |
Years ended October 31, | 2014 | 2013 | 2014 | 2013 |
International Small Cap | | | | |
Shares sold | 7,158,603 | 11,248,438 | $ 190,711,642 | $ 266,912,412 |
Reinvestment of distributions | 988,313 | 770,505 | 25,844,388 | 15,163,539 |
Shares redeemed | (13,529,838) | (8,061,607) | (360,297,655) | (180,218,306) |
Net increase (decrease) | (5,382,922) | 3,957,336 | $ (143,741,625) | $ 101,857,645 |
Institutional Class | | | | |
Shares sold | 1,844,038 | 2,333,500 | $ 48,462,558 | $ 57,218,863 |
Reinvestment of distributions | 61,170 | 8,409 | 1,598,368 | 165,323 |
Shares redeemed | (4,099,284) | (303,629) | (109,159,166) | (6,792,002) |
Net increase (decrease) | (2,194,076) | 2,038,280 | $ (59,098,240) | $ 50,592,184 |
11. Other.
The Fund's organizational documents provide former and current trustees and officers with a limited indemnification against liabilities arising in connection with the performance of their duties to the Fund. In the normal course of business, the Fund may also enter into contracts that provide general indemnifications. The Fund's maximum exposure under these arrangements is unknown as this would be dependent on future claims that may be made against the Fund. The risk of material loss from such claims is considered remote.
At the end of the period, the investment adviser or its affiliates were the owners of record of 18% of the total outstanding shares of the Fund.
Annual Report
To the Trustees of Fidelity Investment Trust and Shareholders of Fidelity International Small Cap Fund:
We have audited the accompanying statement of assets and liabilities of Fidelity International Small Cap Fund (the Fund), a fund of Fidelity Investment Trust, including the schedule of investments, as of October 31, 2014, and the related statement of operations for the year then ended, the statement of changes in net assets for each of the two years in the period then ended, and the financial highlights for each of the five years in the period then ended. These financial statements and financial highlights are the responsibility of the Fund's management. Our responsibility is to express an opinion on these financial statements and financial highlights based on our audits.
We conducted our audits in accordance with the standards of the Public Company Accounting Oversight Board (United States). Those standards require that we plan and perform the audit to obtain reasonable assurance about whether the financial statements and financial highlights are free of material misstatement. The Fund is not required to have, nor were we engaged to perform, an audit of its internal control over financial reporting. Our audits included consideration of internal control over financial reporting as a basis for designing audit procedures that are appropriate in the circumstances, but not for the purpose of expressing an opinion on the effectiveness of the Fund's internal control over financial reporting. Accordingly, we express no such opinion. An audit also includes examining, on a test basis, evidence supporting the amounts and disclosures in the financial statements, assessing the accounting principles used and significant estimates made by management, as well as evaluating the overall financial statement presentation. Our procedures included confirmation of securities owned as of October 31, 2014, by correspondence with the custodians and brokers; where replies were not received from brokers, we performed other auditing procedures. We believe that our audits provide a reasonable basis for our opinion.
In our opinion, the financial statements and financial highlights referred to above present fairly, in all material respects, the financial position of Fidelity International Small Cap Fund as of October 31, 2014, the results of its operations for the year then ended, the changes in its net assets for each of the two years in the period then ended, and the financial highlights for each of the five years in the period then ended, in conformity with accounting principles generally accepted in the United States of America.
DELOITTE & TOUCHE LLP
Boston, Massachusetts
December 19, 2014
Annual Report
The Trustees, Member of the Advisory Board, and officers of the trust and fund, as applicable, are listed below. The Board of Trustees governs the fund and is responsible for protecting the interests of shareholders. The Trustees are experienced executives who meet periodically throughout the year to oversee the fund's activities, review contractual arrangements with companies that provide services to the fund, oversee management of the risks associated with such activities and contractual arrangements, and review the fund's performance. Except for James C. Curvey, each of the Trustees oversees 174 funds. Mr. Curvey oversees 407 funds.
The Trustees hold office without limit in time except that (a) any Trustee may resign; (b) any Trustee may be removed by written instrument, signed by at least two-thirds of the number of Trustees prior to such removal; (c) any Trustee who requests to be retired or who has become incapacitated by illness or injury may be retired by written instrument signed by a majority of the other Trustees; and (d) any Trustee may be removed at any special meeting of shareholders by a two-thirds vote of the outstanding voting securities of the trust. Each Trustee who is not an interested person (as defined in the 1940 Act) of the trust and the fund (Independent Trustee), shall retire not later than the last day of the calendar year in which his or her 75th birthday occurs. The Independent Trustees may waive this mandatory retirement age policy with respect to individual Trustees. The officers and Advisory Board Member hold office without limit in time, except that any officer and Advisory Board Member may resign or may be removed by a vote of a majority of the Trustees at any regular meeting or any special meeting of the Trustees. Except as indicated, each individual has held the office shown or other offices in the same company for the past five years.
Experience, Skills, Attributes, and Qualifications of the Fund's Trustees. The Governance and Nominating Committee has adopted a statement of policy that describes the experience, qualifications, attributes, and skills that are necessary and desirable for potential Independent Trustee candidates (Statement of Policy). The Board believes that each Trustee satisfied at the time he or she was initially elected or appointed a Trustee, and continues to satisfy, the standards contemplated by the Statement of Policy. The Governance and Nominating Committee also engages professional search firms to help identify potential Independent Trustee candidates who have the experience, qualifications, attributes, and skills consistent with the Statement of Policy. From time to time, additional criteria based on the composition and skills of the current Independent Trustees, as well as experience or skills that may be appropriate in light of future changes to board composition, business conditions, and regulatory or other developments, have also been considered by the professional search firms and the Governance and Nominating Committee. In addition, the Board takes into account the Trustees' commitment and participation in Board and committee meetings, as well as their leadership of standing and ad hoc committees throughout their tenure.
In determining that a particular Trustee was and continues to be qualified to serve as a Trustee, the Board has considered a variety of criteria, none of which, in isolation, was controlling. The Board believes that, collectively, the Trustees have balanced and diverse experience, qualifications, attributes, and skills, which allow the Board to operate effectively in governing the fund and protecting the interests of shareholders. Information about the specific experience, skills, attributes, and qualifications of each Trustee, which in each case led to the Board's conclusion that the Trustee should serve (or continue to serve) as a trustee of the fund, is provided below.
Annual Report
Trustees and Officers - continued
Board Structure and Oversight Function. James C. Curvey is an interested person (as defined in the 1940 Act) and currently serves as Chairman. The Trustees have determined that an interested Chairman is appropriate and benefits shareholders because an interested Chairman has a personal and professional stake in the quality and continuity of services provided to the fund. Independent Trustees exercise their informed business judgment to appoint an individual of their choosing to serve as Chairman, regardless of whether the Trustee happens to be independent or a member of management. The Independent Trustees have determined that they can act independently and effectively without having an Independent Trustee serve as Chairman and that a key structural component for assuring that they are in a position to do so is for the Independent Trustees to constitute a substantial majority for the Board. The Independent Trustees also regularly meet in executive session. Ned C. Lautenbach serves as Chairman of the Independent Trustees and as such (i) acts as a liaison between the Independent Trustees and management with respect to matters important to the Independent Trustees and (ii) with management prepares agendas for Board meetings.
Fidelity funds are overseen by different Boards of Trustees. The fund's Board oversees Fidelity's equity and high income funds and another Board oversees Fidelity's investment-grade bond, money market, and asset allocation funds. The asset allocation funds may invest in Fidelity funds overseen by the fund's Board. The use of separate Boards, each with its own committee structure, allows the Trustees of each group of Fidelity funds to focus on the unique issues of the funds they oversee, including common research, investment, and operational issues. On occasion, the separate Boards establish joint committees to address issues of overlapping consequences for the Fidelity funds overseen by each Board.
The Trustees operate using a system of committees to facilitate the timely and efficient consideration of all matters of importance to the Trustees, the fund, and fund shareholders and to facilitate compliance with legal and regulatory requirements and oversight of the fund's activities and associated risks. The Board, acting through its committees, has charged FMR and its affiliates with (i) identifying events or circumstances the occurrence of which could have demonstrably adverse effects on the fund's business and/or reputation; (ii) implementing processes and controls to lessen the possibility that such events or circumstances occur or to mitigate the effects of such events or circumstances if they do occur; and (iii) creating and maintaining a system designed to evaluate continuously business and market conditions in order to facilitate the identification and implementation processes described in (i) and (ii) above. Because the day-to-day operations and activities of the fund are carried out by or through FMR, its affiliates and other service providers, the fund's exposure to risks is mitigated but not eliminated by the processes overseen by the Trustees. While each of the Board's committees has responsibility for overseeing different aspects of the fund's activities, oversight is exercised primarily through the Operations, Audit, and Compliance Committees. In addition, the Independent Trustees have worked with FMR to enhance the Board's oversight of investment and financial risks, legal and regulatory risks, technology risks, and operational risks, including the development of additional risk reporting to the Board. For example, a working group comprised of Independent Trustees and FMR has worked and continues to work to review the Fidelity funds' valuation-related activities, reporting and risk management. Appropriate personnel, including but not limited to the fund's Chief Compliance Officer (CCO), FMR's internal auditor, the independent accountants, the fund's Treasurer and portfolio management personnel, make periodic reports to the Board's committees, as appropriate, including an annual review of FMR's risk management program for the Fidelity funds. The responsibilities of each standing committee, including their oversight responsibilities, are described further under "Standing Committees of the Fund's Trustees."
Annual Report
The fund's Statement of Additional Information (SAI) includes more information about the Trustees. To request a free copy, call Fidelity at 1-877-208-0098.
Interested Trustees*:
Correspondence intended for each Trustee who is an interested person may be sent to Fidelity Investments, 245 Summer Street, Boston, Massachusetts 02210.
Name, Year of Birth; Principal Occupations and Other Relevant Experience+ |
James C. Curvey (1935) |
Year of Election or Appointment: 2007 Trustee Chairman of the Board of Trustees |
| Mr. Curvey also serves as Trustee of other Fidelity funds. Mr. Curvey is a Director of Fidelity Research & Analysis Co. (2009-present), and Vice Chairman (2007-present) and Director of FMR LLC. In addition, Mr. Curvey serves as an Overseer for the Boston Symphony Orchestra and a member of the board of Artis-Naples, Naples, Florida, and as a Trustee for Brewster Academy, Wolfeboro, New Hampshire. Previously, Mr. Curvey served as a Director of Fidelity Investments Money Management, Inc. (2009-2014), a Director of FMR (2007-2014), and a Director of FMR Co., Inc. (2007-2014). |
Charles S. Morrison (1960) |
Year of Election or Appointment: 2014 Trustee |
| Mr. Morrison also serves as Trustee of other funds. He serves as a Director of Fidelity Investments Money Management, Inc. (FIMM) (2014-present), Director of Fidelity SelectCo, LLC (2014-present), President, Asset Management (2014-present), and is an employee of Fidelity Investments. Previously, Mr. Morrison served as Vice President of Fidelity's Fixed Income and Asset Allocation Funds (2012-2014), President, Fixed Income (2011-2014), Vice President of Fidelity's Money Market Funds (2005-2009), President, Money Market Group Leader of FMR (2009), and Senior Vice President, Money Market Group of FMR (2004-2009). Mr. Morrison also served as Vice President of Fidelity's Bond Funds (2002-2005), certain Balanced Funds (2002-2005), and certain Asset Allocation Funds (2002-2007), and as Senior Vice President (2002-2005) of Fidelity's Bond Division. |
* Trustees have been determined to be "Interested Trustees" by virtue of, among other things, their affiliation with the trust or various entities under common control with FMR.
+ The information above includes each Trustee's principal occupation during the last five years and other information relating to the experience, attributes, and skills relevant to each Trustee's qualifications to serve as a Trustee, which led to the conclusion that each Trustee should serve as a Trustee for the fund.
Annual Report
Independent Trustees:
Correspondence intended for each Independent Trustee (that is, the Trustees other than the Interested Trustees) may be sent to Fidelity Investments, P.O. Box 55235, Boston, Massachusetts 02205-5235.
Name, Year of Birth; Principal Occupations and Other Relevant Experience+ |
Dennis J. Dirks (1948) |
Year of Election or Appointment: 2005 Trustee |
| Mr. Dirks also serves as Trustee of other Fidelity funds. Prior to his retirement in May 2003, Mr. Dirks was Chief Operating Officer and a member of the Board of The Depository Trust & Clearing Corporation (DTCC). He also served as President, Chief Operating Officer, and Board member of The Depository Trust Company (DTC) and President and Board member of the National Securities Clearing Corporation (NSCC). In addition, Mr. Dirks served as Chief Executive Officer and Board member of the Government Securities Clearing Corporation, Chief Executive Officer and Board member of the Mortgage-Backed Securities Clearing Corporation, as a Trustee and a member of the Finance Committee of Manhattan College (2005-2008), and as a Trustee and a member of the Finance Committee of AHRC of Nassau County (2006-2008). Mr. Dirks is a member of the Independent Directors Council (IDC) Governing Council (2010-present) and Board of Directors for The Brookville Center for Children's Services, Inc. (2009-present). |
Alan J. Lacy (1953) |
Year of Election or Appointment: 2008 Trustee |
| Mr. Lacy also serves as Trustee of other Fidelity funds. Mr. Lacy serves as Senior Adviser (2007-present) of Oak Hill Capital Partners, L.P. (private equity). Mr. Lacy also served as Chief Executive Officer (2000-2005) and Vice Chairman (2005-2006) of Sears Holdings Corporation and Sears, Roebuck and Co. (retail). In addition, Mr. Lacy serves as a member of the Board of Directors of Dave & Buster's Entertainment, Inc. (restaurant and entertainment complexes, 2010-present), Earth Fare, Inc. (retail grocery, 2012-present), The Hillman Companies, Inc. (hardware wholesalers, 2010-present), and Bristol-Myers Squibb Company (global pharmaceuticals, 2008-present). Mr. Lacy is a member of the Board of Trustees of The National Parks Conservation Association (2006-present). Previously, Mr. Lacy served as Chairman of the Board of Trustees of the National Parks Conservation Association (2008-2011) and as a member of the Board of Directors for the Western Union Company (global money transfer, 2006-2011). |
Ned C. Lautenbach (1944) |
Year of Election or Appointment: 2000 Trustee Chairman of the Independent Trustees |
| Mr. Lautenbach also serves as Trustee of other Fidelity funds. Mr. Lautenbach currently serves as the Lead Director of the Eaton Corporation Board of Directors (diversified industrial, 1997-present). Mr. Lautenbach is Chairman of the Board of Directors of the Philharmonic Center for the Arts in Naples, Florida (2012-present) and a member of the Council on Foreign Relations (1994-present). Previously, Mr. Lautenbach was a Partner/Advisory Partner at Clayton, Dubilier & Rice, LLC (private equity investment, 1998-2010), as well as a Director of Sony Corporation (2006-2007). |
Joseph Mauriello (1944) |
Year of Election or Appointment: 2008 Trustee |
| Mr. Mauriello also serves as Trustee of other Fidelity funds. Prior to his retirement in January 2006, Mr. Mauriello served in numerous senior management positions including Deputy Chairman and Chief Operating Officer (2004-2005), and Vice Chairman of Financial Services (2002-2004) of KPMG LLP US (professional services, 1965-2005). Mr. Mauriello currently serves as a member of the Board of Directors of XL Group plc. (global insurance and re-insurance, 2006-present). Previously, Mr. Mauriello served as a Director of the Hamilton Funds of the Bank of New York (2006-2007) and of Arcadia Resources Inc. (health care services and products, 2007-2012). |
Robert W. Selander (1950) |
Year of Election or Appointment: 2011 Trustee |
| Mr. Selander also serves as Trustee of other Fidelity funds. Previously, Mr. Selander served as a Member of the Advisory Board of other Fidelity funds (2011), and Executive Vice Chairman (2010), Chief Executive Officer (2009-2010), and President and Chief Executive Officer (1997-2009) of Mastercard, Inc. |
Cornelia M. Small (1944) |
Year of Election or Appointment: 2005 Trustee |
| Ms. Small also serves as Trustee of other Fidelity funds. Ms. Small is a member of the Board of Directors (2009-present) and Chair of the Investment Committee (2010-present) of the Teagle Foundation. Ms. Small also serves on the Investment Committee of the Berkshire Taconic Community Foundation (2008-present). Previously, Ms. Small served as Chairperson (2002-2008) and a member of the Investment Committee and Chairperson (2008-2012) and a member of the Board of Trustees of Smith College. In addition, Ms. Small served as Chief Investment Officer, Director of Global Equity Investments, and a member of the Board of Directors of Scudder, Stevens & Clark and Scudder Kemper Investments. |
William S. Stavropoulos (1939) |
Year of Election or Appointment: 2001 Trustee Vice Chairman of the Independent Trustees |
| Mr. Stavropoulos also serves as Trustee of other Fidelity funds. Mr. Stavropoulos serves as President and Founder of the Michigan Baseball Foundation, the Great Lakes Loons (2007-present). Mr. Stavropoulos is Chairman Emeritus of the Board of Directors of The Dow Chemical Company, where he previously served in numerous senior management positions, including President, CEO (1995-2000; 2002-2004), Chairman of the Executive Committee (2000-2006), and as a member of the Board of Directors (1990-2006). Currently, Mr. Stavropoulos is Chairman of the Board of Directors of Univar Inc. (global distributor of commodity and specialty chemicals), a Director of Teradata Corporation (data warehousing and technology solutions), and Maersk Inc. (industrial conglomerate), and a member of the Advisory Board for Metalmark Capital LLC (private equity investment, 2005-present). Mr. Stavropoulos is an operating advisor to Clayton, Dubilier & Rice, LLC (private equity investment). In addition, Mr. Stavropoulos is a member of the University of Notre Dame Advisory Council for the College of Science, a Trustee of the Rollin L. Gerstacker Foundation, and a Director of the Naples Philharmonic Center for the Arts. Previously, Mr. Stavropoulos served as a Director of Chemical Financial Corporation (bank holding company, 1993-2012) and Tyco International, Ltd. (multinational manufacturing and services, 2007-2012). |
David M. Thomas (1949) |
Year of Election or Appointment: 2008 Trustee |
| Mr. Thomas also serves as Trustee of other Fidelity funds. Mr. Thomas serves as Non-Executive Chairman of the Board of Directors of Fortune Brands Home and Security (home and security products, 2011-present), and as a member of the Board of Directors of Interpublic Group of Companies, Inc. (marketing communication, 2004-present). Previously, Mr. Thomas served as Executive Chairman (2005-2006) and Chairman and Chief Executive Officer (2000-2005) of IMS Health, Inc. (pharmaceutical and healthcare information solutions), and a Director of Fortune Brands, Inc. (consumer products, 2000-2011). |
+ The information above includes each Trustee's principal occupation during the last five years and other information relating to the experience, attributes, and skills relevant to each Trustee's qualifications to serve as a Trustee, which led to the conclusion that each Trustee should serve as a Trustee for the fund.
Advisory Board Member and Officers:
Correspondence intended for each officer and Peter S. Lynch may be sent to Fidelity Investments, 245 Summer Street, Boston, Massachusetts 02210. Officers appear below in alphabetical order.
Name, Year of Birth; Principal Occupation |
Peter S. Lynch (1944) |
Year of Election or Appointment: 2003 Member of the Advisory Board |
| Mr. Lynch also serves as Member of the Advisory Board of other Fidelity funds. Mr. Lynch is Vice Chairman and a Director of FMR and FMR Co., Inc. In addition, Mr. Lynch serves as a Trustee of Boston College and as the Chairman of the Inner-City Scholarship Fund. Previously, Mr. Lynch served on the Special Olympics International Board of Directors (1997-2006). |
Elizabeth Paige Baumann (1968) |
Year of Election or Appointment: 2012 Anti-Money Laundering (AML) Officer |
| Ms. Baumann also serves as AML Officer of other funds. She is Chief AML Officer of FMR LLC (2012-present) and is an employee of Fidelity Investments. Previously, Ms. Baumann served as Vice President and Deputy Anti-Money Laundering Officer (2007-2012). |
William C. Coffey (1969) |
Year of Election or Appointment: 2009 Assistant Secretary |
| Mr. Coffey also serves as Assistant Secretary of other funds. He is Senior Vice President and Deputy General Counsel of FMR LLC (2010-present), and is an employee of Fidelity Investments. Previously, Mr. Coffey served as Vice President and Associate General Counsel of FMR LLC (2005-2009). |
Jonathan Davis (1968) |
Year of Election or Appointment: 2010 Assistant Treasurer |
| Mr. Davis also serves as Assistant Treasurer of other funds. Mr. Davis is an employee of Fidelity Investments. Previously, Mr. Davis served as Vice President and Associate General Counsel of FMR LLC (2003-2010). |
Adrien E. Deberghes (1967) |
Year of Election or Appointment: 2008 Deputy Treasurer |
| Mr. Deberghes also serves as an officer of other funds. He is an employee of Fidelity Investments (2008-present). Prior to joining Fidelity Investments, Mr. Deberghes was Senior Vice President of Mutual Fund Administration at State Street Corporation (2007-2008), Senior Director of Mutual Fund Administration at Investors Bank & Trust (2005-2007), and Director of Finance for Dunkin' Brands (2000-2005). |
Stephanie J. Dorsey (1969) |
Year of Election or Appointment: 2010 Assistant Treasurer |
| Ms. Dorsey also serves as an officer of other funds. She is an employee of Fidelity Investments (2008-present) and has served in other fund officer roles. Prior to joining Fidelity Investments, Ms. Dorsey served as Treasurer (2004-2008) of the JPMorgan Mutual Funds and Vice President (2004-2008) of JPMorgan Chase Bank. |
Howard J. Galligan III (1966) |
Year of Election or Appointment: 2014 Chief Financial Officer |
| Mr. Galligan also serves as Chief Financial Officer of other funds. Mr. Galligan serves as President of Fidelity Pricing and Cash Management Services (FPCMS) (2014-present) and as a Director of Strategic Advisers, Inc. (2008-present). Previously, Mr. Galligan served as Chief Administrative Officer of Asset Management (2011-2014) and Chief Operating Officer and Senior Vice President of Investment Support for Strategic Advisers, Inc. (2003-2011). |
Scott C. Goebel (1968) |
Year of Election or Appointment: 2008 Secretary and Chief Legal Officer (CLO) |
| Mr. Goebel serves as Secretary and CLO of other funds. Mr. Goebel also serves as Secretary of Fidelity SelectCo, LLC (2013-present), Fidelity Investments Money Management, Inc. (FIMM) (2010-present) and Fidelity Research and Analysis Company (FRAC) (2010-present); General Counsel, Secretary, and Senior Vice President of FMR (2008-present) and FMR Co., Inc. (2008-present); Chief Legal Officer of Fidelity Management & Research (Hong Kong) Limited (2008-present); and Assistant Secretary of Fidelity Management & Research (Japan) Limited (2008-present) and Fidelity Management & Research (U.K.) Inc. (2008-present). Previously, Mr. Goebel served as Secretary and CLO of other Fidelity funds (2008-2013), Assistant Secretary of FIMM (2008-2010), FRAC (2008-2010), and certain funds (2007-2008); and as Vice President and Secretary of Fidelity Distributors Corporation (FDC) (2005-2007). Mr. Goebel has been employed by FMR LLC or an affiliate since 2001. |
Thomas C. Hense (1964) |
Year of Election or Appointment: 2008/2010 Vice President |
| Mr. Hense also serves as Vice President of other funds (High Income (2008), Small Cap (2008), and Value (2010) funds). Previously, Mr. Hense served as a portfolio manager for Fidelity's Institutional Money Management Group (Pyramis) (2003-2008). |
Brian B. Hogan (1964) |
Year of Election or Appointment: 2009 Vice President |
| Mr. Hogan also serves as Trustee or Vice President of other funds. Mr. Hogan serves as a Director of Fidelity SelectCo, LLC (2014-present) and President of FMR's Equity Division (2009-present). Previously, Mr. Hogan served as Senior Vice President, Equity Research of FMR (2006-2009) and as a portfolio manager. |
Chris Maher (1972) |
Year of Election or Appointment: 2013 Assistant Treasurer |
| Mr. Maher serves as Assistant Treasurer of other funds. Mr. Maher is Vice President of Valuation Oversight and is an employee of Fidelity Investments. Previously, Mr. Maher served as Vice President of Asset Management Compliance (2013), Vice President of FMR's Program Management Group (2010-2013), and Vice President of Valuation Oversight (2008-2010). |
Kenneth B. Robins (1969) |
Year of Election or Appointment: 2008 President and Treasurer |
| Mr. Robins also serves as an officer of other funds. Mr. Robins serves as Executive Vice President of Fidelity Investments Money Management, Inc. (FIMM) (2013-present) and is an employee of Fidelity Investments (2004-present). Previously, Mr. Robins served in other fund officer roles. |
Stephen Sadoski (1971) |
Year of Election or Appointment: 2012 Deputy Treasurer |
| Mr. Sadoski also serves as Deputy Treasurer of other funds. He is an employee of Fidelity Investments (2012-present) and has served in another fund officer role. Prior to joining Fidelity Investments, Mr. Sadoski served as an assistant chief accountant in the Division of Investment Management of the Securities and Exchange Commission (SEC) (2009-2012) and as a senior manager at Deloitte & Touche LLP (1997-2009). |
Stacie M. Smith (1974) |
Year of Election or Appointment: 2013 Deputy Treasurer |
| Ms. Smith also serves as an officer of other funds. She is an employee of Fidelity Investments (2009-present) and has served in other fund officer roles. Prior to joining Fidelity Investments, Ms. Smith served as Senior Audit Manager of Ernst & Young LLP (1996-2009). |
Renee Stagnone (1975) |
Year of Election or Appointment: 2013 Deputy Treasurer |
| Ms. Stagnone also serves as Deputy Treasurer of other funds. Ms. Stagnone is an employee of Fidelity Investments. |
Linda J. Wondrack (1964) |
Year of Election or Appointment: 2014 Chief Compliance Officer |
| Ms. Wondrack also serves as Chief Compliance Officer of other funds. Ms. Wondrack is Executive Vice President and head of the Ethics Office and Asset Management Compliance for Fidelity Investments (2012-present). Ms. Wondrack also serves as Chief Compliance Officer of Fidelity SelectCo, LLC (2014-present); Chief Compliance Officer of Impresa Management LLC (2013-present); and Chief Compliance Officer of FMR Co., Inc., Fidelity Investments Money Management, Inc., Fidelity Management & Research (Japan) Limited, Fidelity Management & Research (U.K.) Inc., Fidelity Management & Research (Hong Kong), Fidelity Management & Research Company, Pyramis Global Advisors, LLC, and Strategic Advisers, Inc., Ballyrock Investment Advisors LLC, and Northern Neck Investors LLC (2012-present). Previously, Ms. Wondrack served as Senior Vice President and Chief Compliance Officer for Columbia Management Investment Advisers, LLC (2005-2012); Chief Compliance Officer for certain funds within the Columbia Family of Funds (2007-2012); and Senior Vice President of Compliance Risk Management at Bank of America (2005-2010). |
Joseph F. Zambello (1957) |
Year of Election or Appointment: 2011 Deputy Treasurer |
| Mr. Zambello also serves as Deputy Treasurer of other funds. Mr. Zambello is an employee of Fidelity Investments. Previously, Mr. Zambello served as Vice President of FMR's Program Management Group (2009-2011) and Vice President of the Transfer Agent Oversight Group (2005-2009). |
Annual Report
The Board of Trustees of Advisor International Small Cap Fund voted to pay to shareholders of record at the opening of business on record date, the following distributions per share derived from capital gains realized from sales of portfolio securities, and dividends derived from net investment income:
| Pay Date | Record Date | Dividends | Capital Gains |
Institutional Class | 12/08/14 | 12/05/14 | $0.0820 | $3.452 |
The fund hereby designates as a capital gain dividend with respect to the taxable year ended October 31, 2014, $165,246,247, or, if subsequently determined to be different, the net capital gain of such year.
Institutional Class designates 29% of the dividend distributed during the fiscal year as amounts which may be taken into account as a dividend for purposes of the maximum rate under section 1(h)(11) of the Internal Revenue Code.
The amounts per share which represent income derived from sources within, and taxes paid to, foreign countries or possessions of the United States are as follows:
| Pay Date | Income | Taxes |
Institutional Class | 12/09/13 | $0.2278 | $0.0122 |
The fund will notify shareholders in January 2015 of amounts for use in preparing 2014 income tax returns.
Annual Report
A special meeting of the fund's shareholders was held on March 18, 2014. The results of votes taken among shareholders on the proposal before them are reported below. Each vote reported represents one dollar of net asset value held on the record date for the meeting.
PROPOSAL 1 |
To approve a change in the performance adjustment index for the fund. |
| # of
Votes | % of
Votes |
Affirmative | 659,102,813.34 | 91.252 |
Against | 41,779,512.26 | 5.784 |
Abstain | 21,410,547.93 | 2.964 |
TOTAL | 722,292,873.53 | 100.000 |
Annual Report
Board Approval of Investment Advisory Contracts and Management Fees
Fidelity International Small Cap Fund
Each year, the Board of Trustees, including the Independent Trustees (together, the Board), votes on the renewal of the management contract with Fidelity Management & Research Company (FMR) and the sub-advisory agreements (together, the Advisory Contracts) for the fund. The Board, assisted by the advice of fund counsel and Independent Trustees' counsel, requests and considers a broad range of information relevant to the renewal of the Advisory Contracts throughout the year.
The Board meets regularly and, at each of its meetings, covers an extensive agenda of topics and materials and considers factors that are relevant to its annual consideration of the renewal of the fund's Advisory Contracts, including the services and support provided to the fund and its shareholders. The Board has established various standing committees (Committees), each composed of and chaired by Independent Trustees with varying backgrounds, to which the Board has assigned specific subject matter responsibilities in order to enhance effective decision-making by the Board. The Board, acting directly and through its Committees, requests and receives information concerning the annual consideration of the renewal of the fund's Advisory Contracts. The Board also meets as needed to consider matters specifically related to the Board's annual consideration of the renewal of the Advisory Contracts. Members of the Board may also meet with trustees of other Fidelity funds through ad hoc joint committees to discuss certain matters relevant to the Fidelity funds.
At its July 2014 meeting, the Board, including the Independent Trustees, unanimously determined to renew the fund's Advisory Contracts. In reaching its determination, the Board considered all factors it believed relevant, including (i) the nature, extent, and quality of the services to be provided to the fund and its shareholders (including the investment performance of the fund); (ii) the competitiveness of the fund's management fee and total expense ratio relative to peer funds; (iii) the total costs of the services to be provided by and the profits to be realized by Fidelity from its relationship with the fund; (iv) the extent to which economies of scale exist and would be realized as the fund grows; and (v) whether fee levels reflect these economies of scale, if any, for the benefit of fund shareholders. In connection with separate internal corporate reorganizations involving Fidelity Management & Research (U.K.) Inc. (FMR U.K.) and Fidelity Management & Research (Japan) Inc. (FMR Japan), the Board approved certain non-material amendments to the fund's sub-advisory agreements with FMR U.K. and FMR Japan to reflect that, after these reorganizations, FMR Investment Management (UK) Limited and Fidelity Management & Research (Japan) Limited will carry on the business of FMR U.K. and FMR Japan, respectively. The Board noted that no changes to the portfolio managers or to the foreign research or investment advisory services provided to the fund were expected in connection with either reorganization and that the same personnel and resources would continue to be available to the fund at the new entities.
Annual Report
In considering whether to renew the Advisory Contracts for the fund, the Board reached a determination, with the assistance of fund counsel and Independent Trustees' counsel and through the exercise of its business judgment, that the renewal of the Advisory Contracts was in the best interests of the fund and its shareholders and that the compensation payable under the Advisory Contracts was fair and reasonable. The Board's decision to renew the Advisory Contracts was not based on any single factor, but rather was based on a comprehensive consideration of all the information provided to the Board at its meetings throughout the year. The Board, in reaching its determination to renew the Advisory Contracts, was aware that shareholders of the fund have a broad range of investment choices available to them, including a wide choice among funds offered by Fidelity's competitors, and that the fund's shareholders, who have the opportunity to review and weigh the disclosure provided by the fund in its prospectus and other public disclosures, have chosen to invest in this fund, which is part of the Fidelity family of funds.
Nature, Extent, and Quality of Services Provided. The Board considered Fidelity's staffing as it relates to the fund, including the backgrounds of investment personnel of FMR and the sub-advisers (together, the Investment Advisers), and also considered the fund's investment objective, strategies, and related investment philosophy. The Independent Trustees also had discussions with senior management of Fidelity's investment operations and investment groups. The Board considered the structure of the portfolio manager compensation program and whether this structure provides appropriate incentives to act in the best interests of the fund. Additionally, the Board considered the portfolio managers' investments, if any, in the funds that they manage.
Resources Dedicated to Investment Management and Support Services. The Board and the Fund Oversight and Research Committees reviewed the general qualifications and capabilities of Fidelity's investment staff, including its size, education, experience, and resources, as well as Fidelity's approach to recruiting, training, managing, and compensating investment personnel. The Board noted that Fidelity has continued to increase the resources devoted to non-U.S. offices, including expansion of Fidelity's global investment organization. The Board also noted that Fidelity's analysts have extensive resources, tools and capabilities that allow them to conduct sophisticated quantitative and fundamental analysis, as well as credit analysis of issuers, counterparties and guarantors. Further, the Board believes that Fidelity's investment professionals have sufficient access to global information and data so as to provide competitive investment results over time, and that those professionals also have access to sophisticated tools that permit them to assess portfolio construction and risk and performance attribution characteristics continuously, as well as to transmit new information and research conclusions rapidly around the world. Additionally, in its deliberations, the Board considered Fidelity's trading and risk management capabilities and resources and global compliance infrastructure, which are an integral part of the investment management process.
Annual Report
Board Approval of Investment Advisory Contracts and
Management Fees - continued
Shareholder and Administrative Services. The Board considered (i) the nature, extent, quality, and cost of advisory, administrative, and shareholder services performed by the Investment Advisers and their affiliates under the Advisory Contracts and under separate agreements covering transfer agency, pricing and bookkeeping, and securities lending services for the fund; (ii) the nature and extent of the supervision of third party service providers, principally custodians and subcustodians; and (iii) the resources devoted to, and the record of compliance with, the fund's compliance policies and procedures. The Board also reviewed the allocation of fund brokerage, including allocations to brokers affiliated with the Investment Advisers, the use of brokerage commissions to pay fund expenses, and the use of "soft" commission dollars to pay for research services.
The Board noted that the growth of fund assets over time across the complex allows Fidelity to reinvest in the development of services designed to enhance the value or convenience of the Fidelity funds as investment vehicles. These services include 24-hour access to account information and market information through telephone representatives and over the Internet, investor education materials and asset allocation tools, and the expanded availability of Fidelity Investor Centers.
In 2014, the Board formed an ad hoc Committee on Transfer Agency Fees to review the variety of transfer agency fee structures throughout the industry and Fidelity's competitive positioning with respect to industry participants.
Investment in a Large Fund Family. The Board considered the benefits to shareholders of investing in a Fidelity fund, including the benefits of investing in a fund that is part of a large family of funds offering a variety of investment disciplines and providing a large variety of mutual fund investor services. The Board noted that Fidelity had taken, or had made recommendations that resulted in the Fidelity funds taking, a number of actions over the previous year that benefited particular funds, including (i) continuing to dedicate additional resources to investment research and to the support of the senior management team that oversees asset management; (ii) persisting in efforts to enhance Fidelity's global research capabilities; (iii) launching new funds and making other enhancements to meet client needs for income-oriented solutions; (iv) reducing fund expenses for certain index funds; (v) continuing to launch dedicated lower cost underlying funds to meet portfolio construction needs related to expanding underlying fund options for Fidelity funds of funds, specifically for the Freedom Fund product lines; (vi) rationalizing product lines and gaining increased efficiencies through fund mergers; (vii) launching sector-based exchange-traded funds and establishing a new Fidelity adviser to manage sector-based funds and products; (viii) continuing to develop and implement technology to improve security and increase efficiency; (ix) modifying the eligibility criteria for certain share classes to increase their marketability to a portion of the defined contribution plan market; (x) waiving redemption fees for certain qualified fund-of-fund and wrap programs and certain retirement plan transactions; and (xi) launching new Institutional Class shares of certain money market funds to attract and retain assets and to fill a gap in the money market fund lineup.
Annual Report
Investment Performance. The Board considered whether the fund has operated in accordance with its investment objective, as well as its record of compliance with its investment restrictions and its performance history. The Board noted that there was a portfolio management change for the fund in March 2014.
The Board took into account discussions with the Investment Advisers about fund investment performance that occur at Board meetings throughout the year. In this regard the Board noted that as part of regularly scheduled fund reviews and other reports to the Board on fund performance, the Board periodically considers annualized return information for the fund, for different time periods, measured against a securities market index ("benchmark index") and a peer group of funds with similar objectives ("peer group"). In its evaluation of fund investment performance, the Board gave particular attention to information indicating changes in performance of certain Fidelity funds for specific time periods and the Investment Advisers' explanations for any overperformance or underperformance.
In addition to reviewing absolute and relative fund performance, the Independent Trustees periodically consider the appropriateness of fund performance metrics in evaluating the results achieved. In general, the Independent Trustees believe that fund performance should be evaluated based on net performance (after fees and expenses) of both the highest performing and lowest performing classes, where applicable, compared to appropriate benchmark indices, over appropriate time periods which may include full market cycles, and compared to peer groups, as applicable, over the same periods, taking into account relevant factors including the following: general market conditions; issuer-specific information; tactical opportunities for investment; and fund cash flows and other factors.
The Independent Trustees recognize that shareholders evaluate performance on a net basis over their own holding periods, for which one-, three-, and five-year periods are often used as a proxy. For this reason, the performance information reviewed by the Board also included net cumulative calendar year total return information for the fund and an appropriate benchmark index and peer group for the most recent one-, three-, and five-year periods, as shown below. Returns are shown compared to the 25th percentile (top of box, 75% beaten) and 75th percentile (bottom of box, 25% beaten) of the peer universe. Returns of the benchmark index are "net MA," i.e., adjusted for tax withholding rates applicable to U.S.-based funds organized as Massachusetts business trusts.
Annual Report
Board Approval of Investment Advisory Contracts and
Management Fees - continued
Fidelity International Small Cap Fund
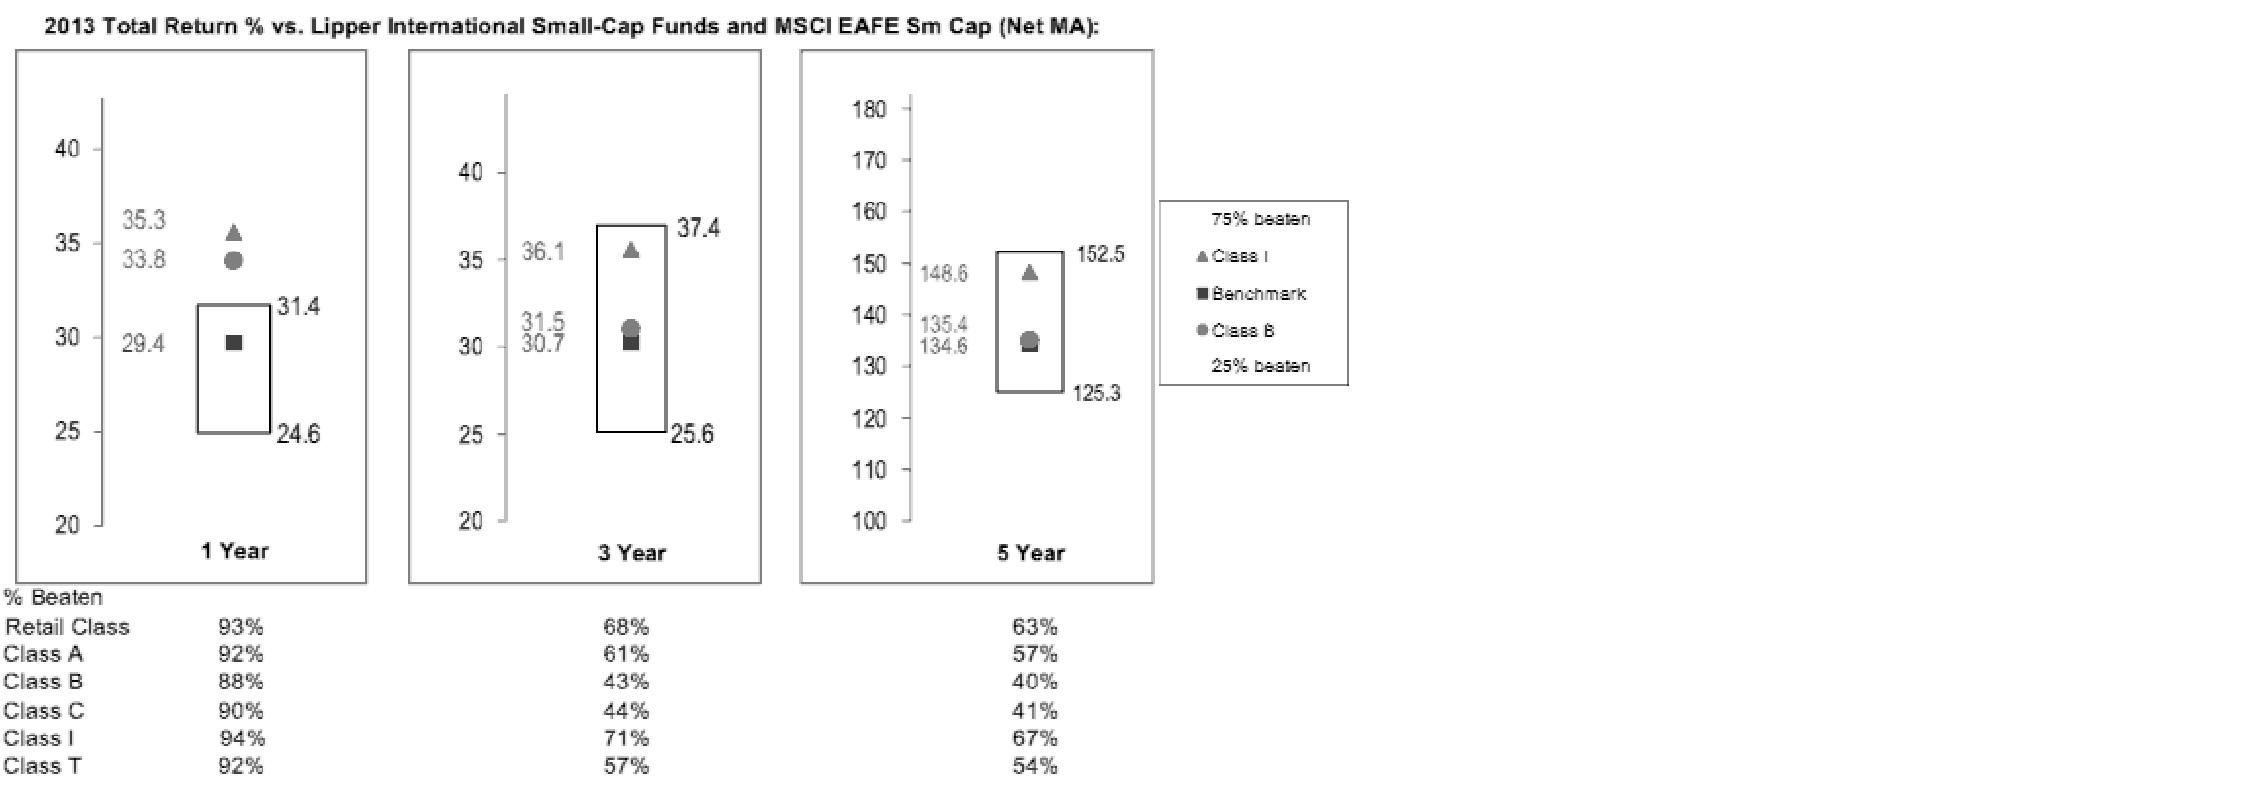
The Board also considered that the fund's management fee is subject to upward or downward adjustment depending upon whether, and to what extent, the fund's investment performance for the performance period exceeds, or is exceeded by, a securities index, thus leading to a performance adjustment for the same period. The Board noted that the performance adjustment provides FMR with a strong economic incentive to seek to achieve superior performance for the fund's shareholders and helps to more closely align the interests of FMR and the fund's shareholders.
Based on its review, the Board concluded that the nature, extent, and quality of services provided to the fund under the Advisory Contracts should benefit the fund's shareholders.
Competitiveness of Management Fee and Total Expense Ratio. The Board considered the fund's management fee and total expense ratio compared to "mapped groups" of competitive funds and classes. Fidelity creates "mapped groups" by combining similar Lipper investment objective categories that have comparable investment mandates. Combining Lipper investment objective categories aids the Board's management fee and total expense ratio comparisons by broadening the competitive group used for comparison and by reducing the number of universes to which various Fidelity funds are compared.
Management Fee. The Board considered two proprietary management fee comparisons for the 12-month periods shown in the chart below. The group of Lipper funds used by the Board for management fee comparisons is referred to below as the "Total Mapped Group." The Total Mapped Group is broader than the Lipper peer group used by the Board for performance comparisons because the Total Mapped Group combines several Lipper investment objective categories while the Lipper peer group does not. The Total Mapped Group comparison focuses on a fund's standing in terms of gross management fees before expense reimbursements or caps, and without giving effect to the fund's performance adjustment, relative to the total universe of funds with comparable investment mandates, regardless of whether their management fee structures also are comparable. Funds with comparable investment mandates offer exposure to similar types of securities. Funds with comparable management fee structures have similar management fee contractual arrangements (e.g., flat rate charged for advisory services, all-inclusive fee rate, etc.). "TMG %" represents the percentage of funds in the Total Mapped Group that had management fees that were lower than the fund's. For example, a hypothetical TMG % of 20% would mean that 80% of the funds in the Total Mapped Group had higher, and 20% had lower, management fees than the fund. The fund's actual TMG %s are in the chart below. The "Asset-Size Peer Group" (ASPG) comparison focuses on a fund's standing relative to a subset of non-Fidelity funds within the Total Mapped Group that are similar in size and management fee structure. For example, if a fund is in the first quartile of the ASPG, the fund's management fee ranks in the least expensive or lowest 25% of funds in the ASPG. The ASPG represents at least 15% of the funds in the Total Mapped Group with comparable asset size and management fee structures, subject to a minimum of 50 funds (or all funds in the Total Mapped Group if fewer than 50). Additional information, such as the ASPG quartile in which the fund's management fee rate ranked and the impact of the fund's performance adjustment, is also included in the chart and considered by the Board.
Annual Report
Fidelity International Small Cap Fund
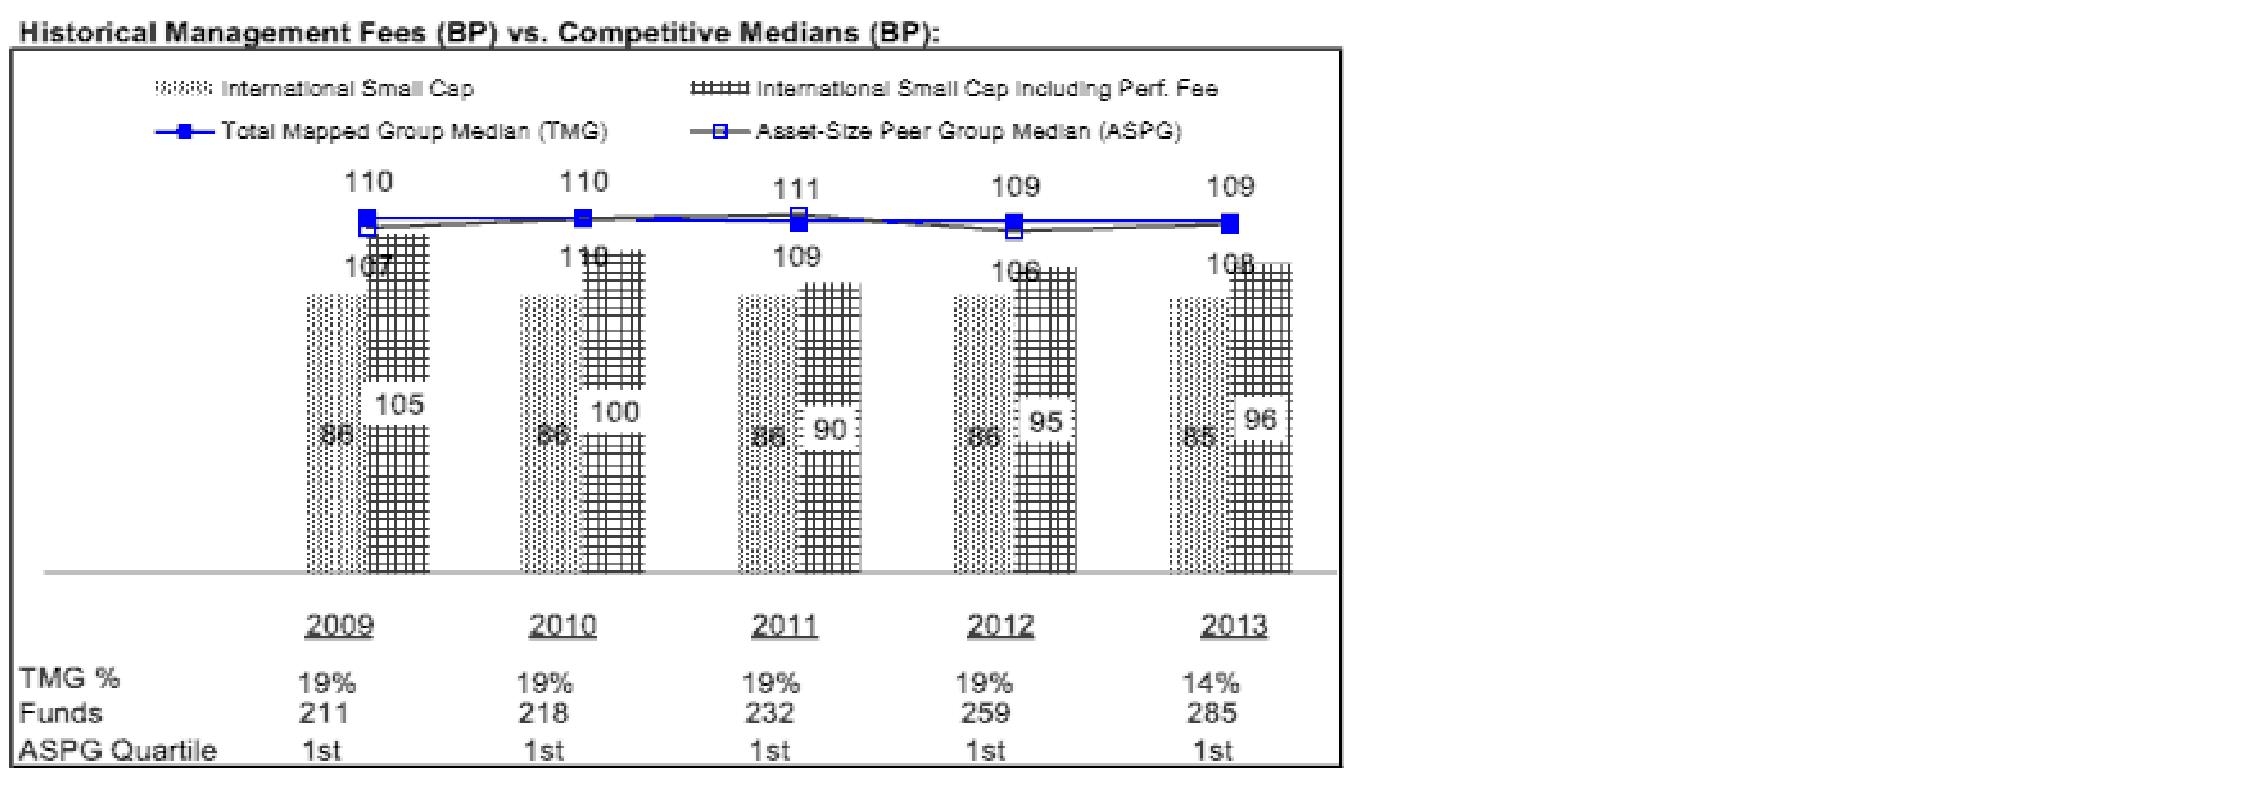
Annual Report
Board Approval of Investment Advisory Contracts and
Management Fees - continued
The Board noted that the fund's management fee rate ranked below the median of its Total Mapped Group and below the median of its ASPG for 2013. The Board also noted the effect of the fund's positive performance adjustment on the fund's management fee ranking.
The Board also noted that, in August 2013, the ad hoc Committee on Management Fees was formed to conduct an in-depth review of the management fee rates of Fidelity's active equity mutual funds. The Committee focused on the following areas: (i) standard fee structures; (ii) research consumption and trading evolution; (iii) management fee competitiveness/profitability by category; and (iv) factors that drive institutional pricing.
Based on its review, the Board concluded that the fund's management fee is fair and reasonable in light of the services that the fund receives and the other factors considered.
Total Expense Ratio. In its review of each class's total expense ratio, the Board considered the fund's management fee as well as other fund or class expenses, as applicable, such as transfer agent fees, pricing and bookkeeping fees, fund-paid 12b-1 fees, and custodial, legal, and audit fees. The Board also noted the effects of any waivers and reimbursements on fees and expenses, as well as the impact of the fund's performance adjustment. As part of its review, the Board also considered the current and historical total expense ratios of each class of the fund compared to competitive fund median expenses. Each class of the fund is compared to those funds and classes in the Total Mapped Group (used by the Board for management fee comparisons) that have a similar sales load structure.
The Board noted that the total expense ratio of each of Class A, Class C, Institutional Class, and the retail class ranked below its competitive median for 2013 and the total expense ratio of each of Class T and Class B ranked above its competitive median for 2013. The Board considered that, in general, various factors can affect total expense ratios. The Board noted that the total expense ratio of Class T was above the competitive median primarily because of higher 12b-1 fees on Class T as compared to most competitor funds. Class T has a higher 12b-1 fee, but a lower front-end sales charge, than traditionally priced front-end sales charge classes. The Board considered that Class T is primarily sold load-waived in the retirement plan market where its 0.50% 12b-1 fee is comparable to competing no-load, higher 12b-1 fee classes designed specifically for retirement plans. The Board noted that the fund offers multiple classes, each of which has a different sales load and 12b-1 fee structure, and that the multiple structures are intended to offer a range of pricing options for the intermediary market. The Board also noted that the total expense ratios of the classes vary primarily by the level of their 12b-1 fees, although differences in transfer agent fees may also cause expenses to vary from class to class.
Annual Report
Fees Charged to Other Fidelity Clients. The Board also considered Fidelity fee structures and other information with respect to clients of Fidelity, such as other funds advised or subadvised by Fidelity, pension plan clients, and other institutional clients. The Board noted the findings of the 2013 ad hoc joint committee (created with the board of other Fidelity funds), which reviewed and compared Fidelity's institutional investment advisory business with its business of providing services to the Fidelity funds, including the differences in services provided, fees charged, and costs incurred, as well as competition in their respective marketplaces.
Based on its review of total expense ratios and fees charged to other Fidelity clients, the Board concluded that the total expense ratio of each class of the fund was reasonable, although in some cases above the median of the universe presented for comparison, in light of the services that the fund and its shareholders receive and the other factors considered.
Costs of the Services and Profitability. The Board considered the revenues earned and the expenses incurred by Fidelity in conducting the business of developing, marketing, distributing, managing, administering and servicing the fund and servicing the fund's shareholders. The Board also considered the level of Fidelity's profits in respect of all the Fidelity funds.
On an annual basis, Fidelity presents to the Board Fidelity's profitability for the fund. Fidelity calculates the profitability for each fund, as well as aggregate profitability for groups of Fidelity funds and all Fidelity funds, using a series of detailed revenue and cost allocation methodologies which originate with the books and records of Fidelity on which Fidelity's audited financial statements are based. The Audit Committee of the Board reviews any significant changes from the prior year's methodologies.
PricewaterhouseCoopers LLP (PwC), independent registered public accounting firm and auditor to Fidelity and certain Fidelity funds, has been engaged annually by the Board as part of the Board's assessment of Fidelity's profitability analysis. PwC's engagement includes the review and assessment of the methodologies used by Fidelity in determining the revenues and expenses attributable to Fidelity's mutual fund business, and completion of agreed-upon procedures in respect of the mathematical accuracy of fund profitability and its conformity to established allocation methodologies. After considering PwC's reports issued under the engagement and information provided by Fidelity, the Board concluded that while other allocation methods may also be reasonable, Fidelity's profitability methodologies are reasonable in all material respects.
The Board also reviewed Fidelity's non-fund businesses and fall-out benefits related to the mutual fund business as well as cases where Fidelity's affiliates may benefit from or be related to the fund's business.
Annual Report
Board Approval of Investment Advisory Contracts and
Management Fees - continued
The Board considered the costs of the services provided by and the profits realized by Fidelity in connection with the operation of the fund and was satisfied that the profitability was not excessive in the circumstances.
Economies of Scale. The Board considered whether there have been economies of scale in respect of the management of the Fidelity funds, whether the Fidelity funds (including the fund) have appropriately benefited from any such economies of scale, and whether there is potential for realization of any further economies of scale. The Board considered the extent to which the fund will benefit from economies of scale through increased services to the fund, through waivers or reimbursements, or through fee or expense ratio reductions. The Board also noted that in 2013, it and the boards of other Fidelity funds created an ad hoc committee (the Economies of Scale Committee) to analyze whether Fidelity attains economies of scale in respect of the management and servicing of the Fidelity funds, whether the Fidelity funds have appropriately benefited from such economies of scale, and whether there is potential for realization of any further economies of scale.
The Board recognized that the fund's management contract incorporates a "group fee" structure, which provides for lower group fee rates as total group assets increase, and for higher group fee rates as total group assets decrease (with "group assets" defined to include fund assets under FMR's management plus sector fund assets previously under FMR's management and currently managed by Fidelity SelectCo, LLC). FMR calculates the group fee rates based on a tiered asset "breakpoint" schedule that varies based on asset class. The Board considered that the group fee is designed to deliver the benefits of economies of scale to fund shareholders when total Fidelity fund assets increase, even if assets of any particular fund are unchanged or have declined, because some portion of Fidelity's costs are attributable to services provided to all Fidelity funds, and all funds benefit if those costs can be allocated among more assets. The Board concluded that, given the group fee structure, fund shareholders will benefit from lower management fees as group assets increase at the fund complex level, regardless of whether Fidelity achieves any such economies of scale.
The Board concluded, taking into account the analysis of the Economies of Scale Committee, that economies of scale, if any, are being appropriately shared between fund shareholders and Fidelity.
Additional Information Requested by the Board. In order to develop fully the factual basis for consideration of the Fidelity funds' Advisory Contracts, the Board requested and received additional information on certain topics, including: (i) fund performance trends and Fidelity's long-term strategies for certain funds; (ii) Fidelity's strategic marketing and product lineup goals; (iii) the methodology with respect to competitive fund data and peer group classifications; (iv) the arrangements with, and performance of, certain sub-advisers on behalf of the Fidelity funds, as well as certain proposed participating affiliate arrangements; (v) the realization of fall-out benefits in certain Fidelity business units; (vi) Fidelity's group fee structures, including the rationale for the individual fee rates of certain categories of funds and the definition of group assets; (vii) trends regarding industry use of performance fee structures and the performance adjustment methodologies applicable to the Fidelity funds; (viii) additional competitive analysis regarding the total expenses for certain classes; (ix) fund profitability methodology, including Fidelity's cost allocation methodology, and the impact of certain factors on fund profitability results; and (x) the process by which Fidelity determines sub-advisory fees for funds it advises.
Annual Report
Based on its evaluation of all of the conclusions noted above, and after considering all factors it believed relevant, the Board ultimately concluded that the advisory fee structures are fair and reasonable, and that the fund's Advisory Contracts should be renewed.
Annual Report
Investment Adviser
Fidelity Management & Research Company
Boston, MA
Investment Sub-Advisers
FMR Co., Inc.
Fidelity Management & Research
(U.K.) Inc.
Fidelity Management & Research
(Hong Kong) Limited
Fidelity Management & Research
(Japan) Limited
FIL Investment Advisors
FIL Investments (Japan) Limited
FIL Investment Advisors (UK) Limited
General Distributor
Fidelity Distributors Corporation
Smithfield, RI
Transfer and Service Agents
Fidelity Investments Institutional Operations Company, Inc.
Boston, MA
Fidelity Service Company, Inc.
Boston, MA
Custodian
The Bank of New York Mellon
New York, NY
(Fidelity Investment logo)(registered trademark)
AISCI-UANN-1214
1.793572.111
Fidelity®
International Small Cap
Fund
Annual Report
October 31, 2014
(Fidelity Cover Art)
Contents
Performance | (Click Here) | How the fund has done over time. |
Management's Discussion of Fund Performance | (Click Here) | The Portfolio Manager's review of fund performance and strategy. |
Shareholder Expense Example | (Click Here) | An example of shareholder expenses. |
Investment Changes | (Click Here) | A summary of major shifts in the fund's investments over the past six months. |
Investments | (Click Here) | A complete list of the fund's investments with their market values. |
Financial Statements | (Click Here) | Statements of assets and liabilities, operations, and changes in net assets, as well as financial highlights. |
Notes | (Click Here) | Notes to financial statements. |
Report of Independent Registered Public Accounting Firm | (Click Here) | |
Trustees and Officers | (Click Here) | |
Distributions | (Click Here) | |
Proxy Voting Results | (Click Here) | |
Board Approval of Investment Advisory Contracts and Management Fees | (Click Here) | |
To view a fund's proxy voting guidelines and proxy voting record for the 12-month period ended June 30, visit http://www.fidelity.com/proxyvotingresults or visit the Securities and Exchange Commission's (SEC) web site at http://www.sec.gov. You may also call 1-800-544-8544 to request a free copy of the proxy voting guidelines.
Standard & Poor's, S&P and S&P 500 are registered service marks of The McGraw-Hill Companies, Inc. and have been licensed for use by Fidelity Distributors Corporation.
Other third-party marks appearing herein are the property of their respective owners.
All other marks appearing herein are registered or unregistered trademarks or service marks of FMR LLC or an affiliated company. © 2014 FMR LLC. All rights reserved.
Annual Report
This report and the financial statements contained herein are submitted for the general information of the shareholders of the fund. This report is not authorized for distribution to prospective investors in the fund unless preceded or accompanied by an effective prospectus.
A fund files its complete schedule of portfolio holdings with the SEC for the first and third quarters of each fiscal year on Form N-Q. Forms N-Q are available on the SEC's web site at http://www.sec.gov. A fund's Forms N-Q may be reviewed and copied at the SEC's Public Reference Room in Washington, DC. Information regarding the operation of the SEC's Public Reference Room may be obtained by calling 1-800-SEC-0330. For a complete list of a fund's portfolio holdings, view the most recent holdings listing, semiannual report, or annual report on Fidelity's web site at http://www.fidelity.com, http://www.advisor.fidelity.com, or http://www.401k.com, as applicable.
NOT FDIC INSURED • MAY LOSE VALUE • NO BANK GUARANTEE
Neither the fund nor Fidelity Distributors Corporation is a bank.
Annual Report
Average annual total return reflects the change in the value of an investment, assuming reinvestment of the class' distributions from dividend income and capital gains (the profits earned upon the sale of securities that have grown in value, if any) and assuming a constant rate of performance each year. The $10,000 table and the fund's returns do not reflect the deduction of taxes that a shareholder would pay on fund distributions or the redemption of fund shares. During periods of reimbursement by Fidelity, a fund's total return will be greater than it would be had the reimbursement not occurred. How a fund did yesterday is no guarantee of how it will do tomorrow.
Average Annual Total Returns
Periods ended October 31, 2014 | Past 1
year | Past 5
years | Past 10
years |
Fidelity® International Small Cap Fund† | -2.48% | 10.59% | 9.02% |
† Prior to April 1, 2014, Fidelity International Small Cap Fund compared its performance to a different benchmark. The fund's historical performance may not represent its current investment policies.
$10,000 Over 10 Years
Let's say hypothetically that $10,000 was invested in Fidelity® International Small Cap Fund, a class of the fund, on October 31, 2004. The chart shows how the value of your investment would have changed, and also shows how the MSCI ACWI (All Country World Index) ex USA Small Cap Index and MSCI EAFE Small Cap Index performed over the same period.
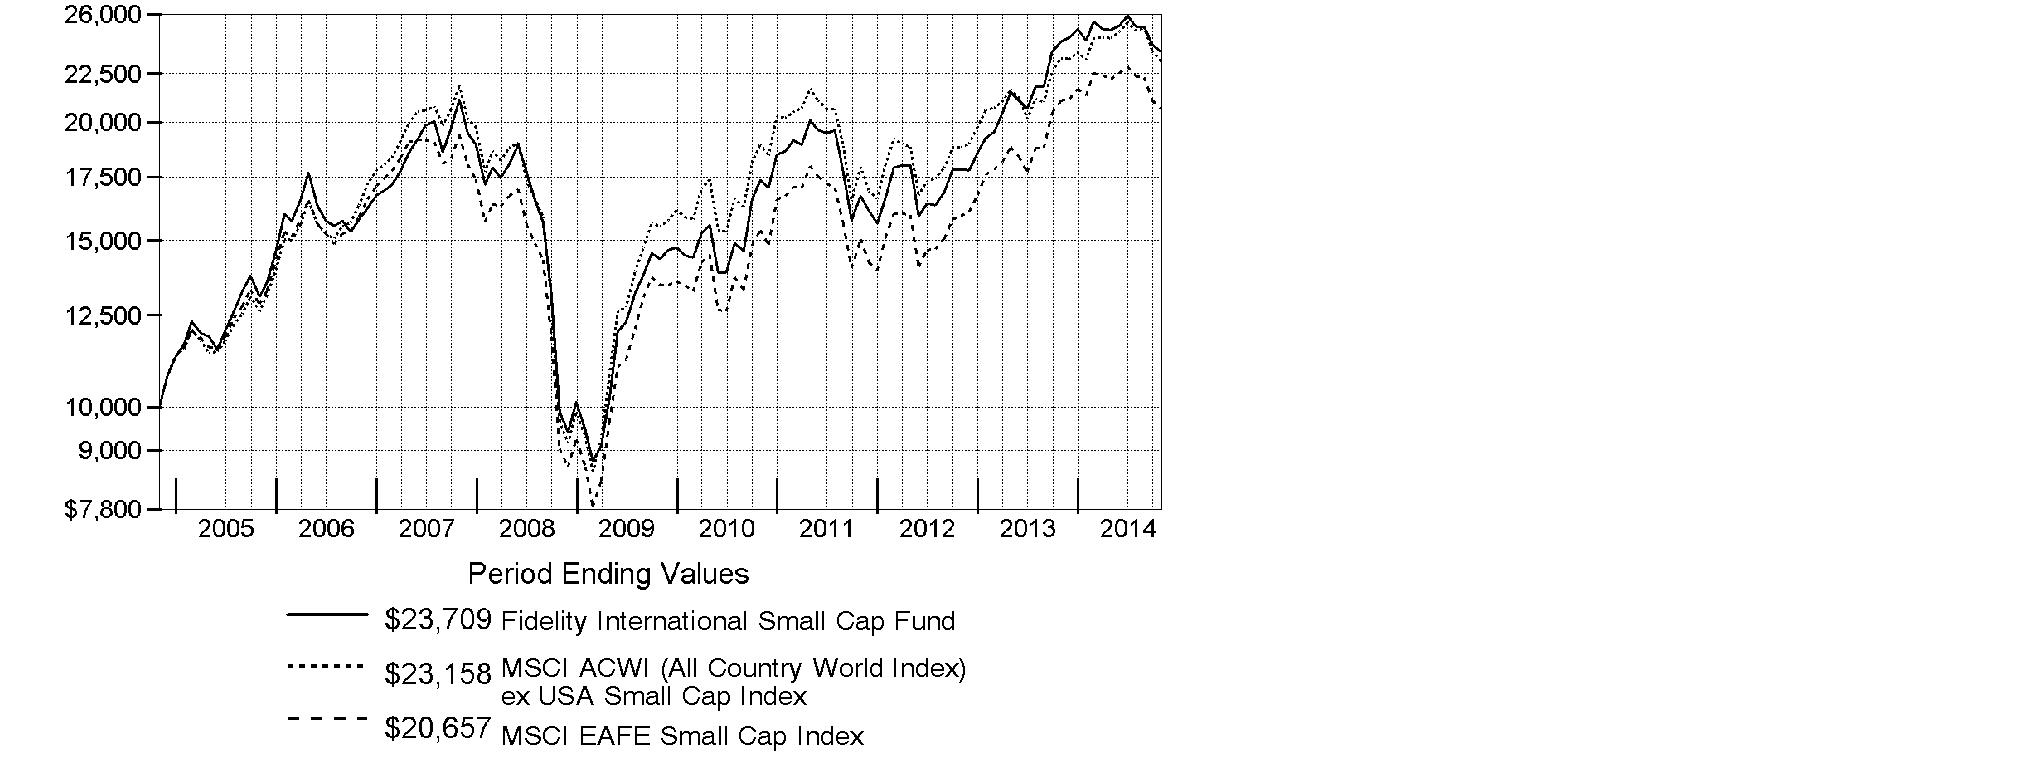
Effective April 1, 2014, the fund began comparing its performance to the MSCI ACWI (All Country World Index) ex USA Small Cap Index rather than the MSCI EAFE Small Cap Index because the MSCI ACWI (All Country World Index) ex USA Small Cap Index provides a more appropriate performance comparison for the fund.
Annual Report
Market Recap: Global equities posted a healthy gain for the 12 months ending October 31, 2014, overcoming an October market decline driven by recessionary pressures in China and tepid growth in Europe. The MSCI ACWI (All Country World Index) Index rose 8.15%, helped by subdued market volatility for much of the period and supported by solid corporate earnings, especially in the United States. Stocks also benefited from easy monetary policies in Japan and the eurozone, as well as increased stimulus efforts in China. All but three of the 24 industry groups that compose the index marked a positive return. The U.S. (+17%) remained a pillar of strength, while a strongly rising dollar in the latter part of the period detracted from investors' returns in most non-U.S. markets. Canada (+5%) notched broad gains outside of its energy and materials sectors, as did Asia-Pacific ex Japan (+4%), led by investor enthusiasm for companies in India. The U.K., Europe and Japan, meanwhile, all underperformed. Among sectors, health care (+24%) led the index, with a strong contribution from the pharmaceuticals, biotechnology & life sciences industry. Information technology (+21%) also outperformed. Conversely, materials (-4%) and energy (-1%) lagged the index due to a higher supply of and lower demand for commodities.
Comments from Samuel Chamovitz, who became Portfolio Manager of Fidelity® International Small Cap Fund on March 1, 2014: For the year, the fund's Retail Class shares returned -2.48%, trailing the -0.79% return of the MSCI ACWI (All Country World Index) ex USA Small Cap Index, which became the fund's primary benchmark on April 1, 2014, and the -1.91% result of the old benchmark, the MSCI EAFE Small Cap Index. Additionally, the fund's performance fell short of the 0.29% return of a linked index combining the returns of the MSCI EAFE Small Cap Index, with which the fund was compared through March, and the new MSCI benchmark, with which the fund was compared during the period's final seven months. The fund's benchmark was changed to reflect a broadened investment focus. Stock selection in Japan meaningfully weighed on the fund's relative results. A sizable overweighting in Japanese utility Hokkaido Electric Power was by far the biggest relative detractor. GFK, a Luxembourg-based consumer research provider, also hampered performance. Both detractors I mentioned were sold from the fund. Conversely, the top relative contributor was a non-index position in Japan-based home furnishings retailer Nitori Holdings.
The views expressed above reflect those of the portfolio manager(s) only through the end of the period as stated on the cover of this report and do not necessarily represent the views of Fidelity or any other person in the Fidelity organization. Any such views are subject to change at any time based upon market or other conditions and Fidelity disclaims any responsibility to update such views. These views may not be relied on as investment advice and, because investment decisions for a Fidelity fund are based on numerous factors, may not be relied on as an indication of trading intent on behalf of any Fidelity fund.
Annual Report
Shareholder Expense Example
As a shareholder of the Fund, you incur two types of costs: (1) transaction costs, including sales charges (loads) on purchase payments or redemption proceeds, redemption fees and (2) ongoing costs, including management fees, distribution and/or service (12b-1) fees and other Fund expenses. This Example is intended to help you understand your ongoing costs (in dollars) of investing in the Fund and to compare these costs with the ongoing costs of investing in other mutual funds.
The Example is based on an investment of $1,000 invested at the beginning of the period and held for the entire period (May 1, 2014 to October 31, 2014).
Actual Expenses
The first line of the accompanying table for each class of the Fund provides information about actual account values and actual expenses. You may use the information in this line, together with the amount you invested, to estimate the expenses that you paid over the period. Simply divide your account value by $1,000.00 (for example, an $8,600 account value divided by $1,000.00 = 8.6), then multiply the result by the number in the first line for a class of the Fund under the heading entitled "Expenses Paid During Period" to estimate the expenses you paid on your account during this period. A small balance maintenance fee of $12.00 that is charged once a year may apply for certain accounts with a value of less than $2,000. This fee is not included in the table below. If it was, the estimate of expenses you paid during the period would be higher, and your ending account value lower, by this amount. In addition, the Fund, as a shareholder in the underlying Fidelity Central Funds, will indirectly bear its pro-rata share of the fees and expenses incurred by the underlying Fidelity Central Funds. These fees and expenses are not included in the Fund's annualized expense ratio used to calculate the expense estimate in the table below.
Hypothetical Example for Comparison Purposes
The second line of the accompanying table for each class of the Fund provides information about hypothetical account values and hypothetical expenses based on a Class' actual expense ratio and an assumed rate of return of 5% per year before expenses, which is not the Class' actual return. The hypothetical account values and expenses may not be used to estimate the actual ending account balance or expenses you paid for the period. You may use this information to compare the ongoing costs of investing in the Fund and other funds. To do so, compare this 5% hypothetical example with the 5% hypothetical examples that appear in the shareholder reports of the other funds. A small balance maintenance fee of $12.00 that is charged once a year may apply for certain accounts with a value of less than $2,000. This fee is not included in the table below. If it was, the estimate of expenses you paid during the period would be higher, and your ending account value lower, by this amount. In addition, the Fund, as a shareholder in the underlying Fidelity Central Funds, will indirectly bear its pro-rata share of the fees and expenses incurred by the underlying Fidelity Central Funds. These fees and expenses are not included in the Fund's annualized expense ratio used to calculate the expense estimate in the table below.
Please note that the expenses shown in the table are meant to highlight your ongoing costs only and do not reflect any transaction costs. Therefore, the second line of the table is useful in comparing ongoing costs only, and will not help you determine the relative total costs of owning different funds. In addition, if these transactional costs were included, your costs would have been higher.
Annual Report
| Annualized
Expense Ratio B | Beginning
Account Value
May 1, 2014 | Ending
Account Value
October 31, 2014 | Expenses Paid
During Period*
May 1, 2014
to October 31, 2014 |
Class A | 1.49% | | | |
Actual | | $ 1,000.00 | $ 947.30 | $ 7.31 |
HypotheticalA | | $ 1,000.00 | $ 1,017.69 | $ 7.58 |
Class T | 1.75% | | | |
Actual | | $ 1,000.00 | $ 946.20 | $ 8.58 |
HypotheticalA | | $ 1,000.00 | $ 1,016.38 | $ 8.89 |
Class B | 2.23% | | | |
Actual | | $ 1,000.00 | $ 943.80 | $ 10.93 |
HypotheticalA | | $ 1,000.00 | $ 1,013.96 | $ 11.32 |
Class C | 2.21% | | | |
Actual | | $ 1,000.00 | $ 944.00 | $ 10.83 |
HypotheticalA | | $ 1,000.00 | $ 1,014.06 | $ 11.22 |
International Small Cap | 1.19% | | | |
Actual | | $ 1,000.00 | $ 948.70 | $ 5.85 |
HypotheticalA | | $ 1,000.00 | $ 1,019.21 | $ 6.06 |
Institutional Class | 1.08% | | | |
Actual | | $ 1,000.00 | $ 949.40 | $ 5.31 |
HypotheticalA | | $ 1,000.00 | $ 1,019.76 | $ 5.50 |
A 5% return per year before expenses
B Annualized expense ratio reflects expenses net of applicable fee waivers.
* Expenses are equal to each Class' annualized expense ratio, multiplied by the average account value over the period, multiplied by 184/365 (to reflect the one-half year period).
Annual Report
Investment Changes (Unaudited)
Geographic Diversification (% of fund's net assets) |
As of October 31, 2014 |
 | Japan 21.2% | |
 | United Kingdom 16.9% | |
 | United States of America* 5.7% | |
 | Australia 5.4% | |
 | Switzerland 4.3% | |
 | Canada 4.2% | |
 | France 3.5% | |
 | Germany 3.4% | |
 | Cayman Islands 3.2% | |
 | Other 32.2% | |

* Includes Short-Term Investments and Net Other Assets (Liabilities). |
Percentages are based on country or territory of incorporation and are adjusted for the effect of futures contracts, if applicable. |
As of April 30, 2014 |
| Japan 19.0% | |
| United Kingdom 16.1% | |
| United States of America* 9.8% | |
| Germany 6.1% | |
| France 5.6% | |
| Australia 5.0% | |
| Cayman Islands 3.7% | |
| Bermuda 3.6% | |
| Switzerland 2.8% | |
| Other 28.3% | |

* Includes Short-Term Investments and Net Other Assets (Liabilities). |
Percentages are based on country or territory of incorporation and are adjusted for the effect of futures contracts, if applicable. |
Asset Allocation as of October 31, 2014 |
| % of fund's
net assets | % of fund's net assets
6 months ago |
Stocks | 95.5 | 91.4 |
Bonds | 0.0 | 0.2 |
Investment Companies | 0.0 | 4.5 |
Short-Term Investments and Net Other Assets (Liabilities) | 4.5 | 3.9 |
Top Ten Stocks as of October 31, 2014 |
| % of fund's
net assets | % of fund's net assets
6 months ago |
Tsuruha Holdings, Inc. (Japan, Food & Staples Retailing) | 2.2 | 1.5 |
Ultra Electronics Holdings PLC (United Kingdom, Aerospace & Defense) | 1.3 | 1.0 |
Close Brothers Group PLC (United Kingdom, Capital Markets) | 1.3 | 1.0 |
Dillard's, Inc. Class A (United States of America, Multiline Retail) | 1.2 | 0.9 |
EBOS Group Ltd. (New Zealand, Health Care Providers & Services) | 1.2 | 0.9 |
Nitori Holdings Co. Ltd. (Japan, Specialty Retail) | 1.1 | 1.1 |
Clicks Group Ltd. (South Africa, Food & Staples Retailing) | 1.1 | 0.9 |
Moneysupermarket.com Group PLC (United Kingdom, Internet Software & Services) | 1.0 | 1.1 |
Jyske Bank A/S (Reg.) (Denmark, Banks) | 1.0 | 0.5 |
Pargesa Holding SA (Switzerland, Diversified Financial Services) | 0.9 | 0.9 |
| 12.3 | |
Market Sectors as of October 31, 2014 |
| % of fund's
net assets | % of fund's net assets
6 months ago |
Industrials | 19.4 | 18.6 |
Financials | 18.8 | 17.9 |
Consumer Discretionary | 15.8 | 15.6 |
Information Technology | 11.1 | 11.4 |
Materials | 8.4 | 9.0 |
Health Care | 7.9 | 7.4 |
Consumer Staples | 7.7 | 5.2 |
Energy | 5.2 | 5.6 |
Telecommunication Services | 0.8 | 0.6 |
Utilities | 0.4 | 0.3 |
Annual Report
Investments October 31, 2014
Showing Percentage of Net Assets
Common Stocks - 95.5% |
| Shares | | Value |
Australia - 5.4% |
Austal Ltd. (a) | 3,396,893 | | $ 3,834,820 |
Bradken Ltd. | 1,369,055 | | 4,670,117 |
Challenger Ltd. | 845,650 | | 5,201,309 |
Charter Hall Group unit | 1,196,020 | | 4,604,097 |
GUD Holdings Ltd. (d) | 1,213,118 | | 7,678,736 |
iiNet Ltd. | 455,468 | | 3,214,157 |
Imdex Ltd. (a) | 7,363,809 | | 3,899,196 |
Life Healthcare Group Ltd. | 1,826,612 | | 3,657,331 |
Nanosonics Ltd. (a) | 1,455,582 | | 1,255,061 |
RCG Corp. Ltd. | 2,518,231 | | 1,362,204 |
Slater & Gordon Ltd. | 1,258,177 | | 6,797,893 |
SomnoMed Ltd. (a) | 584,445 | | 1,273,029 |
Vision Group Holdings Ltd. | 1,221,604 | | 809,573 |
TOTAL AUSTRALIA | | 48,257,523 |
Austria - 1.1% |
Andritz AG | 106,312 | | 5,131,822 |
RHI AG | 195,100 | | 4,998,589 |
TOTAL AUSTRIA | | 10,130,411 |
Bailiwick of Jersey - 1.1% |
Kennedy Wilson Europe Real Estate PLC | 236,185 | | 3,929,382 |
Regus PLC (d) | 2,000,300 | | 6,313,363 |
TOTAL BAILIWICK OF JERSEY | | 10,242,745 |
Belgium - 1.3% |
Barco NV | 94,703 | | 6,978,211 |
Econocom Group SA | 735,085 | | 4,748,640 |
TOTAL BELGIUM | | 11,726,851 |
Bermuda - 2.9% |
APT Satellite Holdings Ltd. | 2,096,000 | | 3,051,814 |
BW Offshore Ltd. | 5,156,413 | | 6,322,291 |
Hiscox Ltd. | 604,895 | | 6,589,700 |
Petra Diamonds Ltd. (a) | 1,917,200 | | 5,091,128 |
STELUX Holdings International | 5,614,000 | | 1,245,301 |
Travelport Worldwide Ltd. (d) | 265,100 | | 3,830,695 |
TOTAL BERMUDA | | 26,130,929 |
British Virgin Islands - 0.2% |
Mail.Ru Group Ltd. GDR (Reg. S) (a) | 72,524 | | 1,757,982 |
Canada - 4.2% |
Constellation Software, Inc. | 18,966 | | 5,342,891 |
Common Stocks - continued |
| Shares | | Value |
Canada - continued |
Dorel Industries, Inc. Class B (sub. vtg.) | 104,700 | | $ 3,253,266 |
Genesis Land Development Corp. | 886,300 | | 3,483,704 |
Jean Coutu Group, Inc. Class A (sub. vtg.) | 319,160 | | 7,317,417 |
Lassonde Industries, Inc. Class A (sub. vtg.) | 26,600 | | 2,912,653 |
McCoy Global, Inc. | 244,300 | | 1,036,116 |
ShawCor Ltd. Class A | 154,929 | | 6,825,096 |
Whitecap Resources, Inc. (d) | 585,981 | | 7,585,700 |
TOTAL CANADA | | 37,756,843 |
Cayman Islands - 3.2% |
AMVIG Holdings Ltd. | 11,576,000 | | 5,420,308 |
Bonjour Holdings Ltd. | 47,792,800 | | 6,048,786 |
China High Precision Automation Group Ltd. (a) | 712,000 | | 27,543 |
China Metal Recycling (Holdings) Ltd. (a) | 436,800 | | 1 |
Lifestyle International Holdings Ltd. | 3,661,500 | | 6,956,149 |
Pico Far East Holdings Ltd. | 18,482,000 | | 4,577,046 |
SITC International Holdings Co. Ltd. | 10,248,000 | | 5,459,089 |
TOTAL CAYMAN ISLANDS | | 28,488,922 |
Chile - 0.5% |
Quinenco SA | 2,290,914 | | 4,757,642 |
Denmark - 1.0% |
Jyske Bank A/S (Reg.) (a) | 161,979 | | 8,726,876 |
Finland - 1.9% |
Amer Group PLC (A Shares) | 297,916 | | 5,700,802 |
Kemira Oyj | 358,900 | | 4,632,482 |
Rakentajain Konevuokraamo Oyj (B Shares) (d) | 173,356 | | 2,522,169 |
Tikkurila Oyj | 205,600 | | 4,246,033 |
TOTAL FINLAND | | 17,101,486 |
France - 3.5% |
ALTEN | 112,000 | | 4,788,838 |
Faurecia SA | 119,873 | | 3,874,144 |
Parrot SA (a) | 192,714 | | 3,656,303 |
Sopra Group SA | 61,000 | | 4,572,005 |
The Lisi Group | 170,500 | | 4,275,378 |
The Vicat Group | 93,298 | | 6,378,958 |
Wendel SA | 39,952 | | 4,402,791 |
TOTAL FRANCE | | 31,948,417 |
Germany - 3.4% |
AURELIUS AG | 158,535 | | 5,507,081 |
Common Stocks - continued |
| Shares | | Value |
Germany - continued |
CompuGroup Medical AG | 239,549 | | $ 5,493,492 |
GEA Group AG | 170,762 | | 7,852,378 |
LEG Immobilien AG | 75,836 | | 5,231,615 |
LEONI AG | 82,747 | | 4,733,649 |
SHW Group | 49,128 | | 2,236,032 |
TOTAL GERMANY | | 31,054,247 |
Greece - 0.8% |
Metka SA | 359,600 | | 3,514,935 |
Motor Oil (HELLAS) Corinth Refineries SA | 552,490 | | 4,043,341 |
TOTAL GREECE | | 7,558,276 |
Hong Kong - 1.9% |
Dah Sing Banking Group Ltd. | 3,094,000 | | 5,621,581 |
Far East Horizon Ltd. | 3,161,000 | | 2,939,913 |
Magnificent Estates Ltd. (a) | 91,044,000 | | 4,342,986 |
Singamas Container Holdings Ltd. | 3,360,000 | | 580,876 |
Techtronic Industries Co. Ltd. | 1,184,500 | | 3,708,198 |
TOTAL HONG KONG | | 17,193,554 |
India - 0.7% |
McLeod Russel India Ltd. | 748,354 | | 3,168,801 |
Shriram Transport Finance Co. Ltd. | 186,687 | | 2,887,986 |
TOTAL INDIA | | 6,056,787 |
Ireland - 1.7% |
C&C Group PLC | 1,099,500 | | 4,896,838 |
Mincon Group PLC | 3,000,521 | | 2,782,476 |
United Drug PLC (United Kingdom) | 1,479,749 | | 7,792,673 |
TOTAL IRELAND | | 15,471,987 |
Isle of Man - 0.6% |
Lamprell PLC (a) | 2,352,546 | | 5,522,742 |
Israel - 0.8% |
Frutarom Industries Ltd. | 283,210 | | 7,030,974 |
Italy - 1.0% |
Danieli & C. Officine Meccaniche SpA | 180,697 | | 4,211,792 |
Prysmian SpA | 263,900 | | 4,563,747 |
TOTAL ITALY | | 8,775,539 |
Japan - 21.2% |
A/S One Corp. | 128,900 | | 3,683,560 |
Common Stocks - continued |
| Shares | | Value |
Japan - continued |
ACOM Co. Ltd. (a) | 461,000 | | $ 1,536,627 |
Aeon Delight Co. Ltd. | 146,700 | | 3,583,755 |
Ain Pharmaciez, Inc. | 136,300 | | 3,692,400 |
Arc Land Sakamoto Co. Ltd. | 172,100 | | 3,836,649 |
Asahi Co. Ltd. | 239,400 | | 2,661,849 |
Broadleaf Co. Ltd. | 471,200 | | 7,447,388 |
Daiwa Industries Ltd. | 446,000 | | 3,400,792 |
Fuji Corp. | 147,800 | | 1,523,684 |
Fukuda Denshi Co. Ltd. | 148,400 | | 7,595,265 |
GMO Internet, Inc. | 676,800 | | 5,682,740 |
Higashi Nihon House Co. Ltd. (d) | 1,224,500 | | 5,189,887 |
Hoshizaki Electric Co. Ltd. | 92,000 | | 4,456,265 |
Iida Group Holdings Co. Ltd. | 325,351 | | 3,615,353 |
JSR Corp. | 479,800 | | 8,640,363 |
KAWAI Musical Instruments Manufacturing Co. Ltd. | 234,400 | | 4,407,999 |
Kinugawa Rubber Industrial Co. Ltd. | 601,000 | | 2,547,457 |
Kotobuki Spirits Co. Ltd. | 87,700 | | 1,744,625 |
Leopalace21 Corp. (a) | 1,288,500 | | 8,070,463 |
Meitec Corp. | 164,700 | | 5,164,819 |
Miraca Holdings, Inc. | 139,600 | | 5,860,332 |
Mitani Shoji Co. Ltd. | 234,300 | | 5,943,325 |
Nitori Holdings Co. Ltd. | 155,300 | | 9,842,226 |
Paramount Bed Holdings Co. Ltd. | 182,000 | | 5,176,488 |
Ricoh Leasing Co. Ltd. | 258,900 | | 7,223,343 |
San-Ai Oil Co. Ltd. | 740,000 | | 5,122,345 |
Ship Healthcare Holdings, Inc. | 94,400 | | 2,209,544 |
TFP Consulting Group Co. Ltd. | 171,500 | | 5,003,205 |
TKC Corp. | 354,500 | | 6,959,278 |
Tokyo Ohka Kogyo Co. Ltd. | 166,400 | | 4,693,072 |
Toshiba Plant Systems & Services Corp. | 390,500 | | 6,536,302 |
Toyo Suisan Kaisha Ltd. | 195,000 | | 6,734,567 |
Tsuruha Holdings, Inc. | 340,600 | | 20,109,285 |
Uchiyama Holdings Co. Ltd. | 451,600 | | 2,622,789 |
VT Holdings Co. Ltd. | 1,240,900 | | 4,900,603 |
Welcia Holdings Co. Ltd. (d) | 110,400 | | 3,688,167 |
TOTAL JAPAN | | 191,106,811 |
Korea (South) - 1.9% |
Hy-Lok Corp. | 120,010 | | 3,255,906 |
KEPCO Plant Service & Engineering Co. Ltd. | 77,030 | | 6,287,461 |
Koh Young Technology, Inc. | 104,779 | | 3,218,133 |
Common Stocks - continued |
| Shares | | Value |
Korea (South) - continued |
Soulbrain Co. Ltd. | 69,713 | | $ 1,751,836 |
TK Corp. (a) | 172,528 | | 2,215,922 |
TOTAL KOREA (SOUTH) | | 16,729,258 |
Luxembourg - 0.7% |
Grand City Properties SA (a)(d) | 471,873 | | 6,046,325 |
Malaysia - 0.3% |
Kossan Rubber Industries Bhd | 2,012,100 | | 2,813,406 |
Netherlands - 1.7% |
Amsterdam Commodities NV | 270,721 | | 6,079,432 |
BinckBank NV | 467,100 | | 4,624,822 |
IMCD Group BV | 173,500 | | 4,783,274 |
TOTAL NETHERLANDS | | 15,487,528 |
New Zealand - 1.9% |
EBOS Group Ltd. | 1,408,656 | | 10,508,313 |
Nuplex Industries Ltd. | 2,588,739 | | 6,356,454 |
TOTAL NEW ZEALAND | | 16,864,767 |
Norway - 1.7% |
ABG Sundal Collier ASA (a) | 6,803,251 | | 4,992,786 |
Ekornes A/S | 444,997 | | 4,750,189 |
Kongsberg Gruppen ASA | 282,200 | | 5,710,984 |
TOTAL NORWAY | | 15,453,959 |
Singapore - 2.0% |
Amtek Engineering Ltd. | 6,985,000 | | 3,288,012 |
Boustead Singapore Ltd. | 2,261,000 | | 3,234,692 |
Hour Glass Ltd. | 2,454,000 | | 3,529,772 |
Mapletree Industrial (REIT) | 2,909,778 | | 3,341,974 |
OSIM International Ltd. | 2,886,000 | | 4,180,724 |
TOTAL SINGAPORE | | 17,575,174 |
South Africa - 1.3% |
Clicks Group Ltd. | 1,411,540 | | 9,610,975 |
Pinnacle Technology Holdings Ltd. | 1,900,130 | | 2,098,287 |
TOTAL SOUTH AFRICA | | 11,709,262 |
Sweden - 1.0% |
AddTech AB (B Shares) (d) | 211,656 | | 3,016,839 |
Meda AB (A Shares) (d) | 425,000 | | 5,582,904 |
TOTAL SWEDEN | | 8,599,743 |
Common Stocks - continued |
| Shares | | Value |
Switzerland - 4.3% |
Allied World Assurance Co. | 206,900 | | $ 7,862,200 |
Clariant AG (Reg.) | 307,372 | | 5,351,017 |
Daetwyler Holdings AG | 20,416 | | 2,584,492 |
Pargesa Holding SA | 111,676 | | 8,676,174 |
Vontobel Holdings AG | 227,903 | | 8,278,553 |
VZ Holding AG | 37,391 | | 6,159,615 |
TOTAL SWITZERLAND | | 38,912,051 |
Taiwan - 0.8% |
Richtek Technology Corp. | 251,000 | | 1,209,316 |
Tripod Technology Corp. | 3,369,000 | | 6,296,218 |
TOTAL TAIWAN | | 7,505,534 |
Thailand - 1.0% |
Delta Electronics PCL (For. Reg.) | 3,795,000 | | 7,532,319 |
TISCO Financial Group PCL | 916,800 | | 1,253,009 |
TOTAL THAILAND | | 8,785,328 |
Turkey - 0.4% |
Aygaz A/S | 821,000 | | 3,461,080 |
United Kingdom - 16.9% |
Aberdeen Asset Management PLC | 996,500 | | 6,918,399 |
Alent PLC | 472,808 | | 2,556,466 |
AMEC PLC | 469,241 | | 7,806,706 |
Ashmore Group PLC (d) | 1,091,793 | | 5,564,480 |
Balfour Beatty PLC | 644,000 | | 1,583,428 |
BBA Aviation PLC | 1,384,681 | | 7,834,717 |
Bond International Software PLC | 843,266 | | 1,254,545 |
Brammer PLC | 377,864 | | 1,959,991 |
Brewin Dolphin Holding PLC | 763,663 | | 3,468,212 |
Cineworld Group PLC | 1,024,176 | | 5,488,554 |
Close Brothers Group PLC | 485,800 | | 11,377,246 |
Countrywide PLC | 951,700 | | 6,972,750 |
Craneware PLC | 354,064 | | 2,817,821 |
Diploma PLC | 551,052 | | 6,130,957 |
Informa PLC | 753,906 | | 5,800,973 |
ITE Group PLC | 1,169,900 | | 3,186,210 |
Luxfer Holdings PLC sponsored ADR | 386,100 | | 6,150,573 |
Mears Group PLC | 750,060 | | 5,303,430 |
Meggitt PLC | 982,183 | | 7,087,675 |
Micro Focus International PLC | 434,227 | | 6,890,759 |
Moneysupermarket.com Group PLC | 2,757,200 | | 8,821,386 |
Common Stocks - continued |
| Shares | | Value |
United Kingdom - continued |
Morgan Advanced Materials PLC | 560,608 | | $ 2,533,473 |
Provident Financial PLC | 201,078 | | 6,828,937 |
Pureprofile Media PLC (a)(e) | 1,108,572 | | 993,094 |
Silverdell PLC (a) | 12,644,400 | | 202 |
Sinclair Pharma PLC (a) | 8,403,003 | | 3,847,854 |
Spectris PLC | 209,600 | | 6,042,054 |
Spirent Communications PLC | 4,227,000 | | 5,074,830 |
Ultra Electronics Holdings PLC | 416,244 | | 11,619,353 |
TOTAL UNITED KINGDOM | | 151,915,075 |
United States of America - 1.2% |
Dillard's, Inc. Class A | 104,271 | | 11,027,701 |
YOU On Demand Holdings, Inc. warrants 8/30/17 (a)(e) | 27,500 | | 7,176 |
TOTAL UNITED STATES OF AMERICA | | 11,034,877 |
TOTAL COMMON STOCKS (Cost $867,303,447) |
859,690,911
|
Money Market Funds - 5.4% |
| | | |
Fidelity Cash Central Fund, 0.11% (b) | 32,958,996 | | 32,958,996 |
Fidelity Securities Lending Cash Central Fund, 0.11% (b)(c) | 15,223,760 | | 15,223,760 |
TOTAL MONEY MARKET FUNDS (Cost $48,182,756) |
48,182,756
|
TOTAL INVESTMENT PORTFOLIO - 100.9% (Cost $915,486,203) | | 907,873,667 |
NET OTHER ASSETS (LIABILITIES) - (0.9)% | | (7,799,874) |
NET ASSETS - 100% | $ 900,073,793 |
Legend |
(a) Non-income producing |
(b) Affiliated fund that is generally available only to investment companies and other accounts managed by Fidelity Investments. The rate quoted is the annualized seven-day yield of the fund at period end. A complete unaudited listing of the fund's holdings as of its most recent quarter end is available upon request. In addition, each Fidelity Central Fund's financial statements, which are not covered by the Fund's Report of Independent Registered Public Accounting Firm, are available on the SEC's website or upon request. |
(c) Investment made with cash collateral received from securities on loan. |
(d) Security or a portion of the security is on loan at period end. |
(e) Restricted securities - Investment in securities not registered under the Securities Act of 1933 (excluding 144A issues). At the end of the period, the value of restricted securities (excluding 144A issues) amounted to $1,000,270 or 0.1% of net assets. |
Additional information on each restricted holding is as follows: |
Security | Acquisition Date | Acquisition Cost |
Pureprofile Media PLC | 5/3/05 - 1/11/06 | $ 1,173,341 |
YOU On Demand Holdings, Inc. warrants 8/30/17 | 9/14/12 | $ 0 |
Affiliated Central Funds |
Information regarding fiscal year to date income earned by the Fund from investments in Fidelity Central Funds is as follows: |
Fund | Income earned |
Fidelity Cash Central Fund | $ 50,747 |
Fidelity Securities Lending Cash Central Fund | 303,427 |
Total | $ 354,174 |
Other Affiliated Issuers |
An affiliated company is a company in which the Fund has ownership of at least 5% of the voting securities. Fiscal year to date transactions with companies which are or were affiliates are as follows: |
Affiliate | Value, beginning of period | Purchases | Sales
Proceeds | Dividend Income | Value,
end of
period |
Pertama Holdings Ltd. | $ 12,066,495 | $ - | $ 12,052,911 | $ 64,973 | $ - |
Other Information |
Categorizations in the Schedule of Investments are based on country or territory of incorporation. |
The following is a summary of the inputs used, as of October 31, 2014, involving the Fund's assets and liabilities carried at fair value. The inputs or methodology used for valuing securities may not be an indication of the risk associated with investing in those securities. For more information on valuation inputs, and their aggregation into the levels used in the tables below, please refer to the Investment Valuation section in the accompanying Notes to Financial Statements. |
Valuation Inputs at Reporting Date: |
Description | Total | Level 1 | Level 2 | Level 3 |
Investments in Securities: | | | | |
Equities: | | | | |
Consumer Discretionary | $ 142,842,893 | $ 53,882,215 | $ 88,960,678 | $ - |
Consumer Staples | 69,955,160 | 30,817,315 | 39,137,845 | - |
Energy | 47,499,029 | 39,141,992 | 8,357,037 | - |
Financials | 168,321,950 | 125,641,648 | 42,680,302 | - |
Health Care | 72,999,435 | 36,043,057 | 36,956,378 | - |
Industrials | 171,122,482 | 119,200,903 | 51,921,377 | 202 |
Information Technology | 101,392,760 | 65,244,864 | 35,127,259 | 1,020,637 |
Materials | 75,830,151 | 53,177,211 | 22,652,939 | 1 |
Telecommunication Services | 6,265,971 | - | 6,265,971 | - |
Utilities | 3,461,080 | 3,461,080 | - | - |
Money Market Funds | 48,182,756 | 48,182,756 | - | - |
Total Investments in Securities: | $ 907,873,667 | $ 574,793,041 | $ 332,059,786 | $ 1,020,840 |
The following is a summary of transfers between Level 1 and Level 2 for the period ended October 31, 2014. Transfers are assumed to have occurred at the beginning of the period, and are primarily attributable to the valuation techniques used for foreign equity securities, as discussed in the accompanying Notes to Financial Statements: |
Transfers | Total |
Level 1 to Level 2 | $ 21,867,578 |
Level 2 to Level 1 | $ 0 |
Valuation Inputs at Reporting Date: |
The following is a reconciliation of Investments in Securities for which Level 3 inputs were used in determining value: |
Investments in Securities: | |
Beginning Balance | $ 11,069,913 |
Net Realized Gain (Loss) on Investment Securities | (13,418,381) |
Net Unrealized Gain (Loss) on Investment Securities | 12,110,008 |
Cost of Purchases | - |
Proceeds of Sales | (8,740,700) |
Amortization/Accretion | - |
Transfers into Level 3 | - |
Transfers out of Level 3 | - |
Ending Balance | $ 1,020,840 |
The change in unrealized gain (loss) for the period attributable to Level 3 securities held at October 31, 2014 | $ (1,179,794) |
The information used in the above reconciliation represents fiscal year to date activity for any Investments in Securities identified as using Level 3 inputs at either the beginning or the end of the current fiscal period. Transfers in or out of Level 3 represent the beginning value of any Security or Instrument where a change in the pricing level occurred from the beginning to the end of the period. The cost of purchases and the proceeds of sales may include securities received or delivered through corporate actions or exchanges. Realized and unrealized gains (losses) disclosed in the reconciliation are included in Net Gain (Loss) on the Fund's Statement of Operations. |
See accompanying notes which are an integral part of the financial statements.
Annual Report
Statement of Assets and Liabilities
| October 31, 2014 |
| | |
Assets | | |
Investment in securities, at value (including securities loaned of $14,662,713) - See accompanying schedule: Unaffiliated issuers (cost $867,303,447) | $ 859,690,911 | |
Fidelity Central Funds (cost $48,182,756) | 48,182,756 | |
Total Investments (cost $915,486,203) | | $ 907,873,667 |
Foreign currency held at value (cost $28,166) | | 28,224 |
Receivable for investments sold | | 9,322,189 |
Receivable for fund shares sold | | 473,019 |
Dividends receivable | | 2,328,647 |
Distributions receivable from Fidelity Central Funds | | 9,252 |
Prepaid expenses | | 3,248 |
Other receivables | | 22,671 |
Total assets | | 920,060,917 |
| | |
Liabilities | | |
Payable for investments purchased | $ 2,303,470 | |
Payable for fund shares redeemed | 1,314,911 | |
Accrued management fee | 648,973 | |
Distribution and service plan fees payable | 21,325 | |
Other affiliated payables | 236,320 | |
Other payables and accrued expenses | 238,365 | |
Collateral on securities loaned, at value | 15,223,760 | |
Total liabilities | | 19,987,124 |
| | |
Net Assets | | $ 900,073,793 |
Net Assets consist of: | | |
Paid in capital | | $ 792,123,948 |
Undistributed net investment income | | 7,150,729 |
Accumulated undistributed net realized gain (loss) on investments and foreign currency transactions | | 108,515,351 |
Net unrealized appreciation (depreciation) on investments and assets and liabilities in foreign currencies | | (7,716,235) |
Net Assets | | $ 900,073,793 |
See accompanying notes which are an integral part of the financial statements.
Annual Report
Statement of Assets and Liabilities - continued
| October 31, 2014 |
| | |
Calculation of Maximum Offering Price Class A:
Net Asset Value and redemption price per share ($24,571,948 ÷ 983,534 shares) | | $ 24.98 |
| | |
Maximum offering price per share (100/94.25 of $24.98) | | $ 26.50 |
Class T:
Net Asset Value and redemption price per share ($12,295,831 ÷ 495,632 shares) | | $ 24.81 |
| | |
Maximum offering price per share (100/96.50 of $24.81) | | $ 25.71 |
Class B:
Net Asset Value and offering price per share ($506,850 ÷ 20,678 shares)A | | $ 24.51 |
| | |
Class C:
Net Asset Value and offering price per share ($12,576,184 ÷ 518,246 shares)A | | $ 24.27 |
| | |
International Small Cap:
Net Asset Value, offering price and redemption price per share ($842,030,670 ÷ 33,228,137 shares) | | $ 25.34 |
| | |
Institutional Class:
Net Asset Value, offering price and redemption price per share ($8,092,310 ÷ 319,321 shares) | | $ 25.34 |
A Redemption price per share is equal to net asset value less any applicable contingent deferred sales charge.
See accompanying notes which are an integral part of the financial statements.
Annual Report
Financial Statements - continued
Statement of Operations
| Year ended October 31, 2014 |
| | |
Investment Income | | |
Dividends (including $64,973 earned from other affiliated issuers) | | $ 25,627,606 |
Interest | | 79,016 |
Income from Fidelity Central Funds | | 354,174 |
Income before foreign taxes withheld | | 26,060,796 |
Less foreign taxes withheld | | (1,980,834) |
Total income | | 24,079,962 |
| | |
Expenses | | |
Management fee
Basic fee | $ 9,557,249 | |
Performance adjustment | (582) | |
Transfer agent fees | 2,603,537 | |
Distribution and service plan fees | 294,101 | |
Accounting and security lending fees | 522,545 | |
Custodian fees and expenses | 385,115 | |
Independent trustees' compensation | 4,685 | |
Registration fees | 117,677 | |
Audit | 151,972 | |
Legal | 9,683 | |
Miscellaneous | 108,677 | |
Total expenses before reductions | 13,754,659 | |
Expense reductions | (43,342) | 13,711,317 |
Net investment income (loss) | | 10,368,645 |
Realized and Unrealized Gain (Loss) Net realized gain (loss) on: | | |
Investment securities: | | |
Unaffiliated issuers (net of foreign taxes of $20,368) | 221,431,771 | |
Other affiliated issuers | 5,640,625 | |
Foreign currency transactions | (336,386) | |
Total net realized gain (loss) | | 226,736,010 |
Change in net unrealized appreciation (depreciation) on: Investment securities (net of increase in deferred foreign taxes of $56,345) | (253,641,424) | |
Assets and liabilities in foreign currencies | (27,887) | |
Total change in net unrealized appreciation (depreciation) | | (253,669,311) |
Net gain (loss) | | (26,933,301) |
Net increase (decrease) in net assets resulting from operations | | $ (16,564,656) |
See accompanying notes which are an integral part of the financial statements.
Annual Report
Statement of Changes in Net Assets
| Year ended
October 31,
2014 | Year ended
October 31,
2013 |
Increase (Decrease) in Net Assets | | |
Operations | | |
Net investment income (loss) | $ 10,368,645 | $ 4,434,071 |
Net realized gain (loss) | 226,736,010 | 66,068,952 |
Change in net unrealized appreciation (depreciation) | (253,669,311) | 198,875,293 |
Net increase (decrease) in net assets resulting from operations | (16,564,656) | 269,378,316 |
Distributions to shareholders from net investment income | (4,012,676) | (4,769,550) |
Distributions to shareholders from net realized gain | (26,257,450) | (11,754,787) |
Total distributions | (30,270,126) | (16,524,337) |
Share transactions - net increase (decrease) | (201,807,331) | 162,217,941 |
Redemption fees | 276,780 | 119,206 |
Total increase (decrease) in net assets | (248,365,333) | 415,191,126 |
| | |
Net Assets | | |
Beginning of period | 1,148,439,126 | 733,248,000 |
End of period (including undistributed net investment income of $7,150,729 and undistributed net investment income of $4,006,124, respectively) | $ 900,073,793 | $ 1,148,439,126 |
See accompanying notes which are an integral part of the financial statements.
Annual Report
Financial Highlights - Class A
Years ended October 31, | 2014 | 2013 | 2012 | 2011 | 2010 |
Selected Per-Share Data | | | | | |
Net asset value, beginning of period | $ 26.34 | $ 19.74 | $ 18.97 | $ 20.42 | $ 17.28 |
Income from Investment Operations | | | | | |
Net investment income (loss) C | .17 | .06 | .06 | .10 | .03 |
Net realized and unrealized gain (loss) | (.89) | 6.94 | 1.09 | (.88) | 3.51 |
Total from investment operations | (.72) | 7.00 | 1.15 | (.78) | 3.54 |
Distributions from net investment income | (.05) | (.07) | (.11) | (.02) | (.06) |
Distributions from net realized gain | (.60) | (.33) | (.27) | (.66) | (.34) |
Total distributions | (.65) | (.40) | (.38) | (.68) | (.40) |
Redemption fees added to paid in capital C | .01 | - G | - G | .01 | - G |
Net asset value, end of period | $ 24.98 | $ 26.34 | $ 19.74 | $ 18.97 | $ 20.42 |
Total ReturnA, B | (2.79)% | 36.18% | 6.28% | (4.00)% | 20.85% |
Ratios to Average Net Assets E, F | | | | | |
Expenses before reductions | 1.50% | 1.61% | 1.63% | 1.56% | 1.71% |
Expenses net of fee waivers, if any | 1.50% | 1.61% | 1.63% | 1.55% | 1.65% |
Expenses net of all reductions | 1.50% | 1.60% | 1.60% | 1.54% | 1.63% |
Net investment income (loss) | .65% | .25% | .32% | .49% | .16% |
Supplemental Data | | | | | |
Net assets, end of period (000 omitted) | $ 24,572 | $ 24,020 | $ 14,125 | $ 17,185 | $ 19,720 |
Portfolio turnover rate D | 102% | 54% | 68% | 47% | 66% |
A Total returns would have been lower if certain expenses had not been reduced during the applicable periods shown.
B Total returns do not include the effect of the sales charges.
C Calculated based on average shares outstanding during the period.
D Amounts do not include the activity of the Underlying Funds.
E Fees and expenses of any underlying Fidelity Central Funds are not included in the Fund's expense ratio. The Fund indirectly bears its proportionate share of the expenses of any underlying Fidelity Central Funds.
F Expense ratios reflect operating expenses of the class. Expenses before reductions do not reflect amounts reimbursed by the investment adviser or reductions from brokerage service arrangements or reductions from other expense offset arrangements and do not represent the amount paid by the class during periods when reimbursements or reductions occur. Expenses net of fee waivers reflect expenses after reimbursement by the investment adviser but prior to reductions from brokerage service arrangements or other expense offset arrangements. Expenses net of all reductions represent the net expenses paid by the class.
G Amount represents less than $.01 per share.
See accompanying notes which are an integral part of the financial statements.
Annual Report
Financial Highlights - Class T
Years ended October 31, | 2014 | 2013 | 2012 | 2011 | 2010 |
Selected Per-Share Data | | | | | |
Net asset value, beginning of period | $ 26.17 | $ 19.59 | $ 18.80 | $ 20.23 | $ 17.14 |
Income from Investment Operations | | | | | |
Net investment income (loss) C | .10 | - G | .01 | .05 | (.02) |
Net realized and unrealized gain (loss) | (.87) | 6.90 | 1.08 | (.86) | 3.47 |
Total from investment operations | (.77) | 6.90 | 1.09 | (.81) | 3.45 |
Distributions from net investment income | - | - | (.03) | - | (.02) |
Distributions from net realized gain | (.60) | (.32) | (.27) | (.63) | (.34) |
Total distributions | (.60) | (.32) | (.30) | (.63) | (.36) |
Redemption fees added to paid in capital C | .01 | - G | - G | .01 | - G |
Net asset value, end of period | $ 24.81 | $ 26.17 | $ 19.59 | $ 18.80 | $ 20.23 |
Total ReturnA, B | (3.00)% | 35.80% | 5.97% | (4.18)% | 20.46% |
Ratios to Average Net Assets E, F | | | | | |
Expenses before reductions | 1.77% | 1.87% | 1.88% | 1.82% | 1.97% |
Expenses net of fee waivers, if any | 1.77% | 1.87% | 1.88% | 1.81% | 1.90% |
Expenses net of all reductions | 1.76% | 1.85% | 1.85% | 1.79% | 1.88% |
Net investment income (loss) | .38% | (.01)% | .07% | .24% | (.09)% |
Supplemental Data | | | | | |
Net assets, end of period (000 omitted) | $ 12,296 | $ 13,530 | $ 9,262 | $ 13,744 | $ 16,092 |
Portfolio turnover rate D | 102% | 54% | 68% | 47% | 66% |
A Total returns would have been lower if certain expenses had not been reduced during the applicable periods shown.
B Total returns do not include the effect of the sales charges.
C Calculated based on average shares outstanding during the period.
D Amounts do not include the activity of the Underlying Funds.
E Fees and expenses of any underlying Fidelity Central Funds are not included in the Fund's expense ratio. The Fund indirectly bears its proportionate share of the expenses of any underlying Fidelity Central Funds.
F Expense ratios reflect operating expenses of the class. Expenses before reductions do not reflect amounts reimbursed by the investment adviser or reductions from brokerage service arrangements or reductions from other expense offset arrangements and do not represent the amount paid by the class during periods when reimbursements or reductions occur. Expenses net of fee waivers reflect expenses after reimbursement by the investment adviser but prior to reductions from brokerage service arrangements or other expense offset arrangements. Expenses net of all reductions represent the net expenses paid by the class.
G Amount represents less than $.01 per share.
See accompanying notes which are an integral part of the financial statements.
Annual Report
Financial Highlights - Class B
Years ended October 31, | 2014 | 2013 | 2012 | 2011 | 2010 |
Selected Per-Share Data | | | | | |
Net asset value, beginning of period | $ 25.87 | $ 19.22 | $ 18.38 | $ 19.79 | $ 16.78 |
Income from Investment Operations | | | | | |
Net investment income (loss) C | (.03) | (.11) | (.08) | (.05) | (.10) |
Net realized and unrealized gain (loss) | (.87) | 6.84 | 1.07 | (.85) | 3.39 |
Total from investment operations | (.90) | 6.73 | .99 | (.90) | 3.29 |
Distributions from net realized gain | (.47) | (.08) | (.15) | (.52) | (.28) |
Redemption fees added to paid in capital C | .01 | - G | - G | .01 | - G |
Net asset value, end of period | $ 24.51 | $ 25.87 | $ 19.22 | $ 18.38 | $ 19.79 |
Total ReturnA, B | (3.52)% | 35.14% | 5.45% | (4.68)% | 19.90% |
Ratios to Average Net Assets E, F | | | | | |
Expenses before reductions | 2.28% | 2.37% | 2.38% | 2.32% | 2.47% |
Expenses net of fee waivers, if any | 2.28% | 2.36% | 2.38% | 2.30% | 2.40% |
Expenses net of all reductions | 2.27% | 2.35% | 2.35% | 2.29% | 2.38% |
Net investment income (loss) | (.13)% | (.51)% | (.43)% | (.26)% | (.59)% |
Supplemental Data | | | | | |
Net assets, end of period (000 omitted) | $ 507 | $ 795 | $ 790 | $ 2,067 | $ 3,457 |
Portfolio turnover rate D | 102% | 54% | 68% | 47% | 66% |
A Total returns would have been lower if certain expenses had not been reduced during the applicable periods shown.
B Total returns do not include the effect of the contingent deferred sales charge.
C Calculated based on average shares outstanding during the period.
D Amounts do not include the activity of the Underlying Funds.
E Fees and expenses of any underlying Fidelity Central Funds are not included in the Fund's expense ratio. The Fund indirectly bears its proportionate share of the expenses of any underlying Fidelity Central Funds.
F Expense ratios reflect operating expenses of the class. Expenses before reductions do not reflect amounts reimbursed by the investment adviser or reductions from brokerage service arrangements or reductions from other expense offset arrangements and do not represent the amount paid by the class during periods when reimbursements or reductions occur. Expenses net of fee waivers reflect expenses after reimbursement by the investment adviser but prior to reductions from brokerage service arrangements or other expense offset arrangements. Expenses net of all reductions represent the net expenses paid by the class.
G Amount represents less than $.01 per share.
See accompanying notes which are an integral part of the financial statements.
Annual Report
Financial Highlights - Class C
Years ended October 31, | 2014 | 2013 | 2012 | 2011 | 2010 |
Selected Per-Share Data | | | | | |
Net asset value, beginning of period | $ 25.68 | $ 19.18 | $ 18.38 | $ 19.85 | $ 16.85 |
Income from Investment Operations | | | | | |
Net investment income (loss) C | (.02) | (.11) | (.08) | (.04) | (.10) |
Net realized and unrealized gain (loss) | (.85) | 6.79 | 1.07 | (.85) | 3.40 |
Total from investment operations | (.87) | 6.68 | .99 | (.89) | 3.30 |
Distributions from net realized gain | (.55) | (.18) | (.19) | (.59) | (.30) |
Redemption fees added to paid in capital C | .01 | - G | - G | .01 | - G |
Net asset value, end of period | $ 24.27 | $ 25.68 | $ 19.18 | $ 18.38 | $ 19.85 |
Total ReturnA, B | (3.43)% | 35.15% | 5.46% | (4.64)% | 19.86% |
Ratios to Average Net Assets E, F | | | | | |
Expenses before reductions | 2.23% | 2.33% | 2.38% | 2.27% | 2.42% |
Expenses net of fee waivers, if any | 2.22% | 2.33% | 2.38% | 2.26% | 2.40% |
Expenses net of all reductions | 2.22% | 2.32% | 2.35% | 2.24% | 2.37% |
Net investment income (loss) | (.07)% | (.47)% | (.43)% | (.21)% | (.59)% |
Supplemental Data | | | | | |
Net assets, end of period (000 omitted) | $ 12,576 | $ 13,426 | $ 6,799 | $ 9,545 | $ 13,501 |
Portfolio turnover rate D | 102% | 54% | 68% | 47% | 66% |
A Total returns would have been lower if certain expenses had not been reduced during the applicable periods shown.
B Total returns do not include the effect of the contingent deferred sales charge.
C Calculated based on average shares outstanding during the period.
D Amounts do not include the activity of the Underlying Funds.
E Fees and expenses of any underlying Fidelity Central Funds are not included in the Fund's expense ratio. The Fund indirectly bears its proportionate share of the expenses of any underlying Fidelity Central Funds.
F Expense ratios reflect operating expenses of the class. Expenses before reductions do not reflect amounts reimbursed by the investment adviser or reductions from brokerage service arrangements or reductions from other expense offset arrangements and do not represent the amount paid by the class during periods when reimbursements or reductions occur. Expenses net of fee waivers reflect expenses after reimbursement by the investment adviser but prior to reductions from brokerage service arrangements or other expense offset arrangements. Expenses net of all reductions represent the net expenses paid by the class.
G Amount represents less than $.01 per share.
See accompanying notes which are an integral part of the financial statements.
Annual Report
Financial Highlights - International Small Cap
Years ended October 31, | 2014 | 2013 | 2012 | 2011 | 2010 |
Selected Per-Share Data | | | | | |
Net asset value, beginning of period | $ 26.67 | $ 19.99 | $ 19.23 | $ 20.66 | $ 17.48 |
Income from Investment Operations | | | | | |
Net investment income (loss) B | .25 | .12 | .11 | .17 | .07 |
Net realized and unrealized gain (loss) | (.90) | 7.02 | 1.10 | (.89) | 3.53 |
Total from investment operations | (.65) | 7.14 | 1.21 | (.72) | 3.60 |
Distributions from net investment income | (.09) | (.14) | (.18) | (.06) | (.08) |
Distributions from net realized gain | (.60) | (.33) | (.27) | (.66) | (.34) |
Total distributions | (.69) | (.46) G | (.45) | (.72) | (.42) |
Redemption fees added to paid in capital B | .01 | - F | - F | .01 | - F |
Net asset value, end of period | $ 25.34 | $ 26.67 | $ 19.99 | $ 19.23 | $ 20.66 |
Total ReturnA | (2.48)% | 36.56% | 6.55% | (3.65)% | 21.02% |
Ratios to Average Net Assets D, E | | | | | |
Expenses before reductions | 1.21% | 1.33% | 1.35% | 1.26% | 1.44% |
Expenses net of fee waivers, if any | 1.20% | 1.32% | 1.35% | 1.25% | 1.44% |
Expenses net of all reductions | 1.20% | 1.31% | 1.33% | 1.23% | 1.42% |
Net investment income (loss) | .95% | .53% | .59% | .80% | .37% |
Supplemental Data | | | | | |
Net assets, end of period (000 omitted) | $ 842,031 | $ 1,029,629 | $ 692,769 | $ 856,692 | $ 808,478 |
Portfolio turnover rate C | 102% | 54% | 68% | 47% | 66% |
A Total returns would have been lower if certain expenses had not been reduced during the applicable periods shown.
B Calculated based on average shares outstanding during the period.
C Amounts do not include the activity of the Underlying Funds.
D Fees and expenses of any underlying Fidelity Central Funds are not included in the Fund's expense ratio. The Fund indirectly bears its proportionate share of the expenses of any underlying Fidelity Central Funds.
E Expense ratios reflect operating expenses of the class. Expenses before reductions do not reflect amounts reimbursed by the investment adviser or reductions from brokerage service arrangements or reductions from other expense offset arrangements and do not represent the amount paid by the class during periods when reimbursements or reductions occur. Expenses net of fee waivers reflect expenses after reimbursement by the investment adviser but prior to reductions from brokerage service arrangements or other expense offset arrangements. Expenses net of all reductions represent the net expenses paid by the class.
F Amount represents less than $.01 per share.
G Total distributions of $.46 per share is comprised of distributions from net investment income of $.136 and distributions from net realized gain of $.327 per share.
See accompanying notes which are an integral part of the financial statements.
Annual Report
Financial Highlights - Institutional Class
Years ended October 31, | 2014 | 2013 | 2012 | 2011 | 2010 |
Selected Per-Share Data | | | | | |
Net asset value, beginning of period | $ 26.67 | $ 20.00 | $ 19.24 | $ 20.66 | $ 17.47 |
Income from Investment Operations | | | | | |
Net investment income (loss) B | .29 | .16 | .13 | .18 | .09 |
Net realized and unrealized gain (loss) | (.90) | 7.00 | 1.10 | (.89) | 3.53 |
Total from investment operations | (.61) | 7.16 | 1.23 | (.71) | 3.62 |
Distributions from net investment income | (.13) | (.16) | (.20) | (.06) | (.09) |
Distributions from net realized gain | (.60) | (.33) | (.27) | (.66) | (.34) |
Total distributions | (.73) | (.49) | (.47) | (.72) | (.43) |
Redemption fees added to paid in capital B | .01 | - F | - F | .01 | - F |
Net asset value, end of period | $ 25.34 | $ 26.67 | $ 20.00 | $ 19.24 | $ 20.66 |
Total ReturnA | (2.35)% | 36.68% | 6.65% | (3.62)% | 21.15% |
Ratios to Average Net Assets D, E | | | | | |
Expenses before reductions | 1.08% | 1.20% | 1.25% | 1.22% | 1.34% |
Expenses net of fee waivers, if any | 1.08% | 1.20% | 1.25% | 1.21% | 1.34% |
Expenses net of all reductions | 1.08% | 1.18% | 1.22% | 1.19% | 1.31% |
Net investment income (loss) | 1.07% | .66% | .70% | .84% | .47% |
Supplemental Data | | | | | |
Net assets, end of period (000 omitted) | $ 8,092 | $ 67,038 | $ 9,503 | $ 15,752 | $ 8,231 |
Portfolio turnover rate C | 102% | 54% | 68% | 47% | 66% |
A Total returns would have been lower if certain expenses had not been reduced during the applicable periods shown.
B Calculated based on average shares outstanding during the period.
C Amounts do not include the activity of the Underlying Funds.
D Fees and expenses of any underlying Fidelity Central Funds are not included in the Fund's expense ratio. The Fund indirectly bears its proportionate share of the expenses of any underlying Fidelity Central Funds.
E Expense ratios reflect operating expenses of the class. Expenses before reductions do not reflect amounts reimbursed by the investment adviser or reductions from brokerage service arrangements or reductions from other expense offset arrangements and do not represent the amount paid by the class during periods when reimbursements or reductions occur. Expenses net of fee waivers reflect expenses after reimbursement by the investment adviser but prior to reductions from brokerage service arrangements or other expense offset arrangements. Expenses net of all reductions represent the net expenses paid by the class.
F Amount represents less than $.01 per share.
See accompanying notes which are an integral part of the financial statements.
Annual Report
Notes to Financial Statements
For the period ended October 31, 2014
1. Organization.
Fidelity International Small Cap Fund (the Fund) is a fund of Fidelity Investment Trust (the Trust) and is authorized to issue an unlimited number of shares. The Trust is registered under the Investment Company Act of 1940, as amended (the 1940 Act), as an open-end management investment company organized as a Massachusetts business trust. The Fund offers Class A, Class T, Class C, International Small Cap and Institutional Class shares, each of which, along with Class B shares, has equal rights as to assets and voting privileges. Class B shares are closed to new accounts and additional purchases, except for exchanges and reinvestments. Each class has exclusive voting rights with respect to matters that affect that class. Class B shares will automatically convert to Class A shares after a holding period of seven years from the initial date of purchase. The Fund's investments in emerging markets can be subject to social, economic, regulatory, and political uncertainties and can be extremely volatile.
2. Investments in Fidelity Central Funds.
The Fund invests in Fidelity Central Funds, which are open-end investment companies generally available only to other investment companies and accounts managed by the investment adviser and its affiliates. The Fund's Schedule of Investments lists each of the Fidelity Central Funds held as of period end, if any, as an investment of the Fund, but does not include the underlying holdings of each Fidelity Central Fund. As an Investing Fund, the Fund indirectly bears its proportionate share of the expenses of the underlying Fidelity Central Funds.
The Money Market Central Funds seek preservation of capital and current income and are managed by Fidelity Investments Money Management, Inc. (FIMM), an affiliate of the investment adviser. Annualized expenses of the Money Market Central Funds as of their most recent shareholder report date are less than .01%.
A complete unaudited list of holdings for each Fidelity Central Fund is available upon request or at the Securities and Exchange Commission (the SEC) website at www.sec.gov. In addition, the financial statements of the Fidelity Central Funds, which are not covered by the Fund's Report of Independent Registered Public Accounting Firm, are available on the SEC website or upon request.
3. Significant Accounting Policies.
The financial statements have been prepared in conformity with accounting principles generally accepted in the United States of America (GAAP), which require management to make certain estimates and assumptions at the date of the financial statements. Actual results could differ from those estimates. Subsequent events, if any, through the date that the financial statements were issued have been evaluated in the preparation of
Annual Report
3. Significant Accounting Policies - continued
the financial statements. The following summarizes the significant accounting policies of the Fund:
Investment Valuation. Investments are valued as of 4:00 p.m. Eastern time on the last calendar day of the period. In accordance with valuation policies and procedures approved by the Board of Trustees (the Board), the Fund attempts to obtain prices from one or more third party pricing vendors or brokers to value its investments. When current market prices, quotations or currency exchange rates are not readily available or reliable, investments will be fair valued in good faith by the Fidelity Management & Research Company (FMR) Fair Value Committee (the Committee), in accordance with procedures adopted by the Board. Factors used in determining fair value vary by investment type and may include market or investment specific events, changes in interest rates and credit quality. The frequency with which these procedures are used cannot be predicted and they may be utilized to a significant extent. The Committee oversees the Fund's valuation policies and procedures and is responsible for approving and reporting to the Board all fair value determinations.
The Fund categorizes the inputs to valuation techniques used to value its investments into a disclosure hierarchy consisting of three levels as shown below:
Level 1 - quoted prices in active markets for identical investments
Level 2 - other significant observable inputs (including quoted prices for similar investments, interest rates, prepayment speeds, etc.)
Level 3 - unobservable inputs (including the Fund's own assumptions based on the best information available)
Valuation techniques used to value the Fund's investments by major category are as follows:
Equity securities, including restricted securities, for which market quotations are readily available, are valued at the last reported sale price or official closing price as reported by a third party pricing vendor on the primary market or exchange on which they are traded and are categorized as Level 1 in the hierarchy. In the event there were no sales during the day or closing prices are not available, securities are valued at the last quoted bid price or may be valued using the last available price and are generally categorized as Level 2 in the hierarchy. For foreign equity securities, when market or security specific events arise, comparisons to the valuation of American Depositary Receipts (ADRs), futures contracts, Exchange-Traded Funds (ETFs) and certain indexes as well as quoted prices for similar securities may be used and would be categorized as Level 2 in the hierarchy. Utilizing these techniques may result in transfers between Level 1 and Level 2. For equity securities, including restricted securities, where observable inputs are
Annual Report
Notes to Financial Statements - continued
3. Significant Accounting Policies - continued
Investment Valuation - continued
limited, assumptions about market activity and risk are used and these securities may be categorized as Level 3 in the hierarchy.
Investment in open-end mutual funds, including the Fidelity Central Funds, are valued at their closing net asset value (NAV) each business day and are categorized as Level 1 in the hierarchy.
Changes in valuation techniques may result in transfers in or out of an assigned level within the disclosure hierarchy. The aggregate value of investments by input level, as of October 31, 2014, including information on transfers between Levels 1 and 2, as well as a roll forward of Level 3 investments, is included at the end of the Fund's Schedule of Investments.
Foreign Currency. The Fund may use foreign currency contracts to facilitate transactions in foreign-denominated securities. Gains and losses from these transactions may arise from changes in the value of the foreign currency or if the counterparties do not perform under the contracts' terms.
Foreign-denominated assets, including investment securities, and liabilities are translated into U.S. dollars at the exchange rates at period end. Purchases and sales of investment securities, income and dividends received and expenses denominated in foreign currencies are translated into U.S. dollars at the exchange rate in effect on the transaction date.
The effects of exchange rate fluctuations on investments are included with the net realized and unrealized gain (loss) on investment securities. Other foreign currency transactions resulting in realized and unrealized gain (loss) are disclosed separately.
Investment Transactions and Income. For financial reporting purposes, the Fund's investment holdings and NAV include trades executed through the end of the last business day of the period. The NAV per share for processing shareholder transactions is calculated as of the close of business of the New York Stock Exchange (NYSE), normally 4:00 p.m. Eastern time and includes trades executed through the end of the prior business day. Gains and losses on securities sold are determined on the basis of identified cost. Dividend income is recorded on the ex-dividend date, except for certain dividends from foreign securities where the ex-dividend date may have passed, which are recorded as soon as the Fund is informed of the ex-dividend date. Non-cash dividends included in dividend income, if any, are recorded at the fair market value of the securities received. Income and capital gain distributions from Fidelity Central Funds, if any, are recorded on the ex-dividend date. Interest income is accrued as earned and includes coupon interest and amortization of premium and accretion of discount on debt securities as applicable. Investment income is recorded net of foreign taxes withheld where recovery of such taxes is uncertain.
Annual Report
3. Significant Accounting Policies - continued
Class Allocations and Expenses. Investment income, realized and unrealized capital gains and losses, common expenses of the Fund, and certain fund-level expense reductions, if any, are allocated daily on a pro-rata basis to each class based on the relative net assets of each class to the total net assets of the Fund. Each class differs with respect to transfer agent and distribution and service plan fees incurred. Certain expense reductions may also differ by class. For the reporting period, the allocated portion of income and expenses to each class as a percent of its average net assets may vary due to the timing of recording these transactions in relation to fluctuating net assets of the classes. Expenses directly attributable to a fund are charged to that fund. Expenses attributable to more than one fund are allocated among the respective funds on the basis of relative net assets or other appropriate methods. Expense estimates are accrued in the period to which they relate and adjustments are made when actual amounts are known.
Income Tax Information and Distributions to Shareholders. Each year, the Fund intends to qualify as a regulated investment company under Subchapter M of the Internal Revenue Code, including distributing substantially all of its taxable income and realized gains. As a result, no provision for U.S. Federal income taxes is required. As of October 31, 2014, the Fund did not have any unrecognized tax benefits in the financial statements; nor is the Fund aware of any tax positions for which it is reasonably possible that the total amounts of unrecognized tax benefits will significantly change in the next twelve months. The Fund files a U.S. federal tax return, in addition to state and local tax returns as required. The Fund's federal income tax returns are subject to examination by the Internal Revenue Service (IRS) for a period of three fiscal years after they are filed. State and local tax returns may be subject to examination for an additional fiscal year depending on the jurisdiction. Foreign taxes are provided for based on the Fund's understanding of the tax rules and rates that exist in the foreign markets in which it invests. The Fund is subject to a tax imposed on capital gains by certain countries in which it invests. An estimated deferred tax liability for net unrealized appreciation on the applicable securities is included in Other payables and accrued expenses on the Statement of Assets & Liabilities.
Distributions are declared and recorded on the ex-dividend date. Income dividends and capital gain distributions are declared separately for each class. Income and capital gain distributions are determined in accordance with income tax regulations, which may differ from GAAP. In addition, the Fund claimed a portion of the payment made to redeeming shareholders as a distribution for income tax purposes.
Capital accounts within the financial statements are adjusted for permanent book-tax differences. These adjustments have no impact on net assets or the results of operations. Capital accounts are not adjusted for temporary book-tax differences which will reverse in a subsequent period.
Annual Report
Notes to Financial Statements - continued
3. Significant Accounting Policies - continued
Income Tax Information and Distributions to Shareholders - continued
Book-tax differences are primarily due to futures transactions, foreign currency transactions, passive foreign investment companies (PFIC), capital loss carryforwards and losses deferred due to wash sales.
The federal tax cost of investment securities and unrealized appreciation (depreciation) as of period end were as follows:
Gross unrealized appreciation | $ 73,615,138 |
Gross unrealized depreciation | (89,554,250) |
Net unrealized appreciation (depreciation) on securities | $ (15,939,112) |
| |
Tax Cost | $ 923,812,779 |
The tax-based components of distributable earnings as of period end were as follows:
Undistributed ordinary income | $ 8,272,083 |
Undistributed long-term capital gain | $ 115,833,054 |
Net unrealized appreciation (depreciation) on securities and other investments | $ (16,103,309) |
The tax character of distributions paid was as follows:
| October 31, 2014 | October 31, 2013 |
Ordinary Income | $ 30,270,126 | $ 16,524,337 |
Short-Term Trading (Redemption) Fees. Shares held by investors in the Fund less than 90 days may have been subject to a redemption fee equal to 2.00% of the NAV of shares redeemed. All redemption fees, which reduce the proceeds of the shareholder redemption, are retained by the Fund and accounted for as an addition to paid in capital.
New Accounting Pronouncement. In June 2014, the Financial Accounting Standards Board issued Accounting Standard Update No. 2014-11, Repurchase-to-Maturity Transactions, Repurchase Financings, and Disclosures. The Update amends the accounting for certain repurchase agreements and expands disclosure requirements for reverse repurchase agreements, securities lending and other similar transactions. The disclosure requirements are effective for annual and interim reporting periods beginning after December 15, 2014. Management is currently evaluating the impact of the Update on the Fund's financial statements and related disclosures.
Annual Report
3. Significant Accounting Policies - continued
Restricted Securities. The Fund may invest in securities that are subject to legal or contractual restrictions on resale. These securities generally may be resold in transactions exempt from registration or to the public if the securities are registered. Disposal of these securities may involve time-consuming negotiations and expense, and prompt sale at an acceptable price may be difficult. Information regarding restricted securities is included at the end of the Fund's Schedule of Investments.
4. Purchases and Sales of Investments.
Purchases and sales of securities, other than short-term securities, aggregated $1,082,370,255 and $1,280,273,199, respectively.
5. Fees and Other Transactions with Affiliates.
Management Fee. Fidelity Management & Research Company (the investment adviser) and its affiliates provide the Fund with investment management related services for which the Fund pays a monthly management fee. The management fee is the sum of an individual fund fee rate that is based on an annual rate of .60% of the Fund's average net assets and an annualized group fee rate that averaged .25% during the period. The group fee rate is based upon the average net assets of all the mutual funds advised by the investment adviser, including any mutual funds previously advised by the investment adviser that are currently advised by Fidelity SelectCo, LLC, an affiliate of the investment adviser. The group fee rate decreases as assets under management increase and increases as assets under management decrease. In addition, the management fee is subject to a performance adjustment (up to a maximum of ± .20% of the Fund's average net assets over a 36 month performance period). The upward or downward adjustment to the management fee is based on the relative investment performance of International Small Cap as compared to its benchmark index, the MSCI All Country World ex USA Small Cap Index effective April 1, 2014 (the MSCI EAFE Small Cap Index prior to April 1, 2014), over the same 36 month performance period. For the reporting period, the total annual management fee rate, including the performance adjustment, was .85% of the Fund's average net assets. The performance adjustment included in the management fee rate may be higher or lower than the maximum performance adjustment rate due to the difference between the average net assets for the reporting and performance periods.
Distribution and Service Plan Fees. In accordance with Rule 12b-1 of the 1940 Act, the Fund has adopted separate Distribution and Service Plans for each class of shares. Certain classes pay Fidelity Distributors Corporation (FDC), an affiliate of the investment adviser, separate Distribution and Service Fees, each of which is based on an annual percentage of each class' average net assets. In addition, FDC may pay financial intermediaries for selling shares of the Fund and providing shareholder support services.
Annual Report
Notes to Financial Statements - continued
5. Fees and Other Transactions with Affiliates - continued
Distribution and Service Plan Fees - continued
For the period, the Distribution and Service Fee rates, total fees and amounts retained by FDC were as follows:
| Distribution
Fee | Service
Fee | Total Fees | Retained
by FDC |
Class A | -% | .25% | $ 65,763 | $ 1,198 |
Class T | .25% | .25% | 70,560 | 154 |
Class B | .75% | .25% | 6,629 | 4,984 |
Class C | .75% | .25% | 151,149 | 28,282 |
| | | $ 294,101 | $ 34,618 |
Sales Load. FDC may receive a front-end sales charge of up to 5.75% for selling Class A shares and 3.50% for selling Class T shares, some of which is paid to financial intermediaries for selling shares of the Fund. Depending on the holding period, FDC may receive contingent deferred sales charges levied on Class A, Class T, Class B, and Class C redemptions. The deferred sales charges range from 5.00% to 1.00% for Class B shares, 1.00% for Class C shares, 1.00% for certain purchases of Class A shares and .25% for certain purchases of Class T shares.
For the period, sales charge amounts retained by FDC were as follows:
| Retained
by FDC |
Class A | $ 18,407 |
Class T | 3,814 |
Class B* | 689 |
Class C* | 1,952 |
| $ 24,862 |
* When Class B and Class C shares are initially sold, FDC pays commissions from its own resources to financial intermediaries through which the sales are made.
Transfer Agent Fees. Fidelity Investments Institutional Operations Company, Inc., (FIIOC), an affiliate of the investment adviser, is the transfer, dividend disbursing and shareholder servicing agent for each class of the Fund. FIIOC receives account fees and asset-based fees that vary according to the account size and type of account of the shareholders of the respective classes of the Fund. FIIOC pays for typesetting, printing and mailing of shareholder reports, except proxy statements.
Annual Report
5. Fees and Other Transactions with Affiliates - continued
Transfer Agent Fees - continued
For the period, transfer agent fees for each class were as follows:
| Amount | % of
Class-Level
Average
Net Assets |
Class A | $ 74,352 | .28 |
Class T | 42,039 | .30 |
Class B | 2,010 | .30 |
Class C | 38,581 | .26 |
International Small Cap | 2,374,942 | .24 |
Institutional Class | 71,613 | .12 |
| $ 2,603,537 | |
Accounting and Security Lending Fees. Fidelity Service Company, Inc. (FSC), an affiliate of the investment adviser, maintains the Fund's accounting records. The accounting fee is based on the level of average net assets for each month. Under a separate contract, FSC administers the security lending program. The security lending fee is based on the number and duration of lending transactions.
Brokerage Commissions. The Fund placed a portion of its portfolio transactions with brokerage firms which are affiliates of the investment adviser. Brokerage commissions are included in net realized gain (loss) and change in net unrealized appreciation (depreciation) in the Statement of Operations. The commissions paid to these affiliated firms were $1,930 for the period.
6. Committed Line of Credit.
The Fund participates with other funds managed by the investment adviser or an affiliate in a $4.25 billion credit facility (the "line of credit") to be utilized for temporary or emergency purposes to fund shareholder redemptions or for other short-term liquidity purposes. The Fund has agreed to pay commitment fees on its pro-rata portion of the line of credit, which amounted to $1,862 and is reflected in Miscellaneous expenses on the Statement of Operations. During the period, the Fund did not borrow on this line of credit.
7. Security Lending.
The Fund lends portfolio securities through a lending agent from time to time in order to earn additional income. For equity securities, a lending agent is used and may loan securities to certain qualified borrowers, including Fidelity Capital Markets (FCM), a
Annual Report
Notes to Financial Statements - continued
7. Security Lending - continued
broker-dealer affiliated with the Fund. On the settlement date of the loan, the Fund receives collateral (in the form of U.S. Treasury obligations, letters of credit and/or cash) against the loaned securities and maintains collateral in an amount not less than 100% of the market value of the loaned securities during the period of the loan. The market value of the loaned securities is determined at the close of business of the Fund and any additional required collateral is delivered to the Fund on the next business day. If the borrower defaults on its obligation to return the securities loaned because of insolvency or other reasons, the Fund may apply collateral received from the borrower against the obligation. The Fund may experience delays and costs in recovering the securities loaned. Any cash collateral received is invested in the Fidelity Securities Lending Cash Central Fund. The value of loaned securities and cash collateral at period end are disclosed on the Fund's Statement of Assets and Liabilities. The value of securities loaned to FCM at period end was $54,910. Security lending income represents the income earned on investing cash collateral, less rebates paid to borrowers and any lending agent fees associated with the loan, plus any premium payments received for lending certain types of securities. Security lending income is presented in the Statement of Operations as a component of income from Fidelity Central Funds. Total security lending income during the period amounted to $303,427, including $2,692 from securities loaned to FCM.
8. Expense Reductions.
Commissions paid to certain brokers with whom the investment adviser, or its affiliates, places trades on behalf of the Fund include an amount in addition to trade execution, which may be rebated back to the Fund to offset certain expenses. This amount totaled $29,569 for the period. Through arrangements with the Fund's custodian, credits realized as a result of uninvested cash balances were used to reduce the Fund's expenses. During the period, these credits reduced the Fund's custody expenses by $132.
In addition, the investment adviser reimbursed a portion of the Fund's operating expenses during the period in the amount of $13,641.
9. Distributions to Shareholders.
Distributions to shareholders of each class were as follows:
Years ended October 31, | 2014 | 2013 |
From net investment income | | |
Class A | $ 48,210 | $ 53,369 |
International Small Cap | 3,601,146 | 4,638,246 |
Institutional Class | 363,320 | 77,935 |
Total | $ 4,012,676 | $ 4,769,550 |
Annual Report
9. Distributions to Shareholders - continued
Years ended October 31, | 2014 | 2013 |
From net realized gain | | |
Class A | $ 564,345 | $ 235,834 |
Class T | 310,220 | 146,972 |
Class B | 14,343 | 3,106 |
Class C | 305,689 | 61,233 |
International Small Cap | 23,368,303 | 11,152,248 |
Institutional Class | 1,694,550 | 155,394 |
Total | $ 26,257,450 | $ 11,754,787 |
10. Share Transactions.
Share transactions for each class were as follows and may contain automatic conversions between classes or exchanges between funds:
| Shares | Shares | Dollars | Dollars |
Years ended October 31, | 2014 | 2013 | 2014 | 2013 |
Class A | | | | |
Shares sold | 355,842 | 398,633 | $ 9,376,508 | $ 9,321,444 |
Reinvestment of distributions | 22,103 | 13,843 | 571,356 | 269,801 |
Shares redeemed | (306,489) | (215,812) | (8,061,522) | (4,750,681) |
Net increase (decrease) | 71,456 | 196,664 | $ 1,886,342 | $ 4,840,564 |
Class T | | | | |
Shares sold | 115,645 | 141,247 | $ 3,022,509 | $ 3,379,516 |
Reinvestment of distributions | 11,686 | 7,380 | 300,676 | 143,239 |
Shares redeemed | (148,659) | (104,387) | (3,861,942) | (2,281,922) |
Net increase (decrease) | (21,328) | 44,240 | $ (538,757) | $ 1,240,833 |
Class B | | | | |
Shares sold | 3,137 | 4,525 | $ 80,198 | $ 108,233 |
Reinvestment of distributions | 538 | 157 | 13,734 | 3,023 |
Shares redeemed | (13,726) | (15,050) | (356,690) | (330,538) |
Net increase (decrease) | (10,051) | (10,368) | $ (262,758) | $ (219,282) |
Class C | | | | |
Shares sold | 207,733 | 275,046 | $ 5,326,341 | $ 6,270,694 |
Reinvestment of distributions | 10,499 | 2,855 | 265,425 | 54,609 |
Shares redeemed | (222,725) | (109,571) | (5,644,059) | (2,419,306) |
Net increase (decrease) | (4,493) | 168,330 | $ (52,293) | $ 3,905,997 |
Annual Report
Notes to Financial Statements - continued
10. Share Transactions - continued
| Shares | Shares | Dollars | Dollars |
Years ended October 31, | 2014 | 2013 | 2014 | 2013 |
International Small Cap | | | | |
Shares sold | 7,158,603 | 11,248,438 | $ 190,711,642 | $ 266,912,412 |
Reinvestment of distributions | 988,313 | 770,505 | 25,844,388 | 15,163,539 |
Shares redeemed | (13,529,838) | (8,061,607) | (360,297,655) | (180,218,306) |
Net increase (decrease) | (5,382,922) | 3,957,336 | $ (143,741,625) | $ 101,857,645 |
Institutional Class | | | | |
Shares sold | 1,844,038 | 2,333,500 | $ 48,462,558 | $ 57,218,863 |
Reinvestment of distributions | 61,170 | 8,409 | 1,598,368 | 165,323 |
Shares redeemed | (4,099,284) | (303,629) | (109,159,166) | (6,792,002) |
Net increase (decrease) | (2,194,076) | 2,038,280 | $ (59,098,240) | $ 50,592,184 |
11. Other.
The Fund's organizational documents provide former and current trustees and officers with a limited indemnification against liabilities arising in connection with the performance of their duties to the Fund. In the normal course of business, the Fund may also enter into contracts that provide general indemnifications. The Fund's maximum exposure under these arrangements is unknown as this would be dependent on future claims that may be made against the Fund. The risk of material loss from such claims is considered remote.
At the end of the period, the investment adviser or its affiliates were the owners of record of 18% of the total outstanding shares of the Fund.
Annual Report
To the Trustees of Fidelity Investment Trust and Shareholders of Fidelity International Small Cap Fund:
We have audited the accompanying statement of assets and liabilities of Fidelity International Small Cap Fund (the Fund), a fund of Fidelity Investment Trust, including the schedule of investments, as of October 31, 2014, and the related statement of operations for the year then ended, the statement of changes in net assets for each of the two years in the period then ended, and the financial highlights for each of the five years in the period then ended. These financial statements and financial highlights are the responsibility of the Fund's management. Our responsibility is to express an opinion on these financial statements and financial highlights based on our audits.
We conducted our audits in accordance with the standards of the Public Company Accounting Oversight Board (United States). Those standards require that we plan and perform the audit to obtain reasonable assurance about whether the financial statements and financial highlights are free of material misstatement. The Fund is not required to have, nor were we engaged to perform, an audit of its internal control over financial reporting. Our audits included consideration of internal control over financial reporting as a basis for designing audit procedures that are appropriate in the circumstances, but not for the purpose of expressing an opinion on the effectiveness of the Fund's internal control over financial reporting. Accordingly, we express no such opinion. An audit also includes examining, on a test basis, evidence supporting the amounts and disclosures in the financial statements, assessing the accounting principles used and significant estimates made by management, as well as evaluating the overall financial statement presentation. Our procedures included confirmation of securities owned as of October 31, 2014, by correspondence with the custodians and brokers; where replies were not received from brokers, we performed other auditing procedures. We believe that our audits provide a reasonable basis for our opinion.
In our opinion, the financial statements and financial highlights referred to above present fairly, in all material respects, the financial position of Fidelity International Small Cap Fund as of October 31, 2014, the results of its operations for the year then ended, the changes in its net assets for each of the two years in the period then ended, and the financial highlights for each of the five years in the period then ended, in conformity with accounting principles generally accepted in the United States of America.
DELOITTE & TOUCHE LLP
Boston, Massachusetts
December 19, 2014
Annual Report
The Trustees, Member of the Advisory Board, and officers of the trust and fund, as applicable, are listed below. The Board of Trustees governs the fund and is responsible for protecting the interests of shareholders. The Trustees are experienced executives who meet periodically throughout the year to oversee the fund's activities, review contractual arrangements with companies that provide services to the fund, oversee management of the risks associated with such activities and contractual arrangements, and review the fund's performance. Except for James C. Curvey, each of the Trustees oversees 174 funds. Mr. Curvey oversees 407 funds.
The Trustees hold office without limit in time except that (a) any Trustee may resign; (b) any Trustee may be removed by written instrument, signed by at least two-thirds of the number of Trustees prior to such removal; (c) any Trustee who requests to be retired or who has become incapacitated by illness or injury may be retired by written instrument signed by a majority of the other Trustees; and (d) any Trustee may be removed at any special meeting of shareholders by a two-thirds vote of the outstanding voting securities of the trust. Each Trustee who is not an interested person (as defined in the 1940 Act) of the trust and the fund (Independent Trustee), shall retire not later than the last day of the calendar year in which his or her 75th birthday occurs. The Independent Trustees may waive this mandatory retirement age policy with respect to individual Trustees. The officers and Advisory Board Member hold office without limit in time, except that any officer and Advisory Board Member may resign or may be removed by a vote of a majority of the Trustees at any regular meeting or any special meeting of the Trustees. Except as indicated, each individual has held the office shown or other offices in the same company for the past five years.
Experience, Skills, Attributes, and Qualifications of the Fund's Trustees. The Governance and Nominating Committee has adopted a statement of policy that describes the experience, qualifications, attributes, and skills that are necessary and desirable for potential Independent Trustee candidates (Statement of Policy). The Board believes that each Trustee satisfied at the time he or she was initially elected or appointed a Trustee, and continues to satisfy, the standards contemplated by the Statement of Policy. The Governance and Nominating Committee also engages professional search firms to help identify potential Independent Trustee candidates who have the experience, qualifications, attributes, and skills consistent with the Statement of Policy. From time to time, additional criteria based on the composition and skills of the current Independent Trustees, as well as experience or skills that may be appropriate in light of future changes to board composition, business conditions, and regulatory or other developments, have also been considered by the professional search firms and the Governance and Nominating Committee. In addition, the Board takes into account the Trustees' commitment and participation in Board and committee meetings, as well as their leadership of standing and ad hoc committees throughout their tenure.
In determining that a particular Trustee was and continues to be qualified to serve as a Trustee, the Board has considered a variety of criteria, none of which, in isolation, was controlling. The Board believes that, collectively, the Trustees have balanced and diverse experience, qualifications, attributes, and skills, which allow the Board to operate effectively in governing the fund and protecting the interests of shareholders. Information about the specific experience, skills, attributes, and qualifications of each Trustee, which in each case led to the Board's conclusion that the Trustee should serve (or continue to serve) as a trustee of the fund, is provided below.
Annual Report
Trustees and Officers - continued
Board Structure and Oversight Function. James C. Curvey is an interested person (as defined in the 1940 Act) and currently serves as Chairman. The Trustees have determined that an interested Chairman is appropriate and benefits shareholders because an interested Chairman has a personal and professional stake in the quality and continuity of services provided to the fund. Independent Trustees exercise their informed business judgment to appoint an individual of their choosing to serve as Chairman, regardless of whether the Trustee happens to be independent or a member of management. The Independent Trustees have determined that they can act independently and effectively without having an Independent Trustee serve as Chairman and that a key structural component for assuring that they are in a position to do so is for the Independent Trustees to constitute a substantial majority for the Board. The Independent Trustees also regularly meet in executive session. Ned C. Lautenbach serves as Chairman of the Independent Trustees and as such (i) acts as a liaison between the Independent Trustees and management with respect to matters important to the Independent Trustees and (ii) with management prepares agendas for Board meetings.
Fidelity funds are overseen by different Boards of Trustees. The fund's Board oversees Fidelity's equity and high income funds and another Board oversees Fidelity's investment-grade bond, money market, and asset allocation funds. The asset allocation funds may invest in Fidelity funds overseen by the fund's Board. The use of separate Boards, each with its own committee structure, allows the Trustees of each group of Fidelity funds to focus on the unique issues of the funds they oversee, including common research, investment, and operational issues. On occasion, the separate Boards establish joint committees to address issues of overlapping consequences for the Fidelity funds overseen by each Board.
The Trustees operate using a system of committees to facilitate the timely and efficient consideration of all matters of importance to the Trustees, the fund, and fund shareholders and to facilitate compliance with legal and regulatory requirements and oversight of the fund's activities and associated risks. The Board, acting through its committees, has charged FMR and its affiliates with (i) identifying events or circumstances the occurrence of which could have demonstrably adverse effects on the fund's business and/or reputation; (ii) implementing processes and controls to lessen the possibility that such events or circumstances occur or to mitigate the effects of such events or circumstances if they do occur; and (iii) creating and maintaining a system designed to evaluate continuously business and market conditions in order to facilitate the identification and implementation processes described in (i) and (ii) above. Because the day-to-day operations and activities of the fund are carried out by or through FMR, its affiliates and other service providers, the fund's exposure to risks is mitigated but not eliminated by the processes overseen by the Trustees. While each of the Board's committees has responsibility for overseeing different aspects of the fund's activities, oversight is exercised primarily through the Operations, Audit, and Compliance Committees. In addition, the Independent Trustees have worked with FMR to enhance the Board's oversight of investment and financial risks, legal and regulatory risks, technology risks, and operational risks, including the development of additional risk reporting to the Board. For example, a working group comprised of Independent Trustees and FMR has worked and continues to work to review the Fidelity funds' valuation-related activities, reporting and risk management. Appropriate personnel, including but not limited to the fund's Chief Compliance Officer (CCO), FMR's internal auditor, the independent accountants, the fund's Treasurer and portfolio management personnel, make periodic reports to the Board's committees, as appropriate, including an annual review of FMR's risk management program for the Fidelity funds. The responsibilities of each standing committee, including their oversight responsibilities, are described further under "Standing Committees of the Fund's Trustees."
Annual Report
The fund's Statement of Additional Information (SAI) includes more information about the Trustees. To request a free copy, call Fidelity at 1-800-544-8544.
Interested Trustees*:
Correspondence intended for each Trustee who is an interested person may be sent to Fidelity Investments, 245 Summer Street, Boston, Massachusetts 02210.
Name, Year of Birth; Principal Occupations and Other Relevant Experience+ |
James C. Curvey (1935) |
Year of Election or Appointment: 2007 Trustee Chairman of the Board of Trustees |
| Mr. Curvey also serves as Trustee of other Fidelity funds. Mr. Curvey is a Director of Fidelity Research & Analysis Co. (2009-present), and Vice Chairman (2007-present) and Director of FMR LLC. In addition, Mr. Curvey serves as an Overseer for the Boston Symphony Orchestra and a member of the board of Artis-Naples, Naples, Florida, and as a Trustee for Brewster Academy, Wolfeboro, New Hampshire. Previously, Mr. Curvey served as a Director of Fidelity Investments Money Management, Inc. (2009-2014), a Director of FMR (2007-2014), and a Director of FMR Co., Inc. (2007-2014). |
Charles S. Morrison (1960) |
Year of Election or Appointment: 2014 Trustee |
| Mr. Morrison also serves as Trustee of other funds. He serves as a Director of Fidelity Investments Money Management, Inc. (FIMM) (2014-present), Director of Fidelity SelectCo, LLC (2014-present), President, Asset Management (2014-present), and is an employee of Fidelity Investments. Previously, Mr. Morrison served as Vice President of Fidelity's Fixed Income and Asset Allocation Funds (2012-2014), President, Fixed Income (2011-2014), Vice President of Fidelity's Money Market Funds (2005-2009), President, Money Market Group Leader of FMR (2009), and Senior Vice President, Money Market Group of FMR (2004-2009). Mr. Morrison also served as Vice President of Fidelity's Bond Funds (2002-2005), certain Balanced Funds (2002-2005), and certain Asset Allocation Funds (2002-2007), and as Senior Vice President (2002-2005) of Fidelity's Bond Division. |
* Trustees have been determined to be "Interested Trustees" by virtue of, among other things, their affiliation with the trust or various entities under common control with FMR.
+ The information above includes each Trustee's principal occupation during the last five years and other information relating to the experience, attributes, and skills relevant to each Trustee's qualifications to serve as a Trustee, which led to the conclusion that each Trustee should serve as a Trustee for the fund.
Annual Report
Independent Trustees:
Correspondence intended for each Independent Trustee (that is, the Trustees other than the Interested Trustees) may be sent to Fidelity Investments, P.O. Box 55235, Boston, Massachusetts 02205-5235.
Name, Year of Birth; Principal Occupations and Other Relevant Experience+ |
Dennis J. Dirks (1948) |
Year of Election or Appointment: 2005 Trustee |
| Mr. Dirks also serves as Trustee of other Fidelity funds. Prior to his retirement in May 2003, Mr. Dirks was Chief Operating Officer and a member of the Board of The Depository Trust & Clearing Corporation (DTCC). He also served as President, Chief Operating Officer, and Board member of The Depository Trust Company (DTC) and President and Board member of the National Securities Clearing Corporation (NSCC). In addition, Mr. Dirks served as Chief Executive Officer and Board member of the Government Securities Clearing Corporation, Chief Executive Officer and Board member of the Mortgage-Backed Securities Clearing Corporation, as a Trustee and a member of the Finance Committee of Manhattan College (2005-2008), and as a Trustee and a member of the Finance Committee of AHRC of Nassau County (2006-2008). Mr. Dirks is a member of the Independent Directors Council (IDC) Governing Council (2010-present) and Board of Directors for The Brookville Center for Children's Services, Inc. (2009-present). |
Alan J. Lacy (1953) |
Year of Election or Appointment: 2008 Trustee |
| Mr. Lacy also serves as Trustee of other Fidelity funds. Mr. Lacy serves as Senior Adviser (2007-present) of Oak Hill Capital Partners, L.P. (private equity). Mr. Lacy also served as Chief Executive Officer (2000-2005) and Vice Chairman (2005-2006) of Sears Holdings Corporation and Sears, Roebuck and Co. (retail). In addition, Mr. Lacy serves as a member of the Board of Directors of Dave & Buster's Entertainment, Inc. (restaurant and entertainment complexes, 2010-present), Earth Fare, Inc. (retail grocery, 2012-present), The Hillman Companies, Inc. (hardware wholesalers, 2010-present), and Bristol-Myers Squibb Company (global pharmaceuticals, 2008-present). Mr. Lacy is a member of the Board of Trustees of The National Parks Conservation Association (2006-present). Previously, Mr. Lacy served as Chairman of the Board of Trustees of the National Parks Conservation Association (2008-2011) and as a member of the Board of Directors for the Western Union Company (global money transfer, 2006-2011). |
Ned C. Lautenbach (1944) |
Year of Election or Appointment: 2000 Trustee Chairman of the Independent Trustees |
| Mr. Lautenbach also serves as Trustee of other Fidelity funds. Mr. Lautenbach currently serves as the Lead Director of the Eaton Corporation Board of Directors (diversified industrial, 1997-present). Mr. Lautenbach is Chairman of the Board of Directors of the Philharmonic Center for the Arts in Naples, Florida (2012-present) and a member of the Council on Foreign Relations (1994-present). Previously, Mr. Lautenbach was a Partner/Advisory Partner at Clayton, Dubilier & Rice, LLC (private equity investment, 1998-2010), as well as a Director of Sony Corporation (2006-2007). |
Joseph Mauriello (1944) |
Year of Election or Appointment: 2008 Trustee |
| Mr. Mauriello also serves as Trustee of other Fidelity funds. Prior to his retirement in January 2006, Mr. Mauriello served in numerous senior management positions including Deputy Chairman and Chief Operating Officer (2004-2005), and Vice Chairman of Financial Services (2002-2004) of KPMG LLP US (professional services, 1965-2005). Mr. Mauriello currently serves as a member of the Board of Directors of XL Group plc. (global insurance and re-insurance, 2006-present). Previously, Mr. Mauriello served as a Director of the Hamilton Funds of the Bank of New York (2006-2007) and of Arcadia Resources Inc. (health care services and products, 2007-2012). |
Robert W. Selander (1950) |
Year of Election or Appointment: 2011 Trustee |
| Mr. Selander also serves as Trustee of other Fidelity funds. Previously, Mr. Selander served as a Member of the Advisory Board of other Fidelity funds (2011), and Executive Vice Chairman (2010), Chief Executive Officer (2009-2010), and President and Chief Executive Officer (1997-2009) of Mastercard, Inc. |
Cornelia M. Small (1944) |
Year of Election or Appointment: 2005 Trustee |
| Ms. Small also serves as Trustee of other Fidelity funds. Ms. Small is a member of the Board of Directors (2009-present) and Chair of the Investment Committee (2010-present) of the Teagle Foundation. Ms. Small also serves on the Investment Committee of the Berkshire Taconic Community Foundation (2008-present). Previously, Ms. Small served as Chairperson (2002-2008) and a member of the Investment Committee and Chairperson (2008-2012) and a member of the Board of Trustees of Smith College. In addition, Ms. Small served as Chief Investment Officer, Director of Global Equity Investments, and a member of the Board of Directors of Scudder, Stevens & Clark and Scudder Kemper Investments. |
William S. Stavropoulos (1939) |
Year of Election or Appointment: 2001 Trustee Vice Chairman of the Independent Trustees |
| Mr. Stavropoulos also serves as Trustee of other Fidelity funds. Mr. Stavropoulos serves as President and Founder of the Michigan Baseball Foundation, the Great Lakes Loons (2007-present). Mr. Stavropoulos is Chairman Emeritus of the Board of Directors of The Dow Chemical Company, where he previously served in numerous senior management positions, including President, CEO (1995-2000; 2002-2004), Chairman of the Executive Committee (2000-2006), and as a member of the Board of Directors (1990-2006). Currently, Mr. Stavropoulos is Chairman of the Board of Directors of Univar Inc. (global distributor of commodity and specialty chemicals), a Director of Teradata Corporation (data warehousing and technology solutions), and Maersk Inc. (industrial conglomerate), and a member of the Advisory Board for Metalmark Capital LLC (private equity investment, 2005-present). Mr. Stavropoulos is an operating advisor to Clayton, Dubilier & Rice, LLC (private equity investment). In addition, Mr. Stavropoulos is a member of the University of Notre Dame Advisory Council for the College of Science, a Trustee of the Rollin L. Gerstacker Foundation, and a Director of the Naples Philharmonic Center for the Arts. Previously, Mr. Stavropoulos served as a Director of Chemical Financial Corporation (bank holding company, 1993-2012) and Tyco International, Ltd. (multinational manufacturing and services, 2007-2012). |
David M. Thomas (1949) |
Year of Election or Appointment: 2008 Trustee |
| Mr. Thomas also serves as Trustee of other Fidelity funds. Mr. Thomas serves as Non-Executive Chairman of the Board of Directors of Fortune Brands Home and Security (home and security products, 2011-present), and as a member of the Board of Directors of Interpublic Group of Companies, Inc. (marketing communication, 2004-present). Previously, Mr. Thomas served as Executive Chairman (2005-2006) and Chairman and Chief Executive Officer (2000-2005) of IMS Health, Inc. (pharmaceutical and healthcare information solutions), and a Director of Fortune Brands, Inc. (consumer products, 2000-2011). |
+ The information above includes each Trustee's principal occupation during the last five years and other information relating to the experience, attributes, and skills relevant to each Trustee's qualifications to serve as a Trustee, which led to the conclusion that each Trustee should serve as a Trustee for the fund.
Advisory Board Member and Officers:
Correspondence intended for each officer and Peter S. Lynch may be sent to Fidelity Investments, 245 Summer Street, Boston, Massachusetts 02210. Officers appear below in alphabetical order.
Name, Year of Birth; Principal Occupation |
Peter S. Lynch (1944) |
Year of Election or Appointment: 2003 Member of the Advisory Board |
| Mr. Lynch also serves as Member of the Advisory Board of other Fidelity funds. Mr. Lynch is Vice Chairman and a Director of FMR and FMR Co., Inc. In addition, Mr. Lynch serves as a Trustee of Boston College and as the Chairman of the Inner-City Scholarship Fund. Previously, Mr. Lynch served on the Special Olympics International Board of Directors (1997-2006). |
Elizabeth Paige Baumann (1968) |
Year of Election or Appointment: 2012 Anti-Money Laundering (AML) Officer |
| Ms. Baumann also serves as AML Officer of other funds. She is Chief AML Officer of FMR LLC (2012-present) and is an employee of Fidelity Investments. Previously, Ms. Baumann served as Vice President and Deputy Anti-Money Laundering Officer (2007-2012). |
William C. Coffey (1969) |
Year of Election or Appointment: 2009 Assistant Secretary |
| Mr. Coffey also serves as Assistant Secretary of other funds. He is Senior Vice President and Deputy General Counsel of FMR LLC (2010-present), and is an employee of Fidelity Investments. Previously, Mr. Coffey served as Vice President and Associate General Counsel of FMR LLC (2005-2009). |
Jonathan Davis (1968) |
Year of Election or Appointment: 2010 Assistant Treasurer |
| Mr. Davis also serves as Assistant Treasurer of other funds. Mr. Davis is an employee of Fidelity Investments. Previously, Mr. Davis served as Vice President and Associate General Counsel of FMR LLC (2003-2010). |
Adrien E. Deberghes (1967) |
Year of Election or Appointment: 2008 Deputy Treasurer |
| Mr. Deberghes also serves as an officer of other funds. He is an employee of Fidelity Investments (2008-present). Prior to joining Fidelity Investments, Mr. Deberghes was Senior Vice President of Mutual Fund Administration at State Street Corporation (2007-2008), Senior Director of Mutual Fund Administration at Investors Bank & Trust (2005-2007), and Director of Finance for Dunkin' Brands (2000-2005). |
Stephanie J. Dorsey (1969) |
Year of Election or Appointment: 2010 Assistant Treasurer |
| Ms. Dorsey also serves as an officer of other funds. She is an employee of Fidelity Investments (2008-present) and has served in other fund officer roles. Prior to joining Fidelity Investments, Ms. Dorsey served as Treasurer (2004-2008) of the JPMorgan Mutual Funds and Vice President (2004-2008) of JPMorgan Chase Bank. |
Howard J. Galligan III (1966) |
Year of Election or Appointment: 2014 Chief Financial Officer |
| Mr. Galligan also serves as Chief Financial Officer of other funds. Mr. Galligan serves as President of Fidelity Pricing and Cash Management Services (FPCMS) (2014-present) and as a Director of Strategic Advisers, Inc. (2008-present). Previously, Mr. Galligan served as Chief Administrative Officer of Asset Management (2011-2014) and Chief Operating Officer and Senior Vice President of Investment Support for Strategic Advisers, Inc. (2003-2011). |
Scott C. Goebel (1968) |
Year of Election or Appointment: 2008 Secretary and Chief Legal Officer (CLO) |
| Mr. Goebel serves as Secretary and CLO of other funds. Mr. Goebel also serves as Secretary of Fidelity SelectCo, LLC (2013-present), Fidelity Investments Money Management, Inc. (FIMM) (2010-present) and Fidelity Research and Analysis Company (FRAC) (2010-present); General Counsel, Secretary, and Senior Vice President of FMR (2008-present) and FMR Co., Inc. (2008-present); Chief Legal Officer of Fidelity Management & Research (Hong Kong) Limited (2008-present); and Assistant Secretary of Fidelity Management & Research (Japan) Limited (2008-present) and Fidelity Management & Research (U.K.) Inc. (2008-present). Previously, Mr. Goebel served as Secretary and CLO of other Fidelity funds (2008-2013), Assistant Secretary of FIMM (2008-2010), FRAC (2008-2010), and certain funds (2007-2008); and as Vice President and Secretary of Fidelity Distributors Corporation (FDC) (2005-2007). Mr. Goebel has been employed by FMR LLC or an affiliate since 2001. |
Thomas C. Hense (1964) |
Year of Election or Appointment: 2008/2010 Vice President |
| Mr. Hense also serves as Vice President of other funds (High Income (2008), Small Cap (2008), and Value (2010) funds). Previously, Mr. Hense served as a portfolio manager for Fidelity's Institutional Money Management Group (Pyramis) (2003-2008). |
Brian B. Hogan (1964) |
Year of Election or Appointment: 2009 Vice President |
| Mr. Hogan also serves as Trustee or Vice President of other funds. Mr. Hogan serves as a Director of Fidelity SelectCo, LLC (2014-present) and President of FMR's Equity Division (2009-present). Previously, Mr. Hogan served as Senior Vice President, Equity Research of FMR (2006-2009) and as a portfolio manager. |
Chris Maher (1972) |
Year of Election or Appointment: 2013 Assistant Treasurer |
| Mr. Maher serves as Assistant Treasurer of other funds. Mr. Maher is Vice President of Valuation Oversight and is an employee of Fidelity Investments. Previously, Mr. Maher served as Vice President of Asset Management Compliance (2013), Vice President of FMR's Program Management Group (2010-2013), and Vice President of Valuation Oversight (2008-2010). |
Kenneth B. Robins (1969) |
Year of Election or Appointment: 2008 President and Treasurer |
| Mr. Robins also serves as an officer of other funds. Mr. Robins serves as Executive Vice President of Fidelity Investments Money Management, Inc. (FIMM) (2013-present) and is an employee of Fidelity Investments (2004-present). Previously, Mr. Robins served in other fund officer roles. |
Stephen Sadoski (1971) |
Year of Election or Appointment: 2012 Deputy Treasurer |
| Mr. Sadoski also serves as Deputy Treasurer of other funds. He is an employee of Fidelity Investments (2012-present) and has served in another fund officer role. Prior to joining Fidelity Investments, Mr. Sadoski served as an assistant chief accountant in the Division of Investment Management of the Securities and Exchange Commission (SEC) (2009-2012) and as a senior manager at Deloitte & Touche LLP (1997-2009). |
Stacie M. Smith (1974) |
Year of Election or Appointment: 2013 Deputy Treasurer |
| Ms. Smith also serves as an officer of other funds. She is an employee of Fidelity Investments (2009-present) and has served in other fund officer roles. Prior to joining Fidelity Investments, Ms. Smith served as Senior Audit Manager of Ernst & Young LLP (1996-2009). |
Renee Stagnone (1975) |
Year of Election or Appointment: 2013 Deputy Treasurer |
| Ms. Stagnone also serves as Deputy Treasurer of other funds. Ms. Stagnone is an employee of Fidelity Investments. |
Linda J. Wondrack (1964) |
Year of Election or Appointment: 2014 Chief Compliance Officer |
| Ms. Wondrack also serves as Chief Compliance Officer of other funds. Ms. Wondrack is Executive Vice President and head of the Ethics Office and Asset Management Compliance for Fidelity Investments (2012-present). Ms. Wondrack also serves as Chief Compliance Officer of Fidelity SelectCo, LLC (2014-present); Chief Compliance Officer of Impresa Management LLC (2013-present); and Chief Compliance Officer of FMR Co., Inc., Fidelity Investments Money Management, Inc., Fidelity Management & Research (Japan) Limited, Fidelity Management & Research (U.K.) Inc., Fidelity Management & Research (Hong Kong), Fidelity Management & Research Company, Pyramis Global Advisors, LLC, and Strategic Advisers, Inc., Ballyrock Investment Advisors LLC, and Northern Neck Investors LLC (2012-present). Previously, Ms. Wondrack served as Senior Vice President and Chief Compliance Officer for Columbia Management Investment Advisers, LLC (2005-2012); Chief Compliance Officer for certain funds within the Columbia Family of Funds (2007-2012); and Senior Vice President of Compliance Risk Management at Bank of America (2005-2010). |
Joseph F. Zambello (1957) |
Year of Election or Appointment: 2011 Deputy Treasurer |
| Mr. Zambello also serves as Deputy Treasurer of other funds. Mr. Zambello is an employee of Fidelity Investments. Previously, Mr. Zambello served as Vice President of FMR's Program Management Group (2009-2011) and Vice President of the Transfer Agent Oversight Group (2005-2009). |
Annual Report
The Board of Trustees of Fidelity International Small Cap Fund voted to pay to shareholders of record at the opening of business on record date, the following distributions per share derived from capital gains realized from sales of portfolio securities, and dividends derived from net investment income:
| Pay Date | Record Date | Dividends | Capital Gains |
International Small Cap Fund | 12/08/14 | 12/05/14 | $0.236 | $3.452 |
The fund hereby designates as a capital gain dividend with respect to the taxable year ended October 31, 2014, $165,246,247, or, if subsequently determined to be different, the net capital gain of such year.
International Small Cap Fund designates 30% of the dividend distributed during the fiscal year as amounts which may be taken into account as a dividend for purposes of the maximum rate under section 1(h)(11) of the Internal Revenue Code.
The amounts per share which represent income derived from sources within, and taxes paid to, foreign countries or possessions of the United States are as follows:
| Pay Date | Income | Taxes |
International Small Cap Fund | 12/09/13 | $0.2167 | $0.0122 |
The fund will notify shareholders in January 2015 of amounts for use in preparing 2014 income tax returns.
Annual Report
A special meeting of the fund's shareholders was held on March 18, 2014. The results of votes taken among shareholders on the proposal before them are reported below. Each vote reported represents one dollar of net asset value held on the record date for the meeting.
PROPOSAL 1 |
To approve a change in the performance adjustment index for the fund. |
| # of
Votes | % of
Votes |
Affirmative | 659,102,813.34 | 91.252 |
Against | 41,779,512.26 | 5.784 |
Abstain | 21,410,547.93 | 2.964 |
TOTAL | 722,292,873.53 | 100.000 |
Annual Report
Board Approval of Investment Advisory Contracts and Management Fees
Fidelity International Small Cap Fund
Each year, the Board of Trustees, including the Independent Trustees (together, the Board), votes on the renewal of the management contract with Fidelity Management & Research Company (FMR) and the sub-advisory agreements (together, the Advisory Contracts) for the fund. The Board, assisted by the advice of fund counsel and Independent Trustees' counsel, requests and considers a broad range of information relevant to the renewal of the Advisory Contracts throughout the year.
The Board meets regularly and, at each of its meetings, covers an extensive agenda of topics and materials and considers factors that are relevant to its annual consideration of the renewal of the fund's Advisory Contracts, including the services and support provided to the fund and its shareholders. The Board has established various standing committees (Committees), each composed of and chaired by Independent Trustees with varying backgrounds, to which the Board has assigned specific subject matter responsibilities in order to enhance effective decision-making by the Board. The Board, acting directly and through its Committees, requests and receives information concerning the annual consideration of the renewal of the fund's Advisory Contracts. The Board also meets as needed to consider matters specifically related to the Board's annual consideration of the renewal of the Advisory Contracts. Members of the Board may also meet with trustees of other Fidelity funds through ad hoc joint committees to discuss certain matters relevant to the Fidelity funds.
At its July 2014 meeting, the Board, including the Independent Trustees, unanimously determined to renew the fund's Advisory Contracts. In reaching its determination, the Board considered all factors it believed relevant, including (i) the nature, extent, and quality of the services to be provided to the fund and its shareholders (including the investment performance of the fund); (ii) the competitiveness of the fund's management fee and total expense ratio relative to peer funds; (iii) the total costs of the services to be provided by and the profits to be realized by Fidelity from its relationship with the fund; (iv) the extent to which economies of scale exist and would be realized as the fund grows; and (v) whether fee levels reflect these economies of scale, if any, for the benefit of fund shareholders. In connection with separate internal corporate reorganizations involving Fidelity Management & Research (U.K.) Inc. (FMR U.K.) and Fidelity Management & Research (Japan) Inc. (FMR Japan), the Board approved certain non-material amendments to the fund's sub-advisory agreements with FMR U.K. and FMR Japan to reflect that, after these reorganizations, FMR Investment Management (UK) Limited and Fidelity Management & Research (Japan) Limited will carry on the business of FMR U.K. and FMR Japan, respectively. The Board noted that no changes to the portfolio managers or to the foreign research or investment advisory services provided to the fund were expected in connection with either reorganization and that the same personnel and resources would continue to be available to the fund at the new entities.
Annual Report
In considering whether to renew the Advisory Contracts for the fund, the Board reached a determination, with the assistance of fund counsel and Independent Trustees' counsel and through the exercise of its business judgment, that the renewal of the Advisory Contracts was in the best interests of the fund and its shareholders and that the compensation payable under the Advisory Contracts was fair and reasonable. The Board's decision to renew the Advisory Contracts was not based on any single factor, but rather was based on a comprehensive consideration of all the information provided to the Board at its meetings throughout the year. The Board, in reaching its determination to renew the Advisory Contracts, was aware that shareholders of the fund have a broad range of investment choices available to them, including a wide choice among funds offered by Fidelity's competitors, and that the fund's shareholders, who have the opportunity to review and weigh the disclosure provided by the fund in its prospectus and other public disclosures, have chosen to invest in this fund, which is part of the Fidelity family of funds.
Nature, Extent, and Quality of Services Provided. The Board considered Fidelity's staffing as it relates to the fund, including the backgrounds of investment personnel of FMR and the sub-advisers (together, the Investment Advisers), and also considered the fund's investment objective, strategies, and related investment philosophy. The Independent Trustees also had discussions with senior management of Fidelity's investment operations and investment groups. The Board considered the structure of the portfolio manager compensation program and whether this structure provides appropriate incentives to act in the best interests of the fund. Additionally, the Board considered the portfolio managers' investments, if any, in the funds that they manage.
Resources Dedicated to Investment Management and Support Services. The Board and the Fund Oversight and Research Committees reviewed the general qualifications and capabilities of Fidelity's investment staff, including its size, education, experience, and resources, as well as Fidelity's approach to recruiting, training, managing, and compensating investment personnel. The Board noted that Fidelity has continued to increase the resources devoted to non-U.S. offices, including expansion of Fidelity's global investment organization. The Board also noted that Fidelity's analysts have extensive resources, tools and capabilities that allow them to conduct sophisticated quantitative and fundamental analysis, as well as credit analysis of issuers, counterparties and guarantors. Further, the Board believes that Fidelity's investment professionals have sufficient access to global information and data so as to provide competitive investment results over time, and that those professionals also have access to sophisticated tools that permit them to assess portfolio construction and risk and performance attribution characteristics continuously, as well as to transmit new information and research conclusions rapidly around the world. Additionally, in its deliberations, the Board considered Fidelity's trading and risk management capabilities and resources and global compliance infrastructure, which are an integral part of the investment management process.
Annual Report
Board Approval of Investment Advisory Contracts and
Management Fees - continued
Shareholder and Administrative Services. The Board considered (i) the nature, extent, quality, and cost of advisory, administrative, and shareholder services performed by the Investment Advisers and their affiliates under the Advisory Contracts and under separate agreements covering transfer agency, pricing and bookkeeping, and securities lending services for the fund; (ii) the nature and extent of the supervision of third party service providers, principally custodians and subcustodians; and (iii) the resources devoted to, and the record of compliance with, the fund's compliance policies and procedures. The Board also reviewed the allocation of fund brokerage, including allocations to brokers affiliated with the Investment Advisers, the use of brokerage commissions to pay fund expenses, and the use of "soft" commission dollars to pay for research services.
The Board noted that the growth of fund assets over time across the complex allows Fidelity to reinvest in the development of services designed to enhance the value or convenience of the Fidelity funds as investment vehicles. These services include 24-hour access to account information and market information through telephone representatives and over the Internet, investor education materials and asset allocation tools, and the expanded availability of Fidelity Investor Centers.
In 2014, the Board formed an ad hoc Committee on Transfer Agency Fees to review the variety of transfer agency fee structures throughout the industry and Fidelity's competitive positioning with respect to industry participants.
Investment in a Large Fund Family. The Board considered the benefits to shareholders of investing in a Fidelity fund, including the benefits of investing in a fund that is part of a large family of funds offering a variety of investment disciplines and providing a large variety of mutual fund investor services. The Board noted that Fidelity had taken, or had made recommendations that resulted in the Fidelity funds taking, a number of actions over the previous year that benefited particular funds, including (i) continuing to dedicate additional resources to investment research and to the support of the senior management team that oversees asset management; (ii) persisting in efforts to enhance Fidelity's global research capabilities; (iii) launching new funds and making other enhancements to meet client needs for income-oriented solutions; (iv) reducing fund expenses for certain index funds; (v) continuing to launch dedicated lower cost underlying funds to meet portfolio construction needs related to expanding underlying fund options for Fidelity funds of funds, specifically for the Freedom Fund product lines; (vi) rationalizing product lines and gaining increased efficiencies through fund mergers; (vii) launching sector-based exchange-traded funds and establishing a new Fidelity adviser to manage sector-based funds and products; (viii) continuing to develop and implement technology to improve security and increase efficiency; (ix) modifying the eligibility criteria for certain share classes to increase their marketability to a portion of the defined contribution plan market; (x) waiving redemption fees for certain qualified fund-of-fund and wrap programs and certain retirement plan transactions; and (xi) launching new Institutional Class shares of certain money market funds to attract and retain assets and to fill a gap in the money market fund lineup.
Annual Report
Investment Performance. The Board considered whether the fund has operated in accordance with its investment objective, as well as its record of compliance with its investment restrictions and its performance history. The Board noted that there was a portfolio management change for the fund in March 2014.
The Board took into account discussions with the Investment Advisers about fund investment performance that occur at Board meetings throughout the year. In this regard the Board noted that as part of regularly scheduled fund reviews and other reports to the Board on fund performance, the Board periodically considers annualized return information for the fund, for different time periods, measured against a securities market index ("benchmark index") and a peer group of funds with similar objectives ("peer group"). In its evaluation of fund investment performance, the Board gave particular attention to information indicating changes in performance of certain Fidelity funds for specific time periods and the Investment Advisers' explanations for any overperformance or underperformance.
In addition to reviewing absolute and relative fund performance, the Independent Trustees periodically consider the appropriateness of fund performance metrics in evaluating the results achieved. In general, the Independent Trustees believe that fund performance should be evaluated based on net performance (after fees and expenses) of both the highest performing and lowest performing classes, where applicable, compared to appropriate benchmark indices, over appropriate time periods which may include full market cycles, and compared to peer groups, as applicable, over the same periods, taking into account relevant factors including the following: general market conditions; issuer-specific information; tactical opportunities for investment; and fund cash flows and other factors.
The Independent Trustees recognize that shareholders evaluate performance on a net basis over their own holding periods, for which one-, three-, and five-year periods are often used as a proxy. For this reason, the performance information reviewed by the Board also included net cumulative calendar year total return information for the fund and an appropriate benchmark index and peer group for the most recent one-, three-, and five-year periods, as shown below. Returns are shown compared to the 25th percentile (top of box, 75% beaten) and 75th percentile (bottom of box, 25% beaten) of the peer universe. Returns of the benchmark index are "net MA," i.e., adjusted for tax withholding rates applicable to U.S.-based funds organized as Massachusetts business trusts.
Annual Report
Board Approval of Investment Advisory Contracts and
Management Fees - continued
Fidelity International Small Cap Fund

The Board also considered that the fund's management fee is subject to upward or downward adjustment depending upon whether, and to what extent, the fund's investment performance for the performance period exceeds, or is exceeded by, a securities index, thus leading to a performance adjustment for the same period. The Board noted that the performance adjustment provides FMR with a strong economic incentive to seek to achieve superior performance for the fund's shareholders and helps to more closely align the interests of FMR and the fund's shareholders.
Based on its review, the Board concluded that the nature, extent, and quality of services provided to the fund under the Advisory Contracts should benefit the fund's shareholders.
Competitiveness of Management Fee and Total Expense Ratio. The Board considered the fund's management fee and total expense ratio compared to "mapped groups" of competitive funds and classes. Fidelity creates "mapped groups" by combining similar Lipper investment objective categories that have comparable investment mandates. Combining Lipper investment objective categories aids the Board's management fee and total expense ratio comparisons by broadening the competitive group used for comparison and by reducing the number of universes to which various Fidelity funds are compared.
Management Fee. The Board considered two proprietary management fee comparisons for the 12-month periods shown in the chart below. The group of Lipper funds used by the Board for management fee comparisons is referred to below as the "Total Mapped Group." The Total Mapped Group is broader than the Lipper peer group used by the Board for performance comparisons because the Total Mapped Group combines several Lipper investment objective categories while the Lipper peer group does not. The Total Mapped Group comparison focuses on a fund's standing in terms of gross management fees before expense reimbursements or caps, and without giving effect to the fund's performance adjustment, relative to the total universe of funds with comparable investment mandates, regardless of whether their management fee structures also are comparable. Funds with comparable investment mandates offer exposure to similar types of securities. Funds with comparable management fee structures have similar management fee contractual arrangements (e.g., flat rate charged for advisory services, all-inclusive fee rate, etc.). "TMG %" represents the percentage of funds in the Total Mapped Group that had management fees that were lower than the fund's. For example, a hypothetical TMG % of 20% would mean that 80% of the funds in the Total Mapped Group had higher, and 20% had lower, management fees than the fund. The fund's actual TMG %s are in the chart below. The "Asset-Size Peer Group" (ASPG) comparison focuses on a fund's standing relative to a subset of non-Fidelity funds within the Total Mapped Group that are similar in size and management fee structure. For example, if a fund is in the first quartile of the ASPG, the fund's management fee ranks in the least expensive or lowest 25% of funds in the ASPG. The ASPG represents at least 15% of the funds in the Total Mapped Group with comparable asset size and management fee structures, subject to a minimum of 50 funds (or all funds in the Total Mapped Group if fewer than 50). Additional information, such as the ASPG quartile in which the fund's management fee rate ranked and the impact of the fund's performance adjustment, is also included in the chart and considered by the Board.
Annual Report
Fidelity International Small Cap Fund

Annual Report
Board Approval of Investment Advisory Contracts and
Management Fees - continued
The Board noted that the fund's management fee rate ranked below the median of its Total Mapped Group and below the median of its ASPG for 2013. The Board also noted the effect of the fund's positive performance adjustment on the fund's management fee ranking.
The Board also noted that, in August 2013, the ad hoc Committee on Management Fees was formed to conduct an in-depth review of the management fee rates of Fidelity's active equity mutual funds. The Committee focused on the following areas: (i) standard fee structures; (ii) research consumption and trading evolution; (iii) management fee competitiveness/profitability by category; and (iv) factors that drive institutional pricing.
Based on its review, the Board concluded that the fund's management fee is fair and reasonable in light of the services that the fund receives and the other factors considered.
Total Expense Ratio. In its review of each class's total expense ratio, the Board considered the fund's management fee as well as other fund or class expenses, as applicable, such as transfer agent fees, pricing and bookkeeping fees, fund-paid 12b-1 fees, and custodial, legal, and audit fees. The Board also noted the effects of any waivers and reimbursements on fees and expenses, as well as the impact of the fund's performance adjustment. As part of its review, the Board also considered the current and historical total expense ratios of each class of the fund compared to competitive fund median expenses. Each class of the fund is compared to those funds and classes in the Total Mapped Group (used by the Board for management fee comparisons) that have a similar sales load structure.
The Board noted that the total expense ratio of each of Class A, Class C, Institutional Class, and the retail class ranked below its competitive median for 2013 and the total expense ratio of each of Class T and Class B ranked above its competitive median for 2013. The Board considered that, in general, various factors can affect total expense ratios. The Board noted that the total expense ratio of Class T was above the competitive median primarily because of higher 12b-1 fees on Class T as compared to most competitor funds. Class T has a higher 12b-1 fee, but a lower front-end sales charge, than traditionally priced front-end sales charge classes. The Board considered that Class T is primarily sold load-waived in the retirement plan market where its 0.50% 12b-1 fee is comparable to competing no-load, higher 12b-1 fee classes designed specifically for retirement plans. The Board noted that the fund offers multiple classes, each of which has a different sales load and 12b-1 fee structure, and that the multiple structures are intended to offer a range of pricing options for the intermediary market. The Board also noted that the total expense ratios of the classes vary primarily by the level of their 12b-1 fees, although differences in transfer agent fees may also cause expenses to vary from class to class.
Annual Report
Fees Charged to Other Fidelity Clients. The Board also considered Fidelity fee structures and other information with respect to clients of Fidelity, such as other funds advised or subadvised by Fidelity, pension plan clients, and other institutional clients. The Board noted the findings of the 2013 ad hoc joint committee (created with the board of other Fidelity funds), which reviewed and compared Fidelity's institutional investment advisory business with its business of providing services to the Fidelity funds, including the differences in services provided, fees charged, and costs incurred, as well as competition in their respective marketplaces.
Based on its review of total expense ratios and fees charged to other Fidelity clients, the Board concluded that the total expense ratio of each class of the fund was reasonable, although in some cases above the median of the universe presented for comparison, in light of the services that the fund and its shareholders receive and the other factors considered.
Costs of the Services and Profitability. The Board considered the revenues earned and the expenses incurred by Fidelity in conducting the business of developing, marketing, distributing, managing, administering and servicing the fund and servicing the fund's shareholders. The Board also considered the level of Fidelity's profits in respect of all the Fidelity funds.
On an annual basis, Fidelity presents to the Board Fidelity's profitability for the fund. Fidelity calculates the profitability for each fund, as well as aggregate profitability for groups of Fidelity funds and all Fidelity funds, using a series of detailed revenue and cost allocation methodologies which originate with the books and records of Fidelity on which Fidelity's audited financial statements are based. The Audit Committee of the Board reviews any significant changes from the prior year's methodologies.
PricewaterhouseCoopers LLP (PwC), independent registered public accounting firm and auditor to Fidelity and certain Fidelity funds, has been engaged annually by the Board as part of the Board's assessment of Fidelity's profitability analysis. PwC's engagement includes the review and assessment of the methodologies used by Fidelity in determining the revenues and expenses attributable to Fidelity's mutual fund business, and completion of agreed-upon procedures in respect of the mathematical accuracy of fund profitability and its conformity to established allocation methodologies. After considering PwC's reports issued under the engagement and information provided by Fidelity, the Board concluded that while other allocation methods may also be reasonable, Fidelity's profitability methodologies are reasonable in all material respects.
The Board also reviewed Fidelity's non-fund businesses and fall-out benefits related to the mutual fund business as well as cases where Fidelity's affiliates may benefit from or be related to the fund's business.
Annual Report
Board Approval of Investment Advisory Contracts and
Management Fees - continued
The Board considered the costs of the services provided by and the profits realized by Fidelity in connection with the operation of the fund and was satisfied that the profitability was not excessive in the circumstances.
Economies of Scale. The Board considered whether there have been economies of scale in respect of the management of the Fidelity funds, whether the Fidelity funds (including the fund) have appropriately benefited from any such economies of scale, and whether there is potential for realization of any further economies of scale. The Board considered the extent to which the fund will benefit from economies of scale through increased services to the fund, through waivers or reimbursements, or through fee or expense ratio reductions. The Board also noted that in 2013, it and the boards of other Fidelity funds created an ad hoc committee (the Economies of Scale Committee) to analyze whether Fidelity attains economies of scale in respect of the management and servicing of the Fidelity funds, whether the Fidelity funds have appropriately benefited from such economies of scale, and whether there is potential for realization of any further economies of scale.
The Board recognized that the fund's management contract incorporates a "group fee" structure, which provides for lower group fee rates as total group assets increase, and for higher group fee rates as total group assets decrease (with "group assets" defined to include fund assets under FMR's management plus sector fund assets previously under FMR's management and currently managed by Fidelity SelectCo, LLC). FMR calculates the group fee rates based on a tiered asset "breakpoint" schedule that varies based on asset class. The Board considered that the group fee is designed to deliver the benefits of economies of scale to fund shareholders when total Fidelity fund assets increase, even if assets of any particular fund are unchanged or have declined, because some portion of Fidelity's costs are attributable to services provided to all Fidelity funds, and all funds benefit if those costs can be allocated among more assets. The Board concluded that, given the group fee structure, fund shareholders will benefit from lower management fees as group assets increase at the fund complex level, regardless of whether Fidelity achieves any such economies of scale.
The Board concluded, taking into account the analysis of the Economies of Scale Committee, that economies of scale, if any, are being appropriately shared between fund shareholders and Fidelity.
Additional Information Requested by the Board. In order to develop fully the factual basis for consideration of the Fidelity funds' Advisory Contracts, the Board requested and received additional information on certain topics, including: (i) fund performance trends and Fidelity's long-term strategies for certain funds; (ii) Fidelity's strategic marketing and product lineup goals; (iii) the methodology with respect to competitive fund data and peer group classifications; (iv) the arrangements with, and performance of, certain sub-advisers on behalf of the Fidelity funds, as well as certain proposed participating affiliate arrangements; (v) the realization of fall-out benefits in certain Fidelity business units; (vi) Fidelity's group fee structures, including the rationale for the individual fee rates of certain categories of funds and the definition of group assets; (vii) trends regarding industry use of performance fee structures and the performance adjustment methodologies applicable to the Fidelity funds; (viii) additional competitive analysis regarding the total expenses for certain classes; (ix) fund profitability methodology, including Fidelity's cost allocation methodology, and the impact of certain factors on fund profitability results; and (x) the process by which Fidelity determines sub-advisory fees for funds it advises.
Annual Report
Based on its evaluation of all of the conclusions noted above, and after considering all factors it believed relevant, the Board ultimately concluded that the advisory fee structures are fair and reasonable, and that the fund's Advisory Contracts should be renewed.
Annual Report
Investment Adviser
Fidelity Management & Research Company
Boston, MA
Investment Sub-Advisers
FMR Co., Inc.
Fidelity Management & Research
(U.K.) Inc.
Fidelity Management & Research
(Hong Kong) Limited
Fidelity Management & Research
(Japan) Limited
FIL Investment Advisors
FIL Investments (Japan) Limited
FIL Investment Advisors (UK)
Limited
General Distributor
Fidelity Distributors Corporation
Smithfield, RI
Transfer and Service Agents
Fidelity Investments Institutional
Operations Company, Inc.
Boston, MA
Fidelity Service Company, Inc.
Boston, MA
Custodian
The Bank of New York Mellon
New York, NY
The Fidelity Telephone Connection
Mutual Fund 24-Hour Service
Exchanges/Redemptions
and Account Assistance 1-800-544-6666
Product Information 1-800-544-8888
Retirement Accounts 1-800-544-4774
(8 a.m. - 9 p.m.)
TDD Service 1-800-544-0118
for the deaf and hearing impaired
(9 a.m. - 9 p.m. Eastern time)
Fidelity Automated Service
Telephone (FAST®)
1-800-544-5555
Automated line for quickest service
(Fidelity Investment logo)(registered trademark)
Corporate Headquarters
245 Summer St., Boston, MA 02210
www.fidelity.com
ISC-UANN-1214
1.793584.111
(Fidelity Investment logo)(registered trademark)
Fidelity Advisor®
International Small Cap Opportunities
Fund - Class A, Class T, Class B
and Class C
Annual Report
October 31, 2014
(Fidelity Cover Art)
Class A, Class T, Class B
and Class C are classes of
Fidelity® International
Small Cap Opportunities Fund
Contents
Performance | (Click Here) | How the fund has done over time. |
Management's Discussion of Fund Performance | (Click Here) | The Portfolio Manager's review of fund performance and strategy. |
Shareholder Expense Example | (Click Here) | An example of shareholder expenses. |
Investment Changes | (Click Here) | A summary of major shifts in the fund's investments over the past six months. |
Investments | (Click Here) | A complete list of the fund's investments with their market values. |
Financial Statements | (Click Here) | Statements of assets and liabilities, operations, and changes in net assets, as well as financial highlights. |
Notes | (Click Here) | Notes to the financial statements. |
Report of Independent Registered Public Accounting Firm | (Click Here) | |
Trustees and Officers | (Click Here) | |
Distributions | (Click Here) | |
Board Approval of Investment Advisory Contracts and Management Fees | (Click Here) | |
To view a fund's proxy voting guidelines and proxy voting record for the 12-month period ended June 30, visit http://www.fidelity.com/proxyvotingresults or visit the Securities and Exchange Commission's (SEC) web site at http://www.sec.gov. You may also call 1-877-208-0098 to request a free copy of the proxy voting guidelines.
Standard & Poor's, S&P and S&P 500 are registered service marks of The McGraw-Hill Companies, Inc. and have been licensed for use by Fidelity Distributors Corporation.
Other third-party marks appearing herein are the property of their respective owners.
All other marks appearing herein are registered or unregistered trademarks or service marks of FMR LLC or an affiliated company. © 2014 FMR LLC. All rights reserved.
Annual Report
This report and the financial statements contained herein are submitted for the general information of the shareholders of the fund. This report is not authorized for distribution to prospective investors in the fund unless preceded or accompanied by an effective prospectus.
A fund files its complete schedule of portfolio holdings with the SEC for the first and third quarters of each fiscal year on Form N-Q. Forms N-Q are available on the SEC's web site at http://www.sec.gov. A fund's Forms N-Q may be reviewed and copied at the SEC's Public Reference Room in Washington, DC. Information regarding the operation of the SEC's Public Reference Room may be obtained by calling 1-800-SEC-0330. For a complete list of a fund's portfolio holdings, view the most recent holdings listing, semiannual report, or annual report on Fidelity's web site at http://www.fidelity.com, http://www.advisor.fidelity.com, or http://www.401k.com, as applicable.
NOT FDIC INSURED • MAY LOSE VALUE • NO BANK GUARANTEE
Neither the fund nor Fidelity Distributors Corporation is a bank.
Annual Report
Average annual total return reflects the change in the value of an investment, assuming reinvestment of the class' distributions from dividend income and capital gains (the profits earned upon the sale of securities that have grown in value, if any) and assuming a constant rate of performance each year. The $10,000 table and the fund's returns do not reflect the deduction of taxes that a shareholder would pay on fund distributions or the redemption of fund shares. During periods of reimbursement by Fidelity, a fund's total return will be greater than it would be had the reimbursement not occurred. How a fund did yesterday is no guarantee of how it will do tomorrow. Returns reflect the conversion of Class B shares to Class A shares after a maximum of seven years.
Average Annual Total Returns
Periods ended October 31, 2014 | Past 1
year | Past 5
years | Life of
fundA |
Class A (incl. 5.75% sales charge) | -5.02% | 11.21% | 4.82% |
Class T (incl. 3.50% sales charge) | -2.97% | 11.45% | 4.81% |
Class B (incl. contingent deferred sales charge) B | -5.00% | 11.42% | 4.87% |
Class C (incl. contingent deferred sales charge) C | -0.96% | 11.69% | 4.69% |
A From August 2, 2005.
B Class B shares' contingent deferred sales charges included in the past one year, past five years, and life of fund total return figures are 5%, 2%, and 0%, respectively.
C Class C shares' contingent deferred sales charges included in the past one year, past five years, and life of fund total return figures are 1%, 0%, and 0%, respectively.
Annual Report
$10,000 Over Life of Fund
Let's say hypothetically that $10,000 was invested in Fidelity Advisor® International Small Cap Opportunities Fund - Class A on August 2, 2005, when the fund started, and the current 5.75% sales charge was paid. The chart shows how the value of your investment would have changed, and also shows how the MSCI EAFE Small Cap Index performed over the same period.
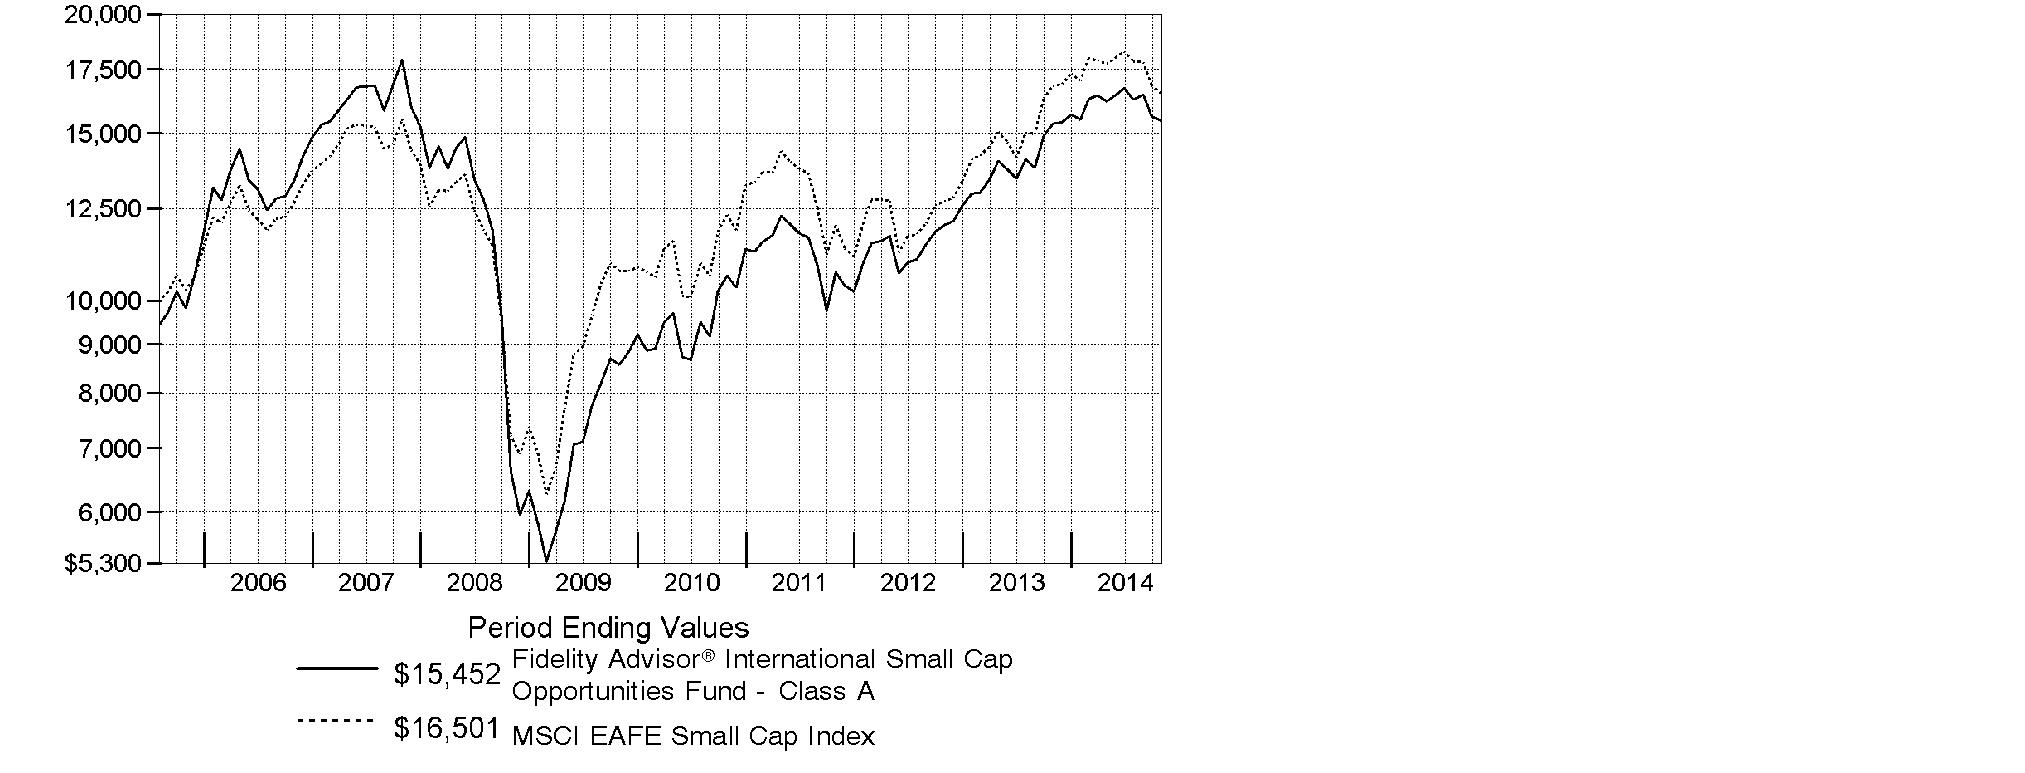
Annual Report
Market Recap: Global equities posted a healthy gain for the 12 months ending October 31, 2014, overcoming an October market decline driven by recessionary pressures in China and tepid growth in Europe. The MSCI ACWI (All Country World Index) Index rose 8.15%, helped by subdued market volatility for much of the period and supported by solid corporate earnings, especially in the United States. Stocks also benefited from easy monetary policies in Japan and the eurozone, as well as increased stimulus efforts in China. All but three of the 24 industry groups that compose the index marked a positive return. The U.S. (+17%) remained a pillar of strength, while a strongly rising dollar in the latter part of the period detracted from investors' returns in most non-U.S. markets. Canada (+5%) notched broad gains outside of its energy and materials sectors, as did Asia-Pacific ex Japan (+4%), led by investor enthusiasm for companies in India. The U.K., Europe and Japan, meanwhile, all underperformed. Among sectors, health care (+24%) led the index, with a strong contribution from the pharmaceuticals, biotechnology & life sciences industry. Information technology (+21%) also outperformed. Conversely, materials (-4%) and energy (-1%) lagged the index due to a higher supply of and lower demand for commodities.
Comments from Jed Weiss, Portfolio Manager of Fidelity Advisor® International Small Cap Opportunities Fund: For the year, the fund's Class A, Class T, Class B and Class C shares returned 0.78%, 0.55%, 0.00% and 0.03%, respectively (excluding sales charges), ahead of the benchmark MSCI EAFE Small Cap Index, which returned -1.91%. The fund especially benefited in relative terms from strong stock selection in Japan, the Netherlands and Sweden within Europe, and South Korea and South Africa within emerging markets. The fund's positioning in Denmark and stock selection in Turkey were minor negatives. On an individual basis, Fagerhult, a Swedish manufacturer of lighting fixtures, added the most value. Harmonic Drive Systems, a Japanese maker of gears for robotic arms, also contributed to the fund's results, as did South Korea's Coway and U.K.-based hotel company Intercontinental Hotel Group. In contrast, the biggest detractor was PriceSmart, a U.S.-based warehouse retailer that does nearly all of its business in Central America and Colombia. During the period, PriceSmart stock struggled as weak emerging-market economies and a maturing market in Central America made the business environment a little tougher. Another detractor was Goldcrest, a Japanese real estate company whose shares were hurt as pessimism grew about the Japanese economy. Of all the stocks mentioned, Goldcrest was the lone index member.
Annual Report
The views expressed above reflect those of the portfolio manager(s) only through the end of the period as stated on the cover of this report and do not necessarily represent the views of Fidelity or any other person in the Fidelity organization. Any such views are subject to change at any time based upon market or other conditions and Fidelity disclaims any responsibility to update such views. These views may not be relied on as investment advice and, because investment decisions for a Fidelity fund are based on numerous factors, may not be relied on as an indication of trading intent on behalf of any Fidelity fund.
Annual Report
Shareholder Expense Example
As a shareholder of the Fund, you incur two types of costs: (1) transaction costs, including sales charges (loads) on purchase payments or redemption proceeds, redemption fees and (2) ongoing costs, including management fees, distribution and/or service (12b-1) fees and other Fund expenses. This Example is intended to help you understand your ongoing costs (in dollars) of investing in the Fund and to compare these costs with the ongoing costs of investing in other mutual funds.
The Example is based on an investment of $1,000 invested at the beginning of the period and held for the entire period (May 1, 2014 to October 31, 2014).
Actual Expenses
The first line of the accompanying table for each class of the Fund provides information about actual account values and actual expenses. You may use the information in this line, together with the amount you invested, to estimate the expenses that you paid over the period. Simply divide your account value by $1,000.00 (for example, an $8,600 account value divided by $1,000.00 = 8.6), then multiply the result by the number in the first line for a class of the Fund under the heading entitled "Expenses Paid During Period" to estimate the expenses you paid on your account during this period. A small balance maintenance fee of $12.00 that is charged once a year may apply for certain accounts with a value of less than $2,000. This fee is not included in the table below. If it was, the estimate of expenses you paid during the period would be higher, and your ending account value lower, by this amount. In addition, the Fund, as a shareholder in the underlying Fidelity Central Funds, will indirectly bear its pro-rata share of the fees and expenses incurred by the underlying Fidelity Central Funds. These fees and expenses are not included in the Fund's annualized expense ratio used to calculate the expense estimate in the table below.
Hypothetical Example for Comparison Purposes
The second line of the accompanying table for each class of the Fund provides information about hypothetical account values and hypothetical expenses based on a Class' actual expense ratio and an assumed rate of return of 5% per year before expenses, which is not the Class' actual return. The hypothetical account values and expenses may not be used to estimate the actual ending account balance or expenses you paid for the period. You may use this information to compare the ongoing costs of investing in the Fund and other funds. To do so, compare this 5% hypothetical example with the 5% hypothetical examples that appear in the shareholder reports of the other funds. A small balance maintenance fee of $12.00 that is charged once a year may apply for certain accounts with a value of less than $2,000. This fee is not included in the table below. If it was, the estimate of expenses you paid during the period would be higher, and your ending account value lower, by this amount. In addition, the Fund, as a shareholder in the underlying Fidelity Central Funds, will indirectly bear its pro-rata share of the fees and expenses incurred by the underlying Fidelity Central Funds. These fees and expenses are not included in the Fund's annualized expense ratio used to calculate the expense estimate in the table below.
Please note that the expenses shown in the table are meant to highlight your ongoing costs only and do not reflect any transaction costs. Therefore, the second line of the table is useful in comparing ongoing costs only, and will not help you determine the relative total costs of owning different funds. In addition, if these transactional costs were included, your costs would have been higher.
Annual Report
| Annualized
Expense RatioB | Beginning
Account Value
May 1, 2014 | Ending
Account Value
October 31, 2014 | Expenses Paid
During Period*
May 1, 2014
to October 31, 2014 |
Class A | 1.63% | | | |
Actual | | $ 1,000.00 | $ 954.50 | $ 8.03 |
HypotheticalA | | $ 1,000.00 | $ 1,016.99 | $ 8.29 |
Class T | 1.88% | | | |
Actual | | $ 1,000.00 | $ 953.50 | $ 9.26 |
HypotheticalA | | $ 1,000.00 | $ 1,015.73 | $ 9.55 |
Class B | 2.36% | | | |
Actual | | $ 1,000.00 | $ 950.70 | $ 11.60 |
HypotheticalA | | $ 1,000.00 | $ 1,013.31 | $ 11.98 |
Class C | 2.37% | | | |
Actual | | $ 1,000.00 | $ 951.10 | $ 11.66 |
HypotheticalA | | $ 1,000.00 | $ 1,013.26 | $ 12.03 |
International Small Cap Opportunities | 1.30% | | | |
Actual | | $ 1,000.00 | $ 956.30 | $ 6.41 |
HypotheticalA | | $ 1,000.00 | $ 1,018.65 | $ 6.61 |
Institutional Class | 1.38% | | | |
Actual | | $ 1,000.00 | $ 955.70 | $ 6.80 |
HypotheticalA | | $ 1,000.00 | $ 1,018.25 | $ 7.02 |
A 5% return per year before expenses
B Annualized expense ratio reflects expenses net of applicable fee waivers.
* Expenses are equal to each Class' annualized expense ratio, multiplied by the average account value over the period, multiplied by 184/365 (to reflect the one-half year period).
Annual Report
Investment Changes (Unaudited)
Geographic Diversification (% of fund's net assets) |
As of October 31, 2014 |
 | Japan 27.3% | |
 | United Kingdom 20.5% | |
 | United States of America* 12.8% | |
 | Germany 4.8% | |
 | Italy 4.0% | |
 | Netherlands 3.5% | |
 | Sweden 2.7% | |
 | Korea (South) 2.4% | |
 | France 2.0% | |
 | Other 20.0% | |

Percentages are based on country or territory of incorporation and are adjusted for the effect of futures contracts, if applicable. |
* Includes Short-Term Investments and Net Other Assets (Liabilities). |
As of April 30, 2014 |
| Japan 22.8% | |
| United Kingdom 18.2% | |
| United States of America* 17.3% | |
| Germany 5.6% | |
| Italy 4.4% | |
| Netherlands 4.0% | |
| Sweden 2.5% | |
| France 2.3% | |
| Ireland 2.2% | |
| Other 20.7% | |

Percentages are based on country or territory of incorporation and are adjusted for the effect of futures contracts, if applicable. |
* Includes Short-Term Investments and Net Other Assets (Liabilities). |
Asset Allocation as of October 31, 2014 |
| % of fund's
net assets | % of fund's net assets
6 months ago |
Stocks | 97.2 | 93.6 |
Short-Term Investments and Net Other Assets (Liabilities) | 2.8 | 6.4 |
Top Ten Stocks as of October 31, 2014 |
| % of fund's
net assets | % of fund's net assets
6 months ago |
USS Co. Ltd. (Japan, Specialty Retail) | 2.3 | 2.0 |
Spirax-Sarco Engineering PLC (United Kingdom, Machinery) | 1.7 | 1.6 |
Unite Group PLC (United Kingdom, Real Estate Management & Development) | 1.6 | 1.6 |
SS&C Technologies Holdings, Inc. (United States of America, Software) | 1.6 | 1.1 |
Berendsen PLC (United Kingdom, Commercial Services & Supplies) | 1.5 | 0.9 |
CTS Eventim AG (Germany, Media) | 1.5 | 1.5 |
Azimut Holding SpA (Italy, Capital Markets) | 1.5 | 1.7 |
Fagerhult AB (Sweden, Electrical Equipment) | 1.5 | 1.2 |
Interpump Group SpA (Italy, Machinery) | 1.4 | 1.6 |
OSG Corp. (Japan, Machinery) | 1.4 | 1.2 |
| 16.0 | |
Market Sectors as of October 31, 2014 |
| % of fund's
net assets | % of fund's net assets
6 months ago |
Industrials | 20.5 | 21.0 |
Financials | 19.4 | 19.3 |
Consumer Discretionary | 18.4 | 16.9 |
Materials | 10.7 | 9.8 |
Consumer Staples | 9.6 | 9.1 |
Information Technology | 9.2 | 7.9 |
Health Care | 6.4 | 6.7 |
Energy | 3.0 | 2.9 |
Annual Report
Investments October 31, 2014
Showing Percentage of Net Assets
Common Stocks - 96.3% |
| Shares | | Value |
Australia - 1.7% |
DuluxGroup Ltd. | 548,583 | | $ 2,592,535 |
Imdex Ltd. (a) | 1,779,471 | | 942,244 |
RCG Corp. Ltd. | 3,726,715 | | 2,015,918 |
Sydney Airport unit | 795,862 | | 3,094,100 |
TFS Corp. Ltd. | 1,926,002 | | 2,669,496 |
TOTAL AUSTRALIA | | 11,314,293 |
Austria - 1.2% |
Andritz AG | 117,900 | | 5,691,191 |
Zumtobel AG | 144,181 | | 2,541,270 |
TOTAL AUSTRIA | | 8,232,461 |
Belgium - 1.2% |
Gimv NV | 66,688 | | 3,029,415 |
KBC Ancora (a) | 172,738 | | 4,997,132 |
TOTAL BELGIUM | | 8,026,547 |
Bermuda - 1.1% |
Lazard Ltd. Class A | 61,499 | | 3,026,366 |
Petra Diamonds Ltd. (a) | 787,509 | | 2,091,232 |
Vostok Nafta Investment Ltd. SDR (a) | 316,909 | | 2,029,996 |
TOTAL BERMUDA | | 7,147,594 |
Brazil - 0.3% |
Arezzo Industria e Comercio SA | 169,900 | | 1,967,848 |
T4F Entretenimento SA (a) | 19,200 | | 21,696 |
TOTAL BRAZIL | | 1,989,544 |
British Virgin Islands - 0.4% |
Gem Diamonds Ltd. (a) | 1,047,996 | | 2,602,734 |
Canada - 1.6% |
Pason Systems, Inc. | 266,200 | | 6,370,094 |
ShawCor Ltd. Class A | 92,400 | | 4,070,503 |
TOTAL CANADA | | 10,440,597 |
Cayman Islands - 0.2% |
58.com, Inc. ADR | 30,600 | | 1,210,842 |
Denmark - 1.7% |
Jyske Bank A/S (Reg.) (a) | 115,827 | | 6,240,364 |
Spar Nord Bank A/S | 521,369 | | 5,266,797 |
TOTAL DENMARK | | 11,507,161 |
Common Stocks - continued |
| Shares | | Value |
Finland - 0.7% |
Tikkurila Oyj | 219,753 | | $ 4,538,320 |
France - 2.0% |
Coface SA | 141,800 | | 1,766,305 |
Laurent-Perrier Group SA | 31,163 | | 2,499,322 |
Saft Groupe SA | 57,516 | | 1,708,205 |
Vetoquinol SA | 56,184 | | 2,534,651 |
Virbac SA | 20,052 | | 4,484,121 |
TOTAL FRANCE | | 12,992,604 |
Germany - 3.9% |
alstria office REIT-AG | 249,000 | | 3,087,268 |
CompuGroup Medical AG | 269,478 | | 6,179,843 |
CTS Eventim AG | 372,280 | | 9,815,637 |
Fielmann AG | 96,874 | | 6,316,320 |
TOTAL GERMANY | | 25,399,068 |
Greece - 0.7% |
Titan Cement Co. SA (Reg.) | 196,480 | | 4,355,613 |
India - 0.5% |
Jyothy Laboratories Ltd. (a) | 857,717 | | 3,498,544 |
Ireland - 1.8% |
FBD Holdings PLC | 240,328 | | 4,065,755 |
James Hardie Industries PLC: | | | |
CDI | 165,775 | | 1,768,263 |
sponsored ADR | 112,915 | | 6,021,757 |
TOTAL IRELAND | | 11,855,775 |
Israel - 1.7% |
Azrieli Group | 90,005 | | 2,889,292 |
Ituran Location & Control Ltd. | 84,286 | | 1,727,020 |
Sarine Technologies Ltd. | 1,308,000 | | 3,033,378 |
Strauss Group Ltd. | 214,344 | | 3,457,298 |
TOTAL ISRAEL | | 11,106,988 |
Italy - 4.0% |
Azimut Holding SpA | 411,997 | | 9,623,721 |
Beni Stabili SpA SIIQ | 10,445,675 | | 7,192,954 |
Interpump Group SpA | 722,943 | | 9,421,943 |
TOTAL ITALY | | 26,238,618 |
Japan - 27.3% |
Air Water, Inc. | 131,000 | | 2,088,180 |
Common Stocks - continued |
| Shares | | Value |
Japan - continued |
Aozora Bank Ltd. | 2,035,000 | | $ 7,152,839 |
Artnature, Inc. (d) | 292,600 | | 3,956,987 |
Asahi Co. Ltd. | 241,100 | | 2,680,751 |
Autobacs Seven Co. Ltd. | 212,000 | | 3,110,003 |
Azbil Corp. | 223,100 | | 5,380,163 |
Broadleaf Co. Ltd. | 51,000 | | 806,063 |
Coca-Cola Central Japan Co. Ltd. | 245,400 | | 4,415,498 |
Cosmos Pharmaceutical Corp. | 31,300 | | 4,475,248 |
Daiichikosho Co. Ltd. | 79,400 | | 2,003,776 |
Daikokutenbussan Co. Ltd. | 168,700 | | 4,908,757 |
Glory Ltd. | 96,800 | | 2,494,487 |
Goldcrest Co. Ltd. | 316,330 | | 5,723,003 |
Harmonic Drive Systems, Inc. | 260,700 | | 3,365,610 |
Iwatsuka Confectionary Co. Ltd. | 63,300 | | 3,419,313 |
Kobayashi Pharmaceutical Co. Ltd. | 72,500 | | 4,475,182 |
Koshidaka Holdings Co. Ltd. | 141,200 | | 2,411,118 |
Kyoto Kimono Yuzen Co. Ltd. | 78,500 | | 707,348 |
Lasertec Corp. | 220,900 | | 2,763,839 |
Medikit Co. Ltd. | 71,200 | | 2,218,561 |
Meiko Network Japan Co. Ltd. | 112,600 | | 1,266,143 |
Miraial Co. Ltd. | 73,200 | | 1,127,074 |
Nabtesco Corp. | 185,800 | | 4,496,454 |
Nagaileben Co. Ltd. | 292,600 | | 5,624,057 |
ND Software Co. Ltd. | 35,491 | | 636,001 |
Nihon M&A Center, Inc. | 68,900 | | 1,980,136 |
Nihon Parkerizing Co. Ltd. | 334,000 | | 7,972,492 |
Nippon Seiki Co. Ltd. | 143,000 | | 3,046,346 |
NS Tool Co. Ltd. | 35,600 | | 408,889 |
OBIC Co. Ltd. | 189,800 | | 6,775,679 |
OSG Corp. | 568,100 | | 9,263,550 |
Paramount Bed Holdings Co. Ltd. | 60,700 | | 1,726,444 |
San-Ai Oil Co. Ltd. | 381,000 | | 2,637,316 |
Seven Bank Ltd. | 2,163,800 | | 9,036,897 |
SHO-BOND Holdings Co. Ltd. | 193,700 | | 7,484,619 |
Shoei Co. Ltd. | 249,100 | | 3,806,780 |
SK Kaken Co. Ltd. | 34,000 | | 2,602,107 |
Software Service, Inc. | 62,900 | | 2,395,403 |
Techno Medica Co. Ltd. | 79,400 | | 1,719,455 |
TFP Consulting Group Co. Ltd. | 41,700 | | 1,216,523 |
The Nippon Synthetic Chemical Industry Co. Ltd. | 436,000 | | 2,662,060 |
TKC Corp. | 156,900 | | 3,080,143 |
Tocalo Co. Ltd. | 117,000 | | 2,207,069 |
Common Stocks - continued |
| Shares | | Value |
Japan - continued |
Tsutsumi Jewelry Co. Ltd. | 81,000 | | $ 1,992,316 |
USS Co. Ltd. | 955,800 | | 15,042,372 |
Workman Co. Ltd. | 79,400 | | 4,149,861 |
Yamato Kogyo Co. Ltd. | 217,900 | | 7,058,866 |
TOTAL JAPAN | | 179,971,778 |
Korea (South) - 2.4% |
Bgf Retail (a) | 58,838 | | 3,723,768 |
Coway Co. Ltd. | 114,533 | | 8,698,345 |
Leeno Industrial, Inc. | 89,751 | | 3,554,305 |
TOTAL KOREA (SOUTH) | | 15,976,418 |
Mexico - 0.6% |
Consorcio ARA S.A.B. de CV (a) | 9,235,478 | | 4,252,109 |
Netherlands - 3.5% |
Aalberts Industries NV | 319,501 | | 8,506,130 |
ASM International NV (depositary receipt) | 63,400 | | 2,075,082 |
Heijmans NV (Certificaten Van Aandelen) | 365,133 | | 4,960,020 |
VastNed Retail NV | 164,729 | | 7,521,282 |
TOTAL NETHERLANDS | | 23,062,514 |
Philippines - 0.5% |
Jollibee Food Corp. | 727,170 | | 3,169,279 |
South Africa - 1.7% |
Alexander Forbes Group Holding (a) | 2,593,721 | | 2,022,349 |
Clicks Group Ltd. | 878,287 | | 5,980,131 |
Nampak Ltd. | 795,900 | | 3,245,008 |
TOTAL SOUTH AFRICA | | 11,247,488 |
Spain - 1.0% |
Prosegur Compania de Seguridad SA (Reg.) | 1,102,590 | | 6,466,406 |
Sweden - 2.7% |
Fagerhult AB | 512,812 | | 9,444,883 |
Intrum Justitia AB | 273,334 | | 8,121,379 |
TOTAL SWEDEN | | 17,566,262 |
Taiwan - 0.3% |
Addcn Technology Co. Ltd. | 210,000 | | 2,019,633 |
Common Stocks - continued |
| Shares | | Value |
Turkey - 1.1% |
Albaraka Turk Katilim Bankasi A/S | 3,666,046 | | $ 2,589,563 |
Coca-Cola Icecek Sanayi A/S | 206,362 | | 4,707,243 |
TOTAL TURKEY | | 7,296,806 |
United Kingdom - 20.5% |
Advanced Computer Software Group PLC | 1,223,900 | | 2,114,503 |
Babcock International Group PLC | 164,700 | | 2,885,003 |
Bellway PLC | 327,072 | | 9,151,067 |
Berendsen PLC | 613,663 | | 9,914,935 |
Britvic PLC | 511,971 | | 5,573,295 |
Dechra Pharmaceuticals PLC | 351,050 | | 4,256,736 |
Derwent London PLC | 101,710 | | 4,833,980 |
Elementis PLC | 1,558,710 | | 6,580,263 |
Great Portland Estates PLC | 621,789 | | 6,828,450 |
H&T Group PLC | 264,353 | | 672,388 |
Hilton Food Group PLC | 217,188 | | 1,302,884 |
Informa PLC | 901,781 | | 6,938,805 |
InterContinental Hotel Group PLC ADR | 141,931 | | 5,394,797 |
ITE Group PLC | 979,734 | | 2,668,295 |
Johnson Matthey PLC | 96,475 | | 4,589,806 |
Meggitt PLC | 640,590 | | 4,622,655 |
Persimmon PLC | 171,863 | | 4,022,215 |
Rotork PLC | 119,700 | | 4,892,419 |
Shaftesbury PLC | 687,673 | | 7,876,505 |
Spectris PLC | 279,178 | | 8,047,751 |
Spirax-Sarco Engineering PLC | 238,421 | | 10,869,959 |
Ted Baker PLC | 133,700 | | 4,159,964 |
Ultra Electronics Holdings PLC | 218,058 | | 6,087,038 |
Unite Group PLC | 1,534,757 | | 10,483,494 |
TOTAL UNITED KINGDOM | | 134,767,207 |
United States of America - 10.0% |
ANSYS, Inc. (a) | 21,085 | | 1,656,438 |
Autoliv, Inc. | 57,100 | | 5,238,354 |
Broadridge Financial Solutions, Inc. | 48,905 | | 2,148,397 |
Dril-Quip, Inc. (a) | 39,595 | | 3,561,570 |
Evercore Partners, Inc. Class A | 56,600 | | 2,930,182 |
Kennedy-Wilson Holdings, Inc. | 250,229 | | 6,778,704 |
Martin Marietta Materials, Inc. | 52,020 | | 6,082,178 |
Mohawk Industries, Inc. (a) | 47,800 | | 6,789,512 |
Oceaneering International, Inc. | 42,502 | | 2,986,616 |
PriceSmart, Inc. | 75,199 | | 6,694,967 |
Common Stocks - continued |
| Shares | | Value |
United States of America - continued |
ResMed, Inc. (d) | 49,100 | | $ 2,564,002 |
Solera Holdings, Inc. | 152,056 | | 7,899,309 |
SS&C Technologies Holdings, Inc. (a) | 212,058 | | 10,246,643 |
TOTAL UNITED STATES OF AMERICA | | 65,576,872 |
TOTAL COMMON STOCKS (Cost $519,760,738) |
633,830,075
|
Nonconvertible Preferred Stocks - 0.9% |
| | | |
Germany - 0.9% |
Sartorius AG (non-vtg.)
(Cost $5,714,273) | 50,279 | |
5,481,620
|
Money Market Funds - 2.7% |
| | | |
Fidelity Cash Central Fund, 0.11% (b) | 16,109,819 | | 16,109,819 |
Fidelity Securities Lending Cash Central Fund, 0.11% (b)(c) | 1,839,312 | | 1,839,312 |
TOTAL MONEY MARKET FUNDS (Cost $17,949,131) |
17,949,131
|
TOTAL INVESTMENT PORTFOLIO - 99.9% (Cost $543,424,142) | | 657,260,826 |
NET OTHER ASSETS (LIABILITIES) - 0.1% | | 950,326 |
NET ASSETS - 100% | $ 658,211,152 |
Legend |
(a) Non-income producing |
(b) Affiliated fund that is generally available only to investment companies and other accounts managed by Fidelity Investments. The rate quoted is the annualized seven-day yield of the fund at period end. A complete unaudited listing of the fund's holdings as of its most recent quarter end is available upon request. In addition, each Fidelity Central Fund's financial statements, which are not covered by the Fund's Report of Independent Registered Public Accounting Firm, are available on the SEC's website or upon request. |
(c) Investment made with cash collateral received from securities on loan. |
(d) Security or a portion of the security is on loan at period end. |
Affiliated Central Funds |
Information regarding fiscal year to date income earned by the Fund from investments in Fidelity Central Funds is as follows: |
Fund | Income earned |
Fidelity Cash Central Fund | $ 30,975 |
Fidelity Securities Lending Cash Central Fund | 171,600 |
Total | $ 202,575 |
Other Information |
Categorizations in the Schedule of Investments are based on country or territory of incorporation. |
The following is a summary of the inputs used, as of October 31, 2014, involving the Fund's assets and liabilities carried at fair value. The inputs or methodology used for valuing securities may not be an indication of the risk associated with investing in those securities. For more information on valuation inputs, and their aggregation into the levels used in the tables below, please refer to the Investment Valuation section in the accompanying Notes to Financial Statements. |
Valuation Inputs at Reporting Date: |
Description | Total | Level 1 | Level 2 | Level 3 |
Investments in Securities: | | | | |
Equities: | | | | |
Consumer Discretionary | $ 120,836,975 | $ 75,434,964 | $ 45,402,011 | $ - |
Consumer Staples | 63,088,437 | 33,938,908 | 29,149,529 | - |
Energy | 19,626,099 | 16,988,783 | 2,637,316 | - |
Financials | 127,665,001 | 105,752,262 | 21,912,739 | - |
Health Care | 41,935,397 | 27,615,476 | 14,319,921 | - |
Industrials | 135,178,251 | 96,133,436 | 39,044,815 | - |
Information Technology | 60,518,381 | 38,565,787 | 21,952,594 | - |
Materials | 70,463,154 | 40,106,911 | 30,356,243 | - |
Money Market Funds | 17,949,131 | 17,949,131 | - | - |
Total Investments in Securities: | $ 657,260,826 | $ 452,485,658 | $ 204,775,168 | $ - |
The following is a summary of transfers between Level 1 and Level 2 for the period ended October 31, 2014. Transfers are assumed to have occurred at the beginning of the period, and are primarily attributable to the valuation techniques used for foreign equity securities, as discussed in the accompanying Notes to Financial Statements: |
Transfers | Total |
Level 1 to Level 2 | $ 13,207,974 |
Level 2 to Level 1 | $ 0 |
See accompanying notes which are an integral part of the financial statements.
Annual Report
Statement of Assets and Liabilities
| October 31, 2014 |
| | |
Assets | | |
Investment in securities, at value (including securities loaned of $1,799,362) - See accompanying schedule: Unaffiliated issuers (cost $525,475,011) | $ 639,311,695 | |
Fidelity Central Funds (cost $17,949,131) | 17,949,131 | |
Total Investments (cost $543,424,142) | | $ 657,260,826 |
Foreign currency held at value (cost $181,591) | | 181,589 |
Receivable for investments sold | | 752,361 |
Receivable for fund shares sold | | 2,224,294 |
Dividends receivable | | 1,600,124 |
Distributions receivable from Fidelity Central Funds | | 5,338 |
Prepaid expenses | | 2,323 |
Other receivables | | 3,053 |
Total assets | | 662,029,908 |
| | |
Liabilities | | |
Payable for investments purchased | $ 376,673 | |
Payable for fund shares redeemed | 823,331 | |
Accrued management fee | 513,986 | |
Distribution and service plan fees payable | 16,541 | |
Other affiliated payables | 159,593 | |
Other payables and accrued expenses | 89,320 | |
Collateral on securities loaned, at value | 1,839,312 | |
Total liabilities | | 3,818,756 |
| | |
Net Assets | | $ 658,211,152 |
Net Assets consist of: | | |
Paid in capital | | $ 828,641,898 |
Undistributed net investment income | | 3,990,517 |
Accumulated undistributed net realized gain (loss) on investments and foreign currency transactions | | (288,211,957) |
Net unrealized appreciation (depreciation) on investments and assets and liabilities in foreign currencies | | 113,790,694 |
Net Assets | | $ 658,211,152 |
See accompanying notes which are an integral part of the financial statements.
Annual Report
Statement of Assets and Liabilities - continued
| October 31, 2014 |
| | |
Calculation of Maximum Offering Price Class A:
Net Asset Value and redemption price per share ($25,041,102 ÷ 1,834,238 shares) | | $ 13.65 |
| | |
Maximum offering price per share (100/94.25 of $13.65) | | $ 14.48 |
Class T:
Net Asset Value and redemption price per share ($9,913,278 ÷ 732,914 shares) | | $ 13.53 |
| | |
Maximum offering price per share (100/96.50 of $13.53) | | $ 14.02 |
Class B:
Net Asset Value and offering price per share ($744,419 ÷ 55,919 shares)A | | $ 13.31 |
| | |
Class C:
Net Asset Value and offering price per share ($8,437,794 ÷ 637,935 shares)A | | $ 13.23 |
| | |
International Small Cap Opportunities:
Net Asset Value, offering price and redemption price per share ($584,252,917 ÷ 42,348,080 shares) | | $ 13.80 |
| | |
Institutional Class:
Net Asset Value, offering price and redemption price per share ($29,821,642 ÷ 2,159,960 shares) | | $ 13.81 |
A Redemption price per share is equal to net asset value less any applicable contingent deferred sales charge.
See accompanying notes which are an integral part of the financial statements.
Annual Report
Financial Statements - continued
Statement of Operations
| Year ended October 31, 2014 |
| | |
Investment Income | | |
Dividends | | $ 13,633,581 |
Income from Fidelity Central Funds | | 202,575 |
Income before foreign taxes withheld | | 13,836,156 |
Less foreign taxes withheld | | (1,157,520) |
Total income | | 12,678,636 |
| | |
Expenses | | |
Management fee
Basic fee | $ 5,510,809 | |
Performance adjustment | 826,188 | |
Transfer agent fees | 1,519,749 | |
Distribution and service plan fees | 212,488 | |
Accounting and security lending fees | 322,189 | |
Custodian fees and expenses | 141,145 | |
Independent trustees' compensation | 2,625 | |
Registration fees | 94,354 | |
Audit | 71,780 | |
Legal | 2,138 | |
Miscellaneous | 3,926 | |
Total expenses before reductions | 8,707,391 | |
Expense reductions | (4,405) | 8,702,986 |
Net investment income (loss) | | 3,975,650 |
Realized and Unrealized Gain (Loss) Net realized gain (loss) on: | | |
Investment securities: | | |
Unaffiliated issuers | 27,597,575 | |
Foreign currency transactions | (131,152) | |
Total net realized gain (loss) | | 27,466,423 |
Change in net unrealized appreciation (depreciation) on: Investment securities | (28,619,605) | |
Assets and liabilities in foreign currencies | (41,552) | |
Total change in net unrealized appreciation (depreciation) | | (28,661,157) |
Net gain (loss) | | (1,194,734) |
Net increase (decrease) in net assets resulting from operations | | $ 2,780,916 |
See accompanying notes which are an integral part of the financial statements.
Annual Report
Statement of Changes in Net Assets
| Year ended
October 31,
2014 | Year ended
October 31,
2013 |
Increase (Decrease) in Net Assets | | |
Operations | | |
Net investment income (loss) | $ 3,975,650 | $ 3,604,267 |
Net realized gain (loss) | 27,466,423 | 37,116,732 |
Change in net unrealized appreciation (depreciation) | (28,661,157) | 71,945,657 |
Net increase (decrease) in net assets resulting from operations | 2,780,916 | 112,666,656 |
Distributions to shareholders from net investment income | (3,580,601) | (3,311,096) |
Distributions to shareholders from net realized gain | (3,233,620) | (171,255) |
Total distributions | (6,814,221) | (3,482,351) |
Share transactions - net increase (decrease) | 97,201,705 | 81,271,586 |
Redemption fees | 84,800 | 56,441 |
Total increase (decrease) in net assets | 93,253,200 | 190,512,332 |
| | |
Net Assets | | |
Beginning of period | 564,957,952 | 374,445,620 |
End of period (including undistributed net investment income of $3,990,517 and undistributed net investment income of $3,595,468, respectively) | $ 658,211,152 | $ 564,957,952 |
See accompanying notes which are an integral part of the financial statements.
Annual Report
Financial Highlights - Class A
Years ended October 31, | 2014 | 2013 | 2012 | 2011 | 2010 |
Selected Per-Share Data | | | | | |
Net asset value, beginning of period | $ 13.68 | $ 10.78 | $ 9.75 | $ 9.82 | $ 8.07 |
Income from Investment Operations | | | | | |
Net investment income (loss) C | .05 | .07 | .08 | .15F | .06 |
Net realized and unrealized gain (loss) | .05 | 2.91 | 1.07 | (.07) | 1.85 |
Total from investment operations | .10 | 2.98 | 1.15 | .08 | 1.91 |
Distributions from net investment income | (.06) | (.08) | (.11) | (.11) | (.07) |
Distributions from net realized gain | (.08) | (.01) | (.01) | (.04) | (.09) |
Total distributions | (.13) J | (.08) I | (.12) | (.15) | (.16) |
Redemption fees added to paid in capital C, H | - | - | - | - | - |
Net asset value, end of period | $ 13.65 | $ 13.68 | $ 10.78 | $ 9.75 | $ 9.82 |
Total ReturnA, B | .78% | 27.85% | 12.00% | .81% | 24.05% |
Ratios to Average Net Assets D, G | | | | | |
Expenses before reductions | 1.63% | 1.70% | 1.75% | 1.34% | 1.16% |
Expenses net of fee waivers, if any | 1.63% | 1.65% | 1.65% | 1.33% | 1.16% |
Expenses net of all reductions | 1.63% | 1.64% | 1.64% | 1.32% | 1.15% |
Net investment income (loss) | .33% | .59% | .85% | 1.44% F | .74% |
Supplemental Data | | | | | |
Net assets, end of period (000 omitted) | $ 25,041 | $ 22,052 | $ 18,194 | $ 18,686 | $ 20,228 |
Portfolio turnover rateE | 18% | 31% | 28% | 24% | 49% |
A Total returns would have been lower if certain expenses had not been reduced during the applicable periods shown.
B Total returns do not include the effect of the sales charges.
C Calculated based on average shares outstanding during the period.
D Fees and expenses of any underlying Fidelity Central Funds are not included in the Fund's expense ratio. The Fund indirectly bears its proportionate share of the expenses of any underlying Fidelity Central Funds.
E Amount does not include the portfolio activity of any underlying Fidelity Central Funds.
F Investment income per share reflects a large, non-recurring dividend which amounted to $.06 per share. Excluding this non-recurring dividend, the ratio of net investment income (loss) to average net assets would have been .80%.
G Expense ratios reflect operating expenses of the class. Expenses before reductions do not reflect amounts reimbursed by the investment adviser or reductions from brokerage service arrangements or reductions from other expense offset arrangements and do not represent the amount paid by the class during periods when reimbursements or reductions occur. Expenses net of fee waivers reflect expenses after reimbursement by the investment adviser but prior to reductions from brokerage service arrangements or other expense offset arrangements. Expenses net of all reductions represent the net expenses paid by the class.
H Amount represents less than $.01 per share.
I Total distributions of $.08 per share is comprised of distributions from net investment income of $.077 and distributions from net realized gain of $.005 per share.
J Total distributions of $.13 per share is comprised of distributions from net investment income of $.055 and distributions from net realized gain of $.079 per share.
See accompanying notes which are an integral part of the financial statements.
Annual Report
Financial Highlights - Class T
Years ended October 31, | 2014 | 2013 | 2012 | 2011 | 2010 |
Selected Per-Share Data | | | | | |
Net asset value, beginning of period | $ 13.56 | $ 10.69 | $ 9.66 | $ 9.72 | $ 8.00 |
Income from Investment Operations | | | | | |
Net investment income (loss) C | .01 | .04 | .06 | .12F | .04 |
Net realized and unrealized gain (loss) | .06 | 2.89 | 1.06 | (.06) | 1.83 |
Total from investment operations | .07 | 2.93 | 1.12 | .06 | 1.87 |
Distributions from net investment income | (.02) | (.05) | (.08) | (.08) | (.06) |
Distributions from net realized gain | (.08) | (.01) | (.01) | (.04) | (.09) |
Total distributions | (.10) | (.06) | (.09) | (.12) | (.15) |
Redemption fees added to paid in capital C, H | - | - | - | - | - |
Net asset value, end of period | $ 13.53 | $ 13.56 | $ 10.69 | $ 9.66 | $ 9.72 |
Total ReturnA, B | .55% | 27.53% | 11.72% | .60% | 23.65% |
Ratios to Average Net Assets D, G | | | | | |
Expenses before reductions | 1.89% | 1.96% | 2.02% | 1.60% | 1.43% |
Expenses net of fee waivers, if any | 1.89% | 1.90% | 1.90% | 1.60% | 1.43% |
Expenses net of all reductions | 1.89% | 1.89% | 1.89% | 1.59% | 1.41% |
Net investment income (loss) | .07% | .34% | .60% | 1.17%F | .48% |
Supplemental Data | | | | | |
Net assets, end of period (000 omitted) | $ 9,913 | $ 9,634 | $ 8,169 | $ 8,701 | $ 11,202 |
Portfolio turnover rateE | 18% | 31% | 28% | 24% | 49% |
A Total returns would have been lower if certain expenses had not been reduced during the applicable periods shown.
B Total returns do not include the effect of the sales charges.
C Calculated based on average shares outstanding during the period.
D Fees and expenses of any underlying Fidelity Central Funds are not included in the Fund's expense ratio. The Fund indirectly bears its proportionate share of the expenses of any underlying Fidelity Central Funds.
E Amount does not include the portfolio activity of any underlying Fidelity Central Funds.
F Investment income per share reflects a large, non-recurring dividend which amounted to $.06 per share. Excluding this non-recurring dividend, the ratio of net investment income (loss) to average net assets would have been .54%.
G Expense ratios reflect operating expenses of the class. Expenses before reductions do not reflect amounts reimbursed by the investment adviser or reductions from brokerage service arrangements or reductions from other expense offset arrangements and do not represent the amount paid by the class during periods when reimbursements or reductions occur. Expenses net of fee waivers reflect expenses after reimbursement by the investment adviser but prior to reductions from brokerage service arrangements or other expense offset arrangements. Expenses net of all reductions represent the net expenses paid by the class.
H Amount represents less than $.01 per share.
See accompanying notes which are an integral part of the financial statements.
Annual Report
Financial Highlights - Class B
Years ended October 31, | 2014 | 2013 | 2012 | 2011 | 2010 |
Selected Per-Share Data | | | | | |
Net asset value, beginning of period | $ 13.31 | $ 10.50 | $ 9.48 | $ 9.54 | $ 7.87 |
Income from Investment Operations | | | | | |
Net investment income (loss) C | (.06) | (.02) | .01 | .07F | -H |
Net realized and unrealized gain (loss) | .06 | 2.84 | 1.05 | (.06) | 1.79 |
Total from investment operations | - | 2.82 | 1.06 | .01 | 1.79 |
Distributions from net investment income | - | -H | (.03) | (.06) | (.03) |
Distributions from net realized gain | - | (.01) | (.01) | (.02) | (.09) |
Total distributions | - | (.01) | (.04) | (.07)I | (.12) |
Redemption fees added to paid in capital C, H | - | - | - | - | - |
Net asset value, end of period | $ 13.31 | $ 13.31 | $ 10.50 | $ 9.48 | $ 9.54 |
Total ReturnA, B | -% | 26.86% | 11.21% | .10% | 23.03% |
Ratios to Average Net Assets D, G | | | | | |
Expenses before reductions | 2.38% | 2.46% | 2.50% | 2.09% | 1.91% |
Expenses net of fee waivers, if any | 2.38% | 2.40% | 2.40% | 2.09% | 1.91% |
Expenses net of all reductions | 2.38% | 2.39% | 2.39% | 2.07% | 1.90% |
Net investment income (loss) | (.43)% | (.16)% | .10% | .68%F | (.01)% |
Supplemental Data | | | | | |
Net assets, end of period (000 omitted) | $ 744 | $ 1,410 | $ 1,966 | $ 2,293 | $ 2,902 |
Portfolio turnover rateE | 18% | 31% | 28% | 24% | 49% |
A Total returns would have been lower if certain expenses had not been reduced during the applicable periods shown.
B Total returns do not include the effect of the contingent deferred sales charge.
C Calculated based on average shares outstanding during the period.
D Fees and expenses of any underlying Fidelity Central Funds are not included in the Fund's expense ratio. The Fund indirectly bears its proportionate share of the expenses of any underlying Fidelity Central Funds.
E Amount does not include the portfolio activity of any underlying Fidelity Central Funds.
F Investment income per share reflects a large, non-recurring dividend which amounted to $.06 per share. Excluding this non-recurring dividend, the ratio of net investment income (loss) to average net assets would have been .05%.
G Expense ratios reflect operating expenses of the class. Expenses before reductions do not reflect amounts reimbursed by the investment adviser or reductions from brokerage service arrangements or reductions from other expense offset arrangements and do not represent the amount paid by the class during periods when reimbursements or reductions occur. Expenses net of fee waivers reflect expenses after reimbursement by the investment adviser but prior to reductions from brokerage service arrangements or other expense offset arrangements. Expenses net of all reductions represent the net expenses paid by the class.
H Amount represents less than $.01 per share.
I Total distributions of $.07 per share is comprised of distributions from net investment income of $.058 and distributions from net realized gain of $.015 per share.
See accompanying notes which are an integral part of the financial statements.
Annual Report
Financial Highlights - Class C
Years ended October 31, | 2014 | 2013 | 2012 | 2011 | 2010 |
Selected Per-Share Data | | | | | |
Net asset value, beginning of period | $ 13.28 | $ 10.48 | $ 9.47 | $ 9.53 | $ 7.86 |
Income from Investment Operations | | | | | |
Net investment income (loss) C | (.06) | (.02) | .01 | .07F | -H |
Net realized and unrealized gain (loss) | .06 | 2.84 | 1.04 | (.06) | 1.79 |
Total from investment operations | - | 2.82 | 1.05 | .01 | 1.79 |
Distributions from net investment income | - | (.01) | (.03) | (.06) | (.03) |
Distributions from net realized gain | (.05) | (.01) | (.01) | (.02) | (.09) |
Total distributions | (.05) | (.02) | (.04) | (.07) I | (.12) |
Redemption fees added to paid in capital C, H | - | - | - | - | - |
Net asset value, end of period | $ 13.23 | $ 13.28 | $ 10.48 | $ 9.47 | $ 9.53 |
Total ReturnA, B | .03% | 26.91% | 11.13% | .10% | 23.06% |
Ratios to Average Net Assets D, G | | | | | |
Expenses before reductions | 2.38% | 2.45% | 2.50% | 2.09% | 1.91% |
Expenses net of fee waivers, if any | �� 2.38% | 2.40% | 2.40% | 2.09% | 1.91% |
Expenses net of all reductions | 2.38% | 2.39% | 2.39% | 2.07% | 1.90% |
Net investment income (loss) | (.42)% | (.16)% | .10% | .68%F | (.01)% |
Supplemental Data | | | | | |
Net assets, end of period (000 omitted) | $ 8,438 | $ 8,070 | $ 6,608 | $ 6,900 | $ 8,936 |
Portfolio turnover rateE | 18% | 31% | 28% | 24% | 49% |
A Total returns would have been lower if certain expenses had not been reduced during the applicable periods shown.
B Total returns do not include the effect of the contingent deferred sales charge.
C Calculated based on average shares outstanding during the period.
D Fees and expenses of any underlying Fidelity Central Funds are not included in the Fund's expense ratio. The Fund indirectly bears its proportionate share of the expenses of any underlying Fidelity Central Funds.
E Amount does not include the portfolio activity of any underlying Fidelity Central Funds.
F Investment income per share reflects a large, non-recurring dividend which amounted to $.06 per share. Excluding this non-recurring dividend, the ratio of net investment income (loss) to average net assets would have been .05%.
G Expense ratios reflect operating expenses of the class. Expenses before reductions do not reflect amounts reimbursed by the investment adviser or reductions from brokerage service arrangements or reductions from other expense offset arrangements and do not represent the amount paid by the class during periods when reimbursements or reductions occur. Expenses net of fee waivers reflect expenses after reimbursement by the investment adviser but prior to reductions from brokerage service arrangements or other expense offset arrangements. Expenses net of all reductions represent the net expenses paid by the class.
H Amount represents less than $.01 per share.
I Total distributions of $.07 per share is comprised of distributions from net investment income of $.058 and distributions from net realized gain of $.015 per share.
See accompanying notes which are an integral part of the financial statements.
Annual Report
Financial Highlights - International Small Cap Opportunities
Years ended October 31, | 2014 | 2013 | 2012 | 2011 | 2010 |
Selected Per-Share Data | | | | | |
Net asset value, beginning of period | $ 13.82 | $ 10.88 | $ 9.85 | $ 9.92 | $ 8.14 |
Income from Investment Operations | | | | | |
Net investment income (loss) B | .09 | .10 | .11 | .17E | .09 |
Net realized and unrealized gain (loss) | .06 | 2.95 | 1.07 | (.06) | 1.87 |
Total from investment operations | .15 | 3.05 | 1.18 | .11 | 1.96 |
Distributions from net investment income | (.09) | (.10) | (.14) | (.14) | (.09) |
Distributions from net realized gain | (.08) | (.01) | (.01) | (.04) | (.09) |
Total distributions | (.17) | (.11) | (.15) | (.18) | (.18) |
Redemption fees added to paid in capital B, G | - | - | - | - | - |
Net asset value, end of period | $ 13.80 | $ 13.82 | $ 10.88 | $ 9.85 | $ 9.92 |
Total ReturnA | 1.11% | 28.24% | 12.21% | 1.10% | 24.43% |
Ratios to Average Net Assets C, F | | | | | |
Expenses before reductions | 1.30% | 1.39% | 1.47% | 1.08% | .91% |
Expenses net of fee waivers, if any | 1.30% | 1.39% | 1.40% | 1.08% | .91% |
Expenses net of all reductions | 1.30% | 1.38% | 1.39% | 1.06% | .89% |
Net investment income (loss) | .65% | .85% | 1.10% | 1.69%E | 1.00% |
Supplemental Data | | | | | |
Net assets, end of period (000 omitted) | $ 584,253 | $ 518,121 | $ 334,918 | $ 328,262 | $ 398,331 |
Portfolio turnover rateD | 18% | 31% | 28% | 24% | 49% |
A Total returns would have been lower if certain expenses had not been reduced during the applicable periods shown.
B Calculated based on average shares outstanding during the period.
C Fees and expenses of any underlying Fidelity Central Funds are not included in the Fund's expense ratio. The Fund indirectly bears its proportionate share of the expenses of any underlying Fidelity Central Funds.
D Amount does not include the portfolio activity of any underlying Fidelity Central Funds.
E Investment income per share reflects a large, non-recurring dividend which amounted to $.07 per share. Excluding this non-recurring dividend, the ratio of net investment income (loss) to average net assets would have been 1.06%.
F Expense ratios reflect operating expenses of the class. Expenses before reductions do not reflect amounts reimbursed by the investment adviser or reductions from brokerage service arrangements or reductions from other expense offset arrangements and do not represent the amount paid by the class during periods when reimbursements or reductions occur. Expenses net of fee waivers reflect expenses after reimbursement by the investment adviser but prior to reductions from brokerage service arrangements or other expense offset arrangements. Expenses net of all reductions represent the net expenses paid by the class.
G Amount represents less than $.01 per share.
See accompanying notes which are an integral part of the financial statements.
Annual Report
Financial Highlights - Institutional Class
Years ended October 31, | 2014 | 2013 | 2012 | 2011 | 2010 |
Selected Per-Share Data | | | | | |
Net asset value, beginning of period | $ 13.83 | $ 10.90 | $ 9.86 | $ 9.93 | $ 8.14 |
Income from Investment Operations | | | | | |
Net investment income (loss) B | .08 | .11 | .11 | .18E | .09 |
Net realized and unrealized gain (loss) | .07 | 2.93 | 1.08 | (.06) | 1.86 |
Total from investment operations | .15 | 3.04 | 1.19 | .12 | 1.95 |
Distributions from net investment income | (.09) | (.10) | (.14) | (.15) | (.07) |
Distributions from net realized gain | (.08) | (.01) | (.01) | (.04) | (.09) |
Total distributions | (.17) | (.11) | (.15) | (.19) | (.16) |
Redemption fees added to paid in capital B, G | - | - | - | - | - |
Net asset value, end of period | $ 13.81 | $ 13.83 | $ 10.90 | $ 9.86 | $ 9.93 |
Total ReturnA | 1.11% | 28.11% | 12.32% | 1.13% | 24.33% |
Ratios to Average Net Assets C, F | | | | | |
Expenses before reductions | 1.36% | 1.38% | 1.44% | 1.03% | .90% |
Expenses net of fee waivers, if any | 1.36% | 1.37% | 1.40% | 1.03% | .90% |
Expenses net of all reductions | 1.36% | 1.37% | 1.39% | 1.02% | .88% |
Net investment income (loss) | .60% | .87% | 1.10% | 1.74%E | 1.01% |
Supplemental Data | | | | | |
Net assets, end of period (000 omitted) | $ 29,822 | $ 5,670 | $ 4,591 | $ 1,395 | $ 2,418 |
Portfolio turnover rateD | 18% | 31% | 28% | 24% | 49% |
A Total returns would have been lower if certain expenses had not been reduced during the applicable periods shown.
B Calculated based on average shares outstanding during the period.
C Fees and expenses of any underlying Fidelity Central Funds are not included in the Fund's expense ratio. The Fund indirectly bears its proportionate share of the expenses of any underlying Fidelity Central Funds.
D Amount does not include the portfolio activity of any underlying Fidelity Central Funds.
E Investment income per share reflects a large, non-recurring dividend which amounted to $.07 per share. Excluding this non-recurring dividend, the ratio of net investment income (loss) to average net assets would have been 1.11%.
F Expense ratios reflect operating expenses of the class. Expenses before reductions do not reflect amounts reimbursed by the investment adviser or reductions from brokerage service arrangements or reductions from other expense offset arrangements and do not represent the amount paid by the class during periods when reimbursements or reductions occur. Expenses net of fee waivers reflect expenses after reimbursement by the investment adviser but prior to reductions from brokerage service arrangements or other expense offset arrangements. Expenses net of all reductions represent the net expenses paid by the class.
G Amount represents less than $.01 per share.
See accompanying notes which are an integral part of the financial statements.
Annual Report
Notes to Financial Statements
For the period ended October 31, 2014
1. Organization.
Fidelity International Small Cap Opportunities Fund (the Fund) is a fund of Fidelity Investment Trust (the Trust) and is authorized to issue an unlimited number of shares. The Trust is registered under the Investment Company Act of 1940, as amended (the 1940 Act), as an open-end management investment company organized as a Massachusetts business trust. The Fund offers Class A, Class T, Class C, International Small Cap Opportunities and Institutional Class shares, each of which, along with Class B shares, has equal rights as to assets and voting privileges. Class B shares are closed to new accounts and additional purchases, except for exchanges and reinvestments. Each class has exclusive voting rights with respect to matters that affect that class. Class B shares will automatically convert to Class A shares after a holding period of seven years from the initial date of purchase.
2. Investments in Fidelity Central Funds.
The Fund invests in Fidelity Central Funds, which are open-end investment companies generally available only to other investment companies and accounts managed by the investment adviser and its affiliates. The Fund's Schedule of Investments lists each of the Fidelity Central Funds held as of period end, if any, as an investment of the Fund, but does not include the underlying holdings of each Fidelity Central Fund. As an Investing Fund, the Fund indirectly bears its proportionate share of the expenses of the underlying Fidelity Central Funds.
The Money Market Central Funds seek preservation of capital and current income and are managed by Fidelity Investments Money Management, Inc. (FIMM), an affiliate of the investment adviser. Annualized expenses of the Money Market Central Funds as of their most recent shareholder report date are less than .01%.
A complete unaudited list of holdings for each Fidelity Central Fund is available upon request or at the Securities and Exchange Commission (the SEC) website at www.sec.gov. In addition, the financial statements of the Fidelity Central Funds, which are not covered by the Fund's Report of Independent Registered Public Accounting Firm, are available on the SEC website or upon request.
3. Significant Accounting Policies.
The financial statements have been prepared in conformity with accounting principles generally accepted in the United States of America (GAAP), which require management to make certain estimates and assumptions at the date of the financial statements. Actual results could differ from those estimates. Subsequent events, if any, through the date that the financial statements were issued have been evaluated in the preparation of
Annual Report
3. Significant Accounting Policies - continued
the financial statements. The following summarizes the significant accounting policies of the Fund:
Investment Valuation. Investments are valued as of 4:00 p.m. Eastern time on the last calendar day of the period. In accordance with valuation policies and procedures approved by the Board of Trustees (the Board), the Fund attempts to obtain prices from one or more third party pricing vendors or brokers to value its investments. When current market prices, quotations or currency exchange rates are not readily available or reliable, investments will be fair valued in good faith by the Fidelity Management & Research Company (FMR) Fair Value Committee (the Committee), in accordance with procedures adopted by the Board. Factors used in determining fair value vary by investment type and may include market or investment specific events. The frequency with which these procedures are used cannot be predicted and they may be utilized to a significant extent. The Committee oversees the Fund's valuation policies and procedures and is responsible for approving and reporting to the Board all fair value determinations.
The Fund categorizes the inputs to valuation techniques used to value its investments into a disclosure hierarchy consisting of three levels as shown below:
Level 1 - quoted prices in active markets for identical investments
Level 2 - other significant observable inputs (including quoted prices for similar investments, interest rates, prepayment speeds, etc.)
Level 3 - unobservable inputs (including the Fund's own assumptions based on the best information available)
Valuation techniques used to value the Fund's investments by major category are as follows:
Equity securities, including restricted securities, for which market quotations are readily available, are valued at the last reported sale price or official closing price as reported by a third party pricing vendor on the primary market or exchange on which they are traded and are categorized as Level 1 in the hierarchy. In the event there were no sales during the day or closing prices are not available, securities are valued at the last quoted bid price or may be valued using the last available price and are generally categorized as Level 2 in the hierarchy. For foreign equity securities, when market or security specific events arise, comparisons to the valuation of American Depositary Receipts (ADRs), futures contracts, Exchange-Traded Funds (ETFs) and certain indexes as well as quoted prices for similar securities may be used and would be categorized as Level 2 in the hierarchy. Utilizing these techniques may result in transfers between Level 1 and Level 2. For equity securities, including restricted securities, where observable inputs are
Annual Report
Notes to Financial Statements - continued
3. Significant Accounting Policies - continued
Investment Valuation - continued
limited, assumptions about market activity and risk are used and these securities may be categorized as Level 3 in the hierarchy.
The U.S. dollar value of foreign currency contracts is determined using currency exchange rates supplied by a pricing service and are categorized as Level 2 in the hierarchy. Investments in open-end mutual funds, including the Fidelity Central Funds, are valued at their closing net asset value (NAV) each business day and are categorized as Level 1 in the hierarchy.
Changes in valuation techniques may result in transfers in or out of an assigned level within the disclosure hierarchy. The aggregate value of investments by input level, as of October 31, 2014, including information on transfers between Levels 1 and 2 is included at the end of the Fund's Schedule of Investments.
Foreign Currency. The Fund may use foreign currency contracts to facilitate transactions in foreign-denominated securities. Gains and losses from these transactions may arise from changes in the value of the foreign currency or if the counterparties do not perform under the contracts' terms.
Foreign-denominated assets, including investment securities, and liabilities are translated into U.S. dollars at the exchange rates at period end. Purchases and sales of investment securities, income and dividends received and expenses denominated in foreign currencies are translated into U.S. dollars at the exchange rate in effect on the transaction date.
The effects of exchange rate fluctuations on investments are included with the net realized and unrealized gain (loss) on investment securities. Other foreign currency transactions resulting in realized and unrealized gain (loss) are disclosed separately.
Investment Transactions and Income. For financial reporting purposes, the Fund's investment holdings and NAV include trades executed through the end of the last business day of the period. The NAV per share for processing shareholder transactions is calculated as of the close of business of the New York Stock Exchange (NYSE), normally 4:00 p.m. Eastern time and includes trades executed through the end of the prior business day. Gains and losses on securities sold are determined on the basis of identified cost and may include proceeds received from litigation. Dividend income is recorded on the ex-dividend date, except for certain dividends from foreign securities where the ex-dividend date may have passed, which are recorded as soon as the Fund is informed of the ex-dividend date. Non-cash dividends included in dividend income, if any, are recorded at the fair market value of the securities received. Income and capital gain distributions from Fidelity Central Funds, if any, are recorded on the ex-dividend date.
Annual Report
3. Significant Accounting Policies - continued
Investment Transactions and Income - continued
Distributions received on securities that represent a return of capital or capital gain are recorded as a reduction of cost of investments and/or as a realized gain. Subsequent to ex-dividend date the Fund determines the components of these distributions, based upon receipt of tax filings or other correspondence relating to the underlying investment.
Class Allocations and Expenses. Investment income, realized and unrealized capital gains and losses, common expenses of the Fund, and certain fund-level expense reductions, if any, are allocated daily on a pro-rata basis to each class based on the relative net assets of each class to the total net assets of the Fund. Each class differs with respect to transfer agent and distribution and service plan fees incurred. Certain expense reductions may also differ by class. For the reporting period, the allocated portion of income and expenses to each class as a percent of its average net assets may vary due to the timing of recording these transactions in relation to fluctuating net assets of the classes. Expenses directly attributable to a fund are charged to that fund. Expenses attributable to more than one fund are allocated among the respective funds on the basis of relative net assets or other appropriate methods. Expense estimates are accrued in the period to which they relate and adjustments are made when actual amounts are known.
Income Tax Information and Distributions to Shareholders. Each year, the Fund intends to qualify as a regulated investment company under Subchapter M of the Internal Revenue Code, including distributing substantially all of its taxable income and realized gains. As a result, no provision for U.S. Federal income taxes is required. As of October 31, 2014, the Fund did not have any unrecognized tax benefits in the financial statements; nor is the Fund aware of any tax positions for which it is reasonably possible that the total amounts of unrecognized tax benefits will significantly change in the next twelve months. The Fund files a U.S. federal tax return, in addition to state and local tax returns as required. The Fund's federal income tax returns are subject to examination by the Internal Revenue Service (IRS) for a period of three fiscal years after they are filed. State and local tax returns may be subject to examination for an additional fiscal year depending on the jurisdiction. Foreign taxes are provided for based on the Fund's understanding of the tax rules and rates that exist in the foreign markets in which it invests.
Distributions are declared and recorded on the ex-dividend date. Income dividends and capital gain distributions are declared separately for each class. Income and capital gain distributions are determined in accordance with income tax regulations, which may differ from GAAP.
Capital accounts within the financial statements are adjusted for permanent book-tax differences. These adjustments have no impact on net assets or the results of operations.
Annual Report
Notes to Financial Statements - continued
3. Significant Accounting Policies - continued
Income Tax Information and Distributions to Shareholders - continued
Capital accounts are not adjusted for temporary book-tax differences which will reverse in a subsequent period.
Book-tax differences are primarily due to foreign currency transactions, partnerships, passive foreign investment companies (PFIC), capital loss carryforwards and losses deferred due to wash sales.
The federal tax cost of investment securities and unrealized appreciation (depreciation) as of period end were as follows:
Gross unrealized appreciation | $ 135,078,782 |
Gross unrealized depreciation | (26,037,635) |
Net unrealized appreciation (depreciation) on securities | $ 109,041,147 |
| |
Tax Cost | $ 548,219,679 |
The tax-based components of distributable earnings as of period end were as follows:
Undistributed ordinary income | $ 4,846,239 |
Capital loss carryforward | $ (284,273,262) |
Net unrealized appreciation (depreciation) on securities and other investments | $ 108,996,277 |
Capital loss carryforwards are only available to offset future capital gains of the Fund to the extent provided by regulations and may be limited. Under the Regulated Investment Company Modernization Act of 2010 (the Act), the Fund is permitted to carry forward capital losses incurred in taxable years beginning after December 22, 2010 for an unlimited period and such capital losses are required to be used prior to any losses that expire. The capital loss carryforward information presented below, including any applicable limitation, is estimated as of fiscal period end and is subject to adjustment.
Fiscal year of expiration | |
2017 | $ (284,273,262) |
The tax character of distributions paid was as follows:
| October 31, 2014 | October 31, 2013 |
Ordinary Income | $ 6,814,221 | $ 3,482,351 |
Annual Report
3. Significant Accounting Policies - continued
Short-Term Trading (Redemption) Fees. Shares held by investors in the Fund less than 90 days may have been subject to a redemption fee equal to 2.00% of the NAV of shares redeemed. All redemption fees, which reduce the proceeds of the shareholder redemption, are retained by the Fund and accounted for as an addition to paid in capital.
New Accounting Pronouncement. In June 2014, the Financial Accounting Standards Board issued Accounting Standard Update No. 2014-11, Repurchase-to-Maturity Transactions, Repurchase Financings, and Disclosures. The Update amends the accounting for certain repurchase agreements and expands disclosure requirements for reverse repurchase agreements, securities lending and other similar transactions. The disclosure requirements are effective for annual and interim reporting periods beginning after December 15, 2014. Management is currently evaluating the impact of the Update on the Fund's financial statements and related disclosures.
4. Purchases and Sales of Investments.
Purchases and sales of securities, other than short-term securities, aggregated $201,745,353 and $113,539,642, respectively.
5. Fees and Other Transactions with Affiliates.
Management Fee. Fidelity Management & Research Company (the investment adviser) and its affiliates provide the Fund with investment management related services for which the Fund pays a monthly management fee. The management fee is the sum of an individual fund fee rate that is based on an annual rate of .60% of the Fund's average net assets and an annualized group fee rate that averaged .25% during the period. The group fee rate is based upon the average net assets of all the mutual funds advised by the investment adviser, including any mutual funds previously advised by the investment adviser that are currently advised by Fidelity SelectCo, LLC, an affiliate of the investment adviser. The group fee rate decreases as assets under management increase and increases as assets under management decrease. In addition, the management fee is subject to a performance adjustment (up to a maximum of ± .20% of the Fund's average net assets over a 36 month performance period). The upward or downward adjustment to the management fee is based on the relative investment performance of International Small Cap Opportunities as compared to its benchmark index, the MSCI EAFE Small Cap Index, over the same 36 month performance period. For the reporting period, the total annual management fee rate, including the performance adjustment, was .98% of the Fund's average net assets. The performance adjustment included in the management fee rate may be higher or lower than the maximum performance adjustment rate due to the difference between the average net assets for the reporting and performance periods.
Annual Report
Notes to Financial Statements - continued
5. Fees and Other Transactions with Affiliates - continued
Distribution and Service Plan Fees. In accordance with Rule 12b-1 of the 1940 Act, the Fund has adopted separate Distribution and Service Plans for each class of shares, except for the Institutional Class. Certain classes pay Fidelity Distributors Corporation (FDC), an affiliate of the investment adviser, separate Distribution and Service Fees, each of which is based on an annual percentage of each class' average net assets. In addition, FDC may pay financial intermediaries for selling shares of the Fund and providing shareholder support services. For the period, the Distribution and Service Fee rates, total fees and amounts retained by FDC were as follows:
| Distribution
Fee | Service
Fee | Total Fees | Retained
by FDC |
Class A | -% | .25% | $ 61,505 | $ 1,091 |
Class T | .25% | .25% | 51,522 | 86 |
Class B | .75% | .25% | 10,529 | 7,921 |
Class C | .75% | .25% | 88,932 | 15,254 |
| | | $ 212,488 | $ 24,352 |
Sales Load. FDC may receive a front-end sales charge of up to 5.75% for selling Class A shares and 3.50% for selling Class T shares, some of which is paid to financial intermediaries for selling shares of the Fund. Depending on the holding period, FDC may receive contingent deferred sales charges levied on Class A, Class T, Class B, and Class C redemptions. The deferred sales charges range from 5.00% to 1.00% for Class B shares, 1.00% for Class C shares, 1.00% for certain purchases of Class A shares and .25% for certain purchases of Class T shares.
For the period, sales charge amounts retained by FDC were as follows:
| Retained
by FDC |
Class A | $ 8,923 |
Class T | 3,488 |
Class B* | 157 |
Class C* | 1,680 |
| $ 14,248 |
* When Class B and Class C shares are initially sold, FDC pays commissions from its own resources to financial intermediaries through which the sales are made.
Transfer Agent Fees. Fidelity Investments Institutional Operations Company, Inc., (FIIOC), an affiliate of the investment adviser, is the transfer, dividend disbursing and shareholder servicing agent for each class of the Fund. FIIOC receives account fees and asset-based fees that vary according to the account size and type of account of the shareholders of the respective classes of the Fund. FIIOC pays for typesetting, printing and mailing of shareholder reports, except proxy statements.
Annual Report
5. Fees and Other Transactions with Affiliates - continued
Transfer Agent Fees - continued
For the period, transfer agent fees for each class were as follows:
| Amount | % of
Class-Level Average
Net Assets |
Class A | $ 74,641 | .30 |
Class T | 32,188 | .31 |
Class B | 3,189 | .30 |
Class C | 27,039 | .30 |
International Small Cap Opportunities | 1,338,038 | .23 |
Institutional Class | 44,654 | .28 |
| $ 1,519,749 | |
Accounting and Security Lending Fees. Fidelity Service Company, Inc. (FSC), an affiliate of the investment adviser, maintains the Fund's accounting records. The accounting fee is based on the level of average net assets for each month. Under a separate contract, FSC administers the security lending program. The security lending fee is based on the number and duration of lending transactions.
Brokerage Commissions. The Fund placed a portion of its portfolio transactions with brokerage firms which are affiliates of the investment adviser. Brokerage commissions are included in net realized gain (loss) and change in net unrealized appreciation (depreciation) in the Statement of Operations. The commissions paid to these affiliated firms were $840 for the period.
Other. During the period, the investment adviser reimbursed the Fund for certain losses in the amount of $5,745.
6. Committed Line of Credit.
The Fund participates with other funds managed by the investment adviser or an affiliate in a $4.25 billion credit facility (the "line of credit") to be utilized for temporary or emergency purposes to fund shareholder redemptions or for other short-term liquidity purposes. The Fund has agreed to pay commitment fees on its pro-rata portion of the line of credit, which amounted to $1,022 and is reflected in Miscellaneous expenses on the Statement of Operations. During the period, the Fund did not borrow on this line of credit.
Annual Report
Notes to Financial Statements - continued
7. Security Lending.
The Fund lends portfolio securities through a lending agent from time to time in order to earn additional income. For equity securities, a lending agent is used and may loan securities to certain qualified borrowers, including Fidelity Capital Markets (FCM), a broker-dealer affiliated with the Fund. On the settlement date of the loan, the Fund receives collateral (in the form of U.S. Treasury obligations, letters of credit and/or cash) against the loaned securities and maintains collateral in an amount not less than 100% of the market value of the loaned securities during the period of the loan. The market value of the loaned securities is determined at the close of business of the Fund and any additional required collateral is delivered to the Fund on the next business day. If the borrower defaults on its obligation to return the securities loaned because of insolvency or other reasons, the Fund may apply collateral received from the borrower against the obligation. The Fund may experience delays and costs in recovering the securities loaned. Any cash collateral received is invested in the Fidelity Securities Lending Cash Central Fund. The value of loaned securities and cash collateral at period end are disclosed on the Fund's Statement of Assets and Liabilities. Security lending income represents the income earned on investing cash collateral, less rebates paid to borrowers and any lending agent fees associated with the loan, plus any premium payments received for lending certain types of securities. Security lending income is presented in the Statement of Operations as a component of income from Fidelity Central Funds. Total security lending income during the period amounted to $171,600. During the period, there were no securities loaned to FCM.
8. Expense Reductions.
Commissions paid to certain brokers with whom the investment adviser, or its affiliates, places trades on behalf of the Fund include an amount in addition to trade execution, which may be rebated back to the Fund to offset certain expenses. This amount totaled $329 for the period. In addition, through arrangements with the Fund's custodian, credits realized as a result of uninvested cash balances were used to reduce the Fund's expenses. During the period, these credits reduced the Fund's custody expenses by $192.
In addition, the investment adviser reimbursed a portion of the Fund's operating expenses during the period in the amount of $3,884.
Annual Report
9. Distributions to Shareholders.
Distributions to shareholders of each class were as follows:
Years ended October 31, | 2014 | 2013 |
From net investment income | | |
Class A | $ 88,584 | $ 127,604 |
Class T | 17,038 | 40,329 |
Class B | - | 540 |
Class C | - | 6,860 |
International Small Cap Opportunities | 3,435,414 | 3,098,688 |
Institutional Class | 39,565 | 37,075 |
Total | $ 3,580,601 | $ 3,311,096 |
Years ended October 31, | | |
From net realized gain | | |
Class A | $ 127,238 | $ 8,286 |
Class T | 56,084 | 3,734 |
Class B | - | 900 |
Class C | 33,933 | 3,118 |
International Small Cap Opportunities | 2,982,391 | 153,400 |
Institutional Class | 33,974 | 1,817 |
Total | $ 3,233,620 | $ 171,255 |
10. Share Transactions.
Share transactions for each class were as follows and may contain automatic conversions between classes or exchanges between funds:
| Shares | Dollars |
Years ended October 31, | 2014 | 2013 | 2014 | 2013 |
Class A | | | | |
Shares sold | 589,478 | 373,515 | $ 8,266,636 | $ 4,517,568 |
Reinvestment of distributions | 14,226 | 10,878 | 191,200 | 119,442 |
Shares redeemed | (381,134) | (460,010) | (5,353,937) | (5,504,745) |
Net increase (decrease) | 222,570 | (75,617) | $ 3,103,899 | $ (867,735) |
Class T | | | | |
Shares sold | 159,216 | 94,833 | $ 2,266,530 | $ 1,133,727 |
Reinvestment of distributions | 5,309 | 3,872 | 70,882 | 42,245 |
Shares redeemed | (142,062) | (152,245) | (1,989,964) | (1,813,542) |
Net increase (decrease) | 22,463 | (53,540) | $ 347,448 | $ (637,570) |
Annual Report
Notes to Financial Statements - continued
10. Share Transactions - continued
| Shares | Dollars |
Years ended October 31, | 2014 | 2013 | 2014 | 2013 |
Class B | | | | |
Shares sold | 1,461 | 2,465 | $ 20,212 | $ 28,055 |
Reinvestment of distributions | - | 123 | - | 1,326 |
Shares redeemed | (51,497) | (83,897) | (706,187) | (970,172) |
Net increase (decrease) | (50,036) | (81,309) | $ (685,975) | $ (940,791) |
Class C | | | | |
Shares sold | 200,445 | 106,942 | $ 2,745,030 | $ 1,277,851 |
Reinvestment of distributions | 2,336 | 870 | 30,621 | 9,335 |
Shares redeemed | (172,604) | (130,535) | (2,374,401) | (1,517,604) |
Net increase (decrease) | 30,177 | (22,723) | $ 401,250 | $ (230,418) |
International Small Cap Opportunities | | | | |
Shares sold | 13,421,171 | 13,306,080 | $ 191,269,160 | $ 163,920,015 |
Reinvestment of distributions | 360,554 | 279,367 | 4,881,895 | 3,092,593 |
Shares redeemed | (8,930,544) | (6,858,430) | (127,222,877) | (83,019,406) |
Net increase (decrease) | 4,851,181 | 6,727,017 | $ 68,928,178 | $ 83,993,202 |
Institutional Class | | | | |
Shares sold | 2,469,158 | 107,232 | $ 34,766,175 | $ 1,308,852 |
Reinvestment of distributions | 4,980 | 3,187 | 67,530 | 35,307 |
Shares redeemed | (724,026) | (121,854) | (9,726,800) | (1,389,261) |
Net increase (decrease) | 1,750,112 | (11,435) | $ 25,106,905 | $ (45,102) |
11. Other.
The Fund's organizational documents provide former and current trustees and officers with a limited indemnification against liabilities arising in connection with the performance of their duties to the Fund. In the normal course of business, the Fund may also enter into contracts that provide general indemnifications. The Fund's maximum exposure under these arrangements is unknown as this would be dependent on future claims that may be made against the Fund. The risk of material loss from such claims is considered remote.
Annual Report
To the Trustees of Fidelity Investment Trust and Shareholders of Fidelity International Small Cap Opportunities Fund:
We have audited the accompanying statement of assets and liabilities of Fidelity International Small Cap Opportunities Fund (the Fund), a fund of Fidelity Investment Trust, including the schedule of investments, as of October 31, 2014, and the related statement of operations for the year then ended, the statement of changes in net assets for each of the two years in the period then ended, and the financial highlights for each of the five years in the period then ended. These financial statements and financial highlights are the responsibility of the Fund's management. Our responsibility is to express an opinion on these financial statements and financial highlights based on our audits.
We conducted our audits in accordance with the standards of the Public Company Accounting Oversight Board (United States). Those standards require that we plan and perform the audit to obtain reasonable assurance about whether the financial statements and financial highlights are free of material misstatement. The Fund is not required to have, nor were we engaged to perform, an audit of its internal control over financial reporting. Our audits included consideration of internal control over financial reporting as a basis for designing audit procedures that are appropriate in the circumstances, but not for the purpose of expressing an opinion on the effectiveness of the Fund's internal control over financial reporting. Accordingly, we express no such opinion. An audit also includes examining, on a test basis, evidence supporting the amounts and disclosures in the financial statements, assessing the accounting principles used and significant estimates made by management, as well as evaluating the overall financial statement presentation. Our procedures included confirmation of securities owned as of October 31, 2014, by correspondence with the custodians and brokers; where replies were not received from brokers, we performed other auditing procedures. We believe that our audits provide a reasonable basis for our opinion.
In our opinion, the financial statements and financial highlights referred to above present fairly, in all material respects, the financial position of Fidelity International Small Cap Opportunities Fund as of October 31, 2014, the results of its operations for the year then ended, the changes in its net assets for each of the two years in the period then ended, and the financial highlights for each of the five years in the period then ended, in conformity with accounting principles generally accepted in the United States of America.
DELOITTE & TOUCHE LLP
Boston, Massachusetts
December 16, 2014
Annual Report
The Trustees, Member of the Advisory Board, and officers of the trust and fund, as applicable, are listed below. The Board of Trustees governs the fund and is responsible for protecting the interests of shareholders. The Trustees are experienced executives who meet periodically throughout the year to oversee the fund's activities, review contractual arrangements with companies that provide services to the fund, oversee management of the risks associated with such activities and contractual arrangements, and review the fund's performance. Except for James C. Curvey, each of the Trustees oversees 174 funds. Mr. Curvey oversees 407 funds.
The Trustees hold office without limit in time except that (a) any Trustee may resign; (b) any Trustee may be removed by written instrument, signed by at least two-thirds of the number of Trustees prior to such removal; (c) any Trustee who requests to be retired or who has become incapacitated by illness or injury may be retired by written instrument signed by a majority of the other Trustees; and (d) any Trustee may be removed at any special meeting of shareholders by a two-thirds vote of the outstanding voting securities of the trust. Each Trustee who is not an interested person (as defined in the 1940 Act) of the trust and the fund (Independent Trustee), shall retire not later than the last day of the calendar year in which his or her 75th birthday occurs. The Independent Trustees may waive this mandatory retirement age policy with respect to individual Trustees. The officers and Advisory Board Member hold office without limit in time, except that any officer and Advisory Board Member may resign or may be removed by a vote of a majority of the Trustees at any regular meeting or any special meeting of the Trustees. Except as indicated, each individual has held the office shown or other offices in the same company for the past five years.
Experience, Skills, Attributes, and Qualifications of the Fund's Trustees. The Governance and Nominating Committee has adopted a statement of policy that describes the experience, qualifications, attributes, and skills that are necessary and desirable for potential Independent Trustee candidates (Statement of Policy). The Board believes that each Trustee satisfied at the time he or she was initially elected or appointed a Trustee, and continues to satisfy, the standards contemplated by the Statement of Policy. The Governance and Nominating Committee also engages professional search firms to help identify potential Independent Trustee candidates who have the experience, qualifications, attributes, and skills consistent with the Statement of Policy. From time to time, additional criteria based on the composition and skills of the current Independent Trustees, as well as experience or skills that may be appropriate in light of future changes to board composition, business conditions, and regulatory or other developments, have also been considered by the professional search firms and the Governance and Nominating Committee. In addition, the Board takes into account the Trustees' commitment and participation in Board and committee meetings, as well as their leadership of standing and ad hoc committees throughout their tenure.
In determining that a particular Trustee was and continues to be qualified to serve as a Trustee, the Board has considered a variety of criteria, none of which, in isolation, was controlling. The Board believes that, collectively, the Trustees have balanced and diverse experience, qualifications, attributes, and skills, which allow the Board to operate effectively in governing the fund and protecting the interests of shareholders. Information about the specific experience, skills, attributes, and qualifications of each Trustee, which in each case led to the Board's conclusion that the Trustee should serve (or continue to serve) as a trustee of the fund, is provided below.
Annual Report
Trustees and Officers - continued
Board Structure and Oversight Function. James C. Curvey is an interested person (as defined in the 1940 Act) and currently serves as Chairman. The Trustees have determined that an interested Chairman is appropriate and benefits shareholders because an interested Chairman has a personal and professional stake in the quality and continuity of services provided to the fund. Independent Trustees exercise their informed business judgment to appoint an individual of their choosing to serve as Chairman, regardless of whether the Trustee happens to be independent or a member of management. The Independent Trustees have determined that they can act independently and effectively without having an Independent Trustee serve as Chairman and that a key structural component for assuring that they are in a position to do so is for the Independent Trustees to constitute a substantial majority for the Board. The Independent Trustees also regularly meet in executive session. Ned C. Lautenbach serves as Chairman of the Independent Trustees and as such (i) acts as a liaison between the Independent Trustees and management with respect to matters important to the Independent Trustees and (ii) with management prepares agendas for Board meetings.
Fidelity funds are overseen by different Boards of Trustees. The fund's Board oversees Fidelity's equity and high income funds and another Board oversees Fidelity's investment-grade bond, money market, and asset allocation funds. The asset allocation funds may invest in Fidelity funds overseen by the fund's Board. The use of separate Boards, each with its own committee structure, allows the Trustees of each group of Fidelity funds to focus on the unique issues of the funds they oversee, including common research, investment, and operational issues. On occasion, the separate Boards establish joint committees to address issues of overlapping consequences for the Fidelity funds overseen by each Board.
The Trustees operate using a system of committees to facilitate the timely and efficient consideration of all matters of importance to the Trustees, the fund, and fund shareholders and to facilitate compliance with legal and regulatory requirements and oversight of the fund's activities and associated risks. The Board, acting through its committees, has charged FMR and its affiliates with (i) identifying events or circumstances the occurrence of which could have demonstrably adverse effects on the fund's business and/or reputation; (ii) implementing processes and controls to lessen the possibility that such events or circumstances occur or to mitigate the effects of such events or circumstances if they do occur; and (iii) creating and maintaining a system designed to evaluate continuously business and market conditions in order to facilitate the identification and implementation processes described in (i) and (ii) above. Because the day-to-day operations and activities of the fund are carried out by or through FMR, its affiliates and other service providers, the fund's exposure to risks is mitigated but not eliminated by the processes overseen by the Trustees. While each of the Board's committees has responsibility for overseeing different aspects of the fund's activities, oversight is exercised primarily through the Operations, Audit, and Compliance Committees. In addition, the Independent Trustees have worked with FMR to enhance the Board's oversight of investment and financial risks, legal and regulatory risks, technology risks, and operational risks, including the development of additional risk reporting to the Board. For example, a working group comprised of Independent Trustees and FMR has worked and continues to work to review the Fidelity funds' valuation-related activities, reporting and risk management. Appropriate personnel, including but not limited to the fund's Chief Compliance Officer (CCO), FMR's internal auditor, the independent accountants, the fund's Treasurer and portfolio management personnel, make periodic reports to the Board's committees, as appropriate, including an annual review of FMR's risk management program for the Fidelity funds. The responsibilities of each standing committee, including their oversight responsibilities, are described further under "Standing Committees of the Fund's Trustees."
Annual Report
The fund's Statement of Additional Information (SAI) includes more information about the Trustees. To request a free copy, call Fidelity at 1-877-208-0098.
Interested Trustees*:
Correspondence intended for each Trustee who is an interested person may be sent to Fidelity Investments, 245 Summer Street, Boston, Massachusetts 02210.
Name, Year of Birth; Principal Occupations and Other Relevant Experience+ |
James C. Curvey (1935) |
Year of Election or Appointment: 2007 Trustee Chairman of the Board of Trustees |
| Mr. Curvey also serves as Trustee of other Fidelity funds. Mr. Curvey is a Director of Fidelity Research & Analysis Co. (2009-present), and Vice Chairman (2007-present) and Director of FMR LLC. In addition, Mr. Curvey serves as an Overseer for the Boston Symphony Orchestra and a member of the board of Artis-Naples, Naples, Florida, and as a Trustee for Brewster Academy, Wolfeboro, New Hampshire. Previously, Mr. Curvey served as a Director of Fidelity Investments Money Management, Inc. (2009-2014), a Director of FMR (2007-2014), and a Director of FMR Co., Inc. (2007-2014). |
Charles S. Morrison (1960) |
Year of Election or Appointment: 2014 Trustee |
| Mr. Morrison also serves as Trustee of other funds. He serves as a Director of Fidelity Investments Money Management, Inc. (FIMM) (2014-present), Director of Fidelity SelectCo, LLC (2014-present), President, Asset Management (2014-present), and is an employee of Fidelity Investments. Previously, Mr. Morrison served as Vice President of Fidelity's Fixed Income and Asset Allocation Funds (2012-2014), President, Fixed Income (2011-2014), Vice President of Fidelity's Money Market Funds (2005-2009), President, Money Market Group Leader of FMR (2009), and Senior Vice President, Money Market Group of FMR (2004-2009). Mr. Morrison also served as Vice President of Fidelity's Bond Funds (2002-2005), certain Balanced Funds (2002-2005), and certain Asset Allocation Funds (2002-2007), and as Senior Vice President (2002-2005) of Fidelity's Bond Division. |
* Trustees have been determined to be "Interested Trustees" by virtue of, among other things, their affiliation with the trust or various entities under common control with FMR.
+ The information above includes each Trustee's principal occupation during the last five years and other information relating to the experience, attributes, and skills relevant to each Trustee's qualifications to serve as a Trustee, which led to the conclusion that each Trustee should serve as a Trustee for the fund.
Annual Report
Independent Trustees:
Correspondence intended for each Independent Trustee (that is, the Trustees other than the Interested Trustees) may be sent to Fidelity Investments, P.O. Box 55235, Boston, Massachusetts 02205-5235.
Name, Year of Birth; Principal Occupations and Other Relevant Experience+ |
Dennis J. Dirks (1948) |
Year of Election or Appointment: 2005 Trustee |
| Mr. Dirks also serves as Trustee of other Fidelity funds. Prior to his retirement in May 2003, Mr. Dirks was Chief Operating Officer and a member of the Board of The Depository Trust & Clearing Corporation (DTCC). He also served as President, Chief Operating Officer, and Board member of The Depository Trust Company (DTC) and President and Board member of the National Securities Clearing Corporation (NSCC). In addition, Mr. Dirks served as Chief Executive Officer and Board member of the Government Securities Clearing Corporation, Chief Executive Officer and Board member of the Mortgage-Backed Securities Clearing Corporation, as a Trustee and a member of the Finance Committee of Manhattan College (2005-2008), and as a Trustee and a member of the Finance Committee of AHRC of Nassau County (2006-2008). Mr. Dirks is a member of the Independent Directors Council (IDC) Governing Council (2010-present) and Board of Directors for The Brookville Center for Children's Services, Inc. (2009-present). |
Alan J. Lacy (1953) |
Year of Election or Appointment: 2008 Trustee |
| Mr. Lacy also serves as Trustee of other Fidelity funds. Mr. Lacy serves as Senior Adviser (2007-present) of Oak Hill Capital Partners, L.P. (private equity). Mr. Lacy also served as Chief Executive Officer (2000-2005) and Vice Chairman (2005-2006) of Sears Holdings Corporation and Sears, Roebuck and Co. (retail). In addition, Mr. Lacy serves as a member of the Board of Directors of Dave & Buster's Entertainment, Inc. (restaurant and entertainment complexes, 2010-present), Earth Fare, Inc. (retail grocery, 2012-present), The Hillman Companies, Inc. (hardware wholesalers, 2010-present), and Bristol-Myers Squibb Company (global pharmaceuticals, 2008-present). Mr. Lacy is a member of the Board of Trustees of The National Parks Conservation Association (2006-present). Previously, Mr. Lacy served as Chairman of the Board of Trustees of the National Parks Conservation Association (2008-2011) and as a member of the Board of Directors for the Western Union Company (global money transfer, 2006-2011). |
Ned C. Lautenbach (1944) |
Year of Election or Appointment: 2000 Trustee Chairman of the Independent Trustees |
| Mr. Lautenbach also serves as Trustee of other Fidelity funds. Mr. Lautenbach currently serves as the Lead Director of the Eaton Corporation Board of Directors (diversified industrial, 1997-present). Mr. Lautenbach is Chairman of the Board of Directors of the Philharmonic Center for the Arts in Naples, Florida (2012-present) and a member of the Council on Foreign Relations (1994-present). Previously, Mr. Lautenbach was a Partner/Advisory Partner at Clayton, Dubilier & Rice, LLC (private equity investment, 1998-2010), as well as a Director of Sony Corporation (2006-2007). |
Joseph Mauriello (1944) |
Year of Election or Appointment: 2008 Trustee |
| Mr. Mauriello also serves as Trustee of other Fidelity funds. Prior to his retirement in January 2006, Mr. Mauriello served in numerous senior management positions including Deputy Chairman and Chief Operating Officer (2004-2005), and Vice Chairman of Financial Services (2002-2004) of KPMG LLP US (professional services, 1965-2005). Mr. Mauriello currently serves as a member of the Board of Directors of XL Group plc. (global insurance and re-insurance, 2006-present). Previously, Mr. Mauriello served as a Director of the Hamilton Funds of the Bank of New York (2006-2007) and of Arcadia Resources Inc. (health care services and products, 2007-2012). |
Robert W. Selander (1950) |
Year of Election or Appointment: 2011 Trustee |
| Mr. Selander also serves as Trustee of other Fidelity funds. Previously, Mr. Selander served as a Member of the Advisory Board of other Fidelity funds (2011), and Executive Vice Chairman (2010), Chief Executive Officer (2009-2010), and President and Chief Executive Officer (1997-2009) of Mastercard, Inc. |
Cornelia M. Small (1944) |
Year of Election or Appointment: 2005 Trustee |
| Ms. Small also serves as Trustee of other Fidelity funds. Ms. Small is a member of the Board of Directors (2009-present) and Chair of the Investment Committee (2010-present) of the Teagle Foundation. Ms. Small also serves on the Investment Committee of the Berkshire Taconic Community Foundation (2008-present). Previously, Ms. Small served as Chairperson (2002-2008) and a member of the Investment Committee and Chairperson (2008-2012) and a member of the Board of Trustees of Smith College. In addition, Ms. Small served as Chief Investment Officer, Director of Global Equity Investments, and a member of the Board of Directors of Scudder, Stevens & Clark and Scudder Kemper Investments. |
William S. Stavropoulos (1939) |
Year of Election or Appointment: 2001 Trustee Vice Chairman of the Independent Trustees |
| Mr. Stavropoulos also serves as Trustee of other Fidelity funds. Mr. Stavropoulos serves as President and Founder of the Michigan Baseball Foundation, the Great Lakes Loons (2007-present). Mr. Stavropoulos is Chairman Emeritus of the Board of Directors of The Dow Chemical Company, where he previously served in numerous senior management positions, including President, CEO (1995-2000; 2002-2004), Chairman of the Executive Committee (2000-2006), and as a member of the Board of Directors (1990-2006). Currently, Mr. Stavropoulos is Chairman of the Board of Directors of Univar Inc. (global distributor of commodity and specialty chemicals), a Director of Teradata Corporation (data warehousing and technology solutions), and Maersk Inc. (industrial conglomerate), and a member of the Advisory Board for Metalmark Capital LLC (private equity investment, 2005-present). Mr. Stavropoulos is an operating advisor to Clayton, Dubilier & Rice, LLC (private equity investment). In addition, Mr. Stavropoulos is a member of the University of Notre Dame Advisory Council for the College of Science, a Trustee of the Rollin L. Gerstacker Foundation, and a Director of the Naples Philharmonic Center for the Arts. Previously, Mr. Stavropoulos served as a Director of Chemical Financial Corporation (bank holding company, 1993-2012) and Tyco International, Ltd. (multinational manufacturing and services, 2007-2012). |
David M. Thomas (1949) |
Year of Election or Appointment: 2008 Trustee |
| Mr. Thomas also serves as Trustee of other Fidelity funds. Mr. Thomas serves as Non-Executive Chairman of the Board of Directors of Fortune Brands Home and Security (home and security products, 2011-present), and as a member of the Board of Directors of Interpublic Group of Companies, Inc. (marketing communication, 2004-present). Previously, Mr. Thomas served as Executive Chairman (2005-2006) and Chairman and Chief Executive Officer (2000-2005) of IMS Health, Inc. (pharmaceutical and healthcare information solutions), and a Director of Fortune Brands, Inc. (consumer products, 2000-2011). |
+ The information above includes each Trustee's principal occupation during the last five years and other information relating to the experience, attributes, and skills relevant to each Trustee's qualifications to serve as a Trustee, which led to the conclusion that each Trustee should serve as a Trustee for the fund.
Advisory Board Member and Officers:
Correspondence intended for each officer and Peter S. Lynch may be sent to Fidelity Investments, 245 Summer Street, Boston, Massachusetts 02210. Officers appear below in alphabetical order.
Name, Year of Birth; Principal Occupation |
Peter S. Lynch (1944) |
Year of Election or Appointment: 2003 Member of the Advisory Board |
| Mr. Lynch also serves as Member of the Advisory Board of other Fidelity funds. Mr. Lynch is Vice Chairman and a Director of FMR and FMR Co., Inc. In addition, Mr. Lynch serves as a Trustee of Boston College and as the Chairman of the Inner-City Scholarship Fund. Previously, Mr. Lynch served on the Special Olympics International Board of Directors (1997-2006). |
Elizabeth Paige Baumann (1968) |
Year of Election or Appointment: 2012 Anti-Money Laundering (AML) Officer |
| Ms. Baumann also serves as AML Officer of other funds. She is Chief AML Officer of FMR LLC (2012-present) and is an employee of Fidelity Investments. Previously, Ms. Baumann served as Vice President and Deputy Anti-Money Laundering Officer (2007-2012). |
William C. Coffey (1969) |
Year of Election or Appointment: 2009 Assistant Secretary |
| Mr. Coffey also serves as Assistant Secretary of other funds. He is Senior Vice President and Deputy General Counsel of FMR LLC (2010-present), and is an employee of Fidelity Investments. Previously, Mr. Coffey served as Vice President and Associate General Counsel of FMR LLC (2005-2009). |
Timothy M. Cohen (1969) |
Year of Election or Appointment: 2014 Vice President of certain Equity Funds |
| Mr. Cohen also serves as Vice President of other funds. Mr. Cohen serves as a Director and Chief Compliance Officer of Fidelity Management & Research (U.K.) Inc. (2013-present) and is an employee of Fidelity Investments. |
Jonathan Davis (1968) |
Year of Election or Appointment: 2010 Assistant Treasurer |
| Mr. Davis also serves as Assistant Treasurer of other funds. Mr. Davis is an employee of Fidelity Investments. Previously, Mr. Davis served as Vice President and Associate General Counsel of FMR LLC (2003-2010). |
Adrien E. Deberghes (1967) |
Year of Election or Appointment: 2008 Deputy Treasurer |
| Mr. Deberghes also serves as an officer of other funds. He is an employee of Fidelity Investments (2008-present). Prior to joining Fidelity Investments, Mr. Deberghes was Senior Vice President of Mutual Fund Administration at State Street Corporation (2007-2008), Senior Director of Mutual Fund Administration at Investors Bank & Trust (2005-2007), and Director of Finance for Dunkin' Brands (2000-2005). |
Stephanie J. Dorsey (1969) |
Year of Election or Appointment: 2010 Assistant Treasurer |
| Ms. Dorsey also serves as an officer of other funds. She is an employee of Fidelity Investments (2008-present) and has served in other fund officer roles. Prior to joining Fidelity Investments, Ms. Dorsey served as Treasurer (2004-2008) of the JPMorgan Mutual Funds and Vice President (2004-2008) of JPMorgan Chase Bank. |
Howard J. Galligan III (1966) |
Year of Election or Appointment: 2014 Chief Financial Officer |
| Mr. Galligan also serves as Chief Financial Officer of other funds. Mr. Galligan serves as President of Fidelity Pricing and Cash Management Services (FPCMS) (2014-present) and as a Director of Strategic Advisers, Inc. (2008-present). Previously, Mr. Galligan served as Chief Administrative Officer of Asset Management (2011-2014) and Chief Operating Officer and Senior Vice President of Investment Support for Strategic Advisers, Inc. (2003-2011). |
Scott C. Goebel (1968) |
Year of Election or Appointment: 2008 Secretary and Chief Legal Officer (CLO) |
| Mr. Goebel serves as Secretary and CLO of other funds. Mr. Goebel also serves as Secretary of Fidelity SelectCo, LLC (2013-present), Fidelity Investments Money Management, Inc. (FIMM) (2010-present) and Fidelity Research and Analysis Company (FRAC) (2010-present); General Counsel, Secretary, and Senior Vice President of FMR (2008-present) and FMR Co., Inc. (2008-present); Chief Legal Officer of Fidelity Management & Research (Hong Kong) Limited (2008-present); and Assistant Secretary of Fidelity Management & Research (Japan) Limited (2008-present) and Fidelity Management & Research (U.K.) Inc. (2008-present). Previously, Mr. Goebel served as Secretary and CLO of other Fidelity funds (2008-2013), Assistant Secretary of FIMM (2008-2010), FRAC (2008-2010), and certain funds (2007-2008); and as Vice President and Secretary of Fidelity Distributors Corporation (FDC) (2005-2007). Mr. Goebel has been employed by FMR LLC or an affiliate since 2001. |
|
Brian B. Hogan (1964) |
Year of Election or Appointment: 2009 Vice President |
| Mr. Hogan also serves as Trustee or Vice President of other funds. Mr. Hogan serves as a Director of Fidelity SelectCo, LLC (2014-present) and President of FMR's Equity Division (2009-present). Previously, Mr. Hogan served as Senior Vice President, Equity Research of FMR (2006-2009) and as a portfolio manager. |
Chris Maher (1972) |
Year of Election or Appointment: 2013 Assistant Treasurer |
| Mr. Maher serves as Assistant Treasurer of other funds. Mr. Maher is Vice President of Valuation Oversight and is an employee of Fidelity Investments. Previously, Mr. Maher served as Vice President of Asset Management Compliance (2013), Vice President of FMR's Program Management Group (2010-2013), and Vice President of Valuation Oversight (2008-2010). |
Kenneth B. Robins (1969) |
Year of Election or Appointment: 2008 President and Treasurer |
| Mr. Robins also serves as an officer of other funds. Mr. Robins serves as Executive Vice President of Fidelity Investments Money Management, Inc. (FIMM) (2013-present) and is an employee of Fidelity Investments (2004-present). Previously, Mr. Robins served in other fund officer roles. |
Stephen Sadoski (1971) |
Year of Election or Appointment: 2012 Deputy Treasurer |
| Mr. Sadoski also serves as Deputy Treasurer of other funds. He is an employee of Fidelity Investments (2012-present) and has served in another fund officer role. Prior to joining Fidelity Investments, Mr. Sadoski served as an assistant chief accountant in the Division of Investment Management of the Securities and Exchange Commission (SEC) (2009-2012) and as a senior manager at Deloitte & Touche LLP (1997-2009). |
Stacie M. Smith (1974) |
Year of Election or Appointment: 2013 Deputy Treasurer |
| Ms. Smith also serves as an officer of other funds. She is an employee of Fidelity Investments (2009-present) and has served in other fund officer roles. Prior to joining Fidelity Investments, Ms. Smith served as Senior Audit Manager of Ernst & Young LLP (1996-2009). |
Renee Stagnone (1975) |
Year of Election or Appointment: 2013 Deputy Treasurer |
| Ms. Stagnone also serves as Deputy Treasurer of other funds. Ms. Stagnone is an employee of Fidelity Investments. |
Linda J. Wondrack (1964) |
Year of Election or Appointment: 2014 Chief Compliance Officer |
| Ms. Wondrack also serves as Chief Compliance Officer of other funds. Ms. Wondrack is Executive Vice President and head of the Ethics Office and Asset Management Compliance for Fidelity Investments (2012-present). Ms. Wondrack also serves as Chief Compliance Officer of Fidelity SelectCo, LLC (2014-present); Chief Compliance Officer of Impresa Management LLC (2013-present); and Chief Compliance Officer of FMR Co., Inc., Fidelity Investments Money Management, Inc., Fidelity Management & Research (Japan) Limited, Fidelity Management & Research (U.K.) Inc., Fidelity Management & Research (Hong Kong), Fidelity Management & Research Company, Pyramis Global Advisors, LLC, and Strategic Advisers, Inc., Ballyrock Investment Advisors LLC, and Northern Neck Investors LLC (2012-present). Previously, Ms. Wondrack served as Senior Vice President and Chief Compliance Officer for Columbia Management Investment Advisers, LLC (2005-2012); Chief Compliance Officer for certain funds within the Columbia Family of Funds (2007-2012); and Senior Vice President of Compliance Risk Management at Bank of America (2005-2010). |
Joseph F. Zambello (1957) |
Year of Election or Appointment: 2011 Deputy Treasurer |
| Mr. Zambello also serves as Deputy Treasurer of other funds. Mr. Zambello is an employee of Fidelity Investments. Previously, Mr. Zambello served as Vice President of FMR's Program Management Group (2009-2011) and Vice President of the Transfer Agent Oversight Group (2005-2009). |
Annual Report
The Board of Trustees of Advisor International Small Cap Opportunities Fund voted to pay to shareholders of record at the opening of business on record date, the following distributions per share derived from capital gains realized from sales of portfolio securities, and dividends derived from net investment income:
| Pay Date | Record Date | Dividends | Capital Gains |
Class A | 12/08/14 | 12/05/14 | $0.050 | $0.021 |
Class T | 12/08/14 | 12/05/14 | $0.006 | $0.021 |
Class B | 12/08/14 | 12/05/14 | $0.000 | $0.000 |
Class C | 12/08/14 | 12/05/14 | $0.000 | $0.000 |
Class A designates 8%, Class T designates 10%, and Class C designates 16% of the dividends distributed in December 2013 during the fiscal year as qualifying for the dividends-received deduction for corporate shareholders.
Class A, Class T, and Class C designates 100% of the dividends distributed in December 2013 during the fiscal year as amounts which may be taken into account as a dividend for purposes of the maximum rate under section 1(h) (11) of the Internal Revenue Code.
The amounts per share which represent income derived from sources within, and taxes paid to, foreign countries or possessions of the United States are as follows:
| Pay Date | Income | Taxes |
Class A | 12/09/2013 | $0.0849 | $0.0152 |
Class T | 12/09/2013 | $0.0672 | $0.0152 |
Class B | 12/09/2013 | $0.0000 | $0.0000 |
Class C | 12/09/2013 | $0.0394 | $0.0152 |
The fund will notify shareholders in January 2015 of amounts for use in preparing 2014 income tax returns.
Annual Report
Board Approval of Investment Advisory Contracts and Management Fees
Fidelity International Small Cap Opportunities Fund
Each year, the Board of Trustees, including the Independent Trustees (together, the Board), votes on the renewal of the management contract with Fidelity Management & Research Company (FMR) and the sub-advisory agreements (together, the Advisory Contracts) for the fund. The Board, assisted by the advice of fund counsel and Independent Trustees' counsel, requests and considers a broad range of information relevant to the renewal of the Advisory Contracts throughout the year.
The Board meets regularly and, at each of its meetings, covers an extensive agenda of topics and materials and considers factors that are relevant to its annual consideration of the renewal of the fund's Advisory Contracts, including the services and support provided to the fund and its shareholders. The Board has established various standing committees (Committees), each composed of and chaired by Independent Trustees with varying backgrounds, to which the Board has assigned specific subject matter responsibilities in order to enhance effective decision-making by the Board. The Board, acting directly and through its Committees, requests and receives information concerning the annual consideration of the renewal of the fund's Advisory Contracts. The Board also meets as needed to consider matters specifically related to the Board's annual consideration of the renewal of the Advisory Contracts. Members of the Board may also meet with trustees of other Fidelity funds through ad hoc joint committees to discuss certain matters relevant to the Fidelity funds.
At its July 2014 meeting, the Board, including the Independent Trustees, unanimously determined to renew the fund's Advisory Contracts. In reaching its determination, the Board considered all factors it believed relevant, including (i) the nature, extent, and quality of the services to be provided to the fund and its shareholders (including the investment performance of the fund); (ii) the competitiveness of the fund's management fee and total expense ratio relative to peer funds; (iii) the total costs of the services to be provided by and the profits to be realized by Fidelity from its relationship with the fund; (iv) the extent to which economies of scale exist and would be realized as the fund grows; and (v) whether fee levels reflect these economies of scale, if any, for the benefit of fund shareholders. In connection with separate internal corporate reorganizations involving Fidelity Management & Research (U.K.) Inc. (FMR U.K.) and Fidelity Management & Research (Japan) Inc. (FMR Japan), the Board approved certain non-material amendments to the fund's sub-advisory agreements with FMR U.K. and FMR Japan to reflect that, after these reorganizations, FMR Investment Management (UK) Limited and Fidelity Management & Research (Japan) Limited will carry on the business of FMR U.K. and FMR Japan, respectively. The Board noted that no changes to the portfolio managers or to the foreign research or investment advisory services provided to the fund were expected in connection with either reorganization and that the same personnel and resources would continue to be available to the fund at the new entities.
Annual Report
In considering whether to renew the Advisory Contracts for the fund, the Board reached a determination, with the assistance of fund counsel and Independent Trustees' counsel and through the exercise of its business judgment, that the renewal of the Advisory Contracts was in the best interests of the fund and its shareholders and that the compensation payable under the Advisory Contracts was fair and reasonable. The Board's decision to renew the Advisory Contracts was not based on any single factor, but rather was based on a comprehensive consideration of all the information provided to the Board at its meetings throughout the year. The Board, in reaching its determination to renew the Advisory Contracts, was aware that shareholders of the fund have a broad range of investment choices available to them, including a wide choice among funds offered by Fidelity's competitors, and that the fund's shareholders, who have the opportunity to review and weigh the disclosure provided by the fund in its prospectus and other public disclosures, have chosen to invest in this fund, which is part of the Fidelity family of funds.
Nature, Extent, and Quality of Services Provided. The Board considered Fidelity's staffing as it relates to the fund, including the backgrounds of investment personnel of FMR and the sub-advisers (together, the Investment Advisers), and also considered the fund's investment objective, strategies, and related investment philosophy. The Independent Trustees also had discussions with senior management of Fidelity's investment operations and investment groups. The Board considered the structure of the portfolio manager compensation program and whether this structure provides appropriate incentives to act in the best interests of the fund. Additionally, the Board considered the portfolio managers' investments, if any, in the funds that they manage.
Resources Dedicated to Investment Management and Support Services. The Board and the Fund Oversight and Research Committees reviewed the general qualificationsand capabilities of Fidelity's investment staff, including its size, education, experience, and resources, as well as Fidelity's approach to recruiting, training, managing, and compensating investment personnel. The Board noted that Fidelity has continued to increase the resources devoted to non-U.S. offices, including expansion of Fidelity's global investment organization. The Board also noted that Fidelity's analysts have extensive resources, tools and capabilities that allow them to conduct sophisticated quantitative and fundamental analysis, as well as credit analysis of issuers, counterparties and guarantors. Further, the Board believes that Fidelity's investment professionals have sufficient access to global information and data so as to provide competitive investment results over time, and that those professionals also have access to sophisticated tools that permit them to assess portfolio construction and risk and performance attribution characteristics continuously, as well as to transmit new information and research conclusions rapidly around the world. Additionally, in its deliberations, the Board considered Fidelity's trading and risk management capabilities and resources and global compliance infrastructure, which are an integral part of the investment management process.
Annual Report
Board Approval of Investment Advisory Contracts and
Management Fees - continued
Shareholder and Administrative Services. The Board considered (i) the nature, extent, quality, and cost of advisory, administrative, and shareholder services performed by the Investment Advisers and their affiliates under the Advisory Contracts and under separate agreements covering transfer agency, pricing and bookkeeping, and securities lending services for the fund; (ii) the nature and extent of the supervision of third party service providers, principally custodians and subcustodians; and (iii) the resources devoted to, and the record of compliance with, the fund's compliance policies and procedures. The Board also reviewed the allocation of fund brokerage, including allocations to brokers affiliated with the Investment Advisers, the use of brokerage commissions to pay fund expenses, and the use of "soft" commission dollars to pay for research services.
The Board noted that the growth of fund assets over time across the complex allows Fidelity to reinvest in the development of services designed to enhance the value or convenience of the Fidelity funds as investment vehicles. These services include 24-hour access to account information and market information through telephone representatives and over the Internet, investor education materials and asset allocation tools, and the expanded availability of Fidelity Investor Centers.
In 2014, the Board formed an ad hoc Committee on Transfer Agency Fees to review the variety of transfer agency fee structures throughout the industry and Fidelity's competitive positioning with respect to industry participants.
Investment in a Large Fund Family. The Board considered the benefits to shareholders of investing in a Fidelity fund, including the benefits of investing in a fund that is part of a large family of funds offering a variety of investment disciplines and providing a large variety of mutual fund investor services. The Board noted that Fidelity had taken, or had made recommendations that resulted in the Fidelity funds taking, a number of actions over the previous year that benefited particular funds, including (i) continuing to dedicate additional resources to investment research and to the support of the senior management team that oversees asset management; (ii) persisting in efforts to enhance Fidelity's global research capabilities; (iii) launching new funds and making other enhancements to meet client needs for income-oriented solutions; (iv) reducing fund expenses for certain index funds; (v) continuing to launch dedicated lower cost underlying funds to meet portfolio construction needs related to expanding underlying fund options for Fidelity funds of funds, specifically for the Freedom Fund product lines; (vi) rationalizing product lines and gaining increased efficiencies through fund mergers; (vii) launching sector-based exchange-traded funds and establishing a new Fidelity adviser to manage sector-based funds and products; (viii) continuing to develop and implement technology to improve security and increase efficiency; (ix) modifying the eligibility criteria for certain share classes to increase their marketability to a portion of the defined contribution plan market; (x) waiving redemption fees for certain qualified fund-of-fund and wrap programs and certain retirement plan transactions; and (xi) launching new Institutional Class shares of certain money market funds to attract and retain assets and to fill a gap in the money market fund lineup.
Annual Report
Investment Performance. The Board considered whether the fund has operated in accordance with its investment objective, as well as its record of compliance with its investment restrictions and its performance history.
The Board took into account discussions with the Investment Advisers about fund investment performance that occur at Board meetings throughout the year. In this regard the Board noted that as part of regularly scheduled fund reviews and other reports to the Board on fund performance, the Board periodically considers annualized return information for the fund, for different time periods, measured against a securities market index ("benchmark index") and a peer group of funds with similar objectives ("peer group"). In its evaluation of fund investment performance, the Board gave particular attention to information indicating changes in performance of certain Fidelity funds for specific time periods and the Investment Advisers' explanations for any overperformance or underperformance.
In addition to reviewing absolute and relative fund performance, the Independent Trustees periodically consider the appropriateness of fund performance metrics in evaluating the results achieved. In general, the Independent Trustees believe that fund performance should be evaluated based on net performance (after fees and expenses) of both the highest performing and lowest performing classes, where applicable, compared to appropriate benchmark indices, over appropriate time periods which may include full market cycles, and compared to peer groups, as applicable, over the same periods, taking into account relevant factors including the following: general market conditions; issuer-specific information; tactical opportunities for investment; and fund cash flows and other factors.
The Independent Trustees recognize that shareholders evaluate performance on a net basis over their own holding periods, for which one-, three-, and five-year periods are often used as a proxy. For this reason, the performance information reviewed by the Board also included net cumulative calendar year total return information for the fund and an appropriate benchmark index and peer group for the most recent one-, three-, and five-year periods, as shown below. Returns are shown compared to the 25th percentile (top of box, 75% beaten) and 75th percentile (bottom of box, 25% beaten) of the peer universe. Returns of the benchmark index are "net MA," i.e., adjusted for tax withholding rates applicable to U.S.-based funds organized as Massachusetts business trusts.
Annual Report
Board Approval of Investment Advisory Contracts and
Management Fees - continued
Fidelity International Small Cap Opportunities Fund
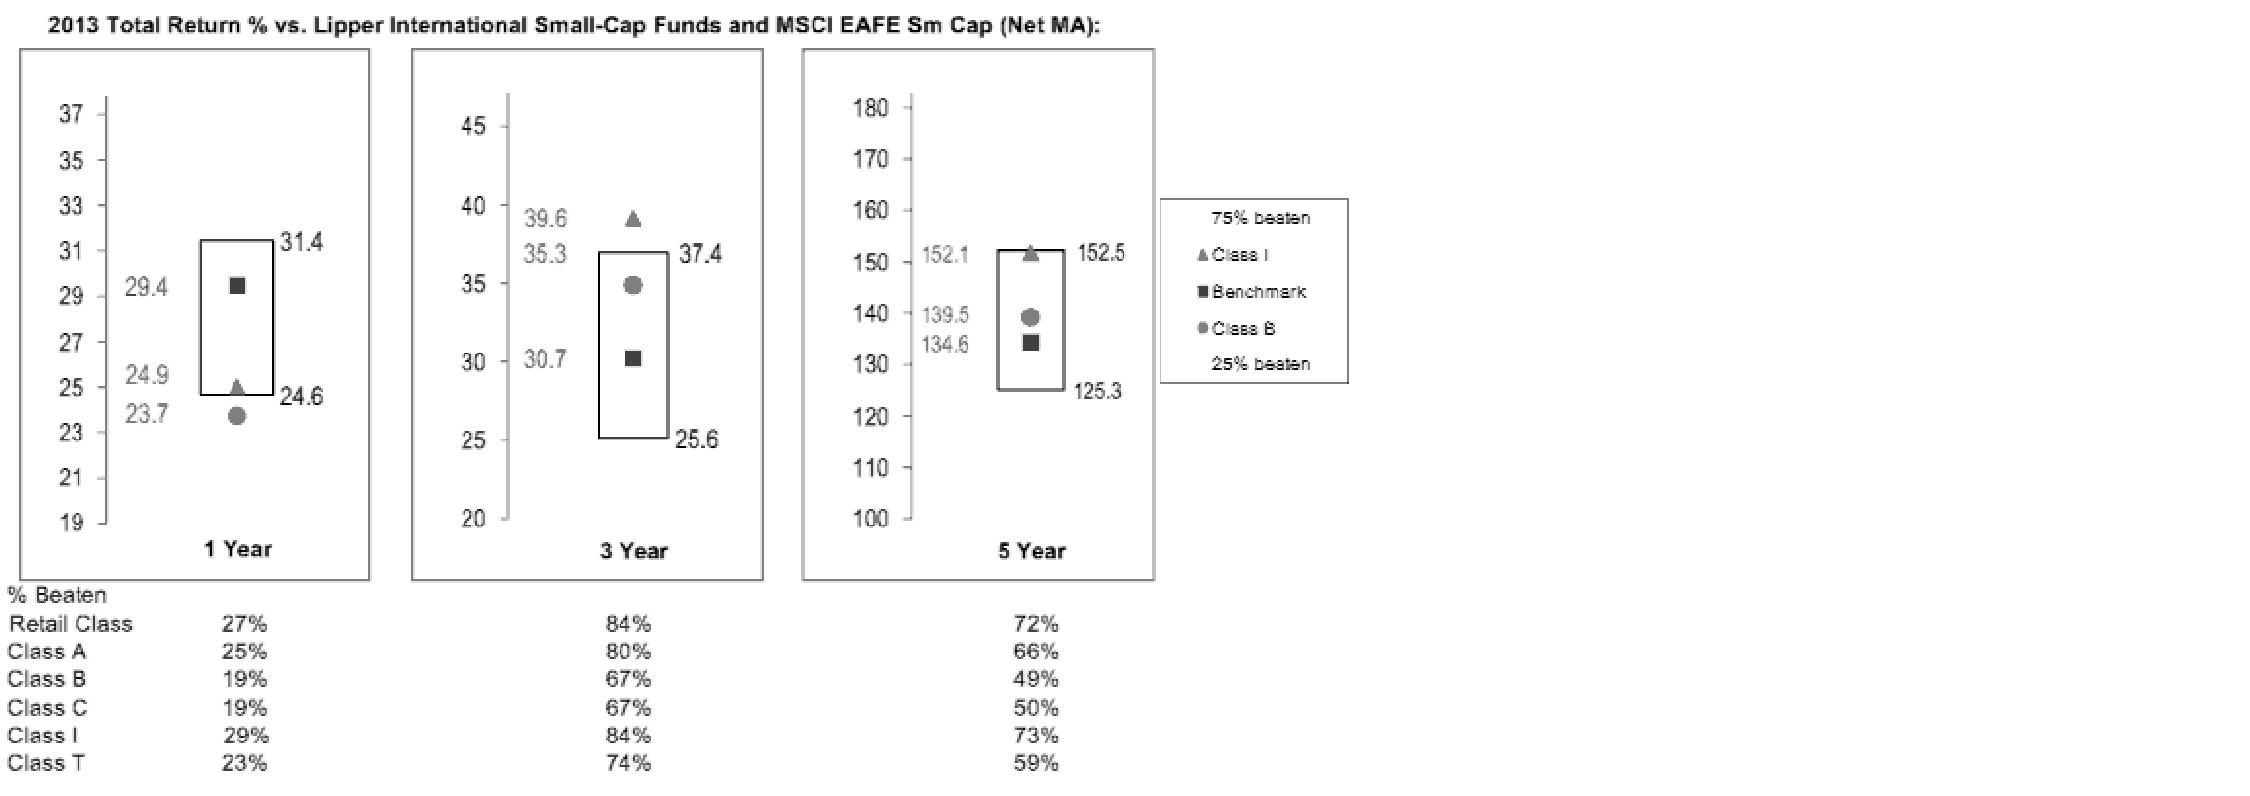
The Board also considered that the fund's management fee is subject to upward or downward adjustment depending upon whether, and to what extent, the fund's investment performance for the performance period exceeds, or is exceeded by, a securities index, thus leading to a performance adjustment for the same period. The Board noted that the performance adjustment provides FMR with a strong economic incentive to seek to achieve superior performance for the fund's shareholders and helps to more closely align the interests of FMR and the fund's shareholders.
Based on its review, the Board concluded that the nature, extent, and quality of services provided to the fund under the Advisory Contracts should benefit the fund's shareholders.
Competitiveness of Management Fee and Total Expense Ratio. The Board considered the fund's management fee and total expense ratio compared to "mapped groups" of competitive funds and classes. Fidelity creates "mapped groups" by combining similar Lipper investment objective categories that have comparable investment mandates. Combining Lipper investment objective categories aids the Board's management fee and total expense ratio comparisons by broadening the competitive group used for comparison and by reducing the number of universes to which various Fidelity funds are compared.
Management Fee. The Board considered two proprietary management fee comparisons for the 12-month periods shown in the chart below. The group of Lipper funds used by the Board for management fee comparisons is referred to below as the "Total Mapped Group." The Total Mapped Group is broader than the Lipper peer group used by the Board for performance comparisons because the Total Mapped Group combines several Lipper investment objective categories while the Lipper peer group does not. The Total Mapped Group comparison focuses on a fund's standing in terms of gross management fees before expense reimbursements or caps, and without giving effect to the fund's performance adjustment, relative to the total universe of funds with comparable investment mandates, regardless of whether their management fee structures also are comparable. Funds with comparable investment mandates offer exposure to similar types of securities. Funds with comparable management fee structures have similar management fee contractual arrangements (e.g., flat rate charged for advisory services, all-inclusive fee rate, etc.). "TMG %" represents the percentage of funds in the Total Mapped Group that had management fees that were lower than the fund's. For example, a hypothetical TMG % of 20% would mean that 80% of the funds in the Total Mapped Group had higher, and 20% had lower, management fees than the fund. The fund's actual TMG %s are in the chart below. The "Asset-Size Peer Group" (ASPG) comparison focuses on a fund's standing relative to a subset of non-Fidelity funds within the Total Mapped Group that are similar in size and management fee structure. For example, if a fund is in the first quartile of the ASPG, the fund's management fee ranks in the least expensive or lowest 25% of funds in the ASPG. The ASPG represents at least 15% of the funds in the Total Mapped Group with comparable asset size and management fee structures, subject to a minimum of 50 funds (or all funds in the Total Mapped Group if fewer than 50). Additional information, such as the ASPG quartile in which the fund's management fee rate ranked and the impact of the fund's performance adjustment, is also included in the chart and considered by the Board.
Annual Report
Fidelity International Small Cap Opportunities Fund
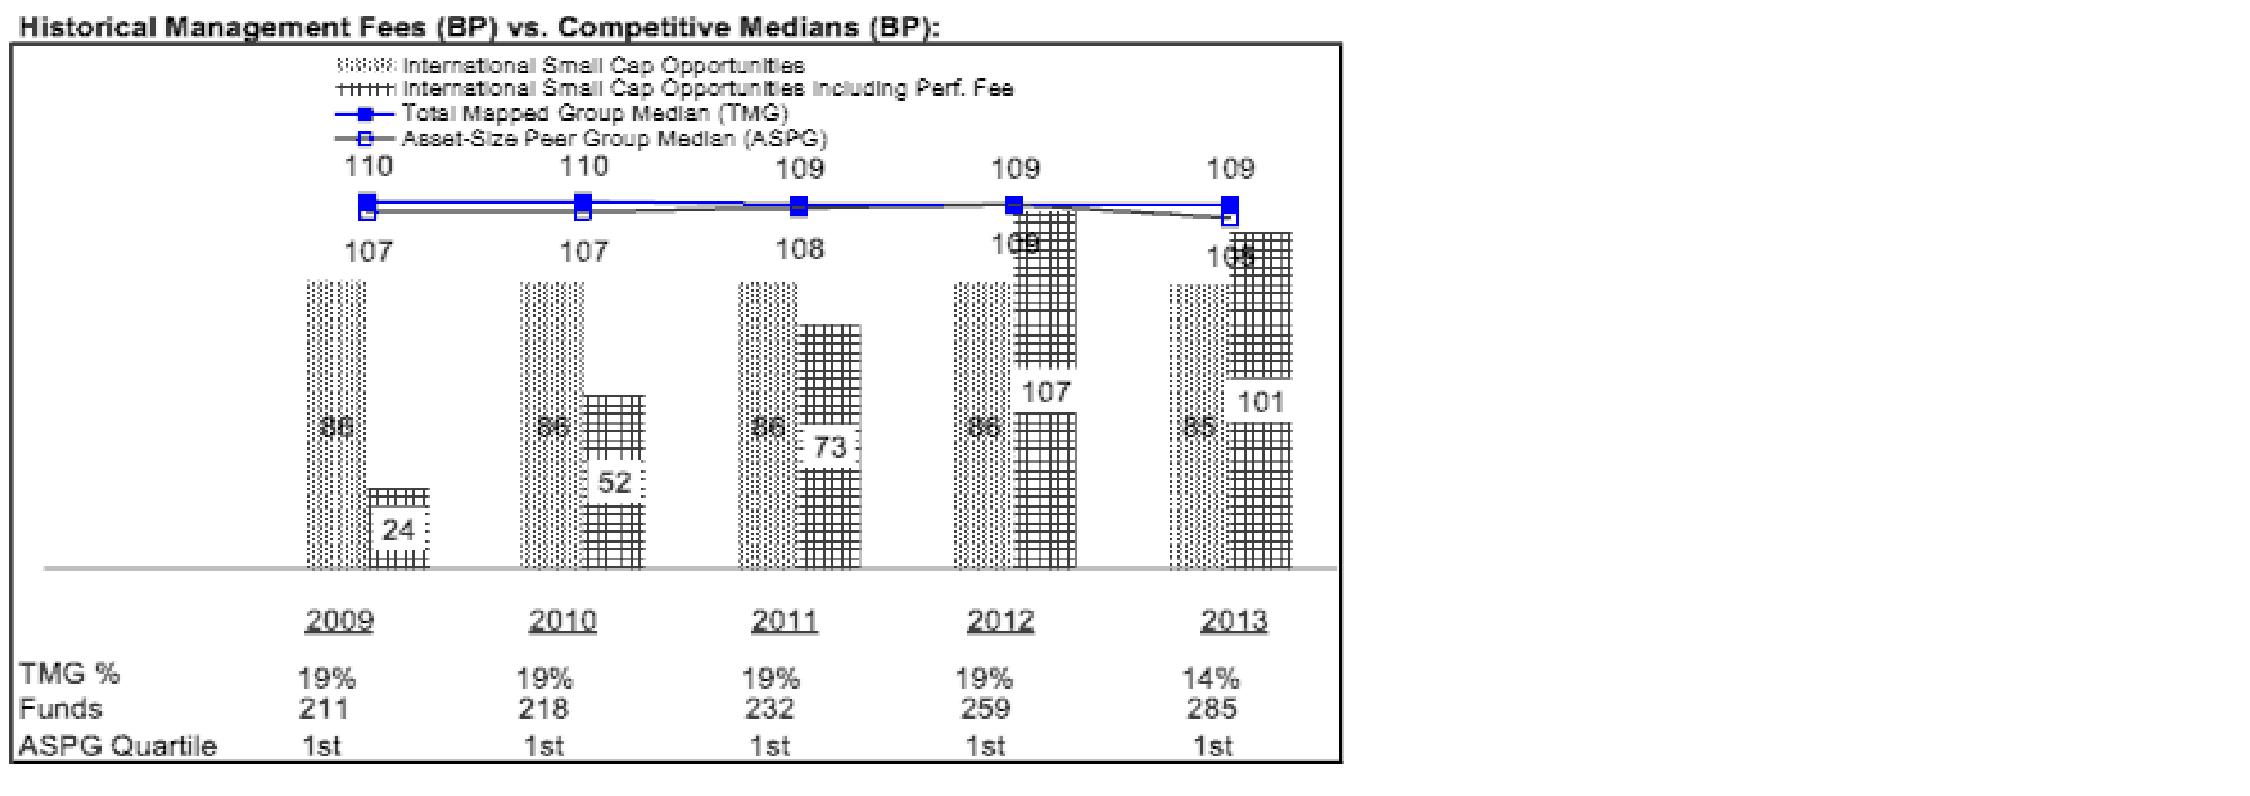
Annual Report
Board Approval of Investment Advisory Contracts and
Management Fees - continued
The Board noted that the fund's management fee rate ranked below the median of its Total Mapped Group and below the median of its ASPG for 2013. The Board also noted the effect of the fund's positive performance adjustment on the fund's management fee ranking.
The Board also noted that, in August 2013, the ad hoc Committee on Management Fees was formed to conduct an in-depth review of the management fee rates of Fidelity's active equity mutual funds. The Committee focused on the following areas: (i) standard fee structures; (ii) research consumption and trading evolution; (iii) management fee competitiveness/profitability by category; and (iv) factors that drive institutional pricing.
Based on its review, the Board concluded that the fund's management fee is fair and reasonable in light of the services that the fund receives and the other factors considered.
Total Expense Ratio. In its review of each class's total expense ratio, the Board considered the fund's management fee as well as other fund or class expenses, as applicable, such as transfer agent fees, pricing and bookkeeping fees, fund-paid 12b-1 fees, and custodial, legal, and audit fees. The Board also noted the effects of any waivers and reimbursements on fees and expenses, as well as the impact of the fund's performance adjustment. As part of its review, the Board also considered the current and historical total expense ratios of each class of the fund compared to competitive fund median expenses. Each class of the fund is compared to those funds and classes in the Total Mapped Group (used by the Board for management fee comparisons) that have a similar sales load structure.
The Board noted that the total expense ratio of each of Class A and the retail class ranked below its competitive median for 2013 and the total expense ratio of each of Class T, Class B, Class C, and Institutional Class ranked above its competitive median for 2013. The Board considered that, in general, various factors can affect total expense ratios. The Board noted that the total expense ratio of Class T was above the competitive median primarily because of higher 12b-1 fees on Class T as compared to most competitor funds. Class T has a higher 12b-1 fee, but a lower front-end sales charge, than traditionally priced front-end sales charge classes. The Board considered that Class T is primarily sold load-waived in the retirement plan market where its 0.50% 12b-1 fee is comparable to competing no-load, higher 12b-1 fee classes designed specifically for retirement plans. The Board noted that the fund offers multiple classes, each of which has a different sales load and 12b-1 fee structure, and that the multiple structures are intended to offer a range of pricing options for the intermediary market. The Board also noted that the total expense ratios of the classes vary primarily by the level of their 12b-1 fees, although differences in transfer agent fees may also cause expenses to vary from class to class.
Annual Report
Fees Charged to Other Fidelity Clients. The Board also considered Fidelity fee structures and other information with respect to clients of Fidelity, such as other funds advised or subadvised by Fidelity, pension plan clients, and other institutional clients. The Board noted the findings of the 2013 ad hoc joint committee (created with the board of other Fidelity funds), which reviewed and compared Fidelity's institutional investment advisory business with its business of providing services to the Fidelity funds, including the differences in services provided, fees charged, and costs incurred, as well as competition in their respective marketplaces.
Based on its review of total expense ratios and fees charged to other Fidelity clients, the Board concluded that the total expense ratio of each class of the fund was reasonable, although in some cases above the median of the universe presented for comparison, in light of the services that the fund and its shareholders receive and the other factors considered.
Costs of the Services and Profitability. The Board considered the revenues earned and the expenses incurred by Fidelity in conducting the business of developing, marketing, distributing, managing, administering and servicing the fund and servicing the fund's shareholders. The Board also considered the level of Fidelity's profits in respect of all the Fidelity funds.
On an annual basis, Fidelity presents to the Board Fidelity's profitability for the fund. Fidelity calculates the profitability for each fund, as well as aggregate profitability for groups of Fidelity funds and all Fidelity funds, using a series of detailed revenue and cost allocation methodologies which originate with the books and records of Fidelity on which Fidelity's audited financial statements are based. The Audit Committee of the Board reviews any significant changes from the prior year's methodologies.
PricewaterhouseCoopers LLP (PwC), independent registered public accounting firm and auditor to Fidelity and certain Fidelity funds, has been engaged annually by the Board as part of the Board's assessment of Fidelity's profitability analysis. PwC's engagement includes the review and assessment of the methodologies used by Fidelity in determining the revenues and expenses attributable to Fidelity's mutual fund business, and completion of agreed-upon procedures in respect of the mathematical accuracy of fund profitability and its conformity to established allocation methodologies. After considering PwC's reports issued under the engagement and information provided by Fidelity, the Board concluded that while other allocation methods may also be reasonable, Fidelity's profitability methodologies are reasonable in all material respects.
The Board also reviewed Fidelity's non-fund businesses and fall-out benefits related to the mutual fund business as well as cases where Fidelity's affiliates may benefit from or be related to the fund's business.
Annual Report
Board Approval of Investment Advisory Contracts and
Management Fees - continued
The Board considered the costs of the services provided by and the profits realized by Fidelity in connection with the operation of the fund and was satisfied that the profitability was not excessive in the circumstances.
Economies of Scale. The Board considered whether there have been economies of scale in respect of the management of the Fidelity funds, whether the Fidelity funds (including the fund) have appropriately benefited from any such economies of scale, and whether there is potential for realization of any further economies of scale. The Board considered the extent to which the fund will benefit from economies of scale through increased services to the fund, through waivers or reimbursements, or through fee or expense ratio reductions. The Board also noted that in 2013, it and the boards of other Fidelity funds created an ad hoc committee (the Economies of Scale Committee) to analyze whether Fidelity attains economies of scale in respect of the management and servicing of the Fidelity funds, whether the Fidelity funds have appropriately benefited from such economies of scale, and whether there is potential for realization of any further economies of scale.
The Board recognized that the fund's management contract incorporates a "group fee" structure, which provides for lower group fee rates as total group assets increase, and for higher group fee rates as total group assets decrease (with "group assets" defined to include fund assets under FMR's management plus sector fund assets previously under FMR's management and currently managed by Fidelity SelectCo, LLC). FMR calculates the group fee rates based on a tiered asset "breakpoint" schedule that varies based on asset class. The Board considered that the group fee is designed to deliver the benefits of economies of scale to fund shareholders when total Fidelity fund assets increase, even if assets of any particular fund are unchanged or have declined, because some portion of Fidelity's costs are attributable to services provided to all Fidelity funds, and all funds benefit if those costs can be allocated among more assets. The Board concluded that, given the group fee structure, fund shareholders will benefit from lower management fees as group assets increase at the fund complex level, regardless of whether Fidelity achieves any such economies of scale.
The Board concluded, taking into account the analysis of the Economies of Scale Committee, that economies of scale, if any, are being appropriately shared between fund shareholders and Fidelity.
Additional Information Requested by the Board. In order to develop fully the factual basis for consideration of the Fidelity funds' Advisory Contracts, the Board requested and received additional information on certain topics, including: (i) fund performance trends and Fidelity's long-term strategies for certain funds; (ii) Fidelity's strategic marketing and product lineup goals; (iii) the methodology with respect to competitive fund data and peer group classifications; (iv) the arrangements with, and performance of, certain sub-advisers on behalf of the Fidelity funds, as well as certain proposed participating affiliate arrangements; (v) the realization of fall-out benefits in certain Fidelity business units; (vi) Fidelity's group fee structures, including the rationale for the individual fee rates of certain categories of funds and the definition of group assets; (vii) trends regarding industry use of performance fee structures and the performance adjustment methodologies applicable to the Fidelity funds; (viii) additional competitive analysis regarding the total expenses for certain classes; (ix) fund profitability methodology, including Fidelity's cost allocation methodology, and the impact of certain factors on fund profitability results; and (x) the process by which Fidelity determines sub-advisory fees for funds it advises.
Annual Report
Based on its evaluation of all of the conclusions noted above, and after considering all factors it believed relevant, the Board ultimately concluded that the advisory fee structures are fair and reasonable, and that the fund's Advisory Contracts should be renewed.
Annual Report
Investment Adviser
Fidelity Management & Research Company
Boston, MA
Investment Sub-Advisers
FMR Co., Inc.
Fidelity Management & Research
(Hong Kong) Limited
Fidelity Management & Research
(Japan) Limited
Fidelity Management & Research
(U.K.) Inc.
FIL Investment Advisors
FIL Investments (Japan) Limited
FIL Investment Advisors (U.K.) Limited
General Distributor
Fidelity Distributors Corporation
Smithfield, RI
Transfer and Service Agents
Fidelity Investments Institutional
Operations Company, Inc.
Boston, MA
Fidelity Service Company, Inc.
Boston, MA
Custodian
The Northern Trust Company
Chicago, IL
(Fidelity Investment logo)(registered trademark)
AILS-UANN-1214
1.815089.109
(Fidelity Investment logo)(registered trademark)
Fidelity Advisor®
International Small Cap Opportunities
Fund - Institutional Class
Annual Report
October 31, 2014
(Fidelity Cover Art)
Institutional Class
is a class of Fidelity®
International Small Cap
Opportunities Fund
Contents
Performance | (Click Here) | How the fund has done over time. |
Management's Discussion of Fund Performance | (Click Here) | The Portfolio Manager's review of fund performance and strategy. |
Shareholder Expense Example | (Click Here) | An example of shareholder expenses. |
Investment Changes | (Click Here) | A summary of major shifts in the fund's investments over the past six months. |
Investments | (Click Here) | A complete list of the fund's investments with their market values. |
Financial Statements | (Click Here) | Statements of assets and liabilities, operations, and changes in net assets, as well as financial highlights. |
Notes | (Click Here) | Notes to the financial statements. |
Report of Independent Registered Public Accounting Firm | (Click Here) | |
Trustees and Officers | (Click Here) | |
Distributions | (Click Here) | |
Board Approval of Investment Advisory Contracts and Management Fees | (Click Here) | |
To view a fund's proxy voting guidelines and proxy voting record for the 12-month period ended June 30, visit http://www.fidelity.com/proxyvotingresults or visit the Securities and Exchange Commission's (SEC) web site at http://www.sec.gov. You may also call 1-877-208-0098 to request a free copy of the proxy voting guidelines.
Standard & Poor's, S&P and S&P 500 are registered service marks of The McGraw-Hill Companies, Inc. and have been licensed for use by Fidelity Distributors Corporation.
Other third-party marks appearing herein are the property of their respective owners.
All other marks appearing herein are registered or unregistered trademarks or service marks of FMR LLC or an affiliated company. © 2014 FMR LLC. All rights reserved.
Annual Report
This report and the financial statements contained herein are submitted for the general information of the shareholders of the fund. This report is not authorized for distribution to prospective investors in the fund unless preceded or accompanied by an effective prospectus.
A fund files its complete schedule of portfolio holdings with the SEC for the first and third quarters of each fiscal year on Form N-Q. Forms N-Q are available on the SEC's web site at http://www.sec.gov. A fund's Forms N-Q may be reviewed and copied at the SEC's Public Reference Room in Washington, DC. Information regarding the operation of the SEC's Public Reference Room may be obtained by calling 1-800-SEC-0330. For a complete list of a fund's portfolio holdings, view the most recent holdings listing, semiannual report, or annual report on Fidelity's web site at http://www.fidelity.com, http://www.advisor.fidelity.com, or http://www.401k.com, as applicable.
NOT FDIC INSURED • MAY LOSE VALUE • NO BANK GUARANTEE
Neither the fund nor Fidelity Distributors Corporation is a bank.
Annual Report
Average annual total return reflects the change in the value of an investment, assuming reinvestment of the class' distributions from dividend income and capital gains (the profits earned upon the sale of securities that have grown in value, if any) and assuming a constant rate of performance each year. The $10,000 table and the fund's returns do not reflect the deduction of taxes that a shareholder would pay on fund distributions or the redemption of fund shares. During periods of reimbursement by Fidelity, a fund's total return will be greater than it would be had the reimbursement not occurred. How a fund did yesterday is no guarantee of how it will do tomorrow.
Average Annual Total Returns
Periods ended October 31, 2014 | Past 1
year | Past 5
years | Life of
fund A |
Institutional Class | 1.11% | 12.84% | 5.77% |
A From August 2, 2005.
$10,000 Over Life of Fund
Let's say hypothetically that $10,000 was invested in Fidelity Advisor® International Small Cap Opportunities Fund - Institutional Class on August 2, 2005, when the fund started. The chart shows how the value of your investment would have changed, and also shows how the MSCI EAFE Small Cap Index performed over the same period.
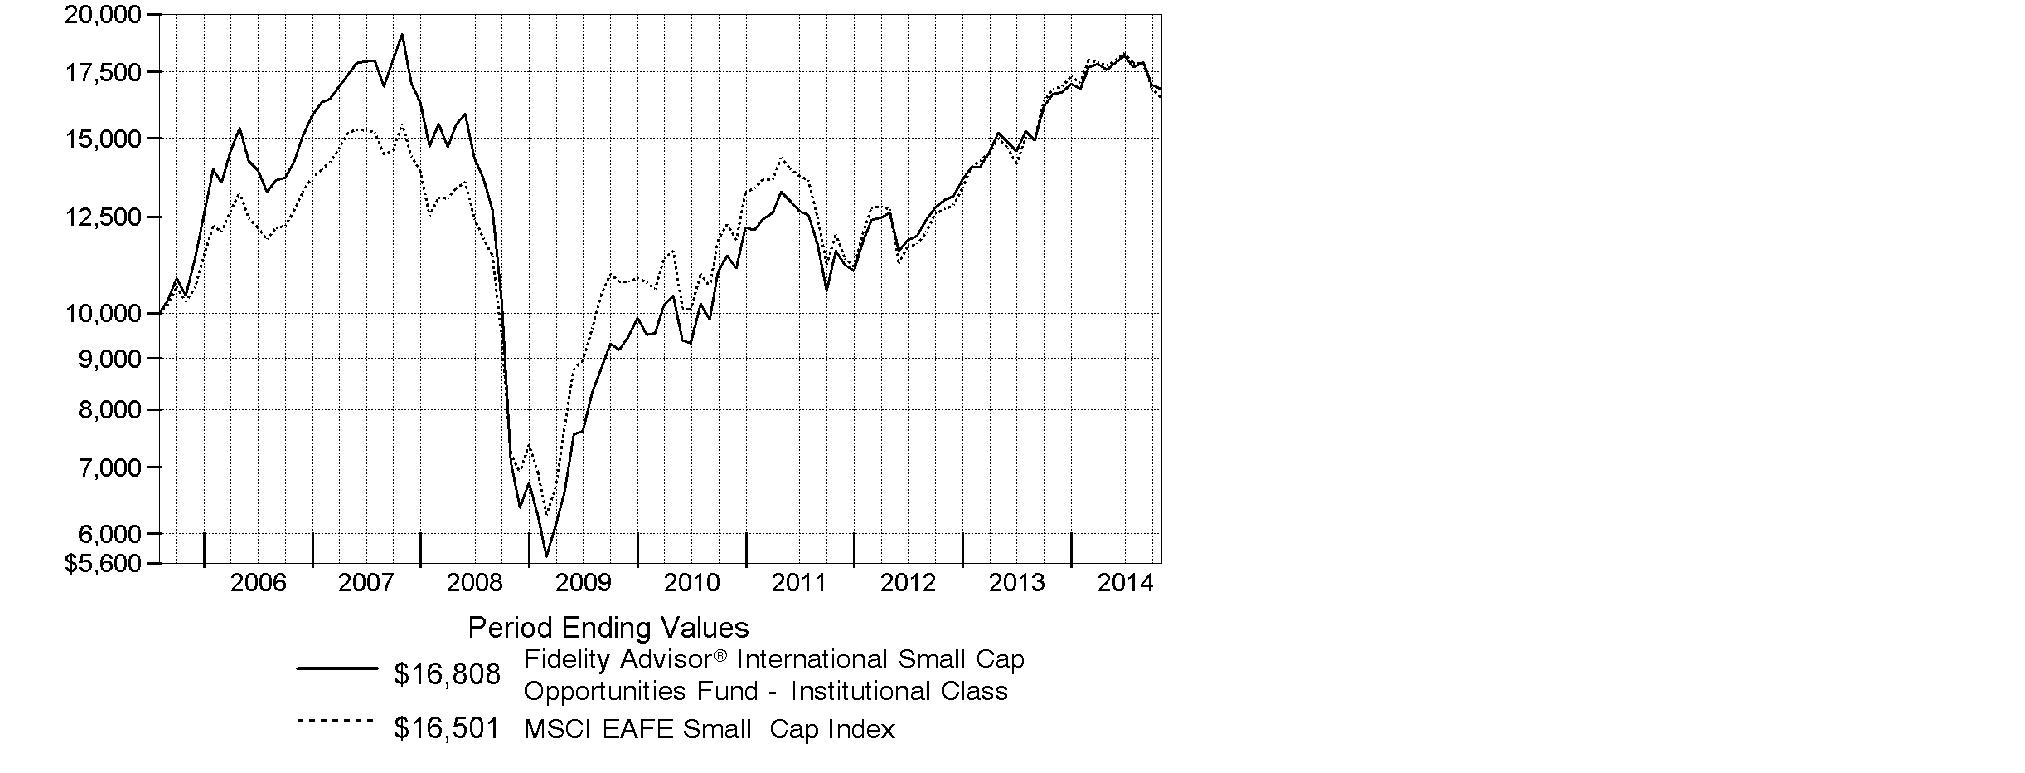
Annual Report
Market Recap: Global equities posted a healthy gain for the 12 months ending October 31, 2014, overcoming an October market decline driven by recessionary pressures in China and tepid growth in Europe. The MSCI ACWI (All Country World Index) Index rose 8.15%, helped by subdued market volatility for much of the period and supported by solid corporate earnings, especially in the United States. Stocks also benefited from easy monetary policies in Japan and the eurozone, as well as increased stimulus efforts in China. All but three of the 24 industry groups that compose the index marked a positive return. The U.S. (+17%) remained a pillar of strength, while a strongly rising dollar in the latter part of the period detracted from investors' returns in most non-U.S. markets. Canada (+5%) notched broad gains outside of its energy and materials sectors, as did Asia-Pacific ex Japan (+4%), led by investor enthusiasm for companies in India. The U.K., Europe and Japan, meanwhile, all underperformed. Among sectors, health care (+24%) led the index, with a strong contribution from the pharmaceuticals, biotechnology & life sciences industry. Information technology (+21%) also outperformed. Conversely, materials (-4%) and energy (-1%) lagged the index due to a higher supply of and lower demand for commodities.
Comments from Jed Weiss, Portfolio Manager of Fidelity Advisor® International Small Cap Opportunities Fund: For the year, the fund's Institutional Class shares gained 1.11%, ahead of the benchmark MSCI EAFE Small Cap Index, which returned -1.91%. The fund especially benefited in relative terms from strong stock selection in Japan, the Netherlands and Sweden within Europe, and South Korea and South Africa within emerging markets. The fund's positioning in Denmark and stock selection in Turkey were minor negatives. On an individual basis, Fagerhult, a Swedish manufacturer of lighting fixtures, added the most value. Harmonic Drive Systems, a Japanese maker of gears for robotic arms, also contributed to the fund's results, as did South Korea's Coway and U.K.-based hotel company Intercontinental Hotel Group. In contrast, the biggest detractor was PriceSmart, a U.S.-based warehouse retailer that does nearly all of its business in Central America and Colombia. During the period, PriceSmart stock struggled as weak emerging-market economies and a maturing market in Central America made the business environment a little tougher. Another detractor was Goldcrest, a Japanese real estate company whose shares were hurt as pessimism grew about the Japanese economy. Of all the stocks mentioned, Goldcrest was the lone index member.
Annual Report
The views expressed above reflect those of the portfolio manager(s) only through the end of the period as stated on the cover of this report and do not necessarily represent the views of Fidelity or any other person in the Fidelity organization. Any such views are subject to change at any time based upon market or other conditions and Fidelity disclaims any responsibility to update such views. These views may not be relied on as investment advice and, because investment decisions for a Fidelity fund are based on numerous factors, may not be relied on as an indication of trading intent on behalf of any Fidelity fund.
Annual Report
Shareholder Expense Example
As a shareholder of the Fund, you incur two types of costs: (1) transaction costs, including sales charges (loads) on purchase payments or redemption proceeds, redemption fees and (2) ongoing costs, including management fees, distribution and/or service (12b-1) fees and other Fund expenses. This Example is intended to help you understand your ongoing costs (in dollars) of investing in the Fund and to compare these costs with the ongoing costs of investing in other mutual funds.
The Example is based on an investment of $1,000 invested at the beginning of the period and held for the entire period (May 1, 2014 to October 31, 2014).
Actual Expenses
The first line of the accompanying table for each class of the Fund provides information about actual account values and actual expenses. You may use the information in this line, together with the amount you invested, to estimate the expenses that you paid over the period. Simply divide your account value by $1,000.00 (for example, an $8,600 account value divided by $1,000.00 = 8.6), then multiply the result by the number in the first line for a class of the Fund under the heading entitled "Expenses Paid During Period" to estimate the expenses you paid on your account during this period. A small balance maintenance fee of $12.00 that is charged once a year may apply for certain accounts with a value of less than $2,000. This fee is not included in the table below. If it was, the estimate of expenses you paid during the period would be higher, and your ending account value lower, by this amount. In addition, the Fund, as a shareholder in the underlying Fidelity Central Funds, will indirectly bear its pro-rata share of the fees and expenses incurred by the underlying Fidelity Central Funds. These fees and expenses are not included in the Fund's annualized expense ratio used to calculate the expense estimate in the table below.
Hypothetical Example for Comparison Purposes
The second line of the accompanying table for each class of the Fund provides information about hypothetical account values and hypothetical expenses based on a Class' actual expense ratio and an assumed rate of return of 5% per year before expenses, which is not the Class' actual return. The hypothetical account values and expenses may not be used to estimate the actual ending account balance or expenses you paid for the period. You may use this information to compare the ongoing costs of investing in the Fund and other funds. To do so, compare this 5% hypothetical example with the 5% hypothetical examples that appear in the shareholder reports of the other funds. A small balance maintenance fee of $12.00 that is charged once a year may apply for certain accounts with a value of less than $2,000. This fee is not included in the table below. If it was, the estimate of expenses you paid during the period would be higher, and your ending account value lower, by this amount. In addition, the Fund, as a shareholder in the underlying Fidelity Central Funds, will indirectly bear its pro-rata share of the fees and expenses incurred by the underlying Fidelity Central Funds. These fees and expenses are not included in the Fund's annualized expense ratio used to calculate the expense estimate in the table below.
Please note that the expenses shown in the table are meant to highlight your ongoing costs only and do not reflect any transaction costs. Therefore, the second line of the table is useful in comparing ongoing costs only, and will not help you determine the relative total costs of owning different funds. In addition, if these transactional costs were included, your costs would have been higher.
Annual Report
| Annualized
Expense RatioB | Beginning
Account Value
May 1, 2014 | Ending
Account Value
October 31, 2014 | Expenses Paid
During Period*
May 1, 2014
to October 31, 2014 |
Class A | 1.63% | | | |
Actual | | $ 1,000.00 | $ 954.50 | $ 8.03 |
HypotheticalA | | $ 1,000.00 | $ 1,016.99 | $ 8.29 |
Class T | 1.88% | | | |
Actual | | $ 1,000.00 | $ 953.50 | $ 9.26 |
HypotheticalA | | $ 1,000.00 | $ 1,015.73 | $ 9.55 |
Class B | 2.36% | | | |
Actual | | $ 1,000.00 | $ 950.70 | $ 11.60 |
HypotheticalA | | $ 1,000.00 | $ 1,013.31 | $ 11.98 |
Class C | 2.37% | | | |
Actual | | $ 1,000.00 | $ 951.10 | $ 11.66 |
HypotheticalA | | $ 1,000.00 | $ 1,013.26 | $ 12.03 |
International Small Cap Opportunities | 1.30% | | | |
Actual | | $ 1,000.00 | $ 956.30 | $ 6.41 |
HypotheticalA | | $ 1,000.00 | $ 1,018.65 | $ 6.61 |
Institutional Class | 1.38% | | | |
Actual | | $ 1,000.00 | $ 955.70 | $ 6.80 |
HypotheticalA | | $ 1,000.00 | $ 1,018.25 | $ 7.02 |
A 5% return per year before expenses
B Annualized expense ratio reflects expenses net of applicable fee waivers.
* Expenses are equal to each Class' annualized expense ratio, multiplied by the average account value over the period, multiplied by 184/365 (to reflect the one-half year period).
Annual Report
Investment Changes (Unaudited)
Geographic Diversification (% of fund's net assets) |
As of October 31, 2014 |
 | Japan 27.3% | |
 | United Kingdom 20.5% | |
 | United States of America* 12.8% | |
 | Germany 4.8% | |
 | Italy 4.0% | |
 | Netherlands 3.5% | |
 | Sweden 2.7% | |
 | Korea (South) 2.4% | |
 | France 2.0% | |
 | Other 20.0% | |

Percentages are based on country or territory of incorporation and are adjusted for the effect of futures contracts, if applicable. |
* Includes Short-Term Investments and Net Other Assets (Liabilities). |
As of April 30, 2014 |
| Japan 22.8% | |
| United Kingdom 18.2% | |
| United States of America* 17.3% | |
| Germany 5.6% | |
| Italy 4.4% | |
| Netherlands 4.0% | |
| Sweden 2.5% | |
| France 2.3% | |
| Ireland 2.2% | |
| Other 20.7% | |

Percentages are based on country or territory of incorporation and are adjusted for the effect of futures contracts, if applicable. |
* Includes Short-Term Investments and Net Other Assets (Liabilities). |
Asset Allocation as of October 31, 2014 |
| % of fund's
net assets | % of fund's net assets
6 months ago |
Stocks | 97.2 | 93.6 |
Short-Term Investments and Net Other Assets (Liabilities) | 2.8 | 6.4 |
Top Ten Stocks as of October 31, 2014 |
| % of fund's
net assets | % of fund's net assets
6 months ago |
USS Co. Ltd. (Japan, Specialty Retail) | 2.3 | 2.0 |
Spirax-Sarco Engineering PLC (United Kingdom, Machinery) | 1.7 | 1.6 |
Unite Group PLC (United Kingdom, Real Estate Management & Development) | 1.6 | 1.6 |
SS&C Technologies Holdings, Inc. (United States of America, Software) | 1.6 | 1.1 |
Berendsen PLC (United Kingdom, Commercial Services & Supplies) | 1.5 | 0.9 |
CTS Eventim AG (Germany, Media) | 1.5 | 1.5 |
Azimut Holding SpA (Italy, Capital Markets) | 1.5 | 1.7 |
Fagerhult AB (Sweden, Electrical Equipment) | 1.5 | 1.2 |
Interpump Group SpA (Italy, Machinery) | 1.4 | 1.6 |
OSG Corp. (Japan, Machinery) | 1.4 | 1.2 |
| 16.0 | |
Market Sectors as of October 31, 2014 |
| % of fund's
net assets | % of fund's net assets
6 months ago |
Industrials | 20.5 | 21.0 |
Financials | 19.4 | 19.3 |
Consumer Discretionary | 18.4 | 16.9 |
Materials | 10.7 | 9.8 |
Consumer Staples | 9.6 | 9.1 |
Information Technology | 9.2 | 7.9 |
Health Care | 6.4 | 6.7 |
Energy | 3.0 | 2.9 |
Annual Report
Investments October 31, 2014
Showing Percentage of Net Assets
Common Stocks - 96.3% |
| Shares | | Value |
Australia - 1.7% |
DuluxGroup Ltd. | 548,583 | | $ 2,592,535 |
Imdex Ltd. (a) | 1,779,471 | | 942,244 |
RCG Corp. Ltd. | 3,726,715 | | 2,015,918 |
Sydney Airport unit | 795,862 | | 3,094,100 |
TFS Corp. Ltd. | 1,926,002 | | 2,669,496 |
TOTAL AUSTRALIA | | 11,314,293 |
Austria - 1.2% |
Andritz AG | 117,900 | | 5,691,191 |
Zumtobel AG | 144,181 | | 2,541,270 |
TOTAL AUSTRIA | | 8,232,461 |
Belgium - 1.2% |
Gimv NV | 66,688 | | 3,029,415 |
KBC Ancora (a) | 172,738 | | 4,997,132 |
TOTAL BELGIUM | | 8,026,547 |
Bermuda - 1.1% |
Lazard Ltd. Class A | 61,499 | | 3,026,366 |
Petra Diamonds Ltd. (a) | 787,509 | | 2,091,232 |
Vostok Nafta Investment Ltd. SDR (a) | 316,909 | | 2,029,996 |
TOTAL BERMUDA | | 7,147,594 |
Brazil - 0.3% |
Arezzo Industria e Comercio SA | 169,900 | | 1,967,848 |
T4F Entretenimento SA (a) | 19,200 | | 21,696 |
TOTAL BRAZIL | | 1,989,544 |
British Virgin Islands - 0.4% |
Gem Diamonds Ltd. (a) | 1,047,996 | | 2,602,734 |
Canada - 1.6% |
Pason Systems, Inc. | 266,200 | | 6,370,094 |
ShawCor Ltd. Class A | 92,400 | | 4,070,503 |
TOTAL CANADA | | 10,440,597 |
Cayman Islands - 0.2% |
58.com, Inc. ADR | 30,600 | | 1,210,842 |
Denmark - 1.7% |
Jyske Bank A/S (Reg.) (a) | 115,827 | | 6,240,364 |
Spar Nord Bank A/S | 521,369 | | 5,266,797 |
TOTAL DENMARK | | 11,507,161 |
Common Stocks - continued |
| Shares | | Value |
Finland - 0.7% |
Tikkurila Oyj | 219,753 | | $ 4,538,320 |
France - 2.0% |
Coface SA | 141,800 | | 1,766,305 |
Laurent-Perrier Group SA | 31,163 | | 2,499,322 |
Saft Groupe SA | 57,516 | | 1,708,205 |
Vetoquinol SA | 56,184 | | 2,534,651 |
Virbac SA | 20,052 | | 4,484,121 |
TOTAL FRANCE | | 12,992,604 |
Germany - 3.9% |
alstria office REIT-AG | 249,000 | | 3,087,268 |
CompuGroup Medical AG | 269,478 | | 6,179,843 |
CTS Eventim AG | 372,280 | | 9,815,637 |
Fielmann AG | 96,874 | | 6,316,320 |
TOTAL GERMANY | | 25,399,068 |
Greece - 0.7% |
Titan Cement Co. SA (Reg.) | 196,480 | | 4,355,613 |
India - 0.5% |
Jyothy Laboratories Ltd. (a) | 857,717 | | 3,498,544 |
Ireland - 1.8% |
FBD Holdings PLC | 240,328 | | 4,065,755 |
James Hardie Industries PLC: | | | |
CDI | 165,775 | | 1,768,263 |
sponsored ADR | 112,915 | | 6,021,757 |
TOTAL IRELAND | | 11,855,775 |
Israel - 1.7% |
Azrieli Group | 90,005 | | 2,889,292 |
Ituran Location & Control Ltd. | 84,286 | | 1,727,020 |
Sarine Technologies Ltd. | 1,308,000 | | 3,033,378 |
Strauss Group Ltd. | 214,344 | | 3,457,298 |
TOTAL ISRAEL | | 11,106,988 |
Italy - 4.0% |
Azimut Holding SpA | 411,997 | | 9,623,721 |
Beni Stabili SpA SIIQ | 10,445,675 | | 7,192,954 |
Interpump Group SpA | 722,943 | | 9,421,943 |
TOTAL ITALY | | 26,238,618 |
Japan - 27.3% |
Air Water, Inc. | 131,000 | | 2,088,180 |
Common Stocks - continued |
| Shares | | Value |
Japan - continued |
Aozora Bank Ltd. | 2,035,000 | | $ 7,152,839 |
Artnature, Inc. (d) | 292,600 | | 3,956,987 |
Asahi Co. Ltd. | 241,100 | | 2,680,751 |
Autobacs Seven Co. Ltd. | 212,000 | | 3,110,003 |
Azbil Corp. | 223,100 | | 5,380,163 |
Broadleaf Co. Ltd. | 51,000 | | 806,063 |
Coca-Cola Central Japan Co. Ltd. | 245,400 | | 4,415,498 |
Cosmos Pharmaceutical Corp. | 31,300 | | 4,475,248 |
Daiichikosho Co. Ltd. | 79,400 | | 2,003,776 |
Daikokutenbussan Co. Ltd. | 168,700 | | 4,908,757 |
Glory Ltd. | 96,800 | | 2,494,487 |
Goldcrest Co. Ltd. | 316,330 | | 5,723,003 |
Harmonic Drive Systems, Inc. | 260,700 | | 3,365,610 |
Iwatsuka Confectionary Co. Ltd. | 63,300 | | 3,419,313 |
Kobayashi Pharmaceutical Co. Ltd. | 72,500 | | 4,475,182 |
Koshidaka Holdings Co. Ltd. | 141,200 | | 2,411,118 |
Kyoto Kimono Yuzen Co. Ltd. | 78,500 | | 707,348 |
Lasertec Corp. | 220,900 | | 2,763,839 |
Medikit Co. Ltd. | 71,200 | | 2,218,561 |
Meiko Network Japan Co. Ltd. | 112,600 | | 1,266,143 |
Miraial Co. Ltd. | 73,200 | | 1,127,074 |
Nabtesco Corp. | 185,800 | | 4,496,454 |
Nagaileben Co. Ltd. | 292,600 | | 5,624,057 |
ND Software Co. Ltd. | 35,491 | | 636,001 |
Nihon M&A Center, Inc. | 68,900 | | 1,980,136 |
Nihon Parkerizing Co. Ltd. | 334,000 | | 7,972,492 |
Nippon Seiki Co. Ltd. | 143,000 | | 3,046,346 |
NS Tool Co. Ltd. | 35,600 | | 408,889 |
OBIC Co. Ltd. | 189,800 | | 6,775,679 |
OSG Corp. | 568,100 | | 9,263,550 |
Paramount Bed Holdings Co. Ltd. | 60,700 | | 1,726,444 |
San-Ai Oil Co. Ltd. | 381,000 | | 2,637,316 |
Seven Bank Ltd. | 2,163,800 | | 9,036,897 |
SHO-BOND Holdings Co. Ltd. | 193,700 | | 7,484,619 |
Shoei Co. Ltd. | 249,100 | | 3,806,780 |
SK Kaken Co. Ltd. | 34,000 | | 2,602,107 |
Software Service, Inc. | 62,900 | | 2,395,403 |
Techno Medica Co. Ltd. | 79,400 | | 1,719,455 |
TFP Consulting Group Co. Ltd. | 41,700 | | 1,216,523 |
The Nippon Synthetic Chemical Industry Co. Ltd. | 436,000 | | 2,662,060 |
TKC Corp. | 156,900 | | 3,080,143 |
Tocalo Co. Ltd. | 117,000 | | 2,207,069 |
Common Stocks - continued |
| Shares | | Value |
Japan - continued |
Tsutsumi Jewelry Co. Ltd. | 81,000 | | $ 1,992,316 |
USS Co. Ltd. | 955,800 | | 15,042,372 |
Workman Co. Ltd. | 79,400 | | 4,149,861 |
Yamato Kogyo Co. Ltd. | 217,900 | | 7,058,866 |
TOTAL JAPAN | | 179,971,778 |
Korea (South) - 2.4% |
Bgf Retail (a) | 58,838 | | 3,723,768 |
Coway Co. Ltd. | 114,533 | | 8,698,345 |
Leeno Industrial, Inc. | 89,751 | | 3,554,305 |
TOTAL KOREA (SOUTH) | | 15,976,418 |
Mexico - 0.6% |
Consorcio ARA S.A.B. de CV (a) | 9,235,478 | | 4,252,109 |
Netherlands - 3.5% |
Aalberts Industries NV | 319,501 | | 8,506,130 |
ASM International NV (depositary receipt) | 63,400 | | 2,075,082 |
Heijmans NV (Certificaten Van Aandelen) | 365,133 | | 4,960,020 |
VastNed Retail NV | 164,729 | | 7,521,282 |
TOTAL NETHERLANDS | | 23,062,514 |
Philippines - 0.5% |
Jollibee Food Corp. | 727,170 | | 3,169,279 |
South Africa - 1.7% |
Alexander Forbes Group Holding (a) | 2,593,721 | | 2,022,349 |
Clicks Group Ltd. | 878,287 | | 5,980,131 |
Nampak Ltd. | 795,900 | | 3,245,008 |
TOTAL SOUTH AFRICA | | 11,247,488 |
Spain - 1.0% |
Prosegur Compania de Seguridad SA (Reg.) | 1,102,590 | | 6,466,406 |
Sweden - 2.7% |
Fagerhult AB | 512,812 | | 9,444,883 |
Intrum Justitia AB | 273,334 | | 8,121,379 |
TOTAL SWEDEN | | 17,566,262 |
Taiwan - 0.3% |
Addcn Technology Co. Ltd. | 210,000 | | 2,019,633 |
Common Stocks - continued |
| Shares | | Value |
Turkey - 1.1% |
Albaraka Turk Katilim Bankasi A/S | 3,666,046 | | $ 2,589,563 |
Coca-Cola Icecek Sanayi A/S | 206,362 | | 4,707,243 |
TOTAL TURKEY | | 7,296,806 |
United Kingdom - 20.5% |
Advanced Computer Software Group PLC | 1,223,900 | | 2,114,503 |
Babcock International Group PLC | 164,700 | | 2,885,003 |
Bellway PLC | 327,072 | | 9,151,067 |
Berendsen PLC | 613,663 | | 9,914,935 |
Britvic PLC | 511,971 | | 5,573,295 |
Dechra Pharmaceuticals PLC | 351,050 | | 4,256,736 |
Derwent London PLC | 101,710 | | 4,833,980 |
Elementis PLC | 1,558,710 | | 6,580,263 |
Great Portland Estates PLC | 621,789 | | 6,828,450 |
H&T Group PLC | 264,353 | | 672,388 |
Hilton Food Group PLC | 217,188 | | 1,302,884 |
Informa PLC | 901,781 | | 6,938,805 |
InterContinental Hotel Group PLC ADR | 141,931 | | 5,394,797 |
ITE Group PLC | 979,734 | | 2,668,295 |
Johnson Matthey PLC | 96,475 | | 4,589,806 |
Meggitt PLC | 640,590 | | 4,622,655 |
Persimmon PLC | 171,863 | | 4,022,215 |
Rotork PLC | 119,700 | | 4,892,419 |
Shaftesbury PLC | 687,673 | | 7,876,505 |
Spectris PLC | 279,178 | | 8,047,751 |
Spirax-Sarco Engineering PLC | 238,421 | | 10,869,959 |
Ted Baker PLC | 133,700 | | 4,159,964 |
Ultra Electronics Holdings PLC | 218,058 | | 6,087,038 |
Unite Group PLC | 1,534,757 | | 10,483,494 |
TOTAL UNITED KINGDOM | | 134,767,207 |
United States of America - 10.0% |
ANSYS, Inc. (a) | 21,085 | | 1,656,438 |
Autoliv, Inc. | 57,100 | | 5,238,354 |
Broadridge Financial Solutions, Inc. | 48,905 | | 2,148,397 |
Dril-Quip, Inc. (a) | 39,595 | | 3,561,570 |
Evercore Partners, Inc. Class A | 56,600 | | 2,930,182 |
Kennedy-Wilson Holdings, Inc. | 250,229 | | 6,778,704 |
Martin Marietta Materials, Inc. | 52,020 | | 6,082,178 |
Mohawk Industries, Inc. (a) | 47,800 | | 6,789,512 |
Oceaneering International, Inc. | 42,502 | | 2,986,616 |
PriceSmart, Inc. | 75,199 | | 6,694,967 |
Common Stocks - continued |
| Shares | | Value |
United States of America - continued |
ResMed, Inc. (d) | 49,100 | | $ 2,564,002 |
Solera Holdings, Inc. | 152,056 | | 7,899,309 |
SS&C Technologies Holdings, Inc. (a) | 212,058 | | 10,246,643 |
TOTAL UNITED STATES OF AMERICA | | 65,576,872 |
TOTAL COMMON STOCKS (Cost $519,760,738) |
633,830,075
|
Nonconvertible Preferred Stocks - 0.9% |
| | | |
Germany - 0.9% |
Sartorius AG (non-vtg.)
(Cost $5,714,273) | 50,279 | |
5,481,620
|
Money Market Funds - 2.7% |
| | | |
Fidelity Cash Central Fund, 0.11% (b) | 16,109,819 | | 16,109,819 |
Fidelity Securities Lending Cash Central Fund, 0.11% (b)(c) | 1,839,312 | | 1,839,312 |
TOTAL MONEY MARKET FUNDS (Cost $17,949,131) |
17,949,131
|
TOTAL INVESTMENT PORTFOLIO - 99.9% (Cost $543,424,142) | | 657,260,826 |
NET OTHER ASSETS (LIABILITIES) - 0.1% | | 950,326 |
NET ASSETS - 100% | $ 658,211,152 |
Legend |
(a) Non-income producing |
(b) Affiliated fund that is generally available only to investment companies and other accounts managed by Fidelity Investments. The rate quoted is the annualized seven-day yield of the fund at period end. A complete unaudited listing of the fund's holdings as of its most recent quarter end is available upon request. In addition, each Fidelity Central Fund's financial statements, which are not covered by the Fund's Report of Independent Registered Public Accounting Firm, are available on the SEC's website or upon request. |
(c) Investment made with cash collateral received from securities on loan. |
(d) Security or a portion of the security is on loan at period end. |
Affiliated Central Funds |
Information regarding fiscal year to date income earned by the Fund from investments in Fidelity Central Funds is as follows: |
Fund | Income earned |
Fidelity Cash Central Fund | $ 30,975 |
Fidelity Securities Lending Cash Central Fund | 171,600 |
Total | $ 202,575 |
Other Information |
Categorizations in the Schedule of Investments are based on country or territory of incorporation. |
The following is a summary of the inputs used, as of October 31, 2014, involving the Fund's assets and liabilities carried at fair value. The inputs or methodology used for valuing securities may not be an indication of the risk associated with investing in those securities. For more information on valuation inputs, and their aggregation into the levels used in the tables below, please refer to the Investment Valuation section in the accompanying Notes to Financial Statements. |
Valuation Inputs at Reporting Date: |
Description | Total | Level 1 | Level 2 | Level 3 |
Investments in Securities: | | | | |
Equities: | | | | |
Consumer Discretionary | $ 120,836,975 | $ 75,434,964 | $ 45,402,011 | $ - |
Consumer Staples | 63,088,437 | 33,938,908 | 29,149,529 | - |
Energy | 19,626,099 | 16,988,783 | 2,637,316 | - |
Financials | 127,665,001 | 105,752,262 | 21,912,739 | - |
Health Care | 41,935,397 | 27,615,476 | 14,319,921 | - |
Industrials | 135,178,251 | 96,133,436 | 39,044,815 | - |
Information Technology | 60,518,381 | 38,565,787 | 21,952,594 | - |
Materials | 70,463,154 | 40,106,911 | 30,356,243 | - |
Money Market Funds | 17,949,131 | 17,949,131 | - | - |
Total Investments in Securities: | $ 657,260,826 | $ 452,485,658 | $ 204,775,168 | $ - |
The following is a summary of transfers between Level 1 and Level 2 for the period ended October 31, 2014. Transfers are assumed to have occurred at the beginning of the period, and are primarily attributable to the valuation techniques used for foreign equity securities, as discussed in the accompanying Notes to Financial Statements: |
Transfers | Total |
Level 1 to Level 2 | $ 13,207,974 |
Level 2 to Level 1 | $ 0 |
See accompanying notes which are an integral part of the financial statements.
Annual Report
Statement of Assets and Liabilities
| October 31, 2014 |
| | |
Assets | | |
Investment in securities, at value (including securities loaned of $1,799,362) - See accompanying schedule: Unaffiliated issuers (cost $525,475,011) | $ 639,311,695 | |
Fidelity Central Funds (cost $17,949,131) | 17,949,131 | |
Total Investments (cost $543,424,142) | | $ 657,260,826 |
Foreign currency held at value (cost $181,591) | | 181,589 |
Receivable for investments sold | | 752,361 |
Receivable for fund shares sold | | 2,224,294 |
Dividends receivable | | 1,600,124 |
Distributions receivable from Fidelity Central Funds | | 5,338 |
Prepaid expenses | | 2,323 |
Other receivables | | 3,053 |
Total assets | | 662,029,908 |
| | |
Liabilities | | |
Payable for investments purchased | $ 376,673 | |
Payable for fund shares redeemed | 823,331 | |
Accrued management fee | 513,986 | |
Distribution and service plan fees payable | 16,541 | |
Other affiliated payables | 159,593 | |
Other payables and accrued expenses | 89,320 | |
Collateral on securities loaned, at value | 1,839,312 | |
Total liabilities | | 3,818,756 |
| | |
Net Assets | | $ 658,211,152 |
Net Assets consist of: | | |
Paid in capital | | $ 828,641,898 |
Undistributed net investment income | | 3,990,517 |
Accumulated undistributed net realized gain (loss) on investments and foreign currency transactions | | (288,211,957) |
Net unrealized appreciation (depreciation) on investments and assets and liabilities in foreign currencies | | 113,790,694 |
Net Assets | | $ 658,211,152 |
See accompanying notes which are an integral part of the financial statements.
Annual Report
Statement of Assets and Liabilities - continued
| October 31, 2014 |
| | |
Calculation of Maximum Offering Price Class A:
Net Asset Value and redemption price per share ($25,041,102 ÷ 1,834,238 shares) | | $ 13.65 |
| | |
Maximum offering price per share (100/94.25 of $13.65) | | $ 14.48 |
Class T:
Net Asset Value and redemption price per share ($9,913,278 ÷ 732,914 shares) | | $ 13.53 |
| | |
Maximum offering price per share (100/96.50 of $13.53) | | $ 14.02 |
Class B:
Net Asset Value and offering price per share ($744,419 ÷ 55,919 shares)A | | $ 13.31 |
| | |
Class C:
Net Asset Value and offering price per share ($8,437,794 ÷ 637,935 shares)A | | $ 13.23 |
| | |
International Small Cap Opportunities:
Net Asset Value, offering price and redemption price per share ($584,252,917 ÷ 42,348,080 shares) | | $ 13.80 |
| | |
Institutional Class:
Net Asset Value, offering price and redemption price per share ($29,821,642 ÷ 2,159,960 shares) | | $ 13.81 |
A Redemption price per share is equal to net asset value less any applicable contingent deferred sales charge.
See accompanying notes which are an integral part of the financial statements.
Annual Report
Financial Statements - continued
Statement of Operations
| Year ended October 31, 2014 |
| | |
Investment Income | | |
Dividends | | $ 13,633,581 |
Income from Fidelity Central Funds | | 202,575 |
Income before foreign taxes withheld | | 13,836,156 |
Less foreign taxes withheld | | (1,157,520) |
Total income | | 12,678,636 |
| | |
Expenses | | |
Management fee
Basic fee | $ 5,510,809 | |
Performance adjustment | 826,188 | |
Transfer agent fees | 1,519,749 | |
Distribution and service plan fees | 212,488 | |
Accounting and security lending fees | 322,189 | |
Custodian fees and expenses | 141,145 | |
Independent trustees' compensation | 2,625 | |
Registration fees | 94,354 | |
Audit | 71,780 | |
Legal | 2,138 | |
Miscellaneous | 3,926 | |
Total expenses before reductions | 8,707,391 | |
Expense reductions | (4,405) | 8,702,986 |
Net investment income (loss) | | 3,975,650 |
Realized and Unrealized Gain (Loss) Net realized gain (loss) on: | | |
Investment securities: | | |
Unaffiliated issuers | 27,597,575 | |
Foreign currency transactions | (131,152) | |
Total net realized gain (loss) | | 27,466,423 |
Change in net unrealized appreciation (depreciation) on: Investment securities | (28,619,605) | |
Assets and liabilities in foreign currencies | (41,552) | |
Total change in net unrealized appreciation (depreciation) | | (28,661,157) |
Net gain (loss) | | (1,194,734) |
Net increase (decrease) in net assets resulting from operations | | $ 2,780,916 |
See accompanying notes which are an integral part of the financial statements.
Annual Report
Statement of Changes in Net Assets
| Year ended
October 31,
2014 | Year ended
October 31,
2013 |
Increase (Decrease) in Net Assets | | |
Operations | | |
Net investment income (loss) | $ 3,975,650 | $ 3,604,267 |
Net realized gain (loss) | 27,466,423 | 37,116,732 |
Change in net unrealized appreciation (depreciation) | (28,661,157) | 71,945,657 |
Net increase (decrease) in net assets resulting from operations | 2,780,916 | 112,666,656 |
Distributions to shareholders from net investment income | (3,580,601) | (3,311,096) |
Distributions to shareholders from net realized gain | (3,233,620) | (171,255) |
Total distributions | (6,814,221) | (3,482,351) |
Share transactions - net increase (decrease) | 97,201,705 | 81,271,586 |
Redemption fees | 84,800 | 56,441 |
Total increase (decrease) in net assets | 93,253,200 | 190,512,332 |
| | |
Net Assets | | |
Beginning of period | 564,957,952 | 374,445,620 |
End of period (including undistributed net investment income of $3,990,517 and undistributed net investment income of $3,595,468, respectively) | $ 658,211,152 | $ 564,957,952 |
See accompanying notes which are an integral part of the financial statements.
Annual Report
Financial Highlights - Class A
Years ended October 31, | 2014 | 2013 | 2012 | 2011 | 2010 |
Selected Per-Share Data | | | | | |
Net asset value, beginning of period | $ 13.68 | $ 10.78 | $ 9.75 | $ 9.82 | $ 8.07 |
Income from Investment Operations | | | | | |
Net investment income (loss) C | .05 | .07 | .08 | .15F | .06 |
Net realized and unrealized gain (loss) | .05 | 2.91 | 1.07 | (.07) | 1.85 |
Total from investment operations | .10 | 2.98 | 1.15 | .08 | 1.91 |
Distributions from net investment income | (.06) | (.08) | (.11) | (.11) | (.07) |
Distributions from net realized gain | (.08) | (.01) | (.01) | (.04) | (.09) |
Total distributions | (.13) J | (.08) I | (.12) | (.15) | (.16) |
Redemption fees added to paid in capital C, H | - | - | - | - | - |
Net asset value, end of period | $ 13.65 | $ 13.68 | $ 10.78 | $ 9.75 | $ 9.82 |
Total ReturnA, B | .78% | 27.85% | 12.00% | .81% | 24.05% |
Ratios to Average Net Assets D, G | | | | | |
Expenses before reductions | 1.63% | 1.70% | 1.75% | 1.34% | 1.16% |
Expenses net of fee waivers, if any | 1.63% | 1.65% | 1.65% | 1.33% | 1.16% |
Expenses net of all reductions | 1.63% | 1.64% | 1.64% | 1.32% | 1.15% |
Net investment income (loss) | .33% | .59% | .85% | 1.44% F | .74% |
Supplemental Data | | | | | |
Net assets, end of period (000 omitted) | $ 25,041 | $ 22,052 | $ 18,194 | $ 18,686 | $ 20,228 |
Portfolio turnover rateE | 18% | 31% | 28% | 24% | 49% |
A Total returns would have been lower if certain expenses had not been reduced during the applicable periods shown.
B Total returns do not include the effect of the sales charges.
C Calculated based on average shares outstanding during the period.
D Fees and expenses of any underlying Fidelity Central Funds are not included in the Fund's expense ratio. The Fund indirectly bears its proportionate share of the expenses of any underlying Fidelity Central Funds.
E Amount does not include the portfolio activity of any underlying Fidelity Central Funds.
F Investment income per share reflects a large, non-recurring dividend which amounted to $.06 per share. Excluding this non-recurring dividend, the ratio of net investment income (loss) to average net assets would have been .80%.
G Expense ratios reflect operating expenses of the class. Expenses before reductions do not reflect amounts reimbursed by the investment adviser or reductions from brokerage service arrangements or reductions from other expense offset arrangements and do not represent the amount paid by the class during periods when reimbursements or reductions occur. Expenses net of fee waivers reflect expenses after reimbursement by the investment adviser but prior to reductions from brokerage service arrangements or other expense offset arrangements. Expenses net of all reductions represent the net expenses paid by the class.
H Amount represents less than $.01 per share.
I Total distributions of $.08 per share is comprised of distributions from net investment income of $.077 and distributions from net realized gain of $.005 per share.
J Total distributions of $.13 per share is comprised of distributions from net investment income of $.055 and distributions from net realized gain of $.079 per share.
See accompanying notes which are an integral part of the financial statements.
Annual Report
Financial Highlights - Class T
Years ended October 31, | 2014 | 2013 | 2012 | 2011 | 2010 |
Selected Per-Share Data | | | | | |
Net asset value, beginning of period | $ 13.56 | $ 10.69 | $ 9.66 | $ 9.72 | $ 8.00 |
Income from Investment Operations | | | | | |
Net investment income (loss) C | .01 | .04 | .06 | .12F | .04 |
Net realized and unrealized gain (loss) | .06 | 2.89 | 1.06 | (.06) | 1.83 |
Total from investment operations | .07 | 2.93 | 1.12 | .06 | 1.87 |
Distributions from net investment income | (.02) | (.05) | (.08) | (.08) | (.06) |
Distributions from net realized gain | (.08) | (.01) | (.01) | (.04) | (.09) |
Total distributions | (.10) | (.06) | (.09) | (.12) | (.15) |
Redemption fees added to paid in capital C, H | - | - | - | - | - |
Net asset value, end of period | $ 13.53 | $ 13.56 | $ 10.69 | $ 9.66 | $ 9.72 |
Total ReturnA, B | .55% | 27.53% | 11.72% | .60% | 23.65% |
Ratios to Average Net Assets D, G | | | | | |
Expenses before reductions | 1.89% | 1.96% | 2.02% | 1.60% | 1.43% |
Expenses net of fee waivers, if any | 1.89% | 1.90% | 1.90% | 1.60% | 1.43% |
Expenses net of all reductions | 1.89% | 1.89% | 1.89% | 1.59% | 1.41% |
Net investment income (loss) | .07% | .34% | .60% | 1.17%F | .48% |
Supplemental Data | | | | | |
Net assets, end of period (000 omitted) | $ 9,913 | $ 9,634 | $ 8,169 | $ 8,701 | $ 11,202 |
Portfolio turnover rateE | 18% | 31% | 28% | 24% | 49% |
A Total returns would have been lower if certain expenses had not been reduced during the applicable periods shown.
B Total returns do not include the effect of the sales charges.
C Calculated based on average shares outstanding during the period.
D Fees and expenses of any underlying Fidelity Central Funds are not included in the Fund's expense ratio. The Fund indirectly bears its proportionate share of the expenses of any underlying Fidelity Central Funds.
E Amount does not include the portfolio activity of any underlying Fidelity Central Funds.
F Investment income per share reflects a large, non-recurring dividend which amounted to $.06 per share. Excluding this non-recurring dividend, the ratio of net investment income (loss) to average net assets would have been .54%.
G Expense ratios reflect operating expenses of the class. Expenses before reductions do not reflect amounts reimbursed by the investment adviser or reductions from brokerage service arrangements or reductions from other expense offset arrangements and do not represent the amount paid by the class during periods when reimbursements or reductions occur. Expenses net of fee waivers reflect expenses after reimbursement by the investment adviser but prior to reductions from brokerage service arrangements or other expense offset arrangements. Expenses net of all reductions represent the net expenses paid by the class.
H Amount represents less than $.01 per share.
See accompanying notes which are an integral part of the financial statements.
Annual Report
Financial Highlights - Class B
Years ended October 31, | 2014 | 2013 | 2012 | 2011 | 2010 |
Selected Per-Share Data | | | | | |
Net asset value, beginning of period | $ 13.31 | $ 10.50 | $ 9.48 | $ 9.54 | $ 7.87 |
Income from Investment Operations | | | | | |
Net investment income (loss) C | (.06) | (.02) | .01 | .07F | -H |
Net realized and unrealized gain (loss) | .06 | 2.84 | 1.05 | (.06) | 1.79 |
Total from investment operations | - | 2.82 | 1.06 | .01 | 1.79 |
Distributions from net investment income | - | -H | (.03) | (.06) | (.03) |
Distributions from net realized gain | - | (.01) | (.01) | (.02) | (.09) |
Total distributions | - | (.01) | (.04) | (.07)I | (.12) |
Redemption fees added to paid in capital C, H | - | - | - | - | - |
Net asset value, end of period | $ 13.31 | $ 13.31 | $ 10.50 | $ 9.48 | $ 9.54 |
Total ReturnA, B | -% | 26.86% | 11.21% | .10% | 23.03% |
Ratios to Average Net Assets D, G | | | | | |
Expenses before reductions | 2.38% | 2.46% | 2.50% | 2.09% | 1.91% |
Expenses net of fee waivers, if any | 2.38% | 2.40% | 2.40% | 2.09% | 1.91% |
Expenses net of all reductions | 2.38% | 2.39% | 2.39% | 2.07% | 1.90% |
Net investment income (loss) | (.43)% | (.16)% | .10% | .68%F | (.01)% |
Supplemental Data | | | | | |
Net assets, end of period (000 omitted) | $ 744 | $ 1,410 | $ 1,966 | $ 2,293 | $ 2,902 |
Portfolio turnover rateE | 18% | 31% | 28% | 24% | 49% |
A Total returns would have been lower if certain expenses had not been reduced during the applicable periods shown.
B Total returns do not include the effect of the contingent deferred sales charge.
C Calculated based on average shares outstanding during the period.
D Fees and expenses of any underlying Fidelity Central Funds are not included in the Fund's expense ratio. The Fund indirectly bears its proportionate share of the expenses of any underlying Fidelity Central Funds.
E Amount does not include the portfolio activity of any underlying Fidelity Central Funds.
F Investment income per share reflects a large, non-recurring dividend which amounted to $.06 per share. Excluding this non-recurring dividend, the ratio of net investment income (loss) to average net assets would have been .05%.
G Expense ratios reflect operating expenses of the class. Expenses before reductions do not reflect amounts reimbursed by the investment adviser or reductions from brokerage service arrangements or reductions from other expense offset arrangements and do not represent the amount paid by the class during periods when reimbursements or reductions occur. Expenses net of fee waivers reflect expenses after reimbursement by the investment adviser but prior to reductions from brokerage service arrangements or other expense offset arrangements. Expenses net of all reductions represent the net expenses paid by the class.
H Amount represents less than $.01 per share.
I Total distributions of $.07 per share is comprised of distributions from net investment income of $.058 and distributions from net realized gain of $.015 per share.
See accompanying notes which are an integral part of the financial statements.
Annual Report
Financial Highlights - Class C
Years ended October 31, | 2014 | 2013 | 2012 | 2011 | 2010 |
Selected Per-Share Data | | | | | |
Net asset value, beginning of period | $ 13.28 | $ 10.48 | $ 9.47 | $ 9.53 | $ 7.86 |
Income from Investment Operations | | | | | |
Net investment income (loss) C | (.06) | (.02) | .01 | .07F | -H |
Net realized and unrealized gain (loss) | .06 | 2.84 | 1.04 | (.06) | 1.79 |
Total from investment operations | - | 2.82 | 1.05 | .01 | 1.79 |
Distributions from net investment income | - | (.01) | (.03) | (.06) | (.03) |
Distributions from net realized gain | (.05) | (.01) | (.01) | (.02) | (.09) |
Total distributions | (.05) | (.02) | (.04) | (.07) I | (.12) |
Redemption fees added to paid in capital C, H | - | - | - | - | - |
Net asset value, end of period | $ 13.23 | $ 13.28 | $ 10.48 | $ 9.47 | $ 9.53 |
Total ReturnA, B | .03% | 26.91% | 11.13% | .10% | 23.06% |
Ratios to Average Net Assets D, G | | | | | |
Expenses before reductions | 2.38% | 2.45% | 2.50% | 2.09% | 1.91% |
Expenses net of fee waivers, if any | 2.38% | 2.40% | 2.40% | 2.09% | 1.91% |
Expenses net of all reductions | 2.38% | 2.39% | 2.39% | 2.07% | 1.90% |
Net investment income (loss) | (.42)% | (.16)% | .10% | .68%F | (.01)% |
Supplemental Data | | | | | |
Net assets, end of period (000 omitted) | $ 8,438 | $ 8,070 | $ 6,608 | $ 6,900 | $ 8,936 |
Portfolio turnover rateE | 18% | 31% | 28% | 24% | 49% |
A Total returns would have been lower if certain expenses had not been reduced during the applicable periods shown.
B Total returns do not include the effect of the contingent deferred sales charge.
C Calculated based on average shares outstanding during the period.
D Fees and expenses of any underlying Fidelity Central Funds are not included in the Fund's expense ratio. The Fund indirectly bears its proportionate share of the expenses of any underlying Fidelity Central Funds.
E Amount does not include the portfolio activity of any underlying Fidelity Central Funds.
F Investment income per share reflects a large, non-recurring dividend which amounted to $.06 per share. Excluding this non-recurring dividend, the ratio of net investment income (loss) to average net assets would have been .05%.
G Expense ratios reflect operating expenses of the class. Expenses before reductions do not reflect amounts reimbursed by the investment adviser or reductions from brokerage service arrangements or reductions from other expense offset arrangements and do not represent the amount paid by the class during periods when reimbursements or reductions occur. Expenses net of fee waivers reflect expenses after reimbursement by the investment adviser but prior to reductions from brokerage service arrangements or other expense offset arrangements. Expenses net of all reductions represent the net expenses paid by the class.
H Amount represents less than $.01 per share.
I Total distributions of $.07 per share is comprised of distributions from net investment income of $.058 and distributions from net realized gain of $.015 per share.
See accompanying notes which are an integral part of the financial statements.
Annual Report
Financial Highlights - International Small Cap Opportunities
Years ended October 31, | 2014 | 2013 | 2012 | 2011 | 2010 |
Selected Per-Share Data | | | | | |
Net asset value, beginning of period | $ 13.82 | $ 10.88 | $ 9.85 | $ 9.92 | $ 8.14 |
Income from Investment Operations | | | | | |
Net investment income (loss) B | .09 | .10 | .11 | .17E | .09 |
Net realized and unrealized gain (loss) | .06 | 2.95 | 1.07 | (.06) | 1.87 |
Total from investment operations | .15 | 3.05 | 1.18 | .11 | 1.96 |
Distributions from net investment income | (.09) | (.10) | (.14) | (.14) | (.09) |
Distributions from net realized gain | (.08) | (.01) | (.01) | (.04) | (.09) |
Total distributions | (.17) | (.11) | (.15) | (.18) | (.18) |
Redemption fees added to paid in capital B, G | - | - | - | - | - |
Net asset value, end of period | $ 13.80 | $ 13.82 | $ 10.88 | $ 9.85 | $ 9.92 |
Total ReturnA | 1.11% | 28.24% | 12.21% | 1.10% | 24.43% |
Ratios to Average Net Assets C, F | | | | | |
Expenses before reductions | 1.30% | 1.39% | 1.47% | 1.08% | .91% |
Expenses net of fee waivers, if any | 1.30% | 1.39% | 1.40% | 1.08% | .91% |
Expenses net of all reductions | 1.30% | 1.38% | 1.39% | 1.06% | .89% |
Net investment income (loss) | .65% | .85% | 1.10% | 1.69%E | 1.00% |
Supplemental Data | | | | | |
Net assets, end of period (000 omitted) | $ 584,253 | $ 518,121 | $ 334,918 | $ 328,262 | $ 398,331 |
Portfolio turnover rateD | 18% | 31% | 28% | 24% | 49% |
A Total returns would have been lower if certain expenses had not been reduced during the applicable periods shown.
B Calculated based on average shares outstanding during the period.
C Fees and expenses of any underlying Fidelity Central Funds are not included in the Fund's expense ratio. The Fund indirectly bears its proportionate share of the expenses of any underlying Fidelity Central Funds.
D Amount does not include the portfolio activity of any underlying Fidelity Central Funds.
E Investment income per share reflects a large, non-recurring dividend which amounted to $.07 per share. Excluding this non-recurring dividend, the ratio of net investment income (loss) to average net assets would have been 1.06%.
F Expense ratios reflect operating expenses of the class. Expenses before reductions do not reflect amounts reimbursed by the investment adviser or reductions from brokerage service arrangements or reductions from other expense offset arrangements and do not represent the amount paid by the class during periods when reimbursements or reductions occur. Expenses net of fee waivers reflect expenses after reimbursement by the investment adviser but prior to reductions from brokerage service arrangements or other expense offset arrangements. Expenses net of all reductions represent the net expenses paid by the class.
G Amount represents less than $.01 per share.
See accompanying notes which are an integral part of the financial statements.
Annual Report
Financial Highlights - Institutional Class
Years ended October 31, | 2014 | 2013 | 2012 | 2011 | 2010 |
Selected Per-Share Data | | | | | |
Net asset value, beginning of period | $ 13.83 | $ 10.90 | $ 9.86 | $ 9.93 | $ 8.14 |
Income from Investment Operations | | | | | |
Net investment income (loss) B | .08 | .11 | .11 | .18E | .09 |
Net realized and unrealized gain (loss) | .07 | 2.93 | 1.08 | (.06) | 1.86 |
Total from investment operations | .15 | 3.04 | 1.19 | .12 | 1.95 |
Distributions from net investment income | (.09) | (.10) | (.14) | (.15) | (.07) |
Distributions from net realized gain | (.08) | (.01) | (.01) | (.04) | (.09) |
Total distributions | (.17) | (.11) | (.15) | (.19) | (.16) |
Redemption fees added to paid in capital B, G | - | - | - | - | - |
Net asset value, end of period | $ 13.81 | $ 13.83 | $ 10.90 | $ 9.86 | $ 9.93 |
Total ReturnA | 1.11% | 28.11% | 12.32% | 1.13% | 24.33% |
Ratios to Average Net Assets C, F | | | | | |
Expenses before reductions | 1.36% | 1.38% | 1.44% | 1.03% | .90% |
Expenses net of fee waivers, if any | 1.36% | 1.37% | 1.40% | 1.03% | .90% |
Expenses net of all reductions | 1.36% | 1.37% | 1.39% | 1.02% | .88% |
Net investment income (loss) | .60% | .87% | 1.10% | 1.74%E | 1.01% |
Supplemental Data | | | | | |
Net assets, end of period (000 omitted) | $ 29,822 | $ 5,670 | $ 4,591 | $ 1,395 | $ 2,418 |
Portfolio turnover rateD | 18% | 31% | 28% | 24% | 49% |
A Total returns would have been lower if certain expenses had not been reduced during the applicable periods shown.
B Calculated based on average shares outstanding during the period.
C Fees and expenses of any underlying Fidelity Central Funds are not included in the Fund's expense ratio. The Fund indirectly bears its proportionate share of the expenses of any underlying Fidelity Central Funds.
D Amount does not include the portfolio activity of any underlying Fidelity Central Funds.
E Investment income per share reflects a large, non-recurring dividend which amounted to $.07 per share. Excluding this non-recurring dividend, the ratio of net investment income (loss) to average net assets would have been 1.11%.
F Expense ratios reflect operating expenses of the class. Expenses before reductions do not reflect amounts reimbursed by the investment adviser or reductions from brokerage service arrangements or reductions from other expense offset arrangements and do not represent the amount paid by the class during periods when reimbursements or reductions occur. Expenses net of fee waivers reflect expenses after reimbursement by the investment adviser but prior to reductions from brokerage service arrangements or other expense offset arrangements. Expenses net of all reductions represent the net expenses paid by the class.
G Amount represents less than $.01 per share.
See accompanying notes which are an integral part of the financial statements.
Annual Report
Notes to Financial Statements
For the period ended October 31, 2014
1. Organization.
Fidelity International Small Cap Opportunities Fund (the Fund) is a fund of Fidelity Investment Trust (the Trust) and is authorized to issue an unlimited number of shares. The Trust is registered under the Investment Company Act of 1940, as amended (the 1940 Act), as an open-end management investment company organized as a Massachusetts business trust. The Fund offers Class A, Class T, Class C, International Small Cap Opportunities and Institutional Class shares, each of which, along with Class B shares, has equal rights as to assets and voting privileges. Class B shares are closed to new accounts and additional purchases, except for exchanges and reinvestments. Each class has exclusive voting rights with respect to matters that affect that class. Class B shares will automatically convert to Class A shares after a holding period of seven years from the initial date of purchase.
2. Investments in Fidelity Central Funds.
The Fund invests in Fidelity Central Funds, which are open-end investment companies generally available only to other investment companies and accounts managed by the investment adviser and its affiliates. The Fund's Schedule of Investments lists each of the Fidelity Central Funds held as of period end, if any, as an investment of the Fund, but does not include the underlying holdings of each Fidelity Central Fund. As an Investing Fund, the Fund indirectly bears its proportionate share of the expenses of the underlying Fidelity Central Funds.
The Money Market Central Funds seek preservation of capital and current income and are managed by Fidelity Investments Money Management, Inc. (FIMM), an affiliate of the investment adviser. Annualized expenses of the Money Market Central Funds as of their most recent shareholder report date are less than .01%.
A complete unaudited list of holdings for each Fidelity Central Fund is available upon request or at the Securities and Exchange Commission (the SEC) website at www.sec.gov. In addition, the financial statements of the Fidelity Central Funds, which are not covered by the Fund's Report of Independent Registered Public Accounting Firm, are available on the SEC website or upon request.
3. Significant Accounting Policies.
The financial statements have been prepared in conformity with accounting principles generally accepted in the United States of America (GAAP), which require management to make certain estimates and assumptions at the date of the financial statements. Actual results could differ from those estimates. Subsequent events, if any, through the date that the financial statements were issued have been evaluated in the preparation of
Annual Report
3. Significant Accounting Policies - continued
the financial statements. The following summarizes the significant accounting policies of the Fund:
Investment Valuation. Investments are valued as of 4:00 p.m. Eastern time on the last calendar day of the period. In accordance with valuation policies and procedures approved by the Board of Trustees (the Board), the Fund attempts to obtain prices from one or more third party pricing vendors or brokers to value its investments. When current market prices, quotations or currency exchange rates are not readily available or reliable, investments will be fair valued in good faith by the Fidelity Management & Research Company (FMR) Fair Value Committee (the Committee), in accordance with procedures adopted by the Board. Factors used in determining fair value vary by investment type and may include market or investment specific events. The frequency with which these procedures are used cannot be predicted and they may be utilized to a significant extent. The Committee oversees the Fund's valuation policies and procedures and is responsible for approving and reporting to the Board all fair value determinations.
The Fund categorizes the inputs to valuation techniques used to value its investments into a disclosure hierarchy consisting of three levels as shown below:
Level 1 - quoted prices in active markets for identical investments
Level 2 - other significant observable inputs (including quoted prices for similar investments, interest rates, prepayment speeds, etc.)
Level 3 - unobservable inputs (including the Fund's own assumptions based on the best information available)
Valuation techniques used to value the Fund's investments by major category are as follows:
Equity securities, including restricted securities, for which market quotations are readily available, are valued at the last reported sale price or official closing price as reported by a third party pricing vendor on the primary market or exchange on which they are traded and are categorized as Level 1 in the hierarchy. In the event there were no sales during the day or closing prices are not available, securities are valued at the last quoted bid price or may be valued using the last available price and are generally categorized as Level 2 in the hierarchy. For foreign equity securities, when market or security specific events arise, comparisons to the valuation of American Depositary Receipts (ADRs), futures contracts, Exchange-Traded Funds (ETFs) and certain indexes as well as quoted prices for similar securities may be used and would be categorized as Level 2 in the hierarchy. Utilizing these techniques may result in transfers between Level 1 and Level 2. For equity securities, including restricted securities, where observable inputs are
Annual Report
Notes to Financial Statements - continued
3. Significant Accounting Policies - continued
Investment Valuation - continued
limited, assumptions about market activity and risk are used and these securities may be categorized as Level 3 in the hierarchy.
The U.S. dollar value of foreign currency contracts is determined using currency exchange rates supplied by a pricing service and are categorized as Level 2 in the hierarchy. Investments in open-end mutual funds, including the Fidelity Central Funds, are valued at their closing net asset value (NAV) each business day and are categorized as Level 1 in the hierarchy.
Changes in valuation techniques may result in transfers in or out of an assigned level within the disclosure hierarchy. The aggregate value of investments by input level, as of October 31, 2014, including information on transfers between Levels 1 and 2 is included at the end of the Fund's Schedule of Investments.
Foreign Currency. The Fund may use foreign currency contracts to facilitate transactions in foreign-denominated securities. Gains and losses from these transactions may arise from changes in the value of the foreign currency or if the counterparties do not perform under the contracts' terms.
Foreign-denominated assets, including investment securities, and liabilities are translated into U.S. dollars at the exchange rates at period end. Purchases and sales of investment securities, income and dividends received and expenses denominated in foreign currencies are translated into U.S. dollars at the exchange rate in effect on the transaction date.
The effects of exchange rate fluctuations on investments are included with the net realized and unrealized gain (loss) on investment securities. Other foreign currency transactions resulting in realized and unrealized gain (loss) are disclosed separately.
Investment Transactions and Income. For financial reporting purposes, the Fund's investment holdings and NAV include trades executed through the end of the last business day of the period. The NAV per share for processing shareholder transactions is calculated as of the close of business of the New York Stock Exchange (NYSE), normally 4:00 p.m. Eastern time and includes trades executed through the end of the prior business day. Gains and losses on securities sold are determined on the basis of identified cost and may include proceeds received from litigation. Dividend income is recorded on the ex-dividend date, except for certain dividends from foreign securities where the ex-dividend date may have passed, which are recorded as soon as the Fund is informed of the ex-dividend date. Non-cash dividends included in dividend income, if any, are recorded at the fair market value of the securities received. Income and capital gain distributions from Fidelity Central Funds, if any, are recorded on the ex-dividend date.
Annual Report
3. Significant Accounting Policies - continued
Investment Transactions and Income - continued
Distributions received on securities that represent a return of capital or capital gain are recorded as a reduction of cost of investments and/or as a realized gain. Subsequent to ex-dividend date the Fund determines the components of these distributions, based upon receipt of tax filings or other correspondence relating to the underlying investment.
Class Allocations and Expenses. Investment income, realized and unrealized capital gains and losses, common expenses of the Fund, and certain fund-level expense reductions, if any, are allocated daily on a pro-rata basis to each class based on the relative net assets of each class to the total net assets of the Fund. Each class differs with respect to transfer agent and distribution and service plan fees incurred. Certain expense reductions may also differ by class. For the reporting period, the allocated portion of income and expenses to each class as a percent of its average net assets may vary due to the timing of recording these transactions in relation to fluctuating net assets of the classes. Expenses directly attributable to a fund are charged to that fund. Expenses attributable to more than one fund are allocated among the respective funds on the basis of relative net assets or other appropriate methods. Expense estimates are accrued in the period to which they relate and adjustments are made when actual amounts are known.
Income Tax Information and Distributions to Shareholders. Each year, the Fund intends to qualify as a regulated investment company under Subchapter M of the Internal Revenue Code, including distributing substantially all of its taxable income and realized gains. As a result, no provision for U.S. Federal income taxes is required. As of October 31, 2014, the Fund did not have any unrecognized tax benefits in the financial statements; nor is the Fund aware of any tax positions for which it is reasonably possible that the total amounts of unrecognized tax benefits will significantly change in the next twelve months. The Fund files a U.S. federal tax return, in addition to state and local tax returns as required. The Fund's federal income tax returns are subject to examination by the Internal Revenue Service (IRS) for a period of three fiscal years after they are filed. State and local tax returns may be subject to examination for an additional fiscal year depending on the jurisdiction. Foreign taxes are provided for based on the Fund's understanding of the tax rules and rates that exist in the foreign markets in which it invests.
Distributions are declared and recorded on the ex-dividend date. Income dividends and capital gain distributions are declared separately for each class. Income and capital gain distributions are determined in accordance with income tax regulations, which may differ from GAAP.
Capital accounts within the financial statements are adjusted for permanent book-tax differences. These adjustments have no impact on net assets or the results of operations.
Annual Report
Notes to Financial Statements - continued
3. Significant Accounting Policies - continued
Income Tax Information and Distributions to Shareholders - continued
Capital accounts are not adjusted for temporary book-tax differences which will reverse in a subsequent period.
Book-tax differences are primarily due to foreign currency transactions, partnerships, passive foreign investment companies (PFIC), capital loss carryforwards and losses deferred due to wash sales.
The federal tax cost of investment securities and unrealized appreciation (depreciation) as of period end were as follows:
Gross unrealized appreciation | $ 135,078,782 |
Gross unrealized depreciation | (26,037,635) |
Net unrealized appreciation (depreciation) on securities | $ 109,041,147 |
| |
Tax Cost | $ 548,219,679 |
The tax-based components of distributable earnings as of period end were as follows:
Undistributed ordinary income | $ 4,846,239 |
Capital loss carryforward | $ (284,273,262) |
Net unrealized appreciation (depreciation) on securities and other investments | $ 108,996,277 |
Capital loss carryforwards are only available to offset future capital gains of the Fund to the extent provided by regulations and may be limited. Under the Regulated Investment Company Modernization Act of 2010 (the Act), the Fund is permitted to carry forward capital losses incurred in taxable years beginning after December 22, 2010 for an unlimited period and such capital losses are required to be used prior to any losses that expire. The capital loss carryforward information presented below, including any applicable limitation, is estimated as of fiscal period end and is subject to adjustment.
Fiscal year of expiration | |
2017 | $ (284,273,262) |
The tax character of distributions paid was as follows:
| October 31, 2014 | October 31, 2013 |
Ordinary Income | $ 6,814,221 | $ 3,482,351 |
Annual Report
3. Significant Accounting Policies - continued
Short-Term Trading (Redemption) Fees. Shares held by investors in the Fund less than 90 days may have been subject to a redemption fee equal to 2.00% of the NAV of shares redeemed. All redemption fees, which reduce the proceeds of the shareholder redemption, are retained by the Fund and accounted for as an addition to paid in capital.
New Accounting Pronouncement. In June 2014, the Financial Accounting Standards Board issued Accounting Standard Update No. 2014-11, Repurchase-to-Maturity Transactions, Repurchase Financings, and Disclosures. The Update amends the accounting for certain repurchase agreements and expands disclosure requirements for reverse repurchase agreements, securities lending and other similar transactions. The disclosure requirements are effective for annual and interim reporting periods beginning after December 15, 2014. Management is currently evaluating the impact of the Update on the Fund's financial statements and related disclosures.
4. Purchases and Sales of Investments.
Purchases and sales of securities, other than short-term securities, aggregated $201,745,353 and $113,539,642, respectively.
5. Fees and Other Transactions with Affiliates.
Management Fee. Fidelity Management & Research Company (the investment adviser) and its affiliates provide the Fund with investment management related services for which the Fund pays a monthly management fee. The management fee is the sum of an individual fund fee rate that is based on an annual rate of .60% of the Fund's average net assets and an annualized group fee rate that averaged .25% during the period. The group fee rate is based upon the average net assets of all the mutual funds advised by the investment adviser, including any mutual funds previously advised by the investment adviser that are currently advised by Fidelity SelectCo, LLC, an affiliate of the investment adviser. The group fee rate decreases as assets under management increase and increases as assets under management decrease. In addition, the management fee is subject to a performance adjustment (up to a maximum of ± .20% of the Fund's average net assets over a 36 month performance period). The upward or downward adjustment to the management fee is based on the relative investment performance of International Small Cap Opportunities as compared to its benchmark index, the MSCI EAFE Small Cap Index, over the same 36 month performance period. For the reporting period, the total annual management fee rate, including the performance adjustment, was .98% of the Fund's average net assets. The performance adjustment included in the management fee rate may be higher or lower than the maximum performance adjustment rate due to the difference between the average net assets for the reporting and performance periods.
Annual Report
Notes to Financial Statements - continued
5. Fees and Other Transactions with Affiliates - continued
Distribution and Service Plan Fees. In accordance with Rule 12b-1 of the 1940 Act, the Fund has adopted separate Distribution and Service Plans for each class of shares, except for the Institutional Class. Certain classes pay Fidelity Distributors Corporation (FDC), an affiliate of the investment adviser, separate Distribution and Service Fees, each of which is based on an annual percentage of each class' average net assets. In addition, FDC may pay financial intermediaries for selling shares of the Fund and providing shareholder support services. For the period, the Distribution and Service Fee rates, total fees and amounts retained by FDC were as follows:
| Distribution
Fee | Service
Fee | Total Fees | Retained
by FDC |
Class A | -% | .25% | $ 61,505 | $ 1,091 |
Class T | .25% | .25% | 51,522 | 86 |
Class B | .75% | .25% | 10,529 | 7,921 |
Class C | .75% | .25% | 88,932 | 15,254 |
| | | $ 212,488 | $ 24,352 |
Sales Load. FDC may receive a front-end sales charge of up to 5.75% for selling Class A shares and 3.50% for selling Class T shares, some of which is paid to financial intermediaries for selling shares of the Fund. Depending on the holding period, FDC may receive contingent deferred sales charges levied on Class A, Class T, Class B, and Class C redemptions. The deferred sales charges range from 5.00% to 1.00% for Class B shares, 1.00% for Class C shares, 1.00% for certain purchases of Class A shares and .25% for certain purchases of Class T shares.
For the period, sales charge amounts retained by FDC were as follows:
| Retained
by FDC |
Class A | $ 8,923 |
Class T | 3,488 |
Class B* | 157 |
Class C* | 1,680 |
| $ 14,248 |
* When Class B and Class C shares are initially sold, FDC pays commissions from its own resources to financial intermediaries through which the sales are made.
Transfer Agent Fees. Fidelity Investments Institutional Operations Company, Inc., (FIIOC), an affiliate of the investment adviser, is the transfer, dividend disbursing and shareholder servicing agent for each class of the Fund. FIIOC receives account fees and asset-based fees that vary according to the account size and type of account of the shareholders of the respective classes of the Fund. FIIOC pays for typesetting, printing and mailing of shareholder reports, except proxy statements.
Annual Report
5. Fees and Other Transactions with Affiliates - continued
Transfer Agent Fees - continued
For the period, transfer agent fees for each class were as follows:
| Amount | % of
Class-Level Average
Net Assets |
Class A | $ 74,641 | .30 |
Class T | 32,188 | .31 |
Class B | 3,189 | .30 |
Class C | 27,039 | .30 |
International Small Cap Opportunities | 1,338,038 | .23 |
Institutional Class | 44,654 | .28 |
| $ 1,519,749 | |
Accounting and Security Lending Fees. Fidelity Service Company, Inc. (FSC), an affiliate of the investment adviser, maintains the Fund's accounting records. The accounting fee is based on the level of average net assets for each month. Under a separate contract, FSC administers the security lending program. The security lending fee is based on the number and duration of lending transactions.
Brokerage Commissions. The Fund placed a portion of its portfolio transactions with brokerage firms which are affiliates of the investment adviser. Brokerage commissions are included in net realized gain (loss) and change in net unrealized appreciation (depreciation) in the Statement of Operations. The commissions paid to these affiliated firms were $840 for the period.
Other. During the period, the investment adviser reimbursed the Fund for certain losses in the amount of $5,745.
6. Committed Line of Credit.
The Fund participates with other funds managed by the investment adviser or an affiliate in a $4.25 billion credit facility (the "line of credit") to be utilized for temporary or emergency purposes to fund shareholder redemptions or for other short-term liquidity purposes. The Fund has agreed to pay commitment fees on its pro-rata portion of the line of credit, which amounted to $1,022 and is reflected in Miscellaneous expenses on the Statement of Operations. During the period, the Fund did not borrow on this line of credit.
Annual Report
Notes to Financial Statements - continued
7. Security Lending.
The Fund lends portfolio securities through a lending agent from time to time in order to earn additional income. For equity securities, a lending agent is used and may loan securities to certain qualified borrowers, including Fidelity Capital Markets (FCM), a broker-dealer affiliated with the Fund. On the settlement date of the loan, the Fund receives collateral (in the form of U.S. Treasury obligations, letters of credit and/or cash) against the loaned securities and maintains collateral in an amount not less than 100% of the market value of the loaned securities during the period of the loan. The market value of the loaned securities is determined at the close of business of the Fund and any additional required collateral is delivered to the Fund on the next business day. If the borrower defaults on its obligation to return the securities loaned because of insolvency or other reasons, the Fund may apply collateral received from the borrower against the obligation. The Fund may experience delays and costs in recovering the securities loaned. Any cash collateral received is invested in the Fidelity Securities Lending Cash Central Fund. The value of loaned securities and cash collateral at period end are disclosed on the Fund's Statement of Assets and Liabilities. Security lending income represents the income earned on investing cash collateral, less rebates paid to borrowers and any lending agent fees associated with the loan, plus any premium payments received for lending certain types of securities. Security lending income is presented in the Statement of Operations as a component of income from Fidelity Central Funds. Total security lending income during the period amounted to $171,600. During the period, there were no securities loaned to FCM.
8. Expense Reductions.
Commissions paid to certain brokers with whom the investment adviser, or its affiliates, places trades on behalf of the Fund include an amount in addition to trade execution, which may be rebated back to the Fund to offset certain expenses. This amount totaled $329 for the period. In addition, through arrangements with the Fund's custodian, credits realized as a result of uninvested cash balances were used to reduce the Fund's expenses. During the period, these credits reduced the Fund's custody expenses by $192.
In addition, the investment adviser reimbursed a portion of the Fund's operating expenses during the period in the amount of $3,884.
Annual Report
9. Distributions to Shareholders.
Distributions to shareholders of each class were as follows:
Years ended October 31, | 2014 | 2013 |
From net investment income | | |
Class A | $ 88,584 | $ 127,604 |
Class T | 17,038 | 40,329 |
Class B | - | 540 |
Class C | - | 6,860 |
International Small Cap Opportunities | 3,435,414 | 3,098,688 |
Institutional Class | 39,565 | 37,075 |
Total | $ 3,580,601 | $ 3,311,096 |
Years ended October 31, | | |
From net realized gain | | |
Class A | $ 127,238 | $ 8,286 |
Class T | 56,084 | 3,734 |
Class B | - | 900 |
Class C | 33,933 | 3,118 |
International Small Cap Opportunities | 2,982,391 | 153,400 |
Institutional Class | 33,974 | 1,817 |
Total | $ 3,233,620 | $ 171,255 |
10. Share Transactions.
Share transactions for each class were as follows and may contain automatic conversions between classes or exchanges between funds:
| Shares | Dollars |
Years ended October 31, | 2014 | 2013 | 2014 | 2013 |
Class A | | | | |
Shares sold | 589,478 | 373,515 | $ 8,266,636 | $ 4,517,568 |
Reinvestment of distributions | 14,226 | 10,878 | 191,200 | 119,442 |
Shares redeemed | (381,134) | (460,010) | (5,353,937) | (5,504,745) |
Net increase (decrease) | 222,570 | (75,617) | $ 3,103,899 | $ (867,735) |
Class T | | | | |
Shares sold | 159,216 | 94,833 | $ 2,266,530 | $ 1,133,727 |
Reinvestment of distributions | 5,309 | 3,872 | 70,882 | 42,245 |
Shares redeemed | (142,062) | (152,245) | (1,989,964) | (1,813,542) |
Net increase (decrease) | 22,463 | (53,540) | $ 347,448 | $ (637,570) |
Annual Report
Notes to Financial Statements - continued
10. Share Transactions - continued
| Shares | Dollars |
Years ended October 31, | 2014 | 2013 | 2014 | 2013 |
Class B | | | | |
Shares sold | 1,461 | 2,465 | $ 20,212 | $ 28,055 |
Reinvestment of distributions | - | 123 | - | 1,326 |
Shares redeemed | (51,497) | (83,897) | (706,187) | (970,172) |
Net increase (decrease) | (50,036) | (81,309) | $ (685,975) | $ (940,791) |
Class C | | | | |
Shares sold | 200,445 | 106,942 | $ 2,745,030 | $ 1,277,851 |
Reinvestment of distributions | 2,336 | 870 | 30,621 | 9,335 |
Shares redeemed | (172,604) | (130,535) | (2,374,401) | (1,517,604) |
Net increase (decrease) | 30,177 | (22,723) | $ 401,250 | $ (230,418) |
International Small Cap Opportunities | | | | |
Shares sold | 13,421,171 | 13,306,080 | $ 191,269,160 | $ 163,920,015 |
Reinvestment of distributions | 360,554 | 279,367 | 4,881,895 | 3,092,593 |
Shares redeemed | (8,930,544) | (6,858,430) | (127,222,877) | (83,019,406) |
Net increase (decrease) | 4,851,181 | 6,727,017 | $ 68,928,178 | $ 83,993,202 |
Institutional Class | | | | |
Shares sold | 2,469,158 | 107,232 | $ 34,766,175 | $ 1,308,852 |
Reinvestment of distributions | 4,980 | 3,187 | 67,530 | 35,307 |
Shares redeemed | (724,026) | (121,854) | (9,726,800) | (1,389,261) |
Net increase (decrease) | 1,750,112 | (11,435) | $ 25,106,905 | $ (45,102) |
11. Other.
The Fund's organizational documents provide former and current trustees and officers with a limited indemnification against liabilities arising in connection with the performance of their duties to the Fund. In the normal course of business, the Fund may also enter into contracts that provide general indemnifications. The Fund's maximum exposure under these arrangements is unknown as this would be dependent on future claims that may be made against the Fund. The risk of material loss from such claims is considered remote.
Annual Report
To the Trustees of Fidelity Investment Trust and Shareholders of Fidelity International Small Cap Opportunities Fund:
We have audited the accompanying statement of assets and liabilities of Fidelity International Small Cap Opportunities Fund (the Fund), a fund of Fidelity Investment Trust, including the schedule of investments, as of October 31, 2014, and the related statement of operations for the year then ended, the statement of changes in net assets for each of the two years in the period then ended, and the financial highlights for each of the five years in the period then ended. These financial statements and financial highlights are the responsibility of the Fund's management. Our responsibility is to express an opinion on these financial statements and financial highlights based on our audits.
We conducted our audits in accordance with the standards of the Public Company Accounting Oversight Board (United States). Those standards require that we plan and perform the audit to obtain reasonable assurance about whether the financial statements and financial highlights are free of material misstatement. The Fund is not required to have, nor were we engaged to perform, an audit of its internal control over financial reporting. Our audits included consideration of internal control over financial reporting as a basis for designing audit procedures that are appropriate in the circumstances, but not for the purpose of expressing an opinion on the effectiveness of the Fund's internal control over financial reporting. Accordingly, we express no such opinion. An audit also includes examining, on a test basis, evidence supporting the amounts and disclosures in the financial statements, assessing the accounting principles used and significant estimates made by management, as well as evaluating the overall financial statement presentation. Our procedures included confirmation of securities owned as of October 31, 2014, by correspondence with the custodians and brokers; where replies were not received from brokers, we performed other auditing procedures. We believe that our audits provide a reasonable basis for our opinion.
In our opinion, the financial statements and financial highlights referred to above present fairly, in all material respects, the financial position of Fidelity International Small Cap Opportunities Fund as of October 31, 2014, the results of its operations for the year then ended, the changes in its net assets for each of the two years in the period then ended, and the financial highlights for each of the five years in the period then ended, in conformity with accounting principles generally accepted in the United States of America.
DELOITTE & TOUCHE LLP
Boston, Massachusetts
December 16, 2014
Annual Report
The Trustees, Member of the Advisory Board, and officers of the trust and fund, as applicable, are listed below. The Board of Trustees governs the fund and is responsible for protecting the interests of shareholders. The Trustees are experienced executives who meet periodically throughout the year to oversee the fund's activities, review contractual arrangements with companies that provide services to the fund, oversee management of the risks associated with such activities and contractual arrangements, and review the fund's performance. Except for James C. Curvey, each of the Trustees oversees 174 funds. Mr. Curvey oversees 407 funds.
The Trustees hold office without limit in time except that (a) any Trustee may resign; (b) any Trustee may be removed by written instrument, signed by at least two-thirds of the number of Trustees prior to such removal; (c) any Trustee who requests to be retired or who has become incapacitated by illness or injury may be retired by written instrument signed by a majority of the other Trustees; and (d) any Trustee may be removed at any special meeting of shareholders by a two-thirds vote of the outstanding voting securities of the trust. Each Trustee who is not an interested person (as defined in the 1940 Act) of the trust and the fund (Independent Trustee), shall retire not later than the last day of the calendar year in which his or her 75th birthday occurs. The Independent Trustees may waive this mandatory retirement age policy with respect to individual Trustees. The officers and Advisory Board Member hold office without limit in time, except that any officer and Advisory Board Member may resign or may be removed by a vote of a majority of the Trustees at any regular meeting or any special meeting of the Trustees. Except as indicated, each individual has held the office shown or other offices in the same company for the past five years.
Experience, Skills, Attributes, and Qualifications of the Fund's Trustees. The Governance and Nominating Committee has adopted a statement of policy that describes the experience, qualifications, attributes, and skills that are necessary and desirable for potential Independent Trustee candidates (Statement of Policy). The Board believes that each Trustee satisfied at the time he or she was initially elected or appointed a Trustee, and continues to satisfy, the standards contemplated by the Statement of Policy. The Governance and Nominating Committee also engages professional search firms to help identify potential Independent Trustee candidates who have the experience, qualifications, attributes, and skills consistent with the Statement of Policy. From time to time, additional criteria based on the composition and skills of the current Independent Trustees, as well as experience or skills that may be appropriate in light of future changes to board composition, business conditions, and regulatory or other developments, have also been considered by the professional search firms and the Governance and Nominating Committee. In addition, the Board takes into account the Trustees' commitment and participation in Board and committee meetings, as well as their leadership of standing and ad hoc committees throughout their tenure.
In determining that a particular Trustee was and continues to be qualified to serve as a Trustee, the Board has considered a variety of criteria, none of which, in isolation, was controlling. The Board believes that, collectively, the Trustees have balanced and diverse experience, qualifications, attributes, and skills, which allow the Board to operate effectively in governing the fund and protecting the interests of shareholders. Information about the specific experience, skills, attributes, and qualifications of each Trustee, which in each case led to the Board's conclusion that the Trustee should serve (or continue to serve) as a trustee of the fund, is provided below.
Annual Report
Trustees and Officers - continued
Board Structure and Oversight Function. James C. Curvey is an interested person (as defined in the 1940 Act) and currently serves as Chairman. The Trustees have determined that an interested Chairman is appropriate and benefits shareholders because an interested Chairman has a personal and professional stake in the quality and continuity of services provided to the fund. Independent Trustees exercise their informed business judgment to appoint an individual of their choosing to serve as Chairman, regardless of whether the Trustee happens to be independent or a member of management. The Independent Trustees have determined that they can act independently and effectively without having an Independent Trustee serve as Chairman and that a key structural component for assuring that they are in a position to do so is for the Independent Trustees to constitute a substantial majority for the Board. The Independent Trustees also regularly meet in executive session. Ned C. Lautenbach serves as Chairman of the Independent Trustees and as such (i) acts as a liaison between the Independent Trustees and management with respect to matters important to the Independent Trustees and (ii) with management prepares agendas for Board meetings.
Fidelity funds are overseen by different Boards of Trustees. The fund's Board oversees Fidelity's equity and high income funds and another Board oversees Fidelity's investment-grade bond, money market, and asset allocation funds. The asset allocation funds may invest in Fidelity funds overseen by the fund's Board. The use of separate Boards, each with its own committee structure, allows the Trustees of each group of Fidelity funds to focus on the unique issues of the funds they oversee, including common research, investment, and operational issues. On occasion, the separate Boards establish joint committees to address issues of overlapping consequences for the Fidelity funds overseen by each Board.
The Trustees operate using a system of committees to facilitate the timely and efficient consideration of all matters of importance to the Trustees, the fund, and fund shareholders and to facilitate compliance with legal and regulatory requirements and oversight of the fund's activities and associated risks. The Board, acting through its committees, has charged FMR and its affiliates with (i) identifying events or circumstances the occurrence of which could have demonstrably adverse effects on the fund's business and/or reputation; (ii) implementing processes and controls to lessen the possibility that such events or circumstances occur or to mitigate the effects of such events or circumstances if they do occur; and (iii) creating and maintaining a system designed to evaluate continuously business and market conditions in order to facilitate the identification and implementation processes described in (i) and (ii) above. Because the day-to-day operations and activities of the fund are carried out by or through FMR, its affiliates and other service providers, the fund's exposure to risks is mitigated but not eliminated by the processes overseen by the Trustees. While each of the Board's committees has responsibility for overseeing different aspects of the fund's activities, oversight is exercised primarily through the Operations, Audit, and Compliance Committees. In addition, the Independent Trustees have worked with FMR to enhance the Board's oversight of investment and financial risks, legal and regulatory risks, technology risks, and operational risks, including the development of additional risk reporting to the Board. For example, a working group comprised of Independent Trustees and FMR has worked and continues to work to review the Fidelity funds' valuation-related activities, reporting and risk management. Appropriate personnel, including but not limited to the fund's Chief Compliance Officer (CCO), FMR's internal auditor, the independent accountants, the fund's Treasurer and portfolio management personnel, make periodic reports to the Board's committees, as appropriate, including an annual review of FMR's risk management program for the Fidelity funds. The responsibilities of each standing committee, including their oversight responsibilities, are described further under "Standing Committees of the Fund's Trustees."
Annual Report
The fund's Statement of Additional Information (SAI) includes more information about the Trustees. To request a free copy, call Fidelity at 1-877-208-0098.
Interested Trustees*:
Correspondence intended for each Trustee who is an interested person may be sent to Fidelity Investments, 245 Summer Street, Boston, Massachusetts 02210.
Name, Year of Birth; Principal Occupations and Other Relevant Experience+ |
James C. Curvey (1935) |
Year of Election or Appointment: 2007 Trustee Chairman of the Board of Trustees |
| Mr. Curvey also serves as Trustee of other Fidelity funds. Mr. Curvey is a Director of Fidelity Research & Analysis Co. (2009-present), and Vice Chairman (2007-present) and Director of FMR LLC. In addition, Mr. Curvey serves as an Overseer for the Boston Symphony Orchestra and a member of the board of Artis-Naples, Naples, Florida, and as a Trustee for Brewster Academy, Wolfeboro, New Hampshire. Previously, Mr. Curvey served as a Director of Fidelity Investments Money Management, Inc. (2009-2014), a Director of FMR (2007-2014), and a Director of FMR Co., Inc. (2007-2014). |
Charles S. Morrison (1960) |
Year of Election or Appointment: 2014 Trustee |
| Mr. Morrison also serves as Trustee of other funds. He serves as a Director of Fidelity Investments Money Management, Inc. (FIMM) (2014-present), Director of Fidelity SelectCo, LLC (2014-present), President, Asset Management (2014-present), and is an employee of Fidelity Investments. Previously, Mr. Morrison served as Vice President of Fidelity's Fixed Income and Asset Allocation Funds (2012-2014), President, Fixed Income (2011-2014), Vice President of Fidelity's Money Market Funds (2005-2009), President, Money Market Group Leader of FMR (2009), and Senior Vice President, Money Market Group of FMR (2004-2009). Mr. Morrison also served as Vice President of Fidelity's Bond Funds (2002-2005), certain Balanced Funds (2002-2005), and certain Asset Allocation Funds (2002-2007), and as Senior Vice President (2002-2005) of Fidelity's Bond Division. |
* Trustees have been determined to be "Interested Trustees" by virtue of, among other things, their affiliation with the trust or various entities under common control with FMR.
+ The information above includes each Trustee's principal occupation during the last five years and other information relating to the experience, attributes, and skills relevant to each Trustee's qualifications to serve as a Trustee, which led to the conclusion that each Trustee should serve as a Trustee for the fund.
Annual Report
Independent Trustees:
Correspondence intended for each Independent Trustee (that is, the Trustees other than the Interested Trustees) may be sent to Fidelity Investments, P.O. Box 55235, Boston, Massachusetts 02205-5235.
Name, Year of Birth; Principal Occupations and Other Relevant Experience+ |
Dennis J. Dirks (1948) |
Year of Election or Appointment: 2005 Trustee |
| Mr. Dirks also serves as Trustee of other Fidelity funds. Prior to his retirement in May 2003, Mr. Dirks was Chief Operating Officer and a member of the Board of The Depository Trust & Clearing Corporation (DTCC). He also served as President, Chief Operating Officer, and Board member of The Depository Trust Company (DTC) and President and Board member of the National Securities Clearing Corporation (NSCC). In addition, Mr. Dirks served as Chief Executive Officer and Board member of the Government Securities Clearing Corporation, Chief Executive Officer and Board member of the Mortgage-Backed Securities Clearing Corporation, as a Trustee and a member of the Finance Committee of Manhattan College (2005-2008), and as a Trustee and a member of the Finance Committee of AHRC of Nassau County (2006-2008). Mr. Dirks is a member of the Independent Directors Council (IDC) Governing Council (2010-present) and Board of Directors for The Brookville Center for Children's Services, Inc. (2009-present). |
Alan J. Lacy (1953) |
Year of Election or Appointment: 2008 Trustee |
| Mr. Lacy also serves as Trustee of other Fidelity funds. Mr. Lacy serves as Senior Adviser (2007-present) of Oak Hill Capital Partners, L.P. (private equity). Mr. Lacy also served as Chief Executive Officer (2000-2005) and Vice Chairman (2005-2006) of Sears Holdings Corporation and Sears, Roebuck and Co. (retail). In addition, Mr. Lacy serves as a member of the Board of Directors of Dave & Buster's Entertainment, Inc. (restaurant and entertainment complexes, 2010-present), Earth Fare, Inc. (retail grocery, 2012-present), The Hillman Companies, Inc. (hardware wholesalers, 2010-present), and Bristol-Myers Squibb Company (global pharmaceuticals, 2008-present). Mr. Lacy is a member of the Board of Trustees of The National Parks Conservation Association (2006-present). Previously, Mr. Lacy served as Chairman of the Board of Trustees of the National Parks Conservation Association (2008-2011) and as a member of the Board of Directors for the Western Union Company (global money transfer, 2006-2011). |
Ned C. Lautenbach (1944) |
Year of Election or Appointment: 2000 Trustee Chairman of the Independent Trustees |
| Mr. Lautenbach also serves as Trustee of other Fidelity funds. Mr. Lautenbach currently serves as the Lead Director of the Eaton Corporation Board of Directors (diversified industrial, 1997-present). Mr. Lautenbach is Chairman of the Board of Directors of the Philharmonic Center for the Arts in Naples, Florida (2012-present) and a member of the Council on Foreign Relations (1994-present). Previously, Mr. Lautenbach was a Partner/Advisory Partner at Clayton, Dubilier & Rice, LLC (private equity investment, 1998-2010), as well as a Director of Sony Corporation (2006-2007). |
Joseph Mauriello (1944) |
Year of Election or Appointment: 2008 Trustee |
| Mr. Mauriello also serves as Trustee of other Fidelity funds. Prior to his retirement in January 2006, Mr. Mauriello served in numerous senior management positions including Deputy Chairman and Chief Operating Officer (2004-2005), and Vice Chairman of Financial Services (2002-2004) of KPMG LLP US (professional services, 1965-2005). Mr. Mauriello currently serves as a member of the Board of Directors of XL Group plc. (global insurance and re-insurance, 2006-present). Previously, Mr. Mauriello served as a Director of the Hamilton Funds of the Bank of New York (2006-2007) and of Arcadia Resources Inc. (health care services and products, 2007-2012). |
Robert W. Selander (1950) |
Year of Election or Appointment: 2011 Trustee |
| Mr. Selander also serves as Trustee of other Fidelity funds. Previously, Mr. Selander served as a Member of the Advisory Board of other Fidelity funds (2011), and Executive Vice Chairman (2010), Chief Executive Officer (2009-2010), and President and Chief Executive Officer (1997-2009) of Mastercard, Inc. |
Cornelia M. Small (1944) |
Year of Election or Appointment: 2005 Trustee |
| Ms. Small also serves as Trustee of other Fidelity funds. Ms. Small is a member of the Board of Directors (2009-present) and Chair of the Investment Committee (2010-present) of the Teagle Foundation. Ms. Small also serves on the Investment Committee of the Berkshire Taconic Community Foundation (2008-present). Previously, Ms. Small served as Chairperson (2002-2008) and a member of the Investment Committee and Chairperson (2008-2012) and a member of the Board of Trustees of Smith College. In addition, Ms. Small served as Chief Investment Officer, Director of Global Equity Investments, and a member of the Board of Directors of Scudder, Stevens & Clark and Scudder Kemper Investments. |
William S. Stavropoulos (1939) |
Year of Election or Appointment: 2001 Trustee Vice Chairman of the Independent Trustees |
| Mr. Stavropoulos also serves as Trustee of other Fidelity funds. Mr. Stavropoulos serves as President and Founder of the Michigan Baseball Foundation, the Great Lakes Loons (2007-present). Mr. Stavropoulos is Chairman Emeritus of the Board of Directors of The Dow Chemical Company, where he previously served in numerous senior management positions, including President, CEO (1995-2000; 2002-2004), Chairman of the Executive Committee (2000-2006), and as a member of the Board of Directors (1990-2006). Currently, Mr. Stavropoulos is Chairman of the Board of Directors of Univar Inc. (global distributor of commodity and specialty chemicals), a Director of Teradata Corporation (data warehousing and technology solutions), and Maersk Inc. (industrial conglomerate), and a member of the Advisory Board for Metalmark Capital LLC (private equity investment, 2005-present). Mr. Stavropoulos is an operating advisor to Clayton, Dubilier & Rice, LLC (private equity investment). In addition, Mr. Stavropoulos is a member of the University of Notre Dame Advisory Council for the College of Science, a Trustee of the Rollin L. Gerstacker Foundation, and a Director of the Naples Philharmonic Center for the Arts. Previously, Mr. Stavropoulos served as a Director of Chemical Financial Corporation (bank holding company, 1993-2012) and Tyco International, Ltd. (multinational manufacturing and services, 2007-2012). |
David M. Thomas (1949) |
Year of Election or Appointment: 2008 Trustee |
| Mr. Thomas also serves as Trustee of other Fidelity funds. Mr. Thomas serves as Non-Executive Chairman of the Board of Directors of Fortune Brands Home and Security (home and security products, 2011-present), and as a member of the Board of Directors of Interpublic Group of Companies, Inc. (marketing communication, 2004-present). Previously, Mr. Thomas served as Executive Chairman (2005-2006) and Chairman and Chief Executive Officer (2000-2005) of IMS Health, Inc. (pharmaceutical and healthcare information solutions), and a Director of Fortune Brands, Inc. (consumer products, 2000-2011). |
+ The information above includes each Trustee's principal occupation during the last five years and other information relating to the experience, attributes, and skills relevant to each Trustee's qualifications to serve as a Trustee, which led to the conclusion that each Trustee should serve as a Trustee for the fund.
Advisory Board Member and Officers:
Correspondence intended for each officer and Peter S. Lynch may be sent to Fidelity Investments, 245 Summer Street, Boston, Massachusetts 02210. Officers appear below in alphabetical order.
Name, Year of Birth; Principal Occupation |
Peter S. Lynch (1944) |
Year of Election or Appointment: 2003 Member of the Advisory Board |
| Mr. Lynch also serves as Member of the Advisory Board of other Fidelity funds. Mr. Lynch is Vice Chairman and a Director of FMR and FMR Co., Inc. In addition, Mr. Lynch serves as a Trustee of Boston College and as the Chairman of the Inner-City Scholarship Fund. Previously, Mr. Lynch served on the Special Olympics International Board of Directors (1997-2006). |
Elizabeth Paige Baumann (1968) |
Year of Election or Appointment: 2012 Anti-Money Laundering (AML) Officer |
| Ms. Baumann also serves as AML Officer of other funds. She is Chief AML Officer of FMR LLC (2012-present) and is an employee of Fidelity Investments. Previously, Ms. Baumann served as Vice President and Deputy Anti-Money Laundering Officer (2007-2012). |
William C. Coffey (1969) |
Year of Election or Appointment: 2009 Assistant Secretary |
| Mr. Coffey also serves as Assistant Secretary of other funds. He is Senior Vice President and Deputy General Counsel of FMR LLC (2010-present), and is an employee of Fidelity Investments. Previously, Mr. Coffey served as Vice President and Associate General Counsel of FMR LLC (2005-2009). |
Timothy M. Cohen (1969) |
Year of Election or Appointment: 2014 Vice President of certain Equity Funds |
| Mr. Cohen also serves as Vice President of other funds. Mr. Cohen serves as a Director and Chief Compliance Officer of Fidelity Management & Research (U.K.) Inc. (2013-present) and is an employee of Fidelity Investments. |
Jonathan Davis (1968) |
Year of Election or Appointment: 2010 Assistant Treasurer |
| Mr. Davis also serves as Assistant Treasurer of other funds. Mr. Davis is an employee of Fidelity Investments. Previously, Mr. Davis served as Vice President and Associate General Counsel of FMR LLC (2003-2010). |
Adrien E. Deberghes (1967) |
Year of Election or Appointment: 2008 Deputy Treasurer |
| Mr. Deberghes also serves as an officer of other funds. He is an employee of Fidelity Investments (2008-present). Prior to joining Fidelity Investments, Mr. Deberghes was Senior Vice President of Mutual Fund Administration at State Street Corporation (2007-2008), Senior Director of Mutual Fund Administration at Investors Bank & Trust (2005-2007), and Director of Finance for Dunkin' Brands (2000-2005). |
Stephanie J. Dorsey (1969) |
Year of Election or Appointment: 2010 Assistant Treasurer |
| Ms. Dorsey also serves as an officer of other funds. She is an employee of Fidelity Investments (2008-present) and has served in other fund officer roles. Prior to joining Fidelity Investments, Ms. Dorsey served as Treasurer (2004-2008) of the JPMorgan Mutual Funds and Vice President (2004-2008) of JPMorgan Chase Bank. |
Howard J. Galligan III (1966) |
Year of Election or Appointment: 2014 Chief Financial Officer |
| Mr. Galligan also serves as Chief Financial Officer of other funds. Mr. Galligan serves as President of Fidelity Pricing and Cash Management Services (FPCMS) (2014-present) and as a Director of Strategic Advisers, Inc. (2008-present). Previously, Mr. Galligan served as Chief Administrative Officer of Asset Management (2011-2014) and Chief Operating Officer and Senior Vice President of Investment Support for Strategic Advisers, Inc. (2003-2011). |
Scott C. Goebel (1968) |
Year of Election or Appointment: 2008 Secretary and Chief Legal Officer (CLO) |
| Mr. Goebel serves as Secretary and CLO of other funds. Mr. Goebel also serves as Secretary of Fidelity SelectCo, LLC (2013-present), Fidelity Investments Money Management, Inc. (FIMM) (2010-present) and Fidelity Research and Analysis Company (FRAC) (2010-present); General Counsel, Secretary, and Senior Vice President of FMR (2008-present) and FMR Co., Inc. (2008-present); Chief Legal Officer of Fidelity Management & Research (Hong Kong) Limited (2008-present); and Assistant Secretary of Fidelity Management & Research (Japan) Limited (2008-present) and Fidelity Management & Research (U.K.) Inc. (2008-present). Previously, Mr. Goebel served as Secretary and CLO of other Fidelity funds (2008-2013), Assistant Secretary of FIMM (2008-2010), FRAC (2008-2010), and certain funds (2007-2008); and as Vice President and Secretary of Fidelity Distributors Corporation (FDC) (2005-2007). Mr. Goebel has been employed by FMR LLC or an affiliate since 2001. |
|
Brian B. Hogan (1964) |
Year of Election or Appointment: 2009 Vice President |
| Mr. Hogan also serves as Trustee or Vice President of other funds. Mr. Hogan serves as a Director of Fidelity SelectCo, LLC (2014-present) and President of FMR's Equity Division (2009-present). Previously, Mr. Hogan served as Senior Vice President, Equity Research of FMR (2006-2009) and as a portfolio manager. |
Chris Maher (1972) |
Year of Election or Appointment: 2013 Assistant Treasurer |
| Mr. Maher serves as Assistant Treasurer of other funds. Mr. Maher is Vice President of Valuation Oversight and is an employee of Fidelity Investments. Previously, Mr. Maher served as Vice President of Asset Management Compliance (2013), Vice President of FMR's Program Management Group (2010-2013), and Vice President of Valuation Oversight (2008-2010). |
Kenneth B. Robins (1969) |
Year of Election or Appointment: 2008 President and Treasurer |
| Mr. Robins also serves as an officer of other funds. Mr. Robins serves as Executive Vice President of Fidelity Investments Money Management, Inc. (FIMM) (2013-present) and is an employee of Fidelity Investments (2004-present). Previously, Mr. Robins served in other fund officer roles. |
Stephen Sadoski (1971) |
Year of Election or Appointment: 2012 Deputy Treasurer |
| Mr. Sadoski also serves as Deputy Treasurer of other funds. He is an employee of Fidelity Investments (2012-present) and has served in another fund officer role. Prior to joining Fidelity Investments, Mr. Sadoski served as an assistant chief accountant in the Division of Investment Management of the Securities and Exchange Commission (SEC) (2009-2012) and as a senior manager at Deloitte & Touche LLP (1997-2009). |
Stacie M. Smith (1974) |
Year of Election or Appointment: 2013 Deputy Treasurer |
| Ms. Smith also serves as an officer of other funds. She is an employee of Fidelity Investments (2009-present) and has served in other fund officer roles. Prior to joining Fidelity Investments, Ms. Smith served as Senior Audit Manager of Ernst & Young LLP (1996-2009). |
Renee Stagnone (1975) |
Year of Election or Appointment: 2013 Deputy Treasurer |
| Ms. Stagnone also serves as Deputy Treasurer of other funds. Ms. Stagnone is an employee of Fidelity Investments. |
Linda J. Wondrack (1964) |
Year of Election or Appointment: 2014 Chief Compliance Officer |
| Ms. Wondrack also serves as Chief Compliance Officer of other funds. Ms. Wondrack is Executive Vice President and head of the Ethics Office and Asset Management Compliance for Fidelity Investments (2012-present). Ms. Wondrack also serves as Chief Compliance Officer of Fidelity SelectCo, LLC (2014-present); Chief Compliance Officer of Impresa Management LLC (2013-present); and Chief Compliance Officer of FMR Co., Inc., Fidelity Investments Money Management, Inc., Fidelity Management & Research (Japan) Limited, Fidelity Management & Research (U.K.) Inc., Fidelity Management & Research (Hong Kong), Fidelity Management & Research Company, Pyramis Global Advisors, LLC, and Strategic Advisers, Inc., Ballyrock Investment Advisors LLC, and Northern Neck Investors LLC (2012-present). Previously, Ms. Wondrack served as Senior Vice President and Chief Compliance Officer for Columbia Management Investment Advisers, LLC (2005-2012); Chief Compliance Officer for certain funds within the Columbia Family of Funds (2007-2012); and Senior Vice President of Compliance Risk Management at Bank of America (2005-2010). |
Joseph F. Zambello (1957) |
Year of Election or Appointment: 2011 Deputy Treasurer |
| Mr. Zambello also serves as Deputy Treasurer of other funds. Mr. Zambello is an employee of Fidelity Investments. Previously, Mr. Zambello served as Vice President of FMR's Program Management Group (2009-2011) and Vice President of the Transfer Agent Oversight Group (2005-2009). |
Annual Report
The Board of Trustees of Advisor International Small Cap Opportunities Fund voted to pay to shareholders of record at the opening of business on record date, the following distributions per share derived from capital gains realized from sales of portfolio securities, and dividends derived from net investment income:
| Pay Date | Record Date | Dividends | Capital Gains |
Institutional Class | 12/08/14 | 12/05/14 | $0.107 | $0.021 |
Institutional Class designates 6% of the dividends distributed in December 2013 during the fiscal year as qualifying for the dividends-received deduction for corporate shareholders.
Institutional Class designates 100% of the dividends distributed in December 2013 during the fiscal year as amounts which may be taken into account as a dividend for purposes of the maximum rate under section 1(h) (11) of the Internal Revenue Code.
The amounts per share which represent income derived from sources within, and taxes paid to, foreign countries or possessions of the United States are as follows:
| Pay Date | Income | Taxes |
Institutional Class | 12/09/2013 | $0.1059 | $0.0152 |
The fund will notify shareholders in January 2015 of amounts for use in preparing 2014 income tax returns.
Annual Report
Board Approval of Investment Advisory Contracts and Management Fees
Fidelity International Small Cap Opportunities Fund
Each year, the Board of Trustees, including the Independent Trustees (together, the Board), votes on the renewal of the management contract with Fidelity Management & Research Company (FMR) and the sub-advisory agreements (together, the Advisory Contracts) for the fund. The Board, assisted by the advice of fund counsel and Independent Trustees' counsel, requests and considers a broad range of information relevant to the renewal of the Advisory Contracts throughout the year.
The Board meets regularly and, at each of its meetings, covers an extensive agenda of topics and materials and considers factors that are relevant to its annual consideration of the renewal of the fund's Advisory Contracts, including the services and support provided to the fund and its shareholders. The Board has established various standing committees (Committees), each composed of and chaired by Independent Trustees with varying backgrounds, to which the Board has assigned specific subject matter responsibilities in order to enhance effective decision-making by the Board. The Board, acting directly and through its Committees, requests and receives information concerning the annual consideration of the renewal of the fund's Advisory Contracts. The Board also meets as needed to consider matters specifically related to the Board's annual consideration of the renewal of the Advisory Contracts. Members of the Board may also meet with trustees of other Fidelity funds through ad hoc joint committees to discuss certain matters relevant to the Fidelity funds.
At its July 2014 meeting, the Board, including the Independent Trustees, unanimously determined to renew the fund's Advisory Contracts. In reaching its determination, the Board considered all factors it believed relevant, including (i) the nature, extent, and quality of the services to be provided to the fund and its shareholders (including the investment performance of the fund); (ii) the competitiveness of the fund's management fee and total expense ratio relative to peer funds; (iii) the total costs of the services to be provided by and the profits to be realized by Fidelity from its relationship with the fund; (iv) the extent to which economies of scale exist and would be realized as the fund grows; and (v) whether fee levels reflect these economies of scale, if any, for the benefit of fund shareholders. In connection with separate internal corporate reorganizations involving Fidelity Management & Research (U.K.) Inc. (FMR U.K.) and Fidelity Management & Research (Japan) Inc. (FMR Japan), the Board approved certain non-material amendments to the fund's sub-advisory agreements with FMR U.K. and FMR Japan to reflect that, after these reorganizations, FMR Investment Management (UK) Limited and Fidelity Management & Research (Japan) Limited will carry on the business of FMR U.K. and FMR Japan, respectively. The Board noted that no changes to the portfolio managers or to the foreign research or investment advisory services provided to the fund were expected in connection with either reorganization and that the same personnel and resources would continue to be available to the fund at the new entities.
Annual Report
In considering whether to renew the Advisory Contracts for the fund, the Board reached a determination, with the assistance of fund counsel and Independent Trustees' counsel and through the exercise of its business judgment, that the renewal of the Advisory Contracts was in the best interests of the fund and its shareholders and that the compensation payable under the Advisory Contracts was fair and reasonable. The Board's decision to renew the Advisory Contracts was not based on any single factor, but rather was based on a comprehensive consideration of all the information provided to the Board at its meetings throughout the year. The Board, in reaching its determination to renew the Advisory Contracts, was aware that shareholders of the fund have a broad range of investment choices available to them, including a wide choice among funds offered by Fidelity's competitors, and that the fund's shareholders, who have the opportunity to review and weigh the disclosure provided by the fund in its prospectus and other public disclosures, have chosen to invest in this fund, which is part of the Fidelity family of funds.
Nature, Extent, and Quality of Services Provided. The Board considered Fidelity's staffing as it relates to the fund, including the backgrounds of investment personnel of FMR and the sub-advisers (together, the Investment Advisers), and also considered the fund's investment objective, strategies, and related investment philosophy. The Independent Trustees also had discussions with senior management of Fidelity's investment operations and investment groups. The Board considered the structure of the portfolio manager compensation program and whether this structure provides appropriate incentives to act in the best interests of the fund. Additionally, the Board considered the portfolio managers' investments, if any, in the funds that they manage.
Resources Dedicated to Investment Management and Support Services. The Board and the Fund Oversight and Research Committees reviewed the general qualificationsand capabilities of Fidelity's investment staff, including its size, education, experience, and resources, as well as Fidelity's approach to recruiting, training, managing, and compensating investment personnel. The Board noted that Fidelity has continued to increase the resources devoted to non-U.S. offices, including expansion of Fidelity's global investment organization. The Board also noted that Fidelity's analysts have extensive resources, tools and capabilities that allow them to conduct sophisticated quantitative and fundamental analysis, as well as credit analysis of issuers, counterparties and guarantors. Further, the Board believes that Fidelity's investment professionals have sufficient access to global information and data so as to provide competitive investment results over time, and that those professionals also have access to sophisticated tools that permit them to assess portfolio construction and risk and performance attribution characteristics continuously, as well as to transmit new information and research conclusions rapidly around the world. Additionally, in its deliberations, the Board considered Fidelity's trading and risk management capabilities and resources and global compliance infrastructure, which are an integral part of the investment management process.
Annual Report
Board Approval of Investment Advisory Contracts and
Management Fees - continued
Shareholder and Administrative Services. The Board considered (i) the nature, extent, quality, and cost of advisory, administrative, and shareholder services performed by the Investment Advisers and their affiliates under the Advisory Contracts and under separate agreements covering transfer agency, pricing and bookkeeping, and securities lending services for the fund; (ii) the nature and extent of the supervision of third party service providers, principally custodians and subcustodians; and (iii) the resources devoted to, and the record of compliance with, the fund's compliance policies and procedures. The Board also reviewed the allocation of fund brokerage, including allocations to brokers affiliated with the Investment Advisers, the use of brokerage commissions to pay fund expenses, and the use of "soft" commission dollars to pay for research services.
The Board noted that the growth of fund assets over time across the complex allows Fidelity to reinvest in the development of services designed to enhance the value or convenience of the Fidelity funds as investment vehicles. These services include 24-hour access to account information and market information through telephone representatives and over the Internet, investor education materials and asset allocation tools, and the expanded availability of Fidelity Investor Centers.
In 2014, the Board formed an ad hoc Committee on Transfer Agency Fees to review the variety of transfer agency fee structures throughout the industry and Fidelity's competitive positioning with respect to industry participants.
Investment in a Large Fund Family. The Board considered the benefits to shareholders of investing in a Fidelity fund, including the benefits of investing in a fund that is part of a large family of funds offering a variety of investment disciplines and providing a large variety of mutual fund investor services. The Board noted that Fidelity had taken, or had made recommendations that resulted in the Fidelity funds taking, a number of actions over the previous year that benefited particular funds, including (i) continuing to dedicate additional resources to investment research and to the support of the senior management team that oversees asset management; (ii) persisting in efforts to enhance Fidelity's global research capabilities; (iii) launching new funds and making other enhancements to meet client needs for income-oriented solutions; (iv) reducing fund expenses for certain index funds; (v) continuing to launch dedicated lower cost underlying funds to meet portfolio construction needs related to expanding underlying fund options for Fidelity funds of funds, specifically for the Freedom Fund product lines; (vi) rationalizing product lines and gaining increased efficiencies through fund mergers; (vii) launching sector-based exchange-traded funds and establishing a new Fidelity adviser to manage sector-based funds and products; (viii) continuing to develop and implement technology to improve security and increase efficiency; (ix) modifying the eligibility criteria for certain share classes to increase their marketability to a portion of the defined contribution plan market; (x) waiving redemption fees for certain qualified fund-of-fund and wrap programs and certain retirement plan transactions; and (xi) launching new Institutional Class shares of certain money market funds to attract and retain assets and to fill a gap in the money market fund lineup.
Annual Report
Investment Performance. The Board considered whether the fund has operated in accordance with its investment objective, as well as its record of compliance with its investment restrictions and its performance history.
The Board took into account discussions with the Investment Advisers about fund investment performance that occur at Board meetings throughout the year. In this regard the Board noted that as part of regularly scheduled fund reviews and other reports to the Board on fund performance, the Board periodically considers annualized return information for the fund, for different time periods, measured against a securities market index ("benchmark index") and a peer group of funds with similar objectives ("peer group"). In its evaluation of fund investment performance, the Board gave particular attention to information indicating changes in performance of certain Fidelity funds for specific time periods and the Investment Advisers' explanations for any overperformance or underperformance.
In addition to reviewing absolute and relative fund performance, the Independent Trustees periodically consider the appropriateness of fund performance metrics in evaluating the results achieved. In general, the Independent Trustees believe that fund performance should be evaluated based on net performance (after fees and expenses) of both the highest performing and lowest performing classes, where applicable, compared to appropriate benchmark indices, over appropriate time periods which may include full market cycles, and compared to peer groups, as applicable, over the same periods, taking into account relevant factors including the following: general market conditions; issuer-specific information; tactical opportunities for investment; and fund cash flows and other factors.
The Independent Trustees recognize that shareholders evaluate performance on a net basis over their own holding periods, for which one-, three-, and five-year periods are often used as a proxy. For this reason, the performance information reviewed by the Board also included net cumulative calendar year total return information for the fund and an appropriate benchmark index and peer group for the most recent one-, three-, and five-year periods, as shown below. Returns are shown compared to the 25th percentile (top of box, 75% beaten) and 75th percentile (bottom of box, 25% beaten) of the peer universe. Returns of the benchmark index are "net MA," i.e., adjusted for tax withholding rates applicable to U.S.-based funds organized as Massachusetts business trusts.
Annual Report
Board Approval of Investment Advisory Contracts and
Management Fees - continued
Fidelity International Small Cap Opportunities Fund

The Board also considered that the fund's management fee is subject to upward or downward adjustment depending upon whether, and to what extent, the fund's investment performance for the performance period exceeds, or is exceeded by, a securities index, thus leading to a performance adjustment for the same period. The Board noted that the performance adjustment provides FMR with a strong economic incentive to seek to achieve superior performance for the fund's shareholders and helps to more closely align the interests of FMR and the fund's shareholders.
Based on its review, the Board concluded that the nature, extent, and quality of services provided to the fund under the Advisory Contracts should benefit the fund's shareholders.
Competitiveness of Management Fee and Total Expense Ratio. The Board considered the fund's management fee and total expense ratio compared to "mapped groups" of competitive funds and classes. Fidelity creates "mapped groups" by combining similar Lipper investment objective categories that have comparable investment mandates. Combining Lipper investment objective categories aids the Board's management fee and total expense ratio comparisons by broadening the competitive group used for comparison and by reducing the number of universes to which various Fidelity funds are compared.
Management Fee. The Board considered two proprietary management fee comparisons for the 12-month periods shown in the chart below. The group of Lipper funds used by the Board for management fee comparisons is referred to below as the "Total Mapped Group." The Total Mapped Group is broader than the Lipper peer group used by the Board for performance comparisons because the Total Mapped Group combines several Lipper investment objective categories while the Lipper peer group does not. The Total Mapped Group comparison focuses on a fund's standing in terms of gross management fees before expense reimbursements or caps, and without giving effect to the fund's performance adjustment, relative to the total universe of funds with comparable investment mandates, regardless of whether their management fee structures also are comparable. Funds with comparable investment mandates offer exposure to similar types of securities. Funds with comparable management fee structures have similar management fee contractual arrangements (e.g., flat rate charged for advisory services, all-inclusive fee rate, etc.). "TMG %" represents the percentage of funds in the Total Mapped Group that had management fees that were lower than the fund's. For example, a hypothetical TMG % of 20% would mean that 80% of the funds in the Total Mapped Group had higher, and 20% had lower, management fees than the fund. The fund's actual TMG %s are in the chart below. The "Asset-Size Peer Group" (ASPG) comparison focuses on a fund's standing relative to a subset of non-Fidelity funds within the Total Mapped Group that are similar in size and management fee structure. For example, if a fund is in the first quartile of the ASPG, the fund's management fee ranks in the least expensive or lowest 25% of funds in the ASPG. The ASPG represents at least 15% of the funds in the Total Mapped Group with comparable asset size and management fee structures, subject to a minimum of 50 funds (or all funds in the Total Mapped Group if fewer than 50). Additional information, such as the ASPG quartile in which the fund's management fee rate ranked and the impact of the fund's performance adjustment, is also included in the chart and considered by the Board.
Annual Report
Fidelity International Small Cap Opportunities Fund

Annual Report
Board Approval of Investment Advisory Contracts and
Management Fees - continued
The Board noted that the fund's management fee rate ranked below the median of its Total Mapped Group and below the median of its ASPG for 2013. The Board also noted the effect of the fund's positive performance adjustment on the fund's management fee ranking.
The Board also noted that, in August 2013, the ad hoc Committee on Management Fees was formed to conduct an in-depth review of the management fee rates of Fidelity's active equity mutual funds. The Committee focused on the following areas: (i) standard fee structures; (ii) research consumption and trading evolution; (iii) management fee competitiveness/profitability by category; and (iv) factors that drive institutional pricing.
Based on its review, the Board concluded that the fund's management fee is fair and reasonable in light of the services that the fund receives and the other factors considered.
Total Expense Ratio. In its review of each class's total expense ratio, the Board considered the fund's management fee as well as other fund or class expenses, as applicable, such as transfer agent fees, pricing and bookkeeping fees, fund-paid 12b-1 fees, and custodial, legal, and audit fees. The Board also noted the effects of any waivers and reimbursements on fees and expenses, as well as the impact of the fund's performance adjustment. As part of its review, the Board also considered the current and historical total expense ratios of each class of the fund compared to competitive fund median expenses. Each class of the fund is compared to those funds and classes in the Total Mapped Group (used by the Board for management fee comparisons) that have a similar sales load structure.
The Board noted that the total expense ratio of each of Class A and the retail class ranked below its competitive median for 2013 and the total expense ratio of each of Class T, Class B, Class C, and Institutional Class ranked above its competitive median for 2013. The Board considered that, in general, various factors can affect total expense ratios. The Board noted that the total expense ratio of Class T was above the competitive median primarily because of higher 12b-1 fees on Class T as compared to most competitor funds. Class T has a higher 12b-1 fee, but a lower front-end sales charge, than traditionally priced front-end sales charge classes. The Board considered that Class T is primarily sold load-waived in the retirement plan market where its 0.50% 12b-1 fee is comparable to competing no-load, higher 12b-1 fee classes designed specifically for retirement plans. The Board noted that the fund offers multiple classes, each of which has a different sales load and 12b-1 fee structure, and that the multiple structures are intended to offer a range of pricing options for the intermediary market. The Board also noted that the total expense ratios of the classes vary primarily by the level of their 12b-1 fees, although differences in transfer agent fees may also cause expenses to vary from class to class.
Annual Report
Fees Charged to Other Fidelity Clients. The Board also considered Fidelity fee structures and other information with respect to clients of Fidelity, such as other funds advised or subadvised by Fidelity, pension plan clients, and other institutional clients. The Board noted the findings of the 2013 ad hoc joint committee (created with the board of other Fidelity funds), which reviewed and compared Fidelity's institutional investment advisory business with its business of providing services to the Fidelity funds, including the differences in services provided, fees charged, and costs incurred, as well as competition in their respective marketplaces.
Based on its review of total expense ratios and fees charged to other Fidelity clients, the Board concluded that the total expense ratio of each class of the fund was reasonable, although in some cases above the median of the universe presented for comparison, in light of the services that the fund and its shareholders receive and the other factors considered.
Costs of the Services and Profitability. The Board considered the revenues earned and the expenses incurred by Fidelity in conducting the business of developing, marketing, distributing, managing, administering and servicing the fund and servicing the fund's shareholders. The Board also considered the level of Fidelity's profits in respect of all the Fidelity funds.
On an annual basis, Fidelity presents to the Board Fidelity's profitability for the fund. Fidelity calculates the profitability for each fund, as well as aggregate profitability for groups of Fidelity funds and all Fidelity funds, using a series of detailed revenue and cost allocation methodologies which originate with the books and records of Fidelity on which Fidelity's audited financial statements are based. The Audit Committee of the Board reviews any significant changes from the prior year's methodologies.
PricewaterhouseCoopers LLP (PwC), independent registered public accounting firm and auditor to Fidelity and certain Fidelity funds, has been engaged annually by the Board as part of the Board's assessment of Fidelity's profitability analysis. PwC's engagement includes the review and assessment of the methodologies used by Fidelity in determining the revenues and expenses attributable to Fidelity's mutual fund business, and completion of agreed-upon procedures in respect of the mathematical accuracy of fund profitability and its conformity to established allocation methodologies. After considering PwC's reports issued under the engagement and information provided by Fidelity, the Board concluded that while other allocation methods may also be reasonable, Fidelity's profitability methodologies are reasonable in all material respects.
The Board also reviewed Fidelity's non-fund businesses and fall-out benefits related to the mutual fund business as well as cases where Fidelity's affiliates may benefit from or be related to the fund's business.
Annual Report
Board Approval of Investment Advisory Contracts and
Management Fees - continued
The Board considered the costs of the services provided by and the profits realized by Fidelity in connection with the operation of the fund and was satisfied that the profitability was not excessive in the circumstances.
Economies of Scale. The Board considered whether there have been economies of scale in respect of the management of the Fidelity funds, whether the Fidelity funds (including the fund) have appropriately benefited from any such economies of scale, and whether there is potential for realization of any further economies of scale. The Board considered the extent to which the fund will benefit from economies of scale through increased services to the fund, through waivers or reimbursements, or through fee or expense ratio reductions. The Board also noted that in 2013, it and the boards of other Fidelity funds created an ad hoc committee (the Economies of Scale Committee) to analyze whether Fidelity attains economies of scale in respect of the management and servicing of the Fidelity funds, whether the Fidelity funds have appropriately benefited from such economies of scale, and whether there is potential for realization of any further economies of scale.
The Board recognized that the fund's management contract incorporates a "group fee" structure, which provides for lower group fee rates as total group assets increase, and for higher group fee rates as total group assets decrease (with "group assets" defined to include fund assets under FMR's management plus sector fund assets previously under FMR's management and currently managed by Fidelity SelectCo, LLC). FMR calculates the group fee rates based on a tiered asset "breakpoint" schedule that varies based on asset class. The Board considered that the group fee is designed to deliver the benefits of economies of scale to fund shareholders when total Fidelity fund assets increase, even if assets of any particular fund are unchanged or have declined, because some portion of Fidelity's costs are attributable to services provided to all Fidelity funds, and all funds benefit if those costs can be allocated among more assets. The Board concluded that, given the group fee structure, fund shareholders will benefit from lower management fees as group assets increase at the fund complex level, regardless of whether Fidelity achieves any such economies of scale.
The Board concluded, taking into account the analysis of the Economies of Scale Committee, that economies of scale, if any, are being appropriately shared between fund shareholders and Fidelity.
Additional Information Requested by the Board. In order to develop fully the factual basis for consideration of the Fidelity funds' Advisory Contracts, the Board requested and received additional information on certain topics, including: (i) fund performance trends and Fidelity's long-term strategies for certain funds; (ii) Fidelity's strategic marketing and product lineup goals; (iii) the methodology with respect to competitive fund data and peer group classifications; (iv) the arrangements with, and performance of, certain sub-advisers on behalf of the Fidelity funds, as well as certain proposed participating affiliate arrangements; (v) the realization of fall-out benefits in certain Fidelity business units; (vi) Fidelity's group fee structures, including the rationale for the individual fee rates of certain categories of funds and the definition of group assets; (vii) trends regarding industry use of performance fee structures and the performance adjustment methodologies applicable to the Fidelity funds; (viii) additional competitive analysis regarding the total expenses for certain classes; (ix) fund profitability methodology, including Fidelity's cost allocation methodology, and the impact of certain factors on fund profitability results; and (x) the process by which Fidelity determines sub-advisory fees for funds it advises.
Annual Report
Based on its evaluation of all of the conclusions noted above, and after considering all factors it believed relevant, the Board ultimately concluded that the advisory fee structures are fair and reasonable, and that the fund's Advisory Contracts should be renewed.
Annual Report
Investment Adviser
Fidelity Management & Research Company
Boston, MA
Investment Sub-Advisers
FMR Co., Inc.
Fidelity Management & Research
(U.K.) Inc.
Fidelity Management & Research
(Hong Kong) Limited
Fidelity Management & Research
(Japan) Limited
FIL Investment Advisors
FIL Investments (Japan) Limited
FIL Investment Advisors (U.K.) Limited
General Distributor
Fidelity Distributors Corporation
Smithfield, RI
Transfer and Service Agents
Fidelity Investments Institutional
Operations Company, Inc.
Boston, MA
Fidelity Service Company, Inc.
Boston, MA
Custodian
The Northern Trust Company
Chicago, IL
(Fidelity Investment logo)(registered trademark)
AILSI-UANN-1214
1.815081.109
Fidelity®
International Small Cap Opportunities
Fund
Annual Report
October 31, 2014
(Fidelity Cover Art)
Contents
Performance | (Click Here) | How the fund has done over time. |
Management's Discussion of Fund Performance | (Click Here) | The Portfolio Manager's review of fund performance and strategy. |
Shareholder Expense Example | (Click Here) | An example of shareholder expenses. |
Investment Changes | (Click Here) | A summary of major shifts in the fund's investments over the past six months. |
Investments | (Click Here) | A complete list of the fund's investments with their market values. |
Financial Statements | (Click Here) | Statements of assets and liabilities, operations, and changes in net assets, as well as financial highlights. |
Notes | (Click Here) | Notes to the financial statements. |
Report of Independent Registered Public Accounting Firm | (Click Here) | |
Trustees and Officers | (Click Here) | |
Distributions | (Click Here) | |
Board Approval of Investment Advisory Contracts and Management Fees | (Click Here) | |
To view a fund's proxy voting guidelines and proxy voting record for the 12-month period ended June 30, visit http://www.fidelity.com/proxyvotingresults or visit the Securities and Exchange Commission's (SEC) web site at http://www.sec.gov. You may also call 1-800-544-8544 to request a free copy of the proxy voting guidelines.
Standard & Poor's, S&P and S&P 500 are registered service marks of The McGraw-Hill Companies, Inc. and have been licensed for use by Fidelity Distributors Corporation.
Other third-party marks appearing herein are the property of their respective owners.
All other marks appearing herein are registered or unregistered trademarks or service marks of FMR LLC or an affiliated company. © 2014 FMR LLC. All rights reserved.
Annual Report
This report and the financial statements contained herein are submitted for the general information of the shareholders of the fund. This report is not authorized for distribution to prospective investors in the fund unless preceded or accompanied by an effective prospectus.
A fund files its complete schedule of portfolio holdings with the SEC for the first and third quarters of each fiscal year on Form N-Q. Forms N-Q are available on the SEC's web site at http://www.sec.gov. A fund's Forms N-Q may be reviewed and copied at the SEC's Public Reference Room in Washington, DC. Information regarding the operation of the SEC's Public Reference Room may be obtained by calling 1-800-SEC-0330. For a complete list of a fund's portfolio holdings, view the most recent holdings listing, semiannual report, or annual report on Fidelity's web site at http://www.fidelity.com, http://www.advisor.fidelity.com, or http://www.401k.com, as applicable.
NOT FDIC INSURED • MAY LOSE VALUE • NO BANK GUARANTEE
Neither the fund nor Fidelity Distributors Corporation is a bank.
Annual Report
Average annual total return reflects the change in the value of an investment, assuming reinvestment of the class' distributions from dividend income and capital gains (the profits earned upon the sale of securities that have grown in value, if any) and assuming a constant rate of performance each year. The $10,000 table and the fund's returns do not reflect the deduction of taxes that a shareholder would pay on fund distributions or the redemption of fund shares. During periods of reimbursement by Fidelity, a fund's total return will be greater than it would be had the reimbursement not occurred. How a fund did yesterday is no guarantee of how it will do tomorrow.
Average Annual Total Returns
Periods ended October 31, 2014 | Past 1
year | Past 5
years | Life of fund A |
Fidelity® International Small Cap Opportunities Fund | 1.11% | 12.85% | 5.77% |
A From August 2, 2005
$10,000 Over Life of Fund
Let's say hypothetically that $10,000 was invested in Fidelity® International Small Cap Opportunities Fund, a class of the fund, on August 2, 2005, when the fund started. The chart shows how the value of your investment would have changed, and also shows how the MSCI EAFE Small Cap Index performed over the same period.
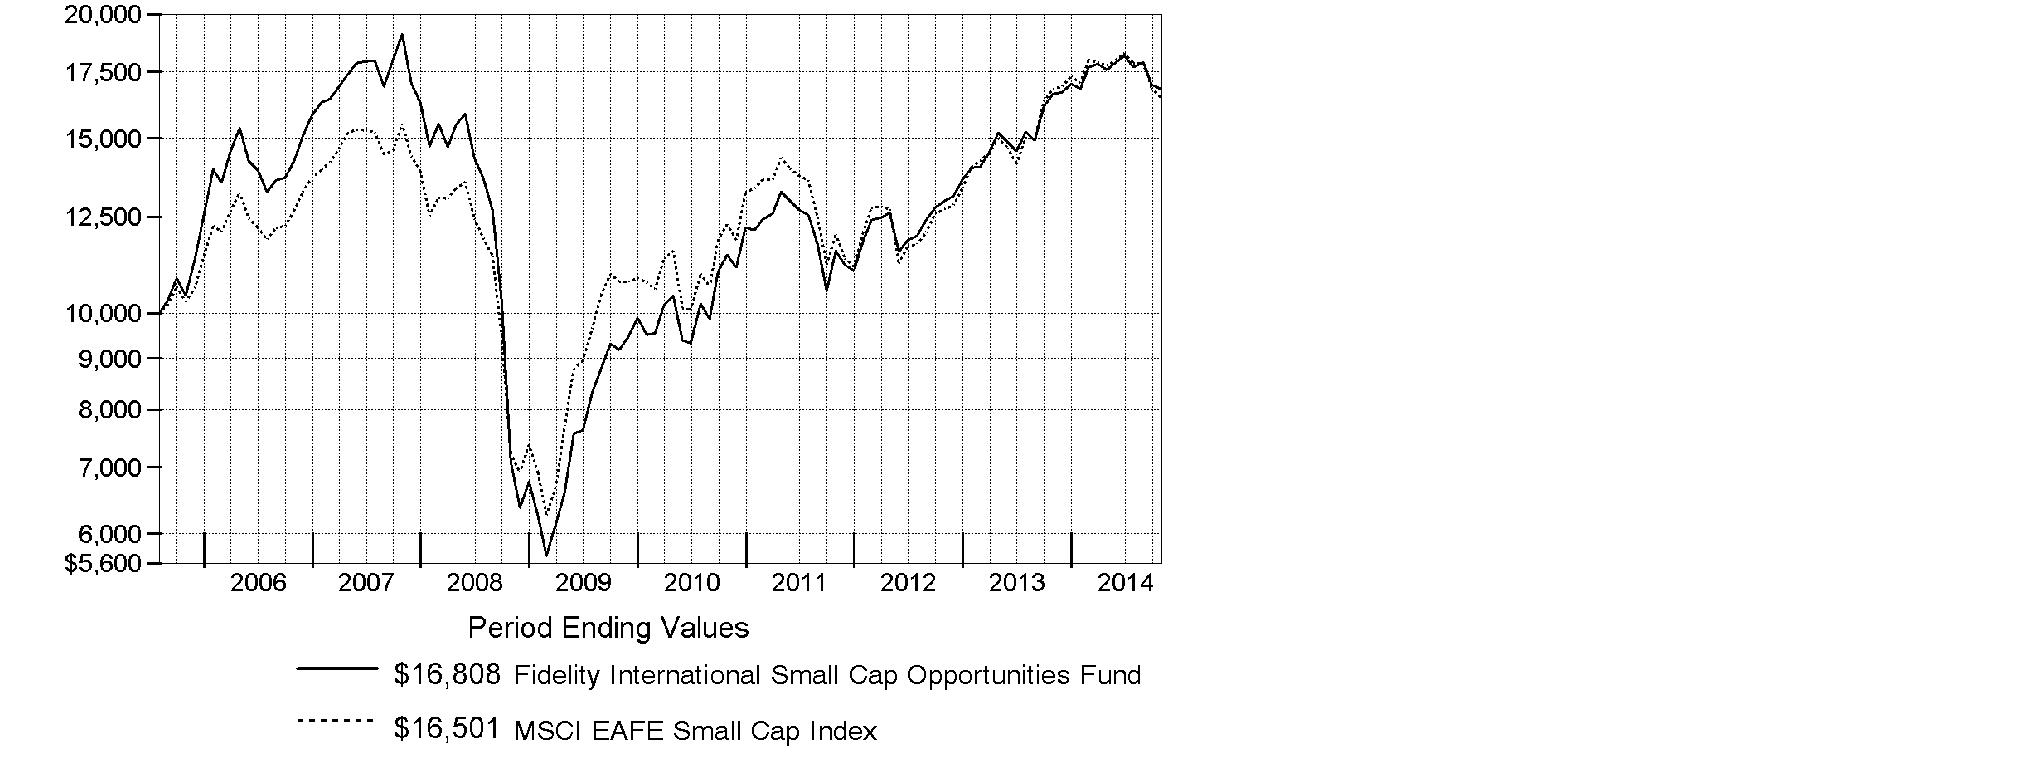
Annual Report
Market Recap: Global equities posted a healthy gain for the 12 months ending October 31, 2014, overcoming an October market decline driven by recessionary pressures in China and tepid growth in Europe. The MSCI ACWI (All Country World Index) Index rose 8.15%, helped by subdued market volatility for much of the period and supported by solid corporate earnings, especially in the United States. Stocks also benefited from easy monetary policies in Japan and the eurozone, as well as increased stimulus efforts in China. All but three of the 24 industry groups that compose the index marked a positive return. The U.S. (+17%) remained a pillar of strength, while a strongly rising dollar in the latter part of the period detracted from investors' returns in most non-U.S. markets. Canada (+5%) notched broad gains outside of its energy and materials sectors, as did Asia-Pacific ex Japan (+4%), led by investor enthusiasm for companies in India. The U.K., Europe and Japan, meanwhile, all underperformed. Among sectors, health care (+24%) led the index, with a strong contribution from the pharmaceuticals, biotechnology & life sciences industry. Information technology (+21%) also outperformed. Conversely, materials (-4%) and energy (-1%) lagged the index due to a higher supply of and lower demand for commodities.
Comments from Jed Weiss, Portfolio Manager of Fidelity® International Small Cap Opportunities Fund: For the year, the fund's Retail Class shares gained 1.11%, ahead of the benchmark MSCI EAFE Small Cap Index, which returned -1.91%. The fund especially benefited in relative terms from strong stock selection in Japan, the Netherlands and Sweden within Europe, and South Korea and South Africa within emerging markets. The fund's positioning in Denmark and stock selection in Turkey were minor negatives. On an individual basis, Fagerhult, a Swedish manufacturer of lighting fixtures, added the most value. Harmonic Drive Systems, a Japanese maker of gears for robotic arms, also contributed to the fund's results, as did South Korea's Coway and U.K.-based hotel company Intercontinental Hotel Group. In contrast, the biggest detractor was PriceSmart, a U.S.-based warehouse retailer that does nearly all of its business in Central America and Colombia. During the period, PriceSmart stock struggled as weak emerging-market economies and a maturing market in Central America made the business environment a little tougher. Another detractor was Goldcrest, a Japanese real estate company, whose shares were hurt as pessimism grew about the Japanese economy. Of all the stocks mentioned, Goldcrest was the lone index member.
The views expressed above reflect those of the portfolio manager(s) only through the end of the period as stated on the cover of this report and do not necessarily represent the views of Fidelity or any other person in the Fidelity organization. Any such views are subject to change at any time based upon market or other conditions and Fidelity disclaims any responsibility to update such views. These views may not be relied on as investment advice and, because investment decisions for a Fidelity fund are based on numerous factors, may not be relied on as an indication of trading intent on behalf of any Fidelity fund.
Annual Report
Shareholder Expense Example
As a shareholder of the Fund, you incur two types of costs: (1) transaction costs, including sales charges (loads) on purchase payments or redemption proceeds, redemption fees and (2) ongoing costs, including management fees, distribution and/or service (12b-1) fees and other Fund expenses. This Example is intended to help you understand your ongoing costs (in dollars) of investing in the Fund and to compare these costs with the ongoing costs of investing in other mutual funds.
The Example is based on an investment of $1,000 invested at the beginning of the period and held for the entire period (May 1, 2014 to October 31, 2014).
Actual Expenses
The first line of the accompanying table for each class of the Fund provides information about actual account values and actual expenses. You may use the information in this line, together with the amount you invested, to estimate the expenses that you paid over the period. Simply divide your account value by $1,000.00 (for example, an $8,600 account value divided by $1,000.00 = 8.6), then multiply the result by the number in the first line for a class of the Fund under the heading entitled "Expenses Paid During Period" to estimate the expenses you paid on your account during this period. A small balance maintenance fee of $12.00 that is charged once a year may apply for certain accounts with a value of less than $2,000. This fee is not included in the table below. If it was, the estimate of expenses you paid during the period would be higher, and your ending account value lower, by this amount. In addition, the Fund, as a shareholder in the underlying Fidelity Central Funds, will indirectly bear its pro-rata share of the fees and expenses incurred by the underlying Fidelity Central Funds. These fees and expenses are not included in the Fund's annualized expense ratio used to calculate the expense estimate in the table below.
Hypothetical Example for Comparison Purposes
The second line of the accompanying table for each class of the Fund provides information about hypothetical account values and hypothetical expenses based on a Class' actual expense ratio and an assumed rate of return of 5% per year before expenses, which is not the Class' actual return. The hypothetical account values and expenses may not be used to estimate the actual ending account balance or expenses you paid for the period. You may use this information to compare the ongoing costs of investing in the Fund and other funds. To do so, compare this 5% hypothetical example with the 5% hypothetical examples that appear in the shareholder reports of the other funds. A small balance maintenance fee of $12.00 that is charged once a year may apply for certain accounts with a value of less than $2,000. This fee is not included in the table below. If it was, the estimate of expenses you paid during the period would be higher, and your ending account value lower, by this amount. In addition, the Fund, as a shareholder in the underlying Fidelity Central Funds, will indirectly bear its pro-rata share of the fees and expenses incurred by the underlying Fidelity Central Funds. These fees and expenses are not included in the Fund's annualized expense ratio used to calculate the expense estimate in the table below.
Please note that the expenses shown in the table are meant to highlight your ongoing costs only and do not reflect any transaction costs. Therefore, the second line of the table is useful in comparing ongoing costs only, and will not help you determine the relative total costs of owning different funds. In addition, if these transactional costs were included, your costs would have been higher.
Annual Report
Shareholder Expense Example - continued
| Annualized
Expense RatioB | Beginning
Account Value
May 1, 2014 | Ending
Account Value
October 31, 2014 | Expenses Paid
During Period*
May 1, 2014
to October 31, 2014 |
Class A | 1.63% | | | |
Actual | | $ 1,000.00 | $ 954.50 | $ 8.03 |
HypotheticalA | | $ 1,000.00 | $ 1,016.99 | $ 8.29 |
Class T | 1.88% | | | |
Actual | | $ 1,000.00 | $ 953.50 | $ 9.26 |
HypotheticalA | | $ 1,000.00 | $ 1,015.73 | $ 9.55 |
Class B | 2.36% | | | |
Actual | | $ 1,000.00 | $ 950.70 | $ 11.60 |
HypotheticalA | | $ 1,000.00 | $ 1,013.31 | $ 11.98 |
Class C | 2.37% | | | |
Actual | | $ 1,000.00 | $ 951.10 | $ 11.66 |
HypotheticalA | | $ 1,000.00 | $ 1,013.26 | $ 12.03 |
International Small Cap Opportunities | 1.30% | | | |
Actual | | $ 1,000.00 | $ 956.30 | $ 6.41 |
HypotheticalA | | $ 1,000.00 | $ 1,018.65 | $ 6.61 |
Institutional Class | 1.38% | | | |
Actual | | $ 1,000.00 | $ 955.70 | $ 6.80 |
HypotheticalA | | $ 1,000.00 | $ 1,018.25 | $ 7.02 |
A 5% return per year before expenses
B Annualized expense ratio reflects expenses net of applicable fee waivers.
* Expenses are equal to each Class' annualized expense ratio, multiplied by the average account value over the period, multiplied by 184/365 (to reflect the one-half year period).
Annual Report
Investment Changes (Unaudited)
Geographic Diversification (% of fund's net assets) |
As of October 31, 2014 |
 | Japan 27.3% | |
 | United Kingdom 20.5% | |
 | United States of America* 12.8% | |
 | Germany 4.8% | |
 | Italy 4.0% | |
 | Netherlands 3.5% | |
 | Sweden 2.7% | |
 | Korea (South) 2.4% | |
 | France 2.0% | |
 | Other 20.0% | |

Percentages are based on country or territory of incorporation and are adjusted for the effect of futures contracts, if applicable. |
* Includes Short-Term Investments and Net Other Assets (Liabilities). |
As of April 30, 2014 |
| Japan 22.8% | |
| United Kingdom 18.2% | |
| United States of America* 17.3% | |
| Germany 5.6% | |
| Italy 4.4% | |
| Netherlands 4.0% | |
 | Sweden 2.5% | |
| France 2.3% | |
| Ireland 2.2% | |
| Other 20.7% | |

Percentages are based on country or territory of incorporation and are adjusted for the effect of futures contracts, if applicable. |
* Includes Short-Term Investments and Net Other Assets (Liabilities). |
Asset Allocation as of October 31, 2014 |
| % of fund's
net assets | % of fund's net assets
6 months ago |
Stocks | 97.2 | 93.6 |
Short-Term Investments and Net Other Assets (Liabilities) | 2.8 | 6.4 |
Top Ten Stocks as of October 31, 2014 |
| % of fund's
net assets | % of fund's net assets
6 months ago |
USS Co. Ltd. (Japan, Specialty Retail) | 2.3 | 2.0 |
Spirax-Sarco Engineering PLC (United Kingdom, Machinery) | 1.7 | 1.6 |
Unite Group PLC (United Kingdom, Real Estate Management & Development) | 1.6 | 1.6 |
SS&C Technologies Holdings, Inc. (United States of America, Software) | 1.6 | 1.1 |
Berendsen PLC (United Kingdom, Commercial Services & Supplies) | 1.5 | 0.9 |
CTS Eventim AG (Germany, Media) | 1.5 | 1.5 |
Azimut Holding SpA (Italy, Capital Markets) | 1.5 | 1.7 |
Fagerhult AB (Sweden, Electrical Equipment) | 1.5 | 1.2 |
Interpump Group SpA (Italy, Machinery) | 1.4 | 1.6 |
OSG Corp. (Japan, Machinery) | 1.4 | 1.2 |
| 16.0 | |
Market Sectors as of October 31, 2014 |
| % of fund's
net assets | % of fund's net assets
6 months ago |
Industrials | 20.5 | 21.0 |
Financials | 19.4 | 19.3 |
Consumer Discretionary | 18.4 | 16.9 |
Materials | 10.7 | 9.8 |
Consumer Staples | 9.6 | 9.1 |
Information Technology | 9.2 | 7.9 |
Health Care | 6.4 | 6.7 |
Energy | 3.0 | 2.9 |
Annual Report
Investments October 31, 2014
Showing Percentage of Net Assets
Common Stocks - 96.3% |
| Shares | | Value |
Australia - 1.7% |
DuluxGroup Ltd. | 548,583 | | $ 2,592,535 |
Imdex Ltd. (a) | 1,779,471 | | 942,244 |
RCG Corp. Ltd. | 3,726,715 | | 2,015,918 |
Sydney Airport unit | 795,862 | | 3,094,100 |
TFS Corp. Ltd. | 1,926,002 | | 2,669,496 |
TOTAL AUSTRALIA | | 11,314,293 |
Austria - 1.2% |
Andritz AG | 117,900 | | 5,691,191 |
Zumtobel AG | 144,181 | | 2,541,270 |
TOTAL AUSTRIA | | 8,232,461 |
Belgium - 1.2% |
Gimv NV | 66,688 | | 3,029,415 |
KBC Ancora (a) | 172,738 | | 4,997,132 |
TOTAL BELGIUM | | 8,026,547 |
Bermuda - 1.1% |
Lazard Ltd. Class A | 61,499 | | 3,026,366 |
Petra Diamonds Ltd. (a) | 787,509 | | 2,091,232 |
Vostok Nafta Investment Ltd. SDR (a) | 316,909 | | 2,029,996 |
TOTAL BERMUDA | | 7,147,594 |
Brazil - 0.3% |
Arezzo Industria e Comercio SA | 169,900 | | 1,967,848 |
T4F Entretenimento SA (a) | 19,200 | | 21,696 |
TOTAL BRAZIL | | 1,989,544 |
British Virgin Islands - 0.4% |
Gem Diamonds Ltd. (a) | 1,047,996 | | 2,602,734 |
Canada - 1.6% |
Pason Systems, Inc. | 266,200 | | 6,370,094 |
ShawCor Ltd. Class A | 92,400 | | 4,070,503 |
TOTAL CANADA | | 10,440,597 |
Cayman Islands - 0.2% |
58.com, Inc. ADR | 30,600 | | 1,210,842 |
Denmark - 1.7% |
Jyske Bank A/S (Reg.) (a) | 115,827 | | 6,240,364 |
Spar Nord Bank A/S | 521,369 | | 5,266,797 |
TOTAL DENMARK | | 11,507,161 |
Common Stocks - continued |
| Shares | | Value |
Finland - 0.7% |
Tikkurila Oyj | 219,753 | | $ 4,538,320 |
France - 2.0% |
Coface SA | 141,800 | | 1,766,305 |
Laurent-Perrier Group SA | 31,163 | | 2,499,322 |
Saft Groupe SA | 57,516 | | 1,708,205 |
Vetoquinol SA | 56,184 | | 2,534,651 |
Virbac SA | 20,052 | | 4,484,121 |
TOTAL FRANCE | | 12,992,604 |
Germany - 3.9% |
alstria office REIT-AG | 249,000 | | 3,087,268 |
CompuGroup Medical AG | 269,478 | | 6,179,843 |
CTS Eventim AG | 372,280 | | 9,815,637 |
Fielmann AG | 96,874 | | 6,316,320 |
TOTAL GERMANY | | 25,399,068 |
Greece - 0.7% |
Titan Cement Co. SA (Reg.) | 196,480 | | 4,355,613 |
India - 0.5% |
Jyothy Laboratories Ltd. (a) | 857,717 | | 3,498,544 |
Ireland - 1.8% |
FBD Holdings PLC | 240,328 | | 4,065,755 |
James Hardie Industries PLC: | | | |
CDI | 165,775 | | 1,768,263 |
sponsored ADR | 112,915 | | 6,021,757 |
TOTAL IRELAND | | 11,855,775 |
Israel - 1.7% |
Azrieli Group | 90,005 | | 2,889,292 |
Ituran Location & Control Ltd. | 84,286 | | 1,727,020 |
Sarine Technologies Ltd. | 1,308,000 | | 3,033,378 |
Strauss Group Ltd. | 214,344 | | 3,457,298 |
TOTAL ISRAEL | | 11,106,988 |
Italy - 4.0% |
Azimut Holding SpA | 411,997 | | 9,623,721 |
Beni Stabili SpA SIIQ | 10,445,675 | | 7,192,954 |
Interpump Group SpA | 722,943 | | 9,421,943 |
TOTAL ITALY | | 26,238,618 |
Japan - 27.3% |
Air Water, Inc. | 131,000 | | 2,088,180 |
Common Stocks - continued |
| Shares | | Value |
Japan - continued |
Aozora Bank Ltd. | 2,035,000 | | $ 7,152,839 |
Artnature, Inc. (d) | 292,600 | | 3,956,987 |
Asahi Co. Ltd. | 241,100 | | 2,680,751 |
Autobacs Seven Co. Ltd. | 212,000 | | 3,110,003 |
Azbil Corp. | 223,100 | | 5,380,163 |
Broadleaf Co. Ltd. | 51,000 | | 806,063 |
Coca-Cola Central Japan Co. Ltd. | 245,400 | | 4,415,498 |
Cosmos Pharmaceutical Corp. | 31,300 | | 4,475,248 |
Daiichikosho Co. Ltd. | 79,400 | | 2,003,776 |
Daikokutenbussan Co. Ltd. | 168,700 | | 4,908,757 |
Glory Ltd. | 96,800 | | 2,494,487 |
Goldcrest Co. Ltd. | 316,330 | | 5,723,003 |
Harmonic Drive Systems, Inc. | 260,700 | | 3,365,610 |
Iwatsuka Confectionary Co. Ltd. | 63,300 | | 3,419,313 |
Kobayashi Pharmaceutical Co. Ltd. | 72,500 | | 4,475,182 |
Koshidaka Holdings Co. Ltd. | 141,200 | | 2,411,118 |
Kyoto Kimono Yuzen Co. Ltd. | 78,500 | | 707,348 |
Lasertec Corp. | 220,900 | | 2,763,839 |
Medikit Co. Ltd. | 71,200 | | 2,218,561 |
Meiko Network Japan Co. Ltd. | 112,600 | | 1,266,143 |
Miraial Co. Ltd. | 73,200 | | 1,127,074 |
Nabtesco Corp. | 185,800 | | 4,496,454 |
Nagaileben Co. Ltd. | 292,600 | | 5,624,057 |
ND Software Co. Ltd. | 35,491 | | 636,001 |
Nihon M&A Center, Inc. | 68,900 | | 1,980,136 |
Nihon Parkerizing Co. Ltd. | 334,000 | | 7,972,492 |
Nippon Seiki Co. Ltd. | 143,000 | | 3,046,346 |
NS Tool Co. Ltd. | 35,600 | | 408,889 |
OBIC Co. Ltd. | 189,800 | | 6,775,679 |
OSG Corp. | 568,100 | | 9,263,550 |
Paramount Bed Holdings Co. Ltd. | 60,700 | | 1,726,444 |
San-Ai Oil Co. Ltd. | 381,000 | | 2,637,316 |
Seven Bank Ltd. | 2,163,800 | | 9,036,897 |
SHO-BOND Holdings Co. Ltd. | 193,700 | | 7,484,619 |
Shoei Co. Ltd. | 249,100 | | 3,806,780 |
SK Kaken Co. Ltd. | 34,000 | | 2,602,107 |
Software Service, Inc. | 62,900 | | 2,395,403 |
Techno Medica Co. Ltd. | 79,400 | | 1,719,455 |
TFP Consulting Group Co. Ltd. | 41,700 | | 1,216,523 |
The Nippon Synthetic Chemical Industry Co. Ltd. | 436,000 | | 2,662,060 |
TKC Corp. | 156,900 | | 3,080,143 |
Tocalo Co. Ltd. | 117,000 | | 2,207,069 |
Common Stocks - continued |
| Shares | | Value |
Japan - continued |
Tsutsumi Jewelry Co. Ltd. | 81,000 | | $ 1,992,316 |
USS Co. Ltd. | 955,800 | | 15,042,372 |
Workman Co. Ltd. | 79,400 | | 4,149,861 |
Yamato Kogyo Co. Ltd. | 217,900 | | 7,058,866 |
TOTAL JAPAN | | 179,971,778 |
Korea (South) - 2.4% |
Bgf Retail (a) | 58,838 | | 3,723,768 |
Coway Co. Ltd. | 114,533 | | 8,698,345 |
Leeno Industrial, Inc. | 89,751 | | 3,554,305 |
TOTAL KOREA (SOUTH) | | 15,976,418 |
Mexico - 0.6% |
Consorcio ARA S.A.B. de CV (a) | 9,235,478 | | 4,252,109 |
Netherlands - 3.5% |
Aalberts Industries NV | 319,501 | | 8,506,130 |
ASM International NV (depositary receipt) | 63,400 | | 2,075,082 |
Heijmans NV (Certificaten Van Aandelen) | 365,133 | | 4,960,020 |
VastNed Retail NV | 164,729 | | 7,521,282 |
TOTAL NETHERLANDS | | 23,062,514 |
Philippines - 0.5% |
Jollibee Food Corp. | 727,170 | | 3,169,279 |
South Africa - 1.7% |
Alexander Forbes Group Holding (a) | 2,593,721 | | 2,022,349 |
Clicks Group Ltd. | 878,287 | | 5,980,131 |
Nampak Ltd. | 795,900 | | 3,245,008 |
TOTAL SOUTH AFRICA | | 11,247,488 |
Spain - 1.0% |
Prosegur Compania de Seguridad SA (Reg.) | 1,102,590 | | 6,466,406 |
Sweden - 2.7% |
Fagerhult AB | 512,812 | | 9,444,883 |
Intrum Justitia AB | 273,334 | | 8,121,379 |
TOTAL SWEDEN | | 17,566,262 |
Taiwan - 0.3% |
Addcn Technology Co. Ltd. | 210,000 | | 2,019,633 |
Common Stocks - continued |
| Shares | | Value |
Turkey - 1.1% |
Albaraka Turk Katilim Bankasi A/S | 3,666,046 | | $ 2,589,563 |
Coca-Cola Icecek Sanayi A/S | 206,362 | | 4,707,243 |
TOTAL TURKEY | | 7,296,806 |
United Kingdom - 20.5% |
Advanced Computer Software Group PLC | 1,223,900 | | 2,114,503 |
Babcock International Group PLC | 164,700 | | 2,885,003 |
Bellway PLC | 327,072 | | 9,151,067 |
Berendsen PLC | 613,663 | | 9,914,935 |
Britvic PLC | 511,971 | | 5,573,295 |
Dechra Pharmaceuticals PLC | 351,050 | | 4,256,736 |
Derwent London PLC | 101,710 | | 4,833,980 |
Elementis PLC | 1,558,710 | | 6,580,263 |
Great Portland Estates PLC | 621,789 | | 6,828,450 |
H&T Group PLC | 264,353 | | 672,388 |
Hilton Food Group PLC | 217,188 | | 1,302,884 |
Informa PLC | 901,781 | | 6,938,805 |
InterContinental Hotel Group PLC ADR | 141,931 | | 5,394,797 |
ITE Group PLC | 979,734 | | 2,668,295 |
Johnson Matthey PLC | 96,475 | | 4,589,806 |
Meggitt PLC | 640,590 | | 4,622,655 |
Persimmon PLC | 171,863 | | 4,022,215 |
Rotork PLC | 119,700 | | 4,892,419 |
Shaftesbury PLC | 687,673 | | 7,876,505 |
Spectris PLC | 279,178 | | 8,047,751 |
Spirax-Sarco Engineering PLC | 238,421 | | 10,869,959 |
Ted Baker PLC | 133,700 | | 4,159,964 |
Ultra Electronics Holdings PLC | 218,058 | | 6,087,038 |
Unite Group PLC | 1,534,757 | | 10,483,494 |
TOTAL UNITED KINGDOM | | 134,767,207 |
United States of America - 10.0% |
ANSYS, Inc. (a) | 21,085 | | 1,656,438 |
Autoliv, Inc. | 57,100 | | 5,238,354 |
Broadridge Financial Solutions, Inc. | 48,905 | | 2,148,397 |
Dril-Quip, Inc. (a) | 39,595 | | 3,561,570 |
Evercore Partners, Inc. Class A | 56,600 | | 2,930,182 |
Kennedy-Wilson Holdings, Inc. | 250,229 | | 6,778,704 |
Martin Marietta Materials, Inc. | 52,020 | | 6,082,178 |
Mohawk Industries, Inc. (a) | 47,800 | | 6,789,512 |
Oceaneering International, Inc. | 42,502 | | 2,986,616 |
PriceSmart, Inc. | 75,199 | | 6,694,967 |
Common Stocks - continued |
| Shares | | Value |
United States of America - continued |
ResMed, Inc. (d) | 49,100 | | $ 2,564,002 |
Solera Holdings, Inc. | 152,056 | | 7,899,309 |
SS&C Technologies Holdings, Inc. (a) | 212,058 | | 10,246,643 |
TOTAL UNITED STATES OF AMERICA | | 65,576,872 |
TOTAL COMMON STOCKS (Cost $519,760,738) |
633,830,075
|
Nonconvertible Preferred Stocks - 0.9% |
| | | |
Germany - 0.9% |
Sartorius AG (non-vtg.)
(Cost $5,714,273) | 50,279 | |
5,481,620
|
Money Market Funds - 2.7% |
| | | |
Fidelity Cash Central Fund, 0.11% (b) | 16,109,819 | | 16,109,819 |
Fidelity Securities Lending Cash Central Fund, 0.11% (b)(c) | 1,839,312 | | 1,839,312 |
TOTAL MONEY MARKET FUNDS (Cost $17,949,131) |
17,949,131
|
TOTAL INVESTMENT PORTFOLIO - 99.9% (Cost $543,424,142) | | 657,260,826 |
NET OTHER ASSETS (LIABILITIES) - 0.1% | | 950,326 |
NET ASSETS - 100% | $ 658,211,152 |
Legend |
(a) Non-income producing |
(b) Affiliated fund that is generally available only to investment companies and other accounts managed by Fidelity Investments. The rate quoted is the annualized seven-day yield of the fund at period end. A complete unaudited listing of the fund's holdings as of its most recent quarter end is available upon request. In addition, each Fidelity Central Fund's financial statements, which are not covered by the Fund's Report of Independent Registered Public Accounting Firm, are available on the SEC's website or upon request. |
(c) Investment made with cash collateral received from securities on loan. |
(d) Security or a portion of the security is on loan at period end. |
Affiliated Central Funds |
Information regarding fiscal year to date income earned by the Fund from investments in Fidelity Central Funds is as follows: |
Fund | Income earned |
Fidelity Cash Central Fund | $ 30,975 |
Fidelity Securities Lending Cash Central Fund | 171,600 |
Total | $ 202,575 |
Other Information |
Categorizations in the Schedule of Investments are based on country or territory of incorporation. |
The following is a summary of the inputs used, as of October 31, 2014, involving the Fund's assets and liabilities carried at fair value. The inputs or methodology used for valuing securities may not be an indication of the risk associated with investing in those securities. For more information on valuation inputs, and their aggregation into the levels used in the tables below, please refer to the Investment Valuation section in the accompanying Notes to Financial Statements. |
Valuation Inputs at Reporting Date: |
Description | Total | Level 1 | Level 2 | Level 3 |
Investments in Securities: | | | | |
Equities: | | | | |
Consumer Discretionary | $ 120,836,975 | $ 75,434,964 | $ 45,402,011 | $ - |
Consumer Staples | 63,088,437 | 33,938,908 | 29,149,529 | - |
Energy | 19,626,099 | 16,988,783 | 2,637,316 | - |
Financials | 127,665,001 | 105,752,262 | 21,912,739 | - |
Health Care | 41,935,397 | 27,615,476 | 14,319,921 | - |
Industrials | 135,178,251 | 96,133,436 | 39,044,815 | - |
Information Technology | 60,518,381 | 38,565,787 | 21,952,594 | - |
Materials | 70,463,154 | 40,106,911 | 30,356,243 | - |
Money Market Funds | 17,949,131 | 17,949,131 | - | - |
Total Investments in Securities: | $ 657,260,826 | $ 452,485,658 | $ 204,775,168 | $ - |
The following is a summary of transfers between Level 1 and Level 2 for the period ended October 31, 2014. Transfers are assumed to have occurred at the beginning of the period, and are primarily attributable to the valuation techniques used for foreign equity securities, as discussed in the accompanying Notes to Financial Statements: |
Transfers | Total |
Level 1 to Level 2 | $ 13,207,974 |
Level 2 to Level 1 | $ 0 |
See accompanying notes which are an integral part of the financial statements.
Annual Report
Statement of Assets and Liabilities
| October 31, 2014 |
| | |
Assets | | |
Investment in securities, at value (including securities loaned of $1,799,362) - See accompanying schedule: Unaffiliated issuers (cost $525,475,011) | $ 639,311,695 | |
Fidelity Central Funds (cost $17,949,131) | 17,949,131 | |
Total Investments (cost $543,424,142) | | $ 657,260,826 |
Foreign currency held at value (cost $181,591) | | 181,589 |
Receivable for investments sold | | 752,361 |
Receivable for fund shares sold | | 2,224,294 |
Dividends receivable | | 1,600,124 |
Distributions receivable from Fidelity Central Funds | | 5,338 |
Prepaid expenses | | 2,323 |
Other receivables | | 3,053 |
Total assets | | 662,029,908 |
| | |
Liabilities | | |
Payable for investments purchased | $ 376,673 | |
Payable for fund shares redeemed | 823,331 | |
Accrued management fee | 513,986 | |
Distribution and service plan fees payable | 16,541 | |
Other affiliated payables | 159,593 | |
Other payables and accrued expenses | 89,320 | |
Collateral on securities loaned, at value | 1,839,312 | |
Total liabilities | | 3,818,756 |
| | |
Net Assets | | $ 658,211,152 |
Net Assets consist of: | | |
Paid in capital | | $ 828,641,898 |
Undistributed net investment income | | 3,990,517 |
Accumulated undistributed net realized gain (loss) on investments and foreign currency transactions | | (288,211,957) |
Net unrealized appreciation (depreciation) on investments and assets and liabilities in foreign currencies | | 113,790,694 |
Net Assets | | $ 658,211,152 |
See accompanying notes which are an integral part of the financial statements.
Annual Report
Financial Statements - continued
Statement of Assets and Liabilities - continued
| October 31, 2014 |
| | |
Calculation of Maximum Offering Price Class A:
Net Asset Value and redemption price per share ($25,041,102 ÷ 1,834,238 shares) | | $ 13.65 |
| | |
Maximum offering price per share (100/94.25 of $13.65) | | $ 14.48 |
Class T:
Net Asset Value and redemption price per share ($9,913,278 ÷ 732,914 shares) | | $ 13.53 |
| | |
Maximum offering price per share (100/96.50 of $13.53) | | $ 14.02 |
Class B:
Net Asset Value and offering price per share ($744,419 ÷ 55,919 shares)A | | $ 13.31 |
| | |
Class C:
Net Asset Value and offering price per share ($8,437,794 ÷ 637,935 shares)A | | $ 13.23 |
| | |
International Small Cap Opportunities:
Net Asset Value, offering price and redemption price per share ($584,252,917 ÷ 42,348,080 shares) | | $ 13.80 |
| | |
Institutional Class:
Net Asset Value, offering price and redemption price per share ($29,821,642 ÷ 2,159,960 shares) | | $ 13.81 |
A Redemption price per share is equal to net asset value less any applicable contingent deferred sales charge.
See accompanying notes which are an integral part of the financial statements.
Annual Report
Statement of Operations
| Year ended October 31, 2014 |
| | |
Investment Income | | |
Dividends | | $ 13,633,581 |
Income from Fidelity Central Funds | | 202,575 |
Income before foreign taxes withheld | | 13,836,156 |
Less foreign taxes withheld | | (1,157,520) |
Total income | | 12,678,636 |
| | |
Expenses | | |
Management fee
Basic fee | $ 5,510,809 | |
Performance adjustment | 826,188 | |
Transfer agent fees | 1,519,749 | |
Distribution and service plan fees | 212,488 | |
Accounting and security lending fees | 322,189 | |
Custodian fees and expenses | 141,145 | |
Independent trustees' compensation | 2,625 | |
Registration fees | 94,354 | |
Audit | 71,780 | |
Legal | 2,138 | |
Miscellaneous | 3,926 | |
Total expenses before reductions | 8,707,391 | |
Expense reductions | (4,405) | 8,702,986 |
Net investment income (loss) | | 3,975,650 |
Realized and Unrealized Gain (Loss) Net realized gain (loss) on: | | |
Investment securities: | | |
Unaffiliated issuers | 27,597,575 | |
Foreign currency transactions | (131,152) | |
Total net realized gain (loss) | | 27,466,423 |
Change in net unrealized appreciation (depreciation) on: Investment securities | (28,619,605) | |
Assets and liabilities in foreign currencies | (41,552) | |
Total change in net unrealized appreciation (depreciation) | | (28,661,157) |
Net gain (loss) | | (1,194,734) |
Net increase (decrease) in net assets resulting from operations | | $ 2,780,916 |
See accompanying notes which are an integral part of the financial statements.
Annual Report
Financial Statements - continued
Statement of Changes in Net Assets
| Year ended
October 31,
2014 | Year ended
October 31,
2013 |
Increase (Decrease) in Net Assets | | |
Operations | | |
Net investment income (loss) | $ 3,975,650 | $ 3,604,267 |
Net realized gain (loss) | 27,466,423 | 37,116,732 |
Change in net unrealized appreciation (depreciation) | (28,661,157) | 71,945,657 |
Net increase (decrease) in net assets resulting from operations | 2,780,916 | 112,666,656 |
Distributions to shareholders from net investment income | (3,580,601) | (3,311,096) |
Distributions to shareholders from net realized gain | (3,233,620) | (171,255) |
Total distributions | (6,814,221) | (3,482,351) |
Share transactions - net increase (decrease) | 97,201,705 | 81,271,586 |
Redemption fees | 84,800 | 56,441 |
Total increase (decrease) in net assets | 93,253,200 | 190,512,332 |
| | |
Net Assets | | |
Beginning of period | 564,957,952 | 374,445,620 |
End of period (including undistributed net investment income of $3,990,517 and undistributed net investment income of $3,595,468, respectively) | $ 658,211,152 | $ 564,957,952 |
See accompanying notes which are an integral part of the financial statements.
Annual Report
Financial Highlights - Class A
Years ended October 31, | 2014 | 2013 | 2012 | 2011 | 2010 |
Selected Per-Share Data | | | | | |
Net asset value, beginning of period | $ 13.68 | $ 10.78 | $ 9.75 | $ 9.82 | $ 8.07 |
Income from Investment Operations | | | | | |
Net investment income (loss) C | .05 | .07 | .08 | .15F | .06 |
Net realized and unrealized gain (loss) | .05 | 2.91 | 1.07 | (.07) | 1.85 |
Total from investment operations | .10 | 2.98 | 1.15 | .08 | 1.91 |
Distributions from net investment income | (.06) | (.08) | (.11) | (.11) | (.07) |
Distributions from net realized gain | (.08) | (.01) | (.01) | (.04) | (.09) |
Total distributions | (.13) J | (.08) I | (.12) | (.15) | (.16) |
Redemption fees added to paid in capital C, H | - | - | - | - | - |
Net asset value, end of period | $ 13.65 | $ 13.68 | $ 10.78 | $ 9.75 | $ 9.82 |
Total ReturnA, B | .78% | 27.85% | 12.00% | .81% | 24.05% |
Ratios to Average Net Assets D, G | | | | | |
Expenses before reductions | 1.63% | 1.70% | 1.75% | 1.34% | 1.16% |
Expenses net of fee waivers, if any | 1.63% | 1.65% | 1.65% | 1.33% | 1.16% |
Expenses net of all reductions | 1.63% | 1.64% | 1.64% | 1.32% | 1.15% |
Net investment income (loss) | .33% | .59% | .85% | 1.44% F | .74% |
Supplemental Data | | | | | |
Net assets, end of period (000 omitted) | $ 25,041 | $ 22,052 | $ 18,194 | $ 18,686 | $ 20,228 |
Portfolio turnover rateE | 18% | 31% | 28% | 24% | 49% |
A Total returns would have been lower if certain expenses had not been reduced during the applicable periods shown.
B Total returns do not include the effect of the sales charges.
C Calculated based on average shares outstanding during the period.
D Fees and expenses of any underlying Fidelity Central Funds are not included in the Fund's expense ratio. The Fund indirectly bears its proportionate share of the expenses of any underlying Fidelity Central Funds.
E Amount does not include the portfolio activity of any underlying Fidelity Central Funds.
F Investment income per share reflects a large, non-recurring dividend which amounted to $.06 per share. Excluding this non-recurring dividend, the ratio of net investment income (loss) to average net assets would have been .80%.
G Expense ratios reflect operating expenses of the class. Expenses before reductions do not reflect amounts reimbursed by the investment adviser or reductions from brokerage service arrangements or reductions from other expense offset arrangements and do not represent the amount paid by the class during periods when reimbursements or reductions occur. Expenses net of fee waivers reflect expenses after reimbursement by the investment adviser but prior to reductions from brokerage service arrangements or other expense offset arrangements. Expenses net of all reductions represent the net expenses paid by the class.
H Amount represents less than $.01 per share.
I Total distributions of $.08 per share is comprised of distributions from net investment income of $.077 and distributions from net realized gain of $.005 per share.
J Total distributions of $.13 per share is comprised of distributions from net investment income of $.055 and distributions from net realized gain of $.079 per share.
See accompanying notes which are an integral part of the financial statements.
Annual Report
Financial Highlights - Class T
Years ended October 31, | 2014 | 2013 | 2012 | 2011 | 2010 |
Selected Per-Share Data | | | | | |
Net asset value, beginning of period | $ 13.56 | $ 10.69 | $ 9.66 | $ 9.72 | $ 8.00 |
Income from Investment Operations | | | | | |
Net investment income (loss) C | .01 | .04 | .06 | .12F | .04 |
Net realized and unrealized gain (loss) | .06 | 2.89 | 1.06 | (.06) | 1.83 |
Total from investment operations | .07 | 2.93 | 1.12 | .06 | 1.87 |
Distributions from net investment income | (.02) | (.05) | (.08) | (.08) | (.06) |
Distributions from net realized gain | (.08) | (.01) | (.01) | (.04) | (.09) |
Total distributions | (.10) | (.06) | (.09) | (.12) | (.15) |
Redemption fees added to paid in capital C, H | - | - | - | - | - |
Net asset value, end of period | $ 13.53 | $ 13.56 | $ 10.69 | $ 9.66 | $ 9.72 |
Total ReturnA, B | .55% | 27.53% | 11.72% | .60% | 23.65% |
Ratios to Average Net Assets D, G | | | | | |
Expenses before reductions | 1.89% | 1.96% | 2.02% | 1.60% | 1.43% |
Expenses net of fee waivers, if any | 1.89% | 1.90% | 1.90% | 1.60% | 1.43% |
Expenses net of all reductions | 1.89% | 1.89% | 1.89% | 1.59% | 1.41% |
Net investment income (loss) | .07% | .34% | .60% | 1.17%F | .48% |
Supplemental Data | | | | | |
Net assets, end of period (000 omitted) | $ 9,913 | $ 9,634 | $ 8,169 | $ 8,701 | $ 11,202 |
Portfolio turnover rateE | 18% | 31% | 28% | 24% | 49% |
A Total returns would have been lower if certain expenses had not been reduced during the applicable periods shown.
B Total returns do not include the effect of the sales charges.
C Calculated based on average shares outstanding during the period.
D Fees and expenses of any underlying Fidelity Central Funds are not included in the Fund's expense ratio. The Fund indirectly bears its proportionate share of the expenses of any underlying Fidelity Central Funds.
E Amount does not include the portfolio activity of any underlying Fidelity Central Funds.
F Investment income per share reflects a large, non-recurring dividend which amounted to $.06 per share. Excluding this non-recurring dividend, the ratio of net investment income (loss) to average net assets would have been .54%.
G Expense ratios reflect operating expenses of the class. Expenses before reductions do not reflect amounts reimbursed by the investment adviser or reductions from brokerage service arrangements or reductions from other expense offset arrangements and do not represent the amount paid by the class during periods when reimbursements or reductions occur. Expenses net of fee waivers reflect expenses after reimbursement by the investment adviser but prior to reductions from brokerage service arrangements or other expense offset arrangements. Expenses net of all reductions represent the net expenses paid by the class.
H Amount represents less than $.01 per share.
See accompanying notes which are an integral part of the financial statements.
Annual Report
Financial Highlights - Class B
Years ended October 31, | 2014 | 2013 | 2012 | 2011 | 2010 |
Selected Per-Share Data | | | | | |
Net asset value, beginning of period | $ 13.31 | $ 10.50 | $ 9.48 | $ 9.54 | $ 7.87 |
Income from Investment Operations | | | | | |
Net investment income (loss) C | (.06) | (.02) | .01 | .07F | -H |
Net realized and unrealized gain (loss) | .06 | 2.84 | 1.05 | (.06) | 1.79 |
Total from investment operations | - | 2.82 | 1.06 | .01 | 1.79 |
Distributions from net investment income | - | -H | (.03) | (.06) | (.03) |
Distributions from net realized gain | - | (.01) | (.01) | (.02) | (.09) |
Total distributions | - | (.01) | (.04) | (.07)I | (.12) |
Redemption fees added to paid in capital C, H | - | - | - | - | - |
Net asset value, end of period | $ 13.31 | $ 13.31 | $ 10.50 | $ 9.48 | $ 9.54 |
Total ReturnA, B | -% | 26.86% | 11.21% | .10% | 23.03% |
Ratios to Average Net Assets D, G | | | | | |
Expenses before reductions | 2.38% | 2.46% | 2.50% | 2.09% | 1.91% |
Expenses net of fee waivers, if any | 2.38% | 2.40% | 2.40% | 2.09% | 1.91% |
Expenses net of all reductions | 2.38% | 2.39% | 2.39% | 2.07% | 1.90% |
Net investment income (loss) | (.43)% | (.16)% | .10% | .68%F | (.01)% |
Supplemental Data | | | | | |
Net assets, end of period (000 omitted) | $ 744 | $ 1,410 | $ 1,966 | $ 2,293 | $ 2,902 |
Portfolio turnover rateE | 18% | 31% | 28% | 24% | 49% |
A Total returns would have been lower if certain expenses had not been reduced during the applicable periods shown.
B Total returns do not include the effect of the contingent deferred sales charge.
C Calculated based on average shares outstanding during the period.
D Fees and expenses of any underlying Fidelity Central Funds are not included in the Fund's expense ratio. The Fund indirectly bears its proportionate share of the expenses of any underlying Fidelity Central Funds.
E Amount does not include the portfolio activity of any underlying Fidelity Central Funds.
F Investment income per share reflects a large, non-recurring dividend which amounted to $.06 per share. Excluding this non-recurring dividend, the ratio of net investment income (loss) to average net assets would have been .05%.
G Expense ratios reflect operating expenses of the class. Expenses before reductions do not reflect amounts reimbursed by the investment adviser or reductions from brokerage service arrangements or reductions from other expense offset arrangements and do not represent the amount paid by the class during periods when reimbursements or reductions occur. Expenses net of fee waivers reflect expenses after reimbursement by the investment adviser but prior to reductions from brokerage service arrangements or other expense offset arrangements. Expenses net of all reductions represent the net expenses paid by the class.
H Amount represents less than $.01 per share.
I Total distributions of $.07 per share is comprised of distributions from net investment income of $.058 and distributions from net realized gain of $.015 per share.
See accompanying notes which are an integral part of the financial statements.
Annual Report
Financial Highlights - Class C
Years ended October 31, | 2014 | 2013 | 2012 | 2011 | 2010 |
Selected Per-Share Data | | | | | |
Net asset value, beginning of period | $ 13.28 | $ 10.48 | $ 9.47 | $ 9.53 | $ 7.86 |
Income from Investment Operations | | | | | |
Net investment income (loss) C | (.06) | (.02) | .01 | .07F | -H |
Net realized and unrealized gain (loss) | .06 | 2.84 | 1.04 | (.06) | 1.79 |
Total from investment operations | - | 2.82 | 1.05 | .01 | 1.79 |
Distributions from net investment income | - | (.01) | (.03) | (.06) | (.03) |
Distributions from net realized gain | (.05) | (.01) | (.01) | (.02) | (.09) |
Total distributions | (.05) | (.02) | (.04) | (.07) I | (.12) |
Redemption fees added to paid in capital C, H | - | - | - | - | - |
Net asset value, end of period | $ 13.23 | $ 13.28 | $ 10.48 | $ 9.47 | $ 9.53 |
Total ReturnA, B | .03% | 26.91% | 11.13% | .10% | 23.06% |
Ratios to Average Net Assets D, G | | | | | |
Expenses before reductions | 2.38% | 2.45% | 2.50% | 2.09% | 1.91% |
Expenses net of fee waivers, if any | 2.38% | 2.40% | 2.40% | 2.09% | 1.91% |
Expenses net of all reductions | 2.38% | 2.39% | 2.39% | 2.07% | 1.90% |
Net investment income (loss) | (.42)% | (.16)% | .10% | .68%F | (.01)% |
Supplemental Data | | | | | |
Net assets, end of period (000 omitted) | $ 8,438 | $ 8,070 | $ 6,608 | $ 6,900 | $ 8,936 |
Portfolio turnover rateE | 18% | 31% | 28% | 24% | 49% |
A Total returns would have been lower if certain expenses had not been reduced during the applicable periods shown.
B Total returns do not include the effect of the contingent deferred sales charge.
C Calculated based on average shares outstanding during the period.
D Fees and expenses of any underlying Fidelity Central Funds are not included in the Fund's expense ratio. The Fund indirectly bears its proportionate share of the expenses of any underlying Fidelity Central Funds.
E Amount does not include the portfolio activity of any underlying Fidelity Central Funds.
F Investment income per share reflects a large, non-recurring dividend which amounted to $.06 per share. Excluding this non-recurring dividend, the ratio of net investment income (loss) to average net assets would have been .05%.
G Expense ratios reflect operating expenses of the class. Expenses before reductions do not reflect amounts reimbursed by the investment adviser or reductions from brokerage service arrangements or reductions from other expense offset arrangements and do not represent the amount paid by the class during periods when reimbursements or reductions occur. Expenses net of fee waivers reflect expenses after reimbursement by the investment adviser but prior to reductions from brokerage service arrangements or other expense offset arrangements. Expenses net of all reductions represent the net expenses paid by the class.
H Amount represents less than $.01 per share.
I Total distributions of $.07 per share is comprised of distributions from net investment income of $.058 and distributions from net realized gain of $.015 per share.
See accompanying notes which are an integral part of the financial statements.
Annual Report
Financial Highlights - International Small Cap Opportunities
Years ended October 31, | 2014 | 2013 | 2012 | 2011 | 2010 |
Selected Per-Share Data | | | | | |
Net asset value, beginning of period | $ 13.82 | $ 10.88 | $ 9.85 | $ 9.92 | $ 8.14 |
Income from Investment Operations | | | | | |
Net investment income (loss) B | .09 | .10 | .11 | .17E | .09 |
Net realized and unrealized gain (loss) | .06 | 2.95 | 1.07 | (.06) | 1.87 |
Total from investment operations | .15 | 3.05 | 1.18 | .11 | 1.96 |
Distributions from net investment income | (.09) | (.10) | (.14) | (.14) | (.09) |
Distributions from net realized gain | (.08) | (.01) | (.01) | (.04) | (.09) |
Total distributions | (.17) | (.11) | (.15) | (.18) | (.18) |
Redemption fees added to paid in capital B, G | - | - | - | - | - |
Net asset value, end of period | $ 13.80 | $ 13.82 | $ 10.88 | $ 9.85 | $ 9.92 |
Total ReturnA | 1.11% | 28.24% | 12.21% | 1.10% | 24.43% |
Ratios to Average Net Assets C, F | | | | | |
Expenses before reductions | 1.30% | 1.39% | 1.47% | 1.08% | .91% |
Expenses net of fee waivers, if any | 1.30% | 1.39% | 1.40% | 1.08% | .91% |
Expenses net of all reductions | 1.30% | 1.38% | 1.39% | 1.06% | .89% |
Net investment income (loss) | .65% | .85% | 1.10% | 1.69%E | 1.00% |
Supplemental Data | | | | | |
Net assets, end of period (000 omitted) | $ 584,253 | $ 518,121 | $ 334,918 | $ 328,262 | $ 398,331 |
Portfolio turnover rateD | 18% | 31% | 28% | 24% | 49% |
A Total returns would have been lower if certain expenses had not been reduced during the applicable periods shown.
B Calculated based on average shares outstanding during the period.
C Fees and expenses of any underlying Fidelity Central Funds are not included in the Fund's expense ratio. The Fund indirectly bears its proportionate share of the expenses of any underlying Fidelity Central Funds.
D Amount does not include the portfolio activity of any underlying Fidelity Central Funds.
E Investment income per share reflects a large, non-recurring dividend which amounted to $.07 per share. Excluding this non-recurring dividend, the ratio of net investment income (loss) to average net assets would have been 1.06%.
F Expense ratios reflect operating expenses of the class. Expenses before reductions do not reflect amounts reimbursed by the investment adviser or reductions from brokerage service arrangements or reductions from other expense offset arrangements and do not represent the amount paid by the class during periods when reimbursements or reductions occur. Expenses net of fee waivers reflect expenses after reimbursement by the investment adviser but prior to reductions from brokerage service arrangements or other expense offset arrangements. Expenses net of all reductions represent the net expenses paid by the class.
G Amount represents less than $.01 per share.
See accompanying notes which are an integral part of the financial statements.
Annual Report
Financial Highlights - Institutional Class
Years ended October 31, | 2014 | 2013 | 2012 | 2011 | 2010 |
Selected Per-Share Data | | | | | |
Net asset value, beginning of period | $ 13.83 | $ 10.90 | $ 9.86 | $ 9.93 | $ 8.14 |
Income from Investment Operations | | | | | |
Net investment income (loss) B | .08 | .11 | .11 | .18E | .09 |
Net realized and unrealized gain (loss) | .07 | 2.93 | 1.08 | (.06) | 1.86 |
Total from investment operations | .15 | 3.04 | 1.19 | .12 | 1.95 |
Distributions from net investment income | (.09) | (.10) | (.14) | (.15) | (.07) |
Distributions from net realized gain | (.08) | (.01) | (.01) | (.04) | (.09) |
Total distributions | (.17) | (.11) | (.15) | (.19) | (.16) |
Redemption fees added to paid in capital B, G | - | - | - | - | - |
Net asset value, end of period | $ 13.81 | $ 13.83 | $ 10.90 | $ 9.86 | $ 9.93 |
Total ReturnA | 1.11% | 28.11% | 12.32% | 1.13% | 24.33% |
Ratios to Average Net Assets C, F | | | | | |
Expenses before reductions | 1.36% | 1.38% | 1.44% | 1.03% | .90% |
Expenses net of fee waivers, if any | 1.36% | 1.37% | 1.40% | 1.03% | .90% |
Expenses net of all reductions | 1.36% | 1.37% | 1.39% | 1.02% | .88% |
Net investment income (loss) | .60% | .87% | 1.10% | 1.74%E | 1.01% |
Supplemental Data | | | | | |
Net assets, end of period (000 omitted) | $ 29,822 | $ 5,670 | $ 4,591 | $ 1,395 | $ 2,418 |
Portfolio turnover rateD | 18% | 31% | 28% | 24% | 49% |
A Total returns would have been lower if certain expenses had not been reduced during the applicable periods shown.
B Calculated based on average shares outstanding during the period.
C Fees and expenses of any underlying Fidelity Central Funds are not included in the Fund's expense ratio. The Fund indirectly bears its proportionate share of the expenses of any underlying Fidelity Central Funds.
D Amount does not include the portfolio activity of any underlying Fidelity Central Funds.
E Investment income per share reflects a large, non-recurring dividend which amounted to $.07 per share. Excluding this non-recurring dividend, the ratio of net investment income (loss) to average net assets would have been 1.11%.
F Expense ratios reflect operating expenses of the class. Expenses before reductions do not reflect amounts reimbursed by the investment adviser or reductions from brokerage service arrangements or reductions from other expense offset arrangements and do not represent the amount paid by the class during periods when reimbursements or reductions occur. Expenses net of fee waivers reflect expenses after reimbursement by the investment adviser but prior to reductions from brokerage service arrangements or other expense offset arrangements. Expenses net of all reductions represent the net expenses paid by the class.
G Amount represents less than $.01 per share.
See accompanying notes which are an integral part of the financial statements.
Annual Report
Notes to Financial Statements
For the period ended October 31, 2014
1. Organization.
Fidelity International Small Cap Opportunities Fund (the Fund) is a fund of Fidelity Investment Trust (the Trust) and is authorized to issue an unlimited number of shares. The Trust is registered under the Investment Company Act of 1940, as amended (the 1940 Act), as an open-end management investment company organized as a Massachusetts business trust. The Fund offers Class A, Class T, Class C, International Small Cap Opportunities and Institutional Class shares, each of which, along with Class B shares, has equal rights as to assets and voting privileges. Class B shares are closed to new accounts and additional purchases, except for exchanges and reinvestments. Each class has exclusive voting rights with respect to matters that affect that class. Class B shares will automatically convert to Class A shares after a holding period of seven years from the initial date of purchase.
2. Investments in Fidelity Central Funds.
The Fund invests in Fidelity Central Funds, which are open-end investment companies generally available only to other investment companies and accounts managed by the investment adviser and its affiliates. The Fund's Schedule of Investments lists each of the Fidelity Central Funds held as of period end, if any, as an investment of the Fund, but does not include the underlying holdings of each Fidelity Central Fund. As an Investing Fund, the Fund indirectly bears its proportionate share of the expenses of the underlying Fidelity Central Funds.
The Money Market Central Funds seek preservation of capital and current income and are managed by Fidelity Investments Money Management, Inc. (FIMM), an affiliate of the investment adviser. Annualized expenses of the Money Market Central Funds as of their most recent shareholder report date are less than .01%.
A complete unaudited list of holdings for each Fidelity Central Fund is available upon request or at the Securities and Exchange Commission (the SEC) website at www.sec.gov. In addition, the financial statements of the Fidelity Central Funds, which are not covered by the Fund's Report of Independent Registered Public Accounting Firm, are available on the SEC website or upon request.
3. Significant Accounting Policies.
The financial statements have been prepared in conformity with accounting principles generally accepted in the United States of America (GAAP), which require management to make certain estimates and assumptions at the date of the financial statements. Actual results could differ from those estimates. Subsequent events, if any, through the date that the financial statements were issued have been evaluated in the preparation of
Annual Report
Notes to Financial Statements - continued
3. Significant Accounting Policies - continued
the financial statements. The following summarizes the significant accounting policies of the Fund:
Investment Valuation. Investments are valued as of 4:00 p.m. Eastern time on the last calendar day of the period. In accordance with valuation policies and procedures approved by the Board of Trustees (the Board), the Fund attempts to obtain prices from one or more third party pricing vendors or brokers to value its investments. When current market prices, quotations or currency exchange rates are not readily available or reliable, investments will be fair valued in good faith by the Fidelity Management & Research Company (FMR) Fair Value Committee (the Committee), in accordance with procedures adopted by the Board. Factors used in determining fair value vary by investment type and may include market or investment specific events. The frequency with which these procedures are used cannot be predicted and they may be utilized to a significant extent. The Committee oversees the Fund's valuation policies and procedures and is responsible for approving and reporting to the Board all fair value determinations.
The Fund categorizes the inputs to valuation techniques used to value its investments into a disclosure hierarchy consisting of three levels as shown below:
Level 1 - quoted prices in active markets for identical investments
Level 2 - other significant observable inputs (including quoted prices for similar investments, interest rates, prepayment speeds, etc.)
Level 3 - unobservable inputs (including the Fund's own assumptions based on the best information available)
Valuation techniques used to value the Fund's investments by major category are as follows:
Equity securities, including restricted securities, for which market quotations are readily available, are valued at the last reported sale price or official closing price as reported by a third party pricing vendor on the primary market or exchange on which they are traded and are categorized as Level 1 in the hierarchy. In the event there were no sales during the day or closing prices are not available, securities are valued at the last quoted bid price or may be valued using the last available price and are generally categorized as Level 2 in the hierarchy. For foreign equity securities, when market or security specific events arise, comparisons to the valuation of American Depositary Receipts (ADRs), futures contracts, Exchange-Traded Funds (ETFs) and certain indexes as well as quoted prices for similar securities may be used and would be categorized as Level 2 in the hierarchy. Utilizing these techniques may result in transfers between Level 1 and Level 2. For equity securities, including restricted securities, where observable inputs are
Annual Report
3. Significant Accounting Policies - continued
Investment Valuation - continued
limited, assumptions about market activity and risk are used and these securities may be categorized as Level 3 in the hierarchy.
The U.S. dollar value of foreign currency contracts is determined using currency exchange rates supplied by a pricing service and are categorized as Level 2 in the hierarchy. Investments in open-end mutual funds, including the Fidelity Central Funds, are valued at their closing net asset value (NAV) each business day and are categorized as Level 1 in the hierarchy.
Changes in valuation techniques may result in transfers in or out of an assigned level within the disclosure hierarchy. The aggregate value of investments by input level, as of October 31, 2014, including information on transfers between Levels 1 and 2 is included at the end of the Fund's Schedule of Investments.
Foreign Currency. The Fund may use foreign currency contracts to facilitate transactions in foreign-denominated securities. Gains and losses from these transactions may arise from changes in the value of the foreign currency or if the counterparties do not perform under the contracts' terms.
Foreign-denominated assets, including investment securities, and liabilities are translated into U.S. dollars at the exchange rates at period end. Purchases and sales of investment securities, income and dividends received and expenses denominated in foreign currencies are translated into U.S. dollars at the exchange rate in effect on the transaction date.
The effects of exchange rate fluctuations on investments are included with the net realized and unrealized gain (loss) on investment securities. Other foreign currency transactions resulting in realized and unrealized gain (loss) are disclosed separately.
Investment Transactions and Income. For financial reporting purposes, the Fund's investment holdings and NAV include trades executed through the end of the last business day of the period. The NAV per share for processing shareholder transactions is calculated as of the close of business of the New York Stock Exchange (NYSE), normally 4:00 p.m. Eastern time and includes trades executed through the end of the prior business day. Gains and losses on securities sold are determined on the basis of identified cost and may include proceeds received from litigation. Dividend income is recorded on the ex-dividend date, except for certain dividends from foreign securities where the ex-dividend date may have passed, which are recorded as soon as the Fund is informed of the ex-dividend date. Non-cash dividends included in dividend income, if any, are recorded at the fair market value of the securities received. Income and capital gain distributions from Fidelity Central Funds, if any, are recorded on the ex-dividend date.
Annual Report
Notes to Financial Statements - continued
3. Significant Accounting Policies - continued
Investment Transactions and Income - continued
Distributions received on securities that represent a return of capital or capital gain are recorded as a reduction of cost of investments and/or as a realized gain. Subsequent to ex-dividend date the Fund determines the components of these distributions, based upon receipt of tax filings or other correspondence relating to the underlying investment.
Class Allocations and Expenses. Investment income, realized and unrealized capital gains and losses, common expenses of the Fund, and certain fund-level expense reductions, if any, are allocated daily on a pro-rata basis to each class based on the relative net assets of each class to the total net assets of the Fund. Each class differs with respect to transfer agent and distribution and service plan fees incurred. Certain expense reductions may also differ by class. For the reporting period, the allocated portion of income and expenses to each class as a percent of its average net assets may vary due to the timing of recording these transactions in relation to fluctuating net assets of the classes. Expenses directly attributable to a fund are charged to that fund. Expenses attributable to more than one fund are allocated among the respective funds on the basis of relative net assets or other appropriate methods. Expense estimates are accrued in the period to which they relate and adjustments are made when actual amounts are known.
Income Tax Information and Distributions to Shareholders. Each year, the Fund intends to qualify as a regulated investment company under Subchapter M of the Internal Revenue Code, including distributing substantially all of its taxable income and realized gains. As a result, no provision for U.S. Federal income taxes is required. As of October 31, 2014, the Fund did not have any unrecognized tax benefits in the financial statements; nor is the Fund aware of any tax positions for which it is reasonably possible that the total amounts of unrecognized tax benefits will significantly change in the next twelve months. The Fund files a U.S. federal tax return, in addition to state and local tax returns as required. The Fund's federal income tax returns are subject to examination by the Internal Revenue Service (IRS) for a period of three fiscal years after they are filed. State and local tax returns may be subject to examination for an additional fiscal year depending on the jurisdiction. Foreign taxes are provided for based on the Fund's understanding of the tax rules and rates that exist in the foreign markets in which it invests.
Distributions are declared and recorded on the ex-dividend date. Income dividends and capital gain distributions are declared separately for each class. Income and capital gain distributions are determined in accordance with income tax regulations, which may differ from GAAP.
Capital accounts within the financial statements are adjusted for permanent book-tax differences. These adjustments have no impact on net assets or the results of operations.
Annual Report
3. Significant Accounting Policies - continued
Income Tax Information and Distributions to Shareholders - continued
Capital accounts are not adjusted for temporary book-tax differences which will reverse in a subsequent period.
Book-tax differences are primarily due to foreign currency transactions, partnerships, passive foreign investment companies (PFIC), capital loss carryforwards and losses deferred due to wash sales.
The federal tax cost of investment securities and unrealized appreciation (depreciation) as of period end were as follows:
Gross unrealized appreciation | $ 135,078,782 |
Gross unrealized depreciation | (26,037,635) |
Net unrealized appreciation (depreciation) on securities | $ 109,041,147 |
| |
Tax Cost | $ 548,219,679 |
The tax-based components of distributable earnings as of period end were as follows:
Undistributed ordinary income | $ 4,846,239 |
Capital loss carryforward | $ (284,273,262) |
Net unrealized appreciation (depreciation) on securities and other investments | $ 108,996,277 |
Capital loss carryforwards are only available to offset future capital gains of the Fund to the extent provided by regulations and may be limited. Under the Regulated Investment Company Modernization Act of 2010 (the Act), the Fund is permitted to carry forward capital losses incurred in taxable years beginning after December 22, 2010 for an unlimited period and such capital losses are required to be used prior to any losses that expire. The capital loss carryforward information presented below, including any applicable limitation, is estimated as of fiscal period end and is subject to adjustment.
Fiscal year of expiration | |
2017 | $ (284,273,262) |
The tax character of distributions paid was as follows:
| October 31, 2014 | October 31, 2013 |
Ordinary Income | $ 6,814,221 | $ 3,482,351 |
Annual Report
Notes to Financial Statements - continued
3. Significant Accounting Policies - continued
Short-Term Trading (Redemption) Fees. Shares held by investors in the Fund less than 90 days may have been subject to a redemption fee equal to 2.00% of the NAV of shares redeemed. All redemption fees, which reduce the proceeds of the shareholder redemption, are retained by the Fund and accounted for as an addition to paid in capital.
New Accounting Pronouncement. In June 2014, the Financial Accounting Standards Board issued Accounting Standard Update No. 2014-11, Repurchase-to-Maturity Transactions, Repurchase Financings, and Disclosures. The Update amends the accounting for certain repurchase agreements and expands disclosure requirements for reverse repurchase agreements, securities lending and other similar transactions. The disclosure requirements are effective for annual and interim reporting periods beginning after December 15, 2014. Management is currently evaluating the impact of the Update on the Fund's financial statements and related disclosures.
4. Purchases and Sales of Investments.
Purchases and sales of securities, other than short-term securities, aggregated $201,745,353 and $113,539,642, respectively.
5. Fees and Other Transactions with Affiliates.
Management Fee. Fidelity Management & Research Company (the investment adviser) and its affiliates provide the Fund with investment management related services for which the Fund pays a monthly management fee. The management fee is the sum of an individual fund fee rate that is based on an annual rate of .60% of the Fund's average net assets and an annualized group fee rate that averaged .25% during the period. The group fee rate is based upon the average net assets of all the mutual funds advised by the investment adviser, including any mutual funds previously advised by the investment adviser that are currently advised by Fidelity SelectCo, LLC, an affiliate of the investment adviser. The group fee rate decreases as assets under management increase and increases as assets under management decrease. In addition, the management fee is subject to a performance adjustment (up to a maximum of ± .20% of the Fund's average net assets over a 36 month performance period). The upward or downward adjustment to the management fee is based on the relative investment performance of International Small Cap Opportunities as compared to its benchmark index, the MSCI EAFE Small Cap Index, over the same 36 month performance period. For the reporting period, the total annual management fee rate, including the performance adjustment, was .98% of the Fund's average net assets. The performance adjustment included in the management fee rate may be higher or lower than the maximum performance adjustment rate due to the difference between the average net assets for the reporting and performance periods.
Annual Report
5. Fees and Other Transactions with Affiliates - continued
Distribution and Service Plan Fees. In accordance with Rule 12b-1 of the 1940 Act, the Fund has adopted separate Distribution and Service Plans for each class of shares, except for the Institutional Class. Certain classes pay Fidelity Distributors Corporation (FDC), an affiliate of the investment adviser, separate Distribution and Service Fees, each of which is based on an annual percentage of each class' average net assets. In addition, FDC may pay financial intermediaries for selling shares of the Fund and providing shareholder support services. For the period, the Distribution and Service Fee rates, total fees and amounts retained by FDC were as follows:
| Distribution
Fee | Service
Fee | Total Fees | Retained
by FDC |
Class A | -% | .25% | $ 61,505 | $ 1,091 |
Class T | .25% | .25% | 51,522 | 86 |
Class B | .75% | .25% | 10,529 | 7,921 |
Class C | .75% | .25% | 88,932 | 15,254 |
| | | $ 212,488 | $ 24,352 |
Sales Load. FDC may receive a front-end sales charge of up to 5.75% for selling Class A shares and 3.50% for selling Class T shares, some of which is paid to financial intermediaries for selling shares of the Fund. Depending on the holding period, FDC may receive contingent deferred sales charges levied on Class A, Class T, Class B, and Class C redemptions. The deferred sales charges range from 5.00% to 1.00% for Class B shares, 1.00% for Class C shares, 1.00% for certain purchases of Class A shares and .25% for certain purchases of Class T shares.
For the period, sales charge amounts retained by FDC were as follows:
| Retained
by FDC |
Class A | $ 8,923 |
Class T | 3,488 |
Class B* | 157 |
Class C* | 1,680 |
| $ 14,248 |
* When Class B and Class C shares are initially sold, FDC pays commissions from its own resources to financial intermediaries through which the sales are made.
Transfer Agent Fees. Fidelity Investments Institutional Operations Company, Inc., (FIIOC), an affiliate of the investment adviser, is the transfer, dividend disbursing and shareholder servicing agent for each class of the Fund. FIIOC receives account fees and asset-based fees that vary according to the account size and type of account of the shareholders of the respective classes of the Fund. FIIOC pays for typesetting, printing and mailing of shareholder reports, except proxy statements.
Annual Report
Notes to Financial Statements - continued
5. Fees and Other Transactions with Affiliates - continued
Transfer Agent Fees - continued
For the period, transfer agent fees for each class were as follows:
| Amount | % of
Class-Level Average
Net Assets |
Class A | $ 74,641 | .30 |
Class T | 32,188 | .31 |
Class B | 3,189 | .30 |
Class C | 27,039 | .30 |
International Small Cap Opportunities | 1,338,038 | .23 |
Institutional Class | 44,654 | .28 |
| $ 1,519,749 | |
Accounting and Security Lending Fees. Fidelity Service Company, Inc. (FSC), an affiliate of the investment adviser, maintains the Fund's accounting records. The accounting fee is based on the level of average net assets for each month. Under a separate contract, FSC administers the security lending program. The security lending fee is based on the number and duration of lending transactions.
Brokerage Commissions. The Fund placed a portion of its portfolio transactions with brokerage firms which are affiliates of the investment adviser. Brokerage commissions are included in net realized gain (loss) and change in net unrealized appreciation (depreciation) in the Statement of Operations. The commissions paid to these affiliated firms were $840 for the period.
Other. During the period, the investment adviser reimbursed the Fund for certain losses in the amount of $5,745.
6. Committed Line of Credit.
The Fund participates with other funds managed by the investment adviser or an affiliate in a $4.25 billion credit facility (the "line of credit") to be utilized for temporary or emergency purposes to fund shareholder redemptions or for other short-term liquidity purposes. The Fund has agreed to pay commitment fees on its pro-rata portion of the line of credit, which amounted to $1,022 and is reflected in Miscellaneous expenses on the Statement of Operations. During the period, the Fund did not borrow on this line of credit.
Annual Report
7. Security Lending.
The Fund lends portfolio securities through a lending agent from time to time in order to earn additional income. For equity securities, a lending agent is used and may loan securities to certain qualified borrowers, including Fidelity Capital Markets (FCM), a broker-dealer affiliated with the Fund. On the settlement date of the loan, the Fund receives collateral (in the form of U.S. Treasury obligations, letters of credit and/or cash) against the loaned securities and maintains collateral in an amount not less than 100% of the market value of the loaned securities during the period of the loan. The market value of the loaned securities is determined at the close of business of the Fund and any additional required collateral is delivered to the Fund on the next business day. If the borrower defaults on its obligation to return the securities loaned because of insolvency or other reasons, the Fund may apply collateral received from the borrower against the obligation. The Fund may experience delays and costs in recovering the securities loaned. Any cash collateral received is invested in the Fidelity Securities Lending Cash Central Fund. The value of loaned securities and cash collateral at period end are disclosed on the Fund's Statement of Assets and Liabilities. Security lending income represents the income earned on investing cash collateral, less rebates paid to borrowers and any lending agent fees associated with the loan, plus any premium payments received for lending certain types of securities. Security lending income is presented in the Statement of Operations as a component of income from Fidelity Central Funds. Total security lending income during the period amounted to $171,600. During the period, there were no securities loaned to FCM.
8. Expense Reductions.
Commissions paid to certain brokers with whom the investment adviser, or its affiliates, places trades on behalf of the Fund include an amount in addition to trade execution, which may be rebated back to the Fund to offset certain expenses. This amount totaled $329 for the period. In addition, through arrangements with the Fund's custodian, credits realized as a result of uninvested cash balances were used to reduce the Fund's expenses. During the period, these credits reduced the Fund's custody expenses by $192.
In addition, the investment adviser reimbursed a portion of the Fund's operating expenses during the period in the amount of $3,884.
Annual Report
Notes to Financial Statements - continued
9. Distributions to Shareholders.
Distributions to shareholders of each class were as follows:
Years ended October 31, | 2014 | 2013 |
From net investment income | | |
Class A | $ 88,584 | $ 127,604 |
Class T | 17,038 | 40,329 |
Class B | - | 540 |
Class C | - | 6,860 |
International Small Cap Opportunities | 3,435,414 | 3,098,688 |
Institutional Class | 39,565 | 37,075 |
Total | $ 3,580,601 | $ 3,311,096 |
Years ended October 31, | | |
From net realized gain | | |
Class A | $ 127,238 | $ 8,286 |
Class T | 56,084 | 3,734 |
Class B | - | 900 |
Class C | 33,933 | 3,118 |
International Small Cap Opportunities | 2,982,391 | 153,400 |
Institutional Class | 33,974 | 1,817 |
Total | $ 3,233,620 | $ 171,255 |
10. Share Transactions.
Share transactions for each class were as follows and may contain automatic conversions between classes or exchanges between funds:
| Shares | Dollars |
Years ended October 31, | 2014 | 2013 | 2014 | 2013 |
Class A | | | | |
Shares sold | 589,478 | 373,515 | $ 8,266,636 | $ 4,517,568 |
Reinvestment of distributions | 14,226 | 10,878 | 191,200 | 119,442 |
Shares redeemed | (381,134) | (460,010) | (5,353,937) | (5,504,745) |
Net increase (decrease) | 222,570 | (75,617) | $ 3,103,899 | $ (867,735) |
Class T | | | | |
Shares sold | 159,216 | 94,833 | $ 2,266,530 | $ 1,133,727 |
Reinvestment of distributions | 5,309 | 3,872 | 70,882 | 42,245 |
Shares redeemed | (142,062) | (152,245) | (1,989,964) | (1,813,542) |
Net increase (decrease) | 22,463 | (53,540) | $ 347,448 | $ (637,570) |
Annual Report
10. Share Transactions - continued
| Shares | Dollars |
Years ended October 31, | 2014 | 2013 | 2014 | 2013 |
Class B | | | | |
Shares sold | 1,461 | 2,465 | $ 20,212 | $ 28,055 |
Reinvestment of distributions | - | 123 | - | 1,326 |
Shares redeemed | (51,497) | (83,897) | (706,187) | (970,172) |
Net increase (decrease) | (50,036) | (81,309) | $ (685,975) | $ (940,791) |
Class C | | | | |
Shares sold | 200,445 | 106,942 | $ 2,745,030 | $ 1,277,851 |
Reinvestment of distributions | 2,336 | 870 | 30,621 | 9,335 |
Shares redeemed | (172,604) | (130,535) | (2,374,401) | (1,517,604) |
Net increase (decrease) | 30,177 | (22,723) | $ 401,250 | $ (230,418) |
International Small Cap Opportunities | | | | |
Shares sold | 13,421,171 | 13,306,080 | $ 191,269,160 | $ 163,920,015 |
Reinvestment of distributions | 360,554 | 279,367 | 4,881,895 | 3,092,593 |
Shares redeemed | (8,930,544) | (6,858,430) | (127,222,877) | (83,019,406) |
Net increase (decrease) | 4,851,181 | 6,727,017 | $ 68,928,178 | $ 83,993,202 |
Institutional Class | | | | |
Shares sold | 2,469,158 | 107,232 | $ 34,766,175 | $ 1,308,852 |
Reinvestment of distributions | 4,980 | 3,187 | 67,530 | 35,307 |
Shares redeemed | (724,026) | (121,854) | (9,726,800) | (1,389,261) |
Net increase (decrease) | 1,750,112 | (11,435) | $ 25,106,905 | $ (45,102) |
11. Other.
The Fund's organizational documents provide former and current trustees and officers with a limited indemnification against liabilities arising in connection with the performance of their duties to the Fund. In the normal course of business, the Fund may also enter into contracts that provide general indemnifications. The Fund's maximum exposure under these arrangements is unknown as this would be dependent on future claims that may be made against the Fund. The risk of material loss from such claims is considered remote.
Annual Report
To the Trustees of Fidelity Investment Trust and Shareholders of Fidelity International Small Cap Opportunities Fund:
We have audited the accompanying statement of assets and liabilities of Fidelity International Small Cap Opportunities Fund (the Fund), a fund of Fidelity Investment Trust, including the schedule of investments, as of October 31, 2014, and the related statement of operations for the year then ended, the statement of changes in net assets for each of the two years in the period then ended, and the financial highlights for each of the five years in the period then ended. These financial statements and financial highlights are the responsibility of the Fund's management. Our responsibility is to express an opinion on these financial statements and financial highlights based on our audits.
We conducted our audits in accordance with the standards of the Public Company Accounting Oversight Board (United States). Those standards require that we plan and perform the audit to obtain reasonable assurance about whether the financial statements and financial highlights are free of material misstatement. The Fund is not required to have, nor were we engaged to perform, an audit of its internal control over financial reporting. Our audits included consideration of internal control over financial reporting as a basis for designing audit procedures that are appropriate in the circumstances, but not for the purpose of expressing an opinion on the effectiveness of the Fund's internal control over financial reporting. Accordingly, we express no such opinion. An audit also includes examining, on a test basis, evidence supporting the amounts and disclosures in the financial statements, assessing the accounting principles used and significant estimates made by management, as well as evaluating the overall financial statement presentation. Our procedures included confirmation of securities owned as of October 31, 2014, by correspondence with the custodians and brokers; where replies were not received from brokers, we performed other auditing procedures. We believe that our audits provide a reasonable basis for our opinion.
In our opinion, the financial statements and financial highlights referred to above present fairly, in all material respects, the financial position of Fidelity International Small Cap Opportunities Fund as of October 31, 2014, the results of its operations for the year then ended, the changes in its net assets for each of the two years in the period then ended, and the financial highlights for each of the five years in the period then ended, in conformity with accounting principles generally accepted in the United States of America.
DELOITTE & TOUCHE LLP
Boston, Massachusetts
December 16, 2014
Annual Report
The Trustees, Member of the Advisory Board, and officers of the trust and fund, as applicable, are listed below. The Board of Trustees governs the fund and is responsible for protecting the interests of shareholders. The Trustees are experienced executives who meet periodically throughout the year to oversee the fund's activities, review contractual arrangements with companies that provide services to the fund, oversee management of the risks associated with such activities and contractual arrangements, and review the fund's performance. Except for James C. Curvey, each of the Trustees oversees 174 funds. Mr. Curvey oversees 407 funds.
The Trustees hold office without limit in time except that (a) any Trustee may resign; (b) any Trustee may be removed by written instrument, signed by at least two-thirds of the number of Trustees prior to such removal; (c) any Trustee who requests to be retired or who has become incapacitated by illness or injury may be retired by written instrument signed by a majority of the other Trustees; and (d) any Trustee may be removed at any special meeting of shareholders by a two-thirds vote of the outstanding voting securities of the trust. Each Trustee who is not an interested person (as defined in the 1940 Act) of the trust and the fund (Independent Trustee), shall retire not later than the last day of the calendar year in which his or her 75th birthday occurs. The Independent Trustees may waive this mandatory retirement age policy with respect to individual Trustees. The officers and Advisory Board Member hold office without limit in time, except that any officer and Advisory Board Member may resign or may be removed by a vote of a majority of the Trustees at any regular meeting or any special meeting of the Trustees. Except as indicated, each individual has held the office shown or other offices in the same company for the past five years.
Experience, Skills, Attributes, and Qualifications of the Fund's Trustees. The Governance and Nominating Committee has adopted a statement of policy that describes the experience, qualifications, attributes, and skills that are necessary and desirable for potential Independent Trustee candidates (Statement of Policy). The Board believes that each Trustee satisfied at the time he or she was initially elected or appointed a Trustee, and continues to satisfy, the standards contemplated by the Statement of Policy. The Governance and Nominating Committee also engages professional search firms to help identify potential Independent Trustee candidates who have the experience, qualifications, attributes, and skills consistent with the Statement of Policy. From time to time, additional criteria based on the composition and skills of the current Independent Trustees, as well as experience or skills that may be appropriate in light of future changes to board composition, business conditions, and regulatory or other developments, have also been considered by the professional search firms and the Governance and Nominating Committee. In addition, the Board takes into account the Trustees' commitment and participation in Board and committee meetings, as well as their leadership of standing and ad hoc committees throughout their tenure.
In determining that a particular Trustee was and continues to be qualified to serve as a Trustee, the Board has considered a variety of criteria, none of which, in isolation, was controlling. The Board believes that, collectively, the Trustees have balanced and diverse experience, qualifications, attributes, and skills, which allow the Board to operate effectively in governing the fund and protecting the interests of shareholders. Information about the specific experience, skills, attributes, and qualifications of each Trustee, which in each case led to the Board's conclusion that the Trustee should serve (or continue to serve) as a trustee of the fund, is provided below.
Annual Report
Board Structure and Oversight Function. James C. Curvey is an interested person (as defined in the 1940 Act) and currently serves as Chairman. The Trustees have determined that an interested Chairman is appropriate and benefits shareholders because an interested Chairman has a personal and professional stake in the quality and continuity of services provided to the fund. Independent Trustees exercise their informed business judgment to appoint an individual of their choosing to serve as Chairman, regardless of whether the Trustee happens to be independent or a member of management. The Independent Trustees have determined that they can act independently and effectively without having an Independent Trustee serve as Chairman and that a key structural component for assuring that they are in a position to do so is for the Independent Trustees to constitute a substantial majority for the Board. The Independent Trustees also regularly meet in executive session. Ned C. Lautenbach serves as Chairman of the Independent Trustees and as such (i) acts as a liaison between the Independent Trustees and management with respect to matters important to the Independent Trustees and (ii) with management prepares agendas for Board meetings.
Fidelity funds are overseen by different Boards of Trustees. The fund's Board oversees Fidelity's equity and high income funds and another Board oversees Fidelity's investment-grade bond, money market, and asset allocation funds. The asset allocation funds may invest in Fidelity funds overseen by the fund's Board. The use of separate Boards, each with its own committee structure, allows the Trustees of each group of Fidelity funds to focus on the unique issues of the funds they oversee, including common research, investment, and operational issues. On occasion, the separate Boards establish joint committees to address issues of overlapping consequences for the Fidelity funds overseen by each Board.
The Trustees operate using a system of committees to facilitate the timely and efficient consideration of all matters of importance to the Trustees, the fund, and fund shareholders and to facilitate compliance with legal and regulatory requirements and oversight of the fund's activities and associated risks. The Board, acting through its committees, has charged FMR and its affiliates with (i) identifying events or circumstances the occurrence of which could have demonstrably adverse effects on the fund's business and/or reputation; (ii) implementing processes and controls to lessen the possibility that such events or circumstances occur or to mitigate the effects of such events or circumstances if they do occur; and (iii) creating and maintaining a system designed to evaluate continuously business and market conditions in order to facilitate the identification and implementation processes described in (i) and (ii) above. Because the day-to-day operations and activities of the fund are carried out by or through FMR, its affiliates and other service providers, the fund's exposure to risks is mitigated but not eliminated by the processes overseen by the Trustees. While each of the Board's committees has responsibility for overseeing different aspects of the fund's activities, oversight is exercised primarily through the Operations, Audit, and Compliance Committees. In addition, the Independent Trustees have worked with FMR to enhance the Board's oversight of investment and financial risks, legal and regulatory risks, technology risks, and operational risks, including the development of additional risk reporting to the Board. For example, a working group comprised of Independent Trustees and FMR has worked and continues to work to review the Fidelity funds' valuation-related activities, reporting and risk management. Appropriate personnel, including but not limited to the fund's Chief Compliance Officer (CCO), FMR's internal auditor, the independent accountants, the fund's Treasurer and portfolio management personnel, make periodic reports to the Board's committees, as appropriate, including an annual review of FMR's risk management program for the Fidelity funds. The responsibilities of each standing committee, including their oversight responsibilities, are described further under "Standing Committees of the Fund's Trustees."
Annual Report
Trustees and Officers - continued
The fund's Statement of Additional Information (SAI) includesmore information about the Trustees. To request a free copy, call Fidelity at 1-800-544-8544.
Interested Trustees*:
Correspondence intended for each Trustee who is an interested person may be sent to Fidelity Investments, 245 Summer Street, Boston, Massachusetts 02210.
Name, Year of Birth; Principal Occupations and Other Relevant Experience+ |
James C. Curvey (1935) |
Year of Election or Appointment: 2007 Trustee Chairman of the Board of Trustees |
| Mr. Curvey also serves as Trustee of other Fidelity funds. Mr. Curvey is a Director of Fidelity Research & Analysis Co. (2009-present), and Vice Chairman (2007-present) and Director of FMR LLC. In addition, Mr. Curvey serves as an Overseer for the Boston Symphony Orchestra and a member of the board of Artis-Naples, Naples, Florida, and as a Trustee for Brewster Academy, Wolfeboro, New Hampshire. Previously, Mr. Curvey served as a Director of Fidelity Investments Money Management, Inc. (2009-2014), a Director of FMR (2007-2014), and a Director of FMR Co., Inc. (2007-2014). |
Charles S. Morrison (1960) |
Year of Election or Appointment: 2014 Trustee |
| Mr. Morrison also serves as Trustee of other funds. He serves as a Director of Fidelity Investments Money Management, Inc. (FIMM) (2014-present), Director of Fidelity SelectCo, LLC (2014-present), President, Asset Management (2014-present) and is an employee of Fidelity Investments. Previously, Mr. Morrison served as Vice President of Fidelity's Fixed Income and Asset Allocation Funds (2012-2014), President, Fixed Income (2011-2014), Vice President of Fidelity's Money Market Funds (2005-2009), President, Money Market Group Leader of FMR (2009), and Senior Vice President, Money Market Group of FMR (2004-2009). Mr. Morrison also served as Vice President of Fidelity's Bond Funds (2002-2005), certain Balanced Funds (2002-2005), and certain Asset Allocation Funds (2002-2007), and as Senior Vice President (2002-2005) of Fidelity's Bond Division. |
* Trustees have been determined to be "Interested Trustees" by virtue of, among other things, their affiliation with the trust or various entities under common control with FMR.
+ The information above includes each Trustee's principal occupation during the last five years and other information relating to the experience, attributes, and skills relevant to each Trustee's qualifications to serve as a Trustee, which led to the conclusion that each Trustee should serve as a Trustee for the fund.
Annual Report
Trustees and Officers - continued
Independent Trustees:
Correspondence intended for each Independent Trustee (that is, the Trustees other than the Interested Trustees) may be sent to Fidelity Investments, P.O. Box 55235, Boston, Massachusetts 02205-5235.
Name, Year of Birth; Principal Occupations and Other Relevant Experience+ |
Dennis J. Dirks (1948) |
Year of Election or Appointment: 2005 Trustee |
| Mr. Dirks also serves as Trustee of other Fidelity funds. Prior to his retirement in May 2003, Mr. Dirks was Chief Operating Officer and a member of the Board of The Depository Trust & Clearing Corporation (DTCC). He also served as President, Chief Operating Officer, and Board member of The Depository Trust Company (DTC) and President and Board member of the National Securities Clearing Corporation (NSCC). In addition, Mr. Dirks served as Chief Executive Officer and Board member of the Government Securities Clearing Corporation, Chief Executive Officer and Board member of the Mortgage-Backed Securities Clearing Corporation, as a Trustee and a member of the Finance Committee of Manhattan College (2005-2008), and as a Trustee and a member of the Finance Committee of AHRC of Nassau County (2006-2008). Mr. Dirks is a member of the Independent Directors Council (IDC) Governing Council (2010-present) and Board of Directors for The Brookville Center for Children's Services, Inc. (2009-present). |
Alan J. Lacy (1953) |
Year of Election or Appointment: 2008 Trustee |
| Mr. Lacy also serves as Trustee of other Fidelity funds. Mr. Lacy serves as Senior Adviser (2007-present) of Oak Hill Capital Partners, L.P. (private equity). Mr. Lacy also served as Chief Executive Officer (2000-2005) and Vice Chairman (2005-2006) of Sears Holdings Corporation and Sears, Roebuck and Co. (retail). In addition, Mr. Lacy serves as a member of the Board of Directors of Dave & Buster's Entertainment, Inc. (restaurant and entertainment complexes, 2010-present), Earth Fare, Inc. (retail grocery, 2012-present), The Hillman Companies, Inc. (hardware wholesalers, 2010-present), and Bristol-Myers Squibb Company (global pharmaceuticals, 2008-present). Mr. Lacy is a member of the Board of Trustees of The National Parks Conservation Association (2006-present). Previously, Mr. Lacy served as Chairman of the Board of Trustees of the National Parks Conservation Association (2008-2011) and as a member of the Board of Directors for the Western Union Company (global money transfer, 2006-2011). |
Ned C. Lautenbach (1944) |
Year of Election or Appointment: 2000 Trustee Chairman of the Independent Trustees |
| Mr. Lautenbach also serves as Trustee of other Fidelity funds. Mr. Lautenbach currently serves as the Lead Director of the Eaton Corporation Board of Directors (diversified industrial, 1997-present). Mr. Lautenbach is Chairman of the Board of Directors of the Philharmonic Center for the Arts in Naples, Florida (2012-present) and a member of the Council on Foreign Relations (1994-present). Previously, Mr. Lautenbach was a Partner/Advisory Partner at Clayton, Dubilier & Rice, LLC (private equity investment, 1998-2010), as well as a Director of Sony Corporation (2006-2007). |
Joseph Mauriello (1944) |
Year of Election or Appointment: 2008 Trustee |
| Mr. Mauriello also serves as Trustee of other Fidelity funds. Prior to his retirement in January 2006, Mr. Mauriello served in numerous senior management positions including Deputy Chairman and Chief Operating Officer (2004-2005), and Vice Chairman of Financial Services (2002-2004) of KPMG LLP US (professional services, 1965-2005). Mr. Mauriello currently serves as a member of the Board of Directors of XL Group plc. (global insurance and re-insurance, 2006-present). Previously, Mr. Mauriello served as a Director of the Hamilton Funds of the Bank of New York (2006-2007) and of Arcadia Resources Inc. (health care services and products, 2007-2012). |
Robert W. Selander (1950) |
Year of Election or Appointment: 2011 Trustee |
| Mr. Selander also serves as Trustee of other Fidelity funds. Previously, Mr. Selander served as a Member of the Advisory Board of other Fidelity funds (2011), and Executive Vice Chairman (2010), Chief Executive Officer (2009-2010), and President and Chief Executive Officer (1997-2009) of Mastercard, Inc. |
Cornelia M. Small (1944) |
Year of Election or Appointment: 2005 Trustee |
| Ms. Small also serves as Trustee of other Fidelity funds. Ms. Small is a member of the Board of Directors (2009-present) and Chair of the Investment Committee (2010-present) of the Teagle Foundation. Ms. Small also serves on the Investment Committee of the Berkshire Taconic Community Foundation (2008-present). Previously, Ms. Small served as Chairperson (2002-2008) and a member of the Investment Committee and Chairperson (2008-2012) and a member of the Board of Trustees of Smith College. In addition, Ms. Small served as Chief Investment Officer, Director of Global Equity Investments, and a member of the Board of Directors of Scudder, Stevens & Clark and Scudder Kemper Investments. |
William S. Stavropoulos (1939) |
Year of Election or Appointment: 2001 Trustee Vice Chairman of the Independent Trustees |
| Mr. Stavropoulos also serves as Trustee of other Fidelity funds. Mr. Stavropoulos serves as President and Founder of the Michigan Baseball Foundation, the Great Lakes Loons (2007-present). Mr. Stavropoulos is Chairman Emeritus of the Board of Directors of The Dow Chemical Company, where he previously served in numerous senior management positions, including President, CEO (1995-2000; 2002-2004), Chairman of the Executive Committee (2000-2006), and as a member of the Board of Directors (1990-2006). Currently, Mr. Stavropoulos is Chairman of the Board of Directors of Univar Inc. (global distributor of commodity and specialty chemicals), a Director of Teradata Corporation (data warehousing and technology solutions), and Maersk Inc. (industrial conglomerate), and a member of the Advisory Board for Metalmark Capital LLC (private equity investment, 2005-present). Mr. Stavropoulos is an operating advisor to Clayton, Dubilier & Rice, LLC (private equity investment). In addition, Mr. Stavropoulos is a member of the University of Notre Dame Advisory Council for the College of Science, a Trustee of the Rollin L. Gerstacker Foundation, and a Director of the Naples Philharmonic Center for the Arts. Previously, Mr. Stavropoulos served as a Director of Chemical Financial Corporation (bank holding company, 1993-2012) and Tyco International, Ltd. (multinational manufacturing and services, 2007-2012). |
David M. Thomas (1949) |
Year of Election or Appointment: 2008 Trustee |
| Mr. Thomas also serves as Trustee of other Fidelity funds. Mr. Thomas serves as Non-Executive Chairman of the Board of Directors of Fortune Brands Home and Security (home and security products, 2011-present), and as a member of the Board of Directors of Interpublic Group of Companies, Inc. (marketing communication, 2004-present). Previously, Mr. Thomas served as Executive Chairman (2005-2006) and Chairman and Chief Executive Officer (2000-2005) of IMS Health, Inc. (pharmaceutical and healthcare information solutions), and a Director of Fortune Brands, Inc. (consumer products, 2000-2011). |
+ The information above includes each Trustee's principal occupation during the last five years and other information relating to the experience, attributes, and skills relevant to each Trustee's qualifications to serve as a Trustee, which led to the conclusion that each Trustee should serve as a Trustee for the fund.
Advisory Board Member and Officers:
Correspondence intended for each officer and Peter S. Lynch may be sent to Fidelity Investments, 245 Summer Street, Boston, Massachusetts 02210. Officers appear below in alphabetical order.
Name, Year of Birth; Principal Occupation |
Peter S. Lynch (1944) |
Year of Election or Appointment: 2003 Member of the Advisory Board |
| Mr. Lynch also serves as Member of the Advisory Board of other Fidelity funds. Mr. Lynch is Vice Chairman and a Director of FMR and FMR Co., Inc. In addition, Mr. Lynch serves as a Trustee of Boston College and as the Chairman of the Inner-City Scholarship Fund. Previously, Mr. Lynch served on the Special Olympics International Board of Directors (1997-2006). |
Elizabeth Paige Baumann (1968) |
Year of Election or Appointment: 2012 Anti-Money Laundering (AML) Officer |
| Ms. Baumann also serves as AML Officer of other funds. She is Chief AML Officer of FMR LLC (2012-present) and is an employee of Fidelity Investments. Previously, Ms. Baumann served as Vice President and Deputy Anti-Money Laundering Officer (2007-2012). |
William C. Coffey (1969) |
Year of Election or Appointment: 2009 Assistant Secretary |
| Mr. Coffey also serves as Assistant Secretary of other funds. He is Senior Vice President and Deputy General Counsel of FMR LLC (2010-present), and is an employee of Fidelity Investments. Previously, Mr. Coffey served as Vice President and Associate General Counsel of FMR LLC (2005-2009). |
Timothy M. Cohen (1969) |
Year of Election or Appointment: 2014 Vice President of certain Equity Funds |
| Mr. Cohen also serves as Vice President of other funds. Mr. Cohen serves as a Director and Chief Compliance Officer of Fidelity Management & Research (U.K.) Inc. (2013-present) and is an employee of Fidelity Investments. |
Jonathan Davis (1968) |
Year of Election or Appointment: 2010 Assistant Treasurer |
| Mr. Davis also serves as Assistant Treasurer of other funds. Mr. Davis is an employee of Fidelity Investments. Previously, Mr. Davis served as Vice President and Associate General Counsel of FMR LLC (2003-2010). |
Adrien E. Deberghes (1967) |
Year of Election or Appointment: 2008 Deputy Treasurer |
| Mr. Deberghes also serves as an officer of other funds. He is an employee of Fidelity Investments (2008-present). Prior to joining Fidelity Investments, Mr. Deberghes was Senior Vice President of Mutual Fund Administration at State Street Corporation (2007-2008), Senior Director of Mutual Fund Administration at Investors Bank & Trust (2005-2007), and Director of Finance for Dunkin' Brands (2000-2005). |
Stephanie J. Dorsey (1969) |
Year of Election or Appointment: 2010 Assistant Treasurer |
| Ms. Dorsey also serves as an officer of other funds. She is an employee of Fidelity Investments (2008-present) and has served in other fund officer roles. Prior to joining Fidelity Investments, Ms. Dorsey served as Treasurer (2004-2008) of the JPMorgan Mutual Funds and Vice President (2004-2008) of JPMorgan Chase Bank. |
Howard J. Galligan III (1966) |
Year of Election or Appointment: 2014 Chief Financial Officer |
| Mr. Galligan also serves as Chief Financial Officer of other funds. Mr. Galligan serves as President of Fidelity Pricing and Cash Management Services (FPCMS) (2014-present) and as a Director of Strategic Advisers, Inc. (2008-present). Previously, Mr. Galligan served as Chief Administrative Officer of Asset Management (2011-2014) and Chief Operating Officer and Senior Vice President of Investment Support for Strategic Advisers, Inc. (2003-2011). |
Scott C. Goebel (1968) |
Year of Election or Appointment: 2008 Secretary and Chief Legal Officer (CLO) |
| Mr. Goebel serves as Secretary and CLO of other funds. Mr. Goebel also serves as Secretary of Fidelity SelectCo, LLC (2013-present), Fidelity Investments Money Management, Inc. (FIMM) (2010-present) and Fidelity Research and Analysis Company (FRAC) (2010-present); General Counsel, Secretary, and Senior Vice President of FMR (2008-present) and FMR Co., Inc. (2008-present); Chief Legal Officer of Fidelity Management & Research (Hong Kong) Limited (2008-present); and Assistant Secretary of Fidelity Management & Research (Japan) Limited (2008-present) and Fidelity Management & Research (U.K.) Inc. (2008-present). Previously, Mr. Goebel served as Secretary and CLO of other Fidelity funds (2008-2013), Assistant Secretary of FIMM (2008-2010), FRAC (2008-2010), and certain funds (2007-2008); and as Vice President and Secretary of Fidelity Distributors Corporation (FDC) (2005-2007). Mr. Goebel has been employed by FMR LLC or an affiliate since 2001. |
Brian B. Hogan (1964) |
Year of Election or Appointment: 2009 Vice President |
| Mr. Hogan also serves as Trustee or Vice President of other funds. Mr. Hogan serves as a Director of Fidelity SelectCo, LLC (2014-present) and President of FMR's Equity Division (2009-present). Previously, Mr. Hogan served as Senior Vice President, Equity Research of FMR (2006-2009) and as a portfolio manager. |
Chris Maher (1972) |
Year of Election or Appointment: 2013 Assistant Treasurer |
| Mr. Maher serves as Assistant Treasurer of other funds. Mr. Maher is Vice President of Valuation Oversight and is an employee of Fidelity Investments. Previously, Mr. Maher served as Vice President of Asset Management Compliance (2013), Vice President of FMR's Program Management Group (2010-2013), and Vice President of Valuation Oversight (2008-2010). |
Kenneth B. Robins (1969) |
Year of Election or Appointment: 2008 President and Treasurer |
| Mr. Robins also serves as an officer of other funds. Mr. Robins serves as Executive Vice President of Fidelity Investments Money Management, Inc. (FIMM) (2013-present) and is an employee of Fidelity Investments (2004-present). Previously, Mr. Robins served in other fund officer roles. |
Stephen Sadoski (1971) |
Year of Election or Appointment: 2012 Deputy Treasurer |
| Mr. Sadoski also serves as Deputy Treasurer of other funds. He is an employee of Fidelity Investments (2012-present) and has served in another fund officer role. Prior to joining Fidelity Investments, Mr. Sadoski served as an assistant chief accountant in the Division of Investment Management of the Securities and Exchange Commission (SEC) (2009-2012) and as a senior manager at Deloitte & Touche LLP (1997-2009). |
Stacie M. Smith (1974) |
Year of Election or Appointment: 2013 Deputy Treasurer |
| Ms. Smith also serves as an officer of other funds. She is an employee of Fidelity Investments (2009-present) and has served in other fund officer roles. Prior to joining Fidelity Investments, Ms. Smith served as Senior Audit Manager of Ernst & Young LLP (1996-2009). |
Renee Stagnone (1975) |
Year of Election or Appointment: 2013 Deputy Treasurer |
| Ms. Stagnone also serves as Deputy Treasurer of other funds. Ms. Stagnone is an employee of Fidelity Investments. |
Linda J. Wondrack (1964) |
Year of Election or Appointment: 2014 Chief Compliance Officer |
| Ms. Wondrack also serves as Chief Compliance Officer of other funds. Ms. Wondrack is Executive Vice President and head of the Ethics Office and Asset Management Compliance for Fidelity Investments (2012-present). Ms. Wondrack also serves as Chief Compliance Officer of Fidelity SelectCo, LLC (2014-present); Chief Compliance Officer of Impresa Management LLC (2013-present); and Chief Compliance Officer of FMR Co., Inc., Fidelity Investments Money Management, Inc., Fidelity Management & Research (Japan) Limited, Fidelity Management & Research (U.K.) Inc., Fidelity Management & Research (Hong Kong), Fidelity Management & Research Company, Pyramis Global Advisors, LLC, and Strategic Advisers, Inc., Ballyrock Investment Advisors LLC, and Northern Neck Investors LLC (2012-present). Previously, Ms. Wondrack served as Senior Vice President and Chief Compliance Officer for Columbia Management Investment Advisers, LLC (2005-2012); Chief Compliance Officer for certain funds within the Columbia Family of Funds (2007-2012); and Senior Vice President of Compliance Risk Management at Bank of America (2005-2010). |
Joseph F. Zambello (1957) |
Year of Election or Appointment: 2011 Deputy Treasurer |
| Mr. Zambello also serves as Deputy Treasurer of other funds. Mr. Zambello is an employee of Fidelity Investments. Previously, Mr. Zambello served as Vice President of FMR's Program Management Group (2009-2011) and Vice President of the Transfer Agent Oversight Group (2005-2009). |
Annual Report
The Board of Trustees of International Small Cap Opportunities Fund voted to pay to shareholders of record at the opening of business on record date, the following distributions per share derived from capital gains realized from sales of portfolio securities, and dividends derived from net investment income:
| Pay Date | Record Date | Dividends | Capital Gains |
International Small Cap Opportunities | 12/08/14 | 12/05/14 | $0.090 | $0.021 |
International Small Cap Opportunities designates 6% of the dividends distributed in December 2013 during the fiscal year as qualifying for the dividends-received deduction for corporate shareholders.
International Small Cap Opportunities designates 100% of the dividends distributed in December 2013 during the fiscal year as amounts which may be taken into account as a dividends for purposes of the maximum rate under section 1(h) (11) of the Internal Revenue Code.
The amounts per share which represent income derived from sources within, and taxes paid to, foreign countries or possessions of the United States are as follows:
| Pay Date | Income | Taxes |
International Small Cap Opportunities | 12/09/2013 | $0.1053 | $0.0152 |
The fund will notify shareholders in January 2015 of amounts for use in preparing 2014 income tax returns.
Annual Report
Board Approval of Investment Advisory Contracts and Management Fees
Fidelity International Small Cap Opportunities Fund
Each year, the Board of Trustees, including the Independent Trustees (together, the Board), votes on the renewal of the management contract with Fidelity Management & Research Company (FMR) and the sub-advisory agreements (together, the Advisory Contracts) for the fund. The Board, assisted by the advice of fund counsel and Independent Trustees' counsel, requests and considers a broad range of information relevant to the renewal of the Advisory Contracts throughout the year.
The Board meets regularly and, at each of its meetings, covers an extensive agenda of topics and materials and considers factors that are relevant to its annual consideration of the renewal of the fund's Advisory Contracts, including the services and support provided to the fund and its shareholders. The Board has established various standing committees (Committees), each composed of and chaired by Independent Trustees with varying backgrounds, to which the Board has assigned specific subject matter responsibilities in order to enhance effective decision-making by the Board. The Board, acting directly and through its Committees, requests and receives information concerning the annual consideration of the renewal of the fund's Advisory Contracts. The Board also meets as needed to consider matters specifically related to the Board's annual consideration of the renewal of the Advisory Contracts. Members of the Board may also meet with trustees of other Fidelity funds through ad hoc joint committees to discuss certain matters relevant to the Fidelity funds.
At its July 2014 meeting, the Board, including the Independent Trustees, unanimously determined to renew the fund's Advisory Contracts. In reaching its determination, the Board considered all factors it believed relevant, including (i) the nature, extent, and quality of the services to be provided to the fund and its shareholders (including the investment performance of the fund); (ii) the competitiveness of the fund's management fee and total expense ratio relative to peer funds; (iii) the total costs of the services to be provided by and the profits to be realized by Fidelity from its relationship with the fund; (iv) the extent to which economies of scale exist and would be realized as the fund grows; and (v) whether fee levels reflect these economies of scale, if any, for the benefit of fund shareholders. In connection with separate internal corporate reorganizations involving Fidelity Management & Research (U.K.) Inc. (FMR U.K.) and Fidelity Management & Research (Japan) Inc. (FMR Japan), the Board approved certain non-material amendments to the fund's sub-advisory agreements with FMR U.K. and FMR Japan to reflect that, after these reorganizations, FMR Investment Management (UK) Limited and Fidelity Management & Research (Japan) Limited will carry on the business of FMR U.K. and FMR Japan, respectively. The Board noted that no changes to the portfolio managers or to the foreign research or investment advisory services provided to the fund were expected in connection with either reorganization and that the same personnel and resources would continue to be available to the fund at the new entities.
Annual Report
Board Approval of Investment Advisory Contracts and
Management Fees - continued
In considering whether to renew the Advisory Contracts for the fund, the Board reached a determination, with the assistance of fund counsel and Independent Trustees' counsel and through the exercise of its business judgment, that the renewal of the Advisory Contracts was in the best interests of the fund and its shareholders and that the compensation payable under the Advisory Contracts was fair and reasonable. The Board's decision to renew the Advisory Contracts was not based on any single factor, but rather was based on a comprehensive consideration of all the information provided to the Board at its meetings throughout the year. The Board, in reaching its determination to renew the Advisory Contracts, was aware that shareholders of the fund have a broad range of investment choices available to them, including a wide choice among funds offered by Fidelity's competitors, and that the fund's shareholders, who have the opportunity to review and weigh the disclosure provided by the fund in its prospectus and other public disclosures, have chosen to invest in this fund, which is part of the Fidelity family of funds.
Nature, Extent, and Quality of Services Provided. The Board considered Fidelity's staffing as it relates to the fund, including the backgrounds of investment personnel of FMR and the sub-advisers (together, the Investment Advisers), and also considered the fund's investment objective, strategies, and related investment philosophy. The Independent Trustees also had discussions with senior management of Fidelity's investment operations and investment groups. The Board considered the structure of the portfolio manager compensation program and whether this structure provides appropriate incentives to act in the best interests of the fund. Additionally, the Board considered the portfolio managers' investments, if any, in the funds that they manage.
Resources Dedicated to Investment Management and Support Services. The Board and the Fund Oversight and Research Committees reviewed the general qualificationsand capabilities of Fidelity's investment staff, including its size, education, experience, and resources, as well as Fidelity's approach to recruiting, training, managing, and compensating investment personnel. The Board noted that Fidelity has continued to increase the resources devoted to non-U.S. offices, including expansion of Fidelity's global investment organization. The Board also noted that Fidelity's analysts have extensive resources, tools and capabilities that allow them to conduct sophisticated quantitative and fundamental analysis, as well as credit analysis of issuers, counterparties and guarantors. Further, the Board believes that Fidelity's investment professionals have sufficient access to global information and data so as to provide competitive investment results over time, and that those professionals also have access to sophisticated tools that permit them to assess portfolio construction and risk and performance attribution characteristics continuously, as well as to transmit new information and research conclusions rapidly around the world. Additionally, in its deliberations, the Board considered Fidelity's trading and risk management capabilities and resources and global compliance infrastructure, which are an integral part of the investment management process.
Annual Report
Shareholder and Administrative Services. The Board considered (i) the nature, extent, quality, and cost of advisory, administrative, and shareholder services performed by the Investment Advisers and their affiliates under the Advisory Contracts and under separate agreements covering transfer agency, pricing and bookkeeping, and securities lending services for the fund; (ii) the nature and extent of the supervision of third party service providers, principally custodians and subcustodians; and (iii) the resources devoted to, and the record of compliance with, the fund's compliance policies and procedures. The Board also reviewed the allocation of fund brokerage, including allocations to brokers affiliated with the Investment Advisers, the use of brokerage commissions to pay fund expenses, and the use of "soft" commission dollars to pay for research services.
The Board noted that the growth of fund assets over time across the complex allows Fidelity to reinvest in the development of services designed to enhance the value or convenience of the Fidelity funds as investment vehicles. These services include 24-hour access to account information and market information through telephone representatives and over the Internet, investor education materials and asset allocation tools, and the expanded availability of Fidelity Investor Centers.
In 2014, the Board formed an ad hoc Committee on Transfer Agency Fees to review the variety of transfer agency fee structures throughout the industry and Fidelity's competitive positioning with respect to industry participants.
Investment in a Large Fund Family. The Board considered the benefits to shareholders of investing in a Fidelity fund, including the benefits of investing in a fund that is part of a large family of funds offering a variety of investment disciplines and providing a large variety of mutual fund investor services. The Board noted that Fidelity had taken, or had made recommendations that resulted in the Fidelity funds taking, a number of actions over the previous year that benefited particular funds, including (i) continuing to dedicate additional resources to investment research and to the support of the senior management team that oversees asset management; (ii) persisting in efforts to enhance Fidelity's global research capabilities; (iii) launching new funds and making other enhancements to meet client needs for income-oriented solutions; (iv) reducing fund expenses for certain index funds; (v) continuing to launch dedicated lower cost underlying funds to meet portfolio construction needs related to expanding underlying fund options for Fidelity funds of funds, specifically for the Freedom Fund product lines; (vi) rationalizing product lines and gaining increased efficiencies through fund mergers; (vii) launching sector-based exchange-traded funds and establishing a new Fidelity adviser to manage sector-based funds and products; (viii) continuing to develop and implement technology to improve security and increase efficiency; (ix) modifying the eligibility criteria for certain share classes to increase their marketability to a portion of the defined contribution plan market; (x) waiving redemption fees for certain qualified fund-of-fund and wrap programs and certain retirement plan transactions; and (xi) launching new Institutional Class shares of certain money market funds to attract and retain assets and to fill a gap in the money market fund lineup.
Annual Report
Board Approval of Investment Advisory Contracts and
Management Fees - continued
Investment Performance. The Board considered whether the fund has operated in accordance with its investment objective, as well as its record of compliance with its investment restrictions and its performance history.
The Board took into account discussions with the Investment Advisers about fund investment performance that occur at Board meetings throughout the year. In this regard the Board noted that as part of regularly scheduled fund reviews and other reports to the Board on fund performance, the Board periodically considers annualized return information for the fund, for different time periods, measured against a securities market index ("benchmark index") and a peer group of funds with similar objectives ("peer group"). In its evaluation of fund investment performance, the Board gave particular attention to information indicating changes in performance of certain Fidelity funds for specific time periods and the Investment Advisers' explanations for any overperformance or underperformance.
In addition to reviewing absolute and relative fund performance, the Independent Trustees periodically consider the appropriateness of fund performance metrics in evaluating the results achieved. In general, the Independent Trustees believe that fund performance should be evaluated based on net performance (after fees and expenses) of both the highest performing and lowest performing classes, where applicable, compared to appropriate benchmark indices, over appropriate time periods which may include full market cycles, and compared to peer groups, as applicable, over the same periods, taking into account relevant factors including the following: general market conditions; issuer-specific information; tactical opportunities for investment; and fund cash flows and other factors.
The Independent Trustees recognize that shareholders evaluate performance on a net basis over their own holding periods, for which one-, three-, and five-year periods are often used as a proxy. For this reason, the performance information reviewed by the Board also included net cumulative calendar year total return information for the fund and an appropriate benchmark index and peer group for the most recent one-, three-, and five-year periods, as shown below. Returns are shown compared to the 25th percentile (top of box, 75% beaten) and 75th percentile (bottom of box, 25% beaten) of the peer universe. Returns of the benchmark index are "net MA," i.e., adjusted for tax withholding rates applicable to U.S.-based funds organized as Massachusetts business trusts.
Annual Report
Fidelity International Small Cap Opportunities Fund

The Board also considered that the fund's management fee is subject to upward or downward adjustment depending upon whether, and to what extent, the fund's investment performance for the performance period exceeds, or is exceeded by, a securities index, thus leading to a performance adjustment for the same period. The Board noted that the performance adjustment provides FMR with a strong economic incentive to seek to achieve superior performance for the fund's shareholders and helps to more closely align the interests of FMR and the fund's shareholders.
Based on its review, the Board concluded that the nature, extent, and quality of services provided to the fund under the Advisory Contracts should benefit the fund's shareholders.
Competitiveness of Management Fee and Total Expense Ratio. The Board considered the fund's management fee and total expense ratio compared to "mapped groups" of competitive funds and classes. Fidelity creates "mapped groups" by combining similar Lipper investment objective categories that have comparable investment mandates. Combining Lipper investment objective categories aids the Board's management fee and total expense ratio comparisons by broadening the competitive group used for comparison and by reducing the number of universes to which various Fidelity funds are compared.
Management Fee. The Board considered two proprietary management fee comparisons for the 12-month periods shown in the chart below. The group of Lipper funds used by the Board for management fee comparisons is referred to below as the "Total Mapped Group." The Total Mapped Group is broader than the Lipper peer group used by the Board for performance comparisons because the Total Mapped Group combines several Lipper investment objective categories while the Lipper peer group does not. The Total Mapped Group comparison focuses on a fund's standing in terms of gross management fees before expense reimbursements or caps, and without giving effect to the fund's performance adjustment, relative to the total universe of funds with comparable investment mandates, regardless of whether their management fee structures also are comparable. Funds with comparable investment mandates offer exposure to similar types of securities. Funds with comparable management fee structures have similar management fee contractual arrangements (e.g., flat rate charged for advisory services, all-inclusive fee rate, etc.). "TMG %" represents the percentage of funds in the Total Mapped Group that had management fees that were lower than the fund's. For example, a hypothetical TMG % of 20% would mean that 80% of the funds in the Total Mapped Group had higher, and 20% had lower, management fees than the fund. The fund's actual TMG %s are in the chart below. The "Asset-Size Peer Group" (ASPG) comparison focuses on a fund's standing relative to a subset of non-Fidelity funds within the Total Mapped Group that are similar in size and management fee structure. For example, if a fund is in the first quartile of the ASPG, the fund's management fee ranks in the least expensive or lowest 25% of funds in the ASPG. The ASPG represents at least 15% of the funds in the Total Mapped Group with comparable asset size and management fee structures, subject to a minimum of 50 funds (or all funds in the Total Mapped Group if fewer than 50). Additional information, such as the ASPG quartile in which the fund's management fee rate ranked and the impact of the fund's performance adjustment, is also included in the chart and considered by the Board.
Annual Report
Board Approval of Investment Advisory Contracts and
Management Fees - continued
Fidelity International Small Cap Opportunities Fund

Annual Report
The Board noted that the fund's management fee rate ranked below the median of its Total Mapped Group and below the median of its ASPG for 2013. The Board also noted the effect of the fund's positive performance adjustment on the fund's management fee ranking.
The Board also noted that, in August 2013, the ad hoc Committee on Management Fees was formed to conduct an in-depth review of the management fee rates of Fidelity's active equity mutual funds. The Committee focused on the following areas: (i) standard fee structures; (ii) research consumption and trading evolution; (iii) management fee competitiveness/profitability by category; and (iv) factors that drive institutional pricing.
Based on its review, the Board concluded that the fund's management fee is fair and reasonable in light of the services that the fund receives and the other factors considered.
Total Expense Ratio. In its review of each class's total expense ratio, the Board considered the fund's management fee as well as other fund or class expenses, as applicable, such as transfer agent fees, pricing and bookkeeping fees, fund-paid 12b-1 fees, and custodial, legal, and audit fees. The Board also noted the effects of any waivers and reimbursements on fees and expenses, as well as the impact of the fund's performance adjustment. As part of its review, the Board also considered the current and historical total expense ratios of each class of the fund compared to competitive fund median expenses. Each class of the fund is compared to those funds and classes in the Total Mapped Group (used by the Board for management fee comparisons) that have a similar sales load structure.
The Board noted that the total expense ratio of each of Class A and the retail class ranked below its competitive median for 2013 and the total expense ratio of each of Class T, Class B, Class C, and Institutional Class ranked above its competitive median for 2013. The Board considered that, in general, various factors can affect total expense ratios. The Board noted that the total expense ratio of Class T was above the competitive median primarily because of higher 12b-1 fees on Class T as compared to most competitor funds. Class T has a higher 12b-1 fee, but a lower front-end sales charge, than traditionally priced front-end sales charge classes. The Board considered that Class T is primarily sold load-waived in the retirement plan market where its 0.50% 12b-1 fee is comparable to competing no-load, higher 12b-1 fee classes designed specifically for retirement plans. The Board noted that the fund offers multiple classes, each of which has a different sales load and 12b-1 fee structure, and that the multiple structures are intended to offer a range of pricing options for the intermediary market. The Board also noted that the total expense ratios of the classes vary primarily by the level of their 12b-1 fees, although differences in transfer agent fees may also cause expenses to vary from class to class.
Annual Report
Board Approval of Investment Advisory Contracts and
Management Fees - continued
Fees Charged to Other Fidelity Clients. The Board also considered Fidelity fee structures and other information with respect to clients of Fidelity, such as other funds advised or subadvised by Fidelity, pension plan clients, and other institutional clients. The Board noted the findings of the 2013 ad hoc joint committee (created with the board of other Fidelity funds), which reviewed and compared Fidelity's institutional investment advisory business with its business of providing services to the Fidelity funds, including the differences in services provided, fees charged, and costs incurred, as well as competition in their respective marketplaces.
Based on its review of total expense ratios and fees charged to other Fidelity clients, the Board concluded that the total expense ratio of each class of the fund was reasonable, although in some cases above the median of the universe presented for comparison, in light of the services that the fund and its shareholders receive and the other factors considered.
Costs of the Services and Profitability. The Board considered the revenues earned and the expenses incurred by Fidelity in conducting the business of developing, marketing, distributing, managing, administering and servicing the fund and servicing the fund's shareholders. The Board also considered the level of Fidelity's profits in respect of all the Fidelity funds.
On an annual basis, Fidelity presents to the Board Fidelity's profitability for the fund. Fidelity calculates the profitability for each fund, as well as aggregate profitability for groups of Fidelity funds and all Fidelity funds, using a series of detailed revenue and cost allocation methodologies which originate with the books and records of Fidelity on which Fidelity's audited financial statements are based. The Audit Committee of the Board reviews any significant changes from the prior year's methodologies.
PricewaterhouseCoopers LLP (PwC), independent registered public accounting firm and auditor to Fidelity and certain Fidelity funds, has been engaged annually by the Board as part of the Board's assessment of Fidelity's profitability analysis. PwC's engagement includes the review and assessment of the methodologies used by Fidelity in determining the revenues and expenses attributable to Fidelity's mutual fund business, and completion of agreed-upon procedures in respect of the mathematical accuracy of fund profitability and its conformity to established allocation methodologies. After considering PwC's reports issued under the engagement and information provided by Fidelity, the Board concluded that while other allocation methods may also be reasonable, Fidelity's profitability methodologies are reasonable in all material respects.
The Board also reviewed Fidelity's non-fund businesses and fall-out benefits related to the mutual fund business as well as cases where Fidelity's affiliates may benefit from or be related to the fund's business.
Annual Report
The Board considered the costs of the services provided by and the profits realized by Fidelity in connection with the operation of the fund and was satisfied that the profitability was not excessive in the circumstances.
Economies of Scale. The Board considered whether there have been economies of scale in respect of the management of the Fidelity funds, whether the Fidelity funds (including the fund) have appropriately benefited from any such economies of scale, and whether there is potential for realization of any further economies of scale. The Board considered the extent to which the fund will benefit from economies of scale through increased services to the fund, through waivers or reimbursements, or through fee or expense ratio reductions. The Board also noted that in 2013, it and the boards of other Fidelity funds created an ad hoc committee (the Economies of Scale Committee) to analyze whether Fidelity attains economies of scale in respect of the management and servicing of the Fidelity funds, whether the Fidelity funds have appropriately benefited from such economies of scale, and whether there is potential for realization of any further economies of scale.
The Board recognized that the fund's management contract incorporates a "group fee" structure, which provides for lower group fee rates as total group assets increase, and for higher group fee rates as total group assets decrease (with "group assets" defined to include fund assets under FMR's management plus sector fund assets previously under FMR's management and currently managed by Fidelity SelectCo, LLC). FMR calculates the group fee rates based on a tiered asset "breakpoint" schedule that varies based on asset class. The Board considered that the group fee is designed to deliver the benefits of economies of scale to fund shareholders when total Fidelity fund assets increase, even if assets of any particular fund are unchanged or have declined, because some portion of Fidelity's costs are attributable to services provided to all Fidelity funds, and all funds benefit if those costs can be allocated among more assets. The Board concluded that, given the group fee structure, fund shareholders will benefit from lower management fees as group assets increase at the fund complex level, regardless of whether Fidelity achieves any such economies of scale.
The Board concluded, taking into account the analysis of the Economies of Scale Committee, that economies of scale, if any, are being appropriately shared between fund shareholders and Fidelity.
Additional Information Requested by the Board. In order to develop fully the factual basis for consideration of the Fidelity funds' Advisory Contracts, the Board requested and received additional information on certain topics, including: (i) fund performance trends and Fidelity's long-term strategies for certain funds; (ii) Fidelity's strategic marketing and product lineup goals; (iii) the methodology with respect to competitive fund data and peer group classifications; (iv) the arrangements with, and performance of, certain sub-advisers on behalf of the Fidelity funds, as well as certain proposed participating affiliate arrangements; (v) the realization of fall-out benefits in certain Fidelity business units; (vi) Fidelity's group fee structures, including the rationale for the individual fee rates of certain categories of funds and the definition of group assets; (vii) trends regarding industry use of performance fee structures and the performance adjustment methodologies applicable to the Fidelity funds; (viii) additional competitive analysis regarding the total expenses for certain classes; (ix) fund profitability methodology, including Fidelity's cost allocation methodology, and the impact of certain factors on fund profitability results; and (x) the process by which Fidelity determines sub-advisory fees for funds it advises.
Annual Report
Board Approval of Investment Advisory Contracts and
Management Fees - continued
Based on its evaluation of all of the conclusions noted above, and after considering all factors it believed relevant, the Board ultimately concluded that the advisory fee structures are fair and reasonable, and that the fund's Advisory Contracts should be renewed.
Annual Report
Investment Adviser
Fidelity Management & Research Company
Boston, MA
Investment Sub-Advisers
FMR Co., Inc.
Fidelity Management & Research
(Hong Kong) Limited
Fidelity Management & Research
(Japan) Limited
Fidelity Management & Research
(U.K.) Inc.
FIL Investments (Japan) Limited
FIL Investment Advisors
FIL Investment Advisors (U.K.) Limited
General Distributor
Fidelity Distributors Corporation
Smithfield, RI
Transfer and Service Agents
Fidelity Investments Institutional
Operations Company, Inc.
Boston, MA
Fidelity Service Company, Inc.
Boston, MA
Custodian
The Northern Trust Company
Chicago, IL
The Fidelity Telephone Connection
Mutual Fund 24-Hour Service
Exchanges/Redemptions
and Account Assistance 1-800-544-6666
Product Information 1-800-544-6666
Retirement Accounts 1-800-544-4774
(8 a.m. - 9 p.m.)
TDD Service 1-800-544-0118
for the deaf and hearing impaired
(9 a.m. - 9 p.m. Eastern time)
Fidelity Automated Service
Telephone (FAST®)
1-800-544-5555
Automated line for quickest service
(Fidelity Investment logo)(registered trademark)
Corporate Headquarters
245 Summer St., Boston, MA 02210
www.fidelity.com
ILS-UANN-1214
1.815061.110
(Fidelity Investment logo)(registered trademark)
Fidelity Advisor®
International Value
Fund - Class A, Class T, Class B
and Class C
Annual Report
October 31, 2014
(Fidelity Cover Art)
Class A, Class T, Class B, and Class C are classes of Fidelity® International Value Fund
Contents
Performance | (Click Here) | How the fund has done over time. |
Management's Discussion of Fund Performance | (Click Here) | The Portfolio Manager's review of fund performance and strategy. |
Shareholder Expense Example | (Click Here) | An example of shareholder expenses. |
Investment Changes | (Click Here) | A summary of major shifts in the fund's investments over the past six months. |
Investments | (Click Here) | A complete list of the fund's investments with their market values. |
Financial Statements | (Click Here) | Statements of assets and liabilities, operations, and changes in net assets, as well as financial highlights. |
Notes | (Click Here) | Notes to financial statements. |
Report of Independent Registered Public Accounting Firm | (Click Here) | |
Trustees and Officers | (Click Here) | |
Distributions | (Click Here) | |
Board Approval of Investment Advisory Contracts and Management Fees | (Click Here) | |
To view a fund's proxy voting guidelines and proxy voting record for the 12-month period ended June 30, visit http://www.fidelity.com/proxyvotingresults or visit the Securities and Exchange Commission's (SEC) web site at http://www.sec.gov. You may also call 1-877-208-0098 to request a free copy of the proxy voting guidelines.
Standard & Poor's, S&P and S&P 500 are registered service marks of The McGraw-Hill Companies, Inc. and have been licensed for use by Fidelity Distributors Corporation.
Other third-party marks appearing herein are the property of their respective owners.
All other marks appearing herein are registered or unregistered trademarks or service marks of FMR LLC or an affiliated company. © 2014 FMR LLC. All rights reserved.
Annual Report
This report and the financial statements contained herein are submitted for the general information of the shareholders of the fund. This report is not authorized for distribution to prospective investors in the fund unless preceded or accompanied by an effective prospectus.
A fund files its complete schedule of portfolio holdings with the SEC for the first and third quarters of each fiscal year on Form N-Q. Forms N-Q are available on the SEC's web site at http://www.sec.gov. A fund's Forms N-Q may be reviewed and copied at the SEC's Public Reference Room in Washington, DC. Information regarding the operation of the SEC's Public Reference Room may be obtained by calling 1-800-SEC-0330. For a complete list of a fund's portfolio holdings, view the most recent holdings listing, semiannual report, or annual report on Fidelity's web site at http://www.fidelity.com, http://www.advisor.fidelity.com, or http://www.401k.com, as applicable.
NOT FDIC INSURED • MAY LOSE VALUE • NO BANK GUARANTEE
Neither the fund nor Fidelity Distributors Corporation is a bank.
Annual Report
Average annual total return reflects the change in the value of an investment, assuming reinvestment of the class' distributions from dividend income and capital gains (the profits earned upon the sale of securities that have grown in value, if any) and assuming a constant rate of performance each year. The $10,000 table and the fund's returns do not reflect the deduction of taxes that a shareholder would pay on fund distributions or the redemption of fund shares. During periods of reimbursement by Fidelity, a fund's total return will be greater than it would be had the reimbursement not occurred. How a fund did yesterday is no guarantee of how it will do tomorrow. Returns reflect the conversion of Class B shares to Class A shares after a maximum of seven years.
Average Annual Total Returns
Periods ended October 31, 2014 | Past 1
year | Past 5
years | Life of
fund A |
Class A (incl. 5.75% sales charge) | -7.41% | 3.58% | 0.05% |
Class T (incl. 3.50% sales charge) | -5.42% | 3.81% | 0.06% |
Class B (incl. contingent deferred sales charge)B | -7.21% | 3.72% | 0.13% |
Class C (incl. contingent deferred sales charge)C | -3.39% | 4.05% | 0.01% |
A From May 18, 2006.
B Class B shares' contingent deferred sales charges included in the past one year, past five years, and life of fund total return figures are 5%, 2%, and 0%, respectively.
C Class C shares' contingent deferred sales charges included in the past one year, past five years, and life of fund total return figures are 1%, 0%, and 0%, respectively.
Annual Report
$10,000 Over Life of Fund
Let's say hypothetically that $10,000 was invested in Fidelity Advisor® International Value Fund - Class A on May 18, 2006, when the fund started, and the current 5.75% sales charge was paid. The chart shows how the value of your investment would have changed, and also shows how the MSCI EAFE Value Index performed over the same period.
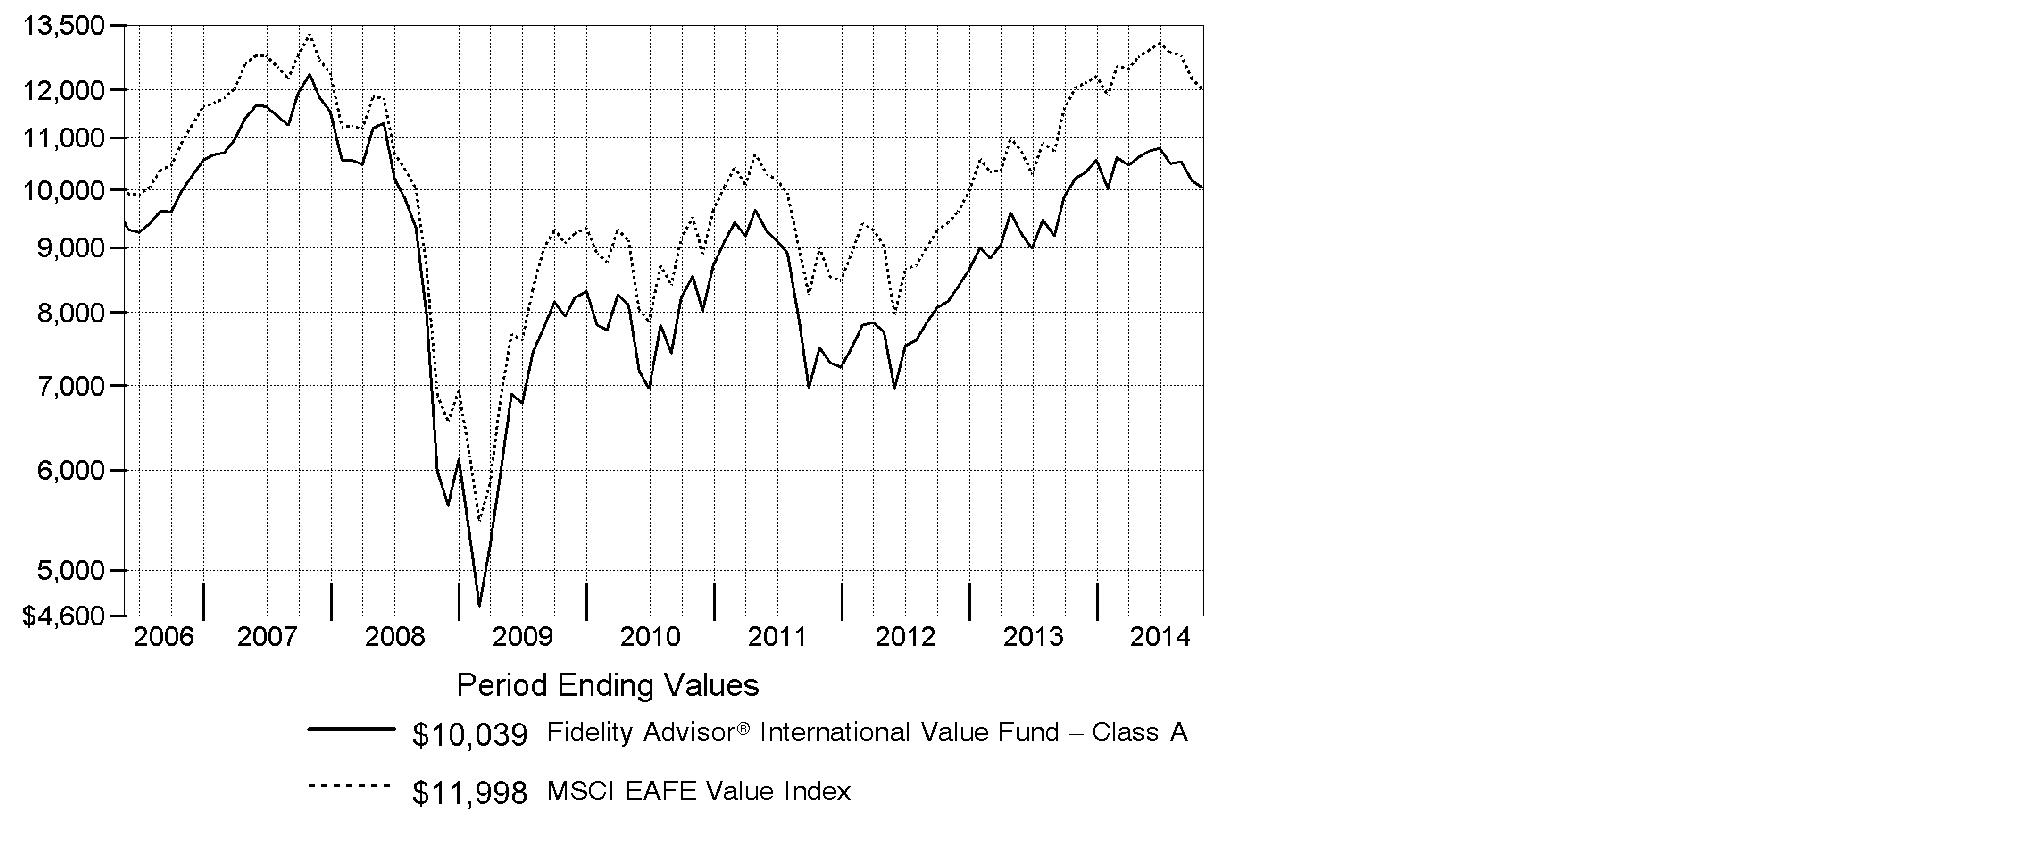
Annual Report
Market Recap: Global equities posted a healthy gain for the 12 months ending October 31, 2014, overcoming an October market decline driven by recessionary pressures in China and tepid growth in Europe. The MSCI ACWI (All Country World Index) Index rose 8.15%, helped by subdued market volatility for much of the period and supported by solid corporate earnings, especially in the United States. Stocks also benefited from easy monetary policies in Japan and the eurozone, as well as increased stimulus efforts in China. All but three of the 24 industry groups that compose the index marked a positive return. The U.S. (+17%) remained a pillar of strength, while a strongly rising dollar in the latter part of the period detracted from investors' returns in most non-U.S. markets. Canada (+5%) notched broad gains outside of its energy and materials sectors, as did Asia-Pacific ex Japan (+4%), led by investor enthusiasm for companies in India. The U.K., Europe and Japan, meanwhile, all underperformed. Among sectors, health care (+24%) led the index, with a strong contribution from the pharmaceuticals, biotechnology & life sciences industry. Information technology (+21%) also outperformed. Conversely, materials (-4%) and energy (-1%) lagged the index due to a higher supply of and lower demand for commodities.
Comments from Alexander Zavratsky, Portfolio Manager of Fidelity Advisor® International Value Fund: For the year, the fund's Class A, Class T, Class B and Class C shares returned -1.76%, -1.99%, -2.39% and -2.43%, respectively (excluding sales charges), trailing the -0.45% return of the benchmark MSCI EAFE Value Index. Versus the index, the fund was hurt by its investments in higher-quality Japanese financials firms, which lagged due to a rising yen and investor reaction to the U.S. central bank's announcement last fall that its stimulus program may end following a period of tapering. From this category, investments in bank holdings company Sumitomo Mitsui Financial Group and diversified conglomerate ORIX were sore spots. An overweighting, on average, in Sumitomo Mitsui was the fund's biggest relative detractor during the past year. Whereas I became more bearish on Sumitomo Mitsui, I held on to ORIX, believing in its ability to deliver long-term results. Conversely, selling our holdings in U.K.-based food retailer Tesco prior to second half of the year proved the biggest relative contributor, as sliding sales and a loss in market share steadily eroded its stock price. Additionally, the stock, which had been declining over the summer, dipped in early August after the firm issued its third profit warning of the year, then again in September after its new chief executive reported that Tesco's first-half profits had been overstated and four senior executives were suspended.
The views expressed above reflect those of the portfolio manager(s) only through the end of the period as stated on the cover of this report and do not necessarily represent the views of Fidelity or any other person in the Fidelity organization. Any such views are subject to change at any time based upon market or other conditions and Fidelity disclaims any responsibility to update such views. These views may not be relied on as investment advice and, because investment decisions for a Fidelity fund are based on numerous factors, may not be relied on as an indication of trading intent on behalf of any Fidelity fund.
Annual Report
Shareholder Expense Example
As a shareholder of the Fund, you incur two types of costs: (1) transaction costs, including sales charges (loads) on purchase payments or redemption proceeds, redemption fees and (2) ongoing costs, including management fees, distribution and/or service (12b-1) fees and other Fund expenses. This Example is intended to help you understand your ongoing costs (in dollars) of investing in the Fund and to compare these costs with the ongoing costs of investing in other mutual funds.
The Example is based on an investment of $1,000 invested at the beginning of the period and held for the entire period (May 1, 2014 to October 31, 2014).
Actual Expenses
The first line of the accompanying table for each class of the Fund provides information about actual account values and actual expenses. You may use the information in this line, together with the amount you invested, to estimate the expenses that you paid over the period. Simply divide your account value by $1,000.00 (for example, an $8,600 account value divided by $1,000.00 = 8.6), then multiply the result by the number in the first line for a class of the Fund under the heading entitled "Expenses Paid During Period" to estimate the expenses you paid on your account during this period. A small balance maintenance fee of $12.00 that is charged once a year may apply for certain accounts with a value of less than $2,000. This fee is not included in the table below. If it was, the estimate of expenses you paid during the period would be higher, and your ending account value lower, by this amount. In addition, the Fund, as a shareholder in the underlying Fidelity Central Funds, will indirectly bear its pro-rata share of the fees and expenses incurred by the underlying Fidelity Central Funds. These fees and expenses are not included in the Fund's annualized expense ratio used to calculate the expense estimate in the table below.
Hypothetical Example for Comparison Purposes
The second line of the accompanying table for each class of the Fund provides information about hypothetical account values and hypothetical expenses based on a Class' actual expense ratio and an assumed rate of return of 5% per year before expenses, which is not the Class' actual return. The hypothetical account values and expenses may not be used to estimate the actual ending account balance or expenses you paid for the period. You may use this information to compare the ongoing costs of investing in the Fund and other funds. To do so, compare this 5% hypothetical example with the 5% hypothetical examples that appear in the shareholder reports of the other funds. A small balance maintenance fee of $12.00 that is charged once a year may apply for certain accounts with a value of less than $2,000. This fee is not included in the table below. If it was, the estimate of expenses you paid during the period would be higher, and your ending account value lower, by this amount. In addition, the Fund, as a shareholder in the underlying Fidelity Central Funds, will indirectly bear its pro-rata share of the fees and expenses incurred by the underlying Fidelity Central Funds. These fees and expenses are not included in the Fund's annualized expense ratio used to calculate the expense estimate in the table below.
Please note that the expenses shown in the table are meant to highlight your ongoing costs only and do not reflect any transaction costs. Therefore, the second line of the table is useful in comparing ongoing costs only, and will not help you determine the relative total costs of owning different funds. In addition, if these transactional costs were included, your costs would have been higher.
Annual Report
| Annualized
Expense Ratio B | Beginning
Account Value
May 1, 2014 | Ending
Account Value
October 31, 2014 | Expenses Paid
During Period*
May 1, 2014
to October 31, 2014 |
Class A | 1.33% | | | |
Actual | | $ 1,000.00 | $ 947.30 | $ 6.53 |
HypotheticalA | | $ 1,000.00 | $ 1,018.50 | $ 6.77 |
Class T | 1.60% | | | |
Actual | | $ 1,000.00 | $ 946.10 | $ 7.85 |
HypotheticalA | | $ 1,000.00 | $ 1,017.14 | $ 8.13 |
Class B | 2.09% | | | |
Actual | | $ 1,000.00 | $ 944.40 | $ 10.24 |
HypotheticalA | | $ 1,000.00 | $ 1,014.67 | $ 10.61 |
Class C | 2.09% | | | |
Actual | | $ 1,000.00 | $ 944.00 | $ 10.24 |
HypotheticalA | | $ 1,000.00 | $ 1,014.67 | $ 10.61 |
International Value | .96% | | | |
Actual | | $ 1,000.00 | $ 949.50 | $ 4.72 |
HypotheticalA | | $ 1,000.00 | $ 1,020.37 | $ 4.89 |
Institutional Class | 1.09% | | | |
Actual | | $ 1,000.00 | $ 948.50 | $ 5.35 |
HypotheticalA | | $ 1,000.00 | $ 1,019.71 | $ 5.55 |
A 5% return per year before expenses
B Annualized expense ratio reflects expenses net of applicable fee waivers.
* Expenses are equal to each Class' annualized expense ratio, multiplied by the average account value over the period, multiplied by 184/365 (to reflect the one-half year period).
Annual Report
Investment Changes (Unaudited)
Geographic Diversification (% of fund's net assets) |
As of October 31, 2014 |
 | United Kingdom 23.4% | |
 | Japan 18.6% | |
 | France 14.4% | |
 | Switzerland 7.9% | |
 | Germany 7.8% | |
 | Australia 5.7% | |
 | United States of America* 3.7% | |
 | Spain 2.9% | |
 | Netherlands 2.5% | |
 | Other 13.1% | |

* Includes short-term investments and net other assets (liabilities) |
Percentages are based on country or territory of incorporation and are adjusted for the effect of futures contracts, if applicable. |
As of April 30, 2014 |
| United Kingdom 24.4% | |
| France 17.9% | |
| Japan 15.4% | |
| Switzerland 7.7% | |
| Germany 7.5% | |
| United States of America* 6.3% | |
| Australia 5.4% | |
| Sweden 2.1% | |
| Netherlands 1.9% | |
| Other 11.4% | |

* Includes short-term investments and net other assets (liabilities) |
Percentages are based on country or territory of incorporation and are adjusted for the effect of futures contracts, if applicable. |
Asset Allocation as of October 31, 2014 |
| % of fund's
net assets | % of fund's net assets
6 months ago |
Stocks | 98.8 | 95.5 |
Short-Term Investments and Net Other Assets (Liabilities) | 1.2 | 4.5 |
Top Ten Stocks as of October 31, 2014 |
| % of fund's
net assets | % of fund's net assets
6 months ago |
Total SA (France, Oil, Gas & Consumable Fuels) | 3.3 | 4.8 |
Novartis AG (Switzerland, Pharmaceuticals) | 3.2 | 2.3 |
HSBC Holdings PLC sponsored ADR (United Kingdom, Banks) | 2.7 | 2.2 |
Westpac Banking Corp. (Australia, Banks) | 2.4 | 2.3 |
Sanofi SA (France, Pharmaceuticals) | 2.2 | 2.4 |
Mitsubishi UFJ Financial Group, Inc. (Japan, Banks) | 2.2 | 1.3 |
BHP Billiton PLC (United Kingdom, Metals & Mining) | 2.2 | 1.7 |
Nestle SA (Switzerland, Food Products) | 2.1 | 2.1 |
Royal Dutch Shell PLC Class A sponsored ADR (United Kingdom, Oil, Gas & Consumable Fuels) | 2.0 | 1.8 |
Vodafone Group PLC sponsored ADR (United Kingdom, Wireless Telecommunication Services) | 2.0 | 2.0 |
| 24.3 | |
Market Sectors as of October 31, 2014 |
| % of fund's
net assets | % of fund's net assets
6 months ago |
Financials | 25.5 | 23.8 |
Health Care | 16.1 | 15.6 |
Consumer Discretionary | 10.2 | 10.4 |
Telecommunication Services | 9.0 | 8.4 |
Consumer Staples | 8.5 | 8.3 |
Industrials | 8.1 | 9.4 |
Energy | 7.2 | 6.6 |
Information Technology | 5.5 | 4.0 |
Materials | 4.8 | 6.0 |
Utilities | 3.9 | 3.0 |
Annual Report
Investments October 31, 2014
Showing Percentage of Net Assets
Common Stocks - 97.8% |
| Shares | | Value |
Australia - 5.7% |
Ansell Ltd. | 52,575 | | $ 922,199 |
Australia & New Zealand Banking Group Ltd. | 116,005 | | 3,432,655 |
Telstra Corp. Ltd. | 236,519 | | 1,176,955 |
Transurban Group unit | 196,204 | | 1,405,195 |
Westpac Banking Corp. | 160,274 | | 4,919,494 |
TOTAL AUSTRALIA | | 11,856,498 |
Bailiwick of Jersey - 1.2% |
Shire PLC | 21,400 | | 1,435,874 |
Wolseley PLC | 20,590 | | 1,092,548 |
TOTAL BAILIWICK OF JERSEY | | 2,528,422 |
Belgium - 0.9% |
Anheuser-Busch InBev SA NV | 11,070 | | 1,227,601 |
UCB SA | 8,600 | | 693,937 |
TOTAL BELGIUM | | 1,921,538 |
Bermuda - 0.1% |
Travelport Worldwide Ltd. | 20,771 | | 300,141 |
Canada - 1.1% |
Imperial Oil Ltd. | 24,200 | | 1,164,426 |
Potash Corp. of Saskatchewan, Inc. | 33,600 | | 1,146,881 |
TOTAL CANADA | | 2,311,307 |
Denmark - 0.8% |
A.P. Moller - Maersk A/S Series B | 673 | | 1,568,199 |
Finland - 1.1% |
Sampo Oyj (A Shares) | 46,634 | | 2,230,632 |
France - 14.4% |
Atos Origin SA | 22,183 | | 1,531,426 |
AXA SA | 97,221 | | 2,242,936 |
BNP Paribas SA | 50,847 | | 3,194,867 |
Cap Gemini SA | 25,693 | | 1,689,064 |
GDF Suez | 78,778 | | 1,910,738 |
Havas SA | 155,466 | | 1,256,603 |
Orange SA | 130,000 | | 2,069,649 |
Renault SA | 16,345 | | 1,213,192 |
Sanofi SA | 51,166 | | 4,642,808 |
Schneider Electric SA | 13,405 | | 1,056,288 |
Common Stocks - continued |
| Shares | | Value |
France - continued |
Total SA | 114,563 | | $ 6,839,790 |
Vivendi SA | 98,899 | | 2,413,640 |
TOTAL FRANCE | | 30,061,001 |
Germany - 6.8% |
Allianz SE | 22,439 | | 3,568,298 |
BASF AG | 39,549 | | 3,481,153 |
Bayer AG | 15,003 | | 2,132,975 |
Continental AG | 6,566 | | 1,288,945 |
Fresenius SE & Co. KGaA | 29,100 | | 1,496,957 |
GEA Group AG | 27,042 | | 1,243,509 |
Siemens AG | 7,361 | | 830,272 |
TOTAL GERMANY | | 14,042,109 |
Ireland - 0.9% |
Actavis PLC (a) | 7,400 | | 1,796,276 |
Israel - 1.2% |
Teva Pharmaceutical Industries Ltd. sponsored ADR | 43,799 | | 2,473,330 |
Italy - 1.2% |
Intesa Sanpaolo SpA | 495,100 | | 1,455,475 |
Telecom Italia SpA (a)(d) | 891,000 | | 1,009,754 |
TOTAL ITALY | | 2,465,229 |
Japan - 18.6% |
Astellas Pharma, Inc. | 136,600 | | 2,120,100 |
Dentsu, Inc. | 31,700 | | 1,178,591 |
East Japan Railway Co. | 19,300 | | 1,507,392 |
Fujitsu Ltd. | 157,000 | | 954,476 |
Hitachi Ltd. | 250,000 | | 1,964,369 |
Hoya Corp. | 56,800 | | 2,009,973 |
Itochu Corp. | 220,200 | | 2,661,897 |
Japan Tobacco, Inc. | 92,300 | | 3,149,189 |
KDDI Corp. | 33,100 | | 2,173,659 |
Mitsubishi Electric Corp. | 90,000 | | 1,160,442 |
Mitsubishi UFJ Financial Group, Inc. | 790,400 | | 4,607,411 |
Nippon Telegraph & Telephone Corp. | 34,800 | | 2,165,216 |
OMRON Corp. | 27,200 | | 1,287,503 |
ORIX Corp. | 100,300 | | 1,392,188 |
Seven & i Holdings Co., Ltd. | 58,100 | | 2,269,161 |
Seven Bank Ltd. | 271,500 | | 1,133,893 |
SoftBank Corp. | 11,800 | | 859,033 |
Sony Financial Holdings, Inc. | 71,200 | | 1,136,687 |
Common Stocks - continued |
| Shares | | Value |
Japan - continued |
Sumitomo Mitsui Trust Holdings, Inc. | 442,000 | | $ 1,804,564 |
Toyota Motor Corp. | 51,300 | | 3,087,091 |
TOTAL JAPAN | | 38,622,835 |
Korea (South) - 0.5% |
Samsung Electronics Co. Ltd. | 841 | | 973,716 |
Luxembourg - 0.4% |
RTL Group SA | 9,839 | | 914,374 |
Netherlands - 2.5% |
ING Groep NV (Certificaten Van Aandelen) (a) | 171,690 | | 2,458,663 |
Reed Elsevier NV | 117,061 | | 2,694,054 |
TOTAL NETHERLANDS | | 5,152,717 |
Norway - 0.7% |
Statoil ASA | 66,000 | | 1,510,439 |
Singapore - 0.8% |
Singapore Telecommunications Ltd. | 530,000 | | 1,559,937 |
Spain - 2.9% |
Amadeus IT Holding SA Class A | 30,962 | | 1,136,841 |
Banco Bilbao Vizcaya Argentaria SA | 221,342 | | 2,475,686 |
Iberdrola SA | 343,700 | | 2,429,622 |
TOTAL SPAIN | | 6,042,149 |
Sweden - 2.2% |
Meda AB (A Shares) | 62,100 | | 815,761 |
Nordea Bank AB | 222,000 | | 2,847,098 |
Svenska Cellulosa AB (SCA) (B Shares) | 40,065 | | 895,801 |
TOTAL SWEDEN | | 4,558,660 |
Switzerland - 7.9% |
Credit Suisse Group AG | 79,817 | | 2,126,628 |
Nestle SA | 59,746 | | 4,381,421 |
Novartis AG | 71,563 | | 6,641,252 |
Roche Holding AG (participation certificate) | 4,927 | | 1,453,966 |
Syngenta AG (Switzerland) | 2,586 | | 799,740 |
UBS AG (NY Shares) | 61,458 | | 1,068,140 |
TOTAL SWITZERLAND | | 16,471,147 |
United Kingdom - 23.4% |
AstraZeneca PLC (United Kingdom) | 52,745 | | 3,852,937 |
BAE Systems PLC | 322,429 | | 2,365,927 |
Barclays PLC | 722,751 | | 2,779,641 |
Common Stocks - continued |
| Shares | | Value |
United Kingdom - continued |
BG Group PLC | 77,900 | | $ 1,298,284 |
BHP Billiton PLC | 176,628 | | 4,563,468 |
BT Group PLC | 85,378 | | 503,331 |
Bunzl PLC | 72,414 | | 1,963,499 |
Compass Group PLC | 131,339 | | 2,113,636 |
GlaxoSmithKline PLC | 45,639 | | 1,032,079 |
HSBC Holdings PLC sponsored ADR (d) | 110,742 | | 5,650,057 |
Imperial Tobacco Group PLC | 70,233 | | 3,045,855 |
Informa PLC | 135,091 | | 1,039,465 |
ITV PLC | 583,096 | | 1,893,541 |
Liberty Global PLC Class A (a) | 27,100 | | 1,232,237 |
National Grid PLC | 254,981 | | 3,783,908 |
Next PLC | 9,400 | | 969,146 |
Prudential PLC | 78,195 | | 1,810,686 |
Royal Dutch Shell PLC Class A sponsored ADR | 58,979 | | 4,234,102 |
Standard Chartered PLC (United Kingdom) | 37,125 | | 558,018 |
Vodafone Group PLC sponsored ADR | 122,858 | | 4,081,343 |
TOTAL UNITED KINGDOM | | 48,771,160 |
United States of America - 2.5% |
AbbVie, Inc. | 13,742 | | 872,067 |
Altria Group, Inc. | 25,800 | | 1,247,172 |
Constellation Brands, Inc. Class A (sub. vtg.) (a) | 14,800 | | 1,354,792 |
ResMed, Inc. CDI (d) | 209,067 | | 1,099,368 |
T-Mobile U.S., Inc. (a) | 24,700 | | 720,993 |
TOTAL UNITED STATES OF AMERICA | | 5,294,392 |
TOTAL COMMON STOCKS (Cost $201,705,371) |
203,426,208
|
Nonconvertible Preferred Stocks - 1.0% |
| | | |
Germany - 1.0% |
Volkswagen AG
(Cost $2,250,614) | 10,231 | |
2,180,207
|
Money Market Funds - 2.4% |
| Shares | | Value |
Fidelity Cash Central Fund, 0.11% (b) | 1,490,412 | | $ 1,490,412 |
Fidelity Securities Lending Cash Central Fund, 0.11% (b)(c) | 3,523,300 | | 3,523,300 |
TOTAL MONEY MARKET FUNDS (Cost $5,013,712) |
5,013,712
|
TOTAL INVESTMENT PORTFOLIO - 101.2% (Cost $208,969,697) | | 210,620,127 |
NET OTHER ASSETS (LIABILITIES) - (1.2)% | | (2,560,016) |
NET ASSETS - 100% | $ 208,060,111 |
Legend |
(a) Non-income producing |
(b) Affiliated fund that is generally available only to investment companies and other accounts managed by Fidelity Investments. The rate quoted is the annualized seven-day yield of the fund at period end. A complete unaudited listing of the fund's holdings as of its most recent quarter end is available upon request. In addition, each Fidelity Central Fund's financial statements, which are not covered by the Fund's Report of Independent Registered Public Accounting Firm, are available on the SEC's website or upon request. |
(c) Investment made with cash collateral received from securities on loan. |
(d) Security or a portion of the security is on loan at period end. |
Affiliated Central Funds |
Information regarding fiscal year to date income earned by the Fund from investments in Fidelity Central Funds is as follows: |
Fund | Income earned |
Fidelity Cash Central Fund | $ 3,947 |
Fidelity Securities Lending Cash Central Fund | 161,924 |
Total | $ 165,871 |
Other Information |
Categorizations in the Schedule of Investments are based on country or territory of incorporation. |
The following is a summary of the inputs used, as of October 31, 2014, involving the Fund's assets and liabilities carried at fair value. The inputs or methodology used for valuing securities may not be an indication of the risk associated with investing in those securities. For more information on valuation inputs, and their aggregation into the levels used in the tables below, please refer to the Investment Valuation section in the accompanying Notes to Financial Statements. |
Valuation Inputs at Reporting Date: |
Description | Total | Level 1 | Level 2 | Level 3 |
Investments in Securities: | | | | |
Equities: | | | | |
Consumer Discretionary | $ 21,361,223 | $ 17,095,541 | $ 4,265,682 | $ - |
Consumer Staples | 17,570,992 | 6,543,620 | 11,027,372 | - |
Energy | 15,047,041 | 5,398,528 | 9,648,513 | - |
Financials | 52,893,717 | 17,791,748 | 35,101,969 | - |
Health Care | 33,481,886 | 10,281,303 | 23,200,583 | - |
Industrials | 16,855,168 | 9,289,970 | 7,565,198 | - |
Information Technology | 11,547,368 | 5,331,047 | 6,216,321 | - |
Materials | 9,991,242 | 4,628,034 | 5,363,208 | - |
Telecommunication Services | 18,733,510 | 7,215,976 | 11,517,534 | - |
Utilities | 8,124,268 | 4,340,360 | 3,783,908 | - |
Money Market Funds | 5,013,712 | 5,013,712 | - | - |
Total Investments in Securities: | $ 210,620,127 | $ 92,929,839 | $ 117,690,288 | $ - |
The following is a summary of transfers between Level 1 and Level 2 for the period ended October 31, 2014. Transfers are assumed to have occurred at the beginning of the period, and are primarily attributable to the valuation techniques used for foreign equity securities, as discussed in the accompanying Notes to Financial Statements: |
Transfers | Total |
Level 1 to Level 2 | $ 18,553,193 |
Level 2 to Level 1 | $ 0 |
See accompanying notes which are an integral part of the financial statements.
Annual Report
Statement of Assets and Liabilities
| October 31, 2014 |
| | |
Assets | | |
Investment in securities, at value (including securities loaned of $3,468,947) - See accompanying schedule: Unaffiliated issuers (cost $203,955,985) | $ 205,606,415 | |
Fidelity Central Funds (cost $5,013,712) | 5,013,712 | |
Total Investments (cost $208,969,697) | | $ 210,620,127 |
Cash | | 2 |
Foreign currency held at value (cost $5,524) | | 5,524 |
Receivable for investments sold | | 2,809,678 |
Receivable for fund shares sold | | 79,904 |
Dividends receivable | | 723,355 |
Distributions receivable from Fidelity Central Funds | | 5,174 |
Prepaid expenses | | 677 |
Other receivables | | 1,614 |
Total assets | | 214,246,055 |
| | |
Liabilities | | |
Payable for investments purchased | $ 2,366,704 | |
Payable for fund shares redeemed | 54,010 | |
Accrued management fee | 122,100 | |
Distribution and service plan fees payable | 6,011 | |
Other affiliated payables | 42,738 | |
Other payables and accrued expenses | 71,081 | |
Collateral on securities loaned, at value | 3,523,300 | |
Total liabilities | | 6,185,944 |
| | |
Net Assets | | $ 208,060,111 |
Net Assets consist of: | | |
Paid in capital | | $ 303,438,497 |
Undistributed net investment income | | 7,054,946 |
Accumulated undistributed net realized gain (loss) on investments and foreign currency transactions | | (104,059,003) |
Net unrealized appreciation (depreciation) on investments and assets and liabilities in foreign currencies | | 1,625,671 |
Net Assets | | $ 208,060,111 |
See accompanying notes which are an integral part of the financial statements.
Annual Report
Statement of Assets and Liabilities - continued
| October 31, 2014 |
| | |
Calculation of Maximum Offering Price Class A:
Net Asset Value and redemption price per share ($6,296,411 ÷ 730,081 shares) | | $ 8.62 |
| | |
Maximum offering price per share (100/94.25 of $8.62) | | $ 9.15 |
Class T:
Net Asset Value and redemption price per share ($3,603,734 ÷ 418,897 shares) | | $ 8.60 |
| | |
Maximum offering price per share (100/96.50 of $8.60) | | $ 8.91 |
Class B:
Net Asset Value and offering price per share ($414,070 ÷ 47,839 shares)A | | $ 8.66 |
| | |
Class C:
Net Asset Value and offering price per share ($3,646,790 ÷ 424,463 shares)A | | $ 8.59 |
| | |
International Value:
Net Asset Value, offering price and redemption price per share ($192,789,069 ÷ 22,313,205 shares) | | $ 8.64 |
| | |
Institutional Class:
Net Asset Value, offering price and redemption price per share ($1,310,037 ÷ 151,443 shares) | | $ 8.65 |
A Redemption price per share is equal to net asset value less any applicable contingent deferred sales charge.
See accompanying notes which are an integral part of the financial statements.
Annual Report
Financial Statements - continued
Statement of Operations
| Year ended October 31, 2014 |
| | |
Investment Income | | |
Dividends | | $ 6,954,134 |
Special dividends | | 3,142,692 |
Income from Fidelity Central Funds | | 165,871 |
Income before foreign taxes withheld | | 10,262,697 |
Less foreign taxes withheld | | (513,411) |
Total income | | 9,749,286 |
| | |
Expenses | | |
Management fee
Basic fee | $ 1,434,574 | |
Performance adjustment | (213,552) | |
Transfer agent fees | 402,517 | |
Distribution and service plan fees | 76,579 | |
Accounting and security lending fees | 107,492 | |
Custodian fees and expenses | 104,890 | |
Independent trustees' compensation | 836 | |
Registration fees | 75,702 | |
Audit | 62,675 | |
Legal | 689 | |
Miscellaneous | 1,603 | |
Total expenses before reductions | 2,054,005 | |
Expense reductions | (4,121) | 2,049,884 |
Net investment income (loss) | | 7,699,402 |
Realized and Unrealized Gain (Loss) Net realized gain (loss) on: | | |
Investment securities: | | |
Unaffiliated issuers | 12,125,451 | |
Foreign currency transactions | (45,328) | |
Total net realized gain (loss) | | 12,080,123 |
Change in net unrealized appreciation (depreciation) on: Investment securities | (23,406,359) | |
Assets and liabilities in foreign currencies | (29,100) | |
Total change in net unrealized appreciation (depreciation) | | (23,435,459) |
Net gain (loss) | | (11,355,336) |
Net increase (decrease) in net assets resulting from operations | | $ (3,655,934) |
See accompanying notes which are an integral part of the financial statements.
Annual Report
Statement of Changes in Net Assets
| Year ended
October 31,
2014 | Year ended
October 31,
2013 |
Increase (Decrease) in Net Assets | | |
Operations | | |
Net investment income (loss) | $ 7,699,402 | $ 3,964,300 |
Net realized gain (loss) | 12,080,123 | 9,397,591 |
Change in net unrealized appreciation (depreciation) | (23,435,459) | 23,791,522 |
Net increase (decrease) in net assets resulting
from operations | (3,655,934) | 37,153,413 |
Distributions to shareholders from net investment income | (4,160,313) | (4,120,600) |
Distributions to shareholders from net realized gain | (301,192) | (786,952) |
Total distributions | (4,461,505) | (4,907,552) |
Share transactions - net increase (decrease) | 20,511,129 | 23,938,130 |
Redemption fees | 1,150 | 3,144 |
Total increase (decrease) in net assets | 12,394,840 | 56,187,135 |
| | |
Net Assets | | |
Beginning of period | 195,665,271 | 139,478,136 |
End of period (including undistributed net investment income of $7,054,946 and undistributed net investment income of $3,680,675, respectively) | $ 208,060,111 | $ 195,665,271 |
See accompanying notes which are an integral part of the financial statements.
Annual Report
Financial Highlights - Class A
Years ended October 31, | 2014 | 2013 | 2012 | 2011 | 2010 |
Selected Per-Share Data | | | | | |
Net asset value, beginning of period | $ 8.96 | $ 7.39 | $ 7.02 | $ 8.22 | $ 7.75 |
Income from Investment Operations | | | | | |
Net investment income (loss) C | .31 I | .17 | .20 | .22 | .15 |
Net realized and unrealized gain (loss) | (.47) | 1.64 | .39 | (1.19) | .44 |
Total from investment operations | (.16) | 1.81 | .59 | (.97) | .59 |
Distributions from net investment income | (.17) | (.20) | (.22) | (.19) | (.11) |
Distributions from net realized gain | (.01) | (.04) | - | (.03) | (.01) |
Total distributions | (.18) | (.24) | (.22) | (.23) H | (.12) |
Redemption fees added to paid in capital C, G | - | - | - | - | - |
Net asset value, end of period | $ 8.62 | $ 8.96 | $ 7.39 | $ 7.02 | $ 8.22 |
Total Return A, B | (1.76)% | 25.24% | 8.82% | (12.19)% | 7.60% |
Ratios to Average Net Assets D, F | | | | | |
Expenses before reductions | 1.32% | 1.39% | 1.44% | 1.36% | 1.40% |
Expenses net of fee waivers, if any | 1.32% | 1.39% | 1.44% | 1.36% | 1.40% |
Expenses net of all reductions | 1.32% | 1.36% | 1.41% | 1.34% | 1.38% |
Net investment income (loss) | 3.44% I | 2.08% | 2.85% | 2.79% | 1.93% |
Supplemental Data | | | | | |
Net assets, end of period (000 omitted) | $ 6,296 | $ 6,191 | $ 4,491 | $ 4,668 | $ 4,699 |
Portfolio turnover rate E | 69% | 79% | 74% | 83% | 43% |
A Total returns would have been lower if certain expenses had not been reduced during the applicable periods shown.
B Total returns do not include the effect of the sales charges.
C Calculated based on average shares outstanding during the period.
D Fees and expenses of any underlying Fidelity Central Funds are not included in the Fund's expense ratio. The Fund indirectly bears its proportionate share of the expenses of any underlying Fidelity Central Funds.
E Amount does not include the portfolio activity of any underlying Fidelity Central Funds.
F Expense ratios reflect operating expenses of the class. Expenses before reductions do not reflect amounts reimbursed by the investment adviser or reductions from brokerage service arrangements or reductions from other expense offset arrangements and do not represent the amount paid by the class during periods when reimbursements or reductions occur. Expenses net of fee waivers reflect expenses after reimbursement by the investment adviser but prior to reductions from brokerage service arrangements or other expense offset arrangements. Expenses net of all reductions represent the net expenses paid by the class.
G Amount represents less than $.01 per share.
H Total distributions of $.23 per share is comprised of distributions from net investment income of $.191 and distributions from net realized gain of $.034 per share.
I Investment income per share reflects a large, non-recurring dividend which amounted to $.14 per share. Excluding this non-recurring dividend, the ratio of net investment income (loss) to average net assets would have been 1.90%.
See accompanying notes which are an integral part of the financial statements.
Annual Report
Financial Highlights - Class T
Years ended October 31, | 2014 | 2013 | 2012 | 2011 | 2010 |
Selected Per-Share Data | | | | | |
Net asset value, beginning of period | $ 8.94 | $ 7.38 | $ 7.00 | $ 8.20 | $ 7.73 |
Income from Investment Operations | | | | | |
Net investment income (loss) C | .28 I | .15 | .18 | .20 | .13 |
Net realized and unrealized gain (loss) | (.46) | 1.64 | .40 | (1.19) | .44 |
Total from investment operations | (.18) | 1.79 | .58 | (.99) | .57 |
Distributions from net investment income | (.15) | (.19) | (.20) | (.17) | (.09) |
Distributions from net realized gain | (.01) | (.04) | - | (.03) | (.01) |
Total distributions | (.16) | (.23) | (.20) | (.21) H | (.10) |
Redemption fees added to paid in capital C, G | - | - | - | - | - |
Net asset value, end of period | $ 8.60 | $ 8.94 | $ 7.38 | $ 7.00 | $ 8.20 |
Total Return A, B | (1.99)% | 24.86% | 8.60% | (12.42)% | 7.32% |
Ratios to Average Net Assets D, F | | | | | |
Expenses before reductions | 1.59% | 1.66% | 1.71% | 1.63% | 1.67% |
Expenses net of fee waivers, if any | 1.59% | 1.65% | 1.70% | 1.62% | 1.67% |
Expenses net of all reductions | 1.59% | 1.63% | 1.67% | 1.60% | 1.65% |
Net investment income (loss) | 3.17% I | 1.81% | 2.58% | 2.52% | 1.65% |
Supplemental Data | | | | | |
Net assets, end of period (000 omitted) | $ 3,604 | $ 3,758 | $ 2,693 | $ 2,468 | $ 2,276 |
Portfolio turnover rate E | 69% | 79% | 74% | 83% | 43% |
A Total returns would have been lower if certain expenses had not been reduced during the applicable periods shown.
B Total returns do not include the effect of the sales charges.
C Calculated based on average shares outstanding during the period.
D Fees and expenses of any underlying Fidelity Central Funds are not included in the Fund's expense ratio. The Fund indirectly bears its proportionate share of the expenses of any underlying Fidelity Central Funds.
E Amount does not include the portfolio activity of any underlying Fidelity Central Funds.
F Expense ratios reflect operating expenses of the class. Expenses before reductions do not reflect amounts reimbursed by the investment adviser or reductions from brokerage service arrangements or reductions from other expense offset arrangements and do not represent the amount paid by the class during periods when reimbursements or reductions occur. Expenses net of fee waivers reflect expenses after reimbursement by the investment adviser but prior to reductions from brokerage service arrangements or other expense offset arrangements. Expenses net of all reductions represent the net expenses paid by the class.
G Amount represents less than $.01 per share.
H Total distributions of $.21 per share is comprised of distributions from net investment income of $.173 and distributions from net realized gain of $.034 per share.
I Investment income per share reflects a large, non-recurring dividend which amounted to $.14 per share. Excluding this non-recurring dividend, the ratio of net investment income (loss) to average net assets would have been 1.64%.
See accompanying notes which are an integral part of the financial statements.
Annual Report
Financial Highlights - Class B
Years ended October 31, | 2014 | 2013 | 2012 | 2011 | 2010 |
Selected Per-Share Data | | | | | |
Net asset value, beginning of period | $ 8.98 | $ 7.39 | $ 7.00 | $ 8.20 | $ 7.74 |
Income from Investment Operations | | | | | |
Net investment income (loss) C | .24 J | .11 | .14 | .17 | .09 |
Net realized and unrealized gain (loss) | (.45) | 1.65 | .41 | (1.20) | .44 |
Total from investment operations | (.21) | 1.76 | .55 | (1.03) | .53 |
Distributions from net investment income | (.09) | (.13) | (.16) | (.13) | (.06) |
Distributions from net realized gain | (.01) | (.04) | - | (.03) | (.01) |
Total distributions | (.11) I | (.17) | (.16) | (.17) H | (.07) |
Redemption fees added to paid in capital C, G | - | - | - | - | - |
Net asset value, end of period | $ 8.66 | $ 8.98 | $ 7.39 | $ 7.00 | $ 8.20 |
Total Return A, B | (2.39)% | 24.30% | 8.07% | (12.88)% | 6.82% |
Ratios to Average Net Assets D, F | | | | | |
Expenses before reductions | 2.08% | 2.14% | 2.19% | 2.11% | 2.15% |
Expenses net of fee waivers, if any | 2.08% | 2.14% | 2.19% | 2.11% | 2.15% |
Expenses net of all reductions | 2.08% | 2.11% | 2.16% | 2.09% | 2.13% |
Net investment income (loss) | 2.68% J | 1.32% | 2.09% | 2.04% | 1.18% |
Supplemental Data | | | | | |
Net assets, end of period (000 omitted) | $ 414 | $ 678 | $ 691 | $ 901 | $ 1,216 |
Portfolio turnover rate E | 69% | 79% | 74% | 83% | 43% |
A Total returns would have been lower if certain expenses had not been reduced during the applicable periods shown.
B Total returns do not include the effect of the contingent deferred sales charge.
C Calculated based on average shares outstanding during the period.
D Fees and expenses of any underlying Fidelity Central Funds are not included in the Fund's expense ratio. The Fund indirectly bears its proportionate share of the expenses of any underlying Fidelity Central Funds.
E Amount does not include the portfolio activity of any underlying Fidelity Central Funds.
F Expense ratios reflect operating expenses of the class. Expenses before reductions do not reflect amounts reimbursed by the investment adviser or reductions from brokerage service arrangements or reductions from other expense offset arrangements and do not represent the amount paid by the class during periods when reimbursements or reductions occur. Expenses net of fee waivers reflect expenses after reimbursement by the investment adviser but prior to reductions from brokerage service arrangements or other expense offset arrangements. Expenses net of all reductions represent the net expenses paid by the class.
G Amount represents less than $.01 per share.
H Total distributions of $.17 per share is comprised of distributions from net investment income of $.131 and distributions from net realized gain of $.034 per share.
I Total distributions of $.11 per share is comprised of distributions from net investment income of $.093 and distributions from net realized gain of $.014 per share.
J Investment income per share reflects a large, non-recurring dividend which amounted to $.14 per share. Excluding this non-recurring dividend, the ratio of net investment income (loss) to average net assets would have been 1.15%.
See accompanying notes which are an integral part of the financial statements.
Annual Report
Financial Highlights - Class C
Years ended October 31, | 2014 | 2013 | 2012 | 2011 | 2010 |
Selected Per-Share Data | | | | | |
Net asset value, beginning of period | $ 8.93 | $ 7.38 | $ 7.00 | $ 8.20 | $ 7.73 |
Income from Investment Operations | | | | | |
Net investment income (loss) C | .24 I | .11 | .14 | .16 | .09 |
Net realized and unrealized gain (loss) | (.45) | 1.63 | .41 | (1.19) | .44 |
Total from investment operations | (.21) | 1.74 | .55 | (1.03) | .53 |
Distributions from net investment income | (.11) | (.15) | (.17) | (.14) | (.05) |
Distributions from net realized gain | (.01) | (.04) | - | (.03) | (.01) |
Total distributions | (.13) H | (.19) | (.17) | (.17) | (.06) |
Redemption fees added to paid in capital C, G | - | - | - | - | - |
Net asset value, end of period | $ 8.59 | $ 8.93 | $ 7.38 | $ 7.00 | $ 8.20 |
Total Return A, B | (2.43)% | 24.17% | 8.12% | (12.84)% | 6.84% |
Ratios to Average Net Assets D, F | | | | | |
Expenses before reductions | 2.07% | 2.14% | 2.19% | 2.12% | 2.15% |
Expenses net of fee waivers, if any | 2.07% | 2.14% | 2.19% | 2.11% | 2.15% |
Expenses net of all reductions | 2.07% | 2.11% | 2.16% | 2.09% | 2.13% |
Net investment income (loss) | 2.69% I | 1.33% | 2.09% | 2.04% | 1.18% |
Supplemental Data | | | | | |
Net assets, end of period (000 omitted) | $ 3,647 | $ 3,231 | $ 2,249 | $ 2,108 | $ 2,123 |
Portfolio turnover rate E | 69% | 79% | 74% | 83% | 43% |
A Total returns would have been lower if certain expenses had not been reduced during the applicable periods shown.
B Total returns do not include the effect of the contingent deferred sales charge.
C Calculated based on average shares outstanding during the period.
D Fees and expenses of any underlying Fidelity Central Funds are not included in the Fund's expense ratio. The Fund indirectly bears its proportionate share of the expenses of any underlying Fidelity Central Funds.
E Amount does not include the portfolio activity of any underlying Fidelity Central Funds.
F Expense ratios reflect operating expenses of the class. Expenses before reductions do not reflect amounts reimbursed by the investment adviser or reductions from brokerage service arrangements or reductions from other expense offset arrangements and do not represent the amount paid by the class during periods when reimbursements or reductions occur. Expenses net of fee waivers reflect expenses after reimbursement by the investment adviser but prior to reductions from brokerage service arrangements or other expense offset arrangements. Expenses net of all reductions represent the net expenses paid by the class.
G Amount represents less than $.01 per share.
H Total distributions of $.13 per share is comprised of distributions from net investment income of $.111 and distributions from net realized gain of $.014 per share.
I Investment income per share reflects a large, non-recurring dividend which amounted to $.14 per share. Excluding this non-recurring dividend, the ratio of net investment income (loss) to average net assets would have been 1.15%.
See accompanying notes which are an integral part of the financial statements.
Annual Report
Financial Highlights - International Value
Years ended October 31, | 2014 | 2013 | 2012 | 2011 | 2010 |
Selected Per-Share Data | | | | | |
Net asset value, beginning of period | $ 8.97 | $ 7.40 | $ 7.03 | $ 8.23 | $ 7.75 |
Income from Investment Operations | | | | | |
Net investment income (loss) B | .34 I | .19 | .22 | .25 | .17 |
Net realized and unrealized gain (loss) | (.46) | 1.65 | .40 | (1.20) | .44 |
Total from investment operations | (.12) | 1.84 | .62 | (.95) | .61 |
Distributions from net investment income | (.20) | (.22) | (.25) | (.22) | (.13) |
Distributions from net realized gain | (.01) | (.04) | - | (.03) | (.01) |
Total distributions | (.21) | (.27) H | (.25) | (.25) | (.13) G |
Redemption fees added to paid in capital B, F | - | - | - | - | - |
Net asset value, end of period | $ 8.64 | $ 8.97 | $ 7.40 | $ 7.03 | $ 8.23 |
Total Return A | (1.34)% | 25.57% | 9.19% | (11.91)% | 7.95% |
Ratios to Average Net Assets C, E | | | | | |
Expenses before reductions | .96% | 1.05% | 1.13% | 1.04% | 1.09% |
Expenses net of fee waivers, if any | .96% | 1.05% | 1.13% | 1.03% | 1.09% |
Expenses net of all reductions | .95% | 1.02% | 1.10% | 1.01% | 1.08% |
Net investment income (loss) | 3.80% I | 2.41% | 3.16% | 3.11% | 2.23% |
Supplemental Data | | | | | |
Net assets, end of period (000 omitted) | $ 192,789 | $ 181,568 | $ 128,983 | $ 150,967 | $ 163,090 |
Portfolio turnover rate D | 69% | 79% | 74% | 83% | 43% |
A Total returns would have been lower if certain expenses had not been reduced during the applicable periods shown.
B Calculated based on average shares outstanding during the period.
C Fees and expenses of any underlying Fidelity Central Funds are not included in the Fund's expense ratio. The Fund indirectly bears its proportionate share of the expenses of any underlying Fidelity Central Funds.
D Amount does not include the portfolio activity of any underlying Fidelity Central Funds.
E Expense ratios reflect operating expenses of the class. Expenses before reductions do not reflect amounts reimbursed by the investment adviser or reductions from brokerage service arrangements or reductions from other expense offset arrangements and do not represent the amount paid by the class during periods when reimbursements or reductions occur. Expenses net of fee waivers reflect expenses after reimbursement by the investment adviser but prior to reductions from brokerage service arrangements or other expense offset arrangements. Expenses net of all reductions represent the net expenses paid by the class.
F Amount represents less than $.01 per share.
G Total distributions of $.13 per share is comprised of distributions from net investment income of $.129 and distributions from net realized gain of $.005 per share.
H Total distributions of $.27 per share is comprised of distributions from net investment income of $.223 and distributions from net realized gain of $.042 per share.
I Investment income per share reflects a large, non-recurring dividend which amounted to $.14 per share. Excluding this non-recurring dividend, the ratio of net investment income (loss) to average net assets would have been 2.27%.
See accompanying notes which are an integral part of the financial statements.
Annual Report
Financial Highlights - Institutional Class
Years ended October 31, | 2014 | 2013 | 2012 | 2011 | 2010 |
Selected Per-Share Data | | | | | |
Net asset value, beginning of period | $ 8.98 | $ 7.41 | $ 7.04 | $ 8.24 | $ 7.76 |
Income from Investment Operations | | | | | |
Net investment income (loss) B | .33 J | .19 | .22 | .25 | .18 |
Net realized and unrealized gain (loss) | (.45) | 1.65 | .40 | (1.19) | .44 |
Total from investment operations | (.12) | 1.84 | .62 | (.94) | .62 |
Distributions from net investment income | (.19) | (.23) | (.25) | (.22) | (.14) |
Distributions from net realized gain | (.01) | (.04) | - | (.03) | (.01) |
Total distributions | (.21) I | (.27) | (.25) | (.26) H | (.14) G |
Redemption fees added to paid in capital B, F | - | - | - | - | - |
Net asset value, end of period | $ 8.65 | $ 8.98 | $ 7.41 | $ 7.04 | $ 8.24 |
Total Return A | (1.41)% | 25.64% | 9.22% | (11.83)% | 8.05% |
Ratios to Average Net Assets C, E | | | | | |
Expenses before reductions | 1.05% | 1.07% | 1.10% | .98% | .98% |
Expenses net of fee waivers, if any | 1.05% | 1.07% | 1.10% | .98% | .98% |
Expenses net of all reductions | 1.04% | 1.04% | 1.07% | .96% | .97% |
Net investment income (loss) | 3.71% J | 2.39% | 3.18% | 3.17% | 2.34% |
Supplemental Data | | | | | |
Net assets, end of period (000 omitted) | $ 1,310 | $ 239 | $ 372 | $ 473 | $ 519 |
Portfolio turnover rate D | 69% | 79% | 74% | 83% | 43% |
A Total returns would have been lower if certain expenses had not been reduced during the applicable periods shown.
B Calculated based on average shares outstanding during the period.
C Fees and expenses of any underlying Fidelity Central Funds are not included in the Fund's expense ratio. The Fund indirectly bears its proportionate share of the expenses of any underlying Fidelity Central Funds.
D Amount does not include the portfolio activity of any underlying Fidelity Central Funds.
E Expense ratios reflect operating expenses of the class. Expenses before reductions do not reflect amounts reimbursed by the investment adviser or reductions from brokerage service arrangements or reductions from other expense offset arrangements and do not represent the amount paid by the class during periods when reimbursements or reductions occur. Expenses net of fee waivers reflect expenses after reimbursement by the investment adviser but prior to reductions from brokerage service arrangements or other expense offset arrangements. Expenses net of all reductions represent the net expenses paid by the class.
F Amount represents less than $.01 per share.
G Total distributions of $.14 per share is comprised of distributions from net investment income of $.137 and distributions from net realized gain of $.005 per share.
H Total distributions of $.26 per share is comprised of distributions from net investment income of $.221 and distributions from net realized gain of $.034 per share.
I Total distributions of $.21 per share is comprised of distributions from net investment income of $.191 and distributions from net realized gain of $.014 per share.
J Investment income per share reflects a large, non-recurring dividend which amounted to $.14 per share. Excluding this non-recurring dividend, the ratio of net investment income (loss) to average net assets would have been 2.18%.
See accompanying notes which are an integral part of the financial statements.
Annual Report
Notes to Financial Statements
For the period ended October 31, 2014
1. Organization.
Fidelity International Value Fund (the Fund) is a fund of Fidelity Investment Trust (the Trust) and is authorized to issue an unlimited number of shares. The Trust is registered under the Investment Company Act of 1940, as amended (the 1940 Act), as an open-end management investment company organized as a Massachusetts business trust. The Fund offers Class A, Class T, Class C, International Value and Institutional Class shares, each of which, along with Class B shares, has equal rights as to assets and voting privileges. Class B shares are closed to new accounts and additional purchases, except for exchanges and reinvestments. Each class has exclusive voting rights with respect to matters that affect that class. Class B shares will automatically convert to Class A shares after a holding period of seven years from the initial date of purchase.
2. Investments in Fidelity Central Funds.
The Fund invests in Fidelity Central Funds, which are open-end investment companies generally available only to other investment companies and accounts managed by the investment adviser and its affiliates. The Fund's Schedule of Investments lists each of the Fidelity Central Funds held as of period end, if any, as an investment of the Fund, but does not include the underlying holdings of each Fidelity Central Fund. As an Investing Fund, the Fund indirectly bears its proportionate share of the expenses of the underlying Fidelity Central Funds.
The Money Market Central Funds seek preservation of capital and current income and are managed by Fidelity Investments Money Management, Inc. (FIMM), an affiliate of the investment adviser. Annualized expenses of the Money Market Central Funds as of their most recent shareholder report date are less than .01%.
A complete unaudited list of holdings for each Fidelity Central Fund is available upon request or at the Securities and Exchange Commission (the SEC) website at www.sec.gov. In addition, the financial statements of the Fidelity Central Funds, which are not covered by the Fund's Report of Independent Registered Public Accounting Firm, are available on the SEC website or upon request.
3. Significant Accounting Policies.
The financial statements have been prepared in conformity with accounting principles generally accepted in the United States of America (GAAP), which require management to make certain estimates and assumptions at the date of the financial statements. Actual results could differ from those estimates. Subsequent events, if any, through the date that the financial statements were issued have been evaluated in the preparation of
Annual Report
Notes to Financial Statements - continued
3. Significant Accounting Policies - continued
the financial statements. The following summarizes the significant accounting policies of the Fund:
Investment Valuation. Investments are valued as of 4:00 p.m. Eastern time on the last calendar day of the period. In accordance with valuation policies and procedures approved by the Board of Trustees (the Board), the Fund attempts to obtain prices from one or more third party pricing vendors or brokers to value its investments. When current market prices, quotations or currency exchange rates are not readily available or reliable, investments will be fair valued in good faith by the Fidelity Management & Research Company (FMR) Fair Value Committee (the Committee), in accordance with procedures adopted by the Board. Factors used in determining fair value vary by investment type and may include market or investment specific events. The frequency with which these procedures are used cannot be predicted and they may be utilized to a significant extent. The Committee oversees the Fund's valuation policies and procedures and is responsible for approving and reporting to the Board all fair value determinations.
The Fund categorizes the inputs to valuation techniques used to value its investments into a disclosure hierarchy consisting of three levels as shown below:
Level 1 - quoted prices in active markets for identical investments
Level 2 - other significant observable inputs (including quoted prices for similar investments, interest rates, prepayment speeds, etc.)
Level 3 - unobservable inputs (including the Fund's own assumptions based on the best information available)
Valuation techniques used to value the Fund's investments by major category are as follows:
Equity securities, including restricted securities, for which market quotations are readily available, are valued at the last reported sale price or official closing price as reported by a third party pricing vendor on the primary market or exchange on which they are traded and are categorized as Level 1 in the hierarchy. In the event there were no sales during the day or closing prices are not available, securities are valued at the last quoted bid price or may be valued using the last available price and are generally categorized as Level 2 in the hierarchy. For foreign equity securities, when market or security specific events arise, comparisons to the valuation of American Depositary Receipts (ADRs), futures contracts, Exchange-Traded Funds (ETFs) and certain indexes as well as quoted prices for similar securities may be used and would be categorized as Level 2 in the hierarchy. Utilizing these techniques may result in transfers between Level 1 and Level 2. For equity securities, including restricted securities, where observable inputs are
Annual Report
3. Significant Accounting Policies - continued
Investment Valuation - continued
limited, assumptions about market activity and risk are used and these securities may be categorized as Level 3 in the hierarchy.
The U.S. dollar value of foreign currency contracts is determined using currency exchange rates supplied by a pricing service and are categorized as Level 2 in the hierarchy. Investments in open-end mutual funds, including the Fidelity Central Funds, are valued at their closing net asset value (NAV) each business day and are categorized as Level 1 in the hierarchy.
Changes in valuation techniques may result in transfers in or out of an assigned level within the disclosure hierarchy. The aggregate value of investments by input level, as of October 31, 2014, including information on transfers between Levels 1 and 2, is included at the end of the Fund's Schedule of Investments.
Foreign Currency. The Fund may use foreign currency contracts to facilitate transactions in foreign-denominated securities. Gains and losses from these transactions may arise from changes in the value of the foreign currency or if the counterparties do not perform under the contracts' terms.
Foreign-denominated assets, including investment securities, and liabilities are translated into U.S. dollars at the exchange rates at period end. Purchases and sales of investment securities, income and dividends received and expenses denominated in foreign currencies are translated into U.S. dollars at the exchange rate in effect on the transaction date.
The effects of exchange rate fluctuations on investments are included with the net realized and unrealized gain (loss) on investment securities. Other foreign currency transactions resulting in realized and unrealized gain (loss) are disclosed separately.
Investment Transactions and Income. For financial reporting purposes, the Fund's investment holdings and NAV include trades executed through the end of the last business day of the period. The NAV per share for processing shareholder transactions is calculated as of the close of business of the New York Stock Exchange (NYSE), normally 4:00 p.m. Eastern time and includes trades executed through the end of the prior business day. Gains and losses on securities sold are determined on the basis of identified cost and may include proceeds received from litigation. Dividend income is recorded on the ex-dividend date, except for certain dividends from foreign securities where the ex-dividend date may have passed, which are recorded as soon as the Fund is informed of the ex-dividend date. Non-cash dividends included in dividend income, if any, are recorded at the fair market value of the securities received. Income and capital gain distributions from Fidelity Central Funds, if any, are recorded on the ex-dividend date.
Annual Report
Notes to Financial Statements - continued
3. Significant Accounting Policies - continued
Investment Transactions and Income - continued
Large, non-recurring dividends recognized by the Fund are presented separately on the Statement of Operations as "Special Dividends" and the impact of these dividends is presented in the Financial Highlights. Investment income is recorded net of foreign taxes withheld where recovery of such taxes is uncertain.
Class Allocations and Expenses. Investment income, realized and unrealized capital gains and losses, common expenses of the Fund, and certain fund-level expense reductions, if any, are allocated daily on a pro-rata basis to each class based on the relative net assets of each class to the total net assets of the Fund. Each class differs with respect to transfer agent and distribution and service plan fees incurred. Certain expense reductions may also differ by class. For the reporting period, the allocated portion of income and expenses to each class as a percent of its average net assets may vary due to the timing of recording these transactions in relation to fluctuating net assets of the classes. Expenses directly attributable to a fund are charged to that fund. Expenses attributable to more than one fund are allocated among the respective funds on the basis of relative net assets or other appropriate methods. Expense estimates are accrued in the period to which they relate and adjustments are made when actual amounts are known.
Income Tax Information and Distributions to Shareholders. Each year, the Fund intends to qualify as a regulated investment company under Subchapter M of the Internal Revenue Code, including distributing substantially all of its taxable income and realized gains. As a result, no provision for U.S. Federal income taxes is required. As of October 31, 2014, the Fund did not have any unrecognized tax benefits in the financial statements; nor is the Fund aware of any tax positions for which it is reasonably possible that the total amounts of unrecognized tax benefits will significantly change in the next twelve months. The Fund files a U.S. federal tax return, in addition to state and local tax returns as required. The Fund's federal income tax returns are subject to examination by the Internal Revenue Service (IRS) for a period of three fiscal years after they are filed. State and local tax returns may be subject to examination for an additional fiscal year depending on the jurisdiction. Foreign taxes are provided for based on the Fund's understanding of the tax rules and rates that exist in the foreign markets in which it invests.
Distributions are declared and recorded on the ex-dividend date. Income dividends and capital gain distributions are declared separately for each class. Income and capital gain distributions are determined in accordance with income tax regulations, which may differ from GAAP.
Capital accounts within the financial statements are adjusted for permanent book-tax differences. These adjustments have no impact on net assets or the results of operations.
Annual Report
3. Significant Accounting Policies - continued
Income Tax Information and Distributions to Shareholders - continued
Capital accounts are not adjusted for temporary book-tax differences which will reverse in a subsequent period.
Book-tax differences are primarily due to foreign currency transactions, passive foreign investment companies (PFIC), capital loss carryforwards and losses deferred due to wash sales.
The federal tax cost of investment securities and unrealized appreciation (depreciation) as of period end were as follows:
Gross unrealized appreciation | $ 15,866,348 |
Gross unrealized depreciation | (15,294,421) |
Net unrealized appreciation (depreciation) on securities | $ 571,927 |
| |
Tax Cost | $ 210,048,200 |
The tax-based components of distributable earnings as of period end were as follows:
Undistributed ordinary income | $ 7,055,942 |
Capital loss carryforward | $ (102,980,501) |
Net unrealized appreciation (depreciation) on securities and other investments | $ 546,172 |
Capital loss carryforwards are only available to offset future capital gains of the Fund to the extent provided by regulations and may be limited. Under the Regulated Investment Company Modernization Act of 2010 (the Act), the Fund is permitted to carry forward capital losses incurred in taxable years beginning after December 22, 2010 for an unlimited period and such capital losses are required to be used prior to any losses that expire. The capital loss carryforward information presented below, including any applicable limitation, is estimated as of fiscal period end and is subject to adjustment.
Fiscal year of expiration | |
2016 | $ (2,663,413) |
2017 | (65,376,972) |
2018 | (3,571,319) |
2019 | (31,368,797) |
Total capital loss carryforward | $ (102,980,501) |
The tax character of distributions paid was as follows:
| October 31, 2014 | October 31, 2013 |
Ordinary Income | $ 4,461,505 | $ 4,907,552 |
Annual Report
Notes to Financial Statements - continued
3. Significant Accounting Policies - continued
Short-Term Trading (Redemption) Fees. Shares held by investors in the Fund less than 30 days may have been subject to a redemption fee equal to 1.00% of the NAV of shares redeemed. All redemption fees, which reduce the proceeds of the shareholder redemption, are retained by the Fund and accounted for as an addition to paid in capital.
New Accounting Pronouncement. In June 2014, the Financial Accounting Standards Board issued Accounting Standard Update No. 2014-11, Repurchase-to-Maturity Transactions, Repurchase Financings, and Disclosures. The Update amends the accounting for certain repurchase agreements and expands disclosure requirements for reverse repurchase agreements, securities lending and other similar transactions. The disclosure requirements are effective for annual and interim reporting periods beginning after December 15, 2014. Management is currently evaluating the impact of the Update on the Fund's financial statements and related disclosures.
4. Purchases and Sales of Investments.
Purchases and sales of securities, other than short-term securities, aggregated $163,988,914 and $139,217,160, respectively.
5. Fees and Other Transactions with Affiliates.
Management Fee. Fidelity Management & Research Company (the investment adviser) and its affiliates provide the Fund with investment management related services for which the Fund pays a monthly management fee. The management fee is the sum of an individual fund fee rate that is based on an annual rate of .45% of the Fund's average net assets and an annualized group fee rate that averaged .25% during the period. The group fee rate is based upon the average net assets of all the mutual funds advised by the investment adviser, including any mutual funds previously advised by the investment adviser that are currently advised by Fidelity SelectCo, LLC, an affiliate of the investment adviser. The group fee rate decreases as assets under management increase and increases as assets under management decrease. In addition, the management fee is subject to a performance adjustment (up to a maximum of ± .20% of the Fund's average net assets over a 36 month performance period). The upward or downward adjustment to the management fee is based on the relative investment performance of International Value as compared to its benchmark index, the MSCI EAFE Value Index, over the same 36 month performance period. For the reporting period, the total annual management fee rate, including the performance adjustment, was .60% of the Fund's average net assets. The performance adjustment included in the management fee rate may be higher or lower than the maximum performance adjustment rate due to the difference between the average net assets for the reporting and performance periods.
Annual Report
5. Fees and Other Transactions with Affiliates - continued
Distribution and Service Plan Fees. In accordance with Rule 12b-1 of the 1940 Act, the Fund has adopted separate Distribution and Service Plans for each class of shares. Certain classes pay Fidelity Distributors Corporation (FDC), an affiliate of the investment adviser, separate Distribution and Service Fees, each of which is based on an annual percentage of each class' average net assets. In addition, FDC may pay financial intermediaries for selling shares of the Fund and providing shareholder support services.
For the period, the Distribution and Service Fee rates, total fees and amounts retained by FDC were as follows:
| Distribution
Fee | Service
Fee | Total Fees | Retained
by FDC |
Class A | -% | .25% | $ 16,198 | $ 317 |
Class T | .25% | .25% | 19,035 | - |
Class B | .75% | .25% | 5,831 | 4,374 |
Class C | .75% | .25% | 35,515 | 6,658 |
| | | $ 76,579 | $ 11,349 |
Sales Load. FDC may receive a front-end sales charge of up to 5.75% for selling Class A shares and 3.50% for selling Class T shares, some of which is paid to financial intermediaries for selling shares of the Fund. Depending on the holding period, FDC may receive contingent deferred sales charges levied on Class A, Class T, Class B, and Class C redemptions. The deferred sales charges range from 5.00% to 1.00% for Class B shares, 1.00% for Class C shares, 1.00% for certain purchases of Class A shares and .25% for certain purchases of Class T shares.
For the period, sales charge amounts retained by FDC were as follows:
| Retained
by FDC |
Class A | $ 6,050 |
Class T | 936 |
Class B* | 1,390 |
Class C* | 794 |
| $ 9,170 |
* When Class B and Class C shares are initially sold, FDC pays commissions from its own resources to financial intermediaries through which the sales are made.
Transfer Agent Fees. Fidelity Investments Institutional Operations Company, Inc., (FIIOC), an affiliate of the investment adviser, is the transfer, dividend disbursing and shareholder servicing agent for each class of the Fund. FIIOC receives account fees and asset-based fees that vary according to the account size and type of account of the shareholders of the respective classes of the Fund. FIIOC pays for typesetting, printing and mailing of shareholder reports, except proxy statements.
Annual Report
Notes to Financial Statements - continued
5. Fees and Other Transactions with Affiliates - continued
Transfer Agent Fees - continued
For the period, transfer agent fees for each class were as follows:
| Amount | % of
Class-Level Average
Net Assets |
Class A | $ 19,698 | .30 |
Class T | 12,131 | .32 |
Class B | 1,781 | .31 |
Class C | 10,841 | .30 |
International Value | 356,047 | .19 |
Institutional Class | 2,019 | .28 |
| $ 402,517 | |
Accounting and Security Lending Fees. Fidelity Service Company, Inc. (FSC), an affiliate of the investment adviser, maintains the Fund's accounting records. The accounting fee is based on the level of average net assets for each month. Under a separate contract, FSC administers the security lending program. The security lending fee is based on the number and duration of lending transactions.
Brokerage Commissions. The Fund placed a portion of its portfolio transactions with brokerage firms which are affiliates of the investment adviser. Brokerage commissions are included in net realized gain (loss) and change in net unrealized appreciation (depreciation) in the Statement of Operations. The commissions paid to these affiliated firms were $237 for the period.
Other. During the period, the investment adviser reimbursed the Fund for certain losses in the amount of $1,417.
6. Committed Line of Credit.
The Fund participates with other funds managed by the investment adviser or an affiliate in a $4.25 billion credit facility (the "line of credit") to be utilized for temporary or emergency purposes to fund shareholder redemptions or for other short-term liquidity purposes. The Fund has agreed to pay commitment fees on its pro-rata portion of the line of credit, which amounted to $328 and is reflected in Miscellaneous expenses on the Statement of Operations. During the period, the Fund did not borrow on this line of credit.
7. Security Lending.
The Fund lends portfolio securities through a lending agent from time to time in order to earn additional income. For equity securities, a lending agent is used and may loan securities to certain qualified borrowers, including Fidelity Capital Markets (FCM), a broker-dealer affiliated with the Fund. On the settlement date of the loan, the Fund receives collateral (in the form of U.S. Treasury obligations, letters of credit and/or cash)
Annual Report
7. Security Lending - continued
against the loaned securities and maintains collateral in an amount not less than 100% of the market value of the loaned securities during the period of the loan. The market value of the loaned securities is determined at the close of business of the Fund and any additional required collateral is delivered to the Fund on the next business day. If the borrower defaults on its obligation to return the securities loaned because of insolvency or other reasons, the Fund may apply collateral received from the borrower against the obligation. The Fund may experience delays and costs in recovering the securities loaned. Any cash collateral received is invested in the Fidelity Securities Lending Cash Central Fund. The value of loaned securities and cash collateral at period end are disclosed on the Fund's Statement of Assets and Liabilities. Security lending income represents the income earned on investing cash collateral, less rebates paid to borrowers and any lending agent fees associated with the loan, plus any premium payments received for lending certain types of securities. Security lending income is presented in the Statement of Operations as a component of income from Fidelity Central Funds. Total security lending income during the period amounted to $161,924. During the period, there were no securities loaned to FCM.
8. Expense Reductions.
Commissions paid to certain brokers with whom the investment adviser, or its affiliates, places trades on behalf of the Fund include an amount in addition to trade execution, which may be rebated back to the Fund to offset certain expenses. This amount totaled $3,923 for the period. In addition, through arrangements with the Fund's custodian, credits realized as a result of uninvested cash balances were used to reduce the Fund's expenses. During the period, these credits reduced the Fund's custody expenses by $5.
In addition, the investment adviser reimbursed a portion of the Fund's operating expenses during the period in the amount of $193.
9. Distributions to Shareholders.
Distributions to shareholders of each class were as follows:
Years ended October 31, | 2014 | 2013 |
From net investment income | | |
Class A | $ 117,558 | $ 121,166 |
Class T | 63,542 | 67,016 |
Class B | 6,919 | 11,860 |
Class C | 40,539 | 47,865 |
International Value | 3,926,459 | 3,862,005 |
Institutional Class | 5,296 | 10,688 |
Total | $ 4,160,313 | $ 4,120,600 |
Annual Report
Notes to Financial Statements - continued
9. Distributions to Shareholders - continued
Years ended October 31, | 2014 | 2013 |
From net realized gain | | |
Class A | $ 9,681 | $ 25,318 |
Class T | 5,931 | 15,214 |
Class B | 1,042 | 3,861 |
Class C | 5,113 | 13,226 |
International Value | 279,037 | 727,373 |
Institutional Class | 388 | 1,960 |
Total | $ 301,192 | $ 786,952 |
10. Share Transactions.
Share transactions for each class were as follows and may contain automatic conversions between classes or exchanges between funds:
| Shares | Shares | Dollars | Dollars |
Years ended October 31, | 2014 | 2013 | 2014 | 2013 |
Class A | | | | |
Shares sold | 271,659 | 221,312 | $ 2,416,438 | $ 1,773,149 |
Reinvestment of distributions | 12,904 | 17,344 | 112,525 | 128,001 |
Shares redeemed | (245,285) | (155,517) | (2,196,440) | (1,235,132) |
Net increase (decrease) | 39,278 | 83,139 | $ 332,523 | $ 666,018 |
Class T | | | | |
Shares sold | 79,778 | 91,084 | $ 709,484 | $ 741,140 |
Reinvestment of distributions | 7,900 | 11,018 | 68,891 | 81,425 |
Shares redeemed | (88,989) | (46,826) | (796,094) | (371,734) |
Net increase (decrease) | (1,311) | 55,276 | $ (17,719) | $ 450,831 |
Class B | | | | |
Shares sold | 1,662 | 6,334 | $ 15,295 | $ 51,789 |
Reinvestment of distributions | 756 | 1,746 | 6,661 | 13,011 |
Shares redeemed | (30,069) | (26,098) | (270,154) | (212,223) |
Net increase (decrease) | (27,651) | (18,018) | $ (248,198) | $ (147,423) |
Class C | | | | |
Shares sold | 107,427 | 93,011 | $ 961,012 | $ 748,735 |
Reinvestment of distributions | 4,784 | 7,487 | 41,813 | 55,475 |
Shares redeemed | (49,408) | (43,711) | (437,003) | (352,531) |
Net increase (decrease) | 62,803 | 56,787 | $ 565,822 | $ 451,679 |
International Value | | | | |
Shares sold | 5,177,049 | 6,308,136 | $ 46,484,243 | $ 51,241,221 |
Reinvestment of distributions | 470,965 | 602,705 | 4,097,400 | 4,441,937 |
Shares redeemed | (3,570,903) | (4,113,021) | (31,830,840) | (32,981,230) |
Net increase (decrease) | 2,077,111 | 2,797,820 | $ 18,750,803 | $ 22,701,928 |
Annual Report
10. Share Transactions - continued
| Shares | Shares | Dollars | Dollars |
Years ended October 31, | 2014 | 2013 | 2014 | 2013 |
Institutional Class | | | | |
Shares sold | 140,760 | 6,984 | $ 1,271,347 | $ 56,532 |
Reinvestment of distributions | 394 | 1,136 | 3,438 | 8,383 |
Shares redeemed | (16,367) | (31,601) | (146,887) | (249,818) |
Net increase (decrease) | 124,787 | (23,481) | $ 1,127,898 | $ (184,903) |
11. Other.
The Fund's organizational documents provide former and current trustees and officers with a limited indemnification against liabilities arising in connection with the performance of their duties to the Fund. In the normal course of business, the Fund may also enter into contracts that provide general indemnifications. The Fund's maximum exposure under these arrangements is unknown as this would be dependent on future claims that may be made against the Fund. The risk of material loss from such claims is considered remote.
At the end of the period, Strategic Advisers International II Fund and VIP FundsManager 60% Portfolio were the owners of record of approximately 35% and 11%, respectively, of the total outstanding shares of the Fund.
Mutual funds managed by the investment adviser or its affiliates were the owners of record, in the aggregate, of approximately 52% of the total outstanding shares of the Fund.
Annual Report
To the Trustees of Fidelity Investment Trust and Shareholders of Fidelity International Value Fund:
We have audited the accompanying statement of assets and liabilities of Fidelity International Value Fund (the Fund), a fund of Fidelity Investment Trust, including the schedule of investments, as of October 31, 2014, and the related statement of operations for the year then ended, the statement of changes in net assets for each of the two years in the period then ended, and the financial highlights for each of the five years in the period then ended. These financial statements and financial highlights are the responsibility of the Fund's management. Our responsibility is to express an opinion on these financial statements and financial highlights based on our audits.
We conducted our audits in accordance with the standards of the Public Company Accounting Oversight Board (United States). Those standards require that we plan and perform the audit to obtain reasonable assurance about whether the financial statements and financial highlights are free of material misstatement. The Fund is not required to have, nor were we engaged to perform, an audit of its internal control over financial reporting. Our audits included consideration of internal control over financial reporting as a basis for designing audit procedures that are appropriate in the circumstances, but not for the purpose of expressing an opinion on the effectiveness of the Fund's internal control over financial reporting. Accordingly, we express no such opinion. An audit also includes examining, on a test basis, evidence supporting the amounts and disclosures in the financial statements, assessing the accounting principles used and significant estimates made by management, as well as evaluating the overall financial statement presentation. Our procedures included confirmation of securities owned as of October 31, 2014, by correspondence with the custodians and brokers; where replies were not received from brokers, we performed other auditing procedures. We believe that our audits provide a reasonable basis for our opinion.
In our opinion, the financial statements and financial highlights referred to above present fairly, in all material respects, the financial position of Fidelity International Value Fund as of October 31, 2014, the results of its operations for the year then ended, the changes in its net assets for each of the two years in the period then ended, and the financial highlights for each of the five years in the period then ended, in conformity with accounting principles generally accepted in the United States of America.
DELOITTE & TOUCHE LLP
Boston, Massachusetts
December 17, 2014
Annual Report
The Trustees, Member of the Advisory Board, and officers of the trust and fund, as applicable, are listed below. The Board of Trustees governs the fund and is responsible for protecting the interests of shareholders. The Trustees are experienced executives who meet periodically throughout the year to oversee the fund's activities, review contractual arrangements with companies that provide services to the fund, oversee management of the risks associated with such activities and contractual arrangements, and review the fund's performance. Except for James C. Curvey, each of the Trustees oversees 174 funds. Mr. Curvey oversees 407 funds.
The Trustees hold office without limit in time except that (a) any Trustee may resign; (b) any Trustee may be removed by written instrument, signed by at least two-thirds of the number of Trustees prior to such removal; (c) any Trustee who requests to be retired or who has become incapacitated by illness or injury may be retired by written instrument signed by a majority of the other Trustees; and (d) any Trustee may be removed at any special meeting of shareholders by a two-thirds vote of the outstanding voting securities of the trust. Each Trustee who is not an interested person (as defined in the 1940 Act) of the trust and the fund (Independent Trustee), shall retire not later than the last day of the calendar year in which his or her 75th birthday occurs. The Independent Trustees may waive this mandatory retirement age policy with respect to individual Trustees. The officers and Advisory Board Member hold office without limit in time, except that any officer and Advisory Board Member may resign or may be removed by a vote of a majority of the Trustees at any regular meeting or any special meeting of the Trustees. Except as indicated, each individual has held the office shown or other offices in the same company for the past five years.
Experience, Skills, Attributes, and Qualifications of the Fund's Trustees. The Governance and Nominating Committee has adopted a statement of policy that describes the experience, qualifications, attributes, and skills that are necessary and desirable for potential Independent Trustee candidates (Statement of Policy). The Board believes that each Trustee satisfied at the time he or she was initially elected or appointed a Trustee, and continues to satisfy, the standards contemplated by the Statement of Policy. The Governance and Nominating Committee also engages professional search firms to help identify potential Independent Trustee candidates who have the experience, qualifications, attributes, and skills consistent with the Statement of Policy. From time to time, additional criteria based on the composition and skills of the current Independent Trustees, as well as experience or skills that may be appropriate in light of future changes to board composition, business conditions, and regulatory or other developments, have also been considered by the professional search firms and the Governance and Nominating Committee. In addition, the Board takes into account the Trustees' commitment and participation in Board and committee meetings, as well as their leadership of standing and ad hoc committees throughout their tenure.
In determining that a particular Trustee was and continues to be qualified to serve as a Trustee, the Board has considered a variety of criteria, none of which, in isolation, was controlling. The Board believes that, collectively, the Trustees have balanced and diverse experience, qualifications, attributes, and skills, which allow the Board to operate effectively in governing the fund and protecting the interests of shareholders. Information about the specific experience, skills, attributes, and qualifications of each Trustee, which in each case led to the Board's conclusion that the Trustee should serve (or continue to serve) as a trustee of the fund, is provided below.
Annual Report
Trustees and Officers - continued
Board Structure and Oversight Function. James C. Curvey is an interested person (as defined in the 1940 Act) and currently serves as Chairman. The Trustees have determined that an interested Chairman is appropriate and benefits shareholders because an interested Chairman has a personal and professional stake in the quality and continuity of services provided to the fund. Independent Trustees exercise their informed business judgment to appoint an individual of their choosing to serve as Chairman, regardless of whether the Trustee happens to be independent or a member of management. The Independent Trustees have determined that they can act independently and effectively without having an Independent Trustee serve as Chairman and that a key structural component for assuring that they are in a position to do so is for the Independent Trustees to constitute a substantial majority for the Board. The Independent Trustees also regularly meet in executive session. Ned C. Lautenbach serves as Chairman of the Independent Trustees and as such (i) acts as a liaison between the Independent Trustees and management with respect to matters important to the Independent Trustees and (ii) with management prepares agendas for Board meetings.
Fidelity funds are overseen by different Boards of Trustees. The fund's Board oversees Fidelity's equity and high income funds and another Board oversees Fidelity's investment-grade bond, money market, and asset allocation funds. The asset allocation funds may invest in Fidelity funds overseen by the fund's Board. The use of separate Boards, each with its own committee structure, allows the Trustees of each group of Fidelity funds to focus on the unique issues of the funds they oversee, including common research, investment, and operational issues. On occasion, the separate Boards establish joint committees to address issues of overlapping consequences for the Fidelity funds overseen by each Board.
The Trustees operate using a system of committees to facilitate the timely and efficient consideration of all matters of importance to the Trustees, the fund, and fund shareholders and to facilitate compliance with legal and regulatory requirements and oversight of the fund's activities and associated risks. The Board, acting through its committees, has charged FMR and its affiliates with (i) identifying events or circumstances the occurrence of which could have demonstrably adverse effects on the fund's business and/or reputation; (ii) implementing processes and controls to lessen the possibility that such events or circumstances occur or to mitigate the effects of such events or circumstances if they do occur; and (iii) creating and maintaining a system designed to evaluate continuously business and market conditions in order to facilitate the identification and implementation processes described in (i) and (ii) above. Because the day-to-day operations and activities of the fund are carried out by or through FMR, its affiliates and other service providers, the fund's exposure to risks is mitigated but not eliminated by the processes overseen by the Trustees. While each of the Board's committees has responsibility for overseeing different aspects of the fund's activities, oversight is exercised primarily through the Operations, Audit, and Compliance Committees. In addition, the Independent Trustees have worked with FMR to enhance the Board's oversight of investment and financial risks, legal and regulatory risks, technology risks, and operational risks, including the development of additional risk reporting to the Board. For example, a working group comprised of Independent Trustees and FMR has worked and continues to work to review the Fidelity funds' valuation-related activities, reporting and risk management. Appropriate personnel, including but not limited to the fund's Chief Compliance Officer (CCO), FMR's internal auditor, the independent accountants, the fund's Treasurer and portfolio management personnel, make periodic reports to the Board's committees, as appropriate, including an annual review of FMR's risk management program for the Fidelity funds. The responsibilities of each standing committee, including their oversight responsibilities, are described further under "Standing Committees of the Fund's Trustees."
Annual Report
The fund's Statement of Additional Information (SAI) includes more information about the Trustees. To request a free copy, call Fidelity at 1-877-208-0098.
Interested Trustees*:
Correspondence intended for each Trustee who is an interested person may be sent to Fidelity Investments, 245 Summer Street, Boston, Massachusetts 02210.
Name, Year of Birth; Principal Occupations and Other Relevant Experience+ |
James C. Curvey (1935) |
Year of Election or Appointment: 2007 Trustee Chairman of the Board of Trustees |
| Mr. Curvey also serves as Trustee of other Fidelity funds. Mr. Curvey is a Director of Fidelity Research & Analysis Co. (2009-present), and Vice Chairman (2007-present) and Director of FMR LLC. In addition, Mr. Curvey serves as an Overseer for the Boston Symphony Orchestra and a member of the board of Artis-Naples, Naples, Florida, and as a Trustee for Brewster Academy, Wolfeboro, New Hampshire. Previously, Mr. Curvey served as a Director of Fidelity Investments Money Management, Inc. (2009-2014), a Director of FMR (2007-2014), and a Director of FMR Co., Inc. (2007-2014). |
Charles S. Morrison (1960) |
Year of Election or Appointment: 2014 Trustee |
| Mr. Morrison also serves as Trustee of other funds. He serves as a Director of Fidelity Investments Money Management, Inc. (FIMM) (2014-present), Director of Fidelity SelectCo, LLC (2014-present), President, Asset Management (2014-present), and is an employee of Fidelity Investments. Previously, Mr. Morrison served as Vice President of Fidelity's Fixed Income and Asset Allocation Funds (2012-2014), President, Fixed Income (2011-2014), Vice President of Fidelity's Money Market Funds (2005-2009), President, Money Market Group Leader of FMR (2009), and Senior Vice President, Money Market Group of FMR (2004-2009). Mr. Morrison also served as Vice President of Fidelity's Bond Funds (2002-2005), certain Balanced Funds (2002-2005), and certain Asset Allocation Funds (2002-2007), and as Senior Vice President (2002-2005) of Fidelity's Bond Division. |
* Trustees have been determined to be "Interested Trustees" by virtue of, among other things, their affiliation with the trust or various entities under common control with FMR.
+ The information above includes each Trustee's principal occupation during the last five years and other information relating to the experience, attributes, and skills relevant to each Trustee's qualifications to serve as a Trustee, which led to the conclusion that each Trustee should serve as a Trustee for the fund.
Annual Report
Independent Trustees:
Correspondence intended for each Independent Trustee (that is, the Trustees other than the Interested Trustees) may be sent to Fidelity Investments, P.O. Box 55235, Boston, Massachusetts 02205-5235.
Name, Year of Birth; Principal Occupations and Other Relevant Experience+ |
Dennis J. Dirks (1948) |
Year of Election or Appointment: 2005 Trustee |
| Mr. Dirks also serves as Trustee of other Fidelity funds. Prior to his retirement in May 2003, Mr. Dirks was Chief Operating Officer and a member of the Board of The Depository Trust & Clearing Corporation (DTCC). He also served as President, Chief Operating Officer, and Board member of The Depository Trust Company (DTC) and President and Board member of the National Securities Clearing Corporation (NSCC). In addition, Mr. Dirks served as Chief Executive Officer and Board member of the Government Securities Clearing Corporation, Chief Executive Officer and Board member of the Mortgage-Backed Securities Clearing Corporation, as a Trustee and a member of the Finance Committee of Manhattan College (2005-2008), and as a Trustee and a member of the Finance Committee of AHRC of Nassau County (2006-2008). Mr. Dirks is a member of the Independent Directors Council (IDC) Governing Council (2010-present) and Board of Directors for The Brookville Center for Children's Services, Inc. (2009-present). |
Alan J. Lacy (1953) |
Year of Election or Appointment: 2008 Trustee |
| Mr. Lacy also serves as Trustee of other Fidelity funds. Mr. Lacy serves as Senior Adviser (2007-present) of Oak Hill Capital Partners, L.P. (private equity). Mr. Lacy also served as Chief Executive Officer (2000-2005) and Vice Chairman (2005-2006) of Sears Holdings Corporation and Sears, Roebuck and Co. (retail). In addition, Mr. Lacy serves as a member of the Board of Directors of Dave & Buster's Entertainment, Inc. (restaurant and entertainment complexes, 2010-present), Earth Fare, Inc. (retail grocery, 2012-present), The Hillman Companies, Inc. (hardware wholesalers, 2010-present), and Bristol-Myers Squibb Company (global pharmaceuticals, 2008-present). Mr. Lacy is a member of the Board of Trustees of The National Parks Conservation Association (2006-present). Previously, Mr. Lacy served as Chairman of the Board of Trustees of the National Parks Conservation Association (2008-2011) and as a member of the Board of Directors for the Western Union Company (global money transfer, 2006-2011). |
Ned C. Lautenbach (1944) |
Year of Election or Appointment: 2000 Trustee Chairman of the Independent Trustees |
| Mr. Lautenbach also serves as Trustee of other Fidelity funds. Mr. Lautenbach currently serves as the Lead Director of the Eaton Corporation Board of Directors (diversified industrial, 1997-present). Mr. Lautenbach is Chairman of the Board of Directors of the Philharmonic Center for the Arts in Naples, Florida (2012-present) and a member of the Council on Foreign Relations (1994-present). Previously, Mr. Lautenbach was a Partner/Advisory Partner at Clayton, Dubilier & Rice, LLC (private equity investment, 1998-2010), as well as a Director of Sony Corporation (2006-2007). |
Joseph Mauriello (1944) |
Year of Election or Appointment: 2008 Trustee |
| Mr. Mauriello also serves as Trustee of other Fidelity funds. Prior to his retirement in January 2006, Mr. Mauriello served in numerous senior management positions including Deputy Chairman and Chief Operating Officer (2004-2005), and Vice Chairman of Financial Services (2002-2004) of KPMG LLP US (professional services, 1965-2005). Mr. Mauriello currently serves as a member of the Board of Directors of XL Group plc. (global insurance and re-insurance, 2006-present). Previously, Mr. Mauriello served as a Director of the Hamilton Funds of the Bank of New York (2006-2007) and of Arcadia Resources Inc. (health care services and products, 2007-2012). |
Robert W. Selander (1950) |
Year of Election or Appointment: 2011 Trustee |
| Mr. Selander also serves as Trustee of other Fidelity funds. Previously, Mr. Selander served as a Member of the Advisory Board of other Fidelity funds (2011), and Executive Vice Chairman (2010), Chief Executive Officer (2009-2010), and President and Chief Executive Officer (1997-2009) of Mastercard, Inc. |
Cornelia M. Small (1944) |
Year of Election or Appointment: 2005 Trustee |
| Ms. Small also serves as Trustee of other Fidelity funds. Ms. Small is a member of the Board of Directors (2009-present) and Chair of the Investment Committee (2010-present) of the Teagle Foundation. Ms. Small also serves on the Investment Committee of the Berkshire Taconic Community Foundation (2008-present). Previously, Ms. Small served as Chairperson (2002-2008) and a member of the Investment Committee and Chairperson (2008-2012) and a member of the Board of Trustees of Smith College. In addition, Ms. Small served as Chief Investment Officer, Director of Global Equity Investments, and a member of the Board of Directors of Scudder, Stevens & Clark and Scudder Kemper Investments. |
William S. Stavropoulos (1939) |
Year of Election or Appointment: 2001 Trustee Vice Chairman of the Independent Trustees |
| Mr. Stavropoulos also serves as Trustee of other Fidelity funds. Mr. Stavropoulos serves as President and Founder of the Michigan Baseball Foundation, the Great Lakes Loons (2007-present). Mr. Stavropoulos is Chairman Emeritus of the Board of Directors of The Dow Chemical Company, where he previously served in numerous senior management positions, including President, CEO (1995-2000; 2002-2004), Chairman of the Executive Committee (2000-2006), and as a member of the Board of Directors (1990-2006). Currently, Mr. Stavropoulos is Chairman of the Board of Directors of Univar Inc. (global distributor of commodity and specialty chemicals), a Director of Teradata Corporation (data warehousing and technology solutions), and Maersk Inc. (industrial conglomerate), and a member of the Advisory Board for Metalmark Capital LLC (private equity investment, 2005-present). Mr. Stavropoulos is an operating advisor to Clayton, Dubilier & Rice, LLC (private equity investment). In addition, Mr. Stavropoulos is a member of the University of Notre Dame Advisory Council for the College of Science, a Trustee of the Rollin L. Gerstacker Foundation, and a Director of the Naples Philharmonic Center for the Arts. Previously, Mr. Stavropoulos served as a Director of Chemical Financial Corporation (bank holding company, 1993-2012) and Tyco International, Ltd. (multinational manufacturing and services, 2007-2012). |
David M. Thomas (1949) |
Year of Election or Appointment: 2008 Trustee |
| Mr. Thomas also serves as Trustee of other Fidelity funds. Mr. Thomas serves as Non-Executive Chairman of the Board of Directors of Fortune Brands Home and Security (home and security products, 2011-present), and as a member of the Board of Directors of Interpublic Group of Companies, Inc. (marketing communication, 2004-present). Previously, Mr. Thomas served as Executive Chairman (2005-2006) and Chairman and Chief Executive Officer (2000-2005) of IMS Health, Inc. (pharmaceutical and healthcare information solutions), and a Director of Fortune Brands, Inc. (consumer products, 2000-2011). |
+ The information above includes each Trustee's principal occupation during the last five years and other information relating to the experience, attributes, and skills relevant to each Trustee's qualifications to serve as a Trustee, which led to the conclusion that each Trustee should serve as a Trustee for the fund.
Advisory Board Member and Officers:
Correspondence intended for each officer and Peter S. Lynch may be sent to Fidelity Investments, 245 Summer Street, Boston, Massachusetts 02210. Officers appear below in alphabetical order.
Name, Year of Birth; Principal Occupation |
Peter S. Lynch (1944) |
Year of Election or Appointment: 2003 Member of the Advisory Board |
| Mr. Lynch also serves as Member of the Advisory Board of other Fidelity funds. Mr. Lynch is Vice Chairman and a Director of FMR and FMR Co., Inc. In addition, Mr. Lynch serves as a Trustee of Boston College and as the Chairman of the Inner-City Scholarship Fund. Previously, Mr. Lynch served on the Special Olympics International Board of Directors (1997-2006). |
Elizabeth Paige Baumann (1968) |
Year of Election or Appointment: 2012 Anti-Money Laundering (AML) Officer |
| Ms. Baumann also serves as AML Officer of other funds. She is Chief AML Officer of FMR LLC (2012-present) and is an employee of Fidelity Investments. Previously, Ms. Baumann served as Vice President and Deputy Anti-Money Laundering Officer (2007-2012). |
William C. Coffey (1969) |
Year of Election or Appointment: 2009 Assistant Secretary |
| Mr. Coffey also serves as Assistant Secretary of other funds. He is Senior Vice President and Deputy General Counsel of FMR LLC (2010-present), and is an employee of Fidelity Investments. Previously, Mr. Coffey served as Vice President and Associate General Counsel of FMR LLC (2005-2009). |
Timothy M. Cohen (1969) |
Year of Election or Appointment: 2014 Vice President of certain Equity Funds |
| Mr. Cohen also serves as Vice President of other funds. Mr. Cohen serves as a Director and Chief Compliance Officer of Fidelity Management & Research (U.K.) Inc. (2013-present) and is an employee of Fidelity Investments. |
Jonathan Davis (1968) |
Year of Election or Appointment: 2010 Assistant Treasurer |
| Mr. Davis also serves as Assistant Treasurer of other funds. Mr. Davis is an employee of Fidelity Investments. Previously, Mr. Davis served as Vice President and Associate General Counsel of FMR LLC (2003-2010). |
Adrien E. Deberghes (1967) |
Year of Election or Appointment: 2008 Deputy Treasurer |
| Mr. Deberghes also serves as an officer of other funds. He is an employee of Fidelity Investments (2008-present). Prior to joining Fidelity Investments, Mr. Deberghes was Senior Vice President of Mutual Fund Administration at State Street Corporation (2007-2008), Senior Director of Mutual Fund Administration at Investors Bank & Trust (2005-2007), and Director of Finance for Dunkin' Brands (2000-2005). |
Stephanie J. Dorsey (1969) |
Year of Election or Appointment: 2010 Assistant Treasurer |
| Ms. Dorsey also serves as an officer of other funds. She is an employee of Fidelity Investments (2008-present) and has served in other fund officer roles. Prior to joining Fidelity Investments, Ms. Dorsey served as Treasurer (2004-2008) of the JPMorgan Mutual Funds and Vice President (2004-2008) of JPMorgan Chase Bank. |
Howard J. Galligan III (1966) |
Year of Election or Appointment: 2014 Chief Financial Officer |
| Mr. Galligan also serves as Chief Financial Officer of other funds. Mr. Galligan serves as President of Fidelity Pricing and Cash Management Services (FPCMS) (2014-present) and as a Director of Strategic Advisers, Inc. (2008-present). Previously, Mr. Galligan served as Chief Administrative Officer of Asset Management (2011-2014) and Chief Operating Officer and Senior Vice President of Investment Support for Strategic Advisers, Inc. (2003-2011). |
Scott C. Goebel (1968) |
Year of Election or Appointment: 2008 Secretary and Chief Legal Officer (CLO) |
| Mr. Goebel serves as Secretary and CLO of other funds. Mr. Goebel also serves as Secretary of Fidelity SelectCo, LLC (2013-present), Fidelity Investments Money Management, Inc. (FIMM) (2010-present) and Fidelity Research and Analysis Company (FRAC) (2010-present); General Counsel, Secretary, and Senior Vice President of FMR (2008-present) and FMR Co., Inc. (2008-present); Chief Legal Officer of Fidelity Management & Research (Hong Kong) Limited (2008-present); and Assistant Secretary of Fidelity Management & Research (Japan) Limited (2008-present) and Fidelity Management & Research (U.K.) Inc. (2008-present). Previously, Mr. Goebel served as Secretary and CLO of other Fidelity funds (2008-2013), Assistant Secretary of FIMM (2008-2010), FRAC (2008-2010), and certain funds (2007-2008); and as Vice President and Secretary of Fidelity Distributors Corporation (FDC) (2005-2007). Mr. Goebel has been employed by FMR LLC or an affiliate since 2001. |
Brian B. Hogan (1964) |
Year of Election or Appointment: 2009 Vice President |
| Mr. Hogan also serves as Trustee or Vice President of other funds. Mr. Hogan serves as a Director of Fidelity SelectCo, LLC (2014-present) and President of FMR's Equity Division (2009-present). Previously, Mr. Hogan served as Senior Vice President, Equity Research of FMR (2006-2009) and as a portfolio manager. |
Chris Maher (1972) |
Year of Election or Appointment: 2013 Assistant Treasurer |
| Mr. Maher serves as Assistant Treasurer of other funds. Mr. Maher is Vice President of Valuation Oversight and is an employee of Fidelity Investments. Previously, Mr. Maher served as Vice President of Asset Management Compliance (2013), Vice President of FMR's Program Management Group (2010-2013), and Vice President of Valuation Oversight (2008-2010). |
Kenneth B. Robins (1969) |
Year of Election or Appointment: 2008 President and Treasurer |
| Mr. Robins also serves as an officer of other funds. Mr. Robins serves as Executive Vice President of Fidelity Investments Money Management, Inc. (FIMM) (2013-present) and is an employee of Fidelity Investments (2004-present). Previously, Mr. Robins served in other fund officer roles. |
Stephen Sadoski (1971) |
Year of Election or Appointment: 2012 Deputy Treasurer |
| Mr. Sadoski also serves as Deputy Treasurer of other funds. He is an employee of Fidelity Investments (2012-present) and has served in another fund officer role. Prior to joining Fidelity Investments, Mr. Sadoski served as an assistant chief accountant in the Division of Investment Management of the Securities and Exchange Commission (SEC) (2009-2012) and as a senior manager at Deloitte & Touche LLP (1997-2009). |
Stacie M. Smith (1974) |
Year of Election or Appointment: 2013 Deputy Treasurer |
| Ms. Smith also serves as an officer of other funds. She is an employee of Fidelity Investments (2009-present) and has served in other fund officer roles. Prior to joining Fidelity Investments, Ms. Smith served as Senior Audit Manager of Ernst & Young LLP (1996-2009). |
Renee Stagnone (1975) |
Year of Election or Appointment: 2013 Deputy Treasurer |
| Ms. Stagnone also serves as Deputy Treasurer of other funds. Ms. Stagnone is an employee of Fidelity Investments. |
Linda J. Wondrack (1964) |
Year of Election or Appointment: 2014 Chief Compliance Officer |
| Ms. Wondrack also serves as Chief Compliance Officer of other funds. Ms. Wondrack is Executive Vice President and head of the Ethics Office and Asset Management Compliance for Fidelity Investments (2012-present). Ms. Wondrack also serves as Chief Compliance Officer of Fidelity SelectCo, LLC (2014-present); Chief Compliance Officer of Impresa Management LLC (2013-present); and Chief Compliance Officer of FMR Co., Inc., Fidelity Investments Money Management, Inc., Fidelity Management & Research (Japan) Limited, Fidelity Management & Research (U.K.) Inc., Fidelity Management & Research (Hong Kong), Fidelity Management & Research Company, Pyramis Global Advisors, LLC, and Strategic Advisers, Inc., Ballyrock Investment Advisors LLC, and Northern Neck Investors LLC (2012-present). Previously, Ms. Wondrack served as Senior Vice President and Chief Compliance Officer for Columbia Management Investment Advisers, LLC (2005-2012); Chief Compliance Officer for certain funds within the Columbia Family of Funds (2007-2012); and Senior Vice President of Compliance Risk Management at Bank of America (2005-2010). |
Joseph F. Zambello (1957) |
Year of Election or Appointment: 2011 Deputy Treasurer |
| Mr. Zambello also serves as Deputy Treasurer of other funds. Mr. Zambello is an employee of Fidelity Investments. Previously, Mr. Zambello served as Vice President of FMR's Program Management Group (2009-2011) and Vice President of the Transfer Agent Oversight Group (2005-2009). |
Annual Report
A percentage of the dividends distributed during the fiscal year qualifies for the dividends-received deduction for corporate shareholders:
| December 2013 | | |
Class A | 0% | | |
Class T | 0% | | |
Class B | 1% | | |
Class C | 1% | | |
Class A, Class T, Class B, and Class C designates 100% of the dividends distributed during the fiscal year as amounts which may be taken into account as a dividend for purposes of the maximum rate under section 1(h)(11) of the Internal Revenue Code.
The amounts per share which represent income derived from sources within, and taxes paid to, foreign countries or possessions of the United States are as follows:
| Pay Date | Income | Taxes |
Class A | 12/09/13 | $0.1317 | $0.0084 |
| | | |
Class T | 12/09/13 | $0.1181 | $0.0084 |
| | | |
Class B | 12/09/13 | $0.0790 | $0.0084 |
| | | |
Class C | 12/09/13 | $0.0913 | $0.0084 |
The fund will notify shareholders in January 2015 of amounts for use in preparing 2014 income tax returns.
Annual Report
Board Approval of Investment Advisory Contracts and Management Fees
Fidelity International Value Fund
Each year, the Board of Trustees, including the Independent Trustees (together, the Board), votes on the renewal of the management contract with Fidelity Management & Research Company (FMR) and the sub-advisory agreements (together, the Advisory Contracts) for the fund. The Board, assisted by the advice of fund counsel and Independent Trustees' counsel, requests and considers a broad range of information relevant to the renewal of the Advisory Contracts throughout the year.
The Board meets regularly and, at each of its meetings, covers an extensive agenda of topics and materials and considers factors that are relevant to its annual consideration of the renewal of the fund's Advisory Contracts, including the services and support provided to the fund and its shareholders. The Board has established various standing committees (Committees), each composed of and chaired by Independent Trustees with varying backgrounds, to which the Board has assigned specific subject matter responsibilities in order to enhance effective decision-making by the Board. The Board, acting directly and through its Committees, requests and receives information concerning the annual consideration of the renewal of the fund's Advisory Contracts. The Board also meets as needed to consider matters specifically related to the Board's annual consideration of the renewal of the Advisory Contracts. Members of the Board may also meet with trustees of other Fidelity funds through ad hoc joint committees to discuss certain matters relevant to the Fidelity funds.
At its July 2014 meeting, the Board, including the Independent Trustees, unanimously determined to renew the fund's Advisory Contracts. In reaching its determination, the Board considered all factors it believed relevant, including (i) the nature, extent, and quality of the services to be provided to the fund and its shareholders (including the investment performance of the fund); (ii) the competitiveness of the fund's management fee and total expense ratio relative to peer funds; (iii) the total costs of the services to be provided by and the profits to be realized by Fidelity from its relationship with the fund; (iv) the extent to which economies of scale exist and would be realized as the fund grows; and (v) whether fee levels reflect these economies of scale, if any, for the benefit of fund shareholders. In connection with separate internal corporate reorganizations involving Fidelity Management & Research (U.K.) Inc. (FMR U.K.) and Fidelity Management & Research (Japan) Inc. (FMR Japan), the Board approved certain non-material amendments to the fund's sub-advisory agreements with FMR U.K. and FMR Japan to reflect that, after these reorganizations, FMR Investment Management (UK) Limited and Fidelity Management & Research (Japan) Limited will carry on the business of FMR U.K. and FMR Japan, respectively. The Board noted that no changes to the portfolio managers or to the foreign research or investment advisory services provided to the fund were expected in connection with either reorganization and that the same personnel and resources would continue to be available to the fund at the new entities.
Annual Report
In considering whether to renew the Advisory Contracts for the fund, the Board reached a determination, with the assistance of fund counsel and Independent Trustees' counsel and through the exercise of its business judgment, that the renewal of the Advisory Contracts was in the best interests of the fund and its shareholders and that the compensation payable under the Advisory Contracts was fair and reasonable. The Board's decision to renew the Advisory Contracts was not based on any single factor, but rather was based on a comprehensive consideration of all the information provided to the Board at its meetings throughout the year. The Board, in reaching its determination to renew the Advisory Contracts, was aware that shareholders of the fund have a broad range of investment choices available to them, including a wide choice among funds offered by Fidelity's competitors, and that the fund's shareholders, who have the opportunity to review and weigh the disclosure provided by the fund in its prospectus and other public disclosures, have chosen to invest in this fund, which is part of the Fidelity family of funds.
Nature, Extent, and Quality of Services Provided. The Board considered Fidelity's staffing as it relates to the fund, including the backgrounds of investment personnel of FMR and the sub-advisers (together, the Investment Advisers), and also considered the fund's investment objective, strategies, and related investment philosophy. The Independent Trustees also had discussions with senior management of Fidelity's investment operations and investment groups. The Board considered the structure of the portfolio manager compensation program and whether this structure provides appropriate incentives to act in the best interests of the fund. Additionally, the Board considered the portfolio managers' investments, if any, in the funds that they manage.
Resources Dedicated to Investment Management and Support Services. The Board and the Fund Oversight and Research Committees reviewed the general qualifications and capabilities of Fidelity's investment staff, including its size, education, experience, and resources, as well as Fidelity's approach to recruiting, training, managing, and compensating investment personnel. The Board noted that Fidelity has continued to increase the resources devoted to non-U.S. offices, including expansion of Fidelity's global investment organization. The Board also noted that Fidelity's analysts have extensive resources, tools and capabilities that allow them to conduct sophisticated quantitative and fundamental analysis, as well as credit analysis of issuers, counterparties and guarantors. Further, the Board believes that Fidelity's investment professionals have sufficient access to global information and data so as to provide competitive investment results over time, and that those professionals also have access to sophisticated tools that permit them to assess portfolio construction and risk and performance attribution characteristics continuously, as well as to transmit new information and research conclusions rapidly around the world. Additionally, in its deliberations, the Board considered Fidelity's trading and risk management capabilities and resources and global compliance infrastructure, which are an integral part of the investment management process.
Annual Report
Board Approval of Investment Advisory Contracts and
Management Fees - continued
Shareholder and Administrative Services. The Board considered (i) the nature, extent, quality, and cost of advisory, administrative, and shareholder services performed by the Investment Advisers and their affiliates under the Advisory Contracts and under separate agreements covering transfer agency, pricing and bookkeeping, and securities lending services for the fund; (ii) the nature and extent of the supervision of third party service providers, principally custodians and subcustodians; and (iii) the resources devoted to, and the record of compliance with, the fund's compliance policies and procedures. The Board also reviewed the allocation of fund brokerage, including allocations to brokers affiliated with the Investment Advisers, the use of brokerage commissions to pay fund expenses, and the use of "soft" commission dollars to pay for research services.
The Board noted that the growth of fund assets over time across the complex allows Fidelity to reinvest in the development of services designed to enhance the value or convenience of the Fidelity funds as investment vehicles. These services include 24-hour access to account information and market information through telephone representatives and over the Internet, investor education materials and asset allocation tools, and the expanded availability of Fidelity Investor Centers.
In 2014, the Board formed an ad hoc Committee on Transfer Agency Fees to review the variety of transfer agency fee structures throughout the industry and Fidelity's competitive positioning with respect to industry participants.
Investment in a Large Fund Family. The Board considered the benefits to shareholders of investing in a Fidelity fund, including the benefits of investing in a fund that is part of a large family of funds offering a variety of investment disciplines and providing a large variety of mutual fund investor services. The Board noted that Fidelity had taken, or had made recommendations that resulted in the Fidelity funds taking, a number of actions over the previous year that benefited particular funds, including (i) continuing to dedicate additional resources to investment research and to the support of the senior management team that oversees asset management; (ii) persisting in efforts to enhance Fidelity's global research capabilities; (iii) launching new funds and making other enhancements to meet client needs for income-oriented solutions; (iv) reducing fund expenses for certain index funds; (v) continuing to launch dedicated lower cost underlying funds to meet portfolio construction needs related to expanding underlying fund options for Fidelity funds of funds, specifically for the Freedom Fund product lines; (vi) rationalizing product lines and gaining increased efficiencies through fund mergers; (vii) launching sector-based exchange-traded funds and establishing a new Fidelity adviser to manage sector-based funds and products; (viii) continuing to develop and implement technology to improve security and increase efficiency; (ix) modifying the eligibility criteria for certain share classes to increase their marketability to a portion of the defined contribution plan market; (x) waiving redemption fees for certain qualified fund-of-fund and wrap programs and certain retirement plan transactions; and (xi) launching new Institutional Class shares of certain money market funds to attract and retain assets and to fill a gap in the money market fund lineup.
Annual Report
Investment Performance. The Board considered whether the fund has operated in accordance with its investment objective, as well as its record of compliance with its investment restrictions and its performance history. The Board noted that there was a portfolio management change for the fund in September 2011.
The Board took into account discussions with the Investment Advisers about fund investment performance that occur at Board meetings throughout the year. In this regard the Board noted that as part of regularly scheduled fund reviews and other reports to the Board on fund performance, the Board periodically considers annualized return information for the fund, for different time periods, measured against a securities market index ("benchmark index") and a peer group of funds with similar objectives ("peer group"). In its evaluation of fund investment performance, the Board gave particular attention to information indicating changes in performance of certain Fidelity funds for specific time periods and the Investment Advisers' explanations for any overperformance or underperformance.
In addition to reviewing absolute and relative fund performance, the Independent Trustees periodically consider the appropriateness of fund performance metrics in evaluating the results achieved. In general, the Independent Trustees believe that fund performance should be evaluated based on net performance (after fees and expenses) of both the highest performing and lowest performing classes, where applicable, compared to appropriate benchmark indices, over appropriate time periods which may include full market cycles, and compared to peer groups, as applicable, over the same periods, taking into account relevant factors including the following: general market conditions; issuer-specific information; tactical opportunities for investment; and fund cash flows and other factors.
The Independent Trustees recognize that shareholders evaluate performance on a net basis over their own holding periods, for which one-, three-, and five-year periods are often used as a proxy. For this reason, the performance information reviewed by the Board also included net cumulative calendar year total return information for the fund and an appropriate benchmark index and peer group for the most recent one-, three-, and five-year periods, as shown below. Returns are shown compared to the 25th percentile (top of box, 75% beaten) and 75th percentile (bottom of box, 25% beaten) of the peer universe. Returns of the benchmark index are "net MA," i.e., adjusted for tax withholding rates applicable to U.S.-based funds organized as Massachusetts business trusts.
Annual Report
Board Approval of Investment Advisory Contracts and
Management Fees - continued
Fidelity International Value Fund

The Board has discussed the fund's performance with FMR, including the fund's underperformance based on more recent periods ended after 2013 (which periods are not shown in the chart above) but prior to the date of the Board's approval of the renewal of the Advisory Contracts, and has engaged with FMR to consider what steps might be taken to remediate the fund's more recent underperformance.
The Board also considered that the fund's management fee is subject to upward or downward adjustment depending upon whether, and to what extent, the fund's investment performance for the performance period exceeds, or is exceeded by, a securities index, thus leading to a performance adjustment for the same period. The Board noted that the performance adjustment provides FMR with a strong economic incentive to seek to achieve superior performance for the fund's shareholders and helps to more closely align the interests of FMR and the fund's shareholders.
Based on its review, the Board concluded that the nature, extent, and quality of services provided to the fund under the Advisory Contracts should benefit the fund's shareholders.
Competitiveness of Management Fee and Total Expense Ratio. The Board considered the fund's management fee and total expense ratio compared to "mapped groups" of competitive funds and classes. Fidelity creates "mapped groups" by combining similar Lipper investment objective categories that have comparable investment mandates. Combining Lipper investment objective categories aids the Board's management fee and total expense ratio comparisons by broadening the competitive group used for comparison and by reducing the number of universes to which various Fidelity funds are compared.
Annual Report
Management Fee. The Board considered two proprietary management fee comparisons for the 12-month periods shown in the chart below. The group of Lipper funds used by the Board for management fee comparisons is referred to below as the "Total Mapped Group." The Total Mapped Group comparison focuses on a fund's standing in terms of gross management fees before expense reimbursements or caps, and without giving effect to the fund's performance adjustment, relative to the total universe of funds with comparable investment mandates, regardless of whether their management fee structures also are comparable. Funds with comparable investment mandates offer exposure to similar types of securities. Funds with comparable management fee structures have similar management fee contractual arrangements (e.g., flat rate charged for advisory services, all-inclusive fee rate, etc.). "TMG %" represents the percentage of funds in the Total Mapped Group that had management fees that were lower than the fund's. For example, a hypothetical TMG % of 20% would mean that 80% of the funds in the Total Mapped Group had higher, and 20% had lower, management fees than the fund. The fund's actual TMG %s are in the chart below. The "Asset-Size Peer Group" (ASPG) comparison focuses on a fund's standing relative to a subset of non-Fidelity funds within the Total Mapped Group that are similar in size and management fee structure. For example, if a fund is in the first quartile of the ASPG, the fund's management fee ranks in the least expensive or lowest 25% of funds in the ASPG. The ASPG represents at least 15% of the funds in the Total Mapped Group with comparable asset size and management fee structures, subject to a minimum of 50 funds (or all funds in the Total Mapped Group if fewer than 50). Additional information, such as the ASPG quartile in which the fund's management fee rate ranked and the impact of the fund's performance adjustment, is also included in the chart and considered by the Board.
Annual Report
Board Approval of Investment Advisory Contracts and
Management Fees - continued
Fidelity International Value Fund

The Board noted that the fund's management fee rate ranked below the median of its Total Mapped Group and below the median of its ASPG for 2013. The Board also noted the effect of the fund's negative performance adjustment on the fund's management fee ranking.
The Board also noted that, in August 2013, the ad hoc Committee on Management Fees was formed to conduct an in-depth review of the management fee rates of Fidelity's active equity mutual funds. The Committee focused on the following areas: (i) standard fee structures; (ii) research consumption and trading evolution; (iii) management fee competitiveness/profitability by category; and (iv) factors that drive institutional pricing.
Based on its review, the Board concluded that the fund's management fee is fair and reasonable in light of the services that the fund receives and the other factors considered.
Total Expense Ratio. In its review of each class's total expense ratio, the Board considered the fund's management fee as well as other fund or class expenses, as applicable, such as transfer agent fees, pricing and bookkeeping fees, fund-paid 12b-1 fees, and custodial, legal, and audit fees. The Board also noted the effects of any waivers and reimbursements on fees and expenses, as well as the impact of the fund's performance adjustment. As part of its review, the Board also considered the current and historical total expense ratios of each class of the fund compared to competitive fund median expenses. Each class of the fund is compared to those funds and classes in the Total Mapped Group (used by the Board for management fee comparisons) that have a similar sales load structure.
Annual Report
The Board noted that the total expense ratio of each of Class A, Class B, Institutional Class, and the retail class ranked below its competitive median for 2013 and the total expense ratio of each of Class T and Class C ranked above its competitive median for 2013. The Board considered that, in general, various factors can affect total expense ratios. The Board noted that the total expense ratio of Class T was above the competitive median primarily because of higher 12b-1 fees on Class T as compared to most competitor funds. Class T has a higher 12b-1 fee, but a lower front-end sales charge, than traditionally priced front-end sales charge classes. The Board considered that Class T is primarily sold load-waived in the retirement plan market where its 0.50% 12b-1 fee is comparable to competing no-load, higher 12b-1 fee classes designed specifically for retirement plans. The Board noted that the fund offers multiple classes, each of which has a different sales load and 12b-1 fee structure, and that the multiple structures are intended to offer a range of pricing options for the intermediary market. The Board also noted that the total expense ratios of the classes vary primarily by the level of their 12b-1 fees, although differences in transfer agent fees may also cause expenses to vary from class to class.
Fees Charged to Other Fidelity Clients. The Board also considered Fidelity fee structures and other information with respect to clients of Fidelity, such as other funds advised or subadvised by Fidelity, pension plan clients, and other institutional clients. The Board noted the findings of the 2013 ad hoc joint committee (created with the board of other Fidelity funds), which reviewed and compared Fidelity's institutional investment advisory business with its business of providing services to the Fidelity funds, including the differences in services provided, fees charged, and costs incurred, as well as competition in their respective marketplaces.
Based on its review of total expense ratios and fees charged to other Fidelity clients, the Board concluded that the total expense ratio of each class of the fund was reasonable, although in some cases above the median of the universe presented for comparison, in light of the services that the fund and its shareholders receive and the other factors considered.
Costs of the Services and Profitability. The Board considered the revenues earned and the expenses incurred by Fidelity in conducting the business of developing, marketing, distributing, managing, administering and servicing the fund and servicing the fund's shareholders. The Board also considered the level of Fidelity's profits in respect of all the Fidelity funds.
On an annual basis, Fidelity presents to the Board Fidelity's profitability for the fund. Fidelity calculates the profitability for each fund, as well as aggregate profitability for groups of Fidelity funds and all Fidelity funds, using a series of detailed revenue and cost allocation methodologies which originate with the books and records of Fidelity on which Fidelity's audited financial statements are based. The Audit Committee of the Board reviews any significant changes from the prior year's methodologies.
Annual Report
Board Approval of Investment Advisory Contracts and
Management Fees - continued
PricewaterhouseCoopers LLP (PwC), independent registered public accounting firm and auditor to Fidelity and certain Fidelity funds, has been engaged annually by the Board as part of the Board's assessment of Fidelity's profitability analysis. PwC's engagement includes the review and assessment of the methodologies used by Fidelity in determining the revenues and expenses attributable to Fidelity's mutual fund business, and completion of agreed-upon procedures in respect of the mathematical accuracy of fund profitability and its conformity to established allocation methodologies. After considering PwC's reports issued under the engagement and information provided by Fidelity, the Board concluded that while other allocation methods may also be reasonable, Fidelity's profitability methodologies are reasonable in all material respects.
The Board also reviewed Fidelity's non-fund businesses and fall-out benefits related to the mutual fund business as well as cases where Fidelity's affiliates may benefit from or be related to the fund's business.
The Board considered the costs of the services provided by and the profits realized by Fidelity in connection with the operation of the fund and was satisfied that the profitability was not excessive in the circumstances.
Economies of Scale. The Board considered whether there have been economies of scale in respect of the management of the Fidelity funds, whether the Fidelity funds (including the fund) have appropriately benefited from any such economies of scale, and whether there is potential for realization of any further economies of scale. The Board considered the extent to which the fund will benefit from economies of scale through increased services to the fund, through waivers or reimbursements, or through fee or expense ratio reductions. The Board also noted that in 2013, it and the boards of other Fidelity funds created an ad hoc committee (the Economies of Scale Committee) to analyze whether Fidelity attains economies of scale in respect of the management and servicing of the Fidelity funds, whether the Fidelity funds have appropriately benefited from such economies of scale, and whether there is potential for realization of any further economies of scale.
The Board recognized that the fund's management contract incorporates a "group fee" structure, which provides for lower group fee rates as total group assets increase, and for higher group fee rates as total group assets decrease (with "group assets" defined to include fund assets under FMR's management plus sector fund assets previously under FMR's management and currently managed by Fidelity SelectCo, LLC). FMR calculates the group fee rates based on a tiered asset "breakpoint" schedule that varies based on asset class. The Board considered that the group fee is designed to deliver the benefits of economies of scale to fund shareholders when total Fidelity fund assets increase, even if assets of any particular fund are unchanged or have declined, because some portion of Fidelity's costs are attributable to services provided to all Fidelity funds, and all funds benefit if those costs can be allocated among more assets. The Board concluded that, given the group fee structure, fund shareholders will benefit from lower management fees as group assets increase at the fund complex level, regardless of whether Fidelity achieves any such economies of scale.
Annual Report
The Board concluded, taking into account the analysis of the Economies of Scale Committee, that economies of scale, if any, are being appropriately shared between fund shareholders and Fidelity.
Additional Information Requested by the Board. In order to develop fully the factual basis for consideration of the Fidelity funds' Advisory Contracts, the Board requested and received additional information on certain topics, including: (i) fund performance trends and Fidelity's long-term strategies for certain funds; (ii) Fidelity's strategic marketing and product lineup goals; (iii) the methodology with respect to competitive fund data and peer group classifications; (iv) the arrangements with, and performance of, certain sub-advisers on behalf of the Fidelity funds, as well as certain proposed participating affiliate arrangements; (v) the realization of fall-out benefits in certain Fidelity business units; (vi) Fidelity's group fee structures, including the rationale for the individual fee rates of certain categories of funds and the definition of group assets; (vii) trends regarding industry use of performance fee structures and the performance adjustment methodologies applicable to the Fidelity funds; (viii) additional competitive analysis regarding the total expenses for certain classes; (ix) fund profitability methodology, including Fidelity's cost allocation methodology, and the impact of certain factors on fund profitability results; and (x) the process by which Fidelity determines sub-advisory fees for funds it advises.
Based on its evaluation of all of the conclusions noted above, and after considering all factors it believed relevant, the Board ultimately concluded that the advisory fee structures are fair and reasonable, and that the fund's Advisory Contracts should be renewed.
Annual Report
Investment Adviser
Fidelity Management & Research Company
Boston, MA
Investment Sub-Advisers
FMR Co., Inc.
Fidelity Management & Research
(U.K.) Inc.
Fidelity Management & Research
(Hong Kong) Limited
Fidelity Management & Research
(Japan) Limited
FIL Investment Advisors
FIL Investment Advisors (U.K.) Limited
FIL Investments (Japan) Limited
General Distributor
Fidelity Distributors Corporation
Smithfield, RI
Transfer and Service Agents
Fidelity Investments Institutional Operations Company, Inc.
Boston, MA
Fidelity Service Company, Inc.
Boston, MA
Custodian
The Northern Trust Company
Chicago, IL
(Fidelity Investment logo)(registered trademark)
AFIV-UANN-1214
1.827496.108
(Fidelity Investment logo)(registered trademark)
Fidelity Advisor®
International Value
Fund - Institutional Class
Annual Report
October 31, 2014
(Fidelity Cover Art)
Institutional Class is
a class of Fidelity®
International Value Fund
Contents
Performance | (Click Here) | How the fund has done over time. |
Management's Discussion of Fund Performance | (Click Here) | The Portfolio Manager's review of fund performance and strategy. |
Shareholder Expense Example | (Click Here) | An example of shareholder expenses. |
Investment Changes | (Click Here) | A summary of major shifts in the fund's investments over the past six months. |
Investments | (Click Here) | A complete list of the fund's investments with their market values. |
Financial Statements | (Click Here) | Statements of assets and liabilities, operations, and changes in net assets, as well as financial highlights. |
Notes | (Click Here) | Notes to financial statements. |
Report of Independent Registered Public Accounting Firm | (Click Here) | |
Trustees and Officers | (Click Here) | |
Distributions | (Click Here) | |
Board Approval of Investment Advisory Contracts and Management Fees | (Click Here) | |
To view a fund's proxy voting guidelines and proxy voting record for the 12-month period ended June 30, visit http://www.fidelity.com/proxyvotingresults or visit the Securities and Exchange Commission's (SEC) web site at http://www.sec.gov. You may also call 1-877-208-0098 to request a free copy of the proxy voting guidelines.
Standard & Poor's, S&P and S&P 500 are registered service marks of The McGraw-Hill Companies, Inc. and have been licensed for use by Fidelity Distributors Corporation.
Other third-party marks appearing herein are the property of their respective owners.
All other marks appearing herein are registered or unregistered trademarks or service marks of FMR LLC or an affiliated company. © 2014 FMR LLC. All rights reserved.
Annual Report
This report and the financial statements contained herein are submitted for the general information of the shareholders of the fund. This report is not authorized for distribution to prospective investors in the fund unless preceded or accompanied by an effective prospectus.
A fund files its complete schedule of portfolio holdings with the SEC for the first and third quarters of each fiscal year on Form N-Q. Forms N-Q are available on the SEC's web site at http://www.sec.gov. A fund's Forms N-Q may be reviewed and copied at the SEC's Public Reference Room in Washington, DC. Information regarding the operation of the SEC's Public Reference Room may be obtained by calling 1-800-SEC-0330. For a complete list of a fund's portfolio holdings, view the most recent holdings listing, semiannual report, or annual report on Fidelity's web site at http://www.fidelity.com, http://www.advisor.fidelity.com, or http://www.401k.com, as applicable.
NOT FDIC INSURED • MAY LOSE VALUE • NO BANK GUARANTEE
Neither the fund nor Fidelity Distributors Corporation is a bank.
Annual Report
Average annual total return reflects the change in the value of an investment, assuming reinvestment of the class' distributions from dividend income and capital gains (the profits earned upon the sale of securities that have grown in value, if any) and assuming a constant rate of performance each year. The $10,000 table and the fund's returns do not reflect the deduction of taxes that a shareholder would pay on fund distributions or the redemption of fund shares. During periods of reimbursement by Fidelity, a fund's total return will be greater than it would be had the reimbursement not occurred. How a fund did yesterday is no guarantee of how it will do tomorrow.
Average Annual Total Returns
Periods ended October 31, 2014 | Past 1
year | Past 5
years | Life of
fund A |
Institutional Class | -1.41% | 5.21% | 1.12% |
A From May 18, 2006.
$10,000 Over Life of Fund
Let's say hypothetically that $10,000 was invested in Fidelity Advisor® International Value Fund - Institutional Class on May 18, 2006, when the fund started. The chart shows how the value of your investment would have changed, and also shows how the MSCI EAFE Value Index performed over the same period.
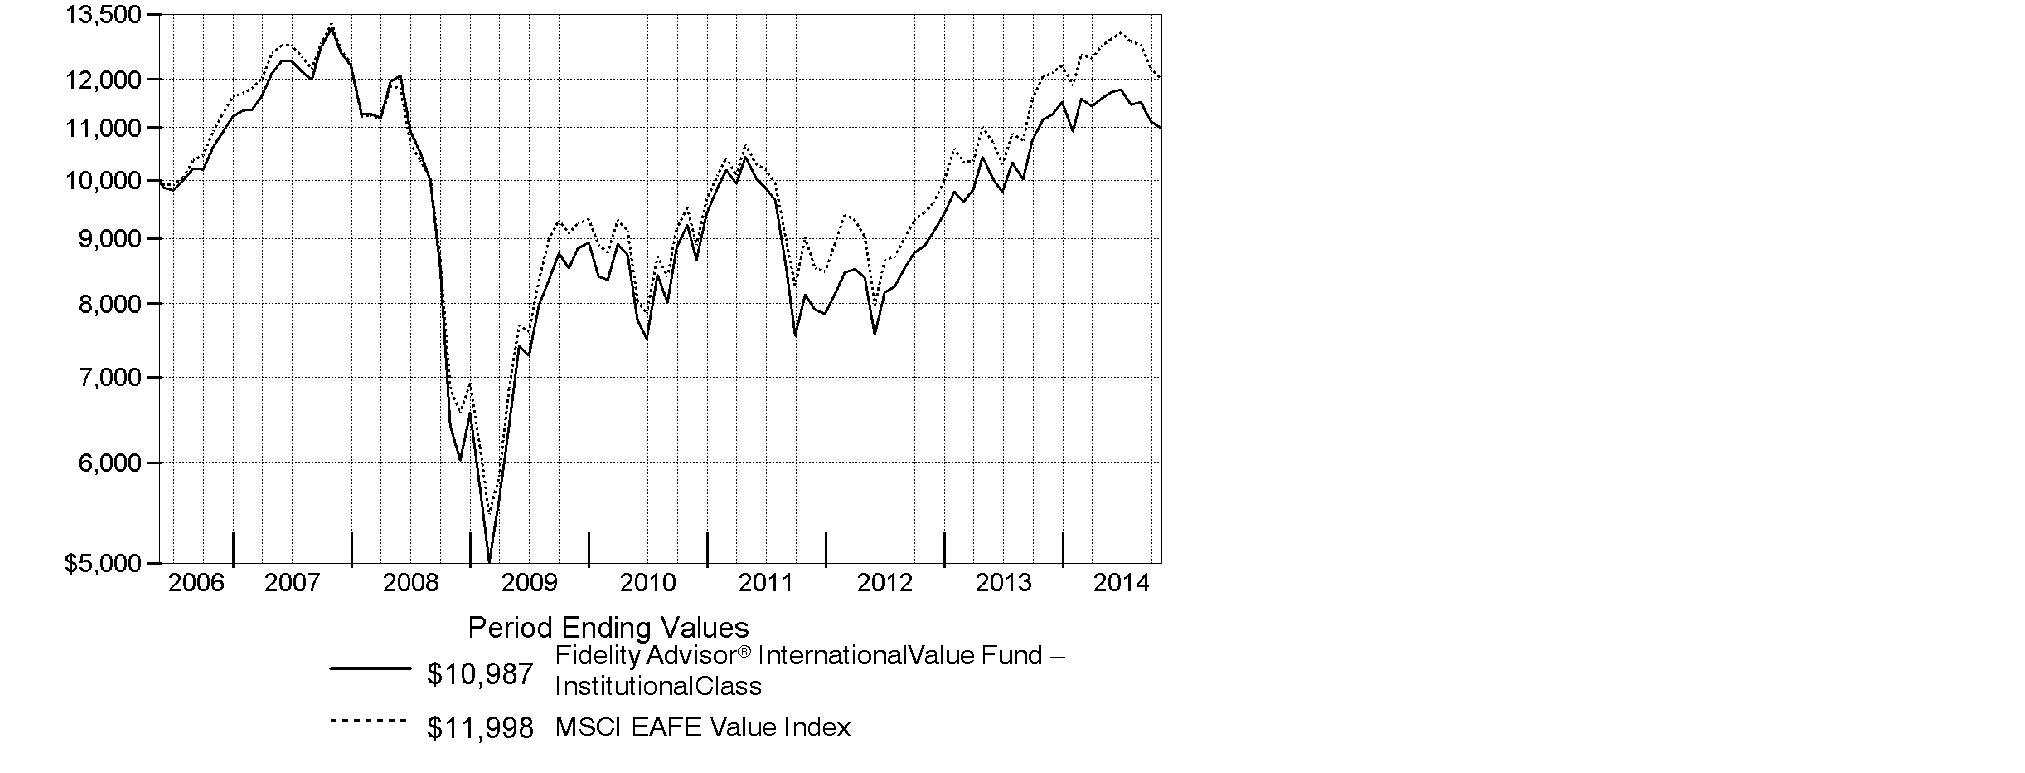
Annual Report
Market Recap: Global equities posted a healthy gain for the 12 months ending October 31, 2014, overcoming an October market decline driven by recessionary pressures in China and tepid growth in Europe. The MSCI ACWI (All Country World Index) Index rose 8.15%, helped by subdued market volatility for much of the period and supported by solid corporate earnings, especially in the United States. Stocks also benefited from easy monetary policies in Japan and the eurozone, as well as increased stimulus efforts in China. All but three of the 24 industry groups that compose the index marked a positive return. The U.S. (+17%) remained a pillar of strength, while a strongly rising dollar in the latter part of the period detracted from investors' returns in most non-U.S. markets. Canada (+5%) notched broad gains outside of its energy and materials sectors, as did Asia-Pacific ex Japan (+4%), led by investor enthusiasm for companies in India. The U.K., Europe and Japan, meanwhile, all underperformed. Among sectors, health care (+24%) led the index, with a strong contribution from the pharmaceuticals, biotechnology & life sciences industry. Information technology (+21%) also outperformed. Conversely, materials (-4%) and energy (-1%) lagged the index due to a higher supply of and lower demand for commodities.
Comments from Alexander Zavratsky, Portfolio Manager of Fidelity Advisor® International Value Fund: For the year, the fund's Institutional Class shares returned -1.41%, trailing the -0.45% return of the benchmark MSCI EAFE Value Index. Versus the index, the fund was hurt by its investments in higher-quality Japanese financials firms, which lagged due to a rising yen and investor reaction to the U.S. central bank's announcement last fall that its stimulus program may end following a period of tapering. From this category, investments in bank holdings company Sumitomo Mitsui Financial Group and diversified conglomerate ORIX were sore spots. An overweighting, on average, in Sumitomo Mitsui was the fund's biggest relative detractor during the past year. Whereas I became more bearish on Sumitomo Mitsui, I held on to ORIX, believing in its ability to deliver long-term results. Conversely, selling our holdings in U.K.-based food retailer Tesco prior to second half of the year proved the biggest relative contributor, as sliding sales and a loss in market share steadily eroded its stock price. Additionally, the stock, which had been declining over the summer, dipped in early August after the firm issued its third profit warning of the year, then again in September after its new chief executive reported that Tesco's first-half profits had been overstated and four senior executives were suspended.
The views expressed above reflect those of the portfolio manager(s) only through the end of the period as stated on the cover of this report and do not necessarily represent the views of Fidelity or any other person in the Fidelity organization. Any such views are subject to change at any time based upon market or other conditions and Fidelity disclaims any responsibility to update such views. These views may not be relied on as investment advice and, because investment decisions for a Fidelity fund are based on numerous factors, may not be relied on as an indication of trading intent on behalf of any Fidelity fund.
Annual Report
Shareholder Expense Example
As a shareholder of the Fund, you incur two types of costs: (1) transaction costs, including sales charges (loads) on purchase payments or redemption proceeds, redemption fees and (2) ongoing costs, including management fees, distribution and/or service (12b-1) fees and other Fund expenses. This Example is intended to help you understand your ongoing costs (in dollars) of investing in the Fund and to compare these costs with the ongoing costs of investing in other mutual funds.
The Example is based on an investment of $1,000 invested at the beginning of the period and held for the entire period (May 1, 2014 to October 31, 2014).
Actual Expenses
The first line of the accompanying table for each class of the Fund provides information about actual account values and actual expenses. You may use the information in this line, together with the amount you invested, to estimate the expenses that you paid over the period. Simply divide your account value by $1,000.00 (for example, an $8,600 account value divided by $1,000.00 = 8.6), then multiply the result by the number in the first line for a class of the Fund under the heading entitled "Expenses Paid During Period" to estimate the expenses you paid on your account during this period. A small balance maintenance fee of $12.00 that is charged once a year may apply for certain accounts with a value of less than $2,000. This fee is not included in the table below. If it was, the estimate of expenses you paid during the period would be higher, and your ending account value lower, by this amount. In addition, the Fund, as a shareholder in the underlying Fidelity Central Funds, will indirectly bear its pro-rata share of the fees and expenses incurred by the underlying Fidelity Central Funds. These fees and expenses are not included in the Fund's annualized expense ratio used to calculate the expense estimate in the table below.
Hypothetical Example for Comparison Purposes
The second line of the accompanying table for each class of the Fund provides information about hypothetical account values and hypothetical expenses based on a Class' actual expense ratio and an assumed rate of return of 5% per year before expenses, which is not the Class' actual return. The hypothetical account values and expenses may not be used to estimate the actual ending account balance or expenses you paid for the period. You may use this information to compare the ongoing costs of investing in the Fund and other funds. To do so, compare this 5% hypothetical example with the 5% hypothetical examples that appear in the shareholder reports of the other funds. A small balance maintenance fee of $12.00 that is charged once a year may apply for certain accounts with a value of less than $2,000. This fee is not included in the table below. If it was, the estimate of expenses you paid during the period would be higher, and your ending account value lower, by this amount. In addition, the Fund, as a shareholder in the underlying Fidelity Central Funds, will indirectly bear its pro-rata share of the fees and expenses incurred by the underlying Fidelity Central Funds. These fees and expenses are not included in the Fund's annualized expense ratio used to calculate the expense estimate in the table below.
Please note that the expenses shown in the table are meant to highlight your ongoing costs only and do not reflect any transaction costs. Therefore, the second line of the table is useful in comparing ongoing costs only, and will not help you determine the relative total costs of owning different funds. In addition, if these transactional costs were included, your costs would have been higher.
Annual Report
Shareholder Expense Example - continued
| Annualized
Expense Ratio B | Beginning
Account Value
May 1, 2014 | Ending
Account Value
October 31, 2014 | Expenses Paid
During Period*
May 1, 2014
to October 31, 2014 |
Class A | 1.33% | | | |
Actual | | $ 1,000.00 | $ 947.30 | $ 6.53 |
HypotheticalA | | $ 1,000.00 | $ 1,018.50 | $ 6.77 |
Class T | 1.60% | | | |
Actual | | $ 1,000.00 | $ 946.10 | $ 7.85 |
HypotheticalA | | $ 1,000.00 | $ 1,017.14 | $ 8.13 |
Class B | 2.09% | | | |
Actual | | $ 1,000.00 | $ 944.40 | $ 10.24 |
HypotheticalA | | $ 1,000.00 | $ 1,014.67 | $ 10.61 |
Class C | 2.09% | | | |
Actual | | $ 1,000.00 | $ 944.00 | $ 10.24 |
HypotheticalA | | $ 1,000.00 | $ 1,014.67 | $ 10.61 |
International Value | .96% | | | |
Actual | | $ 1,000.00 | $ 949.50 | $ 4.72 |
HypotheticalA | | $ 1,000.00 | $ 1,020.37 | $ 4.89 |
Institutional Class | 1.09% | | | |
Actual | | $ 1,000.00 | $ 948.50 | $ 5.35 |
HypotheticalA | | $ 1,000.00 | $ 1,019.71 | $ 5.55 |
A 5% return per year before expenses
B Annualized expense ratio reflects expenses net of applicable fee waivers.
* Expenses are equal to each Class' annualized expense ratio, multiplied by the average account value over the period, multiplied by 184/365 (to reflect the one-half year period).
Annual Report
Investment Changes (Unaudited)
Geographic Diversification (% of fund's net assets) |
As of October 31, 2014 |
 | United Kingdom 23.4% | |
 | Japan 18.6% | |
 | France 14.4% | |
 | Switzerland 7.9% | |
 | Germany 7.8% | |
 | Australia 5.7% | |
 | United States of America* 3.7% | |
 | Spain 2.9% | |
 | Netherlands 2.5% | |
 | Other 13.1% | |

* Includes short-term investments and net other assets (liabilities) |
Percentages are based on country or territory of incorporation and are adjusted for the effect of futures contracts, if applicable. |
As of April 30, 2014 |
| United Kingdom 24.4% | |
| France 17.9% | |
| Japan 15.4% | |
| Switzerland 7.7% | |
| Germany 7.5% | |
| United States of America* 6.3% | |
| Australia 5.4% | |
| Sweden 2.1% | |
| Netherlands 1.9% | |
| Other 11.4% | |

* Includes short-term investments and net other assets (liabilities) |
Percentages are based on country or territory of incorporation and are adjusted for the effect of futures contracts, if applicable. |
Asset Allocation as of October 31, 2014 |
| % of fund's
net assets | % of fund's net assets
6 months ago |
Stocks | 98.8 | 95.5 |
Short-Term Investments and Net Other Assets (Liabilities) | 1.2 | 4.5 |
Top Ten Stocks as of October 31, 2014 |
| % of fund's
net assets | % of fund's net assets
6 months ago |
Total SA (France, Oil, Gas & Consumable Fuels) | 3.3 | 4.8 |
Novartis AG (Switzerland, Pharmaceuticals) | 3.2 | 2.3 |
HSBC Holdings PLC sponsored ADR (United Kingdom, Banks) | 2.7 | 2.2 |
Westpac Banking Corp. (Australia, Banks) | 2.4 | 2.3 |
Sanofi SA (France, Pharmaceuticals) | 2.2 | 2.4 |
Mitsubishi UFJ Financial Group, Inc. (Japan, Banks) | 2.2 | 1.3 |
BHP Billiton PLC (United Kingdom, Metals & Mining) | 2.2 | 1.7 |
Nestle SA (Switzerland, Food Products) | 2.1 | 2.1 |
Royal Dutch Shell PLC Class A sponsored ADR (United Kingdom, Oil, Gas & Consumable Fuels) | 2.0 | 1.8 |
Vodafone Group PLC sponsored ADR (United Kingdom, Wireless Telecommunication Services) | 2.0 | 2.0 |
| 24.3 | |
Market Sectors as of October 31, 2014 |
| % of fund's
net assets | % of fund's net assets
6 months ago |
Financials | 25.5 | 23.8 |
Health Care | 16.1 | 15.6 |
Consumer Discretionary | 10.2 | 10.4 |
Telecommunication Services | 9.0 | 8.4 |
Consumer Staples | 8.5 | 8.3 |
Industrials | 8.1 | 9.4 |
Energy | 7.2 | 6.6 |
Information Technology | 5.5 | 4.0 |
Materials | 4.8 | 6.0 |
Utilities | 3.9 | 3.0 |
Annual Report
Investments October 31, 2014
Showing Percentage of Net Assets
Common Stocks - 97.8% |
| Shares | | Value |
Australia - 5.7% |
Ansell Ltd. | 52,575 | | $ 922,199 |
Australia & New Zealand Banking Group Ltd. | 116,005 | | 3,432,655 |
Telstra Corp. Ltd. | 236,519 | | 1,176,955 |
Transurban Group unit | 196,204 | | 1,405,195 |
Westpac Banking Corp. | 160,274 | | 4,919,494 |
TOTAL AUSTRALIA | | 11,856,498 |
Bailiwick of Jersey - 1.2% |
Shire PLC | 21,400 | | 1,435,874 |
Wolseley PLC | 20,590 | | 1,092,548 |
TOTAL BAILIWICK OF JERSEY | | 2,528,422 |
Belgium - 0.9% |
Anheuser-Busch InBev SA NV | 11,070 | | 1,227,601 |
UCB SA | 8,600 | | 693,937 |
TOTAL BELGIUM | | 1,921,538 |
Bermuda - 0.1% |
Travelport Worldwide Ltd. | 20,771 | | 300,141 |
Canada - 1.1% |
Imperial Oil Ltd. | 24,200 | | 1,164,426 |
Potash Corp. of Saskatchewan, Inc. | 33,600 | | 1,146,881 |
TOTAL CANADA | | 2,311,307 |
Denmark - 0.8% |
A.P. Moller - Maersk A/S Series B | 673 | | 1,568,199 |
Finland - 1.1% |
Sampo Oyj (A Shares) | 46,634 | | 2,230,632 |
France - 14.4% |
Atos Origin SA | 22,183 | | 1,531,426 |
AXA SA | 97,221 | | 2,242,936 |
BNP Paribas SA | 50,847 | | 3,194,867 |
Cap Gemini SA | 25,693 | | 1,689,064 |
GDF Suez | 78,778 | | 1,910,738 |
Havas SA | 155,466 | | 1,256,603 |
Orange SA | 130,000 | | 2,069,649 |
Renault SA | 16,345 | | 1,213,192 |
Sanofi SA | 51,166 | | 4,642,808 |
Schneider Electric SA | 13,405 | | 1,056,288 |
Common Stocks - continued |
| Shares | | Value |
France - continued |
Total SA | 114,563 | | $ 6,839,790 |
Vivendi SA | 98,899 | | 2,413,640 |
TOTAL FRANCE | | 30,061,001 |
Germany - 6.8% |
Allianz SE | 22,439 | | 3,568,298 |
BASF AG | 39,549 | | 3,481,153 |
Bayer AG | 15,003 | | 2,132,975 |
Continental AG | 6,566 | | 1,288,945 |
Fresenius SE & Co. KGaA | 29,100 | | 1,496,957 |
GEA Group AG | 27,042 | | 1,243,509 |
Siemens AG | 7,361 | | 830,272 |
TOTAL GERMANY | | 14,042,109 |
Ireland - 0.9% |
Actavis PLC (a) | 7,400 | | 1,796,276 |
Israel - 1.2% |
Teva Pharmaceutical Industries Ltd. sponsored ADR | 43,799 | | 2,473,330 |
Italy - 1.2% |
Intesa Sanpaolo SpA | 495,100 | | 1,455,475 |
Telecom Italia SpA (a)(d) | 891,000 | | 1,009,754 |
TOTAL ITALY | | 2,465,229 |
Japan - 18.6% |
Astellas Pharma, Inc. | 136,600 | | 2,120,100 |
Dentsu, Inc. | 31,700 | | 1,178,591 |
East Japan Railway Co. | 19,300 | | 1,507,392 |
Fujitsu Ltd. | 157,000 | | 954,476 |
Hitachi Ltd. | 250,000 | | 1,964,369 |
Hoya Corp. | 56,800 | | 2,009,973 |
Itochu Corp. | 220,200 | | 2,661,897 |
Japan Tobacco, Inc. | 92,300 | | 3,149,189 |
KDDI Corp. | 33,100 | | 2,173,659 |
Mitsubishi Electric Corp. | 90,000 | | 1,160,442 |
Mitsubishi UFJ Financial Group, Inc. | 790,400 | | 4,607,411 |
Nippon Telegraph & Telephone Corp. | 34,800 | | 2,165,216 |
OMRON Corp. | 27,200 | | 1,287,503 |
ORIX Corp. | 100,300 | | 1,392,188 |
Seven & i Holdings Co., Ltd. | 58,100 | | 2,269,161 |
Seven Bank Ltd. | 271,500 | | 1,133,893 |
SoftBank Corp. | 11,800 | | 859,033 |
Sony Financial Holdings, Inc. | 71,200 | | 1,136,687 |
Common Stocks - continued |
| Shares | | Value |
Japan - continued |
Sumitomo Mitsui Trust Holdings, Inc. | 442,000 | | $ 1,804,564 |
Toyota Motor Corp. | 51,300 | | 3,087,091 |
TOTAL JAPAN | | 38,622,835 |
Korea (South) - 0.5% |
Samsung Electronics Co. Ltd. | 841 | | 973,716 |
Luxembourg - 0.4% |
RTL Group SA | 9,839 | | 914,374 |
Netherlands - 2.5% |
ING Groep NV (Certificaten Van Aandelen) (a) | 171,690 | | 2,458,663 |
Reed Elsevier NV | 117,061 | | 2,694,054 |
TOTAL NETHERLANDS | | 5,152,717 |
Norway - 0.7% |
Statoil ASA | 66,000 | | 1,510,439 |
Singapore - 0.8% |
Singapore Telecommunications Ltd. | 530,000 | | 1,559,937 |
Spain - 2.9% |
Amadeus IT Holding SA Class A | 30,962 | | 1,136,841 |
Banco Bilbao Vizcaya Argentaria SA | 221,342 | | 2,475,686 |
Iberdrola SA | 343,700 | | 2,429,622 |
TOTAL SPAIN | | 6,042,149 |
Sweden - 2.2% |
Meda AB (A Shares) | 62,100 | | 815,761 |
Nordea Bank AB | 222,000 | | 2,847,098 |
Svenska Cellulosa AB (SCA) (B Shares) | 40,065 | | 895,801 |
TOTAL SWEDEN | | 4,558,660 |
Switzerland - 7.9% |
Credit Suisse Group AG | 79,817 | | 2,126,628 |
Nestle SA | 59,746 | | 4,381,421 |
Novartis AG | 71,563 | | 6,641,252 |
Roche Holding AG (participation certificate) | 4,927 | | 1,453,966 |
Syngenta AG (Switzerland) | 2,586 | | 799,740 |
UBS AG (NY Shares) | 61,458 | | 1,068,140 |
TOTAL SWITZERLAND | | 16,471,147 |
United Kingdom - 23.4% |
AstraZeneca PLC (United Kingdom) | 52,745 | | 3,852,937 |
BAE Systems PLC | 322,429 | | 2,365,927 |
Barclays PLC | 722,751 | | 2,779,641 |
Common Stocks - continued |
| Shares | | Value |
United Kingdom - continued |
BG Group PLC | 77,900 | | $ 1,298,284 |
BHP Billiton PLC | 176,628 | | 4,563,468 |
BT Group PLC | 85,378 | | 503,331 |
Bunzl PLC | 72,414 | | 1,963,499 |
Compass Group PLC | 131,339 | | 2,113,636 |
GlaxoSmithKline PLC | 45,639 | | 1,032,079 |
HSBC Holdings PLC sponsored ADR (d) | 110,742 | | 5,650,057 |
Imperial Tobacco Group PLC | 70,233 | | 3,045,855 |
Informa PLC | 135,091 | | 1,039,465 |
ITV PLC | 583,096 | | 1,893,541 |
Liberty Global PLC Class A (a) | 27,100 | | 1,232,237 |
National Grid PLC | 254,981 | | 3,783,908 |
Next PLC | 9,400 | | 969,146 |
Prudential PLC | 78,195 | | 1,810,686 |
Royal Dutch Shell PLC Class A sponsored ADR | 58,979 | | 4,234,102 |
Standard Chartered PLC (United Kingdom) | 37,125 | | 558,018 |
Vodafone Group PLC sponsored ADR | 122,858 | | 4,081,343 |
TOTAL UNITED KINGDOM | | 48,771,160 |
United States of America - 2.5% |
AbbVie, Inc. | 13,742 | | 872,067 |
Altria Group, Inc. | 25,800 | | 1,247,172 |
Constellation Brands, Inc. Class A (sub. vtg.) (a) | 14,800 | | 1,354,792 |
ResMed, Inc. CDI (d) | 209,067 | | 1,099,368 |
T-Mobile U.S., Inc. (a) | 24,700 | | 720,993 |
TOTAL UNITED STATES OF AMERICA | | 5,294,392 |
TOTAL COMMON STOCKS (Cost $201,705,371) |
203,426,208
|
Nonconvertible Preferred Stocks - 1.0% |
| | | |
Germany - 1.0% |
Volkswagen AG
(Cost $2,250,614) | 10,231 | |
2,180,207
|
Money Market Funds - 2.4% |
| Shares | | Value |
Fidelity Cash Central Fund, 0.11% (b) | 1,490,412 | | $ 1,490,412 |
Fidelity Securities Lending Cash Central Fund, 0.11% (b)(c) | 3,523,300 | | 3,523,300 |
TOTAL MONEY MARKET FUNDS (Cost $5,013,712) |
5,013,712
|
TOTAL INVESTMENT PORTFOLIO - 101.2% (Cost $208,969,697) | | 210,620,127 |
NET OTHER ASSETS (LIABILITIES) - (1.2)% | | (2,560,016) |
NET ASSETS - 100% | $ 208,060,111 |
Legend |
(a) Non-income producing |
(b) Affiliated fund that is generally available only to investment companies and other accounts managed by Fidelity Investments. The rate quoted is the annualized seven-day yield of the fund at period end. A complete unaudited listing of the fund's holdings as of its most recent quarter end is available upon request. In addition, each Fidelity Central Fund's financial statements, which are not covered by the Fund's Report of Independent Registered Public Accounting Firm, are available on the SEC's website or upon request. |
(c) Investment made with cash collateral received from securities on loan. |
(d) Security or a portion of the security is on loan at period end. |
Affiliated Central Funds |
Information regarding fiscal year to date income earned by the Fund from investments in Fidelity Central Funds is as follows: |
Fund | Income earned |
Fidelity Cash Central Fund | $ 3,947 |
Fidelity Securities Lending Cash Central Fund | 161,924 |
Total | $ 165,871 |
Other Information |
Categorizations in the Schedule of Investments are based on country or territory of incorporation. |
The following is a summary of the inputs used, as of October 31, 2014, involving the Fund's assets and liabilities carried at fair value. The inputs or methodology used for valuing securities may not be an indication of the risk associated with investing in those securities. For more information on valuation inputs, and their aggregation into the levels used in the tables below, please refer to the Investment Valuation section in the accompanying Notes to Financial Statements. |
Valuation Inputs at Reporting Date: |
Description | Total | Level 1 | Level 2 | Level 3 |
Investments in Securities: | | | | |
Equities: | | | | |
Consumer Discretionary | $ 21,361,223 | $ 17,095,541 | $ 4,265,682 | $ - |
Consumer Staples | 17,570,992 | 6,543,620 | 11,027,372 | - |
Energy | 15,047,041 | 5,398,528 | 9,648,513 | - |
Financials | 52,893,717 | 17,791,748 | 35,101,969 | - |
Health Care | 33,481,886 | 10,281,303 | 23,200,583 | - |
Industrials | 16,855,168 | 9,289,970 | 7,565,198 | - |
Information Technology | 11,547,368 | 5,331,047 | 6,216,321 | - |
Materials | 9,991,242 | 4,628,034 | 5,363,208 | - |
Telecommunication Services | 18,733,510 | 7,215,976 | 11,517,534 | - |
Utilities | 8,124,268 | 4,340,360 | 3,783,908 | - |
Money Market Funds | 5,013,712 | 5,013,712 | - | - |
Total Investments in Securities: | $ 210,620,127 | $ 92,929,839 | $ 117,690,288 | $ - |
The following is a summary of transfers between Level 1 and Level 2 for the period ended October 31, 2014. Transfers are assumed to have occurred at the beginning of the period, and are primarily attributable to the valuation techniques used for foreign equity securities, as discussed in the accompanying Notes to Financial Statements: |
Transfers | Total |
Level 1 to Level 2 | $ 18,553,193 |
Level 2 to Level 1 | $ 0 |
See accompanying notes which are an integral part of the financial statements.
Annual Report
Statement of Assets and Liabilities
| October 31, 2014 |
| | |
Assets | | |
Investment in securities, at value (including securities loaned of $3,468,947) - See accompanying schedule: Unaffiliated issuers (cost $203,955,985) | $ 205,606,415 | |
Fidelity Central Funds (cost $5,013,712) | 5,013,712 | |
Total Investments (cost $208,969,697) | | $ 210,620,127 |
Cash | | 2 |
Foreign currency held at value (cost $5,524) | | 5,524 |
Receivable for investments sold | | 2,809,678 |
Receivable for fund shares sold | | 79,904 |
Dividends receivable | | 723,355 |
Distributions receivable from Fidelity Central Funds | | 5,174 |
Prepaid expenses | | 677 |
Other receivables | | 1,614 |
Total assets | | 214,246,055 |
| | |
Liabilities | | |
Payable for investments purchased | $ 2,366,704 | |
Payable for fund shares redeemed | 54,010 | |
Accrued management fee | 122,100 | |
Distribution and service plan fees payable | 6,011 | |
Other affiliated payables | 42,738 | |
Other payables and accrued expenses | 71,081 | |
Collateral on securities loaned, at value | 3,523,300 | |
Total liabilities | | 6,185,944 |
| | |
Net Assets | | $ 208,060,111 |
Net Assets consist of: | | |
Paid in capital | | $ 303,438,497 |
Undistributed net investment income | | 7,054,946 |
Accumulated undistributed net realized gain (loss) on investments and foreign currency transactions | | (104,059,003) |
Net unrealized appreciation (depreciation) on investments and assets and liabilities in foreign currencies | | 1,625,671 |
Net Assets | | $ 208,060,111 |
See accompanying notes which are an integral part of the financial statements.
Annual Report
Financial Statements - continued
Statement of Assets and Liabilities - continued
| October 31, 2014 |
| | |
Calculation of Maximum Offering Price Class A:
Net Asset Value and redemption price per share ($6,296,411 ÷ 730,081 shares) | | $ 8.62 |
| | |
Maximum offering price per share (100/94.25 of $8.62) | | $ 9.15 |
Class T:
Net Asset Value and redemption price per share ($3,603,734 ÷ 418,897 shares) | | $ 8.60 |
| | |
Maximum offering price per share (100/96.50 of $8.60) | | $ 8.91 |
Class B:
Net Asset Value and offering price per share ($414,070 ÷ 47,839 shares)A | | $ 8.66 |
| | |
Class C:
Net Asset Value and offering price per share ($3,646,790 ÷ 424,463 shares)A | | $ 8.59 |
| | |
International Value:
Net Asset Value, offering price and redemption price per share ($192,789,069 ÷ 22,313,205 shares) | | $ 8.64 |
| | |
Institutional Class:
Net Asset Value, offering price and redemption price per share ($1,310,037 ÷ 151,443 shares) | | $ 8.65 |
A Redemption price per share is equal to net asset value less any applicable contingent deferred sales charge.
See accompanying notes which are an integral part of the financial statements.
Annual Report
Statement of Operations
| Year ended October 31, 2014 |
| | |
Investment Income | | |
Dividends | | $ 6,954,134 |
Special dividends | | 3,142,692 |
Income from Fidelity Central Funds | | 165,871 |
Income before foreign taxes withheld | | 10,262,697 |
Less foreign taxes withheld | | (513,411) |
Total income | | 9,749,286 |
| | |
Expenses | | |
Management fee
Basic fee | $ 1,434,574 | |
Performance adjustment | (213,552) | |
Transfer agent fees | 402,517 | |
Distribution and service plan fees | 76,579 | |
Accounting and security lending fees | 107,492 | |
Custodian fees and expenses | 104,890 | |
Independent trustees' compensation | 836 | |
Registration fees | 75,702 | |
Audit | 62,675 | |
Legal | 689 | |
Miscellaneous | 1,603 | |
Total expenses before reductions | 2,054,005 | |
Expense reductions | (4,121) | 2,049,884 |
Net investment income (loss) | | 7,699,402 |
Realized and Unrealized Gain (Loss) Net realized gain (loss) on: | | |
Investment securities: | | |
Unaffiliated issuers | 12,125,451 | |
Foreign currency transactions | (45,328) | |
Total net realized gain (loss) | | 12,080,123 |
Change in net unrealized appreciation (depreciation) on: Investment securities | (23,406,359) | |
Assets and liabilities in foreign currencies | (29,100) | |
Total change in net unrealized appreciation (depreciation) | | (23,435,459) |
Net gain (loss) | | (11,355,336) |
Net increase (decrease) in net assets resulting from operations | | $ (3,655,934) |
See accompanying notes which are an integral part of the financial statements.
Annual Report
Financial Statements - continued
Statement of Changes in Net Assets
| Year ended
October 31,
2014 | Year ended
October 31,
2013 |
Increase (Decrease) in Net Assets | | |
Operations | | |
Net investment income (loss) | $ 7,699,402 | $ 3,964,300 |
Net realized gain (loss) | 12,080,123 | 9,397,591 |
Change in net unrealized appreciation (depreciation) | (23,435,459) | 23,791,522 |
Net increase (decrease) in net assets resulting
from operations | (3,655,934) | 37,153,413 |
Distributions to shareholders from net investment income | (4,160,313) | (4,120,600) |
Distributions to shareholders from net realized gain | (301,192) | (786,952) |
Total distributions | (4,461,505) | (4,907,552) |
Share transactions - net increase (decrease) | 20,511,129 | 23,938,130 |
Redemption fees | 1,150 | 3,144 |
Total increase (decrease) in net assets | 12,394,840 | 56,187,135 |
| | |
Net Assets | | |
Beginning of period | 195,665,271 | 139,478,136 |
End of period (including undistributed net investment income of $7,054,946 and undistributed net investment income of $3,680,675, respectively) | $ 208,060,111 | $ 195,665,271 |
See accompanying notes which are an integral part of the financial statements.
Annual Report
Financial Highlights - Class A
Years ended October 31, | 2014 | 2013 | 2012 | 2011 | 2010 |
Selected Per-Share Data | | | | | |
Net asset value, beginning of period | $ 8.96 | $ 7.39 | $ 7.02 | $ 8.22 | $ 7.75 |
Income from Investment Operations | | | | | |
Net investment income (loss) C | .31 I | .17 | .20 | .22 | .15 |
Net realized and unrealized gain (loss) | (.47) | 1.64 | .39 | (1.19) | .44 |
Total from investment operations | (.16) | 1.81 | .59 | (.97) | .59 |
Distributions from net investment income | (.17) | (.20) | (.22) | (.19) | (.11) |
Distributions from net realized gain | (.01) | (.04) | - | (.03) | (.01) |
Total distributions | (.18) | (.24) | (.22) | (.23) H | (.12) |
Redemption fees added to paid in capital C, G | - | - | - | - | - |
Net asset value, end of period | $ 8.62 | $ 8.96 | $ 7.39 | $ 7.02 | $ 8.22 |
Total Return A, B | (1.76)% | 25.24% | 8.82% | (12.19)% | 7.60% |
Ratios to Average Net Assets D, F | | | | | |
Expenses before reductions | 1.32% | 1.39% | 1.44% | 1.36% | 1.40% |
Expenses net of fee waivers, if any | 1.32% | 1.39% | 1.44% | 1.36% | 1.40% |
Expenses net of all reductions | 1.32% | 1.36% | 1.41% | 1.34% | 1.38% |
Net investment income (loss) | 3.44% I | 2.08% | 2.85% | 2.79% | 1.93% |
Supplemental Data | | | | | |
Net assets, end of period (000 omitted) | $ 6,296 | $ 6,191 | $ 4,491 | $ 4,668 | $ 4,699 |
Portfolio turnover rate E | 69% | 79% | 74% | 83% | 43% |
A Total returns would have been lower if certain expenses had not been reduced during the applicable periods shown.
B Total returns do not include the effect of the sales charges.
C Calculated based on average shares outstanding during the period.
D Fees and expenses of any underlying Fidelity Central Funds are not included in the Fund's expense ratio. The Fund indirectly bears its proportionate share of the expenses of any underlying Fidelity Central Funds.
E Amount does not include the portfolio activity of any underlying Fidelity Central Funds.
F Expense ratios reflect operating expenses of the class. Expenses before reductions do not reflect amounts reimbursed by the investment adviser or reductions from brokerage service arrangements or reductions from other expense offset arrangements and do not represent the amount paid by the class during periods when reimbursements or reductions occur. Expenses net of fee waivers reflect expenses after reimbursement by the investment adviser but prior to reductions from brokerage service arrangements or other expense offset arrangements. Expenses net of all reductions represent the net expenses paid by the class.
G Amount represents less than $.01 per share.
H Total distributions of $.23 per share is comprised of distributions from net investment income of $.191 and distributions from net realized gain of $.034 per share.
I Investment income per share reflects a large, non-recurring dividend which amounted to $.14 per share. Excluding this non-recurring dividend, the ratio of net investment income (loss) to average net assets would have been 1.90%.
See accompanying notes which are an integral part of the financial statements.
Annual Report
Financial Highlights - Class T
Years ended October 31, | 2014 | 2013 | 2012 | 2011 | 2010 |
Selected Per-Share Data | | | | | |
Net asset value, beginning of period | $ 8.94 | $ 7.38 | $ 7.00 | $ 8.20 | $ 7.73 |
Income from Investment Operations | | | | | |
Net investment income (loss) C | .28 I | .15 | .18 | .20 | .13 |
Net realized and unrealized gain (loss) | (.46) | 1.64 | .40 | (1.19) | .44 |
Total from investment operations | (.18) | 1.79 | .58 | (.99) | .57 |
Distributions from net investment income | (.15) | (.19) | (.20) | (.17) | (.09) |
Distributions from net realized gain | (.01) | (.04) | - | (.03) | (.01) |
Total distributions | (.16) | (.23) | (.20) | (.21) H | (.10) |
Redemption fees added to paid in capital C, G | - | - | - | - | - |
Net asset value, end of period | $ 8.60 | $ 8.94 | $ 7.38 | $ 7.00 | $ 8.20 |
Total Return A, B | (1.99)% | 24.86% | 8.60% | (12.42)% | 7.32% |
Ratios to Average Net Assets D, F | | | | | |
Expenses before reductions | 1.59% | 1.66% | 1.71% | 1.63% | 1.67% |
Expenses net of fee waivers, if any | 1.59% | 1.65% | 1.70% | 1.62% | 1.67% |
Expenses net of all reductions | 1.59% | 1.63% | 1.67% | 1.60% | 1.65% |
Net investment income (loss) | 3.17% I | 1.81% | 2.58% | 2.52% | 1.65% |
Supplemental Data | | | | | |
Net assets, end of period (000 omitted) | $ 3,604 | $ 3,758 | $ 2,693 | $ 2,468 | $ 2,276 |
Portfolio turnover rate E | 69% | 79% | 74% | 83% | 43% |
A Total returns would have been lower if certain expenses had not been reduced during the applicable periods shown.
B Total returns do not include the effect of the sales charges.
C Calculated based on average shares outstanding during the period.
D Fees and expenses of any underlying Fidelity Central Funds are not included in the Fund's expense ratio. The Fund indirectly bears its proportionate share of the expenses of any underlying Fidelity Central Funds.
E Amount does not include the portfolio activity of any underlying Fidelity Central Funds.
F Expense ratios reflect operating expenses of the class. Expenses before reductions do not reflect amounts reimbursed by the investment adviser or reductions from brokerage service arrangements or reductions from other expense offset arrangements and do not represent the amount paid by the class during periods when reimbursements or reductions occur. Expenses net of fee waivers reflect expenses after reimbursement by the investment adviser but prior to reductions from brokerage service arrangements or other expense offset arrangements. Expenses net of all reductions represent the net expenses paid by the class.
G Amount represents less than $.01 per share.
H Total distributions of $.21 per share is comprised of distributions from net investment income of $.173 and distributions from net realized gain of $.034 per share.
I Investment income per share reflects a large, non-recurring dividend which amounted to $.14 per share. Excluding this non-recurring dividend, the ratio of net investment income (loss) to average net assets would have been 1.64%.
See accompanying notes which are an integral part of the financial statements.
Annual Report
Financial Highlights - Class B
Years ended October 31, | 2014 | 2013 | 2012 | 2011 | 2010 |
Selected Per-Share Data | | | | | |
Net asset value, beginning of period | $ 8.98 | $ 7.39 | $ 7.00 | $ 8.20 | $ 7.74 |
Income from Investment Operations | | | | | |
Net investment income (loss) C | .24 J | .11 | .14 | .17 | .09 |
Net realized and unrealized gain (loss) | (.45) | 1.65 | .41 | (1.20) | .44 |
Total from investment operations | (.21) | 1.76 | .55 | (1.03) | .53 |
Distributions from net investment income | (.09) | (.13) | (.16) | (.13) | (.06) |
Distributions from net realized gain | (.01) | (.04) | - | (.03) | (.01) |
Total distributions | (.11) I | (.17) | (.16) | (.17) H | (.07) |
Redemption fees added to paid in capital C, G | - | - | - | - | - |
Net asset value, end of period | $ 8.66 | $ 8.98 | $ 7.39 | $ 7.00 | $ 8.20 |
Total Return A, B | (2.39)% | 24.30% | 8.07% | (12.88)% | 6.82% |
Ratios to Average Net Assets D, F | | | | | |
Expenses before reductions | 2.08% | 2.14% | 2.19% | 2.11% | 2.15% |
Expenses net of fee waivers, if any | 2.08% | 2.14% | 2.19% | 2.11% | 2.15% |
Expenses net of all reductions | 2.08% | 2.11% | 2.16% | 2.09% | 2.13% |
Net investment income (loss) | 2.68% J | 1.32% | 2.09% | 2.04% | 1.18% |
Supplemental Data | | | | | |
Net assets, end of period (000 omitted) | $ 414 | $ 678 | $ 691 | $ 901 | $ 1,216 |
Portfolio turnover rate E | 69% | 79% | 74% | 83% | 43% |
A Total returns would have been lower if certain expenses had not been reduced during the applicable periods shown.
B Total returns do not include the effect of the contingent deferred sales charge.
C Calculated based on average shares outstanding during the period.
D Fees and expenses of any underlying Fidelity Central Funds are not included in the Fund's expense ratio. The Fund indirectly bears its proportionate share of the expenses of any underlying Fidelity Central Funds.
E Amount does not include the portfolio activity of any underlying Fidelity Central Funds.
F Expense ratios reflect operating expenses of the class. Expenses before reductions do not reflect amounts reimbursed by the investment adviser or reductions from brokerage service arrangements or reductions from other expense offset arrangements and do not represent the amount paid by the class during periods when reimbursements or reductions occur. Expenses net of fee waivers reflect expenses after reimbursement by the investment adviser but prior to reductions from brokerage service arrangements or other expense offset arrangements. Expenses net of all reductions represent the net expenses paid by the class.
G Amount represents less than $.01 per share.
H Total distributions of $.17 per share is comprised of distributions from net investment income of $.131 and distributions from net realized gain of $.034 per share.
I Total distributions of $.11 per share is comprised of distributions from net investment income of $.093 and distributions from net realized gain of $.014 per share.
J Investment income per share reflects a large, non-recurring dividend which amounted to $.14 per share. Excluding this non-recurring dividend, the ratio of net investment income (loss) to average net assets would have been 1.15%.
See accompanying notes which are an integral part of the financial statements.
Annual Report
Financial Highlights - Class C
Years ended October 31, | 2014 | 2013 | 2012 | 2011 | 2010 |
Selected Per-Share Data | | | | | |
Net asset value, beginning of period | $ 8.93 | $ 7.38 | $ 7.00 | $ 8.20 | $ 7.73 |
Income from Investment Operations | | | | | |
Net investment income (loss) C | .24 I | .11 | .14 | .16 | .09 |
Net realized and unrealized gain (loss) | (.45) | 1.63 | .41 | (1.19) | .44 |
Total from investment operations | (.21) | 1.74 | .55 | (1.03) | .53 |
Distributions from net investment income | (.11) | (.15) | (.17) | (.14) | (.05) |
Distributions from net realized gain | (.01) | (.04) | - | (.03) | (.01) |
Total distributions | (.13) H | (.19) | (.17) | (.17) | (.06) |
Redemption fees added to paid in capital C, G | - | - | - | - | - |
Net asset value, end of period | $ 8.59 | $ 8.93 | $ 7.38 | $ 7.00 | $ 8.20 |
Total Return A, B | (2.43)% | 24.17% | 8.12% | (12.84)% | 6.84% |
Ratios to Average Net Assets D, F | | | | | |
Expenses before reductions | 2.07% | 2.14% | 2.19% | 2.12% | 2.15% |
Expenses net of fee waivers, if any | 2.07% | 2.14% | 2.19% | 2.11% | 2.15% |
Expenses net of all reductions | 2.07% | 2.11% | 2.16% | 2.09% | 2.13% |
Net investment income (loss) | 2.69% I | 1.33% | 2.09% | 2.04% | 1.18% |
Supplemental Data | | | | | |
Net assets, end of period (000 omitted) | $ 3,647 | $ 3,231 | $ 2,249 | $ 2,108 | $ 2,123 |
Portfolio turnover rate E | 69% | 79% | 74% | 83% | 43% |
A Total returns would have been lower if certain expenses had not been reduced during the applicable periods shown.
B Total returns do not include the effect of the contingent deferred sales charge.
C Calculated based on average shares outstanding during the period.
D Fees and expenses of any underlying Fidelity Central Funds are not included in the Fund's expense ratio. The Fund indirectly bears its proportionate share of the expenses of any underlying Fidelity Central Funds.
E Amount does not include the portfolio activity of any underlying Fidelity Central Funds.
F Expense ratios reflect operating expenses of the class. Expenses before reductions do not reflect amounts reimbursed by the investment adviser or reductions from brokerage service arrangements or reductions from other expense offset arrangements and do not represent the amount paid by the class during periods when reimbursements or reductions occur. Expenses net of fee waivers reflect expenses after reimbursement by the investment adviser but prior to reductions from brokerage service arrangements or other expense offset arrangements. Expenses net of all reductions represent the net expenses paid by the class.
G Amount represents less than $.01 per share.
H Total distributions of $.13 per share is comprised of distributions from net investment income of $.111 and distributions from net realized gain of $.014 per share.
I Investment income per share reflects a large, non-recurring dividend which amounted to $.14 per share. Excluding this non-recurring dividend, the ratio of net investment income (loss) to average net assets would have been 1.15%.
See accompanying notes which are an integral part of the financial statements.
Annual Report
Financial Highlights - International Value
Years ended October 31, | 2014 | 2013 | 2012 | 2011 | 2010 |
Selected Per-Share Data | | | | | |
Net asset value, beginning of period | $ 8.97 | $ 7.40 | $ 7.03 | $ 8.23 | $ 7.75 |
Income from Investment Operations | | | | | |
Net investment income (loss) B | .34 I | .19 | .22 | .25 | .17 |
Net realized and unrealized gain (loss) | (.46) | 1.65 | .40 | (1.20) | .44 |
Total from investment operations | (.12) | 1.84 | .62 | (.95) | .61 |
Distributions from net investment income | (.20) | (.22) | (.25) | (.22) | (.13) |
Distributions from net realized gain | (.01) | (.04) | - | (.03) | (.01) |
Total distributions | (.21) | (.27) H | (.25) | (.25) | (.13) G |
Redemption fees added to paid in capital B, F | - | - | - | - | - |
Net asset value, end of period | $ 8.64 | $ 8.97 | $ 7.40 | $ 7.03 | $ 8.23 |
Total Return A | (1.34)% | 25.57% | 9.19% | (11.91)% | 7.95% |
Ratios to Average Net Assets C, E | | | | | |
Expenses before reductions | .96% | 1.05% | 1.13% | 1.04% | 1.09% |
Expenses net of fee waivers, if any | .96% | 1.05% | 1.13% | 1.03% | 1.09% |
Expenses net of all reductions | .95% | 1.02% | 1.10% | 1.01% | 1.08% |
Net investment income (loss) | 3.80% I | 2.41% | 3.16% | 3.11% | 2.23% |
Supplemental Data | | | | | |
Net assets, end of period (000 omitted) | $ 192,789 | $ 181,568 | $ 128,983 | $ 150,967 | $ 163,090 |
Portfolio turnover rate D | 69% | 79% | 74% | 83% | 43% |
A Total returns would have been lower if certain expenses had not been reduced during the applicable periods shown.
B Calculated based on average shares outstanding during the period.
C Fees and expenses of any underlying Fidelity Central Funds are not included in the Fund's expense ratio. The Fund indirectly bears its proportionate share of the expenses of any underlying Fidelity Central Funds.
D Amount does not include the portfolio activity of any underlying Fidelity Central Funds.
E Expense ratios reflect operating expenses of the class. Expenses before reductions do not reflect amounts reimbursed by the investment adviser or reductions from brokerage service arrangements or reductions from other expense offset arrangements and do not represent the amount paid by the class during periods when reimbursements or reductions occur. Expenses net of fee waivers reflect expenses after reimbursement by the investment adviser but prior to reductions from brokerage service arrangements or other expense offset arrangements. Expenses net of all reductions represent the net expenses paid by the class.
F Amount represents less than $.01 per share.
G Total distributions of $.13 per share is comprised of distributions from net investment income of $.129 and distributions from net realized gain of $.005 per share.
H Total distributions of $.27 per share is comprised of distributions from net investment income of $.223 and distributions from net realized gain of $.042 per share.
I Investment income per share reflects a large, non-recurring dividend which amounted to $.14 per share. Excluding this non-recurring dividend, the ratio of net investment income (loss) to average net assets would have been 2.27%.
See accompanying notes which are an integral part of the financial statements.
Annual Report
Financial Highlights - Institutional Class
Years ended October 31, | 2014 | 2013 | 2012 | 2011 | 2010 |
Selected Per-Share Data | | | | | |
Net asset value, beginning of period | $ 8.98 | $ 7.41 | $ 7.04 | $ 8.24 | $ 7.76 |
Income from Investment Operations | | | | | |
Net investment income (loss) B | .33 J | .19 | .22 | .25 | .18 |
Net realized and unrealized gain (loss) | (.45) | 1.65 | .40 | (1.19) | .44 |
Total from investment operations | (.12) | 1.84 | .62 | (.94) | .62 |
Distributions from net investment income | (.19) | (.23) | (.25) | (.22) | (.14) |
Distributions from net realized gain | (.01) | (.04) | - | (.03) | (.01) |
Total distributions | (.21) I | (.27) | (.25) | (.26) H | (.14) G |
Redemption fees added to paid in capital B, F | - | - | - | - | - |
Net asset value, end of period | $ 8.65 | $ 8.98 | $ 7.41 | $ 7.04 | $ 8.24 |
Total Return A | (1.41)% | 25.64% | 9.22% | (11.83)% | 8.05% |
Ratios to Average Net Assets C, E | | | | | |
Expenses before reductions | 1.05% | 1.07% | 1.10% | .98% | .98% |
Expenses net of fee waivers, if any | 1.05% | 1.07% | 1.10% | .98% | .98% |
Expenses net of all reductions | 1.04% | 1.04% | 1.07% | .96% | .97% |
Net investment income (loss) | 3.71% J | 2.39% | 3.18% | 3.17% | 2.34% |
Supplemental Data | | | | | |
Net assets, end of period (000 omitted) | $ 1,310 | $ 239 | $ 372 | $ 473 | $ 519 |
Portfolio turnover rate D | 69% | 79% | 74% | 83% | 43% |
A Total returns would have been lower if certain expenses had not been reduced during the applicable periods shown.
B Calculated based on average shares outstanding during the period.
C Fees and expenses of any underlying Fidelity Central Funds are not included in the Fund's expense ratio. The Fund indirectly bears its proportionate share of the expenses of any underlying Fidelity Central Funds.
D Amount does not include the portfolio activity of any underlying Fidelity Central Funds.
E Expense ratios reflect operating expenses of the class. Expenses before reductions do not reflect amounts reimbursed by the investment adviser or reductions from brokerage service arrangements or reductions from other expense offset arrangements and do not represent the amount paid by the class during periods when reimbursements or reductions occur. Expenses net of fee waivers reflect expenses after reimbursement by the investment adviser but prior to reductions from brokerage service arrangements or other expense offset arrangements. Expenses net of all reductions represent the net expenses paid by the class.
F Amount represents less than $.01 per share.
G Total distributions of $.14 per share is comprised of distributions from net investment income of $.137 and distributions from net realized gain of $.005 per share.
H Total distributions of $.26 per share is comprised of distributions from net investment income of $.221 and distributions from net realized gain of $.034 per share.
I Total distributions of $.21 per share is comprised of distributions from net investment income of $.191 and distributions from net realized gain of $.014 per share.
J Investment income per share reflects a large, non-recurring dividend which amounted to $.14 per share. Excluding this non-recurring dividend, the ratio of net investment income (loss) to average net assets would have been 2.18%.
See accompanying notes which are an integral part of the financial statements.
Annual Report
Notes to Financial Statements
For the period ended October 31, 2014
1. Organization.
Fidelity International Value Fund (the Fund) is a fund of Fidelity Investment Trust (the Trust) and is authorized to issue an unlimited number of shares. The Trust is registered under the Investment Company Act of 1940, as amended (the 1940 Act), as an open-end management investment company organized as a Massachusetts business trust. The Fund offers Class A, Class T, Class C, International Value and Institutional Class shares, each of which, along with Class B shares, has equal rights as to assets and voting privileges. Class B shares are closed to new accounts and additional purchases, except for exchanges and reinvestments. Each class has exclusive voting rights with respect to matters that affect that class. Class B shares will automatically convert to Class A shares after a holding period of seven years from the initial date of purchase.
2. Investments in Fidelity Central Funds.
The Fund invests in Fidelity Central Funds, which are open-end investment companies generally available only to other investment companies and accounts managed by the investment adviser and its affiliates. The Fund's Schedule of Investments lists each of the Fidelity Central Funds held as of period end, if any, as an investment of the Fund, but does not include the underlying holdings of each Fidelity Central Fund. As an Investing Fund, the Fund indirectly bears its proportionate share of the expenses of the underlying Fidelity Central Funds.
The Money Market Central Funds seek preservation of capital and current income and are managed by Fidelity Investments Money Management, Inc. (FIMM), an affiliate of the investment adviser. Annualized expenses of the Money Market Central Funds as of their most recent shareholder report date are less than .01%.
A complete unaudited list of holdings for each Fidelity Central Fund is available upon request or at the Securities and Exchange Commission (the SEC) website at www.sec.gov. In addition, the financial statements of the Fidelity Central Funds, which are not covered by the Fund's Report of Independent Registered Public Accounting Firm, are available on the SEC website or upon request.
3. Significant Accounting Policies.
The financial statements have been prepared in conformity with accounting principles generally accepted in the United States of America (GAAP), which require management to make certain estimates and assumptions at the date of the financial statements. Actual results could differ from those estimates. Subsequent events, if any, through the date that the financial statements were issued have been evaluated in the preparation of
Annual Report
Notes to Financial Statements - continued
3. Significant Accounting Policies - continued
the financial statements. The following summarizes the significant accounting policies of the Fund:
Investment Valuation. Investments are valued as of 4:00 p.m. Eastern time on the last calendar day of the period. In accordance with valuation policies and procedures approved by the Board of Trustees (the Board), the Fund attempts to obtain prices from one or more third party pricing vendors or brokers to value its investments. When current market prices, quotations or currency exchange rates are not readily available or reliable, investments will be fair valued in good faith by the Fidelity Management & Research Company (FMR) Fair Value Committee (the Committee), in accordance with procedures adopted by the Board. Factors used in determining fair value vary by investment type and may include market or investment specific events. The frequency with which these procedures are used cannot be predicted and they may be utilized to a significant extent. The Committee oversees the Fund's valuation policies and procedures and is responsible for approving and reporting to the Board all fair value determinations.
The Fund categorizes the inputs to valuation techniques used to value its investments into a disclosure hierarchy consisting of three levels as shown below:
Level 1 - quoted prices in active markets for identical investments
Level 2 - other significant observable inputs (including quoted prices for similar investments, interest rates, prepayment speeds, etc.)
Level 3 - unobservable inputs (including the Fund's own assumptions based on the best information available)
Valuation techniques used to value the Fund's investments by major category are as follows:
Equity securities, including restricted securities, for which market quotations are readily available, are valued at the last reported sale price or official closing price as reported by a third party pricing vendor on the primary market or exchange on which they are traded and are categorized as Level 1 in the hierarchy. In the event there were no sales during the day or closing prices are not available, securities are valued at the last quoted bid price or may be valued using the last available price and are generally categorized as Level 2 in the hierarchy. For foreign equity securities, when market or security specific events arise, comparisons to the valuation of American Depositary Receipts (ADRs), futures contracts, Exchange-Traded Funds (ETFs) and certain indexes as well as quoted prices for similar securities may be used and would be categorized as Level 2 in the hierarchy. Utilizing these techniques may result in transfers between Level 1 and Level 2. For equity securities, including restricted securities, where observable inputs are
Annual Report
3. Significant Accounting Policies - continued
Investment Valuation - continued
limited, assumptions about market activity and risk are used and these securities may be categorized as Level 3 in the hierarchy.
The U.S. dollar value of foreign currency contracts is determined using currency exchange rates supplied by a pricing service and are categorized as Level 2 in the hierarchy. Investments in open-end mutual funds, including the Fidelity Central Funds, are valued at their closing net asset value (NAV) each business day and are categorized as Level 1 in the hierarchy.
Changes in valuation techniques may result in transfers in or out of an assigned level within the disclosure hierarchy. The aggregate value of investments by input level, as of October 31, 2014, including information on transfers between Levels 1 and 2, is included at the end of the Fund's Schedule of Investments.
Foreign Currency. The Fund may use foreign currency contracts to facilitate transactions in foreign-denominated securities. Gains and losses from these transactions may arise from changes in the value of the foreign currency or if the counterparties do not perform under the contracts' terms.
Foreign-denominated assets, including investment securities, and liabilities are translated into U.S. dollars at the exchange rates at period end. Purchases and sales of investment securities, income and dividends received and expenses denominated in foreign currencies are translated into U.S. dollars at the exchange rate in effect on the transaction date.
The effects of exchange rate fluctuations on investments are included with the net realized and unrealized gain (loss) on investment securities. Other foreign currency transactions resulting in realized and unrealized gain (loss) are disclosed separately.
Investment Transactions and Income. For financial reporting purposes, the Fund's investment holdings and NAV include trades executed through the end of the last business day of the period. The NAV per share for processing shareholder transactions is calculated as of the close of business of the New York Stock Exchange (NYSE), normally 4:00 p.m. Eastern time and includes trades executed through the end of the prior business day. Gains and losses on securities sold are determined on the basis of identified cost and may include proceeds received from litigation. Dividend income is recorded on the ex-dividend date, except for certain dividends from foreign securities where the ex-dividend date may have passed, which are recorded as soon as the Fund is informed of the ex-dividend date. Non-cash dividends included in dividend income, if any, are recorded at the fair market value of the securities received. Income and capital gain distributions from Fidelity Central Funds, if any, are recorded on the ex-dividend date.
Annual Report
Notes to Financial Statements - continued
3. Significant Accounting Policies - continued
Investment Transactions and Income - continued
Large, non-recurring dividends recognized by the Fund are presented separately on the Statement of Operations as "Special Dividends" and the impact of these dividends is presented in the Financial Highlights. Investment income is recorded net of foreign taxes withheld where recovery of such taxes is uncertain.
Class Allocations and Expenses. Investment income, realized and unrealized capital gains and losses, common expenses of the Fund, and certain fund-level expense reductions, if any, are allocated daily on a pro-rata basis to each class based on the relative net assets of each class to the total net assets of the Fund. Each class differs with respect to transfer agent and distribution and service plan fees incurred. Certain expense reductions may also differ by class. For the reporting period, the allocated portion of income and expenses to each class as a percent of its average net assets may vary due to the timing of recording these transactions in relation to fluctuating net assets of the classes. Expenses directly attributable to a fund are charged to that fund. Expenses attributable to more than one fund are allocated among the respective funds on the basis of relative net assets or other appropriate methods. Expense estimates are accrued in the period to which they relate and adjustments are made when actual amounts are known.
Income Tax Information and Distributions to Shareholders. Each year, the Fund intends to qualify as a regulated investment company under Subchapter M of the Internal Revenue Code, including distributing substantially all of its taxable income and realized gains. As a result, no provision for U.S. Federal income taxes is required. As of October 31, 2014, the Fund did not have any unrecognized tax benefits in the financial statements; nor is the Fund aware of any tax positions for which it is reasonably possible that the total amounts of unrecognized tax benefits will significantly change in the next twelve months. The Fund files a U.S. federal tax return, in addition to state and local tax returns as required. The Fund's federal income tax returns are subject to examination by the Internal Revenue Service (IRS) for a period of three fiscal years after they are filed. State and local tax returns may be subject to examination for an additional fiscal year depending on the jurisdiction. Foreign taxes are provided for based on the Fund's understanding of the tax rules and rates that exist in the foreign markets in which it invests.
Distributions are declared and recorded on the ex-dividend date. Income dividends and capital gain distributions are declared separately for each class. Income and capital gain distributions are determined in accordance with income tax regulations, which may differ from GAAP.
Capital accounts within the financial statements are adjusted for permanent book-tax differences. These adjustments have no impact on net assets or the results of operations.
Annual Report
3. Significant Accounting Policies - continued
Income Tax Information and Distributions to Shareholders - continued
Capital accounts are not adjusted for temporary book-tax differences which will reverse in a subsequent period.
Book-tax differences are primarily due to foreign currency transactions, passive foreign investment companies (PFIC), capital loss carryforwards and losses deferred due to wash sales.
The federal tax cost of investment securities and unrealized appreciation (depreciation) as of period end were as follows:
Gross unrealized appreciation | $ 15,866,348 |
Gross unrealized depreciation | (15,294,421) |
Net unrealized appreciation (depreciation) on securities | $ 571,927 |
| |
Tax Cost | $ 210,048,200 |
The tax-based components of distributable earnings as of period end were as follows:
Undistributed ordinary income | $ 7,055,942 |
Capital loss carryforward | $ (102,980,501) |
Net unrealized appreciation (depreciation) on securities and other investments | $ 546,172 |
Capital loss carryforwards are only available to offset future capital gains of the Fund to the extent provided by regulations and may be limited. Under the Regulated Investment Company Modernization Act of 2010 (the Act), the Fund is permitted to carry forward capital losses incurred in taxable years beginning after December 22, 2010 for an unlimited period and such capital losses are required to be used prior to any losses that expire. The capital loss carryforward information presented below, including any applicable limitation, is estimated as of fiscal period end and is subject to adjustment.
Fiscal year of expiration | |
2016 | $ (2,663,413) |
2017 | (65,376,972) |
2018 | (3,571,319) |
2019 | (31,368,797) |
Total capital loss carryforward | $ (102,980,501) |
The tax character of distributions paid was as follows:
| October 31, 2014 | October 31, 2013 |
Ordinary Income | $ 4,461,505 | $ 4,907,552 |
Annual Report
Notes to Financial Statements - continued
3. Significant Accounting Policies - continued
Short-Term Trading (Redemption) Fees. Shares held by investors in the Fund less than 30 days may have been subject to a redemption fee equal to 1.00% of the NAV of shares redeemed. All redemption fees, which reduce the proceeds of the shareholder redemption, are retained by the Fund and accounted for as an addition to paid in capital.
New Accounting Pronouncement. In June 2014, the Financial Accounting Standards Board issued Accounting Standard Update No. 2014-11, Repurchase-to-Maturity Transactions, Repurchase Financings, and Disclosures. The Update amends the accounting for certain repurchase agreements and expands disclosure requirements for reverse repurchase agreements, securities lending and other similar transactions. The disclosure requirements are effective for annual and interim reporting periods beginning after December 15, 2014. Management is currently evaluating the impact of the Update on the Fund's financial statements and related disclosures.
4. Purchases and Sales of Investments.
Purchases and sales of securities, other than short-term securities, aggregated $163,988,914 and $139,217,160, respectively.
5. Fees and Other Transactions with Affiliates.
Management Fee. Fidelity Management & Research Company (the investment adviser) and its affiliates provide the Fund with investment management related services for which the Fund pays a monthly management fee. The management fee is the sum of an individual fund fee rate that is based on an annual rate of .45% of the Fund's average net assets and an annualized group fee rate that averaged .25% during the period. The group fee rate is based upon the average net assets of all the mutual funds advised by the investment adviser, including any mutual funds previously advised by the investment adviser that are currently advised by Fidelity SelectCo, LLC, an affiliate of the investment adviser. The group fee rate decreases as assets under management increase and increases as assets under management decrease. In addition, the management fee is subject to a performance adjustment (up to a maximum of ± .20% of the Fund's average net assets over a 36 month performance period). The upward or downward adjustment to the management fee is based on the relative investment performance of International Value as compared to its benchmark index, the MSCI EAFE Value Index, over the same 36 month performance period. For the reporting period, the total annual management fee rate, including the performance adjustment, was .60% of the Fund's average net assets. The performance adjustment included in the management fee rate may be higher or lower than the maximum performance adjustment rate due to the difference between the average net assets for the reporting and performance periods.
Annual Report
5. Fees and Other Transactions with Affiliates - continued
Distribution and Service Plan Fees. In accordance with Rule 12b-1 of the 1940 Act, the Fund has adopted separate Distribution and Service Plans for each class of shares. Certain classes pay Fidelity Distributors Corporation (FDC), an affiliate of the investment adviser, separate Distribution and Service Fees, each of which is based on an annual percentage of each class' average net assets. In addition, FDC may pay financial intermediaries for selling shares of the Fund and providing shareholder support services.
For the period, the Distribution and Service Fee rates, total fees and amounts retained by FDC were as follows:
| Distribution
Fee | Service
Fee | Total Fees | Retained
by FDC |
Class A | -% | .25% | $ 16,198 | $ 317 |
Class T | .25% | .25% | 19,035 | - |
Class B | .75% | .25% | 5,831 | 4,374 |
Class C | .75% | .25% | 35,515 | 6,658 |
| | | $ 76,579 | $ 11,349 |
Sales Load. FDC may receive a front-end sales charge of up to 5.75% for selling Class A shares and 3.50% for selling Class T shares, some of which is paid to financial intermediaries for selling shares of the Fund. Depending on the holding period, FDC may receive contingent deferred sales charges levied on Class A, Class T, Class B, and Class C redemptions. The deferred sales charges range from 5.00% to 1.00% for Class B shares, 1.00% for Class C shares, 1.00% for certain purchases of Class A shares and .25% for certain purchases of Class T shares.
For the period, sales charge amounts retained by FDC were as follows:
| Retained
by FDC |
Class A | $ 6,050 |
Class T | 936 |
Class B* | 1,390 |
Class C* | 794 |
| $ 9,170 |
* When Class B and Class C shares are initially sold, FDC pays commissions from its own resources to financial intermediaries through which the sales are made.
Transfer Agent Fees. Fidelity Investments Institutional Operations Company, Inc., (FIIOC), an affiliate of the investment adviser, is the transfer, dividend disbursing and shareholder servicing agent for each class of the Fund. FIIOC receives account fees and asset-based fees that vary according to the account size and type of account of the shareholders of the respective classes of the Fund. FIIOC pays for typesetting, printing and mailing of shareholder reports, except proxy statements.
Annual Report
Notes to Financial Statements - continued
5. Fees and Other Transactions with Affiliates - continued
Transfer Agent Fees - continued
For the period, transfer agent fees for each class were as follows:
| Amount | % of
Class-Level Average
Net Assets |
Class A | $ 19,698 | .30 |
Class T | 12,131 | .32 |
Class B | 1,781 | .31 |
Class C | 10,841 | .30 |
International Value | 356,047 | .19 |
Institutional Class | 2,019 | .28 |
| $ 402,517 | |
Accounting and Security Lending Fees. Fidelity Service Company, Inc. (FSC), an affiliate of the investment adviser, maintains the Fund's accounting records. The accounting fee is based on the level of average net assets for each month. Under a separate contract, FSC administers the security lending program. The security lending fee is based on the number and duration of lending transactions.
Brokerage Commissions. The Fund placed a portion of its portfolio transactions with brokerage firms which are affiliates of the investment adviser. Brokerage commissions are included in net realized gain (loss) and change in net unrealized appreciation (depreciation) in the Statement of Operations. The commissions paid to these affiliated firms were $237 for the period.
Other. During the period, the investment adviser reimbursed the Fund for certain losses in the amount of $1,417.
6. Committed Line of Credit.
The Fund participates with other funds managed by the investment adviser or an affiliate in a $4.25 billion credit facility (the "line of credit") to be utilized for temporary or emergency purposes to fund shareholder redemptions or for other short-term liquidity purposes. The Fund has agreed to pay commitment fees on its pro-rata portion of the line of credit, which amounted to $328 and is reflected in Miscellaneous expenses on the Statement of Operations. During the period, the Fund did not borrow on this line of credit.
7. Security Lending.
The Fund lends portfolio securities through a lending agent from time to time in order to earn additional income. For equity securities, a lending agent is used and may loan securities to certain qualified borrowers, including Fidelity Capital Markets (FCM), a broker-dealer affiliated with the Fund. On the settlement date of the loan, the Fund receives collateral (in the form of U.S. Treasury obligations, letters of credit and/or cash)
Annual Report
7. Security Lending - continued
against the loaned securities and maintains collateral in an amount not less than 100% of the market value of the loaned securities during the period of the loan. The market value of the loaned securities is determined at the close of business of the Fund and any additional required collateral is delivered to the Fund on the next business day. If the borrower defaults on its obligation to return the securities loaned because of insolvency or other reasons, the Fund may apply collateral received from the borrower against the obligation. The Fund may experience delays and costs in recovering the securities loaned. Any cash collateral received is invested in the Fidelity Securities Lending Cash Central Fund. The value of loaned securities and cash collateral at period end are disclosed on the Fund's Statement of Assets and Liabilities. Security lending income represents the income earned on investing cash collateral, less rebates paid to borrowers and any lending agent fees associated with the loan, plus any premium payments received for lending certain types of securities. Security lending income is presented in the Statement of Operations as a component of income from Fidelity Central Funds. Total security lending income during the period amounted to $161,924. During the period, there were no securities loaned to FCM.
8. Expense Reductions.
Commissions paid to certain brokers with whom the investment adviser, or its affiliates, places trades on behalf of the Fund include an amount in addition to trade execution, which may be rebated back to the Fund to offset certain expenses. This amount totaled $3,923 for the period. In addition, through arrangements with the Fund's custodian, credits realized as a result of uninvested cash balances were used to reduce the Fund's expenses. During the period, these credits reduced the Fund's custody expenses by $5.
In addition, the investment adviser reimbursed a portion of the Fund's operating expenses during the period in the amount of $193.
9. Distributions to Shareholders.
Distributions to shareholders of each class were as follows:
Years ended October 31, | 2014 | 2013 |
From net investment income | | |
Class A | $ 117,558 | $ 121,166 |
Class T | 63,542 | 67,016 |
Class B | 6,919 | 11,860 |
Class C | 40,539 | 47,865 |
International Value | 3,926,459 | 3,862,005 |
Institutional Class | 5,296 | 10,688 |
Total | $ 4,160,313 | $ 4,120,600 |
Annual Report
Notes to Financial Statements - continued
9. Distributions to Shareholders - continued
Years ended October 31, | 2014 | 2013 |
From net realized gain | | |
Class A | $ 9,681 | $ 25,318 |
Class T | 5,931 | 15,214 |
Class B | 1,042 | 3,861 |
Class C | 5,113 | 13,226 |
International Value | 279,037 | 727,373 |
Institutional Class | 388 | 1,960 |
Total | $ 301,192 | $ 786,952 |
10. Share Transactions.
Share transactions for each class were as follows and may contain automatic conversions between classes or exchanges between funds:
| Shares | Shares | Dollars | Dollars |
Years ended October 31, | 2014 | 2013 | 2014 | 2013 |
Class A | | | | |
Shares sold | 271,659 | 221,312 | $ 2,416,438 | $ 1,773,149 |
Reinvestment of distributions | 12,904 | 17,344 | 112,525 | 128,001 |
Shares redeemed | (245,285) | (155,517) | (2,196,440) | (1,235,132) |
Net increase (decrease) | 39,278 | 83,139 | $ 332,523 | $ 666,018 |
Class T | | | | |
Shares sold | 79,778 | 91,084 | $ 709,484 | $ 741,140 |
Reinvestment of distributions | 7,900 | 11,018 | 68,891 | 81,425 |
Shares redeemed | (88,989) | (46,826) | (796,094) | (371,734) |
Net increase (decrease) | (1,311) | 55,276 | $ (17,719) | $ 450,831 |
Class B | | | | |
Shares sold | 1,662 | 6,334 | $ 15,295 | $ 51,789 |
Reinvestment of distributions | 756 | 1,746 | 6,661 | 13,011 |
Shares redeemed | (30,069) | (26,098) | (270,154) | (212,223) |
Net increase (decrease) | (27,651) | (18,018) | $ (248,198) | $ (147,423) |
Class C | | | | |
Shares sold | 107,427 | 93,011 | $ 961,012 | $ 748,735 |
Reinvestment of distributions | 4,784 | 7,487 | 41,813 | 55,475 |
Shares redeemed | (49,408) | (43,711) | (437,003) | (352,531) |
Net increase (decrease) | 62,803 | 56,787 | $ 565,822 | $ 451,679 |
International Value | | | | |
Shares sold | 5,177,049 | 6,308,136 | $ 46,484,243 | $ 51,241,221 |
Reinvestment of distributions | 470,965 | 602,705 | 4,097,400 | 4,441,937 |
Shares redeemed | (3,570,903) | (4,113,021) | (31,830,840) | (32,981,230) |
Net increase (decrease) | 2,077,111 | 2,797,820 | $ 18,750,803 | $ 22,701,928 |
Annual Report
10. Share Transactions - continued
| Shares | Shares | Dollars | Dollars |
Years ended October 31, | 2014 | 2013 | 2014 | 2013 |
Institutional Class | | | | |
Shares sold | 140,760 | 6,984 | $ 1,271,347 | $ 56,532 |
Reinvestment of distributions | 394 | 1,136 | 3,438 | 8,383 |
Shares redeemed | (16,367) | (31,601) | (146,887) | (249,818) |
Net increase (decrease) | 124,787 | (23,481) | $ 1,127,898 | $ (184,903) |
11. Other.
The Fund's organizational documents provide former and current trustees and officers with a limited indemnification against liabilities arising in connection with the performance of their duties to the Fund. In the normal course of business, the Fund may also enter into contracts that provide general indemnifications. The Fund's maximum exposure under these arrangements is unknown as this would be dependent on future claims that may be made against the Fund. The risk of material loss from such claims is considered remote.
At the end of the period, Strategic Advisers International II Fund and VIP FundsManager 60% Portfolio were the owners of record of approximately 35% and 11%, respectively, of the total outstanding shares of the Fund.
Mutual funds managed by the investment adviser or its affiliates were the owners of record, in the aggregate, of approximately 52% of the total outstanding shares of the Fund.
Annual Report
To the Trustees of Fidelity Investment Trust and Shareholders of Fidelity International Value Fund:
We have audited the accompanying statement of assets and liabilities of Fidelity International Value Fund (the Fund), a fund of Fidelity Investment Trust, including the schedule of investments, as of October 31, 2014, and the related statement of operations for the year then ended, the statement of changes in net assets for each of the two years in the period then ended, and the financial highlights for each of the five years in the period then ended. These financial statements and financial highlights are the responsibility of the Fund's management. Our responsibility is to express an opinion on these financial statements and financial highlights based on our audits.
We conducted our audits in accordance with the standards of the Public Company Accounting Oversight Board (United States). Those standards require that we plan and perform the audit to obtain reasonable assurance about whether the financial statements and financial highlights are free of material misstatement. The Fund is not required to have, nor were we engaged to perform, an audit of its internal control over financial reporting. Our audits included consideration of internal control over financial reporting as a basis for designing audit procedures that are appropriate in the circumstances, but not for the purpose of expressing an opinion on the effectiveness of the Fund's internal control over financial reporting. Accordingly, we express no such opinion. An audit also includes examining, on a test basis, evidence supporting the amounts and disclosures in the financial statements, assessing the accounting principles used and significant estimates made by management, as well as evaluating the overall financial statement presentation. Our procedures included confirmation of securities owned as of October 31, 2014, by correspondence with the custodians and brokers; where replies were not received from brokers, we performed other auditing procedures. We believe that our audits provide a reasonable basis for our opinion.
In our opinion, the financial statements and financial highlights referred to above present fairly, in all material respects, the financial position of Fidelity International Value Fund as of October 31, 2014, the results of its operations for the year then ended, the changes in its net assets for each of the two years in the period then ended, and the financial highlights for each of the five years in the period then ended, in conformity with accounting principles generally accepted in the United States of America.
DELOITTE & TOUCHE LLP
Boston, Massachusetts
December 17, 2014
Annual Report
The Trustees, Member of the Advisory Board, and officers of the trust and fund, as applicable, are listed below. The Board of Trustees governs the fund and is responsible for protecting the interests of shareholders. The Trustees are experienced executives who meet periodically throughout the year to oversee the fund's activities, review contractual arrangements with companies that provide services to the fund, oversee management of the risks associated with such activities and contractual arrangements, and review the fund's performance. Except for James C. Curvey, each of the Trustees oversees 174 funds. Mr. Curvey oversees 407 funds.
The Trustees hold office without limit in time except that (a) any Trustee may resign; (b) any Trustee may be removed by written instrument, signed by at least two-thirds of the number of Trustees prior to such removal; (c) any Trustee who requests to be retired or who has become incapacitated by illness or injury may be retired by written instrument signed by a majority of the other Trustees; and (d) any Trustee may be removed at any special meeting of shareholders by a two-thirds vote of the outstanding voting securities of the trust. Each Trustee who is not an interested person (as defined in the 1940 Act) of the trust and the fund (Independent Trustee), shall retire not later than the last day of the calendar year in which his or her 75th birthday occurs. The Independent Trustees may waive this mandatory retirement age policy with respect to individual Trustees. The officers and Advisory Board Member hold office without limit in time, except that any officer and Advisory Board Member may resign or may be removed by a vote of a majority of the Trustees at any regular meeting or any special meeting of the Trustees. Except as indicated, each individual has held the office shown or other offices in the same company for the past five years.
Experience, Skills, Attributes, and Qualifications of the Fund's Trustees. The Governance and Nominating Committee has adopted a statement of policy that describes the experience, qualifications, attributes, and skills that are necessary and desirable for potential Independent Trustee candidates (Statement of Policy). The Board believes that each Trustee satisfied at the time he or she was initially elected or appointed a Trustee, and continues to satisfy, the standards contemplated by the Statement of Policy. The Governance and Nominating Committee also engages professional search firms to help identify potential Independent Trustee candidates who have the experience, qualifications, attributes, and skills consistent with the Statement of Policy. From time to time, additional criteria based on the composition and skills of the current Independent Trustees, as well as experience or skills that may be appropriate in light of future changes to board composition, business conditions, and regulatory or other developments, have also been considered by the professional search firms and the Governance and Nominating Committee. In addition, the Board takes into account the Trustees' commitment and participation in Board and committee meetings, as well as their leadership of standing and ad hoc committees throughout their tenure.
In determining that a particular Trustee was and continues to be qualified to serve as a Trustee, the Board has considered a variety of criteria, none of which, in isolation, was controlling. The Board believes that, collectively, the Trustees have balanced and diverse experience, qualifications, attributes, and skills, which allow the Board to operate effectively in governing the fund and protecting the interests of shareholders. Information about the specific experience, skills, attributes, and qualifications of each Trustee, which in each case led to the Board's conclusion that the Trustee should serve (or continue to serve) as a trustee of the fund, is provided below.
Annual Report
Trustees and Officers - continued
Board Structure and Oversight Function. James C. Curvey is an interested person (as defined in the 1940 Act) and currently serves as Chairman. The Trustees have determined that an interested Chairman is appropriate and benefits shareholders because an interested Chairman has a personal and professional stake in the quality and continuity of services provided to the fund. Independent Trustees exercise their informed business judgment to appoint an individual of their choosing to serve as Chairman, regardless of whether the Trustee happens to be independent or a member of management. The Independent Trustees have determined that they can act independently and effectively without having an Independent Trustee serve as Chairman and that a key structural component for assuring that they are in a position to do so is for the Independent Trustees to constitute a substantial majority for the Board. The Independent Trustees also regularly meet in executive session. Ned C. Lautenbach serves as Chairman of the Independent Trustees and as such (i) acts as a liaison between the Independent Trustees and management with respect to matters important to the Independent Trustees and (ii) with management prepares agendas for Board meetings.
Fidelity funds are overseen by different Boards of Trustees. The fund's Board oversees Fidelity's equity and high income funds and another Board oversees Fidelity's investment-grade bond, money market, and asset allocation funds. The asset allocation funds may invest in Fidelity funds overseen by the fund's Board. The use of separate Boards, each with its own committee structure, allows the Trustees of each group of Fidelity funds to focus on the unique issues of the funds they oversee, including common research, investment, and operational issues. On occasion, the separate Boards establish joint committees to address issues of overlapping consequences for the Fidelity funds overseen by each Board.
The Trustees operate using a system of committees to facilitate the timely and efficient consideration of all matters of importance to the Trustees, the fund, and fund shareholders and to facilitate compliance with legal and regulatory requirements and oversight of the fund's activities and associated risks. The Board, acting through its committees, has charged FMR and its affiliates with (i) identifying events or circumstances the occurrence of which could have demonstrably adverse effects on the fund's business and/or reputation; (ii) implementing processes and controls to lessen the possibility that such events or circumstances occur or to mitigate the effects of such events or circumstances if they do occur; and (iii) creating and maintaining a system designed to evaluate continuously business and market conditions in order to facilitate the identification and implementation processes described in (i) and (ii) above. Because the day-to-day operations and activities of the fund are carried out by or through FMR, its affiliates and other service providers, the fund's exposure to risks is mitigated but not eliminated by the processes overseen by the Trustees. While each of the Board's committees has responsibility for overseeing different aspects of the fund's activities, oversight is exercised primarily through the Operations, Audit, and Compliance Committees. In addition, the Independent Trustees have worked with FMR to enhance the Board's oversight of investment and financial risks, legal and regulatory risks, technology risks, and operational risks, including the development of additional risk reporting to the Board. For example, a working group comprised of Independent Trustees and FMR has worked and continues to work to review the Fidelity funds' valuation-related activities, reporting and risk management. Appropriate personnel, including but not limited to the fund's Chief Compliance Officer (CCO), FMR's internal auditor, the independent accountants, the fund's Treasurer and portfolio management personnel, make periodic reports to the Board's committees, as appropriate, including an annual review of FMR's risk management program for the Fidelity funds. The responsibilities of each standing committee, including their oversight responsibilities, are described further under "Standing Committees of the Fund's Trustees."
Annual Report
The fund's Statement of Additional Information (SAI) includes more information about the Trustees. To request a free copy, call Fidelity at 1-877-208-0098.
Interested Trustees*:
Correspondence intended for each Trustee who is an interested person may be sent to Fidelity Investments, 245 Summer Street, Boston, Massachusetts 02210.
Name, Year of Birth; Principal Occupations and Other Relevant Experience+ |
James C. Curvey (1935) |
Year of Election or Appointment: 2007 Trustee Chairman of the Board of Trustees |
| Mr. Curvey also serves as Trustee of other Fidelity funds. Mr. Curvey is a Director of Fidelity Research & Analysis Co. (2009-present), and Vice Chairman (2007-present) and Director of FMR LLC. In addition, Mr. Curvey serves as an Overseer for the Boston Symphony Orchestra and a member of the board of Artis-Naples, Naples, Florida, and as a Trustee for Brewster Academy, Wolfeboro, New Hampshire. Previously, Mr. Curvey served as a Director of Fidelity Investments Money Management, Inc. (2009-2014), a Director of FMR (2007-2014), and a Director of FMR Co., Inc. (2007-2014). |
Charles S. Morrison (1960) |
Year of Election or Appointment: 2014 Trustee |
| Mr. Morrison also serves as Trustee of other funds. He serves as a Director of Fidelity Investments Money Management, Inc. (FIMM) (2014-present), Director of Fidelity SelectCo, LLC (2014-present), President, Asset Management (2014-present), and is an employee of Fidelity Investments. Previously, Mr. Morrison served as Vice President of Fidelity's Fixed Income and Asset Allocation Funds (2012-2014), President, Fixed Income (2011-2014), Vice President of Fidelity's Money Market Funds (2005-2009), President, Money Market Group Leader of FMR (2009), and Senior Vice President, Money Market Group of FMR (2004-2009). Mr. Morrison also served as Vice President of Fidelity's Bond Funds (2002-2005), certain Balanced Funds (2002-2005), and certain Asset Allocation Funds (2002-2007), and as Senior Vice President (2002-2005) of Fidelity's Bond Division. |
* Trustees have been determined to be "Interested Trustees" by virtue of, among other things, their affiliation with the trust or various entities under common control with FMR.
+ The information above includes each Trustee's principal occupation during the last five years and other information relating to the experience, attributes, and skills relevant to each Trustee's qualifications to serve as a Trustee, which led to the conclusion that each Trustee should serve as a Trustee for the fund.
Annual Report
Independent Trustees:
Correspondence intended for each Independent Trustee (that is, the Trustees other than the Interested Trustees) may be sent to Fidelity Investments, P.O. Box 55235, Boston, Massachusetts 02205-5235.
Name, Year of Birth; Principal Occupations and Other Relevant Experience+ |
Dennis J. Dirks (1948) |
Year of Election or Appointment: 2005 Trustee |
| Mr. Dirks also serves as Trustee of other Fidelity funds. Prior to his retirement in May 2003, Mr. Dirks was Chief Operating Officer and a member of the Board of The Depository Trust & Clearing Corporation (DTCC). He also served as President, Chief Operating Officer, and Board member of The Depository Trust Company (DTC) and President and Board member of the National Securities Clearing Corporation (NSCC). In addition, Mr. Dirks served as Chief Executive Officer and Board member of the Government Securities Clearing Corporation, Chief Executive Officer and Board member of the Mortgage-Backed Securities Clearing Corporation, as a Trustee and a member of the Finance Committee of Manhattan College (2005-2008), and as a Trustee and a member of the Finance Committee of AHRC of Nassau County (2006-2008). Mr. Dirks is a member of the Independent Directors Council (IDC) Governing Council (2010-present) and Board of Directors for The Brookville Center for Children's Services, Inc. (2009-present). |
Alan J. Lacy (1953) |
Year of Election or Appointment: 2008 Trustee |
| Mr. Lacy also serves as Trustee of other Fidelity funds. Mr. Lacy serves as Senior Adviser (2007-present) of Oak Hill Capital Partners, L.P. (private equity). Mr. Lacy also served as Chief Executive Officer (2000-2005) and Vice Chairman (2005-2006) of Sears Holdings Corporation and Sears, Roebuck and Co. (retail). In addition, Mr. Lacy serves as a member of the Board of Directors of Dave & Buster's Entertainment, Inc. (restaurant and entertainment complexes, 2010-present), Earth Fare, Inc. (retail grocery, 2012-present), The Hillman Companies, Inc. (hardware wholesalers, 2010-present), and Bristol-Myers Squibb Company (global pharmaceuticals, 2008-present). Mr. Lacy is a member of the Board of Trustees of The National Parks Conservation Association (2006-present). Previously, Mr. Lacy served as Chairman of the Board of Trustees of the National Parks Conservation Association (2008-2011) and as a member of the Board of Directors for the Western Union Company (global money transfer, 2006-2011). |
Ned C. Lautenbach (1944) |
Year of Election or Appointment: 2000 Trustee Chairman of the Independent Trustees |
| Mr. Lautenbach also serves as Trustee of other Fidelity funds. Mr. Lautenbach currently serves as the Lead Director of the Eaton Corporation Board of Directors (diversified industrial, 1997-present). Mr. Lautenbach is Chairman of the Board of Directors of the Philharmonic Center for the Arts in Naples, Florida (2012-present) and a member of the Council on Foreign Relations (1994-present). Previously, Mr. Lautenbach was a Partner/Advisory Partner at Clayton, Dubilier & Rice, LLC (private equity investment, 1998-2010), as well as a Director of Sony Corporation (2006-2007). |
Joseph Mauriello (1944) |
Year of Election or Appointment: 2008 Trustee |
| Mr. Mauriello also serves as Trustee of other Fidelity funds. Prior to his retirement in January 2006, Mr. Mauriello served in numerous senior management positions including Deputy Chairman and Chief Operating Officer (2004-2005), and Vice Chairman of Financial Services (2002-2004) of KPMG LLP US (professional services, 1965-2005). Mr. Mauriello currently serves as a member of the Board of Directors of XL Group plc. (global insurance and re-insurance, 2006-present). Previously, Mr. Mauriello served as a Director of the Hamilton Funds of the Bank of New York (2006-2007) and of Arcadia Resources Inc. (health care services and products, 2007-2012). |
Robert W. Selander (1950) |
Year of Election or Appointment: 2011 Trustee |
| Mr. Selander also serves as Trustee of other Fidelity funds. Previously, Mr. Selander served as a Member of the Advisory Board of other Fidelity funds (2011), and Executive Vice Chairman (2010), Chief Executive Officer (2009-2010), and President and Chief Executive Officer (1997-2009) of Mastercard, Inc. |
Cornelia M. Small (1944) |
Year of Election or Appointment: 2005 Trustee |
| Ms. Small also serves as Trustee of other Fidelity funds. Ms. Small is a member of the Board of Directors (2009-present) and Chair of the Investment Committee (2010-present) of the Teagle Foundation. Ms. Small also serves on the Investment Committee of the Berkshire Taconic Community Foundation (2008-present). Previously, Ms. Small served as Chairperson (2002-2008) and a member of the Investment Committee and Chairperson (2008-2012) and a member of the Board of Trustees of Smith College. In addition, Ms. Small served as Chief Investment Officer, Director of Global Equity Investments, and a member of the Board of Directors of Scudder, Stevens & Clark and Scudder Kemper Investments. |
William S. Stavropoulos (1939) |
Year of Election or Appointment: 2001 Trustee Vice Chairman of the Independent Trustees |
| Mr. Stavropoulos also serves as Trustee of other Fidelity funds. Mr. Stavropoulos serves as President and Founder of the Michigan Baseball Foundation, the Great Lakes Loons (2007-present). Mr. Stavropoulos is Chairman Emeritus of the Board of Directors of The Dow Chemical Company, where he previously served in numerous senior management positions, including President, CEO (1995-2000; 2002-2004), Chairman of the Executive Committee (2000-2006), and as a member of the Board of Directors (1990-2006). Currently, Mr. Stavropoulos is Chairman of the Board of Directors of Univar Inc. (global distributor of commodity and specialty chemicals), a Director of Teradata Corporation (data warehousing and technology solutions), and Maersk Inc. (industrial conglomerate), and a member of the Advisory Board for Metalmark Capital LLC (private equity investment, 2005-present). Mr. Stavropoulos is an operating advisor to Clayton, Dubilier & Rice, LLC (private equity investment). In addition, Mr. Stavropoulos is a member of the University of Notre Dame Advisory Council for the College of Science, a Trustee of the Rollin L. Gerstacker Foundation, and a Director of the Naples Philharmonic Center for the Arts. Previously, Mr. Stavropoulos served as a Director of Chemical Financial Corporation (bank holding company, 1993-2012) and Tyco International, Ltd. (multinational manufacturing and services, 2007-2012). |
David M. Thomas (1949) |
Year of Election or Appointment: 2008 Trustee |
| Mr. Thomas also serves as Trustee of other Fidelity funds. Mr. Thomas serves as Non-Executive Chairman of the Board of Directors of Fortune Brands Home and Security (home and security products, 2011-present), and as a member of the Board of Directors of Interpublic Group of Companies, Inc. (marketing communication, 2004-present). Previously, Mr. Thomas served as Executive Chairman (2005-2006) and Chairman and Chief Executive Officer (2000-2005) of IMS Health, Inc. (pharmaceutical and healthcare information solutions), and a Director of Fortune Brands, Inc. (consumer products, 2000-2011). |
+ The information above includes each Trustee's principal occupation during the last five years and other information relating to the experience, attributes, and skills relevant to each Trustee's qualifications to serve as a Trustee, which led to the conclusion that each Trustee should serve as a Trustee for the fund.
Advisory Board Member and Officers:
Correspondence intended for each officer and Peter S. Lynch may be sent to Fidelity Investments, 245 Summer Street, Boston, Massachusetts 02210. Officers appear below in alphabetical order.
Name, Year of Birth; Principal Occupation |
Peter S. Lynch (1944) |
Year of Election or Appointment: 2003 Member of the Advisory Board |
| Mr. Lynch also serves as Member of the Advisory Board of other Fidelity funds. Mr. Lynch is Vice Chairman and a Director of FMR and FMR Co., Inc. In addition, Mr. Lynch serves as a Trustee of Boston College and as the Chairman of the Inner-City Scholarship Fund. Previously, Mr. Lynch served on the Special Olympics International Board of Directors (1997-2006). |
Elizabeth Paige Baumann (1968) |
Year of Election or Appointment: 2012 Anti-Money Laundering (AML) Officer |
| Ms. Baumann also serves as AML Officer of other funds. She is Chief AML Officer of FMR LLC (2012-present) and is an employee of Fidelity Investments. Previously, Ms. Baumann served as Vice President and Deputy Anti-Money Laundering Officer (2007-2012). |
William C. Coffey (1969) |
Year of Election or Appointment: 2009 Assistant Secretary |
| Mr. Coffey also serves as Assistant Secretary of other funds. He is Senior Vice President and Deputy General Counsel of FMR LLC (2010-present), and is an employee of Fidelity Investments. Previously, Mr. Coffey served as Vice President and Associate General Counsel of FMR LLC (2005-2009). |
Timothy M. Cohen (1969) |
Year of Election or Appointment: 2014 Vice President of certain Equity Funds |
| Mr. Cohen also serves as Vice President of other funds. Mr. Cohen serves as a Director and Chief Compliance Officer of Fidelity Management & Research (U.K.) Inc. (2013-present) and is an employee of Fidelity Investments. |
Jonathan Davis (1968) |
Year of Election or Appointment: 2010 Assistant Treasurer |
| Mr. Davis also serves as Assistant Treasurer of other funds. Mr. Davis is an employee of Fidelity Investments. Previously, Mr. Davis served as Vice President and Associate General Counsel of FMR LLC (2003-2010). |
Adrien E. Deberghes (1967) |
Year of Election or Appointment: 2008 Deputy Treasurer |
| Mr. Deberghes also serves as an officer of other funds. He is an employee of Fidelity Investments (2008-present). Prior to joining Fidelity Investments, Mr. Deberghes was Senior Vice President of Mutual Fund Administration at State Street Corporation (2007-2008), Senior Director of Mutual Fund Administration at Investors Bank & Trust (2005-2007), and Director of Finance for Dunkin' Brands (2000-2005). |
Stephanie J. Dorsey (1969) |
Year of Election or Appointment: 2010 Assistant Treasurer |
| Ms. Dorsey also serves as an officer of other funds. She is an employee of Fidelity Investments (2008-present) and has served in other fund officer roles. Prior to joining Fidelity Investments, Ms. Dorsey served as Treasurer (2004-2008) of the JPMorgan Mutual Funds and Vice President (2004-2008) of JPMorgan Chase Bank. |
Howard J. Galligan III (1966) |
Year of Election or Appointment: 2014 Chief Financial Officer |
| Mr. Galligan also serves as Chief Financial Officer of other funds. Mr. Galligan serves as President of Fidelity Pricing and Cash Management Services (FPCMS) (2014-present) and as a Director of Strategic Advisers, Inc. (2008-present). Previously, Mr. Galligan served as Chief Administrative Officer of Asset Management (2011-2014) and Chief Operating Officer and Senior Vice President of Investment Support for Strategic Advisers, Inc. (2003-2011). |
Scott C. Goebel (1968) |
Year of Election or Appointment: 2008 Secretary and Chief Legal Officer (CLO) |
| Mr. Goebel serves as Secretary and CLO of other funds. Mr. Goebel also serves as Secretary of Fidelity SelectCo, LLC (2013-present), Fidelity Investments Money Management, Inc. (FIMM) (2010-present) and Fidelity Research and Analysis Company (FRAC) (2010-present); General Counsel, Secretary, and Senior Vice President of FMR (2008-present) and FMR Co., Inc. (2008-present); Chief Legal Officer of Fidelity Management & Research (Hong Kong) Limited (2008-present); and Assistant Secretary of Fidelity Management & Research (Japan) Limited (2008-present) and Fidelity Management & Research (U.K.) Inc. (2008-present). Previously, Mr. Goebel served as Secretary and CLO of other Fidelity funds (2008-2013), Assistant Secretary of FIMM (2008-2010), FRAC (2008-2010), and certain funds (2007-2008); and as Vice President and Secretary of Fidelity Distributors Corporation (FDC) (2005-2007). Mr. Goebel has been employed by FMR LLC or an affiliate since 2001. |
Brian B. Hogan (1964) |
Year of Election or Appointment: 2009 Vice President |
| Mr. Hogan also serves as Trustee or Vice President of other funds. Mr. Hogan serves as a Director of Fidelity SelectCo, LLC (2014-present) and President of FMR's Equity Division (2009-present). Previously, Mr. Hogan served as Senior Vice President, Equity Research of FMR (2006-2009) and as a portfolio manager. |
Chris Maher (1972) |
Year of Election or Appointment: 2013 Assistant Treasurer |
| Mr. Maher serves as Assistant Treasurer of other funds. Mr. Maher is Vice President of Valuation Oversight and is an employee of Fidelity Investments. Previously, Mr. Maher served as Vice President of Asset Management Compliance (2013), Vice President of FMR's Program Management Group (2010-2013), and Vice President of Valuation Oversight (2008-2010). |
Kenneth B. Robins (1969) |
Year of Election or Appointment: 2008 President and Treasurer |
| Mr. Robins also serves as an officer of other funds. Mr. Robins serves as Executive Vice President of Fidelity Investments Money Management, Inc. (FIMM) (2013-present) and is an employee of Fidelity Investments (2004-present). Previously, Mr. Robins served in other fund officer roles. |
Stephen Sadoski (1971) |
Year of Election or Appointment: 2012 Deputy Treasurer |
| Mr. Sadoski also serves as Deputy Treasurer of other funds. He is an employee of Fidelity Investments (2012-present) and has served in another fund officer role. Prior to joining Fidelity Investments, Mr. Sadoski served as an assistant chief accountant in the Division of Investment Management of the Securities and Exchange Commission (SEC) (2009-2012) and as a senior manager at Deloitte & Touche LLP (1997-2009). |
Stacie M. Smith (1974) |
Year of Election or Appointment: 2013 Deputy Treasurer |
| Ms. Smith also serves as an officer of other funds. She is an employee of Fidelity Investments (2009-present) and has served in other fund officer roles. Prior to joining Fidelity Investments, Ms. Smith served as Senior Audit Manager of Ernst & Young LLP (1996-2009). |
Renee Stagnone (1975) |
Year of Election or Appointment: 2013 Deputy Treasurer |
| Ms. Stagnone also serves as Deputy Treasurer of other funds. Ms. Stagnone is an employee of Fidelity Investments. |
Linda J. Wondrack (1964) |
Year of Election or Appointment: 2014 Chief Compliance Officer |
| Ms. Wondrack also serves as Chief Compliance Officer of other funds. Ms. Wondrack is Executive Vice President and head of the Ethics Office and Asset Management Compliance for Fidelity Investments (2012-present). Ms. Wondrack also serves as Chief Compliance Officer of Fidelity SelectCo, LLC (2014-present); Chief Compliance Officer of Impresa Management LLC (2013-present); and Chief Compliance Officer of FMR Co., Inc., Fidelity Investments Money Management, Inc., Fidelity Management & Research (Japan) Limited, Fidelity Management & Research (U.K.) Inc., Fidelity Management & Research (Hong Kong), Fidelity Management & Research Company, Pyramis Global Advisors, LLC, and Strategic Advisers, Inc., Ballyrock Investment Advisors LLC, and Northern Neck Investors LLC (2012-present). Previously, Ms. Wondrack served as Senior Vice President and Chief Compliance Officer for Columbia Management Investment Advisers, LLC (2005-2012); Chief Compliance Officer for certain funds within the Columbia Family of Funds (2007-2012); and Senior Vice President of Compliance Risk Management at Bank of America (2005-2010). |
Joseph F. Zambello (1957) |
Year of Election or Appointment: 2011 Deputy Treasurer |
| Mr. Zambello also serves as Deputy Treasurer of other funds. Mr. Zambello is an employee of Fidelity Investments. Previously, Mr. Zambello served as Vice President of FMR's Program Management Group (2009-2011) and Vice President of the Transfer Agent Oversight Group (2005-2009). |
Annual Report
Institutional Class designates 95% of the dividends distributed during the fiscal year as amounts which may be taken into account as a dividend for purposes of the maximum rate under section 1(h)(11) of the Internal Revenue Code.
The amounts per share which represent income derived from sources within, and taxes paid to, foreign countries or possessions of the United States are as follows:
| Pay Date | Income | Taxes |
Institutional Class | 12/09/13 | $0.1461 | $0.0084 |
The fund will notify shareholders in January 2015 of amounts for use in preparing 2014 income tax returns.
Annual Report
Board Approval of Investment Advisory Contracts and Management Fees
Fidelity International Value Fund
Each year, the Board of Trustees, including the Independent Trustees (together, the Board), votes on the renewal of the management contract with Fidelity Management & Research Company (FMR) and the sub-advisory agreements (together, the Advisory Contracts) for the fund. The Board, assisted by the advice of fund counsel and Independent Trustees' counsel, requests and considers a broad range of information relevant to the renewal of the Advisory Contracts throughout the year.
The Board meets regularly and, at each of its meetings, covers an extensive agenda of topics and materials and considers factors that are relevant to its annual consideration of the renewal of the fund's Advisory Contracts, including the services and support provided to the fund and its shareholders. The Board has established various standing committees (Committees), each composed of and chaired by Independent Trustees with varying backgrounds, to which the Board has assigned specific subject matter responsibilities in order to enhance effective decision-making by the Board. The Board, acting directly and through its Committees, requests and receives information concerning the annual consideration of the renewal of the fund's Advisory Contracts. The Board also meets as needed to consider matters specifically related to the Board's annual consideration of the renewal of the Advisory Contracts. Members of the Board may also meet with trustees of other Fidelity funds through ad hoc joint committees to discuss certain matters relevant to the Fidelity funds.
At its July 2014 meeting, the Board, including the Independent Trustees, unanimously determined to renew the fund's Advisory Contracts. In reaching its determination, the Board considered all factors it believed relevant, including (i) the nature, extent, and quality of the services to be provided to the fund and its shareholders (including the investment performance of the fund); (ii) the competitiveness of the fund's management fee and total expense ratio relative to peer funds; (iii) the total costs of the services to be provided by and the profits to be realized by Fidelity from its relationship with the fund; (iv) the extent to which economies of scale exist and would be realized as the fund grows; and (v) whether fee levels reflect these economies of scale, if any, for the benefit of fund shareholders. In connection with separate internal corporate reorganizations involving Fidelity Management & Research (U.K.) Inc. (FMR U.K.) and Fidelity Management & Research (Japan) Inc. (FMR Japan), the Board approved certain non-material amendments to the fund's sub-advisory agreements with FMR U.K. and FMR Japan to reflect that, after these reorganizations, FMR Investment Management (UK) Limited and Fidelity Management & Research (Japan) Limited will carry on the business of FMR U.K. and FMR Japan, respectively. The Board noted that no changes to the portfolio managers or to the foreign research or investment advisory services provided to the fund were expected in connection with either reorganization and that the same personnel and resources would continue to be available to the fund at the new entities.
Annual Report
In considering whether to renew the Advisory Contracts for the fund, the Board reached a determination, with the assistance of fund counsel and Independent Trustees' counsel and through the exercise of its business judgment, that the renewal of the Advisory Contracts was in the best interests of the fund and its shareholders and that the compensation payable under the Advisory Contracts was fair and reasonable. The Board's decision to renew the Advisory Contracts was not based on any single factor, but rather was based on a comprehensive consideration of all the information provided to the Board at its meetings throughout the year. The Board, in reaching its determination to renew the Advisory Contracts, was aware that shareholders of the fund have a broad range of investment choices available to them, including a wide choice among funds offered by Fidelity's competitors, and that the fund's shareholders, who have the opportunity to review and weigh the disclosure provided by the fund in its prospectus and other public disclosures, have chosen to invest in this fund, which is part of the Fidelity family of funds.
Nature, Extent, and Quality of Services Provided. The Board considered Fidelity's staffing as it relates to the fund, including the backgrounds of investment personnel of FMR and the sub-advisers (together, the Investment Advisers), and also considered the fund's investment objective, strategies, and related investment philosophy. The Independent Trustees also had discussions with senior management of Fidelity's investment operations and investment groups. The Board considered the structure of the portfolio manager compensation program and whether this structure provides appropriate incentives to act in the best interests of the fund. Additionally, the Board considered the portfolio managers' investments, if any, in the funds that they manage.
Resources Dedicated to Investment Management and Support Services. The Board and the Fund Oversight and Research Committees reviewed the general qualifications and capabilities of Fidelity's investment staff, including its size, education, experience, and resources, as well as Fidelity's approach to recruiting, training, managing, and compensating investment personnel. The Board noted that Fidelity has continued to increase the resources devoted to non-U.S. offices, including expansion of Fidelity's global investment organization. The Board also noted that Fidelity's analysts have extensive resources, tools and capabilities that allow them to conduct sophisticated quantitative and fundamental analysis, as well as credit analysis of issuers, counterparties and guarantors. Further, the Board believes that Fidelity's investment professionals have sufficient access to global information and data so as to provide competitive investment results over time, and that those professionals also have access to sophisticated tools that permit them to assess portfolio construction and risk and performance attribution characteristics continuously, as well as to transmit new information and research conclusions rapidly around the world. Additionally, in its deliberations, the Board considered Fidelity's trading and risk management capabilities and resources and global compliance infrastructure, which are an integral part of the investment management process.
Annual Report
Board Approval of Investment Advisory Contracts and
Management Fees - continued
Shareholder and Administrative Services. The Board considered (i) the nature, extent, quality, and cost of advisory, administrative, and shareholder services performed by the Investment Advisers and their affiliates under the Advisory Contracts and under separate agreements covering transfer agency, pricing and bookkeeping, and securities lending services for the fund; (ii) the nature and extent of the supervision of third party service providers, principally custodians and subcustodians; and (iii) the resources devoted to, and the record of compliance with, the fund's compliance policies and procedures. The Board also reviewed the allocation of fund brokerage, including allocations to brokers affiliated with the Investment Advisers, the use of brokerage commissions to pay fund expenses, and the use of "soft" commission dollars to pay for research services.
The Board noted that the growth of fund assets over time across the complex allows Fidelity to reinvest in the development of services designed to enhance the value or convenience of the Fidelity funds as investment vehicles. These services include 24-hour access to account information and market information through telephone representatives and over the Internet, investor education materials and asset allocation tools, and the expanded availability of Fidelity Investor Centers.
In 2014, the Board formed an ad hoc Committee on Transfer Agency Fees to review the variety of transfer agency fee structures throughout the industry and Fidelity's competitive positioning with respect to industry participants.
Investment in a Large Fund Family. The Board considered the benefits to shareholders of investing in a Fidelity fund, including the benefits of investing in a fund that is part of a large family of funds offering a variety of investment disciplines and providing a large variety of mutual fund investor services. The Board noted that Fidelity had taken, or had made recommendations that resulted in the Fidelity funds taking, a number of actions over the previous year that benefited particular funds, including (i) continuing to dedicate additional resources to investment research and to the support of the senior management team that oversees asset management; (ii) persisting in efforts to enhance Fidelity's global research capabilities; (iii) launching new funds and making other enhancements to meet client needs for income-oriented solutions; (iv) reducing fund expenses for certain index funds; (v) continuing to launch dedicated lower cost underlying funds to meet portfolio construction needs related to expanding underlying fund options for Fidelity funds of funds, specifically for the Freedom Fund product lines; (vi) rationalizing product lines and gaining increased efficiencies through fund mergers; (vii) launching sector-based exchange-traded funds and establishing a new Fidelity adviser to manage sector-based funds and products; (viii) continuing to develop and implement technology to improve security and increase efficiency; (ix) modifying the eligibility criteria for certain share classes to increase their marketability to a portion of the defined contribution plan market; (x) waiving redemption fees for certain qualified fund-of-fund and wrap programs and certain retirement plan transactions; and (xi) launching new Institutional Class shares of certain money market funds to attract and retain assets and to fill a gap in the money market fund lineup.
Annual Report
Investment Performance. The Board considered whether the fund has operated in accordance with its investment objective, as well as its record of compliance with its investment restrictions and its performance history. The Board noted that there was a portfolio management change for the fund in September 2011.
The Board took into account discussions with the Investment Advisers about fund investment performance that occur at Board meetings throughout the year. In this regard the Board noted that as part of regularly scheduled fund reviews and other reports to the Board on fund performance, the Board periodically considers annualized return information for the fund, for different time periods, measured against a securities market index ("benchmark index") and a peer group of funds with similar objectives ("peer group"). In its evaluation of fund investment performance, the Board gave particular attention to information indicating changes in performance of certain Fidelity funds for specific time periods and the Investment Advisers' explanations for any overperformance or underperformance.
In addition to reviewing absolute and relative fund performance, the Independent Trustees periodically consider the appropriateness of fund performance metrics in evaluating the results achieved. In general, the Independent Trustees believe that fund performance should be evaluated based on net performance (after fees and expenses) of both the highest performing and lowest performing classes, where applicable, compared to appropriate benchmark indices, over appropriate time periods which may include full market cycles, and compared to peer groups, as applicable, over the same periods, taking into account relevant factors including the following: general market conditions; issuer-specific information; tactical opportunities for investment; and fund cash flows and other factors.
The Independent Trustees recognize that shareholders evaluate performance on a net basis over their own holding periods, for which one-, three-, and five-year periods are often used as a proxy. For this reason, the performance information reviewed by the Board also included net cumulative calendar year total return information for the fund and an appropriate benchmark index and peer group for the most recent one-, three-, and five-year periods, as shown below. Returns are shown compared to the 25th percentile (top of box, 75% beaten) and 75th percentile (bottom of box, 25% beaten) of the peer universe. Returns of the benchmark index are "net MA," i.e., adjusted for tax withholding rates applicable to U.S.-based funds organized as Massachusetts business trusts.
Annual Report
Board Approval of Investment Advisory Contracts and
Management Fees - continued
Fidelity International Value Fund
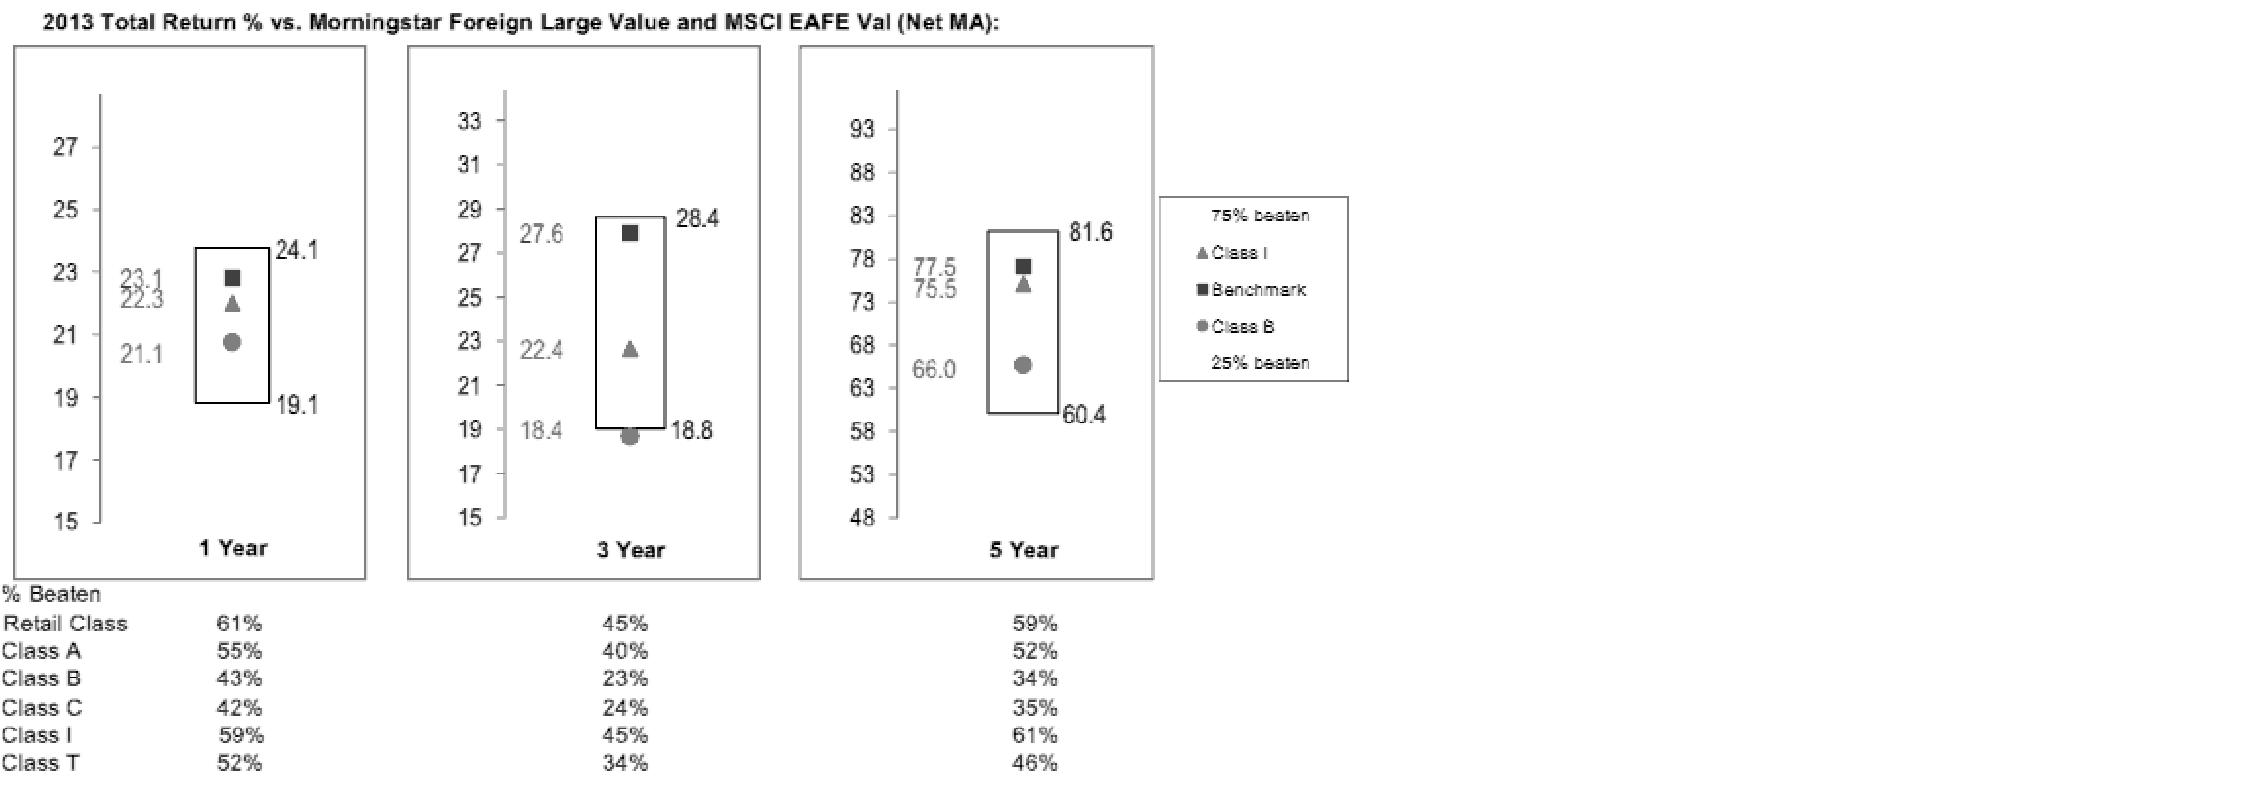
The Board has discussed the fund's performance with FMR, including the fund's underperformance based on more recent periods ended after 2013 (which periods are not shown in the chart above) but prior to the date of the Board's approval of the renewal of the Advisory Contracts, and has engaged with FMR to consider what steps might be taken to remediate the fund's more recent underperformance.
The Board also considered that the fund's management fee is subject to upward or downward adjustment depending upon whether, and to what extent, the fund's investment performance for the performance period exceeds, or is exceeded by, a securities index, thus leading to a performance adjustment for the same period. The Board noted that the performance adjustment provides FMR with a strong economic incentive to seek to achieve superior performance for the fund's shareholders and helps to more closely align the interests of FMR and the fund's shareholders.
Based on its review, the Board concluded that the nature, extent, and quality of services provided to the fund under the Advisory Contracts should benefit the fund's shareholders.
Competitiveness of Management Fee and Total Expense Ratio. The Board considered the fund's management fee and total expense ratio compared to "mapped groups" of competitive funds and classes. Fidelity creates "mapped groups" by combining similar Lipper investment objective categories that have comparable investment mandates. Combining Lipper investment objective categories aids the Board's management fee and total expense ratio comparisons by broadening the competitive group used for comparison and by reducing the number of universes to which various Fidelity funds are compared.
Annual Report
Management Fee. The Board considered two proprietary management fee comparisons for the 12-month periods shown in the chart below. The group of Lipper funds used by the Board for management fee comparisons is referred to below as the "Total Mapped Group." The Total Mapped Group comparison focuses on a fund's standing in terms of gross management fees before expense reimbursements or caps, and without giving effect to the fund's performance adjustment, relative to the total universe of funds with comparable investment mandates, regardless of whether their management fee structures also are comparable. Funds with comparable investment mandates offer exposure to similar types of securities. Funds with comparable management fee structures have similar management fee contractual arrangements (e.g., flat rate charged for advisory services, all-inclusive fee rate, etc.). "TMG %" represents the percentage of funds in the Total Mapped Group that had management fees that were lower than the fund's. For example, a hypothetical TMG % of 20% would mean that 80% of the funds in the Total Mapped Group had higher, and 20% had lower, management fees than the fund. The fund's actual TMG %s are in the chart below. The "Asset-Size Peer Group" (ASPG) comparison focuses on a fund's standing relative to a subset of non-Fidelity funds within the Total Mapped Group that are similar in size and management fee structure. For example, if a fund is in the first quartile of the ASPG, the fund's management fee ranks in the least expensive or lowest 25% of funds in the ASPG. The ASPG represents at least 15% of the funds in the Total Mapped Group with comparable asset size and management fee structures, subject to a minimum of 50 funds (or all funds in the Total Mapped Group if fewer than 50). Additional information, such as the ASPG quartile in which the fund's management fee rate ranked and the impact of the fund's performance adjustment, is also included in the chart and considered by the Board.
Annual Report
Board Approval of Investment Advisory Contracts and
Management Fees - continued
Fidelity International Value Fund
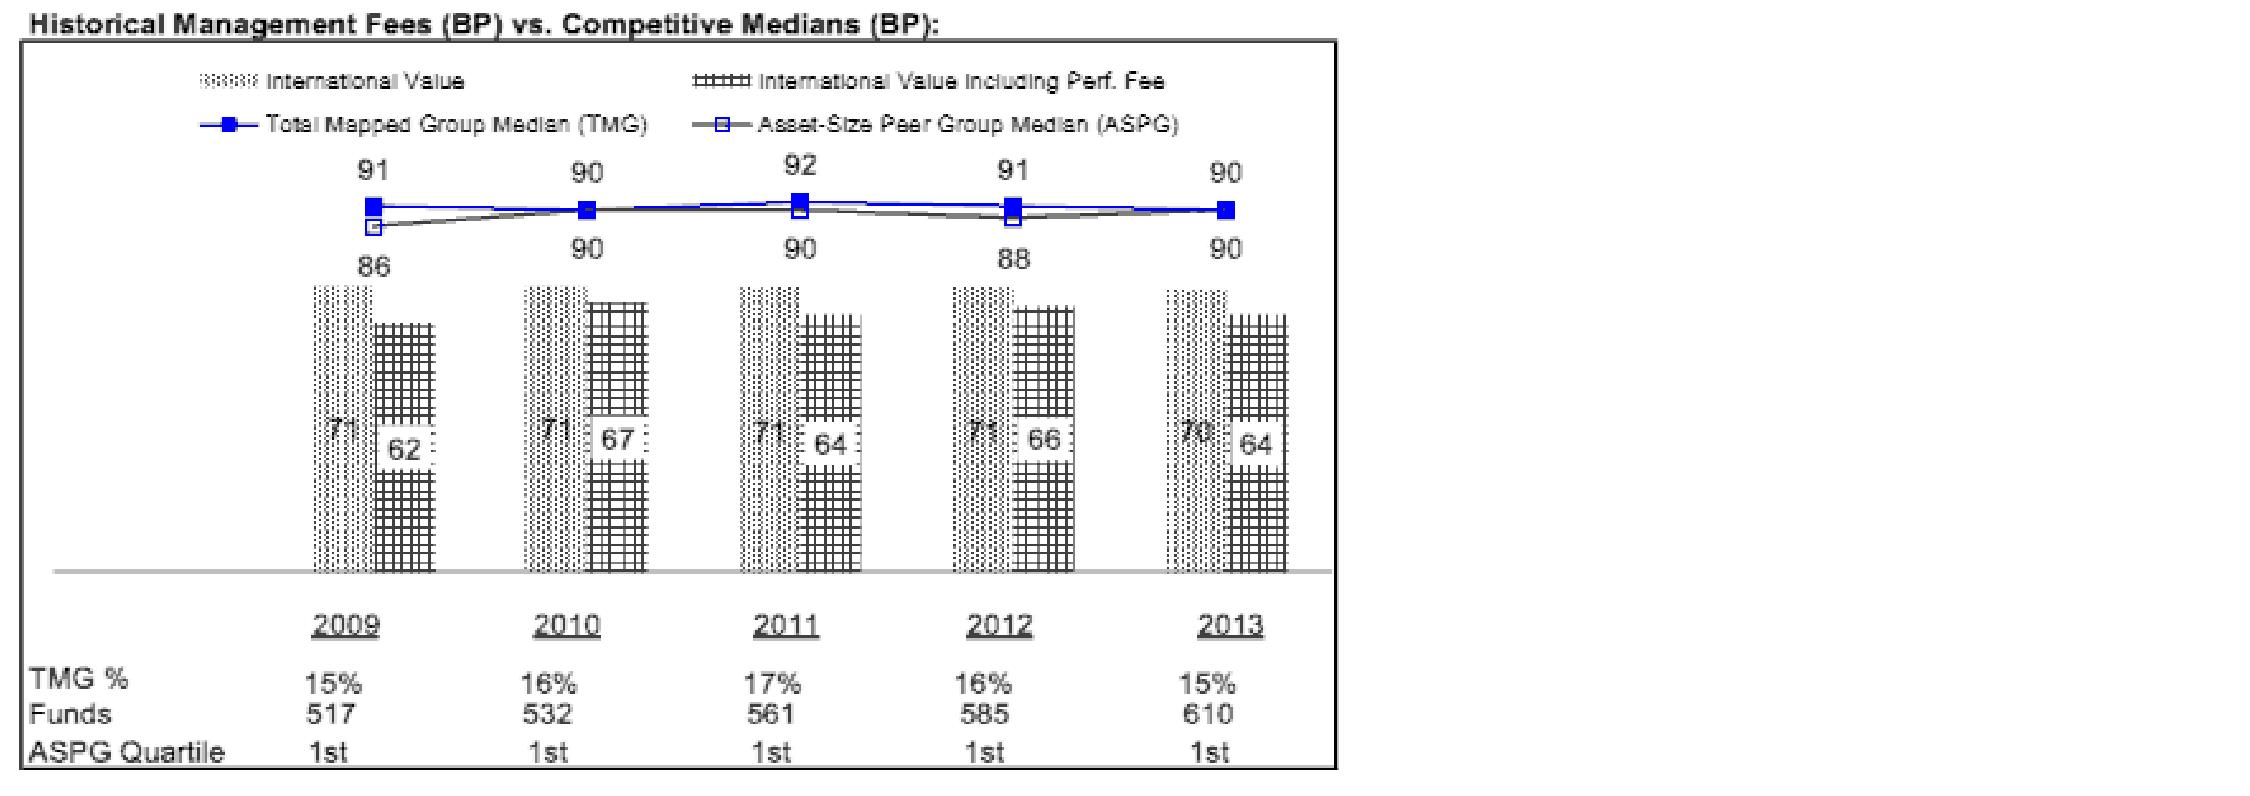
The Board noted that the fund's management fee rate ranked below the median of its Total Mapped Group and below the median of its ASPG for 2013. The Board also noted the effect of the fund's negative performance adjustment on the fund's management fee ranking.
The Board also noted that, in August 2013, the ad hoc Committee on Management Fees was formed to conduct an in-depth review of the management fee rates of Fidelity's active equity mutual funds. The Committee focused on the following areas: (i) standard fee structures; (ii) research consumption and trading evolution; (iii) management fee competitiveness/profitability by category; and (iv) factors that drive institutional pricing.
Based on its review, the Board concluded that the fund's management fee is fair and reasonable in light of the services that the fund receives and the other factors considered.
Total Expense Ratio. In its review of each class's total expense ratio, the Board considered the fund's management fee as well as other fund or class expenses, as applicable, such as transfer agent fees, pricing and bookkeeping fees, fund-paid 12b-1 fees, and custodial, legal, and audit fees. The Board also noted the effects of any waivers and reimbursements on fees and expenses, as well as the impact of the fund's performance adjustment. As part of its review, the Board also considered the current and historical total expense ratios of each class of the fund compared to competitive fund median expenses. Each class of the fund is compared to those funds and classes in the Total Mapped Group (used by the Board for management fee comparisons) that have a similar sales load structure.
Annual Report
The Board noted that the total expense ratio of each of Class A, Class B, Institutional Class, and the retail class ranked below its competitive median for 2013 and the total expense ratio of each of Class T and Class C ranked above its competitive median for 2013. The Board considered that, in general, various factors can affect total expense ratios. The Board noted that the total expense ratio of Class T was above the competitive median primarily because of higher 12b-1 fees on Class T as compared to most competitor funds. Class T has a higher 12b-1 fee, but a lower front-end sales charge, than traditionally priced front-end sales charge classes. The Board considered that Class T is primarily sold load-waived in the retirement plan market where its 0.50% 12b-1 fee is comparable to competing no-load, higher 12b-1 fee classes designed specifically for retirement plans. The Board noted that the fund offers multiple classes, each of which has a different sales load and 12b-1 fee structure, and that the multiple structures are intended to offer a range of pricing options for the intermediary market. The Board also noted that the total expense ratios of the classes vary primarily by the level of their 12b-1 fees, although differences in transfer agent fees may also cause expenses to vary from class to class.
Fees Charged to Other Fidelity Clients. The Board also considered Fidelity fee structures and other information with respect to clients of Fidelity, such as other funds advised or subadvised by Fidelity, pension plan clients, and other institutional clients. The Board noted the findings of the 2013 ad hoc joint committee (created with the board of other Fidelity funds), which reviewed and compared Fidelity's institutional investment advisory business with its business of providing services to the Fidelity funds, including the differences in services provided, fees charged, and costs incurred, as well as competition in their respective marketplaces.
Based on its review of total expense ratios and fees charged to other Fidelity clients, the Board concluded that the total expense ratio of each class of the fund was reasonable, although in some cases above the median of the universe presented for comparison, in light of the services that the fund and its shareholders receive and the other factors considered.
Costs of the Services and Profitability. The Board considered the revenues earned and the expenses incurred by Fidelity in conducting the business of developing, marketing, distributing, managing, administering and servicing the fund and servicing the fund's shareholders. The Board also considered the level of Fidelity's profits in respect of all the Fidelity funds.
On an annual basis, Fidelity presents to the Board Fidelity's profitability for the fund. Fidelity calculates the profitability for each fund, as well as aggregate profitability for groups of Fidelity funds and all Fidelity funds, using a series of detailed revenue and cost allocation methodologies which originate with the books and records of Fidelity on which Fidelity's audited financial statements are based. The Audit Committee of the Board reviews any significant changes from the prior year's methodologies.
Annual Report
Board Approval of Investment Advisory Contracts and
Management Fees - continued
PricewaterhouseCoopers LLP (PwC), independent registered public accounting firm and auditor to Fidelity and certain Fidelity funds, has been engaged annually by the Board as part of the Board's assessment of Fidelity's profitability analysis. PwC's engagement includes the review and assessment of the methodologies used by Fidelity in determining the revenues and expenses attributable to Fidelity's mutual fund business, and completion of agreed-upon procedures in respect of the mathematical accuracy of fund profitability and its conformity to established allocation methodologies. After considering PwC's reports issued under the engagement and information provided by Fidelity, the Board concluded that while other allocation methods may also be reasonable, Fidelity's profitability methodologies are reasonable in all material respects.
The Board also reviewed Fidelity's non-fund businesses and fall-out benefits related to the mutual fund business as well as cases where Fidelity's affiliates may benefit from or be related to the fund's business.
The Board considered the costs of the services provided by and the profits realized by Fidelity in connection with the operation of the fund and was satisfied that the profitability was not excessive in the circumstances.
Economies of Scale. The Board considered whether there have been economies of scale in respect of the management of the Fidelity funds, whether the Fidelity funds (including the fund) have appropriately benefited from any such economies of scale, and whether there is potential for realization of any further economies of scale. The Board considered the extent to which the fund will benefit from economies of scale through increased services to the fund, through waivers or reimbursements, or through fee or expense ratio reductions. The Board also noted that in 2013, it and the boards of other Fidelity funds created an ad hoc committee (the Economies of Scale Committee) to analyze whether Fidelity attains economies of scale in respect of the management and servicing of the Fidelity funds, whether the Fidelity funds have appropriately benefited from such economies of scale, and whether there is potential for realization of any further economies of scale.
The Board recognized that the fund's management contract incorporates a "group fee" structure, which provides for lower group fee rates as total group assets increase, and for higher group fee rates as total group assets decrease (with "group assets" defined to include fund assets under FMR's management plus sector fund assets previously under FMR's management and currently managed by Fidelity SelectCo, LLC). FMR calculates the group fee rates based on a tiered asset "breakpoint" schedule that varies based on asset class. The Board considered that the group fee is designed to deliver the benefits of economies of scale to fund shareholders when total Fidelity fund assets increase, even if assets of any particular fund are unchanged or have declined, because some portion of Fidelity's costs are attributable to services provided to all Fidelity funds, and all funds benefit if those costs can be allocated among more assets. The Board concluded that, given the group fee structure, fund shareholders will benefit from lower management fees as group assets increase at the fund complex level, regardless of whether Fidelity achieves any such economies of scale.
Annual Report
The Board concluded, taking into account the analysis of the Economies of Scale Committee, that economies of scale, if any, are being appropriately shared between fund shareholders and Fidelity.
Additional Information Requested by the Board. In order to develop fully the factual basis for consideration of the Fidelity funds' Advisory Contracts, the Board requested and received additional information on certain topics, including: (i) fund performance trends and Fidelity's long-term strategies for certain funds; (ii) Fidelity's strategic marketing and product lineup goals; (iii) the methodology with respect to competitive fund data and peer group classifications; (iv) the arrangements with, and performance of, certain sub-advisers on behalf of the Fidelity funds, as well as certain proposed participating affiliate arrangements; (v) the realization of fall-out benefits in certain Fidelity business units; (vi) Fidelity's group fee structures, including the rationale for the individual fee rates of certain categories of funds and the definition of group assets; (vii) trends regarding industry use of performance fee structures and the performance adjustment methodologies applicable to the Fidelity funds; (viii) additional competitive analysis regarding the total expenses for certain classes; (ix) fund profitability methodology, including Fidelity's cost allocation methodology, and the impact of certain factors on fund profitability results; and (x) the process by which Fidelity determines sub-advisory fees for funds it advises.
Based on its evaluation of all of the conclusions noted above, and after considering all factors it believed relevant, the Board ultimately concluded that the advisory fee structures are fair and reasonable, and that the fund's Advisory Contracts should be renewed.
Annual Report
Investment Adviser
Fidelity Management & Research Company
Boston, MA
Investment Sub-Advisers
FMR Co., Inc.
Fidelity Management & Research
(U.K.) Inc.
Fidelity Management & Research
(Hong Kong) Limited
Fidelity Management & Research
(Japan) Limited
FIL Investment Advisors
FIL Investment Advisors (U.K.) Limited
FIL Investments (Japan) Limited
General Distributor
Fidelity Distributors Corporation
Smithfield, RI
Transfer and Service Agents
Fidelity Investments Institutional Operations Company, Inc.
Boston, MA
Fidelity Service Company, Inc.
Boston, MA
Custodian
The Northern Trust Company
Chicago, IL
(Fidelity Investment logo)(registered trademark)
AFIVI-UANN-1214
1.827488.108
Fidelity®
International Value
Fund
Annual Report
October 31, 2014
(Fidelity Cover Art)
Contents
Performance | (Click Here) | How the fund has done over time. |
Management's Discussion of Fund Performance | (Click Here) | The Portfolio Manager's review of fund performance and strategy. |
Shareholder Expense Example | (Click Here) | An example of shareholder expenses. |
Investment Changes | (Click Here) | A summary of major shifts in the fund's investments over the past six months. |
Investments | (Click Here) | A complete list of the fund's investments with their market values. |
Financial Statements | (Click Here) | Statements of assets and liabilities, operations, and changes in net assets, as well as financial highlights. |
Notes | (Click Here) | Notes to financial statements. |
Report of Independent Registered Public Accounting Firm | (Click Here) | |
Trustees and Officers | (Click Here) | |
Distributions | (Click Here) | |
Board Approval of Investment Advisory Contracts and Management Fees | (Click Here) | |
To view a fund's proxy voting guidelines and proxy voting record for the 12-month period ended June 30, visit http://www.fidelity.com/proxyvotingresults or visit the Securities and Exchange Commission's (SEC) web site at http://www.sec.gov. You may also call 1-800-544-8544 to request a free copy of the proxy voting guidelines.
Standard & Poor's, S&P and S&P 500 are registered service marks of The McGraw-Hill Companies, Inc. and have been licensed for use by Fidelity Distributors Corporation.
Other third-party marks appearing herein are the property of their respective owners.
All other marks appearing herein are registered or unregistered trademarks or service marks of FMR LLC or an affiliated company. © 2014 FMR LLC. All rights reserved.
Annual Report
This report and the financial statements contained herein are submitted for the general information of the shareholders of the fund. This report is not authorized for distribution to prospective investors in the fund unless preceded or accompanied by an effective prospectus.
A fund files its complete schedule of portfolio holdings with the SEC for the first and third quarters of each fiscal year on Form N-Q. Forms N-Q are available on the SEC's web site at http://www.sec.gov. A fund's Forms N-Q may be reviewed and copied at the SEC's Public Reference Room in Washington, DC. Information regarding the operation of the SEC's Public Reference Room may be obtained by calling 1-800-SEC-0330. For a complete list of a fund's portfolio holdings, view the most recent holdings listing, semiannual report, or annual report on Fidelity's web site at http://www.fidelity.com, http://www.advisor.fidelity.com, or http://www.401k.com, as applicable.
NOT FDIC INSURED • MAY LOSE VALUE • NO BANK GUARANTEE
Neither the fund nor Fidelity Distributors Corporation is a bank.
Annual Report
Average annual total return reflects the change in the value of an investment, assuming reinvestment of the class' distributions from dividend income and capital gains (the profits earned upon the sale of securities that have grown in value, if any) and assuming a constant rate of performance each year. The $10,000 table and the fund's returns do not reflect the deduction of taxes that a shareholder would pay on fund distributions or the redemption of fund shares. During periods of reimbursement by Fidelity, a fund's total return will be greater than it would be had the reimbursement not occurred. How a fund did yesterday is no guarantee of how it will do tomorrow.
Average Annual Total Returns
Periods ended October 31, 2014 | Past 1
year | Past 5
years | Life of
fund A |
Fidelity® International Value Fund | -1.34% | 5.17% | 1.07% |
A From May 18, 2006
$10,000 Over Life of Fund
Let's say hypothetically that $10,000 was invested in Fidelity® International Value Fund, a class of the fund, on May 18, 2006, when the fund started. The chart shows how the value of your investment would have changed, and also shows how the MSCI EAFE Value Index performed over the same period.
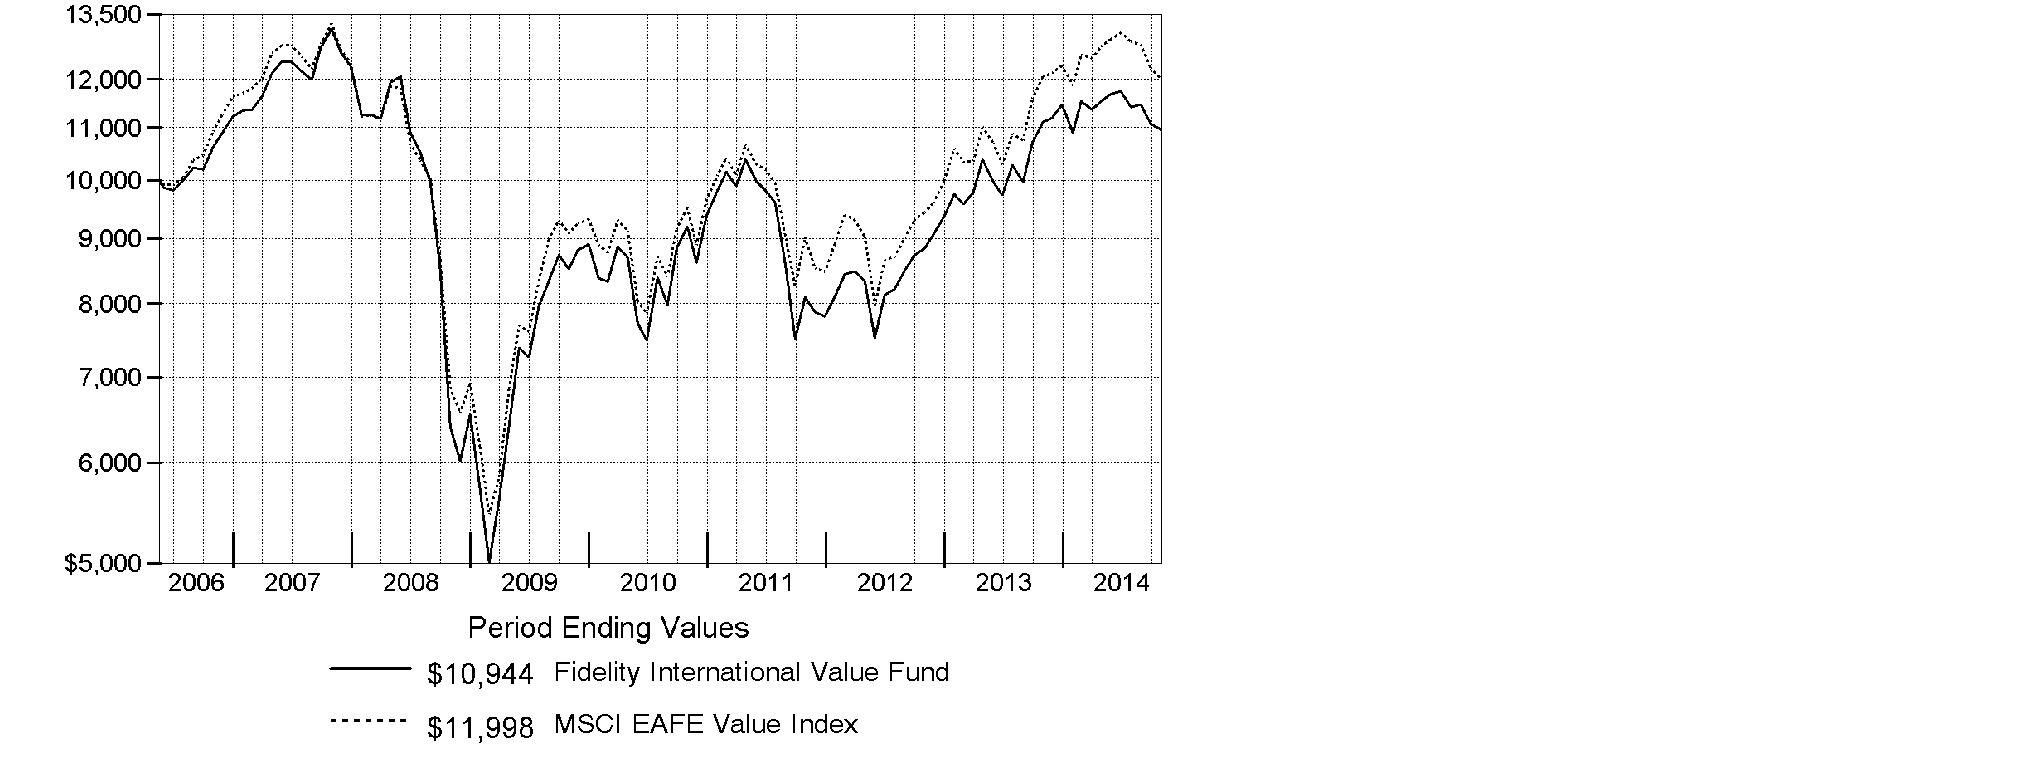
Annual Report
Market Recap: Global equities posted a healthy gain for the 12 months ending October 31, 2014, overcoming an October market decline driven by recessionary pressures in China and tepid growth in Europe. The MSCI ACWI (All Country World Index) Index rose 8.15%, helped by subdued market volatility for much of the period and supported by solid corporate earnings, especially in the United States. Stocks also benefited from easy monetary policies in Japan and the eurozone, as well as increased stimulus efforts in China. All but three of the 24 industry groups that compose the index marked a positive return. The U.S. (+17%) remained a pillar of strength, while a strongly rising dollar in the latter part of the period detracted from investors' returns in most non-U.S. markets. Canada (+5%) notched broad gains outside of its energy and materials sectors, as did Asia-Pacific ex Japan (+4%), led by investor enthusiasm for companies in India. The U.K., Europe and Japan, meanwhile, all underperformed. Among sectors, health care (+24%) led the index, with a strong contribution from the pharmaceuticals, biotechnology & life sciences industry. Information technology (+21%) also outperformed. Conversely, materials (-4%) and energy (-1%) lagged the index due to a higher supply of and lower demand for commodities.
Comments from Alexander Zavratsky, Portfolio Manager of Fidelity® International Value Fund: For the year, the fund's Retail Class shares returned -1.34%, trailing the -0.45% return of the benchmark MSCI EAFE Value Index. Versus the index, the fund was hurt by its investments in higher-quality Japanese financials firms, which lagged due to a rising yen and investor reaction to the U.S. central bank's announcement last fall that its stimulus program may end following a period of tapering. From this category, investments in bank holdings company Sumitomo Mitsui Financial Group and diversified conglomerate ORIX were sore spots. An overweighting, on average, in Sumitomo Mitsui was the fund's biggest relative detractor during the past year. Whereas I became more bearish on Sumitomo Mitsui, I held on to ORIX, believing in its ability to deliver long-term results. Conversely, selling our holdings in U.K.-based food retailer Tesco prior to second half of the year proved the biggest relative contributor, as sliding sales and a loss in market share steadily eroded its stock price. Additionally, the stock, which had been declining over the summer, dipped in early August after the firm issued its third profit warning of the year, then again in September after its new chief executive reported that Tesco's first-half profits had been overstated and four senior executives were suspended.
The views expressed above reflect those of the portfolio manager(s) only through the end of the period as stated on the cover of this report and do not necessarily represent the views of Fidelity or any other person in the Fidelity organization. Any such views are subject to change at any time based upon market or other conditions and Fidelity disclaims any responsibility to update such views. These views may not be relied on as investment advice and, because investment decisions for a Fidelity fund are based on numerous factors, may not be relied on as an indication of trading intent on behalf of any Fidelity fund.
Annual Report
Shareholder Expense Example
As a shareholder of the Fund, you incur two types of costs: (1) transaction costs, including sales charges (loads) on purchase payments or redemption proceeds, redemption fees and (2) ongoing costs, including management fees, distribution and/or service (12b-1) fees and other Fund expenses. This Example is intended to help you understand your ongoing costs (in dollars) of investing in the Fund and to compare these costs with the ongoing costs of investing in other mutual funds.
The Example is based on an investment of $1,000 invested at the beginning of the period and held for the entire period (May 1, 2014 to October 31, 2014).
Actual Expenses
The first line of the accompanying table for each class of the Fund provides information about actual account values and actual expenses. You may use the information in this line, together with the amount you invested, to estimate the expenses that you paid over the period. Simply divide your account value by $1,000.00 (for example, an $8,600 account value divided by $1,000.00 = 8.6), then multiply the result by the number in the first line for a class of the Fund under the heading entitled "Expenses Paid During Period" to estimate the expenses you paid on your account during this period. A small balance maintenance fee of $12.00 that is charged once a year may apply for certain accounts with a value of less than $2,000. This fee is not included in the table below. If it was, the estimate of expenses you paid during the period would be higher, and your ending account value lower, by this amount. In addition, the Fund, as a shareholder in the underlying Fidelity Central Funds, will indirectly bear its pro-rata share of the fees and expenses incurred by the underlying Fidelity Central Funds. These fees and expenses are not included in the Fund's annualized expense ratio used to calculate the expense estimate in the table below.
Hypothetical Example for Comparison Purposes
The second line of the accompanying table for each class of the Fund provides information about hypothetical account values and hypothetical expenses based on a Class' actual expense ratio and an assumed rate of return of 5% per year before expenses, which is not the Class' actual return. The hypothetical account values and expenses may not be used to estimate the actual ending account balance or expenses you paid for the period. You may use this information to compare the ongoing costs of investing in the Fund and other funds. To do so, compare this 5% hypothetical example with the 5% hypothetical examples that appear in the shareholder reports of the other funds. A small balance maintenance fee of $12.00 that is charged once a year may apply for certain accounts with a value of less than $2,000. This fee is not included in the table below. If it was, the estimate of expenses you paid during the period would be higher, and your ending account value lower, by this amount. In addition, the Fund, as a shareholder in the underlying Fidelity Central Funds, will indirectly bear its pro-rata share of the fees and expenses incurred by the underlying Fidelity Central Funds. These fees and expenses are not included in the Fund's annualized expense ratio used to calculate the expense estimate in the table below.
Please note that the expenses shown in the table are meant to highlight your ongoing costs only and do not reflect any transaction costs. Therefore, the second line of the table is useful in comparing ongoing costs only, and will not help you determine the relative total costs of owning different funds. In addition, if these transactional costs were included, your costs would have been higher.
Annual Report
| Annualized
Expense Ratio B | Beginning
Account Value
May 1, 2014 | Ending
Account Value
October 31, 2014 | Expenses Paid
During Period*
May 1, 2014
to October 31, 2014 |
Class A | 1.33% | | | |
Actual | | $ 1,000.00 | $ 947.30 | $ 6.53 |
HypotheticalA | | $ 1,000.00 | $ 1,018.50 | $ 6.77 |
Class T | 1.60% | | | |
Actual | | $ 1,000.00 | $ 946.10 | $ 7.85 |
HypotheticalA | | $ 1,000.00 | $ 1,017.14 | $ 8.13 |
Class B | 2.09% | | | |
Actual | | $ 1,000.00 | $ 944.40 | $ 10.24 |
HypotheticalA | | $ 1,000.00 | $ 1,014.67 | $ 10.61 |
Class C | 2.09% | | | |
Actual | | $ 1,000.00 | $ 944.00 | $ 10.24 |
HypotheticalA | | $ 1,000.00 | $ 1,014.67 | $ 10.61 |
International Value | .96% | | | |
Actual | | $ 1,000.00 | $ 949.50 | $ 4.72 |
HypotheticalA | | $ 1,000.00 | $ 1,020.37 | $ 4.89 |
Institutional Class | 1.09% | | | |
Actual | | $ 1,000.00 | $ 948.50 | $ 5.35 |
HypotheticalA | | $ 1,000.00 | $ 1,019.71 | $ 5.55 |
A 5% return per year before expenses
B Annualized expense ratio reflects expenses net of applicable fee waivers.
* Expenses are equal to each Class' annualized expense ratio, multiplied by the average account value over the period, multiplied by 184/365 (to reflect the one-half year period).
Annual Report
Investment Changes (Unaudited)
Geographic Diversification (% of fund's net assets) |
As of October 31, 2014 |
 | United Kingdom 23.4% | |
 | Japan 18.6% | |
 | France 14.4% | |
 | Switzerland 7.9% | |
 | Germany 7.8% | |
 | Australia 5.7% | |
 | United States of America* 3.7% | |
 | Spain 2.9% | |
 | Netherlands 2.5% | |
 | Other 13.1% | |

* Includes short-term investments and net other assets (liabilities) |
Percentages are based on country or territory of incorporation and are adjusted for the effect of futures contracts, if applicable. |
As of April 30, 2014 |
| United Kingdom 24.4% | |
| France 17.9% | |
| Japan 15.4% | |
| Switzerland 7.7% | |
| Germany 7.5% | |
| United States of America* 6.3% | |
| Australia 5.4% | |
| Sweden 2.1% | |
| Netherlands 1.9% | |
| Other 11.4% | |

* Includes short-term investments and net other assets (liabilities) |
Percentages are based on country or territory of incorporation and are adjusted for the effect of futures contracts, if applicable. |
Asset Allocation as of October 31, 2014 |
| % of fund's
net assets | % of fund's net assets
6 months ago |
Stocks | 98.8 | 95.5 |
Short-Term Investments and Net Other Assets (Liabilities) | 1.2 | 4.5 |
Top Ten Stocks as of October 31, 2014 |
| % of fund's
net assets | % of fund's net assets
6 months ago |
Total SA (France, Oil, Gas & Consumable Fuels) | 3.3 | 4.8 |
Novartis AG (Switzerland, Pharmaceuticals) | 3.2 | 2.3 |
HSBC Holdings PLC sponsored ADR (United Kingdom, Banks) | 2.7 | 2.2 |
Westpac Banking Corp. (Australia, Banks) | 2.4 | 2.3 |
Sanofi SA (France, Pharmaceuticals) | 2.2 | 2.4 |
Mitsubishi UFJ Financial Group, Inc. (Japan, Banks) | 2.2 | 1.3 |
BHP Billiton PLC (United Kingdom, Metals & Mining) | 2.2 | 1.7 |
Nestle SA (Switzerland, Food Products) | 2.1 | 2.1 |
Royal Dutch Shell PLC Class A sponsored ADR (United Kingdom, Oil, Gas & Consumable Fuels) | 2.0 | 1.8 |
Vodafone Group PLC sponsored ADR (United Kingdom, Wireless Telecommunication Services) | 2.0 | 2.0 |
| 24.3 | |
Market Sectors as of October 31, 2014 |
| % of fund's
net assets | % of fund's net assets
6 months ago |
Financials | 25.5 | 23.8 |
Health Care | 16.1 | 15.6 |
Consumer Discretionary | 10.2 | 10.4 |
Telecommunication Services | 9.0 | 8.4 |
Consumer Staples | 8.5 | 8.3 |
Industrials | 8.1 | 9.4 |
Energy | 7.2 | 6.6 |
Information Technology | 5.5 | 4.0 |
Materials | 4.8 | 6.0 |
Utilities | 3.9 | 3.0 |
Annual Report
Investments October 31, 2014
Showing Percentage of Net Assets
Common Stocks - 97.8% |
| Shares | | Value |
Australia - 5.7% |
Ansell Ltd. | 52,575 | | $ 922,199 |
Australia & New Zealand Banking Group Ltd. | 116,005 | | 3,432,655 |
Telstra Corp. Ltd. | 236,519 | | 1,176,955 |
Transurban Group unit | 196,204 | | 1,405,195 |
Westpac Banking Corp. | 160,274 | | 4,919,494 |
TOTAL AUSTRALIA | | 11,856,498 |
Bailiwick of Jersey - 1.2% |
Shire PLC | 21,400 | | 1,435,874 |
Wolseley PLC | 20,590 | | 1,092,548 |
TOTAL BAILIWICK OF JERSEY | | 2,528,422 |
Belgium - 0.9% |
Anheuser-Busch InBev SA NV | 11,070 | | 1,227,601 |
UCB SA | 8,600 | | 693,937 |
TOTAL BELGIUM | | 1,921,538 |
Bermuda - 0.1% |
Travelport Worldwide Ltd. | 20,771 | | 300,141 |
Canada - 1.1% |
Imperial Oil Ltd. | 24,200 | | 1,164,426 |
Potash Corp. of Saskatchewan, Inc. | 33,600 | | 1,146,881 |
TOTAL CANADA | | 2,311,307 |
Denmark - 0.8% |
A.P. Moller - Maersk A/S Series B | 673 | | 1,568,199 |
Finland - 1.1% |
Sampo Oyj (A Shares) | 46,634 | | 2,230,632 |
France - 14.4% |
Atos Origin SA | 22,183 | | 1,531,426 |
AXA SA | 97,221 | | 2,242,936 |
BNP Paribas SA | 50,847 | | 3,194,867 |
Cap Gemini SA | 25,693 | | 1,689,064 |
GDF Suez | 78,778 | | 1,910,738 |
Havas SA | 155,466 | | 1,256,603 |
Orange SA | 130,000 | | 2,069,649 |
Renault SA | 16,345 | | 1,213,192 |
Sanofi SA | 51,166 | | 4,642,808 |
Schneider Electric SA | 13,405 | | 1,056,288 |
Common Stocks - continued |
| Shares | | Value |
France - continued |
Total SA | 114,563 | | $ 6,839,790 |
Vivendi SA | 98,899 | | 2,413,640 |
TOTAL FRANCE | | 30,061,001 |
Germany - 6.8% |
Allianz SE | 22,439 | | 3,568,298 |
BASF AG | 39,549 | | 3,481,153 |
Bayer AG | 15,003 | | 2,132,975 |
Continental AG | 6,566 | | 1,288,945 |
Fresenius SE & Co. KGaA | 29,100 | | 1,496,957 |
GEA Group AG | 27,042 | | 1,243,509 |
Siemens AG | 7,361 | | 830,272 |
TOTAL GERMANY | | 14,042,109 |
Ireland - 0.9% |
Actavis PLC (a) | 7,400 | | 1,796,276 |
Israel - 1.2% |
Teva Pharmaceutical Industries Ltd. sponsored ADR | 43,799 | | 2,473,330 |
Italy - 1.2% |
Intesa Sanpaolo SpA | 495,100 | | 1,455,475 |
Telecom Italia SpA (a)(d) | 891,000 | | 1,009,754 |
TOTAL ITALY | | 2,465,229 |
Japan - 18.6% |
Astellas Pharma, Inc. | 136,600 | | 2,120,100 |
Dentsu, Inc. | 31,700 | | 1,178,591 |
East Japan Railway Co. | 19,300 | | 1,507,392 |
Fujitsu Ltd. | 157,000 | | 954,476 |
Hitachi Ltd. | 250,000 | | 1,964,369 |
Hoya Corp. | 56,800 | | 2,009,973 |
Itochu Corp. | 220,200 | | 2,661,897 |
Japan Tobacco, Inc. | 92,300 | | 3,149,189 |
KDDI Corp. | 33,100 | | 2,173,659 |
Mitsubishi Electric Corp. | 90,000 | | 1,160,442 |
Mitsubishi UFJ Financial Group, Inc. | 790,400 | | 4,607,411 |
Nippon Telegraph & Telephone Corp. | 34,800 | | 2,165,216 |
OMRON Corp. | 27,200 | | 1,287,503 |
ORIX Corp. | 100,300 | | 1,392,188 |
Seven & i Holdings Co., Ltd. | 58,100 | | 2,269,161 |
Seven Bank Ltd. | 271,500 | | 1,133,893 |
SoftBank Corp. | 11,800 | | 859,033 |
Sony Financial Holdings, Inc. | 71,200 | | 1,136,687 |
Common Stocks - continued |
| Shares | | Value |
Japan - continued |
Sumitomo Mitsui Trust Holdings, Inc. | 442,000 | | $ 1,804,564 |
Toyota Motor Corp. | 51,300 | | 3,087,091 |
TOTAL JAPAN | | 38,622,835 |
Korea (South) - 0.5% |
Samsung Electronics Co. Ltd. | 841 | | 973,716 |
Luxembourg - 0.4% |
RTL Group SA | 9,839 | | 914,374 |
Netherlands - 2.5% |
ING Groep NV (Certificaten Van Aandelen) (a) | 171,690 | | 2,458,663 |
Reed Elsevier NV | 117,061 | | 2,694,054 |
TOTAL NETHERLANDS | | 5,152,717 |
Norway - 0.7% |
Statoil ASA | 66,000 | | 1,510,439 |
Singapore - 0.8% |
Singapore Telecommunications Ltd. | 530,000 | | 1,559,937 |
Spain - 2.9% |
Amadeus IT Holding SA Class A | 30,962 | | 1,136,841 |
Banco Bilbao Vizcaya Argentaria SA | 221,342 | | 2,475,686 |
Iberdrola SA | 343,700 | | 2,429,622 |
TOTAL SPAIN | | 6,042,149 |
Sweden - 2.2% |
Meda AB (A Shares) | 62,100 | | 815,761 |
Nordea Bank AB | 222,000 | | 2,847,098 |
Svenska Cellulosa AB (SCA) (B Shares) | 40,065 | | 895,801 |
TOTAL SWEDEN | | 4,558,660 |
Switzerland - 7.9% |
Credit Suisse Group AG | 79,817 | | 2,126,628 |
Nestle SA | 59,746 | | 4,381,421 |
Novartis AG | 71,563 | | 6,641,252 |
Roche Holding AG (participation certificate) | 4,927 | | 1,453,966 |
Syngenta AG (Switzerland) | 2,586 | | 799,740 |
UBS AG (NY Shares) | 61,458 | | 1,068,140 |
TOTAL SWITZERLAND | | 16,471,147 |
United Kingdom - 23.4% |
AstraZeneca PLC (United Kingdom) | 52,745 | | 3,852,937 |
BAE Systems PLC | 322,429 | | 2,365,927 |
Barclays PLC | 722,751 | | 2,779,641 |
Common Stocks - continued |
| Shares | | Value |
United Kingdom - continued |
BG Group PLC | 77,900 | | $ 1,298,284 |
BHP Billiton PLC | 176,628 | | 4,563,468 |
BT Group PLC | 85,378 | | 503,331 |
Bunzl PLC | 72,414 | | 1,963,499 |
Compass Group PLC | 131,339 | | 2,113,636 |
GlaxoSmithKline PLC | 45,639 | | 1,032,079 |
HSBC Holdings PLC sponsored ADR (d) | 110,742 | | 5,650,057 |
Imperial Tobacco Group PLC | 70,233 | | 3,045,855 |
Informa PLC | 135,091 | | 1,039,465 |
ITV PLC | 583,096 | | 1,893,541 |
Liberty Global PLC Class A (a) | 27,100 | | 1,232,237 |
National Grid PLC | 254,981 | | 3,783,908 |
Next PLC | 9,400 | | 969,146 |
Prudential PLC | 78,195 | | 1,810,686 |
Royal Dutch Shell PLC Class A sponsored ADR | 58,979 | | 4,234,102 |
Standard Chartered PLC (United Kingdom) | 37,125 | | 558,018 |
Vodafone Group PLC sponsored ADR | 122,858 | | 4,081,343 |
TOTAL UNITED KINGDOM | | 48,771,160 |
United States of America - 2.5% |
AbbVie, Inc. | 13,742 | | 872,067 |
Altria Group, Inc. | 25,800 | | 1,247,172 |
Constellation Brands, Inc. Class A (sub. vtg.) (a) | 14,800 | | 1,354,792 |
ResMed, Inc. CDI (d) | 209,067 | | 1,099,368 |
T-Mobile U.S., Inc. (a) | 24,700 | | 720,993 |
TOTAL UNITED STATES OF AMERICA | | 5,294,392 |
TOTAL COMMON STOCKS (Cost $201,705,371) |
203,426,208
|
Nonconvertible Preferred Stocks - 1.0% |
| | | |
Germany - 1.0% |
Volkswagen AG
(Cost $2,250,614) | 10,231 | |
2,180,207
|
Money Market Funds - 2.4% |
| Shares | | Value |
Fidelity Cash Central Fund, 0.11% (b) | 1,490,412 | | $ 1,490,412 |
Fidelity Securities Lending Cash Central Fund, 0.11% (b)(c) | 3,523,300 | | 3,523,300 |
TOTAL MONEY MARKET FUNDS (Cost $5,013,712) |
5,013,712
|
TOTAL INVESTMENT PORTFOLIO - 101.2% (Cost $208,969,697) | | 210,620,127 |
NET OTHER ASSETS (LIABILITIES) - (1.2)% | | (2,560,016) |
NET ASSETS - 100% | $ 208,060,111 |
Legend |
(a) Non-income producing |
(b) Affiliated fund that is generally available only to investment companies and other accounts managed by Fidelity Investments. The rate quoted is the annualized seven-day yield of the fund at period end. A complete unaudited listing of the fund's holdings as of its most recent quarter end is available upon request. In addition, each Fidelity Central Fund's financial statements, which are not covered by the Fund's Report of Independent Registered Public Accounting Firm, are available on the SEC's website or upon request. |
(c) Investment made with cash collateral received from securities on loan. |
(d) Security or a portion of the security is on loan at period end. |
Affiliated Central Funds |
Information regarding fiscal year to date income earned by the Fund from investments in Fidelity Central Funds is as follows: |
Fund | Income earned |
Fidelity Cash Central Fund | $ 3,947 |
Fidelity Securities Lending Cash Central Fund | 161,924 |
Total | $ 165,871 |
Other Information |
Categorizations in the Schedule of Investments are based on country or territory of incorporation. |
The following is a summary of the inputs used, as of October 31, 2014, involving the Fund's assets and liabilities carried at fair value. The inputs or methodology used for valuing securities may not be an indication of the risk associated with investing in those securities. For more information on valuation inputs, and their aggregation into the levels used in the tables below, please refer to the Investment Valuation section in the accompanying Notes to Financial Statements. |
Valuation Inputs at Reporting Date: |
Description | Total | Level 1 | Level 2 | Level 3 |
Investments in Securities: | | | | |
Equities: | | | | |
Consumer Discretionary | $ 21,361,223 | $ 17,095,541 | $ 4,265,682 | $ - |
Consumer Staples | 17,570,992 | 6,543,620 | 11,027,372 | - |
Energy | 15,047,041 | 5,398,528 | 9,648,513 | - |
Financials | 52,893,717 | 17,791,748 | 35,101,969 | - |
Health Care | 33,481,886 | 10,281,303 | 23,200,583 | - |
Industrials | 16,855,168 | 9,289,970 | 7,565,198 | - |
Information Technology | 11,547,368 | 5,331,047 | 6,216,321 | - |
Materials | 9,991,242 | 4,628,034 | 5,363,208 | - |
Telecommunication Services | 18,733,510 | 7,215,976 | 11,517,534 | - |
Utilities | 8,124,268 | 4,340,360 | 3,783,908 | - |
Money Market Funds | 5,013,712 | 5,013,712 | - | - |
Total Investments in Securities: | $ 210,620,127 | $ 92,929,839 | $ 117,690,288 | $ - |
The following is a summary of transfers between Level 1 and Level 2 for the period ended October 31, 2014. Transfers are assumed to have occurred at the beginning of the period, and are primarily attributable to the valuation techniques used for foreign equity securities, as discussed in the accompanying Notes to Financial Statements: |
Transfers | Total |
Level 1 to Level 2 | $ 18,553,193 |
Level 2 to Level 1 | $ 0 |
See accompanying notes which are an integral part of the financial statements.
Annual Report
Statement of Assets and Liabilities
| October 31, 2014 |
| | |
Assets | | |
Investment in securities, at value (including securities loaned of $3,468,947) - See accompanying schedule: Unaffiliated issuers (cost $203,955,985) | $ 205,606,415 | |
Fidelity Central Funds (cost $5,013,712) | 5,013,712 | |
Total Investments (cost $208,969,697) | | $ 210,620,127 |
Cash | | 2 |
Foreign currency held at value (cost $5,524) | | 5,524 |
Receivable for investments sold | | 2,809,678 |
Receivable for fund shares sold | | 79,904 |
Dividends receivable | | 723,355 |
Distributions receivable from Fidelity Central Funds | | 5,174 |
Prepaid expenses | | 677 |
Other receivables | | 1,614 |
Total assets | | 214,246,055 |
| | |
Liabilities | | |
Payable for investments purchased | $ 2,366,704 | |
Payable for fund shares redeemed | 54,010 | |
Accrued management fee | 122,100 | |
Distribution and service plan fees payable | 6,011 | |
Other affiliated payables | 42,738 | |
Other payables and accrued expenses | 71,081 | |
Collateral on securities loaned, at value | 3,523,300 | |
Total liabilities | | 6,185,944 |
| | |
Net Assets | | $ 208,060,111 |
Net Assets consist of: | | |
Paid in capital | | $ 303,438,497 |
Undistributed net investment income | | 7,054,946 |
Accumulated undistributed net realized gain (loss) on investments and foreign currency transactions | | (104,059,003) |
Net unrealized appreciation (depreciation) on investments and assets and liabilities in foreign currencies | | 1,625,671 |
Net Assets | | $ 208,060,111 |
See accompanying notes which are an integral part of the financial statements.
Annual Report
Statement of Assets and Liabilities - continued
| October 31, 2014 |
| | |
Calculation of Maximum Offering Price Class A:
Net Asset Value and redemption price per share ($6,296,411 ÷ 730,081 shares) | | $ 8.62 |
| | |
Maximum offering price per share (100/94.25 of $8.62) | | $ 9.15 |
Class T:
Net Asset Value and redemption price per share ($3,603,734 ÷ 418,897 shares) | | $ 8.60 |
| | |
Maximum offering price per share (100/96.50 of $8.60) | | $ 8.91 |
Class B:
Net Asset Value and offering price per share ($414,070 ÷ 47,839 shares)A | | $ 8.66 |
| | |
Class C:
Net Asset Value and offering price per share ($3,646,790 ÷ 424,463 shares)A | | $ 8.59 |
| | |
International Value:
Net Asset Value, offering price and redemption price per share ($192,789,069 ÷ 22,313,205 shares) | | $ 8.64 |
| | |
Institutional Class:
Net Asset Value, offering price and redemption price per share ($1,310,037 ÷ 151,443 shares) | | $ 8.65 |
A Redemption price per share is equal to net asset value less any applicable contingent deferred sales charge.
See accompanying notes which are an integral part of the financial statements.
Annual Report
Financial Statements - continued
Statement of Operations
| Year ended October 31, 2014 |
| | |
Investment Income | | |
Dividends | | $ 6,954,134 |
Special dividends | | 3,142,692 |
Income from Fidelity Central Funds | | 165,871 |
Income before foreign taxes withheld | | 10,262,697 |
Less foreign taxes withheld | | (513,411) |
Total income | | 9,749,286 |
| | |
Expenses | | |
Management fee
Basic fee | $ 1,434,574 | |
Performance adjustment | (213,552) | |
Transfer agent fees | 402,517 | |
Distribution and service plan fees | 76,579 | |
Accounting and security lending fees | 107,492 | |
Custodian fees and expenses | 104,890 | |
Independent trustees' compensation | 836 | |
Registration fees | 75,702 | |
Audit | 62,675 | |
Legal | 689 | |
Miscellaneous | 1,603 | |
Total expenses before reductions | 2,054,005 | |
Expense reductions | (4,121) | 2,049,884 |
Net investment income (loss) | | 7,699,402 |
Realized and Unrealized Gain (Loss) Net realized gain (loss) on: | | |
Investment securities: | | |
Unaffiliated issuers | 12,125,451 | |
Foreign currency transactions | (45,328) | |
Total net realized gain (loss) | | 12,080,123 |
Change in net unrealized appreciation (depreciation) on: Investment securities | (23,406,359) | |
Assets and liabilities in foreign currencies | (29,100) | |
Total change in net unrealized appreciation (depreciation) | | (23,435,459) |
Net gain (loss) | | (11,355,336) |
Net increase (decrease) in net assets resulting from operations | | $ (3,655,934) |
See accompanying notes which are an integral part of the financial statements.
Annual Report
Statement of Changes in Net Assets
| Year ended
October 31,
2014 | Year ended
October 31,
2013 |
Increase (Decrease) in Net Assets | | |
Operations | | |
Net investment income (loss) | $ 7,699,402 | $ 3,964,300 |
Net realized gain (loss) | 12,080,123 | 9,397,591 |
Change in net unrealized appreciation (depreciation) | (23,435,459) | 23,791,522 |
Net increase (decrease) in net assets resulting
from operations | (3,655,934) | 37,153,413 |
Distributions to shareholders from net investment income | (4,160,313) | (4,120,600) |
Distributions to shareholders from net realized gain | (301,192) | (786,952) |
Total distributions | (4,461,505) | (4,907,552) |
Share transactions - net increase (decrease) | 20,511,129 | 23,938,130 |
Redemption fees | 1,150 | 3,144 |
Total increase (decrease) in net assets | 12,394,840 | 56,187,135 |
| | |
Net Assets | | |
Beginning of period | 195,665,271 | 139,478,136 |
End of period (including undistributed net investment income of $7,054,946 and undistributed net investment income of $3,680,675, respectively) | $ 208,060,111 | $ 195,665,271 |
See accompanying notes which are an integral part of the financial statements.
Annual Report
Financial Highlights - Class A
Years ended October 31, | 2014 | 2013 | 2012 | 2011 | 2010 |
Selected Per-Share Data | | | | | |
Net asset value, beginning of period | $ 8.96 | $ 7.39 | $ 7.02 | $ 8.22 | $ 7.75 |
Income from Investment Operations | | | | | |
Net investment income (loss) C | .31 I | .17 | .20 | .22 | .15 |
Net realized and unrealized gain (loss) | (.47) | 1.64 | .39 | (1.19) | .44 |
Total from investment operations | (.16) | 1.81 | .59 | (.97) | .59 |
Distributions from net investment income | (.17) | (.20) | (.22) | (.19) | (.11) |
Distributions from net realized gain | (.01) | (.04) | - | (.03) | (.01) |
Total distributions | (.18) | (.24) | (.22) | (.23) H | (.12) |
Redemption fees added to paid in capital C, G | - | - | - | - | - |
Net asset value, end of period | $ 8.62 | $ 8.96 | $ 7.39 | $ 7.02 | $ 8.22 |
Total Return A, B | (1.76)% | 25.24% | 8.82% | (12.19)% | 7.60% |
Ratios to Average Net Assets D, F | | | | | |
Expenses before reductions | 1.32% | 1.39% | 1.44% | 1.36% | 1.40% |
Expenses net of fee waivers, if any | 1.32% | 1.39% | 1.44% | 1.36% | 1.40% |
Expenses net of all reductions | 1.32% | 1.36% | 1.41% | 1.34% | 1.38% |
Net investment income (loss) | 3.44% I | 2.08% | 2.85% | 2.79% | 1.93% |
Supplemental Data | | | | | |
Net assets, end of period (000 omitted) | $ 6,296 | $ 6,191 | $ 4,491 | $ 4,668 | $ 4,699 |
Portfolio turnover rate E | 69% | 79% | 74% | 83% | 43% |
A Total returns would have been lower if certain expenses had not been reduced during the applicable periods shown.
B Total returns do not include the effect of the sales charges.
C Calculated based on average shares outstanding during the period.
D Fees and expenses of any underlying Fidelity Central Funds are not included in the Fund's expense ratio. The Fund indirectly bears its proportionate share of the expenses of any underlying Fidelity Central Funds.
E Amount does not include the portfolio activity of any underlying Fidelity Central Funds.
F Expense ratios reflect operating expenses of the class. Expenses before reductions do not reflect amounts reimbursed by the investment adviser or reductions from brokerage service arrangements or reductions from other expense offset arrangements and do not represent the amount paid by the class during periods when reimbursements or reductions occur. Expenses net of fee waivers reflect expenses after reimbursement by the investment adviser but prior to reductions from brokerage service arrangements or other expense offset arrangements. Expenses net of all reductions represent the net expenses paid by the class.
G Amount represents less than $.01 per share.
H Total distributions of $.23 per share is comprised of distributions from net investment income of $.191 and distributions from net realized gain of $.034 per share.
I Investment income per share reflects a large, non-recurring dividend which amounted to $.14 per share. Excluding this non-recurring dividend, the ratio of net investment income (loss) to average net assets would have been 1.90%.
See accompanying notes which are an integral part of the financial statements.
Annual Report
Financial Highlights - Class T
Years ended October 31, | 2014 | 2013 | 2012 | 2011 | 2010 |
Selected Per-Share Data | | | | | |
Net asset value, beginning of period | $ 8.94 | $ 7.38 | $ 7.00 | $ 8.20 | $ 7.73 |
Income from Investment Operations | | | | | |
Net investment income (loss) C | .28 I | .15 | .18 | .20 | .13 |
Net realized and unrealized gain (loss) | (.46) | 1.64 | .40 | (1.19) | .44 |
Total from investment operations | (.18) | 1.79 | .58 | (.99) | .57 |
Distributions from net investment income | (.15) | (.19) | (.20) | (.17) | (.09) |
Distributions from net realized gain | (.01) | (.04) | - | (.03) | (.01) |
Total distributions | (.16) | (.23) | (.20) | (.21) H | (.10) |
Redemption fees added to paid in capital C, G | - | - | - | - | - |
Net asset value, end of period | $ 8.60 | $ 8.94 | $ 7.38 | $ 7.00 | $ 8.20 |
Total Return A, B | (1.99)% | 24.86% | 8.60% | (12.42)% | 7.32% |
Ratios to Average Net Assets D, F | | | | | |
Expenses before reductions | 1.59% | 1.66% | 1.71% | 1.63% | 1.67% |
Expenses net of fee waivers, if any | 1.59% | 1.65% | 1.70% | 1.62% | 1.67% |
Expenses net of all reductions | 1.59% | 1.63% | 1.67% | 1.60% | 1.65% |
Net investment income (loss) | 3.17% I | 1.81% | 2.58% | 2.52% | 1.65% |
Supplemental Data | | | | | |
Net assets, end of period (000 omitted) | $ 3,604 | $ 3,758 | $ 2,693 | $ 2,468 | $ 2,276 |
Portfolio turnover rate E | 69% | 79% | 74% | 83% | 43% |
A Total returns would have been lower if certain expenses had not been reduced during the applicable periods shown.
B Total returns do not include the effect of the sales charges.
C Calculated based on average shares outstanding during the period.
D Fees and expenses of any underlying Fidelity Central Funds are not included in the Fund's expense ratio. The Fund indirectly bears its proportionate share of the expenses of any underlying Fidelity Central Funds.
E Amount does not include the portfolio activity of any underlying Fidelity Central Funds.
F Expense ratios reflect operating expenses of the class. Expenses before reductions do not reflect amounts reimbursed by the investment adviser or reductions from brokerage service arrangements or reductions from other expense offset arrangements and do not represent the amount paid by the class during periods when reimbursements or reductions occur. Expenses net of fee waivers reflect expenses after reimbursement by the investment adviser but prior to reductions from brokerage service arrangements or other expense offset arrangements. Expenses net of all reductions represent the net expenses paid by the class.
G Amount represents less than $.01 per share.
H Total distributions of $.21 per share is comprised of distributions from net investment income of $.173 and distributions from net realized gain of $.034 per share.
I Investment income per share reflects a large, non-recurring dividend which amounted to $.14 per share. Excluding this non-recurring dividend, the ratio of net investment income (loss) to average net assets would have been 1.64%.
See accompanying notes which are an integral part of the financial statements.
Annual Report
Financial Highlights - Class B
Years ended October 31, | 2014 | 2013 | 2012 | 2011 | 2010 |
Selected Per-Share Data | | | | | |
Net asset value, beginning of period | $ 8.98 | $ 7.39 | $ 7.00 | $ 8.20 | $ 7.74 |
Income from Investment Operations | | | | | |
Net investment income (loss) C | .24 J | .11 | .14 | .17 | .09 |
Net realized and unrealized gain (loss) | (.45) | 1.65 | .41 | (1.20) | .44 |
Total from investment operations | (.21) | 1.76 | .55 | (1.03) | .53 |
Distributions from net investment income | (.09) | (.13) | (.16) | (.13) | (.06) |
Distributions from net realized gain | (.01) | (.04) | - | (.03) | (.01) |
Total distributions | (.11) I | (.17) | (.16) | (.17) H | (.07) |
Redemption fees added to paid in capital C, G | - | - | - | - | - |
Net asset value, end of period | $ 8.66 | $ 8.98 | $ 7.39 | $ 7.00 | $ 8.20 |
Total Return A, B | (2.39)% | 24.30% | 8.07% | (12.88)% | 6.82% |
Ratios to Average Net Assets D, F | | | | | |
Expenses before reductions | 2.08% | 2.14% | 2.19% | 2.11% | 2.15% |
Expenses net of fee waivers, if any | 2.08% | 2.14% | 2.19% | 2.11% | 2.15% |
Expenses net of all reductions | 2.08% | 2.11% | 2.16% | 2.09% | 2.13% |
Net investment income (loss) | 2.68% J | 1.32% | 2.09% | 2.04% | 1.18% |
Supplemental Data | | | | | |
Net assets, end of period (000 omitted) | $ 414 | $ 678 | $ 691 | $ 901 | $ 1,216 |
Portfolio turnover rate E | 69% | 79% | 74% | 83% | 43% |
A Total returns would have been lower if certain expenses had not been reduced during the applicable periods shown.
B Total returns do not include the effect of the contingent deferred sales charge.
C Calculated based on average shares outstanding during the period.
D Fees and expenses of any underlying Fidelity Central Funds are not included in the Fund's expense ratio. The Fund indirectly bears its proportionate share of the expenses of any underlying Fidelity Central Funds.
E Amount does not include the portfolio activity of any underlying Fidelity Central Funds.
F Expense ratios reflect operating expenses of the class. Expenses before reductions do not reflect amounts reimbursed by the investment adviser or reductions from brokerage service arrangements or reductions from other expense offset arrangements and do not represent the amount paid by the class during periods when reimbursements or reductions occur. Expenses net of fee waivers reflect expenses after reimbursement by the investment adviser but prior to reductions from brokerage service arrangements or other expense offset arrangements. Expenses net of all reductions represent the net expenses paid by the class.
G Amount represents less than $.01 per share.
H Total distributions of $.17 per share is comprised of distributions from net investment income of $.131 and distributions from net realized gain of $.034 per share.
I Total distributions of $.11 per share is comprised of distributions from net investment income of $.093 and distributions from net realized gain of $.014 per share.
J Investment income per share reflects a large, non-recurring dividend which amounted to $.14 per share. Excluding this non-recurring dividend, the ratio of net investment income (loss) to average net assets would have been 1.15%.
See accompanying notes which are an integral part of the financial statements.
Annual Report
Financial Highlights - Class C
Years ended October 31, | 2014 | 2013 | 2012 | 2011 | 2010 |
Selected Per-Share Data | | | | | |
Net asset value, beginning of period | $ 8.93 | $ 7.38 | $ 7.00 | $ 8.20 | $ 7.73 |
Income from Investment Operations | | | | | |
Net investment income (loss) C | .24 I | .11 | .14 | .16 | .09 |
Net realized and unrealized gain (loss) | (.45) | 1.63 | .41 | (1.19) | .44 |
Total from investment operations | (.21) | 1.74 | .55 | (1.03) | .53 |
Distributions from net investment income | (.11) | (.15) | (.17) | (.14) | (.05) |
Distributions from net realized gain | (.01) | (.04) | - | (.03) | (.01) |
Total distributions | (.13) H | (.19) | (.17) | (.17) | (.06) |
Redemption fees added to paid in capital C, G | - | - | - | - | - |
Net asset value, end of period | $ 8.59 | $ 8.93 | $ 7.38 | $ 7.00 | $ 8.20 |
Total Return A, B | (2.43)% | 24.17% | 8.12% | (12.84)% | 6.84% |
Ratios to Average Net Assets D, F | | | | | |
Expenses before reductions | 2.07% | 2.14% | 2.19% | 2.12% | 2.15% |
Expenses net of fee waivers, if any | 2.07% | 2.14% | 2.19% | 2.11% | 2.15% |
Expenses net of all reductions | 2.07% | 2.11% | 2.16% | 2.09% | 2.13% |
Net investment income (loss) | 2.69% I | 1.33% | 2.09% | 2.04% | 1.18% |
Supplemental Data | | | | | |
Net assets, end of period (000 omitted) | $ 3,647 | $ 3,231 | $ 2,249 | $ 2,108 | $ 2,123 |
Portfolio turnover rate E | 69% | 79% | 74% | 83% | 43% |
A Total returns would have been lower if certain expenses had not been reduced during the applicable periods shown.
B Total returns do not include the effect of the contingent deferred sales charge.
C Calculated based on average shares outstanding during the period.
D Fees and expenses of any underlying Fidelity Central Funds are not included in the Fund's expense ratio. The Fund indirectly bears its proportionate share of the expenses of any underlying Fidelity Central Funds.
E Amount does not include the portfolio activity of any underlying Fidelity Central Funds.
F Expense ratios reflect operating expenses of the class. Expenses before reductions do not reflect amounts reimbursed by the investment adviser or reductions from brokerage service arrangements or reductions from other expense offset arrangements and do not represent the amount paid by the class during periods when reimbursements or reductions occur. Expenses net of fee waivers reflect expenses after reimbursement by the investment adviser but prior to reductions from brokerage service arrangements or other expense offset arrangements. Expenses net of all reductions represent the net expenses paid by the class.
G Amount represents less than $.01 per share.
H Total distributions of $.13 per share is comprised of distributions from net investment income of $.111 and distributions from net realized gain of $.014 per share.
I Investment income per share reflects a large, non-recurring dividend which amounted to $.14 per share. Excluding this non-recurring dividend, the ratio of net investment income (loss) to average net assets would have been 1.15%.
See accompanying notes which are an integral part of the financial statements.
Annual Report
Financial Highlights - International Value
Years ended October 31, | 2014 | 2013 | 2012 | 2011 | 2010 |
Selected Per-Share Data | | | | | |
Net asset value, beginning of period | $ 8.97 | $ 7.40 | $ 7.03 | $ 8.23 | $ 7.75 |
Income from Investment Operations | | | | | |
Net investment income (loss) B | .34 I | .19 | .22 | .25 | .17 |
Net realized and unrealized gain (loss) | (.46) | 1.65 | .40 | (1.20) | .44 |
Total from investment operations | (.12) | 1.84 | .62 | (.95) | .61 |
Distributions from net investment income | (.20) | (.22) | (.25) | (.22) | (.13) |
Distributions from net realized gain | (.01) | (.04) | - | (.03) | (.01) |
Total distributions | (.21) | (.27) H | (.25) | (.25) | (.13) G |
Redemption fees added to paid in capital B, F | - | - | - | - | - |
Net asset value, end of period | $ 8.64 | $ 8.97 | $ 7.40 | $ 7.03 | $ 8.23 |
Total Return A | (1.34)% | 25.57% | 9.19% | (11.91)% | 7.95% |
Ratios to Average Net Assets C, E | | | | | |
Expenses before reductions | .96% | 1.05% | 1.13% | 1.04% | 1.09% |
Expenses net of fee waivers, if any | .96% | 1.05% | 1.13% | 1.03% | 1.09% |
Expenses net of all reductions | .95% | 1.02% | 1.10% | 1.01% | 1.08% |
Net investment income (loss) | 3.80% I | 2.41% | 3.16% | 3.11% | 2.23% |
Supplemental Data | | | | | |
Net assets, end of period (000 omitted) | $ 192,789 | $ 181,568 | $ 128,983 | $ 150,967 | $ 163,090 |
Portfolio turnover rate D | 69% | 79% | 74% | 83% | 43% |
A Total returns would have been lower if certain expenses had not been reduced during the applicable periods shown.
B Calculated based on average shares outstanding during the period.
C Fees and expenses of any underlying Fidelity Central Funds are not included in the Fund's expense ratio. The Fund indirectly bears its proportionate share of the expenses of any underlying Fidelity Central Funds.
D Amount does not include the portfolio activity of any underlying Fidelity Central Funds.
E Expense ratios reflect operating expenses of the class. Expenses before reductions do not reflect amounts reimbursed by the investment adviser or reductions from brokerage service arrangements or reductions from other expense offset arrangements and do not represent the amount paid by the class during periods when reimbursements or reductions occur. Expenses net of fee waivers reflect expenses after reimbursement by the investment adviser but prior to reductions from brokerage service arrangements or other expense offset arrangements. Expenses net of all reductions represent the net expenses paid by the class.
F Amount represents less than $.01 per share.
G Total distributions of $.13 per share is comprised of distributions from net investment income of $.129 and distributions from net realized gain of $.005 per share.
H Total distributions of $.27 per share is comprised of distributions from net investment income of $.223 and distributions from net realized gain of $.042 per share.
I Investment income per share reflects a large, non-recurring dividend which amounted to $.14 per share. Excluding this non-recurring dividend, the ratio of net investment income (loss) to average net assets would have been 2.27%.
See accompanying notes which are an integral part of the financial statements.
Annual Report
Financial Highlights - Institutional Class
Years ended October 31, | 2014 | 2013 | 2012 | 2011 | 2010 |
Selected Per-Share Data | | | | | |
Net asset value, beginning of period | $ 8.98 | $ 7.41 | $ 7.04 | $ 8.24 | $ 7.76 |
Income from Investment Operations | | | | | |
Net investment income (loss) B | .33 J | .19 | .22 | .25 | .18 |
Net realized and unrealized gain (loss) | (.45) | 1.65 | .40 | (1.19) | .44 |
Total from investment operations | (.12) | 1.84 | .62 | (.94) | .62 |
Distributions from net investment income | (.19) | (.23) | (.25) | (.22) | (.14) |
Distributions from net realized gain | (.01) | (.04) | - | (.03) | (.01) |
Total distributions | (.21) I | (.27) | (.25) | (.26) H | (.14) G |
Redemption fees added to paid in capital B, F | - | - | - | - | - |
Net asset value, end of period | $ 8.65 | $ 8.98 | $ 7.41 | $ 7.04 | $ 8.24 |
Total Return A | (1.41)% | 25.64% | 9.22% | (11.83)% | 8.05% |
Ratios to Average Net Assets C, E | | | | | |
Expenses before reductions | 1.05% | 1.07% | 1.10% | .98% | .98% |
Expenses net of fee waivers, if any | 1.05% | 1.07% | 1.10% | .98% | .98% |
Expenses net of all reductions | 1.04% | 1.04% | 1.07% | .96% | .97% |
Net investment income (loss) | 3.71% J | 2.39% | 3.18% | 3.17% | 2.34% |
Supplemental Data | | | | | |
Net assets, end of period (000 omitted) | $ 1,310 | $ 239 | $ 372 | $ 473 | $ 519 |
Portfolio turnover rate D | 69% | 79% | 74% | 83% | 43% |
A Total returns would have been lower if certain expenses had not been reduced during the applicable periods shown.
B Calculated based on average shares outstanding during the period.
C Fees and expenses of any underlying Fidelity Central Funds are not included in the Fund's expense ratio. The Fund indirectly bears its proportionate share of the expenses of any underlying Fidelity Central Funds.
D Amount does not include the portfolio activity of any underlying Fidelity Central Funds.
E Expense ratios reflect operating expenses of the class. Expenses before reductions do not reflect amounts reimbursed by the investment adviser or reductions from brokerage service arrangements or reductions from other expense offset arrangements and do not represent the amount paid by the class during periods when reimbursements or reductions occur. Expenses net of fee waivers reflect expenses after reimbursement by the investment adviser but prior to reductions from brokerage service arrangements or other expense offset arrangements. Expenses net of all reductions represent the net expenses paid by the class.
F Amount represents less than $.01 per share.
G Total distributions of $.14 per share is comprised of distributions from net investment income of $.137 and distributions from net realized gain of $.005 per share.
H Total distributions of $.26 per share is comprised of distributions from net investment income of $.221 and distributions from net realized gain of $.034 per share.
I Total distributions of $.21 per share is comprised of distributions from net investment income of $.191 and distributions from net realized gain of $.014 per share.
J Investment income per share reflects a large, non-recurring dividend which amounted to $.14 per share. Excluding this non-recurring dividend, the ratio of net investment income (loss) to average net assets would have been 2.18%.
See accompanying notes which are an integral part of the financial statements.
Annual Report
Notes to Financial Statements
For the period ended October 31, 2014
1. Organization.
Fidelity International Value Fund (the Fund) is a fund of Fidelity Investment Trust (the Trust) and is authorized to issue an unlimited number of shares. The Trust is registered under the Investment Company Act of 1940, as amended (the 1940 Act), as an open-end management investment company organized as a Massachusetts business trust. The Fund offers Class A, Class T, Class C, International Value and Institutional Class shares, each of which, along with Class B shares, has equal rights as to assets and voting privileges. Class B shares are closed to new accounts and additional purchases, except for exchanges and reinvestments. Each class has exclusive voting rights with respect to matters that affect that class. Class B shares will automatically convert to Class A shares after a holding period of seven years from the initial date of purchase.
2. Investments in Fidelity Central Funds.
The Fund invests in Fidelity Central Funds, which are open-end investment companies generally available only to other investment companies and accounts managed by the investment adviser and its affiliates. The Fund's Schedule of Investments lists each of the Fidelity Central Funds held as of period end, if any, as an investment of the Fund, but does not include the underlying holdings of each Fidelity Central Fund. As an Investing Fund, the Fund indirectly bears its proportionate share of the expenses of the underlying Fidelity Central Funds.
The Money Market Central Funds seek preservation of capital and current income and are managed by Fidelity Investments Money Management, Inc. (FIMM), an affiliate of the investment adviser. Annualized expenses of the Money Market Central Funds as of their most recent shareholder report date are less than .01%.
A complete unaudited list of holdings for each Fidelity Central Fund is available upon request or at the Securities and Exchange Commission (the SEC) website at www.sec.gov. In addition, the financial statements of the Fidelity Central Funds, which are not covered by the Fund's Report of Independent Registered Public Accounting Firm, are available on the SEC website or upon request.
3. Significant Accounting Policies.
The financial statements have been prepared in conformity with accounting principles generally accepted in the United States of America (GAAP), which require management to make certain estimates and assumptions at the date of the financial statements. Actual results could differ from those estimates. Subsequent events, if any, through the date that the financial statements were issued have been evaluated in the preparation of
Annual Report
Notes to Financial Statements - continued
3. Significant Accounting Policies - continued
the financial statements. The following summarizes the significant accounting policies of the Fund:
Investment Valuation. Investments are valued as of 4:00 p.m. Eastern time on the last calendar day of the period. In accordance with valuation policies and procedures approved by the Board of Trustees (the Board), the Fund attempts to obtain prices from one or more third party pricing vendors or brokers to value its investments. When current market prices, quotations or currency exchange rates are not readily available or reliable, investments will be fair valued in good faith by the Fidelity Management & Research Company (FMR) Fair Value Committee (the Committee), in accordance with procedures adopted by the Board. Factors used in determining fair value vary by investment type and may include market or investment specific events. The frequency with which these procedures are used cannot be predicted and they may be utilized to a significant extent. The Committee oversees the Fund's valuation policies and procedures and is responsible for approving and reporting to the Board all fair value determinations.
The Fund categorizes the inputs to valuation techniques used to value its investments into a disclosure hierarchy consisting of three levels as shown below:
Level 1 - quoted prices in active markets for identical investments
Level 2 - other significant observable inputs (including quoted prices for similar investments, interest rates, prepayment speeds, etc.)
Level 3 - unobservable inputs (including the Fund's own assumptions based on the best information available)
Valuation techniques used to value the Fund's investments by major category are as follows:
Equity securities, including restricted securities, for which market quotations are readily available, are valued at the last reported sale price or official closing price as reported by a third party pricing vendor on the primary market or exchange on which they are traded and are categorized as Level 1 in the hierarchy. In the event there were no sales during the day or closing prices are not available, securities are valued at the last quoted bid price or may be valued using the last available price and are generally categorized as Level 2 in the hierarchy. For foreign equity securities, when market or security specific events arise, comparisons to the valuation of American Depositary Receipts (ADRs), futures contracts, Exchange-Traded Funds (ETFs) and certain indexes as well as quoted prices for similar securities may be used and would be categorized as Level 2 in the hierarchy. Utilizing these techniques may result in transfers between Level 1 and Level 2. For equity securities, including restricted securities, where observable inputs are
Annual Report
3. Significant Accounting Policies - continued
Investment Valuation - continued
limited, assumptions about market activity and risk are used and these securities may be categorized as Level 3 in the hierarchy.
The U.S. dollar value of foreign currency contracts is determined using currency exchange rates supplied by a pricing service and are categorized as Level 2 in the hierarchy. Investments in open-end mutual funds, including the Fidelity Central Funds, are valued at their closing net asset value (NAV) each business day and are categorized as Level 1 in the hierarchy.
Changes in valuation techniques may result in transfers in or out of an assigned level within the disclosure hierarchy. The aggregate value of investments by input level, as of October 31, 2014, including information on transfers between Levels 1 and 2, is included at the end of the Fund's Schedule of Investments.
Foreign Currency. The Fund may use foreign currency contracts to facilitate transactions in foreign-denominated securities. Gains and losses from these transactions may arise from changes in the value of the foreign currency or if the counterparties do not perform under the contracts' terms.
Foreign-denominated assets, including investment securities, and liabilities are translated into U.S. dollars at the exchange rates at period end. Purchases and sales of investment securities, income and dividends received and expenses denominated in foreign currencies are translated into U.S. dollars at the exchange rate in effect on the transaction date.
The effects of exchange rate fluctuations on investments are included with the net realized and unrealized gain (loss) on investment securities. Other foreign currency transactions resulting in realized and unrealized gain (loss) are disclosed separately.
Investment Transactions and Income. For financial reporting purposes, the Fund's investment holdings and NAV include trades executed through the end of the last business day of the period. The NAV per share for processing shareholder transactions is calculated as of the close of business of the New York Stock Exchange (NYSE), normally 4:00 p.m. Eastern time and includes trades executed through the end of the prior business day. Gains and losses on securities sold are determined on the basis of identified cost and may include proceeds received from litigation. Dividend income is recorded on the ex-dividend date, except for certain dividends from foreign securities where the ex-dividend date may have passed, which are recorded as soon as the Fund is informed of the ex-dividend date. Non-cash dividends included in dividend income, if any, are recorded at the fair market value of the securities received. Income and capital gain distributions from Fidelity Central Funds, if any, are recorded on the ex-dividend date.
Annual Report
Notes to Financial Statements - continued
3. Significant Accounting Policies - continued
Investment Transactions and Income - continued
Large, non-recurring dividends recognized by the Fund are presented separately on the Statement of Operations as "Special Dividends" and the impact of these dividends is presented in the Financial Highlights. Investment income is recorded net of foreign taxes withheld where recovery of such taxes is uncertain.
Class Allocations and Expenses. Investment income, realized and unrealized capital gains and losses, common expenses of the Fund, and certain fund-level expense reductions, if any, are allocated daily on a pro-rata basis to each class based on the relative net assets of each class to the total net assets of the Fund. Each class differs with respect to transfer agent and distribution and service plan fees incurred. Certain expense reductions may also differ by class. For the reporting period, the allocated portion of income and expenses to each class as a percent of its average net assets may vary due to the timing of recording these transactions in relation to fluctuating net assets of the classes. Expenses directly attributable to a fund are charged to that fund. Expenses attributable to more than one fund are allocated among the respective funds on the basis of relative net assets or other appropriate methods. Expense estimates are accrued in the period to which they relate and adjustments are made when actual amounts are known.
Income Tax Information and Distributions to Shareholders. Each year, the Fund intends to qualify as a regulated investment company under Subchapter M of the Internal Revenue Code, including distributing substantially all of its taxable income and realized gains. As a result, no provision for U.S. Federal income taxes is required. As of October 31, 2014, the Fund did not have any unrecognized tax benefits in the financial statements; nor is the Fund aware of any tax positions for which it is reasonably possible that the total amounts of unrecognized tax benefits will significantly change in the next twelve months. The Fund files a U.S. federal tax return, in addition to state and local tax returns as required. The Fund's federal income tax returns are subject to examination by the Internal Revenue Service (IRS) for a period of three fiscal years after they are filed. State and local tax returns may be subject to examination for an additional fiscal year depending on the jurisdiction. Foreign taxes are provided for based on the Fund's understanding of the tax rules and rates that exist in the foreign markets in which it invests.
Distributions are declared and recorded on the ex-dividend date. Income dividends and capital gain distributions are declared separately for each class. Income and capital gain distributions are determined in accordance with income tax regulations, which may differ from GAAP.
Capital accounts within the financial statements are adjusted for permanent book-tax differences. These adjustments have no impact on net assets or the results of operations.
Annual Report
3. Significant Accounting Policies - continued
Income Tax Information and Distributions to Shareholders - continued
Capital accounts are not adjusted for temporary book-tax differences which will reverse in a subsequent period.
Book-tax differences are primarily due to foreign currency transactions, passive foreign investment companies (PFIC), capital loss carryforwards and losses deferred due to wash sales.
The federal tax cost of investment securities and unrealized appreciation (depreciation) as of period end were as follows:
Gross unrealized appreciation | $ 15,866,348 |
Gross unrealized depreciation | (15,294,421) |
Net unrealized appreciation (depreciation) on securities | $ 571,927 |
| |
Tax Cost | $ 210,048,200 |
The tax-based components of distributable earnings as of period end were as follows:
Undistributed ordinary income | $ 7,055,942 |
Capital loss carryforward | $ (102,980,501) |
Net unrealized appreciation (depreciation) on securities and other investments | $ 546,172 |
Capital loss carryforwards are only available to offset future capital gains of the Fund to the extent provided by regulations and may be limited. Under the Regulated Investment Company Modernization Act of 2010 (the Act), the Fund is permitted to carry forward capital losses incurred in taxable years beginning after December 22, 2010 for an unlimited period and such capital losses are required to be used prior to any losses that expire. The capital loss carryforward information presented below, including any applicable limitation, is estimated as of fiscal period end and is subject to adjustment.
Fiscal year of expiration | |
2016 | $ (2,663,413) |
2017 | (65,376,972) |
2018 | (3,571,319) |
2019 | (31,368,797) |
Total capital loss carryforward | $ (102,980,501) |
The tax character of distributions paid was as follows:
| October 31, 2014 | October 31, 2013 |
Ordinary Income | $ 4,461,505 | $ 4,907,552 |
Annual Report
Notes to Financial Statements - continued
3. Significant Accounting Policies - continued
Short-Term Trading (Redemption) Fees. Shares held by investors in the Fund less than 30 days may have been subject to a redemption fee equal to 1.00% of the NAV of shares redeemed. All redemption fees, which reduce the proceeds of the shareholder redemption, are retained by the Fund and accounted for as an addition to paid in capital.
New Accounting Pronouncement. In June 2014, the Financial Accounting Standards Board issued Accounting Standard Update No. 2014-11, Repurchase-to-Maturity Transactions, Repurchase Financings, and Disclosures. The Update amends the accounting for certain repurchase agreements and expands disclosure requirements for reverse repurchase agreements, securities lending and other similar transactions. The disclosure requirements are effective for annual and interim reporting periods beginning after December 15, 2014. Management is currently evaluating the impact of the Update on the Fund's financial statements and related disclosures.
4. Purchases and Sales of Investments.
Purchases and sales of securities, other than short-term securities, aggregated $163,988,914 and $139,217,160, respectively.
5. Fees and Other Transactions with Affiliates.
Management Fee. Fidelity Management & Research Company (the investment adviser) and its affiliates provide the Fund with investment management related services for which the Fund pays a monthly management fee. The management fee is the sum of an individual fund fee rate that is based on an annual rate of .45% of the Fund's average net assets and an annualized group fee rate that averaged .25% during the period. The group fee rate is based upon the average net assets of all the mutual funds advised by the investment adviser, including any mutual funds previously advised by the investment adviser that are currently advised by Fidelity SelectCo, LLC, an affiliate of the investment adviser. The group fee rate decreases as assets under management increase and increases as assets under management decrease. In addition, the management fee is subject to a performance adjustment (up to a maximum of ± .20% of the Fund's average net assets over a 36 month performance period). The upward or downward adjustment to the management fee is based on the relative investment performance of International Value as compared to its benchmark index, the MSCI EAFE Value Index, over the same 36 month performance period. For the reporting period, the total annual management fee rate, including the performance adjustment, was .60% of the Fund's average net assets. The performance adjustment included in the management fee rate may be higher or lower than the maximum performance adjustment rate due to the difference between the average net assets for the reporting and performance periods.
Annual Report
5. Fees and Other Transactions with Affiliates - continued
Distribution and Service Plan Fees. In accordance with Rule 12b-1 of the 1940 Act, the Fund has adopted separate Distribution and Service Plans for each class of shares. Certain classes pay Fidelity Distributors Corporation (FDC), an affiliate of the investment adviser, separate Distribution and Service Fees, each of which is based on an annual percentage of each class' average net assets. In addition, FDC may pay financial intermediaries for selling shares of the Fund and providing shareholder support services.
For the period, the Distribution and Service Fee rates, total fees and amounts retained by FDC were as follows:
| Distribution
Fee | Service
Fee | Total Fees | Retained
by FDC |
Class A | -% | .25% | $ 16,198 | $ 317 |
Class T | .25% | .25% | 19,035 | - |
Class B | .75% | .25% | 5,831 | 4,374 |
Class C | .75% | .25% | 35,515 | 6,658 |
| | | $ 76,579 | $ 11,349 |
Sales Load. FDC may receive a front-end sales charge of up to 5.75% for selling Class A shares and 3.50% for selling Class T shares, some of which is paid to financial intermediaries for selling shares of the Fund. Depending on the holding period, FDC may receive contingent deferred sales charges levied on Class A, Class T, Class B, and Class C redemptions. The deferred sales charges range from 5.00% to 1.00% for Class B shares, 1.00% for Class C shares, 1.00% for certain purchases of Class A shares and .25% for certain purchases of Class T shares.
For the period, sales charge amounts retained by FDC were as follows:
| Retained
by FDC |
Class A | $ 6,050 |
Class T | 936 |
Class B* | 1,390 |
Class C* | 794 |
| $ 9,170 |
* When Class B and Class C shares are initially sold, FDC pays commissions from its own resources to financial intermediaries through which the sales are made.
Transfer Agent Fees. Fidelity Investments Institutional Operations Company, Inc., (FIIOC), an affiliate of the investment adviser, is the transfer, dividend disbursing and shareholder servicing agent for each class of the Fund. FIIOC receives account fees and asset-based fees that vary according to the account size and type of account of the shareholders of the respective classes of the Fund. FIIOC pays for typesetting, printing and mailing of shareholder reports, except proxy statements.
Annual Report
Notes to Financial Statements - continued
5. Fees and Other Transactions with Affiliates - continued
Transfer Agent Fees - continued
For the period, transfer agent fees for each class were as follows:
| Amount | % of
Class-Level Average
Net Assets |
Class A | $ 19,698 | .30 |
Class T | 12,131 | .32 |
Class B | 1,781 | .31 |
Class C | 10,841 | .30 |
International Value | 356,047 | .19 |
Institutional Class | 2,019 | .28 |
| $ 402,517 | |
Accounting and Security Lending Fees. Fidelity Service Company, Inc. (FSC), an affiliate of the investment adviser, maintains the Fund's accounting records. The accounting fee is based on the level of average net assets for each month. Under a separate contract, FSC administers the security lending program. The security lending fee is based on the number and duration of lending transactions.
Brokerage Commissions. The Fund placed a portion of its portfolio transactions with brokerage firms which are affiliates of the investment adviser. Brokerage commissions are included in net realized gain (loss) and change in net unrealized appreciation (depreciation) in the Statement of Operations. The commissions paid to these affiliated firms were $237 for the period.
Other. During the period, the investment adviser reimbursed the Fund for certain losses in the amount of $1,417.
6. Committed Line of Credit.
The Fund participates with other funds managed by the investment adviser or an affiliate in a $4.25 billion credit facility (the "line of credit") to be utilized for temporary or emergency purposes to fund shareholder redemptions or for other short-term liquidity purposes. The Fund has agreed to pay commitment fees on its pro-rata portion of the line of credit, which amounted to $328 and is reflected in Miscellaneous expenses on the Statement of Operations. During the period, the Fund did not borrow on this line of credit.
7. Security Lending.
The Fund lends portfolio securities through a lending agent from time to time in order to earn additional income. For equity securities, a lending agent is used and may loan securities to certain qualified borrowers, including Fidelity Capital Markets (FCM), a broker-dealer affiliated with the Fund. On the settlement date of the loan, the Fund receives collateral (in the form of U.S. Treasury obligations, letters of credit and/or cash)
Annual Report
7. Security Lending - continued
against the loaned securities and maintains collateral in an amount not less than 100% of the market value of the loaned securities during the period of the loan. The market value of the loaned securities is determined at the close of business of the Fund and any additional required collateral is delivered to the Fund on the next business day. If the borrower defaults on its obligation to return the securities loaned because of insolvency or other reasons, the Fund may apply collateral received from the borrower against the obligation. The Fund may experience delays and costs in recovering the securities loaned. Any cash collateral received is invested in the Fidelity Securities Lending Cash Central Fund. The value of loaned securities and cash collateral at period end are disclosed on the Fund's Statement of Assets and Liabilities. Security lending income represents the income earned on investing cash collateral, less rebates paid to borrowers and any lending agent fees associated with the loan, plus any premium payments received for lending certain types of securities. Security lending income is presented in the Statement of Operations as a component of income from Fidelity Central Funds. Total security lending income during the period amounted to $161,924. During the period, there were no securities loaned to FCM.
8. Expense Reductions.
Commissions paid to certain brokers with whom the investment adviser, or its affiliates, places trades on behalf of the Fund include an amount in addition to trade execution, which may be rebated back to the Fund to offset certain expenses. This amount totaled $3,923 for the period. In addition, through arrangements with the Fund's custodian, credits realized as a result of uninvested cash balances were used to reduce the Fund's expenses. During the period, these credits reduced the Fund's custody expenses by $5.
In addition, the investment adviser reimbursed a portion of the Fund's operating expenses during the period in the amount of $193.
9. Distributions to Shareholders.
Distributions to shareholders of each class were as follows:
Years ended October 31, | 2014 | 2013 |
From net investment income | | |
Class A | $ 117,558 | $ 121,166 |
Class T | 63,542 | 67,016 |
Class B | 6,919 | 11,860 |
Class C | 40,539 | 47,865 |
International Value | 3,926,459 | 3,862,005 |
Institutional Class | 5,296 | 10,688 |
Total | $ 4,160,313 | $ 4,120,600 |
Annual Report
Notes to Financial Statements - continued
9. Distributions to Shareholders - continued
Years ended October 31, | 2014 | 2013 |
From net realized gain | | |
Class A | $ 9,681 | $ 25,318 |
Class T | 5,931 | 15,214 |
Class B | 1,042 | 3,861 |
Class C | 5,113 | 13,226 |
International Value | 279,037 | 727,373 |
Institutional Class | 388 | 1,960 |
Total | $ 301,192 | $ 786,952 |
10. Share Transactions.
Share transactions for each class were as follows and may contain automatic conversions between classes or exchanges between funds:
| Shares | Shares | Dollars | Dollars |
Years ended October 31, | 2014 | 2013 | 2014 | 2013 |
Class A | | | | |
Shares sold | 271,659 | 221,312 | $ 2,416,438 | $ 1,773,149 |
Reinvestment of distributions | 12,904 | 17,344 | 112,525 | 128,001 |
Shares redeemed | (245,285) | (155,517) | (2,196,440) | (1,235,132) |
Net increase (decrease) | 39,278 | 83,139 | $ 332,523 | $ 666,018 |
Class T | | | | |
Shares sold | 79,778 | 91,084 | $ 709,484 | $ 741,140 |
Reinvestment of distributions | 7,900 | 11,018 | 68,891 | 81,425 |
Shares redeemed | (88,989) | (46,826) | (796,094) | (371,734) |
Net increase (decrease) | (1,311) | 55,276 | $ (17,719) | $ 450,831 |
Class B | | | | |
Shares sold | 1,662 | 6,334 | $ 15,295 | $ 51,789 |
Reinvestment of distributions | 756 | 1,746 | 6,661 | 13,011 |
Shares redeemed | (30,069) | (26,098) | (270,154) | (212,223) |
Net increase (decrease) | (27,651) | (18,018) | $ (248,198) | $ (147,423) |
Class C | | | | |
Shares sold | 107,427 | 93,011 | $ 961,012 | $ 748,735 |
Reinvestment of distributions | 4,784 | 7,487 | 41,813 | 55,475 |
Shares redeemed | (49,408) | (43,711) | (437,003) | (352,531) |
Net increase (decrease) | 62,803 | 56,787 | $ 565,822 | $ 451,679 |
International Value | | | | |
Shares sold | 5,177,049 | 6,308,136 | $ 46,484,243 | $ 51,241,221 |
Reinvestment of distributions | 470,965 | 602,705 | 4,097,400 | 4,441,937 |
Shares redeemed | (3,570,903) | (4,113,021) | (31,830,840) | (32,981,230) |
Net increase (decrease) | 2,077,111 | 2,797,820 | $ 18,750,803 | $ 22,701,928 |
Annual Report
10. Share Transactions - continued
| Shares | Shares | Dollars | Dollars |
Years ended October 31, | 2014 | 2013 | 2014 | 2013 |
Institutional Class | | | | |
Shares sold | 140,760 | 6,984 | $ 1,271,347 | $ 56,532 |
Reinvestment of distributions | 394 | 1,136 | 3,438 | 8,383 |
Shares redeemed | (16,367) | (31,601) | (146,887) | (249,818) |
Net increase (decrease) | 124,787 | (23,481) | $ 1,127,898 | $ (184,903) |
11. Other.
The Fund's organizational documents provide former and current trustees and officers with a limited indemnification against liabilities arising in connection with the performance of their duties to the Fund. In the normal course of business, the Fund may also enter into contracts that provide general indemnifications. The Fund's maximum exposure under these arrangements is unknown as this would be dependent on future claims that may be made against the Fund. The risk of material loss from such claims is considered remote.
At the end of the period, Strategic Advisers International II Fund and VIP FundsManager 60% Portfolio were the owners of record of approximately 35% and 11%, respectively, of the total outstanding shares of the Fund.
Mutual funds managed by the investment adviser or its affiliates were the owners of record, in the aggregate, of approximately 52% of the total outstanding shares of the Fund.
Annual Report
To the Trustees of Fidelity Investment Trust and Shareholders of Fidelity International Value Fund:
We have audited the accompanying statement of assets and liabilities of Fidelity International Value Fund (the Fund), a fund of Fidelity Investment Trust, including the schedule of investments, as of October 31, 2014, and the related statement of operations for the year then ended, the statement of changes in net assets for each of the two years in the period then ended, and the financial highlights for each of the five years in the period then ended. These financial statements and financial highlights are the responsibility of the Fund's management. Our responsibility is to express an opinion on these financial statements and financial highlights based on our audits.
We conducted our audits in accordance with the standards of the Public Company Accounting Oversight Board (United States). Those standards require that we plan and perform the audit to obtain reasonable assurance about whether the financial statements and financial highlights are free of material misstatement. The Fund is not required to have, nor were we engaged to perform, an audit of its internal control over financial reporting. Our audits included consideration of internal control over financial reporting as a basis for designing audit procedures that are appropriate in the circumstances, but not for the purpose of expressing an opinion on the effectiveness of the Fund's internal control over financial reporting. Accordingly, we express no such opinion. An audit also includes examining, on a test basis, evidence supporting the amounts and disclosures in the financial statements, assessing the accounting principles used and significant estimates made by management, as well as evaluating the overall financial statement presentation. Our procedures included confirmation of securities owned as of October 31, 2014, by correspondence with the custodians and brokers; where replies were not received from brokers, we performed other auditing procedures. We believe that our audits provide a reasonable basis for our opinion.
In our opinion, the financial statements and financial highlights referred to above present fairly, in all material respects, the financial position of Fidelity International Value Fund as of October 31, 2014, the results of its operations for the year then ended, the changes in its net assets for each of the two years in the period then ended, and the financial highlights for each of the five years in the period then ended, in conformity with accounting principles generally accepted in the United States of America.
DELOITTE & TOUCHE LLP
Boston, Massachusetts
December 17, 2014
Annual Report
The Trustees, Member of the Advisory Board, and officers of the trust and fund, as applicable, are listed below. The Board of Trustees governs the fund and is responsible for protecting the interests of shareholders. The Trustees are experienced executives who meet periodically throughout the year to oversee the fund's activities, review contractual arrangements with companies that provide services to the fund, oversee management of the risks associated with such activities and contractual arrangements, and review the fund's performance. Except for James C. Curvey, each of the Trustees oversees 174 funds. Mr. Curvey oversees 407 funds.
The Trustees hold office without limit in time except that (a) any Trustee may resign; (b) any Trustee may be removed by written instrument, signed by at least two-thirds of the number of Trustees prior to such removal; (c) any Trustee who requests to be retired or who has become incapacitated by illness or injury may be retired by written instrument signed by a majority of the other Trustees; and (d) any Trustee may be removed at any special meeting of shareholders by a two-thirds vote of the outstanding voting securities of the trust. Each Trustee who is not an interested person (as defined in the 1940 Act) of the trust and the fund (Independent Trustee), shall retire not later than the last day of the calendar year in which his or her 75th birthday occurs. The Independent Trustees may waive this mandatory retirement age policy with respect to individual Trustees. The officers and Advisory Board Member hold office without limit in time, except that any officer and Advisory Board Member may resign or may be removed by a vote of a majority of the Trustees at any regular meeting or any special meeting of the Trustees. Except as indicated, each individual has held the office shown or other offices in the same company for the past five years.
Experience, Skills, Attributes, and Qualifications of the Fund's Trustees. The Governance and Nominating Committee has adopted a statement of policy that describes the experience, qualifications, attributes, and skills that are necessary and desirable for potential Independent Trustee candidates (Statement of Policy). The Board believes that each Trustee satisfied at the time he or she was initially elected or appointed a Trustee, and continues to satisfy, the standards contemplated by the Statement of Policy. The Governance and Nominating Committee also engages professional search firms to help identify potential Independent Trustee candidates who have the experience, qualifications, attributes, and skills consistent with the Statement of Policy. From time to time, additional criteria based on the composition and skills of the current Independent Trustees, as well as experience or skills that may be appropriate in light of future changes to board composition, business conditions, and regulatory or other developments, have also been considered by the professional search firms and the Governance and Nominating Committee. In addition, the Board takes into account the Trustees' commitment and participation in Board and committee meetings, as well as their leadership of standing and ad hoc committees throughout their tenure.
In determining that a particular Trustee was and continues to be qualified to serve as a Trustee, the Board has considered a variety of criteria, none of which, in isolation, was controlling. The Board believes that, collectively, the Trustees have balanced and diverse experience, qualifications, attributes, and skills, which allow the Board to operate effectively in governing the fund and protecting the interests of shareholders. Information about the specific experience, skills, attributes, and qualifications of each Trustee, which in each case led to the Board's conclusion that the Trustee should serve (or continue to serve) as a trustee of the fund, is provided below.
Annual Report
Trustees and Officers - continued
Board Structure and Oversight Function. James C. Curvey is an interested person (as defined in the 1940 Act) and currently serves as Chairman. The Trustees have determined that an interested Chairman is appropriate and benefits shareholders because an interested Chairman has a personal and professional stake in the quality and continuity of services provided to the fund. Independent Trustees exercise their informed business judgment to appoint an individual of their choosing to serve as Chairman, regardless of whether the Trustee happens to be independent or a member of management. The Independent Trustees have determined that they can act independently and effectively without having an Independent Trustee serve as Chairman and that a key structural component for assuring that they are in a position to do so is for the Independent Trustees to constitute a substantial majority for the Board. The Independent Trustees also regularly meet in executive session. Ned C. Lautenbach serves as Chairman of the Independent Trustees and as such (i) acts as a liaison between the Independent Trustees and management with respect to matters important to the Independent Trustees and (ii) with management prepares agendas for Board meetings.
Fidelity funds are overseen by different Boards of Trustees. The fund's Board oversees Fidelity's equity and high income funds and another Board oversees Fidelity's investment-grade bond, money market, and asset allocation funds. The asset allocation funds may invest in Fidelity funds overseen by the fund's Board. The use of separate Boards, each with its own committee structure, allows the Trustees of each group of Fidelity funds to focus on the unique issues of the funds they oversee, including common research, investment, and operational issues. On occasion, the separate Boards establish joint committees to address issues of overlapping consequences for the Fidelity funds overseen by each Board.
The Trustees operate using a system of committees to facilitate the timely and efficient consideration of all matters of importance to the Trustees, the fund, and fund shareholders and to facilitate compliance with legal and regulatory requirements and oversight of the fund's activities and associated risks. The Board, acting through its committees, has charged FMR and its affiliates with (i) identifying events or circumstances the occurrence of which could have demonstrably adverse effects on the fund's business and/or reputation; (ii) implementing processes and controls to lessen the possibility that such events or circumstances occur or to mitigate the effects of such events or circumstances if they do occur; and (iii) creating and maintaining a system designed to evaluate continuously business and market conditions in order to facilitate the identification and implementation processes described in (i) and (ii) above. Because the day-to-day operations and activities of the fund are carried out by or through FMR, its affiliates and other service providers, the fund's exposure to risks is mitigated but not eliminated by the processes overseen by the Trustees. While each of the Board's committees has responsibility for overseeing different aspects of the fund's activities, oversight is exercised primarily through the Operations, Audit, and Compliance Committees. In addition, the Independent Trustees have worked with FMR to enhance the Board's oversight of investment and financial risks, legal and regulatory risks, technology risks, and operational risks, including the development of additional risk reporting to the Board. For example, a working group comprised of Independent Trustees and FMR has worked and continues to work to review the Fidelity funds' valuation-related activities, reporting and risk management. Appropriate personnel, including but not limited to the fund's Chief Compliance Officer (CCO), FMR's internal auditor, the independent accountants, the fund's Treasurer and portfolio management personnel, make periodic reports to the Board's committees, as appropriate, including an annual review of FMR's risk management program for the Fidelity funds. The responsibilities of each standing committee, including their oversight responsibilities, are described further under "Standing Committees of the Fund's Trustees."
Annual Report
The fund's Statement of Additional Information (SAI) includes more information about the Trustees. To request a free copy, call Fidelity at 1-800-544-8544.
Interested Trustees*:
Correspondence intended for each Trustee who is an interested person may be sent to Fidelity Investments, 245 Summer Street, Boston, Massachusetts 02210.
Name, Year of Birth; Principal Occupations and Other Relevant Experience+ |
James C. Curvey (1935) |
Year of Election or Appointment: 2007 Trustee Chairman of the Board of Trustees |
| Mr. Curvey also serves as Trustee of other Fidelity funds. Mr. Curvey is a Director of Fidelity Research & Analysis Co. (2009-present), and Vice Chairman (2007-present) and Director of FMR LLC. In addition, Mr. Curvey serves as an Overseer for the Boston Symphony Orchestra and a member of the board of Artis-Naples, Naples, Florida, and as a Trustee for Brewster Academy, Wolfeboro, New Hampshire. Previously, Mr. Curvey served as a Director of Fidelity Investments Money Management, Inc. (2009-2014), a Director of FMR (2007-2014), and a Director of FMR Co., Inc. (2007-2014). |
Charles S. Morrison (1960) |
Year of Election or Appointment: 2014 Trustee |
| Mr. Morrison also serves as Trustee of other funds. He serves as a Director of Fidelity Investments Money Management, Inc. (FIMM) (2014-present), Director of Fidelity SelectCo, LLC (2014-present), President, Asset Management (2014-present), and is an employee of Fidelity Investments. Previously, Mr. Morrison served as Vice President of Fidelity's Fixed Income and Asset Allocation Funds (2012-2014), President, Fixed Income (2011-2014), Vice President of Fidelity's Money Market Funds (2005-2009), President, Money Market Group Leader of FMR (2009), and Senior Vice President, Money Market Group of FMR (2004-2009). Mr. Morrison also served as Vice President of Fidelity's Bond Funds (2002-2005), certain Balanced Funds (2002-2005), and certain Asset Allocation Funds (2002-2007), and as Senior Vice President (2002-2005) of Fidelity's Bond Division. |
* Trustees have been determined to be "Interested Trustees" by virtue of, among other things, their affiliation with the trust or various entities under common control with FMR.
+ The information above includes each Trustee's principal occupation during the last five years and other information relating to the experience, attributes, and skills relevant to each Trustee's qualifications to serve as a Trustee, which led to the conclusion that each Trustee should serve as a Trustee for the fund.
Annual Report
Independent Trustees:
Correspondence intended for each Independent Trustee (that is, the Trustees other than the Interested Trustees) may be sent to Fidelity Investments, P.O. Box 55235, Boston, Massachusetts 02205-5235.
Name, Year of Birth; Principal Occupations and Other Relevant Experience+ |
Dennis J. Dirks (1948) |
Year of Election or Appointment: 2005 Trustee |
| Mr. Dirks also serves as Trustee of other Fidelity funds. Prior to his retirement in May 2003, Mr. Dirks was Chief Operating Officer and a member of the Board of The Depository Trust & Clearing Corporation (DTCC). He also served as President, Chief Operating Officer, and Board member of The Depository Trust Company (DTC) and President and Board member of the National Securities Clearing Corporation (NSCC). In addition, Mr. Dirks served as Chief Executive Officer and Board member of the Government Securities Clearing Corporation, Chief Executive Officer and Board member of the Mortgage-Backed Securities Clearing Corporation, as a Trustee and a member of the Finance Committee of Manhattan College (2005-2008), and as a Trustee and a member of the Finance Committee of AHRC of Nassau County (2006-2008). Mr. Dirks is a member of the Independent Directors Council (IDC) Governing Council (2010-present) and Board of Directors for The Brookville Center for Children's Services, Inc. (2009-present). |
Alan J. Lacy (1953) |
Year of Election or Appointment: 2008 Trustee |
| Mr. Lacy also serves as Trustee of other Fidelity funds. Mr. Lacy serves as Senior Adviser (2007-present) of Oak Hill Capital Partners, L.P. (private equity). Mr. Lacy also served as Chief Executive Officer (2000-2005) and Vice Chairman (2005-2006) of Sears Holdings Corporation and Sears, Roebuck and Co. (retail). In addition, Mr. Lacy serves as a member of the Board of Directors of Dave & Buster's Entertainment, Inc. (restaurant and entertainment complexes, 2010-present), Earth Fare, Inc. (retail grocery, 2012-present), The Hillman Companies, Inc. (hardware wholesalers, 2010-present), and Bristol-Myers Squibb Company (global pharmaceuticals, 2008-present). Mr. Lacy is a member of the Board of Trustees of The National Parks Conservation Association (2006-present). Previously, Mr. Lacy served as Chairman of the Board of Trustees of the National Parks Conservation Association (2008-2011) and as a member of the Board of Directors for the Western Union Company (global money transfer, 2006-2011). |
Ned C. Lautenbach (1944) |
Year of Election or Appointment: 2000 Trustee Chairman of the Independent Trustees |
| Mr. Lautenbach also serves as Trustee of other Fidelity funds. Mr. Lautenbach currently serves as the Lead Director of the Eaton Corporation Board of Directors (diversified industrial, 1997-present). Mr. Lautenbach is Chairman of the Board of Directors of the Philharmonic Center for the Arts in Naples, Florida (2012-present) and a member of the Council on Foreign Relations (1994-present). Previously, Mr. Lautenbach was a Partner/Advisory Partner at Clayton, Dubilier & Rice, LLC (private equity investment, 1998-2010), as well as a Director of Sony Corporation (2006-2007). |
Joseph Mauriello (1944) |
Year of Election or Appointment: 2008 Trustee |
| Mr. Mauriello also serves as Trustee of other Fidelity funds. Prior to his retirement in January 2006, Mr. Mauriello served in numerous senior management positions including Deputy Chairman and Chief Operating Officer (2004-2005), and Vice Chairman of Financial Services (2002-2004) of KPMG LLP US (professional services, 1965-2005). Mr. Mauriello currently serves as a member of the Board of Directors of XL Group plc. (global insurance and re-insurance, 2006-present). Previously, Mr. Mauriello served as a Director of the Hamilton Funds of the Bank of New York (2006-2007) and of Arcadia Resources Inc. (health care services and products, 2007-2012). |
Robert W. Selander (1950) |
Year of Election or Appointment: 2011 Trustee |
| Mr. Selander also serves as Trustee of other Fidelity funds. Previously, Mr. Selander served as a Member of the Advisory Board of other Fidelity funds (2011), and Executive Vice Chairman (2010), Chief Executive Officer (2009-2010), and President and Chief Executive Officer (1997-2009) of Mastercard, Inc. |
Cornelia M. Small (1944) |
Year of Election or Appointment: 2005 Trustee |
| Ms. Small also serves as Trustee of other Fidelity funds. Ms. Small is a member of the Board of Directors (2009-present) and Chair of the Investment Committee (2010-present) of the Teagle Foundation. Ms. Small also serves on the Investment Committee of the Berkshire Taconic Community Foundation (2008-present). Previously, Ms. Small served as Chairperson (2002-2008) and a member of the Investment Committee and Chairperson (2008-2012) and a member of the Board of Trustees of Smith College. In addition, Ms. Small served as Chief Investment Officer, Director of Global Equity Investments, and a member of the Board of Directors of Scudder, Stevens & Clark and Scudder Kemper Investments. |
William S. Stavropoulos (1939) |
Year of Election or Appointment: 2001 Trustee Vice Chairman of the Independent Trustees |
| Mr. Stavropoulos also serves as Trustee of other Fidelity funds. Mr. Stavropoulos serves as President and Founder of the Michigan Baseball Foundation, the Great Lakes Loons (2007-present). Mr. Stavropoulos is Chairman Emeritus of the Board of Directors of The Dow Chemical Company, where he previously served in numerous senior management positions, including President, CEO (1995-2000; 2002-2004), Chairman of the Executive Committee (2000-2006), and as a member of the Board of Directors (1990-2006). Currently, Mr. Stavropoulos is Chairman of the Board of Directors of Univar Inc. (global distributor of commodity and specialty chemicals), a Director of Teradata Corporation (data warehousing and technology solutions), and Maersk Inc. (industrial conglomerate), and a member of the Advisory Board for Metalmark Capital LLC (private equity investment, 2005-present). Mr. Stavropoulos is an operating advisor to Clayton, Dubilier & Rice, LLC (private equity investment). In addition, Mr. Stavropoulos is a member of the University of Notre Dame Advisory Council for the College of Science, a Trustee of the Rollin L. Gerstacker Foundation, and a Director of the Naples Philharmonic Center for the Arts. Previously, Mr. Stavropoulos served as a Director of Chemical Financial Corporation (bank holding company, 1993-2012) and Tyco International, Ltd. (multinational manufacturing and services, 2007-2012). |
David M. Thomas (1949) |
Year of Election or Appointment: 2008 Trustee |
| Mr. Thomas also serves as Trustee of other Fidelity funds. Mr. Thomas serves as Non-Executive Chairman of the Board of Directors of Fortune Brands Home and Security (home and security products, 2011-present), and as a member of the Board of Directors of Interpublic Group of Companies, Inc. (marketing communication, 2004-present). Previously, Mr. Thomas served as Executive Chairman (2005-2006) and Chairman and Chief Executive Officer (2000-2005) of IMS Health, Inc. (pharmaceutical and healthcare information solutions), and a Director of Fortune Brands, Inc. (consumer products, 2000-2011). |
+ The information above includes each Trustee's principal occupation during the last five years and other information relating to the experience, attributes, and skills relevant to each Trustee's qualifications to serve as a Trustee, which led to the conclusion that each Trustee should serve as a Trustee for the fund.
Advisory Board Member and Officers:
Correspondence intended for each officer and Peter S. Lynch may be sent to Fidelity Investments, 245 Summer Street, Boston, Massachusetts 02210. Officers appear below in alphabetical order.
Name, Year of Birth; Principal Occupation |
Peter S. Lynch (1944) |
Year of Election or Appointment: 2003 Member of the Advisory Board |
| Mr. Lynch also serves as Member of the Advisory Board of other Fidelity funds. Mr. Lynch is Vice Chairman and a Director of FMR and FMR Co., Inc. In addition, Mr. Lynch serves as a Trustee of Boston College and as the Chairman of the Inner-City Scholarship Fund. Previously, Mr. Lynch served on the Special Olympics International Board of Directors (1997-2006). |
Elizabeth Paige Baumann (1968) |
Year of Election or Appointment: 2012 Anti-Money Laundering (AML) Officer |
| Ms. Baumann also serves as AML Officer of other funds. She is Chief AML Officer of FMR LLC (2012-present) and is an employee of Fidelity Investments. Previously, Ms. Baumann served as Vice President and Deputy Anti-Money Laundering Officer (2007-2012). |
William C. Coffey (1969) |
Year of Election or Appointment: 2009 Assistant Secretary |
| Mr. Coffey also serves as Assistant Secretary of other funds. He is Senior Vice President and Deputy General Counsel of FMR LLC (2010-present), and is an employee of Fidelity Investments. Previously, Mr. Coffey served as Vice President and Associate General Counsel of FMR LLC (2005-2009). |
Timothy M. Cohen (1969) |
Year of Election or Appointment: 2014 Vice President of certain Equity Funds |
| Mr. Cohen also serves as Vice President of other funds. Mr. Cohen serves as a Director and Chief Compliance Officer of Fidelity Management & Research (U.K.) Inc. (2013-present) and is an employee of Fidelity Investments. |
Jonathan Davis (1968) |
Year of Election or Appointment: 2010 Assistant Treasurer |
| Mr. Davis also serves as Assistant Treasurer of other funds. Mr. Davis is an employee of Fidelity Investments. Previously, Mr. Davis served as Vice President and Associate General Counsel of FMR LLC (2003-2010). |
Adrien E. Deberghes (1967) |
Year of Election or Appointment: 2008 Deputy Treasurer |
| Mr. Deberghes also serves as an officer of other funds. He is an employee of Fidelity Investments (2008-present). Prior to joining Fidelity Investments, Mr. Deberghes was Senior Vice President of Mutual Fund Administration at State Street Corporation (2007-2008), Senior Director of Mutual Fund Administration at Investors Bank & Trust (2005-2007), and Director of Finance for Dunkin' Brands (2000-2005). |
Stephanie J. Dorsey (1969) |
Year of Election or Appointment: 2010 Assistant Treasurer |
| Ms. Dorsey also serves as an officer of other funds. She is an employee of Fidelity Investments (2008-present) and has served in other fund officer roles. Prior to joining Fidelity Investments, Ms. Dorsey served as Treasurer (2004-2008) of the JPMorgan Mutual Funds and Vice President (2004-2008) of JPMorgan Chase Bank. |
Howard J. Galligan III (1966) |
Year of Election or Appointment: 2014 Chief Financial Officer |
| Mr. Galligan also serves as Chief Financial Officer of other funds. Mr. Galligan serves as President of Fidelity Pricing and Cash Management Services (FPCMS) (2014-present) and as a Director of Strategic Advisers, Inc. (2008-present). Previously, Mr. Galligan served as Chief Administrative Officer of Asset Management (2011-2014) and Chief Operating Officer and Senior Vice President of Investment Support for Strategic Advisers, Inc. (2003-2011). |
Scott C. Goebel (1968) |
Year of Election or Appointment: 2008 Secretary and Chief Legal Officer (CLO) |
| Mr. Goebel serves as Secretary and CLO of other funds. Mr. Goebel also serves as Secretary of Fidelity SelectCo, LLC (2013-present), Fidelity Investments Money Management, Inc. (FIMM) (2010-present) and Fidelity Research and Analysis Company (FRAC) (2010-present); General Counsel, Secretary, and Senior Vice President of FMR (2008-present) and FMR Co., Inc. (2008-present); Chief Legal Officer of Fidelity Management & Research (Hong Kong) Limited (2008-present); and Assistant Secretary of Fidelity Management & Research (Japan) Limited (2008-present) and Fidelity Management & Research (U.K.) Inc. (2008-present). Previously, Mr. Goebel served as Secretary and CLO of other Fidelity funds (2008-2013), Assistant Secretary of FIMM (2008-2010), FRAC (2008-2010), and certain funds (2007-2008); and as Vice President and Secretary of Fidelity Distributors Corporation (FDC) (2005-2007). Mr. Goebel has been employed by FMR LLC or an affiliate since 2001. |
Brian B. Hogan (1964) |
Year of Election or Appointment: 2009 Vice President |
| Mr. Hogan also serves as Trustee or Vice President of other funds. Mr. Hogan serves as a Director of Fidelity SelectCo, LLC (2014-present) and President of FMR's Equity Division (2009-present). Previously, Mr. Hogan served as Senior Vice President, Equity Research of FMR (2006-2009) and as a portfolio manager. |
Chris Maher (1972) |
Year of Election or Appointment: 2013 Assistant Treasurer |
| Mr. Maher serves as Assistant Treasurer of other funds. Mr. Maher is Vice President of Valuation Oversight and is an employee of Fidelity Investments. Previously, Mr. Maher served as Vice President of Asset Management Compliance (2013), Vice President of FMR's Program Management Group (2010-2013), and Vice President of Valuation Oversight (2008-2010). |
Kenneth B. Robins (1969) |
Year of Election or Appointment: 2008 President and Treasurer |
| Mr. Robins also serves as an officer of other funds. Mr. Robins serves as Executive Vice President of Fidelity Investments Money Management, Inc. (FIMM) (2013-present) and is an employee of Fidelity Investments (2004-present). Previously, Mr. Robins served in other fund officer roles. |
Stephen Sadoski (1971) |
Year of Election or Appointment: 2012 Deputy Treasurer |
| Mr. Sadoski also serves as Deputy Treasurer of other funds. He is an employee of Fidelity Investments (2012-present) and has served in another fund officer role. Prior to joining Fidelity Investments, Mr. Sadoski served as an assistant chief accountant in the Division of Investment Management of the Securities and Exchange Commission (SEC) (2009-2012) and as a senior manager at Deloitte & Touche LLP (1997-2009). |
Stacie M. Smith (1974) |
Year of Election or Appointment: 2013 Deputy Treasurer |
| Ms. Smith also serves as an officer of other funds. She is an employee of Fidelity Investments (2009-present) and has served in other fund officer roles. Prior to joining Fidelity Investments, Ms. Smith served as Senior Audit Manager of Ernst & Young LLP (1996-2009). |
Renee Stagnone (1975) |
Year of Election or Appointment: 2013 Deputy Treasurer |
| Ms. Stagnone also serves as Deputy Treasurer of other funds. Ms. Stagnone is an employee of Fidelity Investments. |
Linda J. Wondrack (1964) |
Year of Election or Appointment: 2014 Chief Compliance Officer |
| Ms. Wondrack also serves as Chief Compliance Officer of other funds. Ms. Wondrack is Executive Vice President and head of the Ethics Office and Asset Management Compliance for Fidelity Investments (2012-present). Ms. Wondrack also serves as Chief Compliance Officer of Fidelity SelectCo, LLC (2014-present); Chief Compliance Officer of Impresa Management LLC (2013-present); and Chief Compliance Officer of FMR Co., Inc., Fidelity Investments Money Management, Inc., Fidelity Management & Research (Japan) Limited, Fidelity Management & Research (U.K.) Inc., Fidelity Management & Research (Hong Kong), Fidelity Management & Research Company, Pyramis Global Advisors, LLC, and Strategic Advisers, Inc., Ballyrock Investment Advisors LLC, and Northern Neck Investors LLC (2012-present). Previously, Ms. Wondrack served as Senior Vice President and Chief Compliance Officer for Columbia Management Investment Advisers, LLC (2005-2012); Chief Compliance Officer for certain funds within the Columbia Family of Funds (2007-2012); and Senior Vice President of Compliance Risk Management at Bank of America (2005-2010). |
Joseph F. Zambello (1957) |
Year of Election or Appointment: 2011 Deputy Treasurer |
| Mr. Zambello also serves as Deputy Treasurer of other funds. Mr. Zambello is an employee of Fidelity Investments. Previously, Mr. Zambello served as Vice President of FMR's Program Management Group (2009-2011) and Vice President of the Transfer Agent Oversight Group (2005-2009). |
Annual Report
International Value Fund designates 93% of the dividends distributed during the fiscal year as amounts which may be taken into account as a dividend for the purposes of the maximum rate under section 1(h)(11) of the Internal Revenue Code.
The amounts per share which represent income derived from sources within, and taxes paid to, foreign countries or possessions of the United States are as follows:
| Pay Date | Income | Taxes |
International Value Fund | 12/09/13 | $0.1502 | $0.0084 |
The fund will notify shareholders in January 2015 of amounts for use in preparing 2014 income tax returns.
Annual Report
Board Approval of Investment Advisory Contracts and Management Fees
Fidelity International Value Fund
Each year, the Board of Trustees, including the Independent Trustees (together, the Board), votes on the renewal of the management contract with Fidelity Management & Research Company (FMR) and the sub-advisory agreements (together, the Advisory Contracts) for the fund. The Board, assisted by the advice of fund counsel and Independent Trustees' counsel, requests and considers a broad range of information relevant to the renewal of the Advisory Contracts throughout the year.
The Board meets regularly and, at each of its meetings, covers an extensive agenda of topics and materials and considers factors that are relevant to its annual consideration of the renewal of the fund's Advisory Contracts, including the services and support provided to the fund and its shareholders. The Board has established various standing committees (Committees), each composed of and chaired by Independent Trustees with varying backgrounds, to which the Board has assigned specific subject matter responsibilities in order to enhance effective decision-making by the Board. The Board, acting directly and through its Committees, requests and receives information concerning the annual consideration of the renewal of the fund's Advisory Contracts. The Board also meets as needed to consider matters specifically related to the Board's annual consideration of the renewal of the Advisory Contracts. Members of the Board may also meet with trustees of other Fidelity funds through ad hoc joint committees to discuss certain matters relevant to the Fidelity funds.
At its July 2014 meeting, the Board, including the Independent Trustees, unanimously determined to renew the fund's Advisory Contracts. In reaching its determination, the Board considered all factors it believed relevant, including (i) the nature, extent, and quality of the services to be provided to the fund and its shareholders (including the investment performance of the fund); (ii) the competitiveness of the fund's management fee and total expense ratio relative to peer funds; (iii) the total costs of the services to be provided by and the profits to be realized by Fidelity from its relationship with the fund; (iv) the extent to which economies of scale exist and would be realized as the fund grows; and (v) whether fee levels reflect these economies of scale, if any, for the benefit of fund shareholders. In connection with separate internal corporate reorganizations involving Fidelity Management & Research (U.K.) Inc. (FMR U.K.) and Fidelity Management & Research (Japan) Inc. (FMR Japan), the Board approved certain non-material amendments to the fund's sub-advisory agreements with FMR U.K. and FMR Japan to reflect that, after these reorganizations, FMR Investment Management (UK) Limited and Fidelity Management & Research (Japan) Limited will carry on the business of FMR U.K. and FMR Japan, respectively. The Board noted that no changes to the portfolio managers or to the foreign research or investment advisory services provided to the fund were expected in connection with either reorganization and that the same personnel and resources would continue to be available to the fund at the new entities.
Annual Report
In considering whether to renew the Advisory Contracts for the fund, the Board reached a determination, with the assistance of fund counsel and Independent Trustees' counsel and through the exercise of its business judgment, that the renewal of the Advisory Contracts was in the best interests of the fund and its shareholders and that the compensation payable under the Advisory Contracts was fair and reasonable. The Board's decision to renew the Advisory Contracts was not based on any single factor, but rather was based on a comprehensive consideration of all the information provided to the Board at its meetings throughout the year. The Board, in reaching its determination to renew the Advisory Contracts, was aware that shareholders of the fund have a broad range of investment choices available to them, including a wide choice among funds offered by Fidelity's competitors, and that the fund's shareholders, who have the opportunity to review and weigh the disclosure provided by the fund in its prospectus and other public disclosures, have chosen to invest in this fund, which is part of the Fidelity family of funds.
Nature, Extent, and Quality of Services Provided. The Board considered Fidelity's staffing as it relates to the fund, including the backgrounds of investment personnel of FMR and the sub-advisers (together, the Investment Advisers), and also considered the fund's investment objective, strategies, and related investment philosophy. The Independent Trustees also had discussions with senior management of Fidelity's investment operations and investment groups. The Board considered the structure of the portfolio manager compensation program and whether this structure provides appropriate incentives to act in the best interests of the fund. Additionally, the Board considered the portfolio managers' investments, if any, in the funds that they manage.
Resources Dedicated to Investment Management and Support Services. The Board and the Fund Oversight and Research Committees reviewed the general qualifications and capabilities of Fidelity's investment staff, including its size, education, experience, and resources, as well as Fidelity's approach to recruiting, training, managing, and compensating investment personnel. The Board noted that Fidelity has continued to increase the resources devoted to non-U.S. offices, including expansion of Fidelity's global investment organization. The Board also noted that Fidelity's analysts have extensive resources, tools and capabilities that allow them to conduct sophisticated quantitative and fundamental analysis, as well as credit analysis of issuers, counterparties and guarantors. Further, the Board believes that Fidelity's investment professionals have sufficient access to global information and data so as to provide competitive investment results over time, and that those professionals also have access to sophisticated tools that permit them to assess portfolio construction and risk and performance attribution characteristics continuously, as well as to transmit new information and research conclusions rapidly around the world. Additionally, in its deliberations, the Board considered Fidelity's trading and risk management capabilities and resources and global compliance infrastructure, which are an integral part of the investment management process.
Annual Report
Board Approval of Investment Advisory Contracts and
Management Fees - continued
Shareholder and Administrative Services. The Board considered (i) the nature, extent, quality, and cost of advisory, administrative, and shareholder services performed by the Investment Advisers and their affiliates under the Advisory Contracts and under separate agreements covering transfer agency, pricing and bookkeeping, and securities lending services for the fund; (ii) the nature and extent of the supervision of third party service providers, principally custodians and subcustodians; and (iii) the resources devoted to, and the record of compliance with, the fund's compliance policies and procedures. The Board also reviewed the allocation of fund brokerage, including allocations to brokers affiliated with the Investment Advisers, the use of brokerage commissions to pay fund expenses, and the use of "soft" commission dollars to pay for research services.
The Board noted that the growth of fund assets over time across the complex allows Fidelity to reinvest in the development of services designed to enhance the value or convenience of the Fidelity funds as investment vehicles. These services include 24-hour access to account information and market information through telephone representatives and over the Internet, investor education materials and asset allocation tools, and the expanded availability of Fidelity Investor Centers.
In 2014, the Board formed an ad hoc Committee on Transfer Agency Fees to review the variety of transfer agency fee structures throughout the industry and Fidelity's competitive positioning with respect to industry participants.
Investment in a Large Fund Family. The Board considered the benefits to shareholders of investing in a Fidelity fund, including the benefits of investing in a fund that is part of a large family of funds offering a variety of investment disciplines and providing a large variety of mutual fund investor services. The Board noted that Fidelity had taken, or had made recommendations that resulted in the Fidelity funds taking, a number of actions over the previous year that benefited particular funds, including (i) continuing to dedicate additional resources to investment research and to the support of the senior management team that oversees asset management; (ii) persisting in efforts to enhance Fidelity's global research capabilities; (iii) launching new funds and making other enhancements to meet client needs for income-oriented solutions; (iv) reducing fund expenses for certain index funds; (v) continuing to launch dedicated lower cost underlying funds to meet portfolio construction needs related to expanding underlying fund options for Fidelity funds of funds, specifically for the Freedom Fund product lines; (vi) rationalizing product lines and gaining increased efficiencies through fund mergers; (vii) launching sector-based exchange-traded funds and establishing a new Fidelity adviser to manage sector-based funds and products; (viii) continuing to develop and implement technology to improve security and increase efficiency; (ix) modifying the eligibility criteria for certain share classes to increase their marketability to a portion of the defined contribution plan market; (x) waiving redemption fees for certain qualified fund-of-fund and wrap programs and certain retirement plan transactions; and (xi) launching new Institutional Class shares of certain money market funds to attract and retain assets and to fill a gap in the money market fund lineup.
Annual Report
Investment Performance. The Board considered whether the fund has operated in accordance with its investment objective, as well as its record of compliance with its investment restrictions and its performance history. The Board noted that there was a portfolio management change for the fund in September 2011.
The Board took into account discussions with the Investment Advisers about fund investment performance that occur at Board meetings throughout the year. In this regard the Board noted that as part of regularly scheduled fund reviews and other reports to the Board on fund performance, the Board periodically considers annualized return information for the fund, for different time periods, measured against a securities market index ("benchmark index") and a peer group of funds with similar objectives ("peer group"). In its evaluation of fund investment performance, the Board gave particular attention to information indicating changes in performance of certain Fidelity funds for specific time periods and the Investment Advisers' explanations for any overperformance or underperformance.
In addition to reviewing absolute and relative fund performance, the Independent Trustees periodically consider the appropriateness of fund performance metrics in evaluating the results achieved. In general, the Independent Trustees believe that fund performance should be evaluated based on net performance (after fees and expenses) of both the highest performing and lowest performing classes, where applicable, compared to appropriate benchmark indices, over appropriate time periods which may include full market cycles, and compared to peer groups, as applicable, over the same periods, taking into account relevant factors including the following: general market conditions; issuer-specific information; tactical opportunities for investment; and fund cash flows and other factors.
The Independent Trustees recognize that shareholders evaluate performance on a net basis over their own holding periods, for which one-, three-, and five-year periods are often used as a proxy. For this reason, the performance information reviewed by the Board also included net cumulative calendar year total return information for the fund and an appropriate benchmark index and peer group for the most recent one-, three-, and five-year periods, as shown below. Returns are shown compared to the 25th percentile (top of box, 75% beaten) and 75th percentile (bottom of box, 25% beaten) of the peer universe. Returns of the benchmark index are "net MA," i.e., adjusted for tax withholding rates applicable to U.S.-based funds organized as Massachusetts business trusts.
Annual Report
Board Approval of Investment Advisory Contracts and
Management Fees - continued
Fidelity International Value Fund

The Board has discussed the fund's performance with FMR, including the fund's underperformance based on more recent periods ended after 2013 (which periods are not shown in the chart above) but prior to the date of the Board's approval of the renewal of the Advisory Contracts, and has engaged with FMR to consider what steps might be taken to remediate the fund's more recent underperformance.
The Board also considered that the fund's management fee is subject to upward or downward adjustment depending upon whether, and to what extent, the fund's investment performance for the performance period exceeds, or is exceeded by, a securities index, thus leading to a performance adjustment for the same period. The Board noted that the performance adjustment provides FMR with a strong economic incentive to seek to achieve superior performance for the fund's shareholders and helps to more closely align the interests of FMR and the fund's shareholders.
Based on its review, the Board concluded that the nature, extent, and quality of services provided to the fund under the Advisory Contracts should benefit the fund's shareholders.
Competitiveness of Management Fee and Total Expense Ratio. The Board considered the fund's management fee and total expense ratio compared to "mapped groups" of competitive funds and classes. Fidelity creates "mapped groups" by combining similar Lipper investment objective categories that have comparable investment mandates. Combining Lipper investment objective categories aids the Board's management fee and total expense ratio comparisons by broadening the competitive group used for comparison and by reducing the number of universes to which various Fidelity funds are compared.
Annual Report
Management Fee. The Board considered two proprietary management fee comparisons for the 12-month periods shown in the chart below. The group of Lipper funds used by the Board for management fee comparisons is referred to below as the "Total Mapped Group." The Total Mapped Group comparison focuses on a fund's standing in terms of gross management fees before expense reimbursements or caps, and without giving effect to the fund's performance adjustment, relative to the total universe of funds with comparable investment mandates, regardless of whether their management fee structures also are comparable. Funds with comparable investment mandates offer exposure to similar types of securities. Funds with comparable management fee structures have similar management fee contractual arrangements (e.g., flat rate charged for advisory services, all-inclusive fee rate, etc.). "TMG %" represents the percentage of funds in the Total Mapped Group that had management fees that were lower than the fund's. For example, a hypothetical TMG % of 20% would mean that 80% of the funds in the Total Mapped Group had higher, and 20% had lower, management fees than the fund. The fund's actual TMG %s are in the chart below. The "Asset-Size Peer Group" (ASPG) comparison focuses on a fund's standing relative to a subset of non-Fidelity funds within the Total Mapped Group that are similar in size and management fee structure. For example, if a fund is in the first quartile of the ASPG, the fund's management fee ranks in the least expensive or lowest 25% of funds in the ASPG. The ASPG represents at least 15% of the funds in the Total Mapped Group with comparable asset size and management fee structures, subject to a minimum of 50 funds (or all funds in the Total Mapped Group if fewer than 50). Additional information, such as the ASPG quartile in which the fund's management fee rate ranked and the impact of the fund's performance adjustment, is also included in the chart and considered by the Board.
Annual Report
Board Approval of Investment Advisory Contracts and
Management Fees - continued
Fidelity International Value Fund

The Board noted that the fund's management fee rate ranked below the median of its Total Mapped Group and below the median of its ASPG for 2013. The Board also noted the effect of the fund's negative performance adjustment on the fund's management fee ranking.
The Board also noted that, in August 2013, the ad hoc Committee on Management Fees was formed to conduct an in-depth review of the management fee rates of Fidelity's active equity mutual funds. The Committee focused on the following areas: (i) standard fee structures; (ii) research consumption and trading evolution; (iii) management fee competitiveness/profitability by category; and (iv) factors that drive institutional pricing.
Based on its review, the Board concluded that the fund's management fee is fair and reasonable in light of the services that the fund receives and the other factors considered.
Total Expense Ratio. In its review of each class's total expense ratio, the Board considered the fund's management fee as well as other fund or class expenses, as applicable, such as transfer agent fees, pricing and bookkeeping fees, fund-paid 12b-1 fees, and custodial, legal, and audit fees. The Board also noted the effects of any waivers and reimbursements on fees and expenses, as well as the impact of the fund's performance adjustment. As part of its review, the Board also considered the current and historical total expense ratios of each class of the fund compared to competitive fund median expenses. Each class of the fund is compared to those funds and classes in the Total Mapped Group (used by the Board for management fee comparisons) that have a similar sales load structure.
Annual Report
The Board noted that the total expense ratio of each of Class A, Class B, Institutional Class, and the retail class ranked below its competitive median for 2013 and the total expense ratio of each of Class T and Class C ranked above its competitive median for 2013. The Board considered that, in general, various factors can affect total expense ratios. The Board noted that the total expense ratio of Class T was above the competitive median primarily because of higher 12b-1 fees on Class T as compared to most competitor funds. Class T has a higher 12b-1 fee, but a lower front-end sales charge, than traditionally priced front-end sales charge classes. The Board considered that Class T is primarily sold load-waived in the retirement plan market where its 0.50% 12b-1 fee is comparable to competing no-load, higher 12b-1 fee classes designed specifically for retirement plans. The Board noted that the fund offers multiple classes, each of which has a different sales load and 12b-1 fee structure, and that the multiple structures are intended to offer a range of pricing options for the intermediary market. The Board also noted that the total expense ratios of the classes vary primarily by the level of their 12b-1 fees, although differences in transfer agent fees may also cause expenses to vary from class to class.
Fees Charged to Other Fidelity Clients. The Board also considered Fidelity fee structures and other information with respect to clients of Fidelity, such as other funds advised or subadvised by Fidelity, pension plan clients, and other institutional clients. The Board noted the findings of the 2013 ad hoc joint committee (created with the board of other Fidelity funds), which reviewed and compared Fidelity's institutional investment advisory business with its business of providing services to the Fidelity funds, including the differences in services provided, fees charged, and costs incurred, as well as competition in their respective marketplaces.
Based on its review of total expense ratios and fees charged to other Fidelity clients, the Board concluded that the total expense ratio of each class of the fund was reasonable, although in some cases above the median of the universe presented for comparison, in light of the services that the fund and its shareholders receive and the other factors considered.
Costs of the Services and Profitability. The Board considered the revenues earned and the expenses incurred by Fidelity in conducting the business of developing, marketing, distributing, managing, administering and servicing the fund and servicing the fund's shareholders. The Board also considered the level of Fidelity's profits in respect of all the Fidelity funds.
On an annual basis, Fidelity presents to the Board Fidelity's profitability for the fund. Fidelity calculates the profitability for each fund, as well as aggregate profitability for groups of Fidelity funds and all Fidelity funds, using a series of detailed revenue and cost allocation methodologies which originate with the books and records of Fidelity on which Fidelity's audited financial statements are based. The Audit Committee of the Board reviews any significant changes from the prior year's methodologies.
Annual Report
Board Approval of Investment Advisory Contracts and
Management Fees - continued
PricewaterhouseCoopers LLP (PwC), independent registered public accounting firm and auditor to Fidelity and certain Fidelity funds, has been engaged annually by the Board as part of the Board's assessment of Fidelity's profitability analysis. PwC's engagement includes the review and assessment of the methodologies used by Fidelity in determining the revenues and expenses attributable to Fidelity's mutual fund business, and completion of agreed-upon procedures in respect of the mathematical accuracy of fund profitability and its conformity to established allocation methodologies. After considering PwC's reports issued under the engagement and information provided by Fidelity, the Board concluded that while other allocation methods may also be reasonable, Fidelity's profitability methodologies are reasonable in all material respects.
The Board also reviewed Fidelity's non-fund businesses and fall-out benefits related to the mutual fund business as well as cases where Fidelity's affiliates may benefit from or be related to the fund's business.
The Board considered the costs of the services provided by and the profits realized by Fidelity in connection with the operation of the fund and was satisfied that the profitability was not excessive in the circumstances.
Economies of Scale. The Board considered whether there have been economies of scale in respect of the management of the Fidelity funds, whether the Fidelity funds (including the fund) have appropriately benefited from any such economies of scale, and whether there is potential for realization of any further economies of scale. The Board considered the extent to which the fund will benefit from economies of scale through increased services to the fund, through waivers or reimbursements, or through fee or expense ratio reductions. The Board also noted that in 2013, it and the boards of other Fidelity funds created an ad hoc committee (the Economies of Scale Committee) to analyze whether Fidelity attains economies of scale in respect of the management and servicing of the Fidelity funds, whether the Fidelity funds have appropriately benefited from such economies of scale, and whether there is potential for realization of any further economies of scale.
The Board recognized that the fund's management contract incorporates a "group fee" structure, which provides for lower group fee rates as total group assets increase, and for higher group fee rates as total group assets decrease (with "group assets" defined to include fund assets under FMR's management plus sector fund assets previously under FMR's management and currently managed by Fidelity SelectCo, LLC). FMR calculates the group fee rates based on a tiered asset "breakpoint" schedule that varies based on asset class. The Board considered that the group fee is designed to deliver the benefits of economies of scale to fund shareholders when total Fidelity fund assets increase, even if assets of any particular fund are unchanged or have declined, because some portion of Fidelity's costs are attributable to services provided to all Fidelity funds, and all funds benefit if those costs can be allocated among more assets. The Board concluded that, given the group fee structure, fund shareholders will benefit from lower management fees as group assets increase at the fund complex level, regardless of whether Fidelity achieves any such economies of scale.
Annual Report
The Board concluded, taking into account the analysis of the Economies of Scale Committee, that economies of scale, if any, are being appropriately shared between fund shareholders and Fidelity.
Additional Information Requested by the Board. In order to develop fully the factual basis for consideration of the Fidelity funds' Advisory Contracts, the Board requested and received additional information on certain topics, including: (i) fund performance trends and Fidelity's long-term strategies for certain funds; (ii) Fidelity's strategic marketing and product lineup goals; (iii) the methodology with respect to competitive fund data and peer group classifications; (iv) the arrangements with, and performance of, certain sub-advisers on behalf of the Fidelity funds, as well as certain proposed participating affiliate arrangements; (v) the realization of fall-out benefits in certain Fidelity business units; (vi) Fidelity's group fee structures, including the rationale for the individual fee rates of certain categories of funds and the definition of group assets; (vii) trends regarding industry use of performance fee structures and the performance adjustment methodologies applicable to the Fidelity funds; (viii) additional competitive analysis regarding the total expenses for certain classes; (ix) fund profitability methodology, including Fidelity's cost allocation methodology, and the impact of certain factors on fund profitability results; and (x) the process by which Fidelity determines sub-advisory fees for funds it advises.
Based on its evaluation of all of the conclusions noted above, and after considering all factors it believed relevant, the Board ultimately concluded that the advisory fee structures are fair and reasonable, and that the fund's Advisory Contracts should be renewed.
Annual Report
Investment Adviser
Fidelity Management & Research
Company
Boston, MA
Investment Sub-Advisers
FMR Co., Inc.
Fidelity Management & Research
(U.K.) Inc.
Fidelity Management & Research
(Hong Kong) Limited
Fidelity Management & Research
(Japan) Limited
FIL Investment Advisors
FIL Investment Advisors (U.K.) Limited
FIL Investments (Japan) Limited
General Distributor
Fidelity Distributors Corporation
Smithfield, RI
Transfer and Service Agents
Fidelity Investments Institutional
Operations Company, Inc.
Boston, MA
Fidelity Service Company, Inc.
Boston, MA
Custodian
The Northern Trust Company
Chicago, IL
The Fidelity Telephone Connection
Mutual Fund 24-Hour Service
Exchanges/Redemptions
and Account Assistance 1-800-544-6666
Product Information 1-800-544-8888
Retirement Accounts 1-800-544-4774
(8 a.m. - 9 p.m.)
TDD Service 1-800-544-0118
for the deaf and hearing impaired
(9 a.m. - 9 p.m. Eastern time)
Fidelity Automated Service
Telephone (FAST®)
1-800-544-5555
Automated line for quickest service
(Fidelity Investment logo)(registered trademark)
Corporate Headquarters
245 Summer St., Boston, MA 02210
www.fidelity.com
FIV-UANN-1214
1.827481.108
Fidelity®
Series Emerging Markets
Series International Growth
Series International Small Cap
Series International Value
Funds -
Fidelity Series Emerging Markets Fund
Fidelity Series International Growth Fund
Fidelity Series International Small Cap Fund
Fidelity Series International Value Fund
Class F
Annual Report
October 31, 2014
(Fidelity Cover Art)
Contents
Shareholder Expense Example | (Click Here) | An example of shareholder expenses. |
Fidelity® Series Emerging Markets Fund |
Performance | (Click Here) | How the fund has done over time. |
Management's Discussion of Fund Performance | (Click Here) | The Portfolio Manager's review of fund performance and strategy. |
Investment Changes | (Click Here) | A summary of major shifts in the Fund's investments over the past six months. |
Investments | (Click Here) | A complete list of the fund's investments with their market values. |
Financial Statements | (Click Here) | Statements of assets and liabilities, operations, and changes in net assets, as well as financial highlights. |
Fidelity Series International Growth Fund |
Performance | (Click Here) | How the fund has done over time. |
Management's Discussion of Fund Performance | (Click Here) | The Portfolio Manager's review of fund performance and strategy. |
Investment Changes | (Click Here) | A summary of major shifts in the Fund's investments over the past six months. |
Investments | (Click Here) | A complete list of the fund's investments with their market values. |
Financial Statements | (Click Here) | Statements of assets and liabilities, operations, and changes in net assets, as well as financial highlights. |
Fidelity Series International Small Cap Fund |
Performance | (Click Here) | How the fund has done over time. |
Management's Discussion of Fund Performance | (Click Here) | The Portfolio Manager's review of fund performance and strategy. |
Investment Changes | (Click Here) | A summary of major shifts in the Fund's investments over the past six months. |
Investments | (Click Here) | A complete list of the fund's investments with their market values. |
Financial Statements | (Click Here) | Statements of assets and liabilities, operations, and changes in net assets, as well as financial highlights. |
Fidelity Series International Value Fund |
Performance | (Click Here) | How the fund has done over time. |
Management's Discussion of Fund Performance | (Click Here) | The Portfolio Manager's review of fund performance and strategy. |
Investment Changes | (Click Here) | A summary of major shifts in the Fund's investments over the past six months. |
Investments | (Click Here) | A complete list of the fund's investments with their market values. |
Financial Statements | (Click Here) | Statements of assets and liabilities, operations, and changes in net assets, as well as financial highlights. |
Notes | (Click Here) | Notes to the Financial Statements. |
Reports of Independent Registered Public Accounting Firms | (Click Here) | |
Trustees and Officers | (Click Here) | |
Distributions | (Click Here) | |
Board Approval of Investment Advisory Contracts and Management Fees | (Click Here) | |
To view a fund's proxy voting guidelines and proxy voting record for the 12-month period ended June 30, visit http://www.fidelity.com/proxyvotingresults or visit the Securities and Exchange Commission's (SEC) web site at http://www.sec.gov. You may also call 1-800-544-8544 for Fidelity Series Emerging Markets Fund, Fidelity Series International Growth Fund, Fidelity Series International Small Cap Fund, and Fidelity Series International Value Fund or 1-800-835-5092 for Class F of each fund to request a free copy of the proxy voting guidelines.
Standard & Poor's, S&P and S&P 500 are registered service marks of The McGraw-Hill Companies, Inc. and have been licensed for use by Fidelity Distributors Corporation.
Other third-party marks appearing herein are the property of their respective owners.
All other marks appearing herein are registered or unregistered trademarks or service marks of FMR LLC or an affiliated company. © 2014 FMR LLC. All rights reserved.
This report and the financial statements contained herein are submitted for the general information of the shareholders of the funds. This report is not authorized for distribution to prospective investors in the funds unless preceded or accompanied by an effective prospectus.
A fund files its complete schedule of portfolio holdings with the SEC for the first and third quarters of each fiscal year on Form N-Q. Forms N-Q are available on the SEC's web site at http://www.sec.gov. A fund's Forms N-Q may be reviewed and copied at the SEC's Public Reference Room in Washington, DC. Information regarding the operation of the SEC's Public Reference Room may be obtained by calling 1-800-SEC-0330. For a complete list of a fund's portfolio holdings, view the most recent holdings listing, semiannual report, or annual report on Fidelity's web site at http://www.fidelity.com, http://www.advisor.fidelity.com, or http://www.401k.com, as applicable.
NOT FDIC INSURED • MAY LOSE VALUE • NO BANK GUARANTEE
Neither the funds nor Fidelity Distributors Corporation is a bank.
Annual Report
Shareholder Expense Example
As a shareholder of a Fund, you incur two types of costs: (1) transaction costs and (2) ongoing costs, including management fees and other Fund expenses. This Example is intended to help you understand your ongoing costs (in dollars) of investing in the Funds and to compare these costs with the ongoing costs of investing in other mutual funds.
The Example is based on an investment of $1,000 invested at the beginning of the period and held for the entire period (May 1, 2014 to October 31, 2014).
Actual Expenses
The first line of the accompanying table for each class of each fund provides information about actual account values and actual expenses. You may use the information in this line, together with the amount you invested, to estimate the expenses that you paid over the period. Simply divide your account value by $1,000.00 (for example, an $8,600 account value divided by $1,000.00 = 8.6), then multiply the result by the number in the first line for a class of the fund under the heading entitled "Expenses Paid During Period" to estimate the expenses you paid on your account during this period. In addition, each Fund, as a shareholder in the underlying Fidelity Central Funds, will indirectly bear its pro-rata share of the fees and expenses incurred by the underlying Fidelity Central Funds. These fees and expenses are not included in the Fund's annualized expense ratio used to calculate the expense estimate in the table below.
Hypothetical Example for Comparison Purposes
The second line of the accompanying table for each class of each fund provides information about hypothetical account values and hypothetical expenses based on a Class' actual expense ratio and an assumed rate of return of 5% per year before expenses, which is not the Class' actual return. The hypothetical account values and expenses may not be used to estimate the actual ending account balance or expenses you paid for the period. You may use this information to compare the ongoing costs of investing in the Fund and other funds. To do so, compare this 5% hypothetical example with the 5% hypothetical examples that appear in the shareholder reports of the other funds. In addition, each Fund, as a shareholder in the underlying Fidelity Central Funds, will indirectly bear its pro-rata share of the fees and expenses incurred by the underlying Fidelity Central Funds. These fees and expenses are not included in the Fund's annualized expense ratio used to calculate the expense estimate in the table below.
Please note that the expenses shown in the table are meant to highlight your ongoing costs only and do not reflect any transaction costs. Therefore, the second line of the table is useful in comparing ongoing costs only, and will not help you determine the relative total costs of owning different funds.
Annual Report
Shareholder Expense Example - continued
| Annualized
Expense Ratio B | Beginning
Account Value
May 1, 2014 | Ending
Account Value
October 31, 2014 | Expenses Paid
During Period*
May 1, 2014
to October 31, 2014 |
Fidelity Series Emerging Markets Fund | | | | |
Series Emerging Markets | 1.05% | | | |
Actual | | $ 1,000.00 | $ 1,033.10 | $ 5.38 |
HypotheticalA | | $ 1,000.00 | $ 1,019.91 | $ 5.35 |
Class F | .88% | | | |
Actual | | $ 1,000.00 | $ 1,034.20 | $ 4.51 |
HypotheticalA | | $ 1,000.00 | $ 1,020.77 | $ 4.48 |
Fidelity Series International Growth Fund | | | | |
Series International Growth | .97% | | | |
Actual | | $ 1,000.00 | $ 997.20 | $ 4.88 |
HypotheticalA | | $ 1,000.00 | $ 1,020.32 | $ 4.94 |
Class F | .80% | | | |
Actual | | $ 1,000.00 | $ 997.20 | $ 4.03 |
HypotheticalA | | $ 1,000.00 | $ 1,021.17 | $ 4.08 |
Fidelity Series International Small Cap Fund | | | | |
Series International Small Cap | 1.19% | | | |
Actual | | $ 1,000.00 | $ 951.20 | $ 5.85 |
HypotheticalA | | $ 1,000.00 | $ 1,019.21 | $ 6.06 |
Class F | 1.02% | | | |
Actual | | $ 1,000.00 | $ 952.60 | $ 5.02 |
HypotheticalA | | $ 1,000.00 | $ 1,020.06 | $ 5.19 |
| Annualized
Expense Ratio B | Beginning
Account Value
May 1, 2014 | Ending
Account Value
October 31, 2014 | Expenses Paid
During Period*
May 1, 2014
to October 31, 2014 |
Fidelity Series International Value Fund | | | | |
Series International Value | .82% | | | |
Actual | | $ 1,000.00 | $ 950.40 | $ 4.03 |
HypotheticalA | | $ 1,000.00 | $ 1,021.07 | $ 4.18 |
Class F | .65% | | | |
Actual | | $ 1,000.00 | $ 950.50 | $ 3.20 |
HypotheticalA | | $ 1,000.00 | $ 1,021.93 | $ 3.31 |
A 5% return per year before expenses
B Annualized expense ratio reflects expenses net of applicable fee waivers.
* Expenses are equal to each Class' annualized expense ratio, multiplied by the average account value over the period, multiplied by 184/ 365 (to reflect the one-half year period).
Annual Report
Fidelity® Series Emerging Markets Fund
Average annual total return reflects the change in the value of an investment, assuming reinvestment of the class' distributions from dividend income and capital gains (the profits earned upon the sale of securities that have grown in value, if any) and assuming a constant rate of performance each year. The $10,000 table and the fund's returns do not reflect the deduction of taxes that a shareholder would pay on fund distributions or the redemption of fund shares. During periods of reimbursement by Fidelity, a fund's total return will be greater than it would be had the reimbursement not occurred. How a fund did yesterday is no guarantee of how it will do tomorrow.
Average Annual Total Returns
Periods ended October 31, 2014 | Past 1
year | Past 5
years | Life of
fund A |
Fidelity Series Emerging Markets Fund | 2.20% | 5.93% | 14.24% |
Class F B | 2.35% | 6.14% | 14.45% |
A From December 9, 2008.
B The initial offering of Class F shares took place on June 26, 2009. Returns prior to June 26, 2009, are those of Fidelity Series Emerging Markets Fund, the original class of the fund.
$10,000 Over Life of Fund
Let's say hypothetically that $10,000 was invested in Fidelity Series Emerging Markets Fund, a class of the fund, on December 9, 2008, when the fund started. The chart shows how the value of your investment would have changed, and also shows how the MSCI Emerging Markets Index performed over the same period.
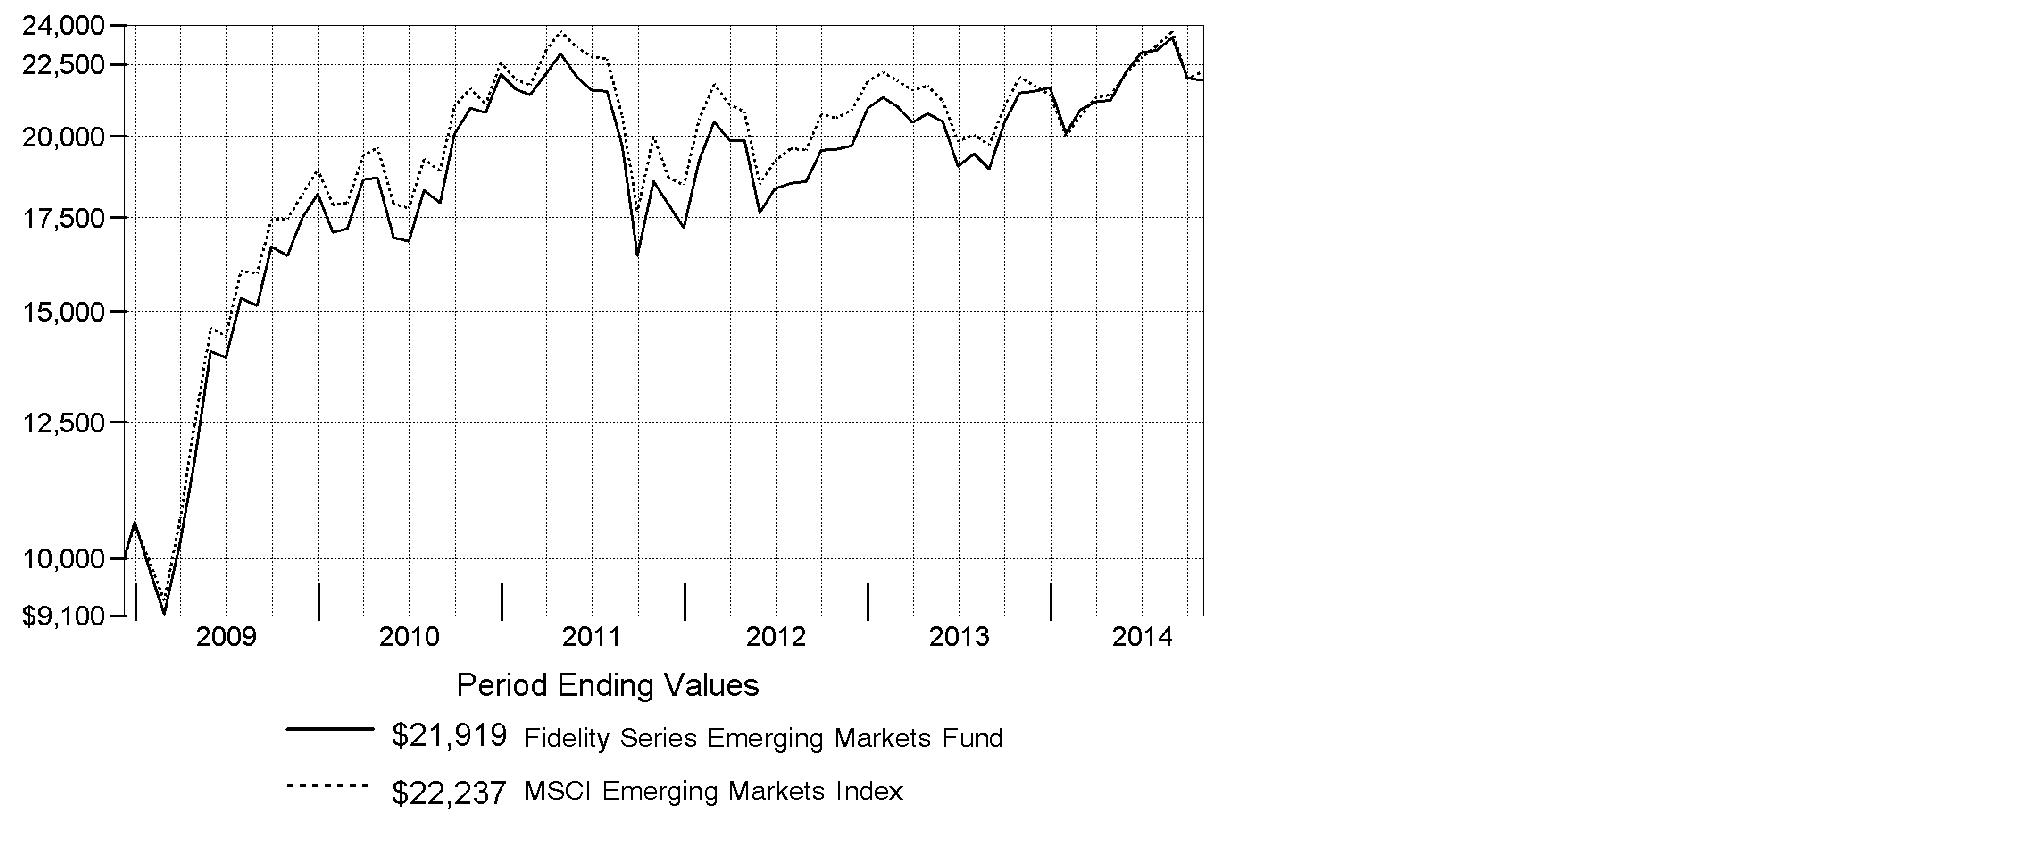
Annual Report
Fidelity Series Emerging Markets Fund
Market Recap: Global equities posted a healthy gain for the 12 months ending October 31, 2014, overcoming an October market decline driven by recessionary pressures in China and tepid growth in Europe. The MSCI ACWI (All Country World Index) Index rose 8.15%, helped by subdued market volatility for much of the period and supported by solid corporate earnings, especially in the United States. Stocks also benefited from easy monetary policies in Japan and the eurozone, as well as increased stimulus efforts in China. All but three of the 24 industry groups that compose the index marked a positive return. The U.S. (+17%) remained a pillar of strength, while a strongly rising dollar in the latter part of the period detracted from investors' returns in most non-U.S. markets. Canada (+5%) notched broad gains outside of its energy and materials sectors, as did Asia-Pacific ex Japan (+4%), led by investor enthusiasm for companies in India. The U.K., Europe and Japan, meanwhile, all underperformed. Among sectors, health care (+24%) led the index, with a strong contribution from the pharmaceuticals, biotechnology & life sciences industry. Information technology (+21%) also outperformed. Conversely, materials (-4%) and energy (-1%) lagged the index due to a higher supply of and lower demand for commodities.
Comments from Samuel Polyak and James Hayes, Co-Portfolio Managers of Fidelity® Series Emerging Markets Fund, along with Gregory Lee and Timothy Gannon: For the year, the fund's Series Emerging Markets and Class F shares gained 2.20% and 2.35%, respectively, ahead of the MSCI index. Relative to the index, the fund's top individual contributor was South-Korean cosmetics company AMOREPACIFIC Group, whose stock price tripled due to rapidly increasing demand for makeup among Chinese consumers. We had good stock selection in energy, where we successfully avoided struggling index name CNOOC, a Chinese oil & gas equipment & production firm. Our top relative contributors also included India-based Axis Bank - a non-index stock that did well along with the Indian market overall. On the downside, we had weak picks in Russia, including Sberbank Russia and Mobile TeleSystems, a market-leading private bank and wireless telecom provider, respectively. We as a group felt it prudent to move the fund to an underweighting in Russia overall in order to mitigate risk while geopolitical tension in the region evolves.
Note to shareholders: Effective October 1, 2014, Per Johansson and Douglas Chow were no longer co-managers of the fund, and Co-Managers Gregory Lee and Tim Gannon became responsible for the energy and information technology subportfolios, respectively.
The views expressed above reflect those of the portfolio manager(s) only through the end of the period as stated on the cover of this report and do not necessarily represent the views of Fidelity or any other person in the Fidelity organization. Any such views are subject to change at any time based upon market or other conditions and Fidelity disclaims any responsibility to update such views. These views may not be relied on as investment advice and, because investment decisions for a Fidelity fund are based on numerous factors, may not be relied on as an indication of trading intent on behalf of any Fidelity fund.
Annual Report
Fidelity Series Emerging Markets Fund
Investment Changes (Unaudited)
Geographic Diversification (% of fund's net assets) |
As of October 31, 2014 |
 | Korea (South) 16.8% | |
 | India 10.5% | |
 | Brazil 8.5% | |
 | Taiwan 7.9% | |
 | China 7.4% | |
 | Cayman Islands 6.8% | |
 | United States of America* 6.5% | |
 | Mexico 5.9% | |
 | South Africa 5.6% | |
 | Other 24.1% | |

* Includes Short-Term Investments and Net Other Assets (Liabilities). |
Percentages are based on country or territory of incorporation and are adjusted for the effect of futures contracts, if applicable. |
As of April 30, 2014 |
| Korea (South) 19.1% | |
| Brazil 10.5% | |
| Taiwan 7.7% | |
| Cayman Islands 7.5% | |
| India 7.2% | |
| China 6.6% | |
| United States of America* 5.3% | |
| South Africa 4.8% | |
| Mexico 4.8% | |
| Other 26.5% | |

* Includes Short-Term Investments and Net Other Assets (Liabilities). |
Percentages are based on country or territory of incorporation and are adjusted for the effect of futures contracts, if applicable. |
Asset Allocation as of October 31, 2014 |
| % of fund's
net assets | % of fund's net assets
6 months ago |
Stocks and Equity Futures | 96.8 | 96.9 |
Short-Term Investments and Net Other Assets (Liabilities) | 3.2 | 3.1 |
Top Ten Stocks as of October 31, 2014 |
| % of fund's
net assets | % of fund's net assets
6 months ago |
Samsung Electronics Co. Ltd. (Korea (South), Technology Hardware, Storage & Peripherals) | 3.7 | 4.3 |
Taiwan Semiconductor Manufacturing Co. Ltd. (Taiwan, Semiconductors & Semiconductor Equipment) | 2.8 | 3.5 |
Tencent Holdings Ltd. (Cayman Islands, Internet Software & Services) | 2.0 | 2.3 |
Naspers Ltd. Class N (South Africa, Media) | 1.6 | 1.3 |
Industrial & Commercial Bank of China Ltd. (H Shares) (China, Banks) | 1.4 | 1.6 |
Itau Unibanco Holding SA sponsored ADR (Brazil, Banks) | 1.4 | 1.4 |
Grupo Televisa SA de CV (CPO) sponsored ADR (Mexico, Media) | 1.3 | 1.1 |
Hon Hai Precision Industry Co. Ltd. (Foxconn) (Taiwan, Electronic Equipment & Components) | 1.3 | 0.1 |
Daewoo International Corp. (Korea (South), Trading Companies & Distributors) | 1.3 | 0.9 |
Axis Bank Ltd. (India, Banks) | 1.2 | 1.0 |
| 18.0 | |
Market Sectors as of October 31, 2014 |
| % of fund's
net assets | % of fund's net assets
6 months ago |
Financials | 25.7 | 25.1 |
Information Technology | 17.6 | 17.2 |
Energy | 9.0 | 10.3 |
Consumer Discretionary | 8.3 | 7.9 |
Consumer Staples | 8.0 | 8.3 |
Materials | 7.1 | 8.7 |
Industrials | 7.0 | 8.1 |
Telecommunication Services | 6.4 | 6.8 |
Utilities | 2.6 | 2.0 |
Health Care | 2.0 | 1.8 |
Annual Report
Fidelity Series Emerging Markets Fund
Investments October 31, 2014
Showing Percentage of Net Assets
Common Stocks - 85.6% |
| Shares | | Value |
Argentina - 0.7% |
Grupo Financiero Galicia SA sponsored ADR (d) | 1,194,600 | | $ 17,560,620 |
YPF SA Class D sponsored ADR | 1,353,350 | | 47,597,320 |
TOTAL ARGENTINA | | 65,157,940 |
Austria - 0.2% |
C.A.T. oil AG (Bearer) | 1,109,662 | | 21,136,709 |
Bermuda - 1.5% |
Aquarius Platinum Ltd. (Australia) (a) | 67,968,553 | | 18,498,158 |
Cosan Ltd. Class A | 1,850,532 | | 19,597,134 |
Credicorp Ltd. (United States) | 29,681 | | 4,778,641 |
GP Investments Ltd. Class A (depositary receipt) (a)(e) | 11,529,837 | | 23,311,870 |
Hoegh LNG Holdings Ltd. (a) | 110,905 | | 1,430,512 |
Shangri-La Asia Ltd. | 23,420,000 | | 34,005,951 |
Yue Yuen Industrial (Holdings) Ltd. | 14,555,500 | | 48,862,600 |
TOTAL BERMUDA | | 150,484,866 |
Brazil - 2.7% |
BM&F BOVESPA SA | 8,480,500 | | 37,304,754 |
BR Properties SA | 4,288,000 | | 21,665,830 |
CCR SA | 648,000 | | 4,824,892 |
Cielo SA | 2,414,949 | | 39,656,271 |
Cosan SA Industria e Comercio | 1,080,200 | | 15,078,945 |
Fibria Celulose SA (a) | 2,795,200 | | 33,852,840 |
Localiza Rent A Car SA | 137,300 | | 1,979,239 |
Mills Estruturas e Servicos de Engenharia SA | 450,175 | | 2,934,068 |
Minerva SA (a)(e) | 9,753,900 | | 50,188,557 |
Qualicorp SA (a) | 436,060 | | 4,434,687 |
Smiles SA | 2,041,000 | | 35,253,561 |
T4F Entretenimento SA (a)(e) | 4,516,845 | | 5,103,986 |
Ultrapar Participacoes SA | 1,092,550 | | 23,831,602 |
TOTAL BRAZIL | | 276,109,232 |
British Virgin Islands - 0.1% |
Mail.Ru Group Ltd. GDR (Reg. S) (a) | 513,100 | | 12,437,544 |
Canada - 0.7% |
First Quantum Minerals Ltd. (d) | 873,100 | | 13,169,513 |
Goldcorp, Inc. (d) | 1,382,600 | | 25,945,601 |
Pan American Silver Corp. | 2,232,400 | | 20,605,052 |
Torex Gold Resources, Inc. (a) | 7,498,300 | | 7,983,639 |
TOTAL CANADA | | 67,703,805 |
Common Stocks - continued |
| Shares | | Value |
Cayman Islands - 6.8% |
58.com, Inc. ADR (d) | 875,307 | | $ 34,635,898 |
Alibaba Group Holding Ltd. sponsored ADR | 176,000 | | 17,353,600 |
Anta Sports Products Ltd. | 18,803,000 | | 36,906,294 |
China Lodging Group Ltd. ADR (a) | 1,509,502 | | 41,496,210 |
China ZhengTong Auto Services Holdings Ltd. | 56,995,300 | | 32,287,909 |
Cimc Enric Holdings Ltd. | 19,538,000 | | 19,647,514 |
E-House China Holdings Ltd. ADR (d) | 2,160,400 | | 21,582,396 |
Eurasia Drilling Co. Ltd. GDR (Reg. S) | 1,107,009 | | 27,675,225 |
GCL-Poly Energy Holdings Ltd. (a) | 36,467,000 | | 12,290,201 |
Greatview Aseptic Pack Co. Ltd. | 31,444,000 | | 20,700,334 |
Haitian International Holdings Ltd. | 9,238,000 | | 19,816,231 |
Hengan International Group Co. Ltd. | 4,477,500 | | 47,196,249 |
SINA Corp. (a) | 436,300 | | 17,875,211 |
Tencent Holdings Ltd. | 12,236,700 | | 196,671,582 |
Tingyi (Cayman Islands) Holding Corp. | 28,496,000 | | 70,890,785 |
Uni-President China Holdings Ltd. | 53,485,000 | | 49,696,639 |
Xueda Education Group sponsored ADR | 1,327,662 | | 3,730,730 |
Yingde Gases Group Co. Ltd. | 20,176,500 | | 15,754,669 |
TOTAL CAYMAN ISLANDS | | 686,207,677 |
Chile - 0.9% |
Embotelladora Andina SA ADR | 274,500 | | 4,254,750 |
Empresa Nacional de Electricidad SA | 12,284,668 | | 19,128,745 |
Inversiones La Construccion SA | 2,149,727 | | 30,634,600 |
Vina Concha y Toro SA | 19,702,747 | | 37,671,548 |
TOTAL CHILE | | 91,689,643 |
China - 7.4% |
Anhui Conch Cement Co. Ltd. (H Shares) | 7,281,500 | | 23,845,922 |
BBMG Corp. (H Shares) | 41,139,000 | | 29,089,873 |
China Life Insurance Co. Ltd. (H Shares) | 37,130,700 | | 110,796,938 |
China Pacific Insurance Group Co. Ltd. (H Shares) | 21,845,000 | | 81,747,481 |
China Shenhua Energy Co. Ltd. (H Shares) | 13,438,000 | | 37,875,495 |
China Suntien Green Energy Corp. Ltd. (H Shares) | 59,411,000 | | 15,779,686 |
China Telecom Corp. Ltd. (H Shares) | 126,406,582 | | 80,578,566 |
Industrial & Commercial Bank of China Ltd. (H Shares) | 209,362,400 | | 139,008,255 |
Maanshan Iron & Steel Ltd. (H Shares) (a) | 115,770,000 | | 30,186,593 |
PetroChina Co. Ltd.: | | | |
(H Shares) | 75,580,000 | | 94,621,955 |
sponsored ADR (d) | 71,600 | | 8,985,800 |
Common Stocks - continued |
| Shares | | Value |
China - continued |
PICC Property & Casualty Co. Ltd. (H Shares) | 41,850,900 | | $ 76,772,890 |
Sinopec Engineering Group Co. Ltd. (H Shares) (f) | 13,779,500 | | 13,327,157 |
TOTAL CHINA | | 742,616,611 |
Colombia - 0.6% |
BanColombia SA sponsored ADR (d) | 1,141,700 | | 64,585,969 |
Denmark - 0.1% |
Auriga Industries A/S Series B (a) | 268,039 | | 13,831,796 |
Egypt - 0.3% |
Citadel Capital Corp. (a) | 49,143,900 | | 27,217,970 |
Greece - 0.5% |
National Bank of Greece SA (a) | 12,610,400 | | 30,417,563 |
Public Power Corp. of Greece (a) | 2,124,920 | | 16,136,832 |
TOTAL GREECE | | 46,554,395 |
Hong Kong - 3.2% |
China Power International Development Ltd. | 52,344,000 | | 23,644,954 |
China Resources Power Holdings Co. Ltd. | 10,717,180 | | 31,193,904 |
China Unicom Ltd. | 22,697,000 | | 34,102,568 |
CNOOC Ltd. | 51,369,000 | | 80,438,165 |
CNOOC Ltd. sponsored ADR (d) | 54,400 | | 8,506,528 |
Far East Horizon Ltd. | 38,318,300 | | 35,638,243 |
Lenovo Group Ltd. | 25,652,000 | | 37,811,176 |
Sinotruk Hong Kong Ltd. | 35,486,500 | | 18,394,233 |
Techtronic Industries Co. Ltd. | 15,101,500 | | 47,276,790 |
TOTAL HONG KONG | | 317,006,561 |
India - 10.5% |
Adani Ports & Special Economic Zone | 8,159,677 | | 37,927,315 |
Axis Bank Ltd. (a) | 16,056,459 | | 118,339,813 |
Bharti Airtel Ltd. (a) | 7,905,057 | | 51,366,753 |
Bharti Infratel Ltd. | 12,645,370 | | 60,602,165 |
Coal India Ltd. | 10,986,555 | | 66,248,001 |
Eicher Motors Ltd. | 258,556 | | 53,704,317 |
GAIL India Ltd. | 4,136,549 | | 35,553,411 |
Grasim Industries Ltd. | 612,598 | | 36,760,937 |
HCL Technologies Ltd. | 747,619 | | 19,607,190 |
Infosys Ltd. | 1,333,077 | | 88,363,283 |
ITC Ltd. (a) | 12,160,785 | | 70,312,541 |
JK Cement Ltd. | 2,736,749 | | 26,881,728 |
Larsen & Toubro Ltd. (a) | 936,444 | | 25,236,447 |
LIC Housing Finance Ltd. | 4,404,534 | | 25,937,159 |
Common Stocks - continued |
| Shares | | Value |
India - continued |
Lupin Ltd. | 2,207,426 | | $ 51,109,388 |
Petronet LNG Ltd. (a) | 11,586,873 | | 37,618,827 |
Phoenix Mills Ltd. | 5,968,823 | | 37,577,923 |
Power Grid Corp. of India Ltd. | 9,533,836 | | 22,620,843 |
SREI Infrastructure Finance Ltd. (e) | 47,462,511 | | 36,691,182 |
State Bank of India | 785,152 | | 34,551,712 |
Tata Consultancy Services Ltd. | 1,113,967 | | 47,396,523 |
Wipro Ltd. | 2,329,700 | | 21,519,781 |
Yes Bank Ltd. | 4,403,172 | | 49,860,166 |
TOTAL INDIA | | 1,055,787,405 |
Indonesia - 1.3% |
PT AKR Corporindo Tbk | 25,429,000 | | 10,360,219 |
PT Bakrieland Development Tbk (a) | 1,764,831,200 | | 7,403,967 |
PT Bank Rakyat Indonesia Tbk | 87,686,700 | | 80,355,757 |
PT Kalbe Farma Tbk | 255,534,200 | | 36,079,548 |
TOTAL INDONESIA | | 134,199,491 |
Israel - 0.5% |
Bezeq The Israel Telecommunication Corp. Ltd. | 27,890,000 | | 47,150,535 |
Kenya - 0.3% |
Equity Bank Ltd. (a) | 48,749,300 | | 27,794,458 |
Korea (South) - 15.0% |
AMOREPACIFIC Group, Inc. | 57,401 | | 63,200,427 |
Daewoo International Corp. | 4,049,045 | | 127,563,694 |
E-Mart Co. Ltd. | 304,790 | | 56,167,063 |
Fila Korea Ltd. | 322,450 | | 33,462,090 |
Hana Financial Group, Inc. | 2,361,981 | | 81,448,000 |
Hankook Shell Oil Co. Ltd. | 22,145 | | 10,078,603 |
Hyundai Industrial Development & Construction Co. | 1,303,327 | | 48,945,497 |
Hyundai Mobis | 391,810 | | 91,165,672 |
KB Financial Group, Inc. | 2,121,382 | | 82,715,345 |
KEPCO Plant Service & Engineering Co. Ltd. | 233,585 | | 19,066,034 |
Korea Electric Power Corp. | 797,116 | | 34,803,938 |
Korea Zinc Co. Ltd. | 78,552 | | 29,426,523 |
Korean Reinsurance Co. | 5,128,088 | | 54,409,675 |
LG Chemical Ltd. | 192,092 | | 35,756,507 |
LG Corp. | 582,849 | | 34,500,785 |
NAVER Corp. | 69,703 | | 48,914,614 |
POSCO | 145,562 | | 41,820,076 |
Common Stocks - continued |
| Shares | | Value |
Korea (South) - continued |
Samsung C&T Corp. | 718,460 | | $ 48,345,572 |
Samsung Electronics Co. Ltd. | 317,141 | | 367,188,090 |
Shinhan Financial Group Co. Ltd. | 2,351,639 | | 110,091,668 |
SK Hynix, Inc. (a) | 1,392,605 | | 61,500,688 |
SK Telecom Co. Ltd. sponsored ADR (d) | 794,200 | | 22,070,818 |
TOTAL KOREA (SOUTH) | | 1,502,641,379 |
Luxembourg - 0.5% |
Globant SA (a) | 657,976 | | 8,514,209 |
Tenaris SA sponsored ADR | 1,130,600 | | 44,816,984 |
TOTAL LUXEMBOURG | | 53,331,193 |
Mexico - 5.9% |
America Movil S.A.B. de CV Series L sponsored ADR | 4,755,000 | | 116,069,550 |
Banregio Grupo Financiero S.A.B. de CV | 2,413,426 | | 13,957,681 |
CEMEX S.A.B. de CV sponsored ADR (d) | 4,009,697 | | 49,319,273 |
El Puerto de Liverpool S.A.B. de CV Class C | 3,321,400 | | 38,967,640 |
Fomento Economico Mexicano S.A.B. de CV sponsored ADR | 603,200 | | 58,051,968 |
Grupo Aeroportuario del Pacifico SA de CV Series B | 4,389,300 | | 29,863,374 |
Grupo Aeroportuario Norte S.A.B. de CV | 3,092,500 | | 15,407,097 |
Grupo Comercial Chedraui S.A.B. de CV (d) | 12,355,188 | | 43,461,636 |
Grupo Financiero Banorte S.A.B. de CV Series O | 7,927,000 | | 50,854,063 |
Grupo Televisa SA de CV (CPO) sponsored ADR | 3,653,400 | | 132,033,876 |
Macquarie Mexican (REIT) | 26,508,300 | | 48,149,486 |
TOTAL MEXICO | | 596,135,644 |
Nigeria - 1.5% |
Guaranty Trust Bank PLC | 83,889,103 | | 12,660,595 |
Guaranty Trust Bank PLC GDR (Reg. S) | 5,606,577 | | 43,170,643 |
Transnational Corp. of Nigeria PLC | 522,851,647 | | 12,751,709 |
Zenith Bank PLC | 661,288,199 | | 84,632,115 |
TOTAL NIGERIA | | 153,215,062 |
Panama - 0.2% |
Copa Holdings SA Class A | 196,500 | | 22,974,780 |
Philippines - 2.3% |
Alliance Global Group, Inc. | 80,553,300 | | 45,307,972 |
LT Group, Inc. | 68,433,200 | | 21,663,864 |
Metropolitan Bank & Trust Co. | 34,353,792 | | 63,033,327 |
Common Stocks - continued |
| Shares | | Value |
Philippines - continued |
PNOC Energy Development Corp. | 104,927,600 | | $ 17,964,281 |
Robinsons Land Corp. | 148,277,850 | | 80,950,619 |
TOTAL PHILIPPINES | | 228,920,063 |
Poland - 0.8% |
Cyfrowy Polsat SA | 5,237,623 | | 40,059,818 |
Powszechny Zaklad Ubezpieczen SA | 252,400 | | 37,830,410 |
TOTAL POLAND | | 77,890,228 |
Puerto Rico - 0.2% |
Popular, Inc. (a) | 468,381 | | 14,931,986 |
Romania - 0.0% |
SNGN Romgaz SA GDR (f) | 314,434 | | 2,965,113 |
Russia - 2.8% |
Bashneft OJSC rights (a) | 23,529 | | 0 |
E.ON Russia JSC (a) | 382,682,300 | | 22,234,772 |
LUKOIL Oil Co. sponsored ADR (United Kingdom) | 1,409,600 | | 69,211,360 |
Mobile TeleSystems OJSC (a) | 4,666,400 | | 27,666,242 |
NOVATEK OAO GDR (Reg. S) | 660,600 | | 70,948,440 |
Sberbank (Savings Bank of the Russian Federation) (a) | 45,261,300 | | 80,219,689 |
TMK OAO GDR (Reg. S) | 1,713,500 | | 13,416,705 |
TOTAL RUSSIA | | 283,697,208 |
Singapore - 0.7% |
Ezion Holdings Ltd. | 12,344,640 | | 14,536,944 |
First Resources Ltd. | 32,710,000 | | 52,992,993 |
TOTAL SINGAPORE | | 67,529,937 |
South Africa - 5.6% |
Alexander Forbes Group Holding (a) | 21,934,266 | | 17,102,354 |
Aspen Pharmacare Holdings Ltd. | 2,218,500 | | 79,135,669 |
Barclays Africa Group Ltd. | 2,866,713 | | 45,265,463 |
Bidvest Group Ltd. | 1,849,045 | | 50,857,434 |
Blue Label Telecoms Ltd. | 21,275,300 | | 18,806,788 |
Impala Platinum Holdings Ltd. (a) | 3,489,000 | | 25,397,839 |
JSE Ltd. | 2,668,592 | | 25,984,885 |
Life Healthcare Group Holdings Ltd. | 10,165,600 | | 38,432,922 |
MTN Group Ltd. | 4,789,006 | | 105,942,335 |
Naspers Ltd. Class N | 1,277,900 | | 159,033,220 |
TOTAL SOUTH AFRICA | | 565,958,909 |
Common Stocks - continued |
| Shares | | Value |
Taiwan - 7.9% |
Catcher Technology Co. Ltd. | 3,689,000 | | $ 31,093,031 |
Cathay Financial Holding Co. Ltd. | 7,995,150 | | 13,158,382 |
E.SUN Financial Holdings Co. Ltd. | 43,076,287 | | 27,241,277 |
Hon Hai Precision Industry Co. Ltd. (Foxconn) | 40,630,280 | | 128,394,318 |
Inotera Memories, Inc. (a) | 15,055,000 | | 23,230,870 |
King's Town Bank | 4,109,000 | | 4,486,952 |
Largan Precision Co. Ltd. | 508,000 | | 35,631,002 |
MediaTek, Inc. | 4,543,100 | | 64,787,739 |
Pegatron Corp. | 12,151,000 | | 22,110,608 |
Radiant Opto-Electronics Corp. | 4,713,000 | | 16,443,005 |
Taiwan Fertilizer Co. Ltd. | 18,672,300 | | 33,075,115 |
Taiwan Semiconductor Manufacturing Co. Ltd. | 58,406,284 | | 252,789,009 |
Taiwan Semiconductor Manufacturing Co. Ltd. sponsored ADR | 1,257,501 | | 27,690,172 |
Unified-President Enterprises Corp. | 46,536,637 | | 79,894,464 |
Universal Cement Corp. | 15,886,980 | | 13,963,357 |
Vanguard International Semiconductor Corp. | 10,244,000 | | 15,366,367 |
Voltronic Power Technology Corp. | 3,250 | | 26,206 |
TOTAL TAIWAN | | 789,381,874 |
Thailand - 1.3% |
Kasikornbank PCL (For. Reg.) | 9,277,300 | | 67,193,240 |
Intouch Holdings PCL NVDR | 12,570,200 | | 28,538,277 |
Thai Union Frozen Products PCL (For. Reg.) | 15,478,100 | | 35,391,308 |
TOTAL THAILAND | | 131,122,825 |
Turkey - 1.9% |
Aksa Akrilik Kimya Sanayii | 311,300 | | 1,023,824 |
Aselsan A/S | 2,975,261 | | 13,519,959 |
Aygaz A/S | 3,627,611 | | 15,292,878 |
Tupras Turkiye Petrol Rafinelleri A/S | 1,972,096 | | 42,810,893 |
Turkcell Iletisim Hizmet A/S (a) | 824,000 | | 4,790,136 |
Turkcell Iletisim Hizmet A/S sponsored ADR (a) | 2,291,100 | | 33,518,793 |
Turkiye Garanti Bankasi A/S | 13,018,700 | | 50,810,598 |
Turkiye Halk Bankasi A/S | 4,021,500 | | 26,868,502 |
TOTAL TURKEY | | 188,635,583 |
United Arab Emirates - 0.5% |
DP World Ltd. | 771,214 | | 14,776,460 |
First Gulf Bank PJSC | 6,584,559 | | 32,537,366 |
TOTAL UNITED ARAB EMIRATES | | 47,313,826 |
United Kingdom - 0.0% |
China Pacific Insurance Group Co. Ltd. ELS (UBS Warrant Programme) warrants 6/29/15 (a)(f) | 1,038,500 | | 3,440,274 |
Common Stocks - continued |
| Shares | | Value |
United States of America - 0.2% |
Cognizant Technology Solutions Corp. Class A (a) | 475,672 | | $ 23,236,577 |
TOTAL COMMON STOCKS (Cost $7,553,684,019) |
8,600,995,068
|
Nonconvertible Preferred Stocks - 8.1% |
| | | |
Brazil - 5.8% |
Ambev SA sponsored ADR | 7,400,400 | | 49,434,672 |
Banco do Estado Rio Grande do Sul SA | 8,901,471 | | 53,166,702 |
Braskem SA (PN-A) | 4,863,300 | | 35,583,207 |
Companhia Paranaense de Energia-Copel: | | | |
(PN-B) | 130,000 | | 1,815,771 |
(PN-B) sponsored (d) | 1,110,057 | | 15,651,804 |
Gerdau SA sponsored ADR | 7,944,200 | | 35,987,226 |
Itau Unibanco Holding SA sponsored ADR | 9,274,606 | | 136,893,185 |
Marcopolo SA (PN) | 13,118,500 | | 22,447,411 |
Petroleo Brasileiro SA - Petrobras: | | | |
(PN) sponsored (non-vtg.) | 424,600 | | 5,192,858 |
sponsored ADR (d) | 8,054,992 | | 94,243,406 |
TIM Participacoes SA sponsored ADR | 960,700 | | 26,438,464 |
Vale SA (PN-A) sponsored ADR | 12,474,200 | | 109,273,992 |
TOTAL BRAZIL | | 586,128,698 |
Chile - 0.2% |
Embotelladora Andina SA Class A | 6,300,442 | | 16,150,207 |
Korea (South) - 1.8% |
Hyundai Motor Co. Series 2 | 450,796 | | 53,703,901 |
Samsung Electronics Co. Ltd. | 70,835 | | 64,938,154 |
Samsung Fire & Marine Insurance Co. Ltd. | 331,286 | | 62,437,272 |
TOTAL KOREA (SOUTH) | | 181,079,327 |
Russia - 0.3% |
Surgutneftegas (a) | 42,027,350 | | 28,820,960 |
TOTAL NONCONVERTIBLE PREFERRED STOCKS (Cost $891,602,933) |
812,179,192
|
Government Obligations - 0.3% |
| Principal Amount | | Value |
United States of America - 0.3% |
U.S. Treasury Bills, yield at date of purchase 0.01% to 0.03% 11/6/14 to 1/15/15 (g)
(Cost $25,329,564) | | $ 25,330,000 | | $ 25,329,876 |
Money Market Funds - 7.8% |
| Shares | | |
Fidelity Cash Central Fund, 0.11% (b) | 680,604,584 | | 680,604,584 |
Fidelity Securities Lending Cash Central Fund, 0.11% (b)(c) | 108,065,931 | | 108,065,931 |
TOTAL MONEY MARKET FUNDS (Cost $788,670,515) |
788,670,515
|
TOTAL INVESTMENT PORTFOLIO - 101.8% (Cost $9,259,287,031) | | 10,227,174,651 |
NET OTHER ASSETS (LIABILITIES) - (1.8)% | | (181,249,600) |
NET ASSETS - 100% | $ 10,045,925,051 |
Futures Contracts |
| Expiration Date | | Underlying
Face Amount
at Value | | Unrealized Appreciation/
(Depreciation) |
Purchased |
Equity Index Contracts |
6,167 NYSE E-mini MSCI EAFE Index Contracts (United States) | Dec. 2014 | | $ 312,543,560 | | $ 8,051,246 |
|
The face value of futures purchased as a percentage of net assets is 3.1% |
Security Type Abbreviations |
ELS | - | Equity-Linked Security |
Legend |
(a) Non-income producing |
(b) Affiliated fund that is generally available only to investment companies and other accounts managed by Fidelity Investments. The rate quoted is the annualized seven-day yield of the fund at period end. A complete unaudited listing of the fund's holdings as of its most recent quarter end is available upon request. In addition, each Fidelity Central Fund's financial statements, which are not covered by the Fund's Report of Independent Registered Public Accounting Firm, are available on the SEC's website or upon request. |
(c) Investment made with cash collateral received from securities on loan. |
(d) Security or a portion of the security is on loan at period end. |
(e) Affiliated company |
(f) Security exempt from registration under Rule 144A of the Securities Act of 1933. These securities may be resold in transactions exempt from registration, normally to qualified institutional buyers. At the end of the period, the value of these securities amounted to $19,732,544 or 0.2% of net assets. |
(g) Security or a portion of the security was pledged to cover margin requirements for futures contracts. At period end, the value of securities pledged amounted to $13,484,905. |
Affiliated Central Funds |
Information regarding fiscal year to date income earned by the Fund from investments in Fidelity Central Funds is as follows: |
Fund | Income earned |
Fidelity Cash Central Fund | $ 292,774 |
Fidelity Securities Lending Cash Central Fund | 1,617,498 |
Total | $ 1,910,272 |
Other Affiliated Issuers |
An affiliated company is a company in which the Fund has ownership of at least 5% of the voting securities. Fiscal year to date transactions with companies which are or were affiliates are as follows: |
Affiliate | Value, beginning of period | Purchases | Sales
Proceeds | Dividend Income | Value,
end of
period |
58.com, Inc. ADR | $ 822,492 | $ 40,173,286 | $ 22,590,259 | $ - | $ - |
Daou Technology, Inc. | 16,429,478 | 1,974,748 | 17,499,599 | 138,157 | - |
ElectroMagnetic GeoServices ASA | 9,388,983 | 6,793,265 | 12,556,712 | - | - |
Affiliate | Value, beginning of period | Purchases | Sales
Proceeds | Dividend Income | Value,
end of
period |
GP Investments Ltd. Class A (depositary receipt) | $ 19,319,221 | $ 2,863,651 | $ 1,754,508 | $ - | $ 23,311,870 |
Korean Reinsurance Co. | 31,553,914 | 24,402,666 | - | 411,974 | - |
Minerva SA | - | 46,979,838 | 533,456 | - | 50,188,557 |
PT Bakrieland Development Tbk | 9,799,068 | - | 753,444 | - | - |
SREI Infrastructure Finance Ltd. | 14,720,963 | 1,080,445 | - | 394,699 | 36,691,182 |
T4F Entretenimento SA | - | 10,481,211 | 257,508 | - | 5,103,986 |
Veripos | 14,258,599 | - | 16,055,355 | - | - |
Xueda Education Group sponsored ADR | 13,792,358 | 2,858,950 | 6,569,674 | 558,416 | - |
Total | $ 130,085,076 | $ 137,608,060 | $ 78,570,515 | $ 1,503,246 | $ 115,295,595 |
Other Information |
Categorizations in the Schedule of Investments are based on country or territory of incorporation. |
The following is a summary of the inputs used, as of October 31, 2014, involving the Fund's assets and liabilities carried at fair value. The inputs or methodology used for valuing securities may not be an indication of the risk associated with investing in those securities. For more information on valuation inputs, and their aggregation into the levels used in the tables below, please refer to the Investment Valuation section in the accompanying Notes to Financial Statements. |
Valuation Inputs at Reporting Date: |
Description | Total | Level 1 | Level 2 | Level 3 |
Investments in Securities: | | | | |
Equities: | | | | |
Consumer Discretionary | $ 834,374,072 | $ 635,034,528 | $ 199,339,544 | $ - |
Consumer Staples | 806,619,671 | 378,580,828 | 428,038,843 | - |
Energy | 903,464,170 | 556,345,097 | 347,119,073 | - |
Financials | 2,579,929,620 | 1,321,800,557 | 1,258,129,063 | - |
Health Care | 209,192,214 | 122,003,278 | 87,188,936 | - |
Valuation Inputs at Reporting Date: |
Description | Total | Level 1 | Level 2 | Level 3 |
Investments in Securities: | | | | |
Equities: | | | | |
Industrials | $ 720,560,695 | $ 476,813,084 | $ 243,747,611 | $ - |
Information Technology | 1,737,446,713 | 723,941,028 | 1,013,505,685 | - |
Materials | 726,709,770 | 436,133,008 | 290,576,762 | - |
Telecommunication Services | 638,835,202 | 378,856,737 | 259,978,465 | - |
Utilities | 256,042,133 | 90,260,802 | 165,781,331 | - |
Government Obligations | 25,329,876 | - | 25,329,876 | - |
Money Market Funds | 788,670,515 | 788,670,515 | - | - |
Total Investments in Securities: | $ 10,227,174,651 | $ 5,908,439,462 | $ 4,318,735,189 | $ - |
Derivative Instruments: | | | | |
Assets | | | | |
Futures Contracts | $ 8,051,246 | $ 8,051,246 | $ - | $ - |
The following is a summary of transfers between Level 1 and Level 2 for the period ended October 31, 2014. Transfers are assumed to have occurred at the beginning of the period, and are primarily attributable to the valuation techniques used for foreign equity securities, as discussed in the accompanying Notes to Financial Statements: |
Transfers | Total |
Level 1 to Level 2 | $ 1,545,631,973 |
Level 2 to Level 1 | $ 0 |
Value of Derivative Instruments |
The following table is a summary of the Fund's value of derivative instruments by primary risk exposure as of October 31, 2014. For additional information on derivative instruments, please refer to the Derivative Instruments section in the accompanying Notes to Financial Statements. |
Primary Risk Exposure /
Derivative Type | Value |
| Asset | Liability |
Equity Risk | | |
Futures Contracts (a) | $ 8,051,246 | $ - |
Total Value of Derivatives | $ 8,051,246 | $ - |
(a) Reflects gross cumulative appreciation (depreciation) on futures contracts as presented in the Schedule of Investments. Only the period end receivable or payable for daily variation margin and net unrealized appreciation (depreciation) are presented in the Statement of Assets and Liabilities. |
See accompanying notes which are an integral part of the financial statements.
Annual Report
Fidelity Series Emerging Markets Fund
Statement of Assets and Liabilities
| October 31, 2014 |
| | |
Assets | | |
Investment in securities, at value (including securities loaned of $105,979,714) - See accompanying schedule: Unaffiliated issuers (cost $8,346,129,790) | $ 9,323,208,541 | |
Fidelity Central Funds (cost $788,670,515) | 788,670,515 | |
Other affiliated issuers (cost $124,486,726) | 115,295,595 | |
Total Investments (cost $9,259,287,031) | | $ 10,227,174,651 |
Foreign currency held at value (cost $21,503,327) | | 21,239,691 |
Receivable for investments sold | | 60,676,930 |
Receivable for fund shares sold | | 9,110,471 |
Dividends receivable | | 10,247,360 |
Distributions receivable from Fidelity Central Funds | | 162,106 |
Receivable for daily variation margin for derivative instruments | | 1,172,647 |
Prepaid expenses | | 27,124 |
Other receivables | | 1,681,553 |
Total assets | | 10,331,492,533 |
| | |
Liabilities | | |
Payable to custodian bank | $ 358,283 | |
Payable for investments purchased | 150,221,487 | |
Accrued management fee | 6,444,613 | |
Other affiliated payables | 796,513 | |
Other payables and accrued expenses | 19,680,655 | |
Collateral on securities loaned, at value | 108,065,931 | |
Total liabilities | | 285,567,482 |
| | |
Net Assets | | $ 10,045,925,051 |
Net Assets consist of: | | |
Paid in capital | | $ 9,285,650,592 |
Undistributed net investment income | | 76,236,490 |
Accumulated undistributed net realized gain (loss) on investments and foreign currency transactions | | (272,821,288) |
Net unrealized appreciation (depreciation) on investments and assets and liabilities in foreign currencies | | 956,859,257 |
Net Assets | | $ 10,045,925,051 |
See accompanying notes which are an integral part of the financial statements.
Annual Report
Fidelity Series Emerging Markets Fund
Financial Statements - continued
Statement of Assets and Liabilities - continued
| October 31, 2014 |
| | |
Series Emerging Markets:
Net Asset Value, offering price and redemption price per share ($4,837,496,542 ÷ 272,178,257 shares) | | $ 17.77 |
| | |
Class F:
Net Asset Value, offering price and redemption price per share ($5,208,428,509 ÷ 292,040,422 shares) | | $ 17.83 |
See accompanying notes which are an integral part of the financial statements.
Annual Report
Statement of Operations
| Year ended October 31, 2014 |
| | |
Investment Income | | |
Dividends (including $1,503,246 earned from other affiliated issuers) | | $ 211,397,822 |
Interest | | 2,627 |
Income from Fidelity Central Funds | | 1,910,272 |
Income before foreign taxes withheld | | 213,310,721 |
Less foreign taxes withheld | | (23,791,082) |
Total income | | 189,519,639 |
| | |
Expenses | | |
Management fee | $ 67,589,600 | |
Transfer agent fees | 7,114,834 | |
Accounting and security lending fees | 1,734,681 | |
Custodian fees and expenses | 5,617,577 | |
Independent trustees' compensation | 33,499 | |
Audit | 111,464 | |
Legal | 25,934 | |
Miscellaneous | 53,475 | |
Total expenses before reductions | 82,281,064 | |
Expense reductions | (60,750) | 82,220,314 |
Net investment income (loss) | | 107,299,325 |
Realized and Unrealized Gain (Loss) Net realized gain (loss) on: | | |
Investment securities: | | |
Unaffiliated issuers (net of foreign taxes of $1,276,364) | 139,222,548 | |
Other affiliated issuers | (22,632,715) | |
Foreign currency transactions | (35,095,754) | |
Futures contracts | (33,204,989) | |
Total net realized gain (loss) | | 48,289,090 |
Change in net unrealized appreciation (depreciation) on: Investment securities (net of increase in deferred foreign taxes of $17,811,336) | (21,764,433) | |
Assets and liabilities in foreign currencies | (598,237) | |
Futures contracts | 8,302,316 | |
Total change in net unrealized appreciation (depreciation) | | (14,060,354) |
Net gain (loss) | | 34,228,736 |
Net increase (decrease) in net assets resulting from operations | | $ 141,528,061 |
See accompanying notes which are an integral part of the financial statements.
Annual Report
Fidelity Series Emerging Markets Fund
Financial Statements - continued
Statement of Changes in Net Assets
| Year ended
October 31,
2014 | Year ended
October 31,
2013 |
Increase (Decrease) in Net Assets | | |
Operations | | |
Net investment income (loss) | $ 107,299,325 | $ 79,721,292 |
Net realized gain (loss) | 48,289,090 | (8,006,691) |
Change in net unrealized appreciation (depreciation) | (14,060,354) | 533,280,529 |
Net increase (decrease) in net assets resulting from operations | 141,528,061 | 604,995,130 |
Distributions to shareholders from net investment income | (82,603,080) | (83,765,985) |
Distributions to shareholders from net realized gain | (2,770,030) | (3,180,768) |
Total distributions | (85,373,110) | (86,946,753) |
Share transactions - net increase (decrease) | 2,875,521,339 | 842,777,045 |
Total increase (decrease) in net assets | 2,931,676,290 | 1,360,825,422 |
| | |
Net Assets | | |
Beginning of period | 7,114,248,761 | 5,753,423,339 |
End of period (including undistributed net investment income of $76,236,490 and undistributed net investment income of $69,317,447, respectively) | $ 10,045,925,051 | $ 7,114,248,761 |
See accompanying notes which are an integral part of the financial statements.
Annual Report
Financial Highlights - Series Emerging Markets
Years ended October 31, | 2014 | 2013 | 2012 | 2011 | 2010 |
Selected Per-Share Data | | | | | |
Net asset value, beginning of period | $ 17.56 | $ 16.25 | $ 16.06 | $ 18.85 | $ 16.38 |
Income from Investment Operations | | | | | |
Net investment income (loss) B | .21 | .20 | .21 | .18 | .15 |
Net realized and unrealized gain (loss) | .17 | 1.34 | .59 | (2.19) | 4.03 |
Total from investment operations | .38 | 1.54 | .80 | (2.01) | 4.18 |
Distributions from net investment income | (.17) | (.22) | (.09) | (.10) | (.09) |
Distributions from net realized gain | (.01) | (.01) | (.52) | (.68) | (1.62) |
Total distributions | (.17) F | (.23) | (.61) | (.78) | (1.71) |
Net asset value, end of period | $ 17.77 | $ 17.56 | $ 16.25 | $ 16.06 | $ 18.85 |
Total ReturnA | 2.20% | 9.59% | 5.40% | (11.26)% | 27.32% |
Ratios to Average Net Assets C, E | | | | | |
Expenses before reductions | 1.06% | 1.09% | 1.10% | 1.12% | 1.15% |
Expenses net of fee waivers, if any | 1.06% | 1.09% | 1.10% | 1.12% | 1.15% |
Expenses net of all reductions | 1.06% | 1.06% | 1.07% | 1.07% | 1.08% |
Net investment income (loss) | 1.18% | 1.22% | 1.37% | 1.00% | .89% |
Supplemental Data | | | | | |
Net assets, end of period (000 omitted) | $ 4,837,497 | $ 3,623,928 | $ 3,182,644 | $ 3,384,616 | $ 2,425,249 |
Portfolio turnover rateD | 93% | 79% | 80% | 104% | 92% |
A Total returns would have been lower if certain expenses had not been reduced during the applicable periods shown.
B Calculated based on average shares outstanding during the period.
C Fees and expenses of any underlying Fidelity Central Funds are not included in the Fund's expense ratio. The Fund indirectly bears its proportionate share of the expenses of any underlying Fidelity Central Funds.
D Amount does not include the portfolio activity of any underlying Fidelity Central Funds.
E Expense ratios reflect operating expenses of the class. Expenses before reductions do not reflect amounts reimbursed by the investment adviser or reductions from brokerage service arrangements or reductions from other expense offset arrangements and do not represent the amount paid by the class during periods when reimbursements or reductions occur. Expenses net of fee waivers reflect expenses after reimbursement by the investment adviser but prior to reductions from brokerage service arrangements or other expense offset arrangements. Expenses net of all reductions represent the net expenses paid by the class.
F Total distributions of $.17 per share is comprised of distributions from net investment income of $.166 and distributions from net realized gain of $.006 per share.
See accompanying notes which are an integral part of the financial statements.
Annual Report
Financial Highlights - Class F
Years ended October 31, | 2014 | 2013 | 2012 | 2011 | 2010 |
Selected Per-Share Data | | | | | |
Net asset value, beginning of period | $ 17.62 | $ 16.30 | $ 16.11 | $ 18.90 | $ 16.40 |
Income from Investment Operations | | | | | |
Net investment income (loss) B | .24 | .23 | .25 | .21 | .19 |
Net realized and unrealized gain (loss) | .17 | 1.35 | .58 | (2.19) | 4.03 |
Total from investment operations | .41 | 1.58 | .83 | (1.98) | 4.22 |
Distributions from net investment income | (.19) | (.26) | (.12) | (.13) | (.10) |
Distributions from net realized gain | (.01) | (.01) | (.52) | (.68) | (1.62) |
Total distributions | (.20) | (.26) F | (.64) | (.81) | (1.72) |
Net asset value, end of period | $ 17.83 | $ 17.62 | $ 16.30 | $ 16.11 | $ 18.90 |
Total ReturnA | 2.35% | 9.84% | 5.60% | (11.07)% | 27.59% |
Ratios to Average Net Assets C, E | | | | | |
Expenses before reductions | .89% | .90% | .90% | .91% | .92% |
Expenses net of fee waivers, if any | .89% | .90% | .90% | .91% | .92% |
Expenses net of all reductions | .89% | .88% | .87% | .86% | .85% |
Net investment income (loss) | 1.35% | 1.40% | 1.57% | 1.21% | 1.13% |
Supplemental Data | | | | | |
Net assets, end of period (000 omitted) | $ 5,208,429 | $ 3,490,320 | $ 2,570,780 | $ 1,471,427 | $ 454,160 |
Portfolio turnover rateD | 93% | 79% | 80% | 104% | 92% |
A Total returns would have been lower if certain expenses had not been reduced during the applicable periods shown.
B Calculated based on average shares outstanding during the period.
C Fees and expenses of any underlying Fidelity Central Funds are not included in the Fund's expense ratio. The Fund indirectly bears its proportionate share of the expenses of any underlying Fidelity Central Funds.
D Amount does not include the portfolio activity of any underlying Fidelity Central Funds.
E Expense ratios reflect operating expenses of the class. Expenses before reductions do not reflect amounts reimbursed by the investment adviser or reductions from brokerage service arrangements or reductions from other expense offset arrangements and do not represent the amount paid by the class during periods when reimbursements or reductions occur. Expenses net of fee waivers reflect expenses after reimbursement by the investment adviser but prior to reductions from brokerage service arrangements or other expense offset arrangements. Expenses net of all reductions represent the net expenses paid by the class.
F Total distributions of $.26 per share is comprised of distributions from net investment income of $.255 and distributions from net realized gain of $.009 per share.
See accompanying notes which are an integral part of the financial statements.
Annual Report
Fidelity Series International Growth Fund
Average annual total return reflects the change in the value of an investment, assuming reinvestment of the class' distributions from dividend income and capital gains (the profits earned upon the sale of securities that have grown in value, if any) and assuming a constant rate of performance each year. The $10,000 table and the fund's returns do not reflect the deduction of taxes that a shareholder would pay on fund distributions or the redemption of fund shares. During periods of reimbursement by Fidelity, a fund's total return will be greater than it would be had the reimbursement not occurred. How a fund did yesterday is no guarantee of how it will do tomorrow.
Average Annual Total Returns
Periods ended October 31, 2014 | Past 1
year | Life of
fund A |
Fidelity Series International Growth Fund | 2.66% | 8.32% |
Class F | 2.80% | 8.52% |
A From December 3, 2009.
$10,000 Over Life of Fund
Let's say hypothetically that $10,000 was invested in Fidelity Series International Growth Fund, a class of the fund, on December 3, 2009, when the fund started. The chart shows how the value of your investment would have changed, and also shows how the MSCI EAFE Growth Index performed over the same period.
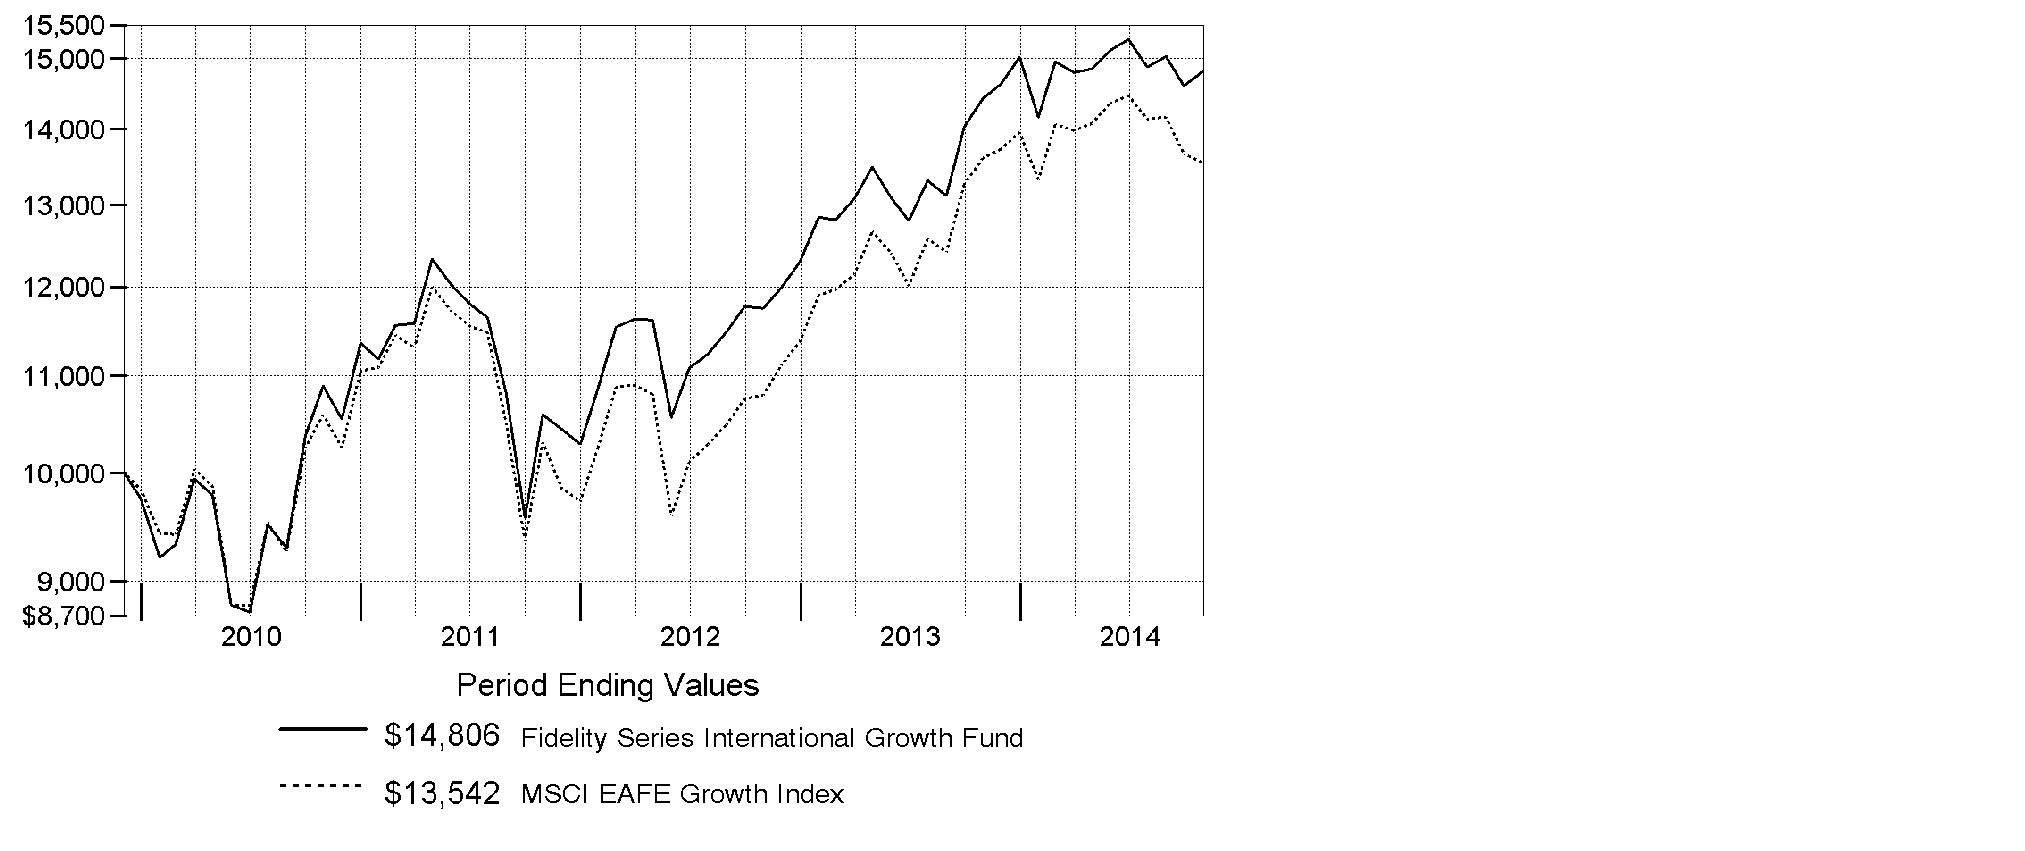
Annual Report
Fidelity Series International Growth Fund
Market Recap: Global equities posted a healthy gain for the 12 months ending October 31, 2014, overcoming an October market decline driven by recessionary pressures in China and tepid growth in Europe. The MSCI ACWI (All Country World Index) Index rose 8.15%, helped by subdued market volatility for much of the period and supported by solid corporate earnings, especially in the United States. Stocks also benefited from easy monetary policies in Japan and the eurozone, as well as increased stimulus efforts in China. All but three of the 24 industry groups that compose the index marked a positive return. The U.S. (+17%) remained a pillar of strength, while a strongly rising dollar in the latter part of the period detracted from investors' returns in most non-U.S. markets. Canada (+5%) notched broad gains outside of its energy and materials sectors, as did Asia-Pacific ex Japan (+4%), led by investor enthusiasm for companies in India. The U.K., Europe and Japan, meanwhile, all underperformed. Among sectors, health care (+24%) led the index, with a strong contribution from the pharmaceuticals, biotechnology & life sciences industry. Information technology (+21%) also outperformed. Conversely, materials (-4%) and energy (-1%) lagged the index due to a higher supply of and lower demand for commodities.
Comments from Jed Weiss, Portfolio Manager of Fidelity® Series International Growth Fund: For the year ending October 31, 2014, the fund's Series International Growth and Class F shares gained 2.66% and 2.80%, respectively, ahead of the MSCI EAFE Growth Index, which returned -0.51%. The fund benefited from its positioning in the U.S. - where some fund holdings happen to be domiciled while doing most or all of their business abroad - and also a beneficial underweighting in Europe. My stance in Japan was a modest negative. On an individual basis, U.K.-based hotel company InterContinental Hotels Group was the fund's top individual contributor. I continued to like this stock for its strong operations and ability to benefit from a cyclically improving hotel business, especially in the U.S. Visa and MasterCard, two U.S.-based payment-processing software companies not found in the index, also were significant contributors. One notable laggard was Andritz, an Austrian industrial engineering firm with a dominant competitive position in several industries. The value of our stake fell 21% for the 12 months, most likely because of investors' concerns about a slowing global economy. Another disappointment was Nokian Tyres, a Finland-based tire manufacturer that encountered a difficult business environment. I ultimately sold the fund's stake in search of other opportunities.
The views expressed above reflect those of the portfolio manager(s) only through the end of the period as stated on the cover of this report and do not necessarily represent the views of Fidelity or any other person in the Fidelity organization. Any such views are subject to change at any time based upon market or other conditions and Fidelity disclaims any responsibility to update such views. These views may not be relied on as investment advice and, because investment decisions for a Fidelity fund are based on numerous factors, may not be relied on as an indication of trading intent on behalf of any Fidelity fund.
Annual Report
Fidelity Series International Growth Fund
Investment Changes (Unaudited)
Geographic Diversification (% of fund's net assets) |
As of October 31, 2014 |
| United States of America* 16.8% | |
| United Kingdom 16.0% | |
| Japan 15.0% | |
| Switzerland 12.5% | |
| Sweden 5.4% | |
| Germany 4.6% | |
| Belgium 4.5% | |
| Australia 3.6% | |
| Cayman Islands 3.0% | |
| Other 18.6% | |

* Includes Short-Term Investments and Net Other Assets (Liabilities). |
Percentages are based on country or territory of incorporation and are adjusted for the effect of futures contracts, if applicable. |
As of April 30, 2014 |
| United States of America* 16.3% | |
| United Kingdom 14.9% | |
| Japan 14.5% | |
| Switzerland 13.4% | |
| Sweden 6.5% | |
| Belgium 5.0% | |
| Germany 4.2% | |
| Australia 3.1% | |
| Denmark 3.0% | |
| Other 19.1% | |

* Includes Short-Term Investments and Net Other Assets (Liabilities). |
Percentages are based on country or territory of incorporation and are adjusted for the effect of futures contracts, if applicable. |
Asset Allocation as of October 31, 2014 |
| % of fund's
net assets | % of fund's net assets
6 months ago |
Stocks | 98.9 | 98.3 |
Short-Term Investments and Net Other Assets (Liabilities) | 1.1 | 1.7 |
Top Ten Stocks as of October 31, 2014 |
| % of fund's
net assets | % of fund's net assets
6 months ago |
Roche Holding AG (participation certificate) (Switzerland, Pharmaceuticals) | 4.5 | 4.1 |
Nestle SA (Switzerland, Food Products) | 3.7 | 3.7 |
Prudential PLC (United Kingdom, Insurance) | 3.1 | 2.9 |
Anheuser-Busch InBev SA NV (Belgium, Beverages) | 2.9 | 3.6 |
DENSO Corp. (Japan, Auto Components) | 2.8 | 2.7 |
Linde AG (Germany, Chemicals) | 2.5 | 2.6 |
CSL Ltd. (Australia, Biotechnology) | 2.3 | 2.1 |
Reckitt Benckiser Group PLC (United Kingdom, Household Products) | 2.3 | 2.1 |
Novo Nordisk A/S Series B sponsored ADR (Denmark, Pharmaceuticals) | 2.3 | 2.5 |
Keyence Corp. (Japan, Electronic Equipment & Components) | 2.2 | 1.8 |
| 28.6 | |
Market Sectors as of October 31, 2014 |
| % of fund's
net assets | % of fund's net assets
6 months ago |
Consumer Discretionary | 16.8 | 17.8 |
Health Care | 16.4 | 12.3 |
Financials | 15.9 | 16.2 |
Consumer Staples | 15.0 | 16.4 |
Industrials | 14.7 | 14.9 |
Information Technology | 9.9 | 7.9 |
Materials | 7.5 | 8.3 |
Energy | 2.2 | 2.4 |
Telecommunication Services | 0.5 | 2.1 |
Annual Report
Fidelity Series International Growth Fund
Investments October 31, 2014
Showing Percentage of Net Assets
Common Stocks - 98.9% |
| Shares | | Value |
Australia - 3.6% |
CSL Ltd. | 4,166,100 | | $ 294,138,858 |
Sydney Airport unit | 18,304,467 | | 71,162,902 |
Transurban Group unit | 12,771,255 | | 91,466,533 |
TOTAL AUSTRALIA | | 456,768,293 |
Austria - 1.0% |
Andritz AG | 2,622,198 | | 126,577,006 |
Bailiwick of Jersey - 1.0% |
Shire PLC | 1,881,600 | | 126,249,581 |
Belgium - 4.5% |
Anheuser-Busch InBev SA NV | 3,313,281 | | 367,424,315 |
KBC Groupe SA (a) | 3,654,019 | | 195,753,699 |
TOTAL BELGIUM | | 563,178,014 |
Bermuda - 0.6% |
Lazard Ltd. Class A | 1,427,548 | | 70,249,637 |
Canada - 0.7% |
Canadian Pacific Railway Ltd. | 450,600 | | 93,726,239 |
Cayman Islands - 3.0% |
Sands China Ltd. | 24,482,400 | | 152,699,444 |
Tencent Holdings Ltd. | 5,495,850 | | 88,330,801 |
Wynn Macau Ltd. | 37,168,200 | | 134,367,034 |
TOTAL CAYMAN ISLANDS | | 375,397,279 |
Denmark - 2.9% |
Jyske Bank A/S (Reg.) (a) | 1,401,400 | | 75,502,652 |
Novo Nordisk A/S Series B sponsored ADR | 6,359,281 | | 287,312,316 |
TOTAL DENMARK | | 362,814,968 |
Finland - 0.3% |
Tikkurila Oyj | 1,550,679 | | 32,024,486 |
France - 1.0% |
Safran SA | 2,039,186 | | 129,047,999 |
Germany - 4.6% |
Bayer AG | 1,833,900 | | 260,725,319 |
Linde AG | 1,747,819 | | 322,299,610 |
TOTAL GERMANY | | 583,024,929 |
India - 0.5% |
Housing Development Finance Corp. Ltd. | 3,156,031 | | 56,837,710 |
Common Stocks - continued |
| Shares | | Value |
Ireland - 2.3% |
CRH PLC sponsored ADR | 6,015,505 | | $ 134,807,467 |
James Hardie Industries PLC CDI | 14,466,311 | | 154,306,994 |
TOTAL IRELAND | | 289,114,461 |
Israel - 0.3% |
Azrieli Group | 1,019,186 | | 32,717,360 |
Italy - 0.6% |
Azimut Holding SpA | 1,569,606 | | 36,663,981 |
Interpump Group SpA | 3,015,349 | | 39,298,320 |
TOTAL ITALY | | 75,962,301 |
Japan - 15.0% |
Aozora Bank Ltd. | 17,523,000 | | 61,591,747 |
Astellas Pharma, Inc. | 11,010,400 | | 170,886,880 |
Coca-Cola Central Japan Co. Ltd. | 2,233,000 | | 40,178,511 |
DENSO Corp. | 7,755,400 | | 355,458,081 |
East Japan Railway Co. | 928,100 | | 72,487,613 |
Fanuc Corp. | 702,200 | | 123,752,762 |
Fast Retailing Co. Ltd. | 380,100 | | 141,305,039 |
Japan Tobacco, Inc. | 1,964,600 | | 67,030,295 |
Keyence Corp. | 580,100 | | 281,106,414 |
Mitsui Fudosan Co. Ltd. | 6,020,000 | | 193,641,970 |
Seven Bank Ltd. | 21,420,700 | | 89,461,436 |
SHO-BOND Holdings Co. Ltd. (e) | 1,672,600 | | 64,629,702 |
USS Co. Ltd. | 11,116,900 | | 174,957,759 |
Yamato Kogyo Co. Ltd. | 1,937,700 | | 62,771,751 |
TOTAL JAPAN | | 1,899,259,960 |
Kenya - 0.1% |
Safaricom Ltd. | 44,000,000 | | 6,001,118 |
Korea (South) - 0.5% |
NAVER Corp. | 88,261 | | 61,937,832 |
Mexico - 0.5% |
Fomento Economico Mexicano S.A.B. de CV sponsored ADR | 618,112 | | 59,487,099 |
Netherlands - 1.6% |
ING Groep NV (Certificaten Van Aandelen) (a) | 14,527,104 | | 208,033,394 |
South Africa - 1.6% |
Clicks Group Ltd. | 9,027,484 | | 61,466,855 |
Common Stocks - continued |
| Shares | | Value |
South Africa - continued |
MTN Group Ltd. | 2,333,700 | | $ 51,626,084 |
Naspers Ltd. Class N | 720,510 | | 89,666,660 |
TOTAL SOUTH AFRICA | | 202,759,599 |
Spain - 2.1% |
Inditex SA (d) | 8,325,360 | | 233,854,011 |
Prosegur Compania de Seguridad SA (Reg.) | 6,021,389 | | 35,313,893 |
TOTAL SPAIN | | 269,167,904 |
Sweden - 5.4% |
ASSA ABLOY AB (B Shares) | 4,136,139 | | 219,069,759 |
Atlas Copco AB (A Shares) (d) | 4,630,932 | | 133,644,578 |
H&M Hennes & Mauritz AB (B Shares) | 3,687,901 | | 146,683,982 |
Intrum Justitia AB | 1,499,000 | | 44,538,721 |
Svenska Handelsbanken AB (A Shares) | 2,969,871 | | 141,612,993 |
TOTAL SWEDEN | | 685,550,033 |
Switzerland - 12.5% |
Nestle SA | 6,445,886 | | 472,703,503 |
Novartis AG | 1,893,505 | | 175,722,704 |
Roche Holding AG (participation certificate) | 1,914,267 | | 564,903,323 |
Schindler Holding AG: | | | |
(participation certificate) | 688,219 | | 96,135,357 |
(Reg.) | 154,309 | | 20,881,393 |
UBS AG (NY Shares) | 14,584,413 | | 253,477,098 |
TOTAL SWITZERLAND | | 1,583,823,378 |
Taiwan - 0.4% |
Taiwan Semiconductor Manufacturing Co. Ltd. | 12,027,000 | | 52,054,218 |
Turkey - 0.6% |
Coca-Cola Icecek Sanayi A/S | 3,368,278 | | 76,832,472 |
United Kingdom - 16.0% |
Babcock International Group PLC | 5,174,861 | | 90,646,565 |
BAE Systems PLC | 9,342,200 | | 68,551,418 |
Berendsen PLC | 2,968,600 | | 47,963,581 |
BG Group PLC | 8,347,322 | | 139,116,728 |
GlaxoSmithKline PLC | 5,817,600 | | 131,559,004 |
Informa PLC | 7,561,193 | | 58,180,030 |
InterContinental Hotel Group PLC ADR (d) | 5,646,727 | | 214,632,093 |
Johnson Matthey PLC | 2,604,527 | | 123,910,575 |
Prudential PLC | 16,744,857 | | 387,744,393 |
Common Stocks - continued |
| Shares | | Value |
United Kingdom - continued |
Reckitt Benckiser Group PLC | 3,452,387 | | $ 289,946,133 |
Rolls-Royce Group PLC | 7,702,711 | | 103,874,686 |
Rotork PLC | 762,297 | | 31,156,858 |
SABMiller PLC | 4,502,736 | | 253,906,694 |
Shaftesbury PLC | 3,910,400 | | 44,789,143 |
Unite Group PLC | 5,472,383 | | 37,380,311 |
TOTAL UNITED KINGDOM | | 2,023,358,212 |
United States of America - 15.7% |
Autoliv, Inc. (d) | 1,507,727 | | 138,318,875 |
Berkshire Hathaway, Inc. Class B (a) | 685,550 | | 96,086,688 |
BorgWarner, Inc. | 3,118,514 | | 177,817,668 |
Cummins, Inc. | 699,427 | | 102,242,239 |
FMC Technologies, Inc. (a) | 1,045,645 | | 58,597,946 |
Google, Inc.: | | | |
Class A (a) | 280,197 | | 159,115,470 |
Class C (a) | 122,497 | | 68,485,623 |
Martin Marietta Materials, Inc. (d) | 957,400 | | 111,939,208 |
MasterCard, Inc. Class A | 2,308,510 | | 193,337,713 |
Mead Johnson Nutrition Co. Class A | 530,956 | | 52,729,240 |
Mohawk Industries, Inc. (a) | 734,515 | | 104,330,511 |
National Oilwell Varco, Inc. | 399,941 | | 29,051,714 |
Oceaneering International, Inc. | 761,819 | | 53,533,021 |
Philip Morris International, Inc. | 1,245,992 | | 110,905,748 |
PriceSmart, Inc. | 590,775 | | 52,596,698 |
ResMed, Inc. (d) | 915,700 | | 47,817,854 |
Solera Holdings, Inc. | 1,527,714 | | 79,364,742 |
SS&C Technologies Holdings, Inc. (a) | 1,632,844 | | 78,899,022 |
Union Pacific Corp. | 616,800 | | 71,826,360 |
Visa, Inc. Class A | 823,324 | | 198,775,113 |
TOTAL UNITED STATES OF AMERICA | | 1,985,771,453 |
TOTAL COMMON STOCKS (Cost $9,652,842,571) |
12,487,726,935
|
Nonconvertible Preferred Stocks - 0.0% |
| | | |
United Kingdom - 0.0% |
Rolls-Royce Group PLC
(Cost $1,110,716) | 693,243,990 | |
1,108,982
|
Money Market Funds - 2.6% |
| Shares | | Value |
Fidelity Cash Central Fund, 0.11% (b) | 73,990,826 | | $ 73,990,826 |
Fidelity Securities Lending Cash Central Fund, 0.11% (b)(c) | 258,704,321 | | 258,704,321 |
TOTAL MONEY MARKET FUNDS (Cost $332,695,147) |
332,695,147
|
TOTAL INVESTMENT PORTFOLIO - 101.5% (Cost $9,986,648,434) | 12,821,531,064 |
NET OTHER ASSETS (LIABILITIES) - (1.5)% | | (193,984,087) |
NET ASSETS - 100% | $ 12,627,546,977 |
Legend |
(a) Non-income producing |
(b) Affiliated fund that is generally available only to investment companies and other accounts managed by Fidelity Investments. The rate quoted is the annualized seven-day yield of the fund at period end. A complete unaudited listing of the fund's holdings as of its most recent quarter end is available upon request. In addition, each Fidelity Central Fund's financial statements, which are not covered by the Fund's Report of Independent Registered Public Accounting Firm, are available on the SEC's website or upon request. |
(c) Investment made with cash collateral received from securities on loan. |
(d) Security or a portion of the security is on loan at period end. |
(e) Affiliated company |
Affiliated Central Funds |
Information regarding fiscal year to date income earned by the Fund from investments in Fidelity Central Funds is as follows: |
Fund | Income earned |
Fidelity Cash Central Fund | $ 207,662 |
Fidelity Securities Lending Cash Central Fund | 5,257,021 |
Total | $ 5,464,683 |
Other Affiliated Issuers |
An affiliated company is a company in which the Fund has ownership of at least 5% of the voting securities. Fiscal year to date transactions with companies which are or were affiliates are as follows: |
Affiliate | Value,
beginning of
period | Purchases | Sales
Proceeds | Dividend
Income | Value,
end of
period |
SHO-BOND Holdings Co. Ltd. | $ 53,355,078 | $ 24,031,722 | $ - | $ 888,708 | $ 64,629,702 |
Total | $ 53,355,078 | $ 24,031,722 | $ - | $ 888,708 | $ 64,629,702 |
Other Information |
Categorizations in the Schedule of Investments are based on country or territory of incorporation. |
The following is a summary of the inputs used, as of October 31, 2014, involving the Fund's assets and liabilities carried at fair value. The inputs or methodology used for valuing securities may not be an indication of the risk associated with investing in those securities. For more information on valuation inputs, and their aggregation into the levels used in the tables below, please refer to the Investment Valuation section in the accompanying Notes to Financial Statements. |
Valuation Inputs at Reporting Date: |
Description | Total | Level 1 | Level 2 | Level 3 |
Investments in Securities: | | | | |
Equities: | | | | |
Consumer Discretionary | $ 2,122,271,187 | $ 1,163,483,830 | $ 958,787,357 | $ - |
Consumer Staples | 1,905,207,563 | 957,870,939 | 947,336,624 | - |
Energy | 280,299,409 | 141,182,681 | 139,116,728 | - |
Financials | 1,981,544,212 | 984,233,562 | 997,310,650 | - |
Health Care | 2,059,315,839 | 595,855,489 | 1,463,460,350 | - |
Industrials | 1,879,103,466 | 1,455,603,954 | 423,499,512 | - |
Information Technology | 1,261,406,948 | 839,915,515 | 421,491,433 | - |
Materials | 942,060,091 | 724,981,346 | 217,078,745 | - |
Telecommunication Services | 57,627,202 | 57,627,202 | - | - |
Money Market Funds | 332,695,147 | 332,695,147 | - | - |
Total Investments in Securities: | $ 12,821,531,064 | $ 7,253,449,665 | $ 5,568,081,399 | $ - |
The following is a summary of transfers between Level 1 and Level 2 for the period ended October 31, 2014. Transfers are assumed to have occurred at the beginning of the period, and are primarily attributable to the valuation techniques used for foreign equity securities, as discussed in the accompanying Notes to Financial Statements: |
Transfers | Total |
Level 1 to Level 2 | $ 1,254,071,660 |
Level 2 to Level 1 | $ 0 |
See accompanying notes which are an integral part of the financial statements.
Annual Report
Fidelity Series International Growth Fund
Statement of Assets and Liabilities
| October 31, 2014 |
| | |
Assets | | |
Investment in securities, at value (including securities loaned of $254,332,307) - See accompanying schedule: Unaffiliated issuers (cost $9,601,555,279) | $ 12,424,206,215 | |
Fidelity Central Funds (cost $332,695,147) | 332,695,147 | |
Other affiliated issuers (cost $52,398,008) | 64,629,702 | |
Total Investments (cost $9,986,648,434) | | $ 12,821,531,064 |
Foreign currency held at value (cost $64) | | 64 |
Receivable for investments sold | | 52,911,941 |
Receivable for fund shares sold | | 9,950,443 |
Dividends receivable | | 29,851,579 |
Distributions receivable from Fidelity Central Funds | | 90,871 |
Prepaid expenses | | 41,757 |
Other receivables | | 71,098 |
Total assets | | 12,914,448,817 |
| | |
Liabilities | | |
Payable for investments purchased | $ 16,509,478 | |
Payable for fund shares redeemed | 1,765,230 | |
Accrued management fee | 8,466,172 | |
Other affiliated payables | 1,037,032 | |
Other payables and accrued expenses | 419,607 | |
Collateral on securities loaned, at value | 258,704,321 | |
Total liabilities | | 286,901,840 |
| | |
Net Assets | | $ 12,627,546,977 |
Net Assets consist of: | | |
Paid in capital | | $ 9,457,841,416 |
Undistributed net investment income | | 167,671,083 |
Accumulated undistributed net realized gain (loss) on investments and foreign currency transactions | | 168,162,089 |
Net unrealized appreciation (depreciation) on investments and assets and liabilities in foreign currencies | | 2,833,872,389 |
Net Assets | | $ 12,627,546,977 |
See accompanying notes which are an integral part of the financial statements.
Annual Report
Statement of Assets and Liabilities - continued
| October 31, 2014 |
| | |
Series International Growth:
Net Asset Value, offering price and redemption price per share ($6,049,346,532 ÷ 427,021,223 shares) | | $ 14.17 |
| | |
Class F:
Net Asset Value, offering price and redemption price per share ($6,578,200,445 ÷ 462,797,101 shares) | | $ 14.21 |
See accompanying notes which are an integral part of the financial statements.
Annual Report
Fidelity Series International Growth Fund
Financial Statements - continued
Statement of Operations
| Year ended October 31, 2014 |
| | |
Investment Income | | |
Dividends (including $888,708 earned from other affiliated issuers) | | $ 306,397,754 |
Interest | | 528 |
Income from Fidelity Central Funds | | 5,464,683 |
Income before foreign taxes withheld | | 311,862,965 |
Less foreign taxes withheld | | (22,819,348) |
Total income | | 289,043,617 |
| | |
Expenses | | |
Management fee
Basic fee | $ 92,020,698 | |
Performance adjustment | 9,753,300 | |
Transfer agent fees | 11,087,250 | |
Accounting and security lending fees | 1,946,737 | |
Custodian fees and expenses | 1,202,597 | |
Independent trustees' compensation | 53,424 | |
Audit | 84,282 | |
Legal | 41,163 | |
Interest | 14,850 | |
Miscellaneous | 88,044 | |
Total expenses before reductions | 116,292,345 | |
Expense reductions | (96,567) | 116,195,778 |
Net investment income (loss) | | 172,847,839 |
Realized and Unrealized Gain (Loss) Net realized gain (loss) on: | | |
Investment securities: | | |
Unaffiliated issuers | 189,263,125 | |
Foreign currency transactions | (662,521) | |
Total net realized gain (loss) | | 188,600,604 |
Change in net unrealized appreciation (depreciation) on: Investment securities | 12,464,895 | |
Assets and liabilities in foreign currencies | (1,198,914) | |
Total change in net unrealized appreciation (depreciation) | | 11,265,981 |
Net gain (loss) | | 199,866,585 |
Net increase (decrease) in net assets resulting from operations | | $ 372,714,424 |
See accompanying notes which are an integral part of the financial statements.
Annual Report
Statement of Changes in Net Assets
| Year ended
October 31,
2014 | Year ended
October 31,
2013 |
Increase (Decrease) in Net Assets | | |
Operations | | |
Net investment income (loss) | $ 172,847,839 | $ 133,578,174 |
Net realized gain (loss) | 188,600,604 | 370,154,006 |
Change in net unrealized appreciation (depreciation) | 11,265,981 | 1,529,936,762 |
Net increase (decrease) in net assets resulting
from operations | 372,714,424 | 2,033,668,942 |
Distributions to shareholders from net investment income | (98,329,968) | (154,572,907) |
Distributions to shareholders from net realized gain | (45,984,907) | - |
Total distributions | (144,314,875) | (154,572,907) |
Share transactions - net increase (decrease) | 1,220,764,933 | 189,778,640 |
Total increase (decrease) in net assets | 1,449,164,482 | 2,068,874,675 |
| | |
Net Assets | | |
Beginning of period | 11,178,382,495 | 9,109,507,820 |
End of period (including undistributed net investment income of $167,671,083 and undistributed net investment income of $94,753,598, respectively) | $ 12,627,546,977 | $ 11,178,382,495 |
See accompanying notes which are an integral part of the financial statements.
Annual Report
Financial Highlights - Series International Growth
Years ended October 31, | 2014 | 2013 | 2012 | 2011 | 2010 G |
Selected Per-Share Data | | | | | |
Net asset value, beginning of period | $ 13.95 | $ 11.55 | $ 10.53 | $ 10.89 | $ 10.00 |
Income from Investment Operations | | | | | |
Net investment income (loss) D | .17 | .16 | .15 | .16 | .09 |
Net realized and unrealized gain (loss) | .20 | 2.43 | .99 | (.46) | .80 |
Total from investment operations | .37 | 2.59 | 1.14 | (.30) | .89 |
Distributions from net investment income | (.10) | (.19) | (.12) | (.05) | - |
Distributions from net realized gain | (.05) | - | (.01) | (.01) | - |
Total distributions | (.15) | (.19) | (.12) I | (.06) | - |
Net asset value, end of period | $ 14.17 | $ 13.95 | $ 11.55 | $ 10.53 | $ 10.89 |
Total Return B, C | 2.66% | 22.72% | 11.00% | (2.77)% | 8.90% |
Ratios to Average Net Assets E, H | | | | |
Expenses before reductions | .97% | 1.04% | 1.05% | 1.00% | 1.01% A |
Expenses net of fee waivers, if any | .97% | 1.04% | 1.05% | 1.00% | 1.01% A |
Expenses net of all reductions | .97% | 1.02% | 1.04% | .98% | .99% A |
Net investment income (loss) | 1.23% | 1.26% | 1.38% | 1.40% | 1.06% A |
Supplemental Data | | | | | |
Net assets, end of period (000 omitted) | $ 6,049,347 | $ 5,642,298 | $ 5,045,151 | $ 4,996,927 | $ 3,944,123 |
Portfolio turnover rate F | 33% | 41% | 27% | 23% | 63% A |
A Annualized
B Total returns for periods of less than one year are not annualized.
C Total returns would have been lower if certain expenses had not been reduced during the applicable periods shown.
D Calculated based on average shares outstanding during the period.
E Fees and expenses of any underlying Fidelity Central Funds are not included in the Fund's expense ratio. The Fund indirectly bears its proportionate share of the expenses of any underlying Fidelity Central Funds.
F Amount does not include the portfolio activity of any underlying Fidelity Central Funds.
G For the period December 3, 2009 (commencement of operations) to October 31, 2010.
H Expense ratios reflect operating expenses of the class. Expenses before reductions do not reflect amounts reimbursed by the investment adviser or reductions from brokerage service arrangements or reductions from other expense offset arrangements and do not represent the amount paid by the class during periods when reimbursements or reductions occur. Expense ratios before reductions for start-up periods may not be representative of longer-term operating periods. Expenses net of fee waivers reflect expenses after reimbursement by the investment adviser but prior to reductions from brokerage service arrangements or other expense offset arrangements. Expenses net of all reductions represent the net expenses paid by the class.
I Total distributions of $.12 per share is comprised of distributions from net investment income of $.115 and distributions from net realized gain of $.007 per share.
See accompanying notes which are an integral part of the financial statements.
Annual Report
Financial Highlights - Class F
Years ended October 31, | 2014 | 2013 | 2012 | 2011 | 2010 G |
Selected Per-Share Data | | | | | |
Net asset value, beginning of period | $ 13.99 | $ 11.59 | $ 10.57 | $ 10.91 | $ 10.00 |
Income from Investment Operations | | | | | |
Net investment income (loss) D | .20 | .18 | .17 | .18 | .11 |
Net realized and unrealized gain (loss) | .19 | 2.43 | 1.00 | (.45) | .80 |
Total from investment operations | .39 | 2.61 | 1.17 | (.27) | .91 |
Distributions from net investment income | (.12) | (.21) | (.14) | (.06) | - |
Distributions from net realized gain | (.05) | - | (.01) | (.01) | - |
Total distributions | (.17) | (.21) | (.15) | (.07) | - |
Net asset value, end of period | $ 14.21 | $ 13.99 | $ 11.59 | $ 10.57 | $ 10.91 |
Total Return B, C | 2.80% | 22.88% | 11.23% | (2.50)% | 9.10% |
Ratios to Average Net Assets E, H | | | | |
Expenses before reductions | .80% | .85% | .85% | .79% | .78% A |
Expenses net of fee waivers, if any | .80% | .85% | .85% | .79% | .78% A |
Expenses net of all reductions | .80% | .84% | .84% | .77% | .75% A |
Net investment income (loss) | 1.40% | 1.44% | 1.58% | 1.62% | 1.29% A |
Supplemental Data | | | | | |
Net assets, end of period (000 omitted) | $ 6,578,200 | $ 5,536,085 | $ 4,064,357 | $ 2,165,942 | $ 744,325 |
Portfolio turnover rate F | 33% | 41% | 27% | 23% | 63% A |
A Annualized
B Total returns for periods of less than one year are not annualized.
C Total returns would have been lower if certain expenses had not been reduced during the applicable periods shown.
D Calculated based on average shares outstanding during the period.
E Fees and expenses of any underlying Fidelity Central Funds are not included in the Fund's expense ratio. The Fund indirectly bears its proportionate share of the expenses of any underlying Fidelity Central Funds.
F Amount does not include the portfolio activity of any underlying Fidelity Central Funds.
G For the period December 3, 2009 (commencement of operations) to October 31, 2010.
H Expense ratios reflect operating expenses of the class. Expenses before reductions do not reflect amounts reimbursed by the investment adviser or reductions from brokerage service arrangements or reductions from other expense offset arrangements and do not represent the amount paid by the class during periods when reimbursements or reductions occur. Expense ratios before reductions for start-up periods may not be representative of longer-term operating periods. Expenses net of fee waivers reflect expenses after reimbursement by the investment adviser but prior to reductions from brokerage service arrangements or other expense offset arrangements. Expenses net of all reductions represent the net expenses paid by the class.
See accompanying notes which are an integral part of the financial statements.
Annual Report
Fidelity Series International Small Cap Fund
Average annual total return reflects the change in the value of an investment, assuming reinvestment of the class' distributions from dividend income and capital gains (the profits earned upon the sale of securities that have grown in value, if any) and assuming a constant rate of performance each year. The $10,000 table and the fund's returns do not reflect the deduction of taxes that a shareholder would pay on fund distributions or the redemption of fund shares. During periods of reimbursement by Fidelity, a fund's total return will be greater than it would be had the reimbursement not occurred. How a fund did yesterday is no guarantee of how it will do tomorrow.
Average Annual Total Returns
Periods ended October 31, 2014 | Past 1
year | Life of
fund A |
Fidelity Series International Small Cap Fund | 0.21% | 10.52% |
Class F | 0.47% | 10.75% |
A From December 3, 2009.
$10,000 Over Life of Fund
Let's say hypothetically that $10,000 was invested in Fidelity Series International Small Cap Fund, a class of the fund, on December 3, 2009, when the fund started. The chart shows how the value of your investment would have changed, and also shows how the MSCI EAFE Small Cap Index performed over the same period.
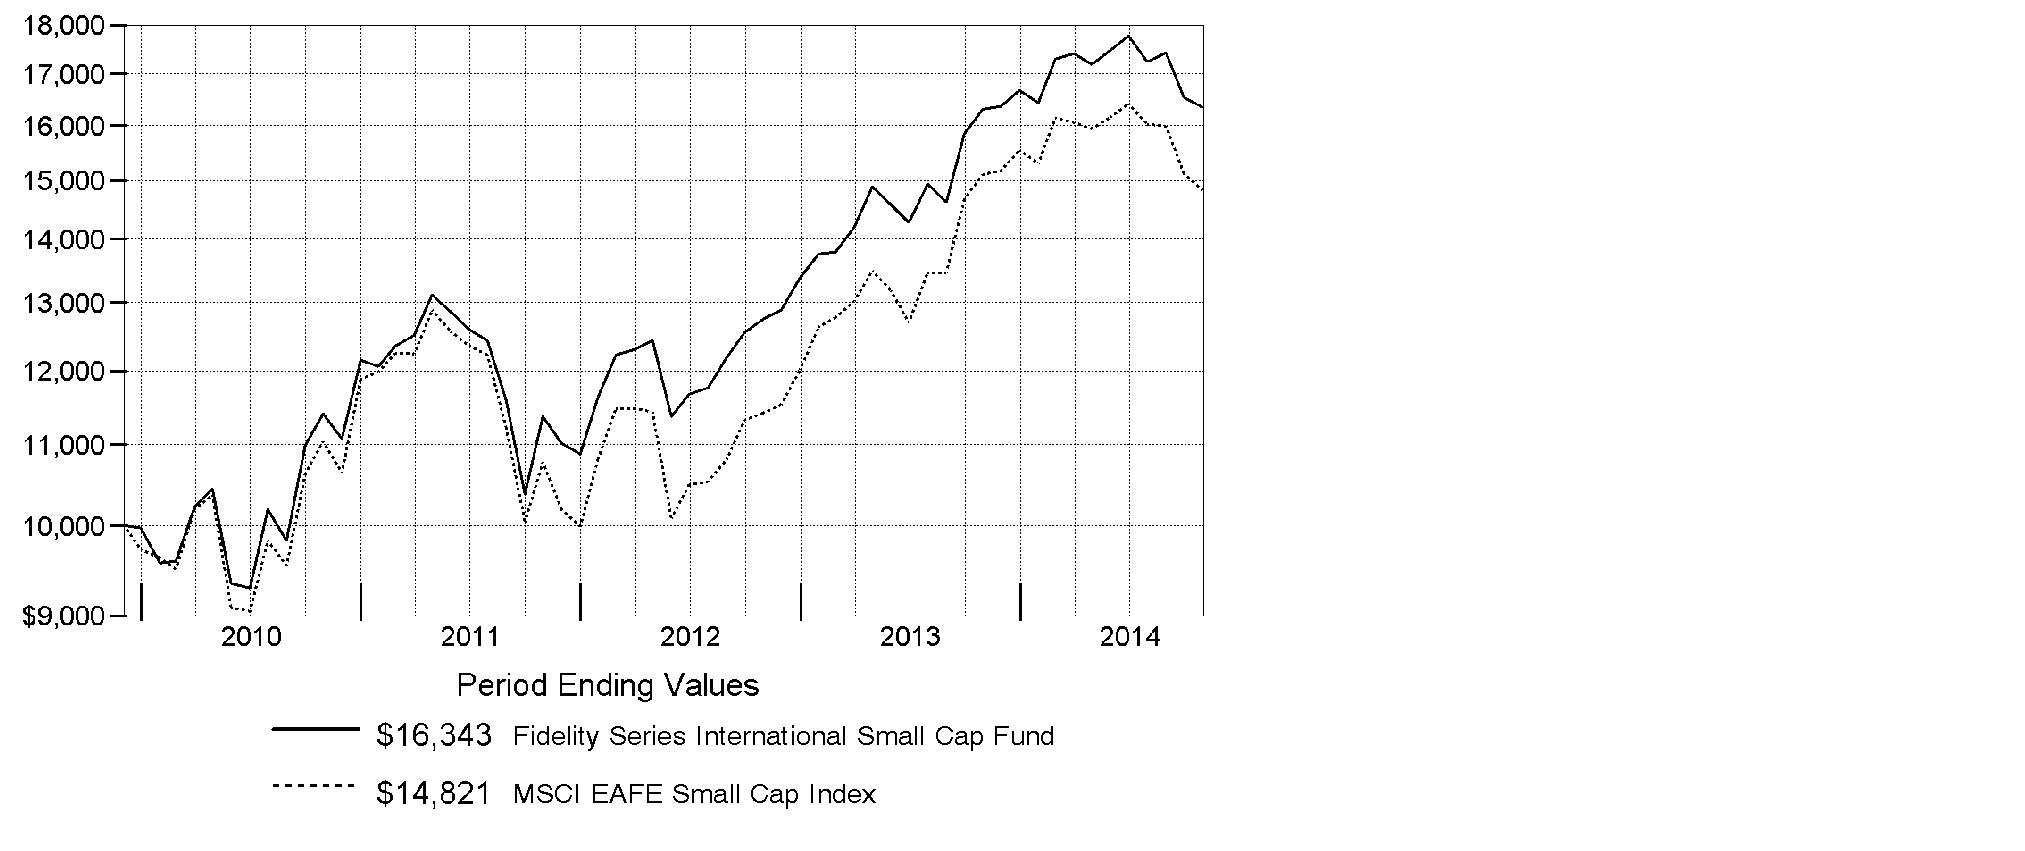
Annual Report
Fidelity Series International Small Cap Fund
Market Recap: Global equities posted a healthy gain for the 12 months ending October 31, 2014, overcoming an October market decline driven by recessionary pressures in China and tepid growth in Europe. The MSCI ACWI (All Country World Index) Index rose 8.15%, helped by subdued market volatility for much of the period and supported by solid corporate earnings, especially in the United States. Stocks also benefited from easy monetary policies in Japan and the eurozone, as well as increased stimulus efforts in China. All but three of the 24 industry groups that compose the index marked a positive return. The U.S. (+17%) remained a pillar of strength, while a strongly rising dollar in the latter part of the period detracted from investors' returns in most non-U.S. markets. Canada (+5%) notched broad gains outside of its energy and materials sectors, as did Asia-Pacific ex Japan (+4%), led by investor enthusiasm for companies in India. The U.K., Europe and Japan, meanwhile, all underperformed. Among sectors, health care (+24%) led the index, with a strong contribution from the pharmaceuticals, biotechnology & life sciences industry. Information technology (+21%) also outperformed. Conversely, materials (-4%) and energy (-1%) lagged the index due to a higher supply of and lower demand for commodities.
Comments from Jed Weiss, Portfolio Manager of Fidelity® Series International Small Cap Fund: For the year, the fund's Series International Small Cap and Class F shares gained 0.21% and 0.47%, respectively, ahead of the benchmark MSCI EAFE Small Cap Index, which returned -1.91%. The fund especially benefited in relative terms from strong stock selection in South Korea and South Africa within emerging markets and the Netherlands and Sweden within Europe. The fund's positioning in Denmark and stock selection in Turkey were negatives. On an individual basis, Fagerhult, a Swedish manufacturer of lighting fixtures, added the most value versus the index. Harmonic Drive Systems, a Japanese maker of gears for robotic arms, also contributed to the fund's results, as did South Korea's Coway and U.K.-based hotel company InterContinental Hotel Group. In contrast, the biggest detractor was PriceSmart, a U.S.-based warehouse retailer that does nearly all of its business in Central America and Colombia. During the period, PriceSmart stock struggled as weak emerging-market economies and a maturing market in Central America made the business environment a little tougher. Another detractor was Goldcrest, a Japanese real estate company, whose shares were hurt as pessimism grew about the Japanese economy. Of all the stocks mentioned, Goldcrest was the lone index member.
The views expressed above reflect those of the portfolio manager(s) only through the end of the period as stated on the cover of this report and do not necessarily represent the views of Fidelity or any other person in the Fidelity organization. Any such views are subject to change at any time based upon market or other conditions and Fidelity disclaims any responsibility to update such views. These views may not be relied on as investment
Annual Report
Fidelity Series International Small Cap Fund
Investment Changes (Unaudited)
Geographic Diversification (% of fund's net assets) |
As of October 31, 2014 |
| Japan 26.3% | |
| United Kingdom 21.1% | |
| United States of America* 11.4% | |
| Germany 4.8% | |
| Italy 4.0% | |
| Netherlands 3.6% | |
| Sweden 3.1% | |
| Korea (South) 2.5% | |
| Ireland 2.0% | |
| Other 21.2% | |

* Includes Short-Term Investments and Net Other Assets (Liabilities). |
Percentages are based on country or territory of incorporation and are adjusted for the effect of futures contracts, if applicable. |
As of April 30, 2014 |
| Japan 23.0% | |
| United Kingdom 19.4% | |
| United States of America* 13.4% | |
| Germany 5.9% | |
| Italy 4.6% | |
| Netherlands 4.1% | |
| Sweden 2.8% | |
| France 2.4% | |
| Ireland 2.4% | |
| Other 22.0% | |

* Includes Short-Term Investments and Net Other Assets (Liabilities). |
Percentages are based on country or territory of incorporation and are adjusted for the effect of futures contracts, if applicable. |
Asset Allocation as of October 31, 2014 |
| % of fund's
net assets | % of fund's net assets
6 months ago |
Stocks | 98.7 | 97.9 |
Short-Term Investments and Net Other Assets (Liabilities) | 1.3 | 2.1 |
Top Ten Stocks as of October 31, 2014 |
| % of fund's
net assets | % of fund's net assets
6 months ago |
USS Co. Ltd. (Japan, Specialty Retail) | 2.6 | 2.3 |
Unite Group PLC (United Kingdom, Real Estate Management & Development) | 1.7 | 1.7 |
Spirax-Sarco Engineering PLC (United Kingdom, Machinery) | 1.7 | 1.6 |
Fagerhult AB (Sweden, Electrical Equipment) | 1.6 | 1.3 |
Interpump Group SpA (Italy, Machinery) | 1.5 | 1.8 |
SS&C Technologies Holdings, Inc. (United States of America, Software) | 1.5 | 1.0 |
CTS Eventim AG (Germany, Media) | 1.5 | 1.7 |
Intrum Justitia AB (Sweden, Commercial Services & Supplies) | 1.5 | 1.5 |
Berendsen PLC (United Kingdom, Commercial Services & Supplies) | 1.5 | 0.9 |
Bellway PLC (United Kingdom, Household Durables) | 1.5 | 1.2 |
| 16.6 | |
Market Sectors as of October 31, 2014 |
| % of fund's
net assets | % of fund's net assets
6 months ago |
Industrials | 21.0 | 22.0 |
Financials | 20.2 | 20.3 |
Consumer Discretionary | 18.1 | 17.0 |
Materials | 11.2 | 10.7 |
Consumer Staples | 9.6 | 9.5 |
Information Technology | 9.6 | 8.2 |
Health Care | 6.0 | 7.0 |
Energy | 3.0 | 3.2 |
Annual Report
Fidelity Series International Small Cap Fund
Investments October 31, 2014
Showing Percentage of Net Assets
Common Stocks - 97.9% |
| Shares | | Value |
Australia - 1.8% |
DuluxGroup Ltd. | 2,369,294 | | $ 11,196,989 |
Imdex Ltd. (a) | 6,780,171 | | 3,590,155 |
RCG Corp. Ltd. (e) | 15,294,331 | | 8,273,270 |
Sydney Airport unit | 3,717,686 | | 14,453,375 |
TFS Corp. Ltd. | 7,998,182 | | 11,085,718 |
TOTAL AUSTRALIA | | 48,599,507 |
Austria - 1.3% |
Andritz AG | 516,024 | | 24,909,169 |
Zumtobel AG | 680,119 | | 11,987,475 |
TOTAL AUSTRIA | | 36,896,644 |
Belgium - 1.4% |
Gimv NV | 295,309 | | 13,414,910 |
KBC Ancora (a) | 852,473 | | 24,661,164 |
TOTAL BELGIUM | | 38,076,074 |
Bermuda - 1.1% |
Lazard Ltd. Class A | 262,101 | | 12,897,990 |
Petra Diamonds Ltd. (a) | 3,217,591 | | 8,544,319 |
Vostok Nafta Investment Ltd. SDR (a)(d) | 1,263,942 | | 8,096,322 |
TOTAL BERMUDA | | 29,538,631 |
Brazil - 0.3% |
Arezzo Industria e Comercio SA | 714,000 | | 8,269,825 |
British Virgin Islands - 0.4% |
Gem Diamonds Ltd. (a) | 4,337,632 | | 10,772,658 |
Canada - 1.6% |
Pason Systems, Inc. | 1,177,800 | | 28,184,434 |
ShawCor Ltd. Class A | 385,600 | | 16,986,860 |
TOTAL CANADA | | 45,171,294 |
Cayman Islands - 0.2% |
58.com, Inc. ADR (d) | 132,500 | | 5,243,025 |
Denmark - 1.9% |
Jyske Bank A/S (Reg.) (a) | 493,219 | | 26,572,957 |
Spar Nord Bank A/S | 2,602,747 | | 26,292,587 |
TOTAL DENMARK | | 52,865,544 |
Finland - 0.7% |
Tikkurila Oyj (d) | 987,867 | | 20,401,342 |
Common Stocks - continued |
| Shares | | Value |
France - 2.0% |
Coface SA | 579,200 | | $ 7,214,695 |
Laurent-Perrier Group SA | 132,224 | | 10,604,576 |
Saft Groupe SA | 256,617 | | 7,621,436 |
Vetoquinol SA | 208,127 | | 9,389,317 |
Virbac SA | 91,200 | | 20,394,565 |
TOTAL FRANCE | | 55,224,589 |
Germany - 4.0% |
alstria office REIT-AG | 789,329 | | 9,786,627 |
CompuGroup Medical AG | 1,323,715 | | 30,356,286 |
CTS Eventim AG | 1,603,124 | | 42,268,410 |
Fielmann AG | 423,190 | | 27,592,578 |
TOTAL GERMANY | | 110,003,901 |
Greece - 0.7% |
Titan Cement Co. SA (Reg.) | 899,599 | | 19,942,512 |
India - 0.6% |
Jyothy Laboratories Ltd. (a) | 4,091,337 | | 16,688,164 |
Ireland - 2.0% |
FBD Holdings PLC | 1,298,400 | | 21,965,714 |
James Hardie Industries PLC CDI | 3,276,486 | | 34,949,111 |
TOTAL IRELAND | | 56,914,825 |
Israel - 1.7% |
Azrieli Group | 414,179 | | 13,295,751 |
Ituran Location & Control Ltd. | 502,446 | | 10,295,119 |
Sarine Technologies Ltd. | 4,390,000 | | 10,180,831 |
Strauss Group Ltd. | 820,516 | | 13,234,651 |
TOTAL ISRAEL | | 47,006,352 |
Italy - 4.0% |
Azimut Holding SpA | 1,693,364 | | 39,554,809 |
Beni Stabili SpA SIIQ (d) | 43,666,820 | | 30,069,231 |
Interpump Group SpA | 3,268,666 | | 42,599,739 |
TOTAL ITALY | | 112,223,779 |
Japan - 26.3% |
Air Water, Inc. | 550,000 | | 8,767,170 |
Aozora Bank Ltd. | 8,533,000 | | 29,992,717 |
Artnature, Inc. (d) | 1,231,400 | | 16,652,883 |
Asahi Co. Ltd. (d) | 1,013,100 | | 11,264,489 |
Autobacs Seven Co. Ltd. | 1,035,300 | | 15,187,673 |
Common Stocks - continued |
| Shares | | Value |
Japan - continued |
Azbil Corp. | 997,700 | | $ 24,060,012 |
Broadleaf Co. Ltd. | 216,400 | | 3,420,235 |
Coca-Cola Central Japan Co. Ltd. | 1,046,700 | | 18,833,340 |
Cosmos Pharmaceutical Corp. | 139,600 | | 19,959,893 |
Daiichikosho Co. Ltd. | 324,000 | | 8,176,617 |
Daikokutenbussan Co. Ltd. | 567,600 | | 16,515,770 |
Glory Ltd. | 387,900 | | 9,995,985 |
Goldcrest Co. Ltd. | 1,440,910 | | 26,068,766 |
Harmonic Drive Systems, Inc. (d) | 1,140,300 | | 14,721,156 |
Iwatsuka Confectionary Co. Ltd. (d) | 162,300 | | 8,767,053 |
Kobayashi Pharmaceutical Co. Ltd. | 326,400 | | 20,147,576 |
Koshidaka Holdings Co. Ltd. | 305,200 | | 5,211,568 |
Kyoto Kimono Yuzen Co. Ltd. | 356,700 | | 3,214,151 |
Lasertec Corp. (d) | 908,400 | | 11,365,647 |
Medikit Co. Ltd. | 15,000 | | 467,393 |
Meiko Network Japan Co. Ltd. | 514,400 | | 5,784,226 |
Miraial Co. Ltd. (d) | 301,300 | | 4,639,173 |
Nabtesco Corp. | 753,300 | | 18,230,242 |
Nagaileben Co. Ltd. | 1,225,900 | | 23,562,993 |
ND Software Co. Ltd. | 111,268 | | 1,993,931 |
Nihon M&A Center, Inc. | 308,900 | | 8,877,563 |
Nihon Parkerizing Co. Ltd. | 1,618,000 | | 38,621,236 |
Nippon Seiki Co. Ltd. | 638,000 | | 13,591,389 |
NS Tool Co. Ltd. | 2,000 | | 22,971 |
OBIC Co. Ltd. | 912,200 | | 32,564,670 |
OSG Corp. | 2,458,600 | | 40,090,415 |
Paramount Bed Holdings Co. Ltd. | 263,000 | | 7,480,310 |
San-Ai Oil Co. Ltd. | 1,575,000 | | 10,902,289 |
Seven Bank Ltd. | 9,506,500 | | 39,702,957 |
SHO-BOND Holdings Co. Ltd. (d) | 804,000 | | 31,066,771 |
Shoei Co. Ltd. | 550,100 | | 8,406,703 |
SK Kaken Co. Ltd. | 73,000 | | 5,586,876 |
Software Service, Inc. | 175,900 | | 6,698,751 |
Techno Medica Co. Ltd. | 283,000 | | 6,128,536 |
The Nippon Synthetic Chemical Industry Co. Ltd. | 2,720,000 | | 16,607,346 |
TKC Corp. | 599,400 | | 11,766,970 |
Tocalo Co. Ltd. | 458,400 | | 8,647,183 |
Tsutsumi Jewelry Co. Ltd. | 273,600 | | 6,729,600 |
USS Co. Ltd. | 4,583,000 | | 72,127,253 |
Workman Co. Ltd. | 107,400 | | 5,613,288 |
Yamato Kogyo Co. Ltd. | 998,500 | | 32,346,387 |
TOTAL JAPAN | | 730,580,123 |
Common Stocks - continued |
| Shares | | Value |
Korea (South) - 2.5% |
Bgf Retail (a) | 246,044 | | $ 15,571,753 |
Coway Co. Ltd. | 507,047 | | 38,508,286 |
Leeno Industrial, Inc. | 379,988 | | 15,048,224 |
TOTAL KOREA (SOUTH) | | 69,128,263 |
Mexico - 0.7% |
Consorcio ARA S.A.B. de CV (a) | 41,353,427 | | 19,039,543 |
Netherlands - 3.6% |
Aalberts Industries NV | 1,369,900 | | 36,471,083 |
ASM International NV (depositary receipt) | 283,800 | | 9,288,774 |
Heijmans NV (Certificaten Van Aandelen) (d) | 1,550,171 | | 21,057,749 |
VastNed Retail NV | 746,955 | | 34,104,860 |
TOTAL NETHERLANDS | | 100,922,466 |
Philippines - 0.5% |
Jollibee Food Corp. | 3,065,150 | | 13,359,070 |
South Africa - 1.8% |
Alexander Forbes Group Holding (a) | 9,630,704 | | 7,509,151 |
Clicks Group Ltd. | 4,317,421 | | 29,396,706 |
Nampak Ltd. | 3,262,570 | | 13,302,003 |
TOTAL SOUTH AFRICA | | 50,207,860 |
Spain - 1.0% |
Prosegur Compania de Seguridad SA (Reg.) | 4,572,986 | | 26,819,383 |
Sweden - 3.1% |
Fagerhult AB (e) | 2,397,342 | | 44,153,831 |
Intrum Justitia AB | 1,409,603 | | 41,882,532 |
TOTAL SWEDEN | | 86,036,363 |
Taiwan - 0.3% |
Addcn Technology Co. Ltd. | 878,000 | | 8,443,988 |
Turkey - 1.2% |
Albaraka Turk Katilim Bankasi A/S | 16,640,671 | | 11,754,371 |
Coca-Cola Icecek Sanayi A/S | 971,544 | | 22,161,510 |
TOTAL TURKEY | | 33,915,881 |
United Kingdom - 21.1% |
Advanced Computer Software Group PLC | 4,876,731 | | 8,425,411 |
Babcock International Group PLC | 701,700 | | 12,291,479 |
Bellway PLC | 1,456,300 | | 40,745,458 |
Berendsen PLC | 2,572,009 | | 41,555,872 |
Britvic PLC | 2,243,612 | | 24,423,867 |
Common Stocks - continued |
| Shares | | Value |
United Kingdom - continued |
Dechra Pharmaceuticals PLC | 1,636,163 | | $ 19,839,664 |
Derwent London PLC | 422,190 | | 20,065,461 |
Elementis PLC | 6,618,882 | | 27,942,327 |
Great Portland Estates PLC | 2,756,000 | | 30,266,228 |
H&T Group PLC | 1,288,592 | | 3,277,563 |
Hilton Food Group PLC | 901,038 | | 5,405,214 |
Informa PLC | 3,950,785 | | 30,399,540 |
InterContinental Hotel Group PLC ADR | 594,546 | | 22,598,693 |
ITE Group PLC | 4,199,872 | | 11,438,306 |
Johnson Matthey PLC | 433,270 | | 20,612,854 |
Meggitt PLC | 3,112,345 | | 22,459,449 |
Persimmon PLC | 759,100 | | 17,765,681 |
Rotork PLC | 515,000 | | 21,049,253 |
Shaftesbury PLC | 2,990,255 | | 34,249,938 |
Spectris PLC | 1,183,016 | | 34,102,322 |
Spirax-Sarco Engineering PLC | 1,004,400 | | 45,792,052 |
Ted Baker PLC | 559,367 | | 17,404,237 |
Ultra Electronics Holdings PLC | 936,610 | | 26,145,248 |
Unite Group PLC | 6,953,599 | | 47,498,081 |
TOTAL UNITED KINGDOM | | 585,754,198 |
United States of America - 10.1% |
ANSYS, Inc. (a) | 93,715 | | 7,362,250 |
Autoliv, Inc. | 244,600 | | 22,439,604 |
Broadridge Financial Solutions, Inc. | 236,895 | | 10,406,797 |
Dril-Quip, Inc. (a) | 169,205 | | 15,219,990 |
Evercore Partners, Inc. Class A | 246,100 | | 12,740,597 |
Kennedy-Wilson Holdings, Inc. | 1,044,988 | | 28,308,725 |
Martin Marietta Materials, Inc. (d) | 222,280 | | 25,988,978 |
Mohawk Industries, Inc. (a) | 201,862 | | 28,672,478 |
Oceaneering International, Inc. | 198,667 | | 13,960,330 |
PriceSmart, Inc. | 317,261 | | 28,245,747 |
ResMed, Inc. (d) | 211,800 | | 11,060,196 |
Solera Holdings, Inc. | 670,290 | | 34,821,566 |
SS&C Technologies Holdings, Inc. (a) | 876,788 | | 42,366,396 |
TOTAL UNITED STATES OF AMERICA | | 281,593,654 |
TOTAL COMMON STOCKS (Cost $2,120,733,020) |
2,719,639,458
|
Nonconvertible Preferred Stocks - 0.8% |
| Shares | | Value |
Germany - 0.8% |
Sartorius AG (non-vtg.)
(Cost $22,926,603) | 203,746 | | $ 22,213,214 |
Money Market Funds - 3.1% |
| | | |
Fidelity Cash Central Fund, 0.11% (b) | 26,240,735 | | 26,240,735 |
Fidelity Securities Lending Cash Central Fund, 0.11% (b)(c) | 61,106,390 | | 61,106,390 |
TOTAL MONEY MARKET FUNDS (Cost $87,347,125) |
87,347,125
|
TOTAL INVESTMENT PORTFOLIO - 101.8% (Cost $2,231,006,748) | | 2,829,199,797 |
NET OTHER ASSETS (LIABILITIES) - (1.8)% | | (49,663,488) |
NET ASSETS - 100% | $ 2,779,536,309 |
Legend |
(a) Non-income producing |
(b) Affiliated fund that is generally available only to investment companies and other accounts managed by Fidelity Investments. The rate quoted is the annualized seven-day yield of the fund at period end. A complete unaudited listing of the fund's holdings as of its most recent quarter end is available upon request. In addition, each Fidelity Central Fund's financial statements, which are not covered by the Fund's Report of Independent Registered Public Accounting Firm, are available on the SEC's website or upon request. |
(c) Investment made with cash collateral received from securities on loan. |
(d) Security or a portion of the security is on loan at period end. |
(e) Affiliated company |
Affiliated Central Funds |
Information regarding fiscal year to date income earned by the Fund from investments in Fidelity Central Funds is as follows: |
Fund | Income earned |
Fidelity Cash Central Fund | $ 64,348 |
Fidelity Securities Lending Cash Central Fund | 1,186,817 |
Total | $ 1,251,165 |
Other Affiliated Issuers |
An affiliated company is a company in which the Fund has ownership of at least 5% of the voting securities. Fiscal year to date transactions with companies which are or were affiliates are as follows: |
Affiliate | Value,
beginning of
period | Purchases | Sales
Proceeds | Dividend
Income | Value,
end of
period |
Fagerhult AB | $ 16,152,472 | $ 8,923,943 | $ 21,977 | $ 747,378 | $ 44,153,831 |
Heijmans NV (Certificaten Van Aandelen) | 16,464,500 | 4,149,550 | - | 272,842 | - |
RCG Corp. Ltd. | 840,814 | 9,594,235 | - | 615,392 | 8,273,270 |
Total | $ 33,457,786 | $ 22,667,728 | $ 21,977 | $ 1,635,612 | $ 52,427,101 |
Other Information |
Categorizations in the Schedule of Investments are based on country or territory of incorporation. |
The following is a summary of the inputs used, as of October 31, 2014, involving the Fund's assets and liabilities carried at fair value. The inputs or methodology used for valuing securities may not be an indication of the risk associated with investing in those securities. For more information on valuation inputs, and their aggregation into the levels used in the tables below, please refer to the Investment Valuation section in the accompanying Notes to Financial Statements. |
Valuation Inputs at Reporting Date: |
Description | Total | Level 1 | Level 2 | Level 3 |
Investments in Securities: | | | | |
Equities: | | | | |
Consumer Discretionary | $ 504,081,936 | $ 327,142,639 | $ 176,939,297 | $ - |
Consumer Staples | 266,608,703 | 149,044,024 | 117,564,679 | - |
Energy | 85,253,903 | 74,351,614 | 10,902,289 | - |
Financials | 559,362,172 | 463,597,732 | 95,764,440 | - |
Health Care | 168,010,567 | 121,678,653 | 46,331,914 | - |
Industrials | 583,082,242 | 426,795,750 | 156,286,492 | - |
Information Technology | 265,195,168 | 168,934,473 | 96,260,695 | - |
Materials | 310,257,981 | 147,506,993 | 162,750,988 | - |
Money Market Funds | 87,347,125 | 87,347,125 | - | - |
Total Investments in Securities: | $ 2,829,199,797 | $ 1,966,399,003 | $ 862,800,794 | $ - |
The following is a summary of transfers between Level 1 and Level 2 for the period ended October 31, 2014. Transfers are assumed to have occurred at the beginning of the period, and are primarily attributable to the valuation techniques used for foreign equity securities, as discussed in the accompanying Notes to Financial Statements: |
Transfers | Total |
Level 1 to Level 2 | $ 70,277,449 |
Level 2 to Level 1 | $ 0 |
See accompanying notes which are an integral part of the financial statements.
Annual Report
Fidelity Series International Small Cap Fund
Statement of Assets and Liabilities
| October 31, 2014 |
| | |
Assets | | |
Investment in securities, at value (including securities loaned of $59,564,902) - See accompanying schedule: Unaffiliated issuers (cost $2,109,894,847) | $ 2,689,425,571 | |
Fidelity Central Funds (cost $87,347,125) | 87,347,125 | |
Other affiliated issuers (cost $33,764,776) | 52,427,101 | |
Total Investments (cost $2,231,006,748) | | $ 2,829,199,797 |
Foreign currency held at value (cost $859,724) | | 859,637 |
Receivable for investments sold | | 5,514,672 |
Receivable for fund shares sold | | 2,278,828 |
Dividends receivable | | 7,141,817 |
Distributions receivable from Fidelity Central Funds | | 47,961 |
Prepaid expenses | | 9,826 |
Other receivables | | 3,213 |
Total assets | | 2,845,055,751 |
| | |
Liabilities | | |
Payable for investments purchased | $ 1,378,641 | |
Payable for fund shares redeemed | 403,736 | |
Accrued management fee | 2,126,891 | |
Other affiliated payables | 295,258 | |
Other payables and accrued expenses | 208,526 | |
Collateral on securities loaned, at value | 61,106,390 | |
Total liabilities | | 65,519,442 |
| | |
Net Assets | | $ 2,779,536,309 |
Net Assets consist of: | | |
Paid in capital | | $ 2,133,815,552 |
Undistributed net investment income | | 27,520,165 |
Accumulated undistributed net realized gain (loss) on investments and foreign currency transactions | | 20,257,329 |
Net unrealized appreciation (depreciation) on investments and assets and liabilities in foreign currencies | | 597,943,263 |
Net Assets | | $ 2,779,536,309 |
See accompanying notes which are an integral part of the financial statements.
Annual Report
Fidelity Series International Small Cap Fund
Financial Statements - continued
Statement of Assets and Liabilities - continued
| October 31, 2014 |
| | |
Series International Small Cap:
Net Asset Value, offering price and redemption price per share ($1,330,809,132 ÷ 87,469,652 shares) | | $ 15.21 |
| | |
Class F:
Net Asset Value, offering price and redemption price per share ($1,448,727,177 ÷ 94,900,839 shares) | | $ 15.27 |
See accompanying notes which are an integral part of the financial statements.
Annual Report
Statement of Operations
| Year ended October 31, 2014 |
| | |
Investment Income | | |
Dividends (including $1,635,612 earned from other affiliated issuers) | | $ 63,556,416 |
Interest | | 6 |
Income from Fidelity Central Funds | | 1,251,165 |
Income before foreign taxes withheld | | 64,807,587 |
Less foreign taxes withheld | | (5,512,014) |
Total income | | 59,295,573 |
| | |
Expenses | | |
Management fee
Basic fee | $ 24,638,448 | |
Performance adjustment | 2,927,891 | |
Transfer agent fees | 2,446,205 | |
Accounting and security lending fees | 1,274,031 | |
Custodian fees and expenses | 337,430 | |
Independent trustees' compensation | 11,731 | |
Audit | 67,207 | |
Legal | 8,745 | |
Miscellaneous | 19,359 | |
Total expenses | | 31,731,047 |
Net investment income (loss) | | 27,564,526 |
Realized and Unrealized Gain (Loss) Net realized gain (loss) on: | | |
Investment securities: | | |
Unaffiliated issuers | 36,540,361 | |
Other affiliated issuers | 11,017 | |
Foreign currency transactions | (314,965) | |
Total net realized gain (loss) | | 36,236,413 |
Change in net unrealized appreciation (depreciation) on: Investment securities (net of increase in deferred foreign taxes of $57,160) | (48,595,583) | |
Assets and liabilities in foreign currencies | (178,220) | |
Total change in net unrealized appreciation (depreciation) | | (48,773,803) |
Net gain (loss) | | (12,537,390) |
Net increase (decrease) in net assets resulting from operations | | $ 15,027,136 |
See accompanying notes which are an integral part of the financial statements.
Annual Report
Fidelity Series International Small Cap Fund
Financial Statements - continued
Statement of Changes in Net Assets
| Year ended
October 31,
2014 | Year ended
October 31,
2013 |
Increase (Decrease) in Net Assets | | |
Operations | | |
Net investment income (loss) | $ 27,564,526 | $ 23,222,109 |
Net realized gain (loss) | 36,236,413 | 93,039,428 |
Change in net unrealized appreciation (depreciation) | (48,773,803) | 390,724,094 |
Net increase (decrease) in net assets resulting
from operations | 15,027,136 | 506,985,631 |
Distributions to shareholders from net investment income | (22,654,352) | (20,487,378) |
Distributions to shareholders from net realized gain | (73,752,533) | (1,498,848) |
Total distributions | (96,406,885) | (21,986,226) |
Share transactions - net increase (decrease) | 555,726,987 | (56,862,699) |
Total increase (decrease) in net assets | 474,347,238 | 428,136,706 |
| | |
Net Assets | | |
Beginning of period | 2,305,189,071 | 1,877,052,365 |
End of period (including undistributed net investment income of $27,520,165 and undistributed net investment income of $22,673,543, respectively) | $ 2,779,536,309 | $ 2,305,189,071 |
See accompanying notes which are an integral part of the financial statements.
Annual Report
Financial Highlights - Series International Small Cap
Years ended October 31, | 2014 | 2013 | 2012 | 2011 | 2010 H |
Selected Per-Share Data | | | | | |
Net asset value, beginning of period | $ 15.75 | $ 12.44 | $ 11.22 | $ 11.40 | $ 10.00 |
Income from Investment Operations | | | | | |
Net investment income (loss) D | .14 | .15 | .15 | .17G | .06 |
Net realized and unrealized gain (loss) | (.11) | 3.29 | 1.19 | (.19) | 1.34 |
Total from investment operations | .03 | 3.44 | 1.34 | (.02) | 1.40 |
Distributions from net investment income | (.13) | (.12) | (.11) | (.09) | - |
Distributions from net realized gain | (.44) | (.01) | (.01) | (.07) | - |
Total distributions | (.57) | (.13) | (.12) | (.16) | - |
Net asset value, end of period | $ 15.21 | $ 15.75 | $ 12.44 | $ 11.22 | $ 11.40 |
Total ReturnB, C | .21% | 27.95% | 12.07% | (.23)% | 14.00% |
Ratios to Average Net Assets E, I | | | | | |
Expenses before reductions | 1.18% | 1.23% | 1.22% | 1.14% | 1.21%A |
Expenses net of fee waivers, if any | 1.18% | 1.23% | 1.22% | 1.14% | 1.21%A |
Expenses net of all reductions | 1.18% | 1.22% | 1.22% | 1.13% | 1.18%A |
Net investment income (loss) | .86% | 1.05% | 1.27% | 1.47%G | .68%A |
Supplemental Data | | | | | |
Net assets, end of period (000 omitted) | $ 1,330,809 | $ 1,163,381 | $ 1,040,585 | $ 1,107,242 | $ 701,814 |
Portfolio turnover rateF | 18% | 29% | 25% | 22% | 21% A |
A Annualized
B Total returns for periods of less than one year are not annualized.
C Total returns would have been lower if certain expenses had not been reduced during the applicable periods shown.
D Calculated based on average shares outstanding during the period.
E Fees and expenses of any underlying Fidelity Central Funds are not included in the Fund's expense ratio. The Fund indirectly bears its proportionate share of the expenses of any underlying Fidelity Central Funds.
F Amount does not include the portfolio activity of any underlying Fidelity Central Funds.
G Investment income per share reflects a large, non-recurring dividend which amounted to $.06 per share. Excluding this non-recurring dividend, the ratio of net investment income (loss) to average net assets would have been 1.00%.
H For the period December 3, 2009 (commencement of operations) to October 31, 2010.
I Expense ratios reflect operating expenses of the class. Expenses before reductions do not reflect amounts reimbursed by the investment adviser or reductions from brokerage service arrangements or reductions from other expense offset arrangements and do not represent the amount paid by the class during periods when reimbursements or reductions occur. Expense ratios before reductions for start-up periods may not be representative of longer-term operating periods. Expenses net of fee waivers reflect expenses after reimbursement by the investment adviser but prior to reductions from brokerage service arrangements or other expense offset arrangements. Expenses net of all reductions represent the net expenses paid by the class.
See accompanying notes which are an integral part of the financial statements.
Annual Report
Financial Highlights - Class F
Years ended October 31, | 2014 | 2013 | 2012 | 2011 | 2010 H |
Selected Per-Share Data | | | | | |
Net asset value, beginning of period | $ 15.79 | $ 12.48 | $ 11.26 | $ 11.43 | $ 10.00 |
Income from Investment Operations | | | | | |
Net investment income (loss) D | .16 | .17 | .17 | .20G | .09 |
Net realized and unrealized gain (loss) | (.09) | 3.30 | 1.19 | (.20) | 1.34 |
Total from investment operations | .07 | 3.47 | 1.36 | - | 1.43 |
Distributions from net investment income | (.15) | (.15) | (.13) | (.10) | - |
Distributions from net realized gain | (.44) | (.01) | (.01) | (.07) | - |
Total distributions | (.59) | (.16) | (.14) | (.17) | - |
Net asset value, end of period | $ 15.27 | $ 15.79 | $ 12.48 | $ 11.26 | $ 11.43 |
Total ReturnB, C | .47% | 28.14% | 12.25% | (.03)% | 14.30% |
Ratios to Average Net Assets E, I | | | | | |
Expenses before reductions | 1.01% | 1.04% | 1.02% | .93% | .98%A |
Expenses net of fee waivers, if any | 1.01% | 1.04% | 1.02% | .93% | .98%A |
Expenses net of all reductions | 1.01% | 1.03% | 1.01% | .92% | .94%A |
Net investment income (loss) | 1.04% | 1.24% | 1.47% | 1.68%G | .92%A |
Supplemental Data | | | | | |
Net assets, end of period (000 omitted) | $ 1,448,727 | $ 1,141,808 | $ 836,468 | $ 480,498 | $ 130,513 |
Portfolio turnover rateF | 18% | 29% | 25% | 22% | 21% A |
A Annualized
B Total returns for periods of less than one year are not annualized.
C Total returns would have been lower if certain expenses had not been reduced during the applicable periods shown.
D Calculated based on average shares outstanding during the period.
E Fees and expenses of any underlying Fidelity Central Funds are not included in the Fund's expense ratio. The Fund indirectly bears its proportionate share of the expenses of any underlying Fidelity Central Funds.
F Amount does not include the portfolio activity of any underlying Fidelity Central Funds.
G Investment income per share reflects a large, non-recurring dividend which amounted to $.06 per share. Excluding this non-recurring dividend, the ratio of net investment income (loss) to average net assets would have been 1.21%.
H For the period December 3, 2009 (commencement of operations) to October 31, 2010.
I Expense ratios reflect operating expenses of the class. Expenses before reductions do not reflect amounts reimbursed by the investment adviser or reductions from brokerage service arrangements or reductions from other expense offset arrangements and do not represent the amount paid by the class during periods when reimbursements or reductions occur. Expense ratios before reductions for start-up periods may not be representative of longer-term operating periods. Expenses net of fee waivers reflect expenses after reimbursement by the investment adviser but prior to reductions from brokerage service arrangements or other expense offset arrangements. Expenses net of all reductions represent the net expenses paid by the class.
See accompanying notes which are an integral part of the financial statements.
Annual Report
Fidelity Series International Value Fund
Average annual total return reflects the change in the value of an investment, assuming reinvestment of the class' distributions from dividend income and capital gains (the profits earned upon the sale of securities that have grown in value, if any) and assuming a constant rate of performance each year. The $10,000 table and the fund's returns do not reflect the deduction of taxes that a shareholder would pay on fund distributions or the redemption of fund shares. During periods of reimbursement by Fidelity, a fund's total return will be greater than it would be had the reimbursement not occurred. How a fund did yesterday is no guarantee of how it will do tomorrow.
Average Annual Total Returns
Periods ended October 31, 2014 | Past 1
year | Life of
fund A |
Fidelity Series International Value Fund | -1.25% | 3.59% |
Class F | -1.18% | 3.78% |
A From December 3, 2009.
$10,000 Over Life of Fund
Let's say hypothetically that $10,000 was invested in Fidelity Series International Value Fund, a class of the fund, on December 3, 2009, when the fund started. The chart shows how the value of your investment would have changed, and also shows how the MSCI EAFE Value Index performed over the same period.
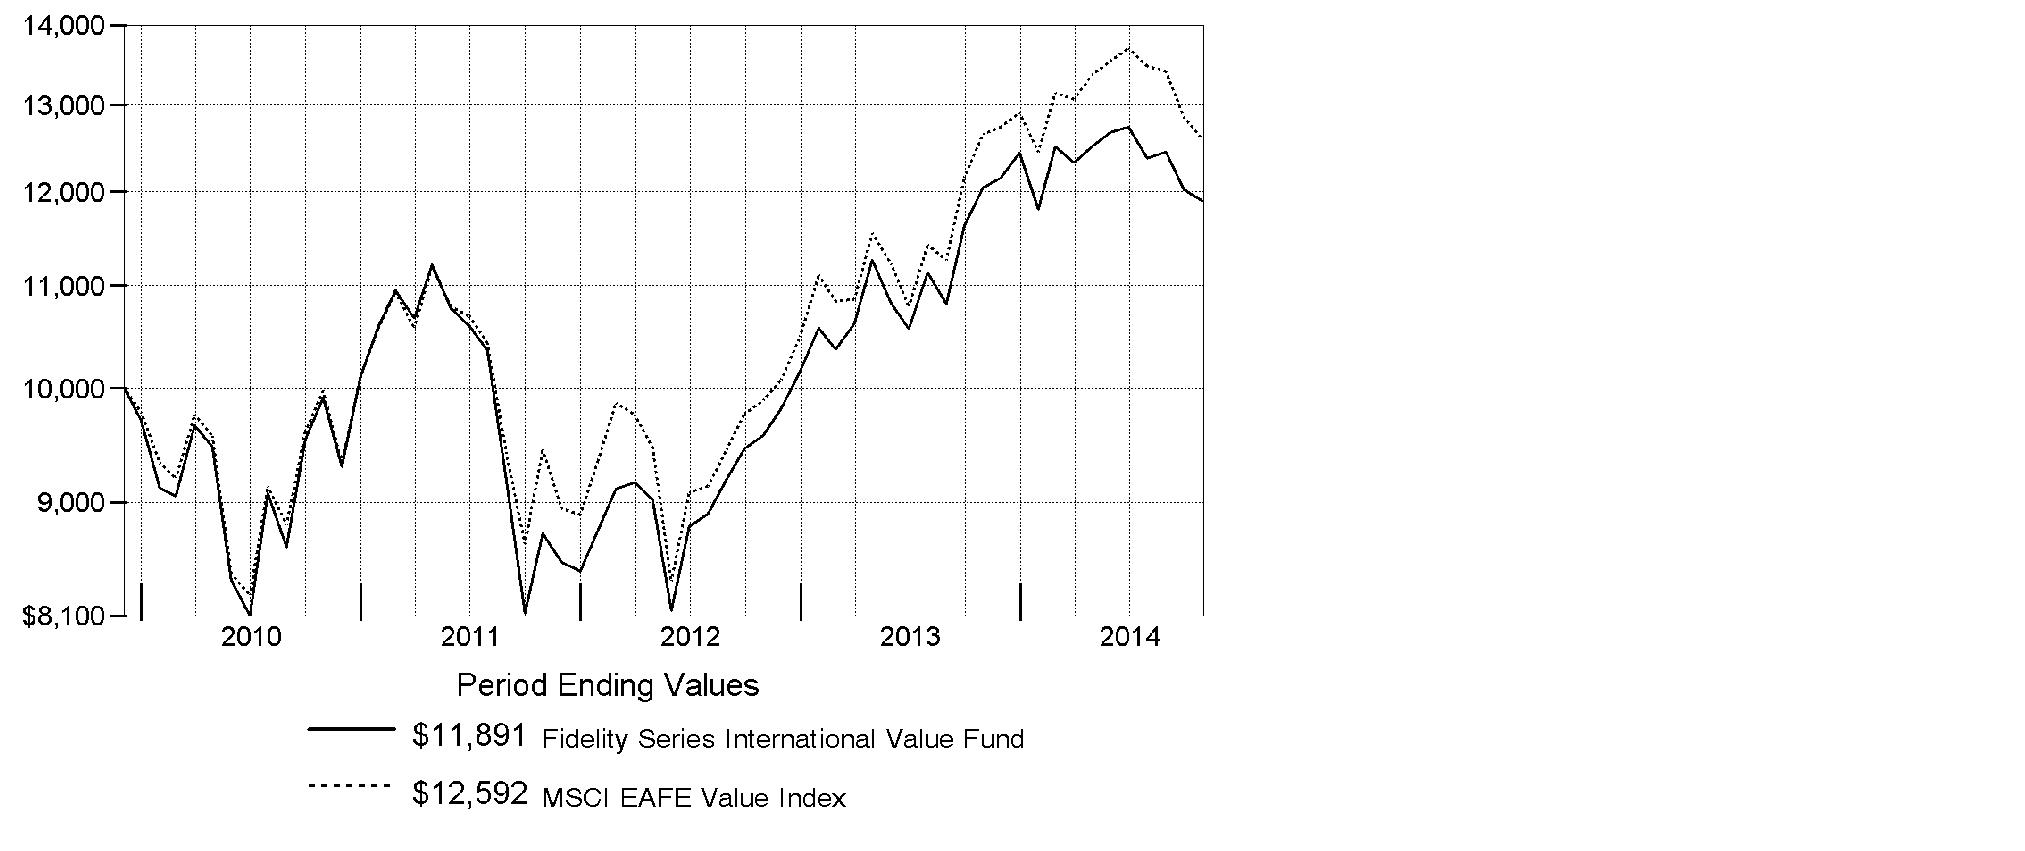
Annual Report
Fidelity Series International Value Fund
Market Recap: Global equities posted a healthy gain for the 12 months ending October 31, 2014, overcoming an October market decline driven by recessionary pressures in China and tepid growth in Europe. The MSCI ACWI (All Country World Index) Index rose 8.15%, helped by subdued market volatility for much of the period and supported by solid corporate earnings, especially in the United States. Stocks also benefited from easy monetary policies in Japan and the eurozone, as well as increased stimulus efforts in China. All but three of the 24 industry groups that compose the index marked a positive return. The U.S. (+17%) remained a pillar of strength, while a strongly rising dollar in the latter part of the period detracted from investors' returns in most non-U.S. markets. Canada (+5%) notched broad gains outside of its energy and materials sectors, as did Asia-Pacific ex Japan (+4%), led by investor enthusiasm for companies in India. The U.K., Europe and Japan, meanwhile, all underperformed. Among sectors, health care (+24%) led the index, with a strong contribution from the pharmaceuticals, biotechnology & life sciences industry. Information technology (+21%) also outperformed. Conversely, materials (-4%) and energy (-1%) lagged the index due to a higher supply of and lower demand for commodities.
Comments from Alexander Zavratsky, Portfolio Manager of Fidelity® Series International Value Fund: For the year, the fund's Series International Value and Class F shares returned -1.25% and -1.18, respectively, trailing the -0.45% return of the benchmark MSCI EAFE Value Index. Versus the index, the fund was hurt by its investments in higher-quality Japanese financials firms, which lagged due to a rising yen and investor reaction to the U.S. central bank's announcement last fall that its stimulus program may end following a period of tapering. From this category, investments in bank holdings company Sumitomo Mitsui Financial Group and diversified conglomerate ORIX were sore spots. An overweighting, on average, in Sumitomo Mitsui was the fund's biggest relative detractor during the past year. Whereas I became more bearish on Sumitomo Mitsui, I held on to ORIX, believing in its ability to deliver long-term results. Conversely, selling our holdings in U.K.-based food retailer Tesco prior to second half of the year proved the biggest relative contributor, as sliding sales and a loss in market share steadily eroded its stock price. Additionally, the stock, which had been declining over the summer, dipped in early August after the firm issued its third profit warning of the year, then again in September after its new chief executive reported that Tesco's first-half profits had been overstated and four senior executives were suspended.
The views expressed above reflect those of the portfolio manager(s) only through the end of the period as stated on the cover of this report and do not necessarily represent the views of Fidelity or any other person in the Fidelity organization. Any such views are subject to change at any time based upon market or other conditions and Fidelity disclaims any responsibility to update such views. These views may not be relied on as investment advice and, because investment decisions for a Fidelity fund are based on numerous factors, may not be relied on as an indication of trading intent on behalf of any Fidelity fund.
Annual Report
Fidelity Series International Value Fund
Investment Changes (Unaudited)
Geographic Diversification (% of fund's net assets) |
As of October 31, 2014 |
| United Kingdom 23.4% | |
| Japan 18.6% | |
| France 14.4% | |
| Switzerland 7.9% | |
| Germany 7.8% | |
| Australia 5.8% | |
| United States of America* 3.5% | |
| Spain 2.9% | |
| Netherlands 2.5% | |
| Other 13.2% | |

* Includes Short-Term Investments and Net Other Assets (Liabilities). |
Percentages are based on country or territory of incorporation and are adjusted for the effect of futures contracts, if applicable. |
As of April 30, 2014 |
| United Kingdom 24.7% | |
| France 18.2% | |
| Japan 15.8% | |
| Switzerland 7.8% | |
| Germany 7.5% | |
| Australia 5.5% | |
| United States of America* 4.6% | |
| Sweden 2.1% | |
| Netherlands 1.9% | |
| Other 11.9% | |

* Includes Short-Term Investments and Net Other Assets (Liabilities). |
Percentages are based on country or territory of incorporation and are adjusted for the effect of futures contracts, if applicable. |
Asset Allocation as of October 31, 2014 |
| % of fund's
net assets | % of fund's net assets
6 months ago |
Stocks | 99.0 | 97.2 |
Short-Term Investments and Net Other Assets (Liabilities) | 1.0 | 2.8 |
Top Ten Stocks as of October 31, 2014 |
| % of fund's
net assets | % of fund's net assets
6 months ago |
Total SA (France, Oil, Gas & Consumable Fuels) | 3.3 | 4.8 |
Novartis AG (Switzerland, Pharmaceuticals) | 3.2 | 2.4 |
HSBC Holdings PLC sponsored ADR (United Kingdom, Banks) | 2.7 | 2.2 |
Westpac Banking Corp. (Australia, Banks) | 2.4 | 2.3 |
Sanofi SA (France, Pharmaceuticals) | 2.2 | 2.5 |
Mitsubishi UFJ Financial Group, Inc. (Japan, Banks) | 2.2 | 1.3 |
BHP Billiton PLC (United Kingdom, Metals & Mining) | 2.2 | 1.7 |
Nestle SA (Switzerland, Food Products) | 2.1 | 2.1 |
Royal Dutch Shell PLC Class A sponsored ADR (United Kingdom, Oil, Gas & Consumable Fuels) | 2.0 | 1.7 |
Vodafone Group PLC sponsored ADR (United Kingdom, Wireless Telecommunication Services) | 2.0 | 2.0 |
| 24.3 | |
Market Sectors as of October 31, 2014 |
| % of fund's
net assets | % of fund's net assets
6 months ago |
Financials | 25.5 | 24.5 |
Health Care | 16.2 | 15.9 |
Consumer Discretionary | 10.3 | 10.7 |
Telecommunication Services | 9.0 | 8.4 |
Consumer Staples | 8.5 | 8.3 |
Industrials | 8.1 | 9.8 |
Energy | 7.2 | 6.5 |
Information Technology | 5.5 | 4.1 |
Materials | 4.8 | 6.0 |
Utilities | 3.9 | 3.0 |
Annual Report
Fidelity Series International Value Fund
Investments October 31, 2014
Showing Percentage of Net Assets
Common Stocks - 98.0% |
| Shares | | Value |
Australia - 5.8% |
Ansell Ltd. | 3,467,096 | | $ 60,815,080 |
Australia & New Zealand Banking Group Ltd. | 6,930,246 | | 205,069,994 |
Telstra Corp. Ltd. | 14,779,457 | | 73,544,873 |
Transurban Group unit | 11,721,408 | | 83,947,627 |
Westpac Banking Corp. | 9,579,350 | | 294,031,193 |
TOTAL AUSTRALIA | | 717,408,767 |
Bailiwick of Jersey - 1.2% |
Shire PLC | 1,275,300 | | 85,568,713 |
Wolseley PLC | 1,230,833 | | 65,310,521 |
TOTAL BAILIWICK OF JERSEY | | 150,879,234 |
Belgium - 0.9% |
Anheuser-Busch InBev SA NV | 671,730 | | 74,491,097 |
UCB SA | 513,634 | | 41,445,296 |
TOTAL BELGIUM | | 115,936,393 |
Bermuda - 0.1% |
Travelport Worldwide Ltd. | 1,214,581 | | 17,550,695 |
Canada - 1.1% |
Imperial Oil Ltd. | 1,445,600 | | 69,557,595 |
Potash Corp. of Saskatchewan, Inc. | 2,008,200 | | 68,546,608 |
TOTAL CANADA | | 138,104,203 |
Denmark - 0.8% |
A.P. Moller - Maersk A/S Series B | 40,242 | | 93,770,398 |
Finland - 1.1% |
Sampo Oyj (A Shares) | 2,786,013 | | 133,262,623 |
France - 14.4% |
Atos Origin SA | 1,325,695 | | 91,520,724 |
AXA SA | 5,822,573 | | 134,329,620 |
BNP Paribas SA | 3,040,318 | | 191,032,121 |
Cap Gemini SA | 1,537,805 | | 101,095,683 |
GDF Suez | 4,709,653 | | 114,231,306 |
Havas SA | 9,287,642 | | 75,070,315 |
Orange SA | 7,768,800 | | 123,682,195 |
Renault SA | 975,692 | | 72,419,835 |
Sanofi SA | 3,058,550 | | 277,533,128 |
Schneider Electric SA | 799,805 | | 63,023,092 |
Common Stocks - continued |
| Shares | | Value |
France - continued |
Total SA | 6,843,922 | | $ 408,604,764 |
Vivendi SA | 5,907,350 | | 144,169,445 |
TOTAL FRANCE | | 1,796,712,228 |
Germany - 6.8% |
Allianz SE | 1,340,527 | | 213,173,474 |
BASF AG | 2,360,972 | | 207,815,720 |
Bayer AG | 909,614 | | 129,319,701 |
Continental AG | 394,133 | | 77,370,652 |
Fresenius SE & Co. KGaA | 1,738,500 | | 89,431,582 |
GEA Group AG | 1,619,322 | | 74,463,452 |
Siemens AG | 440,050 | | 49,634,742 |
TOTAL GERMANY | | 841,209,323 |
Ireland - 0.9% |
Actavis PLC (a) | 442,100 | | 107,315,354 |
Israel - 1.2% |
Teva Pharmaceutical Industries Ltd. sponsored ADR | 2,622,192 | | 148,075,182 |
Italy - 1.2% |
Intesa Sanpaolo SpA | 29,579,000 | | 86,955,136 |
Telecom Italia SpA (a)(d) | 53,244,800 | | 60,341,383 |
TOTAL ITALY | | 147,296,519 |
Japan - 18.6% |
Astellas Pharma, Inc. | 8,074,400 | | 125,318,701 |
Dentsu, Inc. | 1,934,300 | | 71,916,336 |
East Japan Railway Co. | 1,153,000 | | 90,053,031 |
Fujitsu Ltd. | 9,394,000 | | 57,110,477 |
Hitachi Ltd. | 14,929,000 | | 117,304,245 |
Hoya Corp. | 3,413,800 | | 120,803,601 |
Itochu Corp. | 13,155,000 | | 159,024,789 |
Japan Tobacco, Inc. | 5,500,600 | | 187,675,273 |
KDDI Corp. | 1,977,400 | | 129,854,786 |
Mitsubishi Electric Corp. | 5,811,000 | | 74,925,870 |
Mitsubishi UFJ Financial Group, Inc. | 47,240,400 | | 275,374,446 |
Nippon Telegraph & Telephone Corp. | 2,078,000 | | 129,290,789 |
OMRON Corp. | 1,671,200 | | 79,105,703 |
ORIX Corp. | 6,002,000 | | 83,309,225 |
Seven & i Holdings Co., Ltd. | 3,433,600 | | 134,103,121 |
Seven Bank Ltd. | 16,443,800 | | 68,675,905 |
SoftBank Corp. | 736,900 | | 53,645,891 |
Common Stocks - continued |
| Shares | | Value |
Japan - continued |
Sony Financial Holdings, Inc. | 4,348,800 | | $ 69,427,314 |
Sumitomo Mitsui Trust Holdings, Inc. | 26,450,000 | | 107,988,060 |
Toyota Motor Corp. | 3,065,100 | | 184,449,175 |
TOTAL JAPAN | | 2,319,356,738 |
Korea (South) - 0.5% |
Samsung Electronics Co. Ltd. | 50,264 | | 58,196,014 |
Luxembourg - 0.5% |
RTL Group SA | 607,639 | | 56,470,082 |
Netherlands - 2.5% |
ING Groep NV (Certificaten Van Aandelen) (a) | 10,257,034 | | 146,884,444 |
Reed Elsevier NV | 6,917,046 | | 159,189,586 |
TOTAL NETHERLANDS | | 306,074,030 |
Norway - 0.7% |
Statoil ASA | 3,949,600 | | 90,388,307 |
Singapore - 0.8% |
Singapore Telecommunications Ltd. | 31,663,000 | | 93,193,002 |
Spain - 2.9% |
Amadeus IT Holding SA Class A | 1,852,674 | | 68,025,178 |
Banco Bilbao Vizcaya Argentaria SA | 13,224,418 | | 147,913,640 |
Iberdrola SA | 20,543,000 | | 145,218,860 |
TOTAL SPAIN | | 361,157,678 |
Sweden - 2.2% |
Meda AB (A Shares) (d) | 3,790,800 | | 49,796,876 |
Nordea Bank AB | 13,272,533 | | 170,217,137 |
Svenska Cellulosa AB (SCA) (B Shares) | 2,397,362 | | 53,601,900 |
TOTAL SWEDEN | | 273,615,913 |
Switzerland - 7.9% |
Credit Suisse Group AG | 4,777,681 | | 127,295,589 |
Nestle SA | 3,571,696 | | 261,927,252 |
Novartis AG | 4,275,240 | | 396,754,554 |
Roche Holding AG (participation certificate) | 294,344 | | 86,861,396 |
Syngenta AG (Switzerland) | 158,802 | | 49,110,726 |
UBS AG (NY Shares) | 3,673,671 | | 63,848,402 |
TOTAL SWITZERLAND | | 985,797,919 |
United Kingdom - 23.4% |
AstraZeneca PLC (United Kingdom) | 3,150,950 | | 230,171,803 |
Common Stocks - continued |
| Shares | | Value |
United Kingdom - continued |
BAE Systems PLC | 19,238,450 | | $ 141,168,358 |
Barclays PLC | 43,120,037 | | 165,836,149 |
BG Group PLC | 4,653,100 | | 77,548,709 |
BHP Billiton PLC | 10,550,157 | | 272,580,254 |
BT Group PLC | 5,099,168 | | 30,061,273 |
Bunzl PLC | 4,328,329 | | 117,362,273 |
Compass Group PLC | 7,834,917 | | 126,087,178 |
GlaxoSmithKline PLC | 2,728,008 | | 61,691,078 |
HSBC Holdings PLC sponsored ADR (d) | 6,620,688 | | 337,787,502 |
Imperial Tobacco Group PLC | 4,195,784 | | 181,962,202 |
Informa PLC | 8,064,610 | | 62,053,601 |
ITV PLC | 34,834,685 | | 113,121,842 |
Liberty Global PLC Class A (a) | 1,616,400 | | 73,497,708 |
National Grid PLC | 15,203,128 | | 225,613,832 |
Next PLC | 586,900 | | 60,509,780 |
Prudential PLC | 4,620,401 | | 106,990,139 |
Royal Dutch Shell PLC Class A sponsored ADR | 3,523,413 | | 252,945,819 |
Standard Chartered PLC (United Kingdom) | 2,296,472 | | 34,517,768 |
Vodafone Group PLC sponsored ADR | 7,341,666 | | 243,890,145 |
TOTAL UNITED KINGDOM | | 2,915,397,413 |
United States of America - 2.5% |
AbbVie, Inc. | 818,829 | | 51,962,888 |
Altria Group, Inc. | 1,542,700 | | 74,574,118 |
Constellation Brands, Inc. Class A (sub. vtg.) (a) | 884,400 | | 80,957,976 |
ResMed, Inc. CDI | 12,495,874 | | 65,708,901 |
T-Mobile U.S., Inc. (a) | 1,478,000 | | 43,142,820 |
TOTAL UNITED STATES OF AMERICA | | 316,346,703 |
TOTAL COMMON STOCKS (Cost $11,446,106,925) |
12,183,514,718
|
Nonconvertible Preferred Stocks - 1.0% |
| | | |
Germany - 1.0% |
Volkswagen AG
(Cost $129,679,552) | 607,990 | |
129,561,548
|
Money Market Funds - 1.7% |
| Shares | | Value |
Fidelity Cash Central Fund, 0.11% (b) | 51,516,200 | | $ 51,516,200 |
Fidelity Securities Lending Cash Central Fund, 0.11% (b)(c) | 158,661,960 | | 158,661,960 |
TOTAL MONEY MARKET FUNDS (Cost $210,178,160) |
210,178,160
|
TOTAL INVESTMENT PORTFOLIO - 100.7% (Cost $11,785,964,637) | | 12,523,254,426 |
NET OTHER ASSETS (LIABILITIES) - (0.7)% | | (84,481,953) |
NET ASSETS - 100% | $ 12,438,772,473 |
Legend |
(a) Non-income producing |
(b) Affiliated fund that is generally available only to investment companies and other accounts managed by Fidelity Investments. The rate quoted is the annualized seven-day yield of the fund at period end. A complete unaudited listing of the fund's holdings as of its most recent quarter end is available upon request. In addition, each Fidelity Central Fund's financial statements, which are not covered by the Fund's Report of Independent Registered Public Accounting Firm, are available on the SEC's website or upon request. |
(c) Investment made with cash collateral received from securities on loan. |
(d) Security or a portion of the security is on loan at period end. |
Affiliated Central Funds |
Information regarding fiscal year to date income earned by the Fund from investments in Fidelity Central Funds is as follows: |
Fund | Income earned |
Fidelity Cash Central Fund | $ 163,754 |
Fidelity Securities Lending Cash Central Fund | 10,474,227 |
Total | $ 10,637,981 |
Other Information |
Categorizations in the Schedule of Investments are based on country or territory of incorporation. |
The following is a summary of the inputs used, as of October 31, 2014, involving the Fund's assets and liabilities carried at fair value. The inputs or methodology used for valuing securities may not be an indication of the risk associated with investing in those securities. For more information on valuation inputs, and their aggregation into the levels used in the tables below, please refer to the Investment Valuation section in the accompanying Notes to Financial Statements. |
Valuation Inputs at Reporting Date: |
Description | Total | Level 1 | Level 2 | Level 3 |
Investments in Securities: | | | | |
Equities: | | | | |
Consumer Discretionary | $ 1,279,268,333 | $ 1,022,902,822 | $ 256,365,511 | $ - |
Consumer Staples | 1,049,292,939 | 391,096,196 | 658,196,743 | - |
Energy | 899,045,194 | 322,503,414 | 576,541,780 | - |
Financials | 3,163,919,881 | 1,064,995,173 | 2,098,924,708 | - |
Health Care | 2,007,770,233 | 617,346,879 | 1,390,423,354 | - |
Industrials | 1,012,684,153 | 555,098,094 | 457,586,059 | - |
Information Technology | 693,161,625 | 318,837,599 | 374,324,026 | - |
Materials | 598,053,308 | 276,362,328 | 321,690,980 | - |
Telecommunication Services | 1,124,816,602 | 431,202,410 | 693,614,192 | - |
Utilities | 485,063,998 | 259,450,166 | 225,613,832 | - |
Money Market Funds | 210,178,160 | 210,178,160 | - | - |
Total Investments in Securities: | $ 12,523,254,426 | $ 5,469,973,241 | $ 7,053,281,185 | $ - |
The following is a summary of transfers between Level 1 and Level 2 for the period ended October 31, 2014. Transfers are assumed to have occurred at the beginning of the period, and are primarily attributable to the valuation techniques used for foreign equity securities, as discussed in the accompanying Notes to Financial Statements: |
Transfers | Total |
Level 1 to Level 2 | $ 1,066,257,986 |
Level 2 to Level 1 | $ 0 |
See accompanying notes which are an integral part of the financial statements.
Annual Report
Fidelity Series International Value Fund
Statement of Assets and Liabilities
| October 31, 2014 |
| | |
Assets | | |
Investment in securities, at value (including securities loaned of $155,388,725) - See accompanying schedule: Unaffiliated issuers (cost $11,575,786,477) | $ 12,313,076,266 | |
Fidelity Central Funds (cost $210,178,160) | 210,178,160 | |
Total Investments (cost $11,785,964,637) | | $ 12,523,254,426 |
Receivable for investments sold | | 169,741,999 |
Receivable for fund shares sold | | 9,950,321 |
Dividends receivable | | 38,003,882 |
Distributions receivable from Fidelity Central Funds | | 356,430 |
Prepaid expenses | | 42,214 |
Other receivables | | 186,635 |
Total assets | | 12,741,535,907 |
| | |
Liabilities | | |
Payable to custodian bank | $ 7 | |
Payable for investments purchased | 133,462,326 | |
Payable for fund shares redeemed | 1,765,230 | |
Accrued management fee | 7,427,798 | |
Other affiliated payables | 1,045,393 | |
Other payables and accrued expenses | 400,720 | |
Collateral on securities loaned, at value | 158,661,960 | |
Total liabilities | | 302,763,434 |
| | |
Net Assets | | $ 12,438,772,473 |
Net Assets consist of: | | |
Paid in capital | | $ 10,910,418,563 |
Undistributed net investment income | | 485,385,663 |
Accumulated undistributed net realized gain (loss) on investments and foreign currency transactions | | 306,858,177 |
Net unrealized appreciation (depreciation) on investments and assets and liabilities in foreign currencies | | 736,110,070 |
Net Assets | | $ 12,438,772,473 |
See accompanying notes which are an integral part of the financial statements.
Annual Report
Statement of Assets and Liabilities - continued
| October 31, 2014 |
| | |
Series International Value:
Net Asset Value, offering price and redemption price per share ($5,971,189,491 ÷ 556,628,394 shares) | | $ 10.73 |
| | |
Class F:
Net Asset Value, offering price and redemption price per share ($6,467,582,982 ÷ 600,885,964 shares) | | $ 10.76 |
See accompanying notes which are an integral part of the financial statements.
Annual Report
Fidelity Series International Value Fund
Financial Statements - continued
Statement of Operations
| Year ended October 31, 2014 |
| | |
Investment Income | | |
Dividends | | $ 455,562,825 |
Special dividends | | 208,752,868 |
Interest | | 249 |
Income from Fidelity Central Funds | | 10,637,981 |
Income before foreign taxes withheld | | 674,953,923 |
Less foreign taxes withheld | | (33,630,641) |
Total income | | 641,323,282 |
| | |
Expenses | | |
Management fee
Basic fee | $ 92,413,923 | |
Performance adjustment | (10,470,035) | |
Transfer agent fees | 11,148,599 | |
Accounting and security lending fees | 1,961,239 | |
Custodian fees and expenses | 1,109,554 | |
Independent trustees' compensation | 53,702 | |
Audit | 78,225 | |
Legal | 41,233 | |
Interest | 10,471 | |
Miscellaneous | 88,612 | |
Total expenses before reductions | 96,435,523 | |
Expense reductions | (454,296) | 95,981,227 |
Net investment income (loss) | | 545,342,055 |
Realized and Unrealized Gain (Loss) Net realized gain (loss) on: | | |
Investment securities: | | |
Unaffiliated issuers | 407,896,726 | |
Foreign currency transactions | (5,244,713) | |
Total net realized gain (loss) | | 402,652,013 |
Change in net unrealized appreciation (depreciation) on: Investment securities | (1,081,027,560) | |
Assets and liabilities in foreign currencies | (1,194,740) | |
Total change in net unrealized appreciation (depreciation) | | (1,082,222,300) |
Net gain (loss) | | (679,570,287) |
Net increase (decrease) in net assets resulting from operations | | $ (134,228,232) |
See accompanying notes which are an integral part of the financial statements.
Annual Report
Statement of Changes in Net Assets
| Year ended
October 31,
2014 | Year ended
October 31,
2013 |
Increase (Decrease) in Net Assets | | |
Operations | | |
Net investment income (loss) | $ 545,342,055 | $ 266,930,898 |
Net realized gain (loss) | 402,652,013 | 863,801,313 |
Change in net unrealized appreciation (depreciation) | (1,082,222,300) | 1,178,227,478 |
Net increase (decrease) in net assets resulting from operations | (134,228,232) | 2,308,959,689 |
Distributions to shareholders from net investment income | (280,500,370) | (264,134,724) |
Distributions to shareholders from net realized gain | (41,143,110) | (56,993,210) |
Total distributions | (321,643,480) | (321,127,934) |
Share transactions - net increase (decrease) | 1,583,070,862 | 101,473,805 |
Total increase (decrease) in net assets | 1,127,199,150 | 2,089,305,560 |
| | |
Net Assets | | |
Beginning of period | 11,311,573,323 | 9,222,267,763 |
End of period (including undistributed net investment income of $485,385,663 and undistributed net investment income of $245,251,345, respectively) | $ 12,438,772,473 | $ 11,311,573,323 |
See accompanying notes which are an integral part of the financial statements.
Annual Report
Financial Highlights - Series International Value
Years ended October 31, | 2014 | 2013 | 2012 | 2011 | 2010 H |
Selected Per-Share Data | | | | | |
Net asset value, beginning of period | $ 11.14 | $ 9.16 | $ 8.59 | $ 9.91 | $ 10.00 |
Income from Investment Operations | | | | | |
Net investment income (loss) D | .45G | .26 | .29 | .30 | .18 |
Net realized and unrealized gain (loss) | (.59) | 2.03 | .50 | (1.45) | (.27) |
Total from investment operations | (.14) | 2.29 | .79 | (1.15) | (.09) |
Distributions from net investment income | (.24) | (.26) | (.22) | (.13) | - |
Distributions from net realized gain | (.04) | (.06) | - | (.04) | - |
Total distributions | (.27) K | (.31) J | (.22) | (.17) | - |
Net asset value, end of period | $ 10.73 | $ 11.14 | $ 9.16 | $ 8.59 | $ 9.91 |
Total ReturnB, C | (1.25)% | 25.78% | 9.56% | (11.84)% | (.90)% |
Ratios to Average Net Assets E, I | | | | | |
Expenses before reductions | .82% | .88% | .90% | .95% | 1.01%A |
Expenses net of fee waivers, if any | .82% | .88% | .90% | .95% | 1.01%A |
Expenses net of all reductions | .81% | .85% | .87% | .93% | .99%A |
Net investment income (loss) | 4.05% G | 2.58% | 3.35% | 3.05% | 2.24%A |
Supplemental Data | | | | | |
Net assets, end of period (000 omitted) | $ 5,971,189 | $ 5,710,397 | $ 5,107,633 | $ 4,503,487 | $ 3,865,058 |
Portfolio turnover rateF | 70% | 80% | 63% | 78% | 72% A |
A Annualized
B Total returns for periods of less than one year are not annualized.
C Total returns would have been lower if certain expenses had not been reduced during the applicable periods shown.
D Calculated based on average shares outstanding during the period.
E Fees and expenses of any underlying Fidelity Central Funds are not included in the Fund's expense ratio. The Fund indirectly bears its proportionate share of the expenses of any underlying Fidelity Central Funds.
F Amount does not include the portfolio activity of any underlying Fidelity Central Funds.
G Investment income per share reflects a large, non-recurring dividend which amounted to $.18 per share. Excluding this non-recurring dividend, the ratio of net investment income (loss) to average net assets would have been 2.46%.
H For the period December 3, 2009 (commencement of operations) to October 31, 2010.
I Expense ratios reflect operating expenses of the class. Expenses before reductions do not reflect amounts reimbursed by the investment adviser or reductions from brokerage service arrangements or reductions from other expense offset arrangements and do not represent the amount paid by the class during periods when reimbursements or reductions occur. Expense ratios before reductions for start-up periods may not be representative of longer-term operating periods. Expenses net of fee waivers reflect expenses after reimbursement by the investment adviser but prior to reductions from brokerage service arrangements or other expense offset arrangements. Expenses net of all reductions represent the net expenses paid by the class.
J Total distributions of $.31 per share is comprised of distributions from net investment income of $.256 and distributions from net realized gain of $.057 per share.
K Total distributions of $.27 per share is comprised of distributions from net investment income of $.237 and distributions from net realized gain of $.036 per share.
See accompanying notes which are an integral part of the financial statements.
Annual Report
Financial Highlights - Class F
Years ended October 31, | 2014 | 2013 | 2012 | 2011 | 2010 H |
Selected Per-Share Data | | | | | |
Net asset value, beginning of period | $ 11.18 | $ 9.19 | $ 8.62 | $ 9.93 | $ 10.00 |
Income from Investment Operations | | | | | |
Net investment income (loss) D | .47G | .28 | .30 | .31 | .20 |
Net realized and unrealized gain (loss) | (.60) | 2.04 | .51 | (1.44) | (.27) |
Total from investment operations | (.13) | 2.32 | .81 | (1.13) | (.07) |
Distributions from net investment income | (.25) | (.27) | (.24) | (.14) | - |
Distributions from net realized gain | (.04) | (.06) | - | (.04) | - |
Total distributions | (.29) | (.33) | (.24) | (.18) | - |
Net asset value, end of period | $ 10.76 | $ 11.18 | $ 9.19 | $ 8.62 | $ 9.93 |
Total ReturnB, C | (1.18)% | 26.05% | 9.77% | (11.61)% | (.70)% |
Ratios to Average Net Assets E, I | | | | | |
Expenses before reductions | .65% | .69% | .70% | .74% | .78%A |
Expenses net of fee waivers, if any | .65% | .69% | .70% | .74% | .78%A |
Expenses net of all reductions | .64% | .67% | .67% | .72% | .75%A |
Net investment income (loss) | 4.22%G | 2.76% | 3.55% | 3.26% | 2.47%A |
Supplemental Data | | | | | |
Net assets, end of period (000 omitted) | $ 6,467,583 | $ 5,601,176 | $ 4,114,635 | $ 1,955,967 | $ 730,524 |
Portfolio turnover rateF | 70% | 80% | 63% | 78% | 72% A |
A Annualized
B Total returns for periods of less than one year are not annualized.
C Total returns would have been lower if certain expenses had not been reduced during the applicable periods shown.
D Calculated based on average shares outstanding during the period.
E Fees and expenses of any underlying Fidelity Central Funds are not included in the Fund's expense ratio. The Fund indirectly bears its proportionate share of the expenses of any underlying Fidelity Central Funds.
F Amount does not include the portfolio activity of any underlying Fidelity Central Funds.
G Investment income per share reflects a large, non-recurring dividend which amounted to $.18 per share. Excluding this non-recurring dividend, the ratio of net investment income (loss) to average net assets would have been 2.64%.
H For the period December 3, 2009 (commencement of operations) to October 31, 2010.
I Expense ratios reflect operating expenses of the class. Expenses before reductions do not reflect amounts reimbursed by the investment adviser or reductions from brokerage service arrangements or reductions from other expense offset arrangements and do not represent the amount paid by the class during periods when reimbursements or reductions occur. Expense ratios before reductions for start-up periods may not be representative of longer-term operating periods. Expenses net of fee waivers reflect expenses after reimbursement by the investment adviser but prior to reductions from brokerage service arrangements or other expense offset arrangements. Expenses net of all reductions represent the net expenses paid by the class.
See accompanying notes which are an integral part of the financial statements.
Annual Report
Notes to Financial Statements
For the period ended October 31, 2014
1. Organization.
Fidelity Series Emerging Markets Fund, Fidelity Series International Growth Fund, Fidelity Series International Small Cap Fund and Fidelity Series International Value Fund (the Funds) are funds of Fidelity Investment Trust (the Trust). The Trust is registered under the Investment Company Act of 1940, as amended (the 1940 Act), as an open-end management investment company organized as a Massachusetts business trust. Each Fund is authorized to issue an unlimited number of shares. Shares of the Funds are only available for purchase by mutual funds for which Fidelity Management & Research Company (FMR) or an affiliate serves as an investment manager. Fidelity Series Emerging Markets Fund offers Series Emerging Markets shares and Class F shares. Fidelity Series International Growth Fund offers Series International Growth shares and Class F shares. Fidelity Series International Small Cap Fund offers Series International Small Cap shares and Class F shares. Fidelity Series International Value Fund offers Series International Value shares and Class F shares. All classes have equal rights as to assets and voting privileges. Each class has exclusive voting rights with respect to matters that affect that class. The Funds' investments in emerging markets can be subject to social, economic, regulatory, and political uncertainties and can be extremely volatile.
2. Investments in Fidelity Central Funds.
The Funds invest in Fidelity Central Funds, which are open-end investment companies generally available only to other investment companies and accounts managed by the investment adviser and its affiliates. The Funds' Schedules of Investments list each of the Fidelity Central Funds held as of period end, if any, as an investment of each Fund, but do not include the underlying holdings of each Fidelity Central Fund. As an Investing Fund, each Fund indirectly bears its proportionate share of the expenses of the underlying Fidelity Central Funds.
The Money Market Central Funds seek preservation of capital and current income and are managed by Fidelity Investments Money Management, Inc. (FIMM), an affiliate of the investment adviser. Annualized expenses of the Money Market Central Funds as of their most recent shareholder report date are less than .01%.
A complete unaudited list of holdings for each Fidelity Central Fund is available upon request or at the Securities and Exchange Commission (the SEC) website at www.sec.gov. In addition, the financial statements of the Fidelity Central Funds, which are not covered by the Funds' Report of Independent Registered Public Accounting Firm, are available on the SEC website or upon request.
Annual Report
Notes to Financial Statements - continued
3. Significant Accounting Policies.
The financial statements have been prepared in conformity with accounting principles generally accepted in the United States of America (GAAP), which require management to make certain estimates and assumptions at the date of the financial statements. Actual results could differ from those estimates. Subsequent events, if any, through the date that the financial statements were issued have been evaluated in the preparation of the financial statements. The following summarizes the significant accounting policies of the Funds:
Investment Valuation. Investments are valued as of 4:00 p.m. Eastern time on the last calendar day of the period. In accordance with valuation policies and procedures approved by the Board of Trustees (the Board), each Fund attempts to obtain prices from one or more third party pricing vendors or brokers to value its investments. When current market prices, quotations or currency exchange rates are not readily available or reliable, investments will be fair valued in good faith by the FMR Fair Value Committee (the Committee), in accordance with procedures adopted by the Board. Factors used in determining fair value vary by investment type and may include market or investment specific events, changes in interest rates and credit quality. The frequency with which these procedures are used cannot be predicted and they may be utilized to a significant extent. The Committee oversees each Fund's valuation policies and procedures and is responsible for approving and reporting to the Board all fair value determinations.
Each Fund categorizes the inputs to valuation techniques used to value its investments into a disclosure hierarchy consisting of three levels as shown below:
Level 1 - quoted prices in active markets for identical investments
Level 2 - other significant observable inputs (including quoted prices for similar investments, interest rates, prepayment speeds, etc.)
Level 3 - unobservable inputs (including the Fund's own assumptions based on the best information available)
Valuation techniques used to value each Fund's investments by major category are as follows:
Equity securities, including restricted securities, for which market quotations are readily available, are valued at the last reported sale price or official closing price as reported by a third party pricing vendor on the primary market or exchange on which they are traded and are categorized as Level 1 in the hierarchy. In the event there were no sales during the day or closing prices are not available, securities are valued at the last quoted bid price or may be valued using the last available price and are generally categorized as Level 2 in the hierarchy. For foreign equity securities, when market or security specific events arise, comparisons to the valuation of American Depositary Receipts (ADRs),
Annual Report
3. Significant Accounting Policies - continued
Investment Valuation - continued
futures contracts, Exchange-Traded Funds (ETFs) and certain indexes as well as quoted prices for similar securities may be used and would be categorized as Level 2 in the hierarchy. Utilizing these techniques may result in transfers between Level 1 and Level 2. For equity securities, including restricted securities, where observable inputs are limited, assumptions about market activity and risk are used and these securities may be categorized as Level 3 in the hierarchy.
Debt securities, including restricted securities, are valued based on evaluated prices received from third party pricing vendors or from brokers who make markets in such securities. U.S. government and government agency obligations are valued by pricing vendors who utilize matrix pricing which considers yield or price of bonds of comparable quality, coupon, maturity and type or by broker-supplied prices. When independent prices are unavailable or unreliable, debt securities may be valued utilizing pricing methodologies which consider similar factors that would be used by third party pricing vendors. Debt securities are generally categorized as Level 2 in the hierarchy but may be Level 3 depending on the circumstances.
Futures contracts are valued at the settlement price established each day by the board of trade or exchange on which they are traded and are categorized as Level 1 in the hierarchy. Investments in open-end mutual funds, including the Fidelity Central Funds, are valued at their closing net asset value (NAV) each business day and are categorized as Level 1 in the hierarchy.
Changes in valuation techniques may result in transfers in or out of an assigned level within the disclosure hierarchy. The aggregate value of investments by input level, as of October 31, 2014, including information on transfers between Levels 1 and 2, is included at the end of each applicable Fund's Schedule of Investments.
Foreign Currency. The Funds may use foreign currency contracts to facilitate transactions in foreign-denominated securities. Gains and losses from these transactions may arise from changes in the value of the foreign currency or if the counterparties do not perform under the contracts' terms.
Foreign-denominated assets, including investment securities, and liabilities are translated into U.S. dollars at the exchange rates at period end. Purchases and sales of investment securities, income and dividends received and expenses denominated in foreign currencies are translated into U.S. dollars at the exchange rate in effect on the transaction date.
Annual Report
Notes to Financial Statements - continued
3. Significant Accounting Policies - continued
Foreign Currency - continued
The effects of exchange rate fluctuations on investments are included with the net realized and unrealized gain (loss) on investment securities. Other foreign currency transactions resulting in realized and unrealized gain (loss) are disclosed separately.
Investment Transactions and Income. For financial reporting purposes, the Funds' investment holdings and NAV include trades executed through the end of the last business day of the period. The NAV per share for processing shareholder transactions is calculated as of the close of business of the New York Stock Exchange (NYSE), normally 4:00 p.m. Eastern time and includes trades executed through the end of the prior business day. Gains and losses on securities sold are determined on the basis of identified cost. Dividend income is recorded on the ex-dividend date, except for certain dividends from foreign securities where the ex-dividend date may have passed, which are recorded as soon as the Funds are informed of the ex-dividend date. Non-cash dividends included in dividend income, if any, are recorded at the fair market value of the securities received. Income and capital gain distributions from Fidelity Central Funds, if any, are recorded on the ex-dividend date. Distributions received on securities that represent a return of capital or capital gain are recorded as a reduction of cost of investments and/or as a realized gain. Subsequent to ex-dividend date the Funds determine the components of these distributions, based upon receipt of tax filings or other correspondence relating to the underlying investment. Large, non-recurring dividends recognized by the Funds are presented separately on the Statement of Operations as "Special Dividends" and the impact of these dividends is presented in the Financial Highlights. Interest income is accrued as earned and includes coupon interest and amortization of premium and accretion of discount on debt securities as applicable. Investment income is recorded net of foreign taxes withheld where recovery of such taxes is uncertain.
Class Allocations and Expenses. Investment income, realized and unrealized capital gains and losses, common expenses of each Fund, and certain fund-level expense reductions, if any, are allocated daily on a pro-rata basis to each class based on the relative net assets of each class to the total net assets of each Fund. Each class differs with respect to transfer agent fees incurred. Certain expense reductions may also differ by class. For the reporting period, the allocated portion of income and expenses to each class as a percent of its average net assets may vary due to the timing of recording these transactions in relation to fluctuating net assets of the classes. Expenses directly attributable to a fund are charged to that fund. Expenses attributable to more than one fund are allocated among the respective funds on the basis of relative net assets or other appropriate methods. Expense estimates are accrued in the period to which they relate and adjustments are made when actual amounts are known.
Annual Report
3. Significant Accounting Policies - continued
Income Tax Information and Distributions to Shareholders. Each year, each Fund intends to qualify as a regulated investment company under Subchapter M of the Internal Revenue Code, including distributing substantially all of its taxable income and realized gains. As a result, no provision for U.S. Federal income taxes is required. As of October 31, 2014, each Fund did not have any unrecognized tax benefits in the financial statements; nor is each Fund aware of any tax positions for which it is reasonably possible that the total amounts of unrecognized tax benefits will significantly change in the next twelve months. Each Fund files a U.S. federal tax return, in addition to state and local tax returns as required. Each Fund's federal income tax returns are subject to examination by the Internal Revenue Service (IRS) for a period of three fiscal years after they are filed. State and local tax returns may be subject to examination for an additional fiscal year depending on the jurisdiction. Foreign taxes are provided for based on each Fund's understanding of the tax rules and rates that exist in the foreign markets in which it invests. Fidelity Series Emerging Markets Fund and Fidelity Series International Small Cap Fund are subject to a tax imposed on capital gains by certain countries in which they invest. An estimated deferred tax liability for net unrealized appreciation on the applicable securities is included in Other payables and accrued expenses on each applicable Fund's Statement of Assets & Liabilities.
Distributions are declared and recorded on the ex-dividend date. Income dividends and capital gain distributions are declared separately for each class. Income and capital gain distributions are determined in accordance with income tax regulations, which may differ from GAAP.
Capital accounts within the financial statements are adjusted for permanent book-tax differences. These adjustments have no impact on net assets or the results of operations. Capital accounts are not adjusted for temporary book-tax differences which will reverse in a subsequent period.
Book-tax differences are primarily due to futures contracts, foreign currency transactions, certain foreign taxes, passive foreign investment companies (PFIC), market discount, partnerships, capital loss carryforwards and losses deferred due to wash sales.
Annual Report
Notes to Financial Statements - continued
3. Significant Accounting Policies - continued
Income Tax Information and Distributions to Shareholders - continued
The federal tax cost of investment securities and unrealized appreciation (depreciation) as of period end were as follows for each Fund:
| Tax cost | Gross unrealized
appreciation | Gross unrealized
depreciation | Net unrealized
appreciation
(depreciation) on
securities |
Fidelity Series Emerging Markets Fund | $ 9,353,924,711 | $ 1,491,160,458 | $ (617,910,518) | $ 873,249,940 |
Fidelity Series International Growth Fund | 10,004,643,707 | 2,995,411,457 | (178,524,100) | 2,816,887,357 |
Fidelity Series International Small Cap Fund | 2,247,138,987 | 687,139,787 | (105,078,977) | 582,060,810 |
Fidelity Series International Value Fund | 11,848,142,824 | 1,260,333,840 | (585,222,238) | 675,111,602 |
The tax-based components of distributable earnings as of period end were as follows for each Fund:
| Undistributed
ordinary
income | Undistributed
long-term
capital gain | Capital loss
carryforward | Net unrealized
appreciation
(depreciation)
on securities and
other investments |
Fidelity Series Emerging Markets Fund | $ 76,236,744 | $ - | $ (170,132,361) | $ 871,981,408 |
Fidelity Series International Growth Fund | 167,779,579 | 186,157,361 | - | 2,815,768,620 |
Fidelity Series International Small Cap Fund | 30,288,339 | 33,684,947 | - | 581,804,631 |
Fidelity Series International Value Fund | 485,425,153 | 369,036,365 | - | 673,892,392 |
Capital loss carryforwards are only available to offset future capital gains of the Funds to the extent provided by regulations and may be limited. Under the Regulated Investment Company Modernization Act of 2010 (the Act), the Funds are permitted to carry forward
Annual Report
3. Significant Accounting Policies - continued
Income Tax Information and Distributions to Shareholders - continued
capital losses incurred in taxable years beginning after December 22, 2010 for an unlimited period and such capital losses are required to be used prior to any losses that expire. The capital loss carryforward information presented below, including any applicable limitation, is estimated as of fiscal period end and is subject to adjustment.
| No expiration | | |
| Short-term | Long-term | Total capital loss
carryfoward |
Fidelity Series Emerging Markets Fund | $ (170,132,361) | $ - | $ (170,132,361) |
The tax character of distributions paid was as follows:
October 31, 2014 | | | |
| Ordinary Income | Long-term
Capital Gains | Total |
Fidelity Series Emerging Markets Fund | $ 85,373,110 | $ - | $ 85,373,110 |
Fidelity Series International Growth Fund | 98,329,968 | 45,984,907 | 144,314,875 |
Fidelity Series International Small Cap Fund | 29,845,642 | 66,561,243 | 96,406,885 |
Fidelity Series International Value Fund | 321,643,480 | - | 321,643,480 |
October 31, 2013 | | | |
| Ordinary Income | Long-Term
Capital Gains | Total |
Fidelity Series Emerging Markets Fund | $ 86,946,753 | $ - | $ 86,946,753 |
Fidelity Series International Growth Fund | 154,572,907 | - | 154,572,907 |
Fidelity Series International Small Cap Fund | 21,986,226 | - | 21,986,226 |
Fidelity Series International Value Fund | 321,127,934 | - | 321,127,934 |
Restricted Securities. The Funds may invest in securities that are subject to legal or contractual restrictions on resale. These securities generally may be resold in transactions exempt from registration or to the public if the securities are registered. Disposal of these securities may involve time-consuming negotiations and expense, and prompt sale at an acceptable price may be difficult. Information regarding restricted securities is included at the end of each applicable Fund's Schedule of Investments.
Annual Report
Notes to Financial Statements - continued
3. Significant Accounting Policies - continued
New Accounting Pronouncement. In June 2014, the Financial Accounting Standards Board issued Accounting Standard Update No. 2014-11, Repurchase-to-Maturity Transactions, Repurchase Financings, and Disclosures. The Update amends the accounting for certain repurchase agreements and expands disclosure requirements for reverse repurchase agreements, securities lending and other similar transactions. The disclosure requirements are effective for annual and interim reporting periods beginning after December 15, 2014. Management is currently evaluating the impact of the Update on the Funds' financial statements and related disclosures.
4. Derivative Instruments.
Risk Exposures and the Use of Derivative Instruments. The Funds' investment objective allows the Funds to enter into various types of derivative contracts, including futures contracts. Derivatives are investments whose value is primarily derived from underlying assets, indices or reference rates and may be transacted on an exchange or over-the-counter (OTC). Derivatives may involve a future commitment to buy or sell a specified asset based on specified terms, to exchange future cash flows at periodic intervals based on a notional principal amount, or for one party to make one or more payments upon the occurrence of specified events in exchange for periodic payments from the other party.
The Funds used derivatives to increase returns and to manage exposure to certain risks as defined below. The success of any strategy involving derivatives depends on analysis of numerous economic factors, and if the strategies for investment do not work as intended, the Funds may not achieve their objectives.
The Funds' use of derivatives increased or decreased their exposure to the following risk:
Equity Risk | Equity risk relates to the fluctuations in the value of financial instruments as a result of changes in market prices (other than those arising from interest rate risk or foreign exchange risk), whether caused by factors specific to an individual investment, its issuer, or all factors affecting all instruments traded in a market or market segment. |
The Funds are also exposed to additional risks from investing in derivatives, such as liquidity risk and counterparty credit risk. Liquidity risk is the risk that the Funds will be unable to close out the derivative in the open market in a timely manner. Counterparty credit risk is the risk that the counterparty will not be able to fulfill its obligation to the Funds. Counterparty credit risk related to exchange-traded futures contracts may be mitigated by the protection provided by the exchange on which they trade.
Annual Report
4. Derivative Instruments - continued
Risk Exposures and the Use of Derivative Instruments - continued
Investing in derivatives may involve greater risks than investing in the underlying assets directly and, to varying degrees, may involve risk of loss in excess of any initial investment and collateral received and amounts recognized in the Statement of Assets and Liabilities. In addition, there may be the risk that the change in value of the derivative contract does not correspond to the change in value of the underlying instrument.
Futures Contracts. A futures contract is an agreement between two parties to buy or sell a specified underlying instrument for a fixed price at a specified future date. The Funds used futures contracts to manage their exposure to the stock market.
Upon entering into a futures contract, a fund is required to deposit either cash or securities (initial margin) with a clearing broker in an amount equal to a certain percentage of the face value of the contract. Futures contracts are marked-to-market daily and subsequent daily payments (variation margin) are made or received by a fund depending on the daily fluctuations in the value of the futures contracts and are recorded as unrealized appreciation or (depreciation). This receivable and/or payable, if any, is included in daily variation margin for derivative instruments in the Statement of Assets and Liabilities. Realized gain or (loss) is recorded upon the expiration or closing of a futures contract. The net realized gain (loss) and change in net unrealized appreciation (depreciation) on futures contracts during the period is included in the Statement of Operations.
Any open futures contracts at period end are presented in the Schedule of Investments under the caption "Futures Contracts." The underlying face amount at value reflects each contract's exposure to the underlying instrument or index at period end. Securities deposited to meet initial margin requirements are identified in the Schedule of Investments.
During the period the Fidelity Series Emerging Markets Fund recognized net realized gain (loss) of $(33,204,989) and a change in net unrealized appreciation (depreciation) of $8,302,316 related to its investment in futures contracts. These amounts are included in the Statement of Operations.
Annual Report
Notes to Financial Statements - continued
5. Purchases and Sales of Investments.
Purchases and sales of securities, other than short-term securities, are noted in the table below.
| Purchases ($) | Sales ($) |
Fidelity Series Emerging Markets Fund | 9,971,193,312 | 7,633,340,346 |
Fidelity Series International Growth Fund | 5,556,744,943 | 4,195,534,275 |
Fidelity Series International Small Cap Fund | 1,012,599,722 | 495,627,160 |
Fidelity Series International Value Fund | 10,991,235,172 | 9,092,278,261 |
6. Fees and Other Transactions with Affiliates.
Management Fee. Fidelity Management & Research Company (the investment adviser) and its affiliates provide the Funds with investment management related services for which the Funds pay a monthly management fee. The management fee is the sum of an individual fund fee rate and an annualized group fee rate. The individual fund fee rate is applied to each Fund's average net assets. The group fee rate is based upon the average net assets of all the mutual funds advised by the investment adviser, including any mutual funds previously advised by the investment adviser that are currently advised by Fidelity SelectCo, LLC, an affiliate of the investment adviser. The group fee rate decreases as assets under management increase and increases as assets under management decrease. In addition, the management fee for Fidelity Series International Growth Fund, Fidelity Series International Small Cap Fund and Fidelity Series International Value Fund is subject to a performance adjustment (up to a maximum of ± .20% of each applicable Fund's average net assets over a 36 month performance period.) The upward or downward adjustment to the management fee is based on each fund's relative investment performance of the asset-weighted return of all classes as compared to its benchmark index over the same 36 month performance period. For the reporting period, each Fund's annual management fee rate expressed as a percentage of each Fund's average net assets, including the performance adjustment, if applicable was as follows. The performance adjustment included in the management fee rate may be higher or lower than the maximum performance adjustment rate due to the difference between the average net asset for the reporting and performance periods.
Fund Name | Individual Rate | Group Rate | Total |
Fidelity Series Emerging Markets Fund | .55% | .25% | .80% |
Fidelity Series International Growth Fund | .45% | .25% | .77% |
Fidelity Series International Small Cap Fund | .60% | .25% | .95% |
Fidelity Series International Value Fund | .45% | .25% | .62% |
Transfer Agent Fees. Fidelity Investments Institutional Operations Company, Inc., (FIIOC), an affiliate of the investment adviser, is the transfer, dividend disbursing and
Annual Report
6. Fees and Other Transactions with Affiliates - continued
Transfer Agent Fees - continued
shareholder servicing agent for each class of the Funds. FIIOC receives account fees and asset-based fees that vary according to the account size and type of account of the shareholders of the respective classes of each Fund except for Class F. FIIOC receives no fees for providing transfer agency services to Class F. FIIOC pays for typesetting, printing and mailing of shareholder reports, except proxy statements. For the period, transfer agent fees for each class were as follows:
Fidelity Series Emerging Markets Fund | Amount | % of
Class-Level Average
Net Assets |
Series Emerging Markets | $ 7,114,834 | .17 |
Fidelity Series International Growth Fund | | |
Series International Growth | 11,087,250 | .17 |
Fidelity Series International Small Cap Fund | | |
Series International Small Cap | 2,446,205 | .17 |
Fidelity Series International Value Fund | | |
Series International Value | 11,148,599 | .17 |
Accounting and Security Lending Fees. Fidelity Service Company, Inc. (FSC), an affiliate of the investment adviser, maintains each Fund's accounting records. The accounting fee is based on the level of average net assets for each month. Under a separate contract, FSC administers the security lending program. The security lending fee is based on the number and duration of lending transactions.
Brokerage Commissions. Certain Funds placed a portion of their portfolio transactions with brokerage firms which are affiliates of the investment adviser. Brokerage commissions are included in net realized gain (loss) and change in net unrealized appreciation (depreciation) in the Statement of Operations. The commissions paid to these affiliated firms were as follows:
| Amount |
Fidelity Series Emerging Markets Fund | $ 94,395 |
Fidelity Series International Growth Fund | 8,597 |
Fidelity Series International Small Cap Fund | 2,904 |
Fidelity Series International Value Fund | 13,637 |
Interfund Lending Program. Pursuant to an Exemptive Order issued by the SEC, the Funds, along with other registered investment companies having management contracts with FMR or other affiliated entities of FMR, may participate in an interfund lending program. This program provides an alternative credit facility allowing the funds to
Annual Report
Notes to Financial Statements - continued
6. Fees and Other Transactions with Affiliates - continued
Interfund Lending Program - continued
borrow from, or lend money to, other participating affiliated funds. At period end, there were no interfund loans outstanding. Each applicable fund's activity in this program during the period for which loans were outstanding was as follows:
| Borrower or
Lender | Average Loan
Balance | Weighted
Average
Interest Rate | Interest
Expense |
Fidelity Series International Growth Fund | Borrower | $ 102,435,529 | .31% | $ 14,850 |
Fidelity Series International Value Fund | Borrower | 70,863,588 | .31% | 10,471 |
7. Committed Line of Credit.
Certain Funds participate with other funds managed by the investment adviser or an affiliate in a $4.25 billion credit facility (the "line of credit") to be utilized for temporary or emergency purposes to fund shareholder redemptions or for other short-term liquidity purposes. The participating funds have agreed to pay commitment fees on their pro-rata portion of the line of credit, which are reflected in Miscellaneous expenses on the Statement of Operations, and are as follows:
Fidelity Series Emerging Markets Fund | $ 13,151 |
Fidelity Series International Growth Fund | 20,984 |
Fidelity Series International Small Cap Fund | 4,572 |
Fidelity Series International Value Fund | 21,086 |
During the period, the Funds did not borrow on this line of credit.
8. Security Lending.
Certain Funds lend portfolio securities through a lending agent from time to time in order to earn additional income. For equity securities, a lending agent is used and may loan securities to certain qualified borrowers, including Fidelity Capital Markets (FCM), a broker-dealer affiliated with the Funds. On the settlement date of the loan, each applicable Fund receives collateral (in the form of U.S. Treasury obligations, letters of credit and/or cash) against the loaned securities and maintains collateral in an amount not less than 100% of the market value of the loaned securities during the period of the loan. The market value of the loaned securities is determined at the close of business of the Funds and any additional required collateral is delivered to the Funds on the next
Annual Report
8. Security Lending - continued
business day. If the borrower defaults on its obligation to return the securities loaned because of insolvency or other reasons, the Funds may apply collateral received from the borrower against the obligation. The Funds may experience delays and costs in recovering the securities loaned. Any cash collateral received is invested in the Fidelity Securities Lending Cash Central Fund. The value of loaned securities and cash collateral at period end are disclosed on each applicable Fund's Statement of Assets and Liabilities. Security lending income represents the income earned on investing cash collateral, less rebates paid to borrowers and any lending agent fees associated with the loan, plus any premium payments received for lending certain types of securities. Security lending income is presented on each applicable Fund's Statement of Operations as a component of income from Fidelity Central Funds. FCM security lending activity was as follows:
| Total Security
Lending
Income | Security Lending
Income From
Securities
Loaned to FCM | Value of
Securities
Loaned to FCM
at Period End |
Fidelity Series Emerging Markets Fund | $ 1,617,498 | $ 18,647 | $ 833,490 |
Fidelity Series International Growth Fund | 5,257,021 | 186,367 | - |
Fidelity Series International Small Cap Fund | 1,186,817 | 91,172 | 8,517,082 |
Fidelity Series International Value Fund | 10,474,227 | 2,096 | - |
9. Expense Reductions.
Commissions paid to certain brokers with whom the investment adviser, or its affiliates, places trades on behalf of Certain Funds include an amount in addition to trade execution, which may be rebated back to the Funds to offset certain expenses. In addition, through arrangements with each applicable Fund's custodian, credits realized as a result of uninvested cash balances were used to reduce the Fund's expenses. All of the applicable expense reductions are noted in the table below.
| Brokerage Service
reduction | Custody
expense
reduction |
Fidelity Series Emerging Markets Fund | $ 60,546 | $ 204 |
Fidelity Series International Growth Fund | 96,567 | - |
Fidelity Series International Value Fund | 454,296 | - |
Annual Report
Notes to Financial Statements - continued
10. Distributions to Shareholders.
Distributions to shareholders of each class were as follows:
Years ended October 31, | 2014 | 2013 |
Fidelity Series Emerging Markets Fund | | |
From net investment income | | |
Series Emerging Markets | $ 38,549,457 | $ 42,756,925 |
Class F | 44,053,623 | 41,009,060 |
Total | $ 82,603,080 | $ 83,765,985 |
From net realized gain | | |
Series Emerging Markets | $ 1,393,354 | $ 1,733,389 |
Class F | 1,376,676 | 1,447,379 |
Total | $ 2,770,030 | $ 3,180,768 |
Fidelity Series International Growth Fund | | |
From net investment income | | |
Series International Growth | $ 44,982,373 | $ 79,982,034 |
Class F | 53,347,595 | 74,590,873 |
Total | $ 98,329,968 | $ 154,572,907 |
From net realized gain | | |
Series International Growth | $ 23,186,790 | $ - |
Class F | 22,798,117 | - |
Total | $ 45,984,907 | $ - |
Fidelity Series International Small Cap Fund | | |
From net investment income | | |
Series International Small Cap | $ 10,579,671 | $ 10,164,093 |
Class F | 12,074,681 | 10,323,285 |
Total | $ 22,654,352 | $ 20,487,378 |
From net realized gain | | |
Series International Small Cap | $ 37,028,847 | $ 819,685 |
Class F | 36,723,686 | 679,163 |
Total | $ 73,752,533 | $ 1,498,848 |
Fidelity Series International Value Fund | | |
From net investment income | | |
Series International Value | $ 136,444,048 | $ 139,841,918 |
Class F | 144,056,322 | 124,292,806 |
Total | $ 280,500,370 | $ 264,134,724 |
From net realized gain | | |
Series International Value | $ 20,725,678 | $ 31,136,677 |
Class F | 20,417,432 | 25,856,533 |
Total | $ 41,143,110 | $ 56,993,210 |
Annual Report
11. Share Transactions.
Transactions for each class of shares were as follows:
| Shares | Shares | Dollars | Dollars |
Years ended October 31, | 2014 | 2013 | 2014 | 2013 |
Fidelity Series Emerging Markets Fund | | | | |
Series Emerging Markets | | | | |
Shares sold | 92,426,382 | 38,959,533 | $ 1,645,786,227 | $ 645,995,579 |
Reinvestment of distributions | 2,310,168 | 2,717,796 | 39,942,811 | 44,490,314 |
Shares redeemed | (28,925,774) | (31,216,858) | (505,237,270) | (524,357,869) |
Net increase (decrease) | 65,810,776 | 10,460,471 | $ 1,180,491,768 | $ 166,128,024 |
Class F | | | | |
Shares sold | 119,603,499 | 48,367,901 | $ 2,144,127,127 | $ 813,845,994 |
Reinvestment of distributions | 2,622,996 | 2,590,387 | 45,430,299 | 42,456,439 |
Shares redeemed | (28,307,280) | (10,556,755) | (494,527,855) | (179,653,412) |
Net increase (decrease) | 93,919,215 | 40,401,533 | $ 1,695,029,571 | $ 676,649,021 |
Fidelity Series International Growth Fund | | | | |
Series International Growth | | | | |
Shares sold | 111,100,310 | 39,398,443 | $ 1,551,845,942 | $ 510,170,838 |
Reinvestment of distributions | 4,921,961 | 6,859,523 | 68,169,163 | 79,982,034 |
Shares redeemed | (93,568,720) | (78,355,276) | (1,326,687,201) | (971,293,070) |
Net increase (decrease) | 22,453,551 | (32,097,310) | $ 293,327,904 | $ (381,140,198) |
Class F | | | | |
Shares sold | 144,005,124 | 72,396,842 | $ 2,024,480,402 | $ 918,440,640 |
Reinvestment of distributions | 5,489,958 | 6,386,205 | 76,145,712 | 74,590,873 |
Shares redeemed | (82,443,810) | (33,723,110) | (1,173,189,085) | (422,112,675) |
Net increase (decrease) | 67,051,272 | 45,059,937 | $ 927,437,029 | $ 570,918,838 |
Fidelity Series International Small Cap Fund | | | | |
Series International Small Cap | | | | |
Shares sold | 27,564,831 | 5,971,087 | $ 428,962,557 | $ 84,453,632 |
Reinvestment of distributions | 3,165,460 | 869,658 | 47,608,518 | 10,983,778 |
Shares redeemed | (17,122,638) | (16,651,980) | (270,568,578) | (224,499,941) |
Net increase (decrease) | 13,607,653 | (9,811,235) | $ 206,002,497 | $ (129,062,531) |
Annual Report
Notes to Financial Statements - continued
11. Share Transactions - continued
| Shares | Shares | Dollars | Dollars |
Years ended October 31, | 2014 | 2013 | 2014 | 2013 |
Series International Small Cap | | | | |
Class F | | | | |
Shares sold | 33,881,109 | 12,254,974 | $ 531,825,078 | $ 168,713,546 |
Reinvestment of distributions | 3,238,113 | 869,759 | 48,798,367 | 11,002,448 |
Shares redeemed | (14,508,461) | (7,885,777) | (230,898,955) | (107,516,162) |
Net increase (decrease) | 22,610,761 | 5,238,956 | $ 349,724,490 | $ 72,199,832 |
Fidelity Series International Value Fund | | | | |
Series International Value | | | | |
Shares sold | 144,202,227 | 47,159,267 | $ 1,593,743,427 | $ 484,088,995 |
Reinvestment of distributions | 14,552,752 | 18,706,630 | 157,169,726 | 170,978,595 |
Shares redeemed | (114,686,628) | (110,968,953) | (1,270,496,899) | (1,082,752,825) |
Net increase (decrease) | 44,068,351 | (45,103,056) | $ 480,416,254 | $ (427,685,235) |
Class F | | | | |
Shares sold | 185,652,636 | 89,535,804 | $ 2,061,243,349 | $ 896,793,608 |
Reinvestment of distributions | 15,200,901 | 16,409,764 | 164,473,754 | 150,149,339 |
Shares redeemed | (101,157,768) | (52,596,433) | (1,123,062,495) | (517,783,907) |
Net increase (decrease) | 99,695,769 | 53,349,135 | $ 1,102,654,608 | $ 529,159,040 |
12. Other.
The Funds' organizational documents provide former and current trustees and officers with a limited indemnification against liabilities arising in connection with the performance of their duties to the Funds. In the normal course of business, the Funds may also enter into contracts that provide general indemnifications. The Funds' maximum exposure under these arrangements is unknown as this would be dependent on future claims that may be made against the Funds. The risk of material loss from such claims is considered remote.
At the end of the period, mutual funds managed by the investment adviser or its affiliates were the owners of record of all of the outstanding shares of the Funds.
Annual Report
To the Trustees of Fidelity Investment Trust and the Shareholders of Fidelity Series International Growth Fund:
In our opinion, the accompanying statements of assets and liabilities, including the schedules of investments, and the related statements of operations and of changes in net assets and the financial highlights present fairly, in all material respects, the financial positions of Fidelity Series International Growth Fund (fund of Fidelity Investment Trust) at October 31, 2014, the results of each of their operations for the year then ended, the changes in its net assets for each of the two years in the period then ended and the financial highlights for each of the periods indicated, in conformity with accounting principles generally accepted in the United States of America. These financial statements and financial highlights (hereafter referred to as "financial statements") are the responsibility of the management of Fidelity Series International Growth Fund. Our responsibility is to express an opinion on these financial statements based on our audits. We conducted our audits of these financial statements in accordance with the standards of the Public Company Accounting Oversight Board (United States). Those standards require that we plan and perform the audit to obtain reasonable assurance about whether the financial statements are free of material misstatement. An audit includes examining, on a test basis, evidence supporting the amounts and disclosures in the financial statements, assessing the accounting principles used and significant estimates made by management, and evaluating the overall financial statement presentation. We believe that our audits, which included confirmation of securities at October 31, 2014 by correspondence with the custodian and brokers, provide a reasonable basis for our opinion.
PricewaterhouseCoopers LLP
Boston, Massachusetts
December 22, 2014
Annual Report
Report of Independent Registered Public Accounting Firm
To the Trustees of Fidelity Investment Trust and the Shareholders of Fidelity Series Emerging Markets Fund, Fidelity Series International Small Cap Fund and Fidelity Series International Value Fund:
We have audited the accompanying statements of assets and liabilities of Fidelity Series Emerging Markets Fund, Fidelity Series International Small Cap Fund and Fidelity Series International Value Fund (Funds of Fidelity Investment Trust), including the schedules of investments, as of October 31, 2014, and the related statements of operations for the year then ended, the statements of changes in net assets for each of the two years in the period then ended, and the financial highlights for each of the periods indicated. These financial statements and financial highlights are the responsibility of the Funds' management. Our responsibility is to express an opinion on these financial statements and financial highlights based on our audits.
We conducted our audits in accordance with the standards of the Public Company Accounting Oversight Board (United States). Those standards require that we plan and perform the audit to obtain reasonable assurance about whether the financial statements and financial highlights are free of material misstatement. The Funds are not required to have, nor were we engaged to perform, an audit of their internal control over financial reporting. Our audits included consideration of internal control over financial reporting as a basis for designing audit procedures that are appropriate in the circumstances, but not for the purpose of expressing an opinion on the effectiveness of the Funds' internal control over financial reporting. Accordingly, we express no such opinion. An audit also includes examining, on a test basis, evidence supporting the amounts and disclosures in the financial statements, assessing the accounting principles used and significant estimates made by management, as well as evaluating the overall financial statement presentation. Our procedures included confirmation of securities owned as of October 31, 2014, by correspondence with the custodians and brokers; where replies were not received from brokers, we performed other auditing procedures. We believe that our audits provide a reasonable basis for our opinion.
In our opinion, the financial statements and financial highlights referred to above present fairly, in all material respects, the financial position of Fidelity Series Emerging Markets Fund, Fidelity Series International Small Cap Fund and Fidelity Series International Value Fund as of October 31, 2014, the results of their operations for the year then ended, the changes in their net assets for each of the two years in the period then ended, and the financial highlights for each of the periods indicated, in conformity with accounting principles generally accepted in the United States of America.
DELOITTE & TOUCHE LLP
Boston, Massachusetts
December 22, 2014
Annual Report
The Trustees, Member of the Advisory Board, and officers of the trust and funds, as applicable, are listed below. The Board of Trustees governs each fund and is responsible for protecting the interests of shareholders. The Trustees are experienced executives who meet periodically throughout the year to oversee each fund's activities, review contractual arrangements with companies that provide services to each fund, oversee management of the risks associated with such activities and contractual arrangements, and review each fund's performance. Except for James C. Curvey, each of the Trustees oversees 174 funds. Mr. Curvey oversees 407 funds.
The Trustees hold office without limit in time except that (a) any Trustee may resign; (b) any Trustee may be removed by written instrument, signed by at least two-thirds of the number of Trustees prior to such removal; (c) any Trustee who requests to be retired or who has become incapacitated by illness or injury may be retired by written instrument signed by a majority of the other Trustees; and (d) any Trustee may be removed at any special meeting of shareholders by a two-thirds vote of the outstanding voting securities of the trust. Each Trustee who is not an interested person (as defined in the 1940 Act) of the trust and the funds (Independent Trustee), shall retire not later than the last day of the calendar year in which his or her 75th birthday occurs. The Independent Trustees may waive this mandatory retirement age policy with respect to individual Trustees. The officers and Advisory Board Member hold office without limit in time, except that any officer and Advisory Board Member may resign or may be removed by a vote of a majority of the Trustees at any regular meeting or any special meeting of the Trustees. Except as indicated, each individual has held the office shown or other offices in the same company for the past five years.
Experience, Skills, Attributes, and Qualifications of the Funds' Trustees. The Governance and Nominating Committee has adopted a statement of policy that describes the experience, qualifications, attributes, and skills that are necessary and desirable for potential Independent Trustee candidates (Statement of Policy). The Board believes that each Trustee satisfied at the time he or she was initially elected or appointed a Trustee, and continues to satisfy, the standards contemplated by the Statement of Policy. The Governance and Nominating Committee also engages professional search firms to help identify potential Independent Trustee candidates who have the experience, qualifications, attributes, and skills consistent with the Statement of Policy. From time to time, additional criteria based on the composition and skills of the current Independent Trustees, as well as experience or skills that may be appropriate in light of future changes to board composition, business conditions, and regulatory or other developments, have also been considered by the professional search firms and the Governance and Nominating Committee. In addition, the Board takes into account the Trustees' commitment and participation in Board and committee meetings, as well as their leadership of standing and ad hoc committees throughout their tenure.
In determining that a particular Trustee was and continues to be qualified to serve as a Trustee, the Board has considered a variety of criteria, none of which, in isolation, was controlling. The Board believes that, collectively, the Trustees have balanced and diverse experience, qualifications, attributes, and skills, which allow the Board to operate effectively in governing each fund and protecting the interests of shareholders. Information about the specific experience, skills, attributes, and qualifications of each Trustee, which in each case led to the Board's conclusion that the Trustee should serve (or continue to serve) as a trustee of the funds, is provided below.
Annual Report
Board Structure and Oversight Function. James C. Curvey is an interested person (as defined in the 1940 Act) and currently serves as Chairman. The Trustees have determined that an interested Chairman is appropriate and benefits shareholders because an interested Chairman has a personal and professional stake in the quality and continuity of services provided to the funds. Independent Trustees exercise their informed business judgment to appoint an individual of their choosing to serve as Chairman, regardless of whether the Trustee happens to be independent or a member of management. The Independent Trustees have determined that they can act independently and effectively without having an Independent Trustee serve as Chairman and that a key structural component for assuring that they are in a position to do so is for the Independent Trustees to constitute a substantial majority for the Board. The Independent Trustees also regularly meet in executive session. Ned C. Lautenbach serves as Chairman of the Independent Trustees and as such (i) acts as a liaison between the Independent Trustees and management with respect to matters important to the Independent Trustees and (ii) with management prepares agendas for Board meetings.
Fidelity funds are overseen by different Boards of Trustees. The funds' Board oversees Fidelity's equity and high income funds and another Board oversees Fidelity's investment-grade bond, money market, and asset allocation funds. The asset allocation funds may invest in Fidelity funds overseen by the funds' Board. The use of separate Boards, each with its own committee structure, allows the Trustees of each group of Fidelity funds to focus on the unique issues of the funds they oversee, including common research, investment, and operational issues. On occasion, the separate Boards establish joint committees to address issues of overlapping consequences for the Fidelity funds overseen by each Board.
The Trustees operate using a system of committees to facilitate the timely and efficient consideration of all matters of importance to the Trustees, each fund, and fund shareholders and to facilitate compliance with legal and regulatory requirements and oversight of the funds' activities and associated risks. The Board, acting through its committees, has charged FMR and its affiliates with (i) identifying events or circumstances the occurrence of which could have demonstrably adverse effects on the funds' business and/or reputation; (ii) implementing processes and controls to lessen the possibility that such events or circumstances occur or to mitigate the effects of such events or circumstances if they do occur; and (iii) creating and maintaining a system designed to evaluate continuously business and market conditions in order to facilitate the identification and implementation processes described in (i) and (ii) above. Because the day-to-day operations and activities of the funds are carried out by or through FMR, its affiliates and other service providers, the funds' exposure to risks is mitigated but not eliminated by the processes overseen by the Trustees. While each of the Board's committees has responsibility for overseeing different aspects of the funds' activities, oversight is exercised primarily through the Operations, Audit, and Compliance Committees. In addition, the Independent Trustees have worked with FMR to enhance the Board's oversight of investment and financial risks, legal and regulatory risks, technology risks, and operational risks, including the development of additional risk reporting to the Board. For example, a working group comprised of Independent Trustees and FMR has worked and continues to work to review the Fidelity funds' valuation-related activities, reporting and risk management. Appropriate personnel, including but not limited to the funds' Chief Compliance Officer (CCO), FMR's internal auditor, the independent accountants, the funds' Treasurer and portfolio management personnel, make periodic reports to the Board's committees, as appropriate, including an annual review of FMR's risk management program for the Fidelity funds. The responsibilities of each standing committee, including their oversight responsibilities, are described further under "Standing Committees of the Funds' Trustees."
Annual Report
Trustees and Officers - continued
The funds' Statements of Additional Information (SAIs) include more information about the Trustees. To request a free copy, call Fidelity at 1-800-544-8544 for Fidelity Series Emerging Markets Fund, Fidelity Series International Growth Fund, Fidelity Series International Small Cap Fund, and Fidelity Series International Value Fund or 1-800-835-5092 for Class F.
Interested Trustees*:
Correspondence intended for each Trustee who is an interested person may be sent to Fidelity Investments, 245 Summer Street, Boston, Massachusetts 02210.
Name, Year of Birth; Principal Occupations and Other Relevant Experience+ |
James C. Curvey (1935) |
Year of Election or Appointment: 2007 Trustee Chairman of the Board of Trustees |
| Mr. Curvey also serves as Trustee of other Fidelity funds. Mr. Curvey is a Director of Fidelity Research & Analysis Co. (2009-present), and Vice Chairman (2007-present) and Director of FMR LLC. In addition, Mr. Curvey serves as an Overseer for the Boston Symphony Orchestra and a member of the board of Artis-Naples, Naples, Florida, and as a Trustee for Brewster Academy, Wolfeboro, New Hampshire. Previously, Mr. Curvey served as a Director of Fidelity Investments Money Management, Inc. (2009-2014), a Director of FMR (2007-2014), and a Director of FMR Co., Inc. (2007-2014). |
Charles S. Morrison (1960) |
Year of Election or Appointment: 2014 Trustee |
| Mr. Morrison also serves as Trustee of other funds. He serves as a Director of Fidelity Investments Money Management, Inc. (FIMM) (2014-present), Director of Fidelity SelectCo, LLC (2014-present), President, Asset Management (2014-present), and is an employee of Fidelity Investments. Previously, Mr. Morrison served as Vice President of Fidelity's Fixed Income and Asset Allocation Funds (2012-2014), President, Fixed Income (2011-2014), Vice President of Fidelity's Money Market Funds (2005-2009), President, Money Market Group Leader of FMR (2009), and Senior Vice President, Money Market Group of FMR (2004-2009). Mr. Morrison also served as Vice President of Fidelity's Bond Funds (2002-2005), certain Balanced Funds (2002-2005), and certain Asset Allocation Funds (2002-2007), and as Senior Vice President (2002-2005) of Fidelity's Bond Division. |
* Trustees have been determined to be "Interested Trustees" by virtue of, among other things, their affiliation with the trust or various entities under common control with FMR.
+ The information above includes each Trustee's principal occupation during the last five years and other information relating to the experience, attributes, and skills relevant to each Trustee's qualifications to serve as a Trustee, which led to the conclusion that each Trustee should serve as a Trustee for each fund.
Annual Report
Trustees and Officers - continued
Independent Trustees:
Correspondence intended for each Independent Trustee (that is, the Trustees other than the Interested Trustees) may be sent to Fidelity Investments, P.O. Box 55235, Boston, Massachusetts 02205-5235.
Name, Year of Birth; Principal Occupations and Other Relevant Experience+ |
Dennis J. Dirks (1948) |
Year of Election or Appointment: 2005 Trustee |
| Mr. Dirks also serves as Trustee of other Fidelity funds. Prior to his retirement in May 2003, Mr. Dirks was Chief Operating Officer and a member of the Board of The Depository Trust & Clearing Corporation (DTCC). He also served as President, Chief Operating Officer, and Board member of The Depository Trust Company (DTC) and President and Board member of the National Securities Clearing Corporation (NSCC). In addition, Mr. Dirks served as Chief Executive Officer and Board member of the Government Securities Clearing Corporation, Chief Executive Officer and Board member of the Mortgage-Backed Securities Clearing Corporation, as a Trustee and a member of the Finance Committee of Manhattan College (2005-2008), and as a Trustee and a member of the Finance Committee of AHRC of Nassau County (2006-2008). Mr. Dirks is a member of the Independent Directors Council (IDC) Governing Council (2010-present) and Board of Directors for The Brookville Center for Children's Services, Inc. (2009-present). |
Alan J. Lacy (1953) |
Year of Election or Appointment: 2008 Trustee |
| Mr. Lacy also serves as Trustee of other Fidelity funds. Mr. Lacy serves as Senior Adviser (2007-present) of Oak Hill Capital Partners, L.P. (private equity). Mr. Lacy also served as Chief Executive Officer (2000-2005) and Vice Chairman (2005-2006) of Sears Holdings Corporation and Sears, Roebuck and Co. (retail). In addition, Mr. Lacy serves as a member of the Board of Directors of Dave & Buster's Entertainment, Inc. (restaurant and entertainment complexes, 2010-present), Earth Fare, Inc. (retail grocery, 2012-present), The Hillman Companies, Inc. (hardware wholesalers, 2010-present), and Bristol-Myers Squibb Company (global pharmaceuticals, 2008-present). Mr. Lacy is a member of the Board of Trustees of The National Parks Conservation Association (2006-present). Previously, Mr. Lacy served as Chairman of the Board of Trustees of the National Parks Conservation Association (2008-2011) and as a member of the Board of Directors for the Western Union Company (global money transfer, 2006-2011). |
Ned C. Lautenbach (1944) |
Year of Election or Appointment: 2000 Trustee Chairman of the Independent Trustees |
| Mr. Lautenbach also serves as Trustee of other Fidelity funds. Mr. Lautenbach currently serves as the Lead Director of the Eaton Corporation Board of Directors (diversified industrial, 1997-present). Mr. Lautenbach is Chairman of the Board of Directors of the Philharmonic Center for the Arts in Naples, Florida (2012-present) and a member of the Council on Foreign Relations (1994-present). Previously, Mr. Lautenbach was a Partner/Advisory Partner at Clayton, Dubilier & Rice, LLC (private equity investment, 1998-2010), as well as a Director of Sony Corporation (2006-2007). |
Joseph Mauriello (1944) |
Year of Election or Appointment: 2008 Trustee |
| Mr. Mauriello also serves as Trustee of other Fidelity funds. Prior to his retirement in January 2006, Mr. Mauriello served in numerous senior management positions including Deputy Chairman and Chief Operating Officer (2004-2005), and Vice Chairman of Financial Services (2002-2004) of KPMG LLP US (professional services, 1965-2005). Mr. Mauriello currently serves as a member of the Board of Directors of XL Group plc. (global insurance and re-insurance, 2006-present). Previously, Mr. Mauriello served as a Director of the Hamilton Funds of the Bank of New York (2006-2007) and of Arcadia Resources Inc. (health care services and products, 2007-2012). |
Robert W. Selander (1950) |
Year of Election or Appointment: 2011 Trustee |
| Mr. Selander also serves as Trustee of other Fidelity funds. Previously, Mr. Selander served as a Member of the Advisory Board of other Fidelity funds (2011), and Executive Vice Chairman (2010), Chief Executive Officer (2009-2010), and President and Chief Executive Officer (1997-2009) of Mastercard, Inc. |
Cornelia M. Small (1944) |
Year of Election or Appointment: 2005 Trustee |
| Ms. Small also serves as Trustee of other Fidelity funds. Ms. Small is a member of the Board of Directors (2009-present) and Chair of the Investment Committee (2010-present) of the Teagle Foundation. Ms. Small also serves on the Investment Committee of the Berkshire Taconic Community Foundation (2008-present). Previously, Ms. Small served as Chairperson (2002-2008) and a member of the Investment Committee and Chairperson (2008-2012) and a member of the Board of Trustees of Smith College. In addition, Ms. Small served as Chief Investment Officer, Director of Global Equity Investments, and a member of the Board of Directors of Scudder, Stevens & Clark and Scudder Kemper Investments. |
William S. Stavropoulos (1939) |
Year of Election or Appointment: 2001 Trustee Vice Chairman of the Independent Trustees |
| Mr. Stavropoulos also serves as Trustee of other Fidelity funds. Mr. Stavropoulos serves as President and Founder of the Michigan Baseball Foundation, the Great Lakes Loons (2007-present). Mr. Stavropoulos is Chairman Emeritus of the Board of Directors of The Dow Chemical Company, where he previously served in numerous senior management positions, including President, CEO (1995-2000; 2002-2004), Chairman of the Executive Committee (2000-2006), and as a member of the Board of Directors (1990-2006). Currently, Mr. Stavropoulos is Chairman of the Board of Directors of Univar Inc. (global distributor of commodity and specialty chemicals), a Director of Teradata Corporation (data warehousing and technology solutions), and Maersk Inc. (industrial conglomerate), and a member of the Advisory Board for Metalmark Capital LLC (private equity investment, 2005-present). Mr. Stavropoulos is an operating advisor to Clayton, Dubilier & Rice, LLC (private equity investment). In addition, Mr. Stavropoulos is a member of the University of Notre Dame Advisory Council for the College of Science, a Trustee of the Rollin L. Gerstacker Foundation, and a Director of the Naples Philharmonic Center for the Arts. Previously, Mr. Stavropoulos served as a Director of Chemical Financial Corporation (bank holding company, 1993-2012) and Tyco International, Ltd. (multinational manufacturing and services, 2007-2012). |
David M. Thomas (1949) |
Year of Election or Appointment: 2008 Trustee |
| Mr. Thomas also serves as Trustee of other Fidelity funds. Mr. Thomas serves as Non-Executive Chairman of the Board of Directors of Fortune Brands Home and Security (home and security products, 2011-present), and as a member of the Board of Directors of Interpublic Group of Companies, Inc. (marketing communication, 2004-present). Previously, Mr. Thomas served as Executive Chairman (2005-2006) and Chairman and Chief Executive Officer (2000-2005) of IMS Health, Inc. (pharmaceutical and healthcare information solutions), and a Director of Fortune Brands, Inc. (consumer products, 2000-2011). |
+ The information above includes each Trustee's principal occupation during the last five years and other information relating to the experience, attributes, and skills relevant to each Trustee's qualifications to serve as a Trustee, which led to the conclusion that each Trustee should serve as a Trustee for each fund.
Advisory Board Member and Officers:
Correspondence intended for each officer and Peter S. Lynch may be sent to Fidelity Investments, 245 Summer Street, Boston, Massachusetts 02210. Officers appear below in alphabetical order.
Name, Year of Birth; Principal Occupation |
Peter S. Lynch (1944) |
Year of Election or Appointment: 2003 Member of the Advisory Board |
| Mr. Lynch also serves as Member of the Advisory Board of other Fidelity funds. Mr. Lynch is Vice Chairman and a Director of FMR and FMR Co., Inc. In addition, Mr. Lynch serves as a Trustee of Boston College and as the Chairman of the Inner-City Scholarship Fund. Previously, Mr. Lynch served on the Special Olympics International Board of Directors (1997-2006). |
Elizabeth Paige Baumann (1968) |
Year of Election or Appointment: 2012 Anti-Money Laundering (AML) Officer |
| Ms. Baumann also serves as AML Officer of other funds. She is Chief AML Officer of FMR LLC (2012-present) and is an employee of Fidelity Investments. Previously, Ms. Baumann served as Vice President and Deputy Anti-Money Laundering Officer (2007-2012). |
William C. Coffey (1969) |
Year of Election or Appointment: 2009 Assistant Secretary |
| Mr. Coffey also serves as Assistant Secretary of other funds. He is Senior Vice President and Deputy General Counsel of FMR LLC (2010-present), and is an employee of Fidelity Investments. Previously, Mr. Coffey served as Vice President and Associate General Counsel of FMR LLC (2005-2009). |
Timothy M. Cohen (1969) |
Year of Election or Appointment: 2014 Vice President of certain Equity Funds |
| Mr. Cohen also serves as Vice President of other funds. Mr. Cohen serves as a Director and Chief Compliance Officer of Fidelity Management & Research (U.K.) Inc. (2013-present) and is an employee of Fidelity Investments. |
Jonathan Davis (1968) |
Year of Election or Appointment: 2010 Assistant Treasurer |
| Mr. Davis also serves as Assistant Treasurer of other funds. Mr. Davis is an employee of Fidelity Investments. Previously, Mr. Davis served as Vice President and Associate General Counsel of FMR LLC (2003-2010). |
Adrien E. Deberghes (1967) |
Year of Election or Appointment: 2008 Deputy Treasurer |
| Mr. Deberghes also serves as an officer of other funds. He is an employee of Fidelity Investments (2008-present). Prior to joining Fidelity Investments, Mr. Deberghes was Senior Vice President of Mutual Fund Administration at State Street Corporation (2007-2008), Senior Director of Mutual Fund Administration at Investors Bank & Trust (2005-2007), and Director of Finance for Dunkin' Brands (2000-2005). |
Stephanie J. Dorsey (1969) |
Year of Election or Appointment: 2010 Assistant Treasurer |
| Ms. Dorsey also serves as an officer of other funds. She is an employee of Fidelity Investments (2008-present) and has served in other fund officer roles. Prior to joining Fidelity Investments, Ms. Dorsey served as Treasurer (2004-2008) of the JPMorgan Mutual Funds and Vice President (2004-2008) of JPMorgan Chase Bank. |
Howard J. Galligan III (1966) |
Year of Election or Appointment: 2014 Chief Financial Officer |
| Mr. Galligan also serves as Chief Financial Officer of other funds. Mr. Galligan serves as President of Fidelity Pricing and Cash Management Services (FPCMS) (2014-present) and as a Director of Strategic Advisers, Inc. (2008-present). Previously, Mr. Galligan served as Chief Administrative Officer of Asset Management (2011-2014) and Chief Operating Officer and Senior Vice President of Investment Support for Strategic Advisers, Inc. (2003-2011). |
Scott C. Goebel (1968) |
Year of Election or Appointment: 2008 Secretary and Chief Legal Officer (CLO) |
| Mr. Goebel serves as Secretary and CLO of other funds. Mr. Goebel also serves as Secretary of Fidelity SelectCo, LLC (2013-present), Fidelity Investments Money Management, Inc. (FIMM) (2010-present) and Fidelity Research and Analysis Company (FRAC) (2010-present); General Counsel, Secretary, and Senior Vice President of FMR (2008-present) and FMR Co., Inc. (2008-present); Chief Legal Officer of Fidelity Management & Research (Hong Kong) Limited (2008-present); and Assistant Secretary of Fidelity Management & Research (Japan) Limited (2008-present) and Fidelity Management & Research (U.K.) Inc. (2008-present). Previously, Mr. Goebel served as Secretary and CLO of other Fidelity funds (2008-2013), Assistant Secretary of FIMM (2008-2010), FRAC (2008-2010), and certain funds (2007-2008); and as Vice President and Secretary of Fidelity Distributors Corporation (FDC) (2005-2007). Mr. Goebel has been employed by FMR LLC or an affiliate since 2001. |
Name, Year of Birth; Principal Occupation |
Brian B. Hogan (1964) |
Year of Election or Appointment: 2009 Vice President |
| Mr. Hogan also serves as Trustee or Vice President of other funds. Mr. Hogan serves as a Director of Fidelity SelectCo, LLC (2014-present) and President of FMR's Equity Division (2009-present). Previously, Mr. Hogan served as Senior Vice President, Equity Research of FMR (2006-2009) and as a portfolio manager. |
Chris Maher (1972) |
Year of Election or Appointment: 2013 Assistant Treasurer |
| Mr. Maher serves as Assistant Treasurer of other funds. Mr. Maher is Vice President of Valuation Oversight and is an employee of Fidelity Investments. Previously, Mr. Maher served as Vice President of Asset Management Compliance (2013), Vice President of FMR's Program Management Group (2010-2013), and Vice President of Valuation Oversight (2008-2010). |
Kenneth B. Robins (1969) |
Year of Election or Appointment: 2008 President and Treasurer |
| Mr. Robins also serves as an officer of other funds. Mr. Robins serves as Executive Vice President of Fidelity Investments Money Management, Inc. (FIMM) (2013-present) and is an employee of Fidelity Investments (2004-present). Previously, Mr. Robins served in other fund officer roles. |
Stephen Sadoski (1971) |
Year of Election or Appointment: 2012 Deputy Treasurer |
| Mr. Sadoski also serves as Deputy Treasurer of other funds. He is an employee of Fidelity Investments (2012-present) and has served in another fund officer role. Prior to joining Fidelity Investments, Mr. Sadoski served as an assistant chief accountant in the Division of Investment Management of the Securities and Exchange Commission (SEC) (2009-2012) and as a senior manager at Deloitte & Touche LLP (1997-2009). |
Name, Year of Birth; Principal Occupation |
Stacie M. Smith (1974) |
Year of Election or Appointment: 2013 Deputy Treasurer |
| Ms. Smith also serves as an officer of other funds. She is an employee of Fidelity Investments (2009-present) and has served in other fund officer roles. Prior to joining Fidelity Investments, Ms. Smith served as Senior Audit Manager of Ernst & Young LLP (1996-2009). |
Renee Stagnone (1975) |
Year of Election or Appointment: 2013 Deputy Treasurer |
| Ms. Stagnone also serves as Deputy Treasurer of other funds. Ms. Stagnone is an employee of Fidelity Investments. |
Linda J. Wondrack (1964) |
Year of Election or Appointment: 2014 Chief Compliance Officer |
| Ms. Wondrack also serves as Chief Compliance Officer of other funds. Ms. Wondrack is Executive Vice President and head of the Ethics Office and Asset Management Compliance for Fidelity Investments (2012-present). Ms. Wondrack also serves as Chief Compliance Officer of Fidelity SelectCo, LLC (2014-present); Chief Compliance Officer of Impresa Management LLC (2013-present); and Chief Compliance Officer of FMR Co., Inc., Fidelity Investments Money Management, Inc., Fidelity Management & Research (Japan) Limited, Fidelity Management & Research (U.K.) Inc., Fidelity Management & Research (Hong Kong), Fidelity Management & Research Company, Pyramis Global Advisors, LLC, and Strategic Advisers, Inc., Ballyrock Investment Advisors LLC, and Northern Neck Investors LLC (2012-present). Previously, Ms. Wondrack served as Senior Vice President and Chief Compliance Officer for Columbia Management Investment Advisers, LLC (2005-2012); Chief Compliance Officer for certain funds within the Columbia Family of Funds (2007-2012); and Senior Vice President of Compliance Risk Management at Bank of America (2005-2010). |
Joseph F. Zambello (1957) |
Year of Election or Appointment: 2011 Deputy Treasurer |
| Mr. Zambello also serves as Deputy Treasurer of other funds. Mr. Zambello is an employee of Fidelity Investments. Previously, Mr. Zambello served as Vice President of FMR's Program Management Group (2009-2011) and Vice President of the Transfer Agent Oversight Group (2005-2009). |
Annual Report
The Board of Trustees of each fund voted to pay to shareholders of record at the opening of business on record date, the following distributions per share derived from capital gains realized from sales of portfolio securities, and dividends derived from net investment income:
Fund | Pay Date | Record Date | Dividends | Capital Gains |
Series Emerging Markets Fund | 12/08/14 | 12/05/14 | $0.139 | $0.000 |
Class F | 12/08/14 | 12/05/14 | $0.166 | $0.000 |
Series International Growth Fund | 12/08/14 | 12/05/14 | $0.186 | $0.21 |
Class F | 12/08/14 | 12/05/14 | $0.212 | $0.21 |
Series International Small Cap Fund | 12/08/14 | 12/05/14 | $0.140 | $0.203 |
Class F | 12/08/14 | 12/05/14 | $0.172 | $0.203 |
Series International Value Fund | 12/08/14 | 12/05/14 | $0.437 | $0.32 |
Class F | 12/08/14 | 12/05/14 | $0.457 | $0.32 |
The funds hereby designate as capital gain dividend the amounts noted below for the taxable year ended October 31, 2014, or, if subsequently determined to be different, the net capital gain of such year.
Fund | |
Series International Growth Fund | $187,039,175 |
Series International Small Cap Fund | $33,720,100 |
Series International Value Fund | $369,036,365 |
A percentage of the dividends distributed during the fiscal year for the following funds qualifies for the dividends-received deduction for corporate shareholders.
Fund | December 06, 2013 |
Series Emerging Markets Fund | 0% |
Class F | 0% |
Series International Growth Fund | 17% |
Class F | 14% |
Series International Small Cap Fund | 6% |
Class F | 5% |
Series International Value Fund | 0% |
Class F | 0% |
Annual Report
Distributions - continued
A percentage of the dividends distributed during the fiscal year for the following funds may be taken into account as a dividend for purposes of the maximum rate under section 1(h)(11) of the Internal Revenue Code.
Fund | December 06, 2013 |
Series Emerging Markets Fund | 100% |
Class F | 100% |
Series International Growth Fund | 100% |
Class F | 100% |
Series International Small Cap Fund | 100% |
Class F | 100% |
Series International Value Fund | 76% |
Class F | 72% |
The amounts per share which represent income derived from sources within, and taxes paid to, foreign countries or possessions of the United States are as follows:
Fund | Pay Date | Income | Taxes |
Series Emerging Markets Fund | 12/09/13 | $0.1802 | $0.0342 |
Class F | 12/09/13 | $0.2029 | $0.0342 |
Series International Growth Fund | 12/09/13 | $0.107 | $0.01 |
Class F | 12/09/13 | $0.127 | $0.01 |
Series International Small Cap Fund | 12/09/13 | $0.1177 | $0.0153 |
Class F | 12/09/13 | $0.1299 | $0.0153 |
Series International Value Fund | 12/09/13 | $0.1778 | $0.0076 |
Class F | 12/09/13 | $0.1886 | $0.0076 |
The fund will notify shareholders in January 2015 of amounts for use in preparing 2014 income tax returns.
Annual Report
Board Approval of Investment Advisory Contracts and Management Fees
Fidelity Series Emerging Markets Fund
Fidelity Series International Growth Fund
Fidelity Series International Small Cap Fund
Fidelity Series International Value Fund
Each year, the Board of Trustees, including the Independent Trustees (together, the Board), votes on the renewal of the management contract with Fidelity Management & Research Company (FMR) and the sub-advisory agreements (together, the Advisory Contracts) for each fund. The Board, assisted by the advice of fund counsel and Independent Trustees' counsel, requests and considers a broad range of information relevant to the renewal of the Advisory Contracts throughout the year.
The Board meets regularly and, at each of its meetings, covers an extensive agenda of topics and materials and considers factors that are relevant to its annual consideration of the renewal of each fund's Advisory Contracts, including the services and support provided to each fund and its shareholders. The Board has established various standing committees (Committees), each composed of and chaired by Independent Trustees with varying backgrounds, to which the Board has assigned specific subject matter responsibilities in order to enhance effective decision-making by the Board. The Board, acting directly and through its Committees, requests and receives information concerning the annual consideration of the renewal of each fund's Advisory Contracts. The Board also meets as needed to consider matters specifically related to the Board's annual consideration of the renewal of the Advisory Contracts. Members of the Board may also meet with trustees of other Fidelity funds through ad hoc joint committees to discuss certain matters relevant to the Fidelity funds.
At its July 2014 meeting, the Board, including the Independent Trustees, unanimously determined to renew each fund's Advisory Contracts. In reaching its determination, the Board considered all factors it believed relevant, including (i) the nature, extent, and quality of the services to be provided to each fund and its shareholders (including the investment performance of each fund); (ii) the competitiveness of each fund's management fee and total expense ratio relative to peer funds; (iii) the total costs of the services to be provided by and the profits to be realized by Fidelity from its relationship with each fund; (iv) the extent to which economies of scale exist and would be realized as each fund grows; and (v) whether fee levels reflect these economies of scale, if any, for the benefit of fund shareholders. In connection with separate internal corporate reorganizations involving Fidelity Management & Research (U.K.) Inc. (FMR U.K.) and Fidelity Management & Research (Japan) Inc. (FMR Japan), the Board approved certain non-material amendments to the funds' sub-advisory agreements with FMR U.K. and FMR Japan to reflect that, after these reorganizations, FMR Investment Management (UK) Limited and Fidelity Management & Research (Japan) Limited will carry on the business of FMR U.K. and FMR Japan, respectively. The Board noted that no changes to the portfolio managers or to the foreign research or investment advisory services provided to the funds were expected in connection with either reorganization and that the same personnel and resources would continue to be available to the funds at the new entities.
Annual Report
Board Approval of Investment Advisory Contracts and
Management Fees - continued
In considering whether to renew the Advisory Contracts for each fund, the Board reached a determination, with the assistance of fund counsel and Independent Trustees' counsel and through the exercise of its business judgment, that the renewal of the Advisory Contracts was in the best interests of each fund and its shareholders and that the compensation payable under the Advisory Contracts was fair and reasonable. The Board's decision to renew the Advisory Contracts was not based on any single factor, but rather was based on a comprehensive consideration of all the information provided to the Board at its meetings throughout the year. The Board, in reaching its determination to renew the Advisory Contracts, was aware that shareholders of each fund have a broad range of investment choices available to them, including a wide choice among funds offered by Fidelity's competitors, and that each fund's shareholders, who have the opportunity to review and weigh the disclosure provided by the fund in its prospectus and other public disclosures, have chosen to invest in that fund, which is part of the Fidelity family of funds.
Nature, Extent, and Quality of Services Provided. The Board considered Fidelity's staffing as it relates to the funds, including the backgrounds of investment personnel of FMR and the sub-advisers (together, the Investment Advisers), and also considered the funds' investment objectives, strategies, and related investment philosophies. The Independent Trustees also had discussions with senior management of Fidelity's investment operations and investment groups. The Board considered the structure of the portfolio manager compensation program and whether this structure provides appropriate incentives to act in the best interests of each fund. Additionally, the Board considered the portfolio managers' investments, if any, in the funds that they manage.
Resources Dedicated to Investment Management and Support Services. The Board and the Fund Oversight and Research Committees reviewed the general qualifications and capabilities of Fidelity's investment staff, including its size, education, experience, and resources, as well as Fidelity's approach to recruiting, training, managing, and compensating investment personnel. The Board noted that Fidelity has continued to increase the resources devoted to non-U.S. offices, including expansion of Fidelity's global investment organization. The Board also noted that Fidelity's analysts have extensive resources, tools and capabilities that allow them to conduct sophisticated quantitative and fundamental analysis, as well as credit analysis of issuers, counterparties and guarantors. Further, the Board believes that Fidelity's investment professionals have sufficient access to global information and data so as to provide competitive investment results over time, and that those professionals also have access to sophisticated tools that permit them to assess portfolio construction and risk and performance attribution characteristics continuously, as well as to transmit new information and research conclusions rapidly around the world. Additionally, in its deliberations, the Board considered Fidelity's trading and risk management capabilities and resources and global compliance infrastructure, which are an integral part of the investment management process.
Annual Report
Shareholder and Administrative Services. The Board considered (i) the nature, extent, quality, and cost of advisory, administrative, and shareholder services performed by the Investment Advisers and their affiliates under the Advisory Contracts and under separate agreements covering transfer agency, pricing and bookkeeping, and securities lending services for each fund; (ii) the nature and extent of the supervision of third party service providers, principally custodians and subcustodians; and (iii) the resources devoted to, and the record of compliance with, each fund's compliance policies and procedures. The Board also reviewed the allocation of fund brokerage, including allocations to brokers affiliated with the Investment Advisers, the use of brokerage commissions to pay fund expenses, and the use of "soft" commission dollars to pay for research services.
The Board noted that the growth of fund assets over time across the complex allows Fidelity to reinvest in the development of services designed to enhance the value or convenience of the Fidelity funds as investment vehicles. These services include 24-hour access to account information and market information through telephone representatives and over the Internet, investor education materials and asset allocation tools, and the expanded availability of Fidelity Investor Centers.
In 2014, the Board formed an ad hoc Committee on Transfer Agency Fees to review the variety of transfer agency fee structures throughout the industry and Fidelity's competitive positioning with respect to industry participants.
Investment in a Large Fund Family. The Board considered the benefits to shareholders of investing in a Fidelity fund, including the benefits of investing in a fund that is part of a large family of funds offering a variety of investment disciplines and providing a large variety of mutual fund investor services. The Board noted that Fidelity had taken, or had made recommendations that resulted in the Fidelity funds taking, a number of actions over the previous year that benefited particular funds, including (i) continuing to dedicate additional resources to investment research and to the support of the senior management team that oversees asset management; (ii) persisting in efforts to enhance Fidelity's global research capabilities; (iii) launching new funds and making other enhancements to meet client needs for income-oriented solutions; (iv) reducing fund expenses for certain index funds; (v) continuing to launch dedicated lower cost underlying funds to meet portfolio construction needs related to expanding underlying fund options for Fidelity funds of funds, specifically for the Freedom Fund product lines; (vi) rationalizing product lines and gaining increased efficiencies through fund mergers; (vii) launching sector-based exchange-traded funds and establishing a new Fidelity adviser to manage sector-based funds and products; (viii) continuing to develop and implement technology to improve security and increase efficiency; (ix) modifying the eligibility criteria for certain share classes to increase their marketability to a portion of the defined contribution plan market; (x) waiving redemption fees for certain qualified fund-of-fund and wrap programs and certain retirement plan transactions; and (xi) launching new Institutional Class shares of certain money market funds to attract and retain assets and to fill a gap in the money market fund lineup.
Annual Report
Board Approval of Investment Advisory Contracts and
Management Fees - continued
Investment Performance. The Board considered whether each fund has operated in accordance with its investment objective, as well as its record of compliance with its investment restrictions and its performance history. The Board noted that there was a portfolio management change for a sleeve of Fidelity Series Emerging Markets Fund in May 2012 and October 2013 and for a sleeve of Fidelity Series International Value Fund in September 2011.
The Board took into account discussions with the Investment Advisers about fund investment performance that occur at Board meetings throughout the year. In this regard the Board noted that as part of regularly scheduled fund reviews and other reports to the Board on fund performance, the Board periodically considers annualized return information for each fund, for different time periods, measured against a securities market index ("benchmark index") and a peer group of funds with similar objectives ("peer group"). In its evaluation of fund investment performance, the Board gave particular attention to information indicating changes in performance of certain Fidelity funds for specific time periods and the Investment Advisers' explanations for any overperformance or underperformance.
In addition to reviewing absolute and relative fund performance, the Independent Trustees periodically consider the appropriateness of fund performance metrics in evaluating the results achieved. In general, the Independent Trustees believe that fund performance should be evaluated based on net performance (after fees and expenses) of both the highest performing and lowest performing classes, where applicable, compared to appropriate benchmark indices, over appropriate time periods which may include full market cycles, and compared to peer groups, as applicable, over the same periods, taking into account relevant factors including the following: general market conditions; issuer-specific information; tactical opportunities for investment; and fund cash flows and other factors.
The Independent Trustees recognize that shareholders evaluate performance on a net basis over their own holding periods, for which one-, three-, and five-year periods are often used as a proxy. For this reason, the performance information reviewed by the Board also included net cumulative calendar year total return information for each fund and an appropriate benchmark index and peer group for the most recent one-, three-, and five-year periods, as shown below. Returns are shown compared to the 25th percentile (top of box, 75% beaten) and 75th percentile (bottom of box, 25% beaten) of the peer universe. For each fund (except Fidelity Series Emerging Markets Fund), returns of the benchmark index are "net MA," i.e., adjusted for tax withholding rates applicable to U.S.-based funds organized as Massachusetts business trusts.
Annual Report
Fidelity Series Emerging Markets Fund
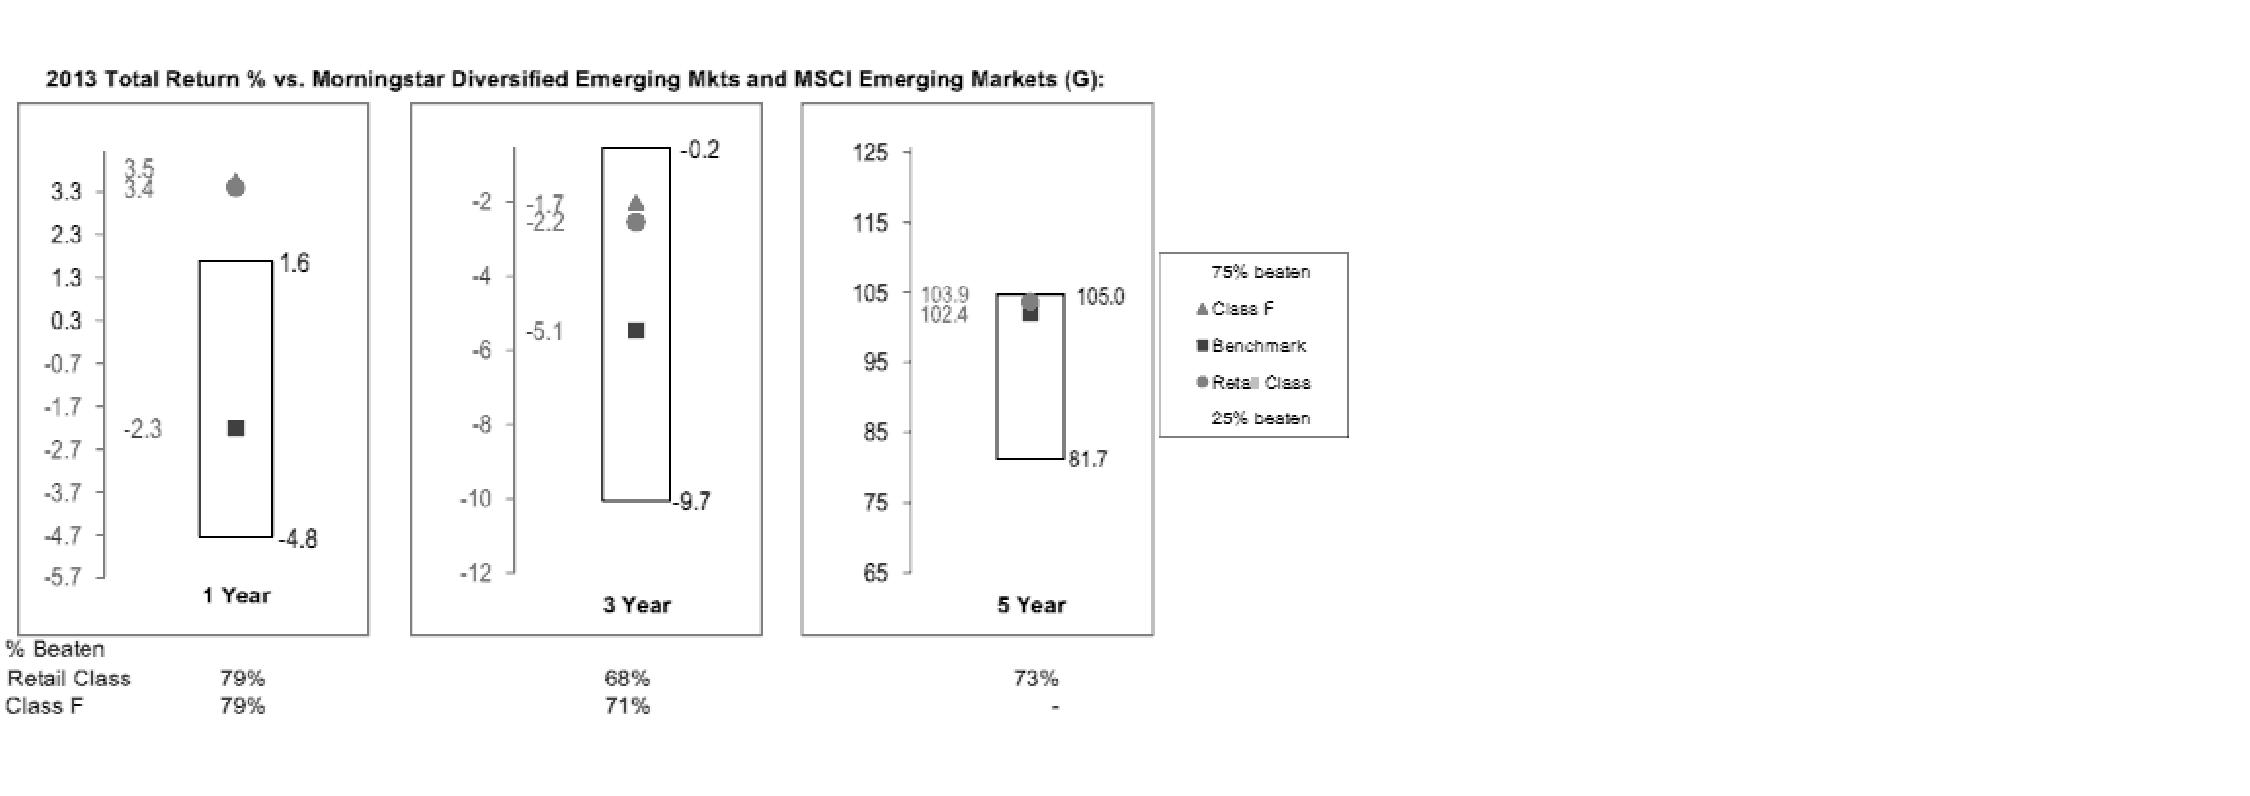
Fidelity Series International Growth Fund
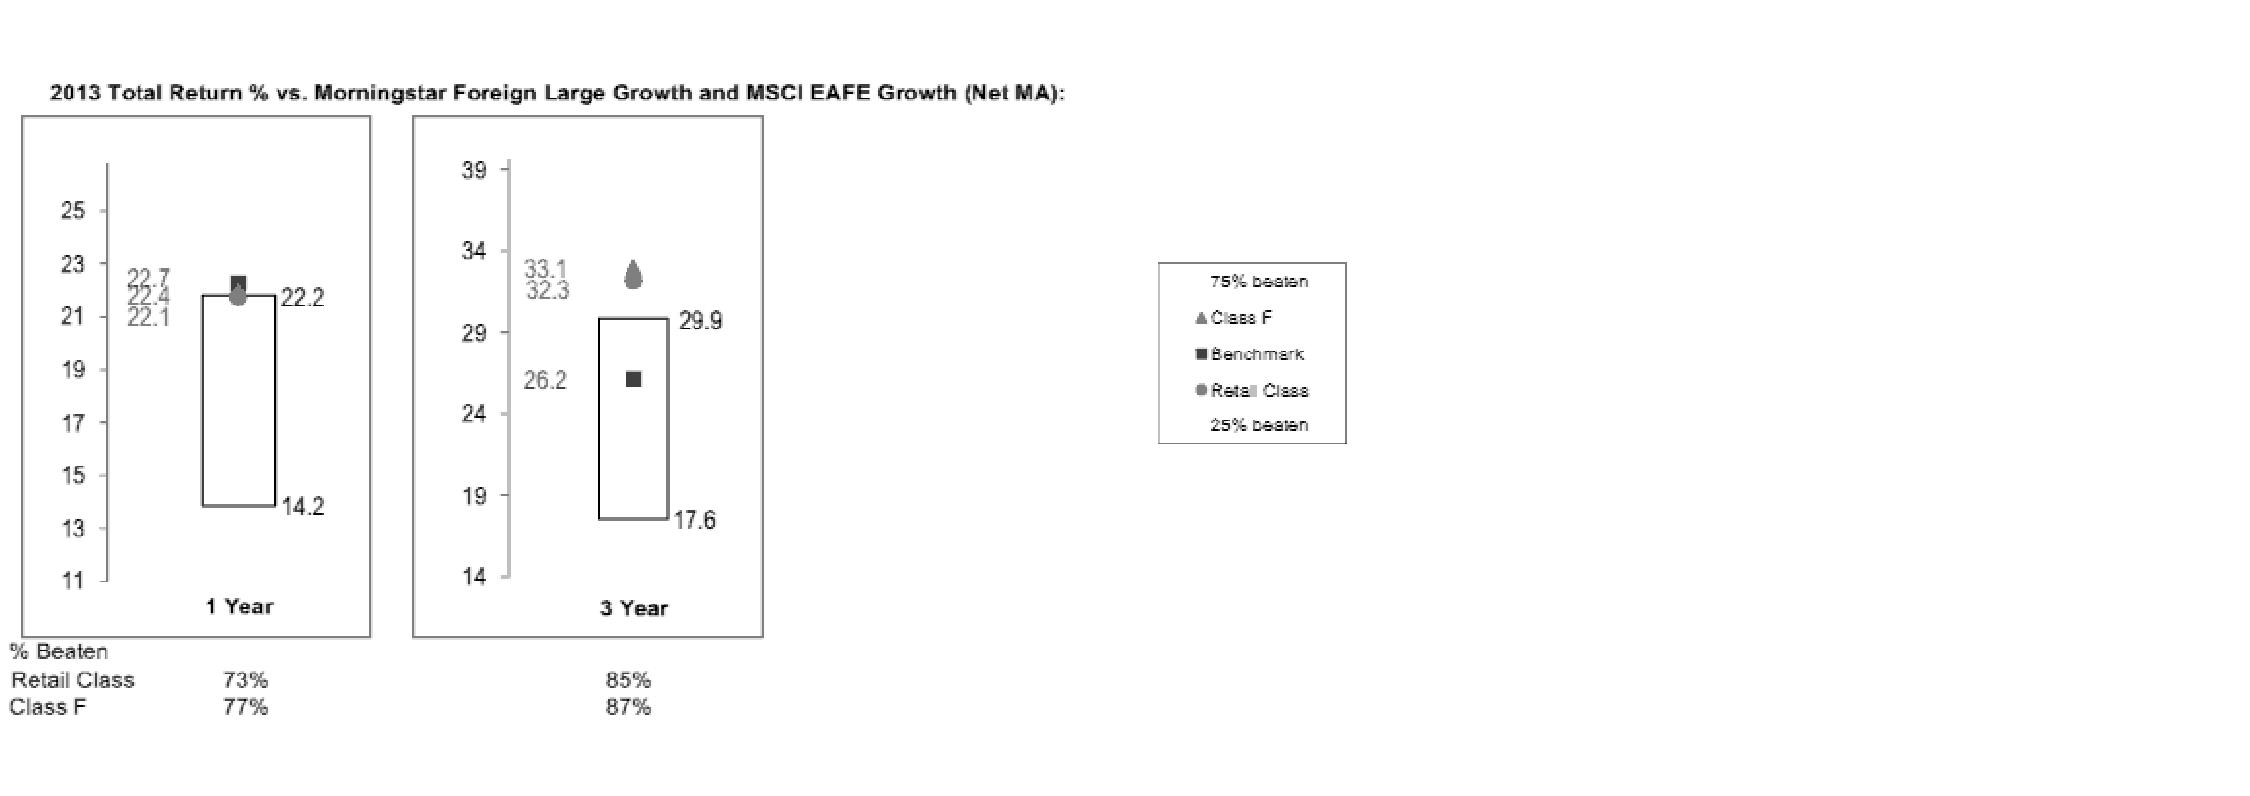
Annual Report
Board Approval of Investment Advisory Contracts and
Management Fees - continued
Fidelity Series International Small Cap Fund
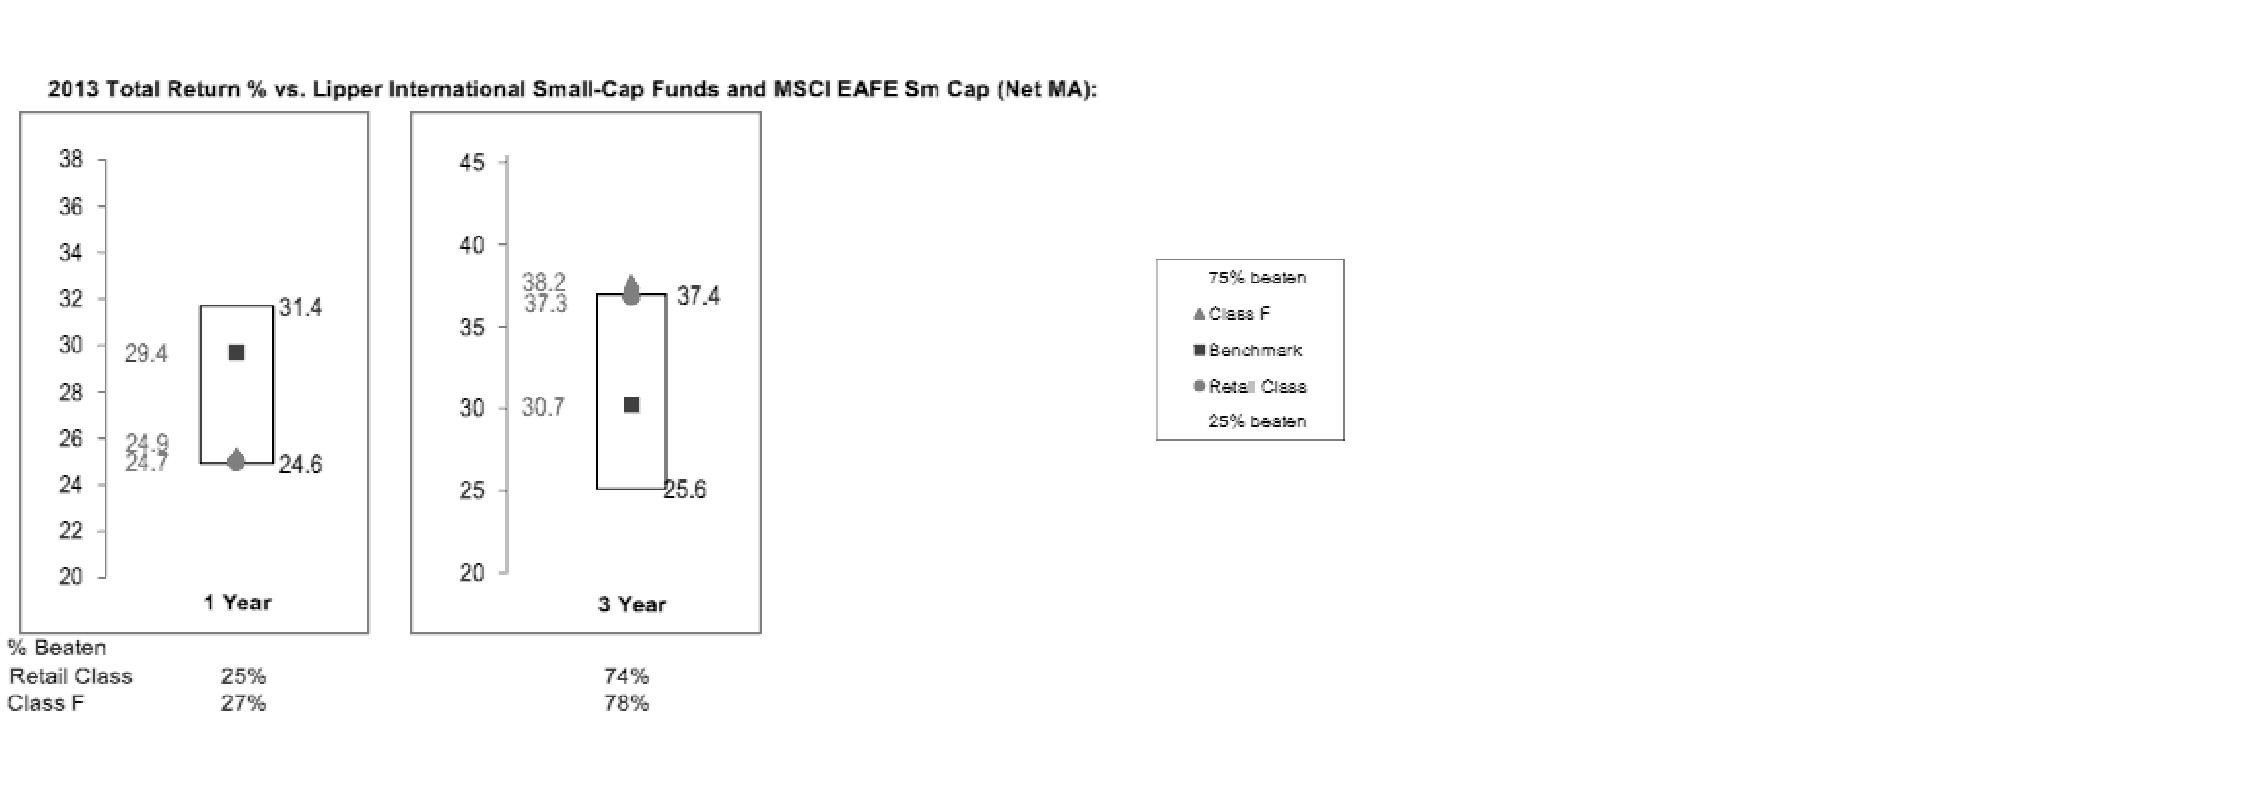
Fidelity Series International Value Fund
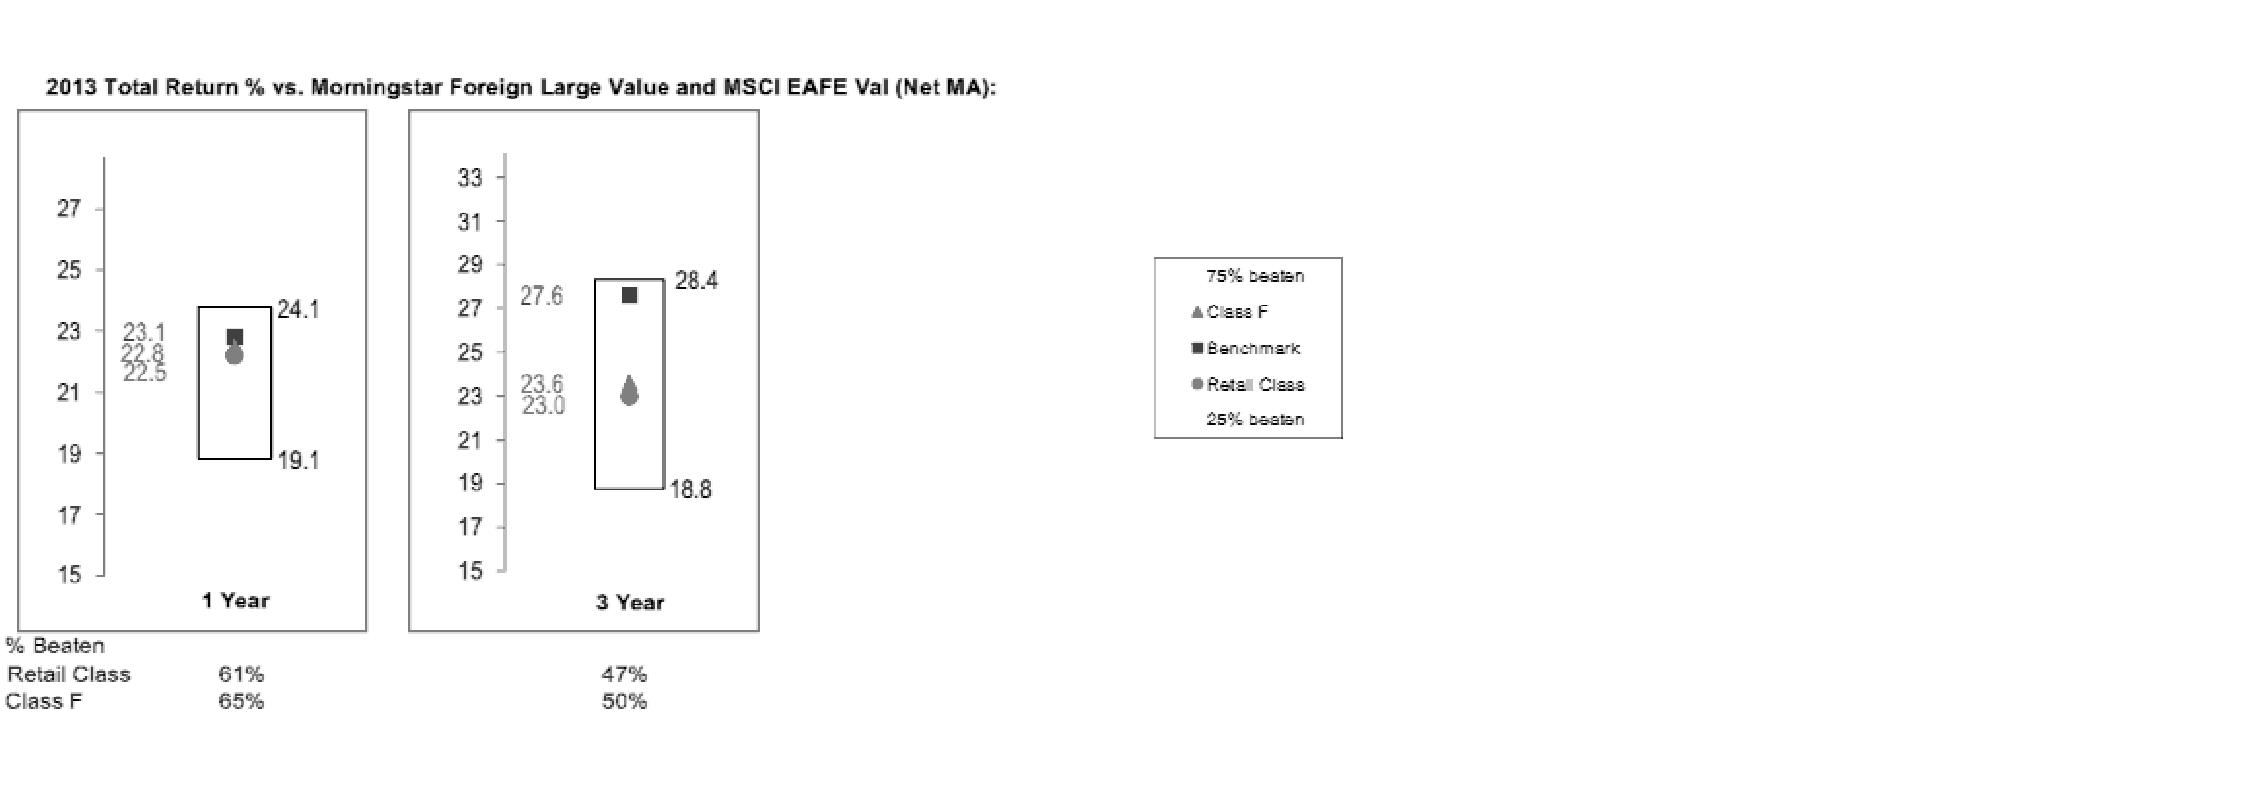
The Board has discussed Fidelity Series International Value Fund's performance with FMR, including the fund's underperformance based on more recent periods ended after 2013 (which periods are not shown in the chart above) but prior to the date of the Board's approval of the renewal of the Advisory Contracts, and has engaged with FMR to consider what steps might be taken to remediate the fund's more recent underperformance.
Annual Report
The Board also considered that each of Fidelity Series International Growth Fund's, Fidelity Series International Small Cap Fund's, and Fidelity Series International Value Fund's management fee is subject to upward or downward adjustment depending upon whether, and to what extent, the fund's investment performance for the performance period exceeds, or is exceeded by, a securities index, thus leading to a performance adjustment for the same period. The Board noted that the performance adjustment provides FMR with a strong economic incentive to seek to achieve superior performance for each fund's shareholders and helps to more closely align the interests of FMR and each fund's shareholders.
Based on its review, the Board concluded that the nature, extent, and quality of services provided to each fund under the Advisory Contracts should benefit each fund's shareholders.
Competitiveness of Management Fee and Total Expense Ratio. The Board considered each fund's management fee and total expense ratio compared to "mapped groups" of competitive funds and classes. Fidelity creates "mapped groups" by combining similar Lipper investment objective categories that have comparable investment mandates. Combining Lipper investment objective categories aids the Board's management fee and total expense ratio comparisons by broadening the competitive group used for comparison and by reducing the number of universes to which various Fidelity funds are compared.
Management Fee. The Board considered two proprietary management fee comparisons for the 12-month (or shorter) periods shown in the charts below. The group of Lipper funds used by the Board for management fee comparisons is referred to below as the "Total Mapped Group." For Fidelity Series International Small Cap Fund, the Total Mapped Group is broader than the Lipper peer group used by the Board for performance comparisons because the Total Mapped Group combines several Lipper investment objective categories while the Lipper peer group does not. The Total Mapped Group comparison focuses on a fund's standing in terms of gross management fees before expense reimbursements or caps, and without giving effect to the fund's performance adjustment (if applicable), relative to the total universe of funds with comparable investment mandates, regardless of whether their management fee structures also are comparable. Funds with comparable investment mandates offer exposure to similar types of securities. Funds with comparable management fee structures have similar management fee contractual arrangements (e.g., flat rate charged for advisory services, all-inclusive fee rate, etc.). "TMG %" represents the percentage of funds in the Total Mapped Group that had management fees that were lower than a fund's. For example, a hypothetical TMG % of 20% would mean that 80% of the funds in the Total Mapped Group had higher, and 20% had lower, management fees than a fund. The funds' actual TMG %s are in the charts below. The "Asset-Size Peer Group" (ASPG) comparison focuses on a fund's standing relative to a subset of non-Fidelity funds within the Total Mapped Group that are similar in size and management fee structure. For example, if a fund is in the first quartile of the ASPG, the fund's management fee ranks in the least expensive or lowest 25% of funds in the ASPG. The ASPG represents at least 15% of the funds in the Total Mapped Group with comparable asset size and management fee structures, subject to a minimum of 50 funds (or all funds in the Total Mapped Group if fewer than 50). Additional information, such as the ASPG quartile in which a fund's management fee rate ranked and the impact of a fund's performance adjustment (if applicable), is also included in the charts and considered by the Board.
Annual Report
Board Approval of Investment Advisory Contracts and
Management Fees - continued
Fidelity Series Emerging Markets Fund
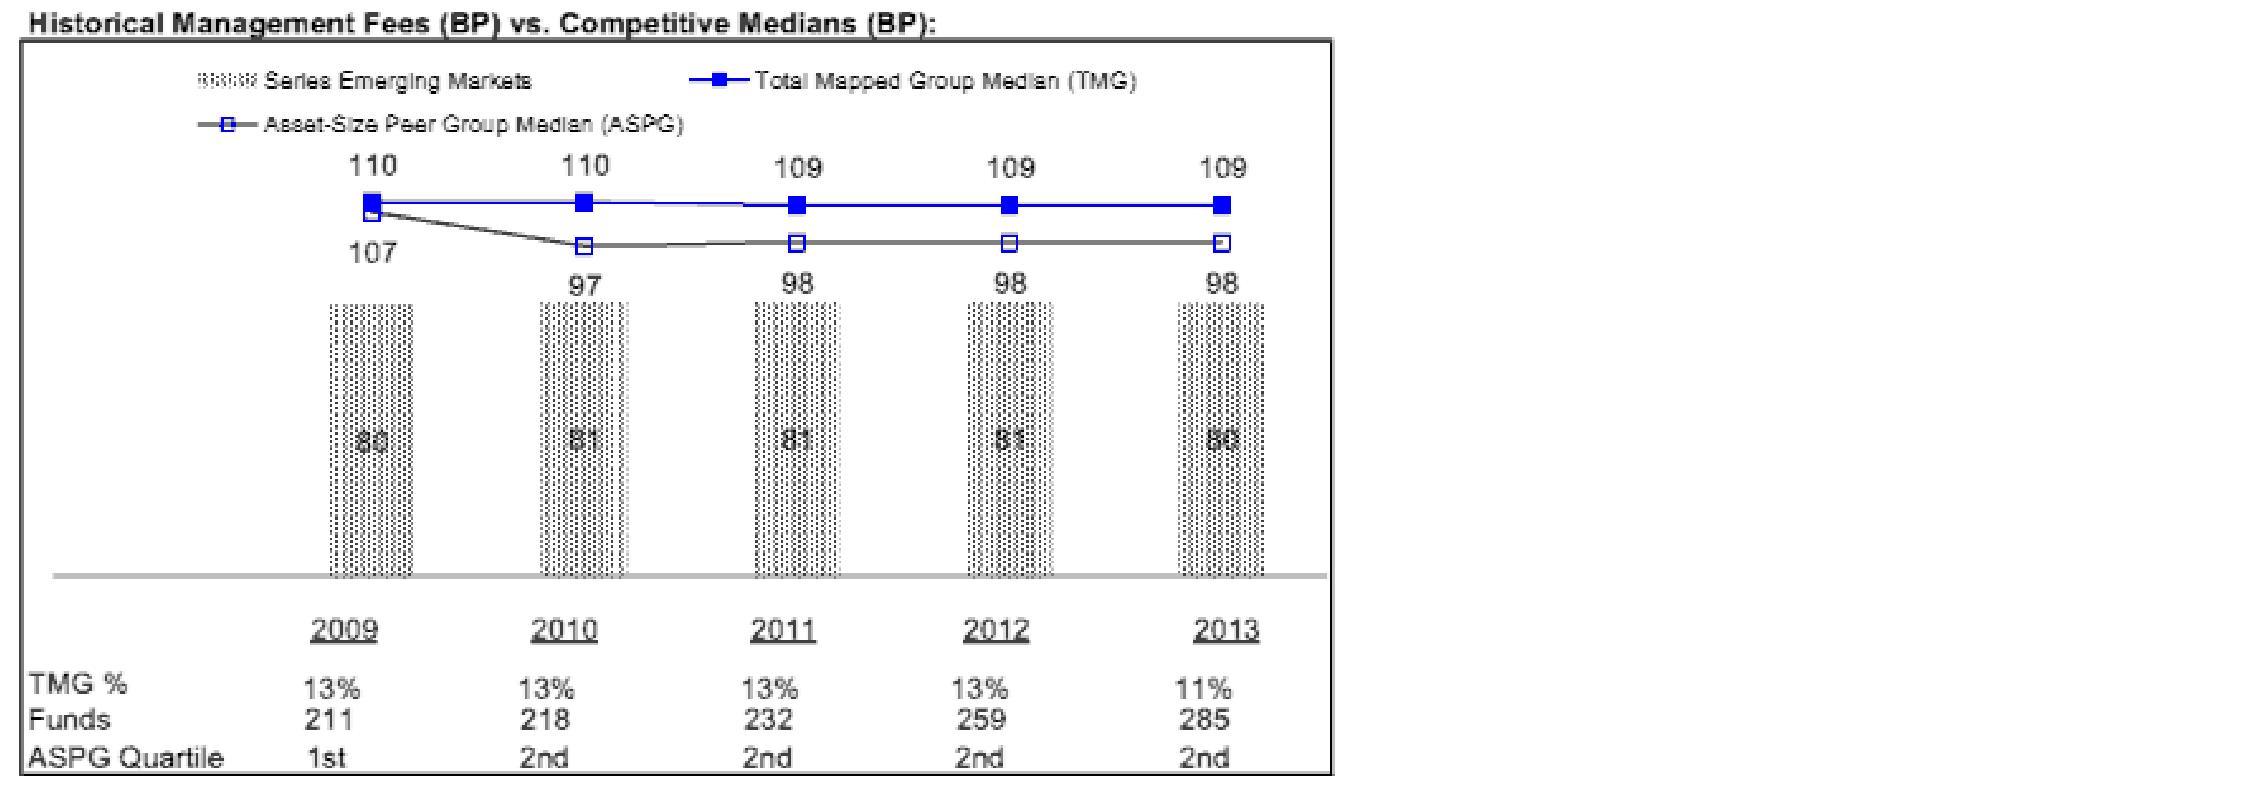
Annual Report
Fidelity Series International Growth Fund
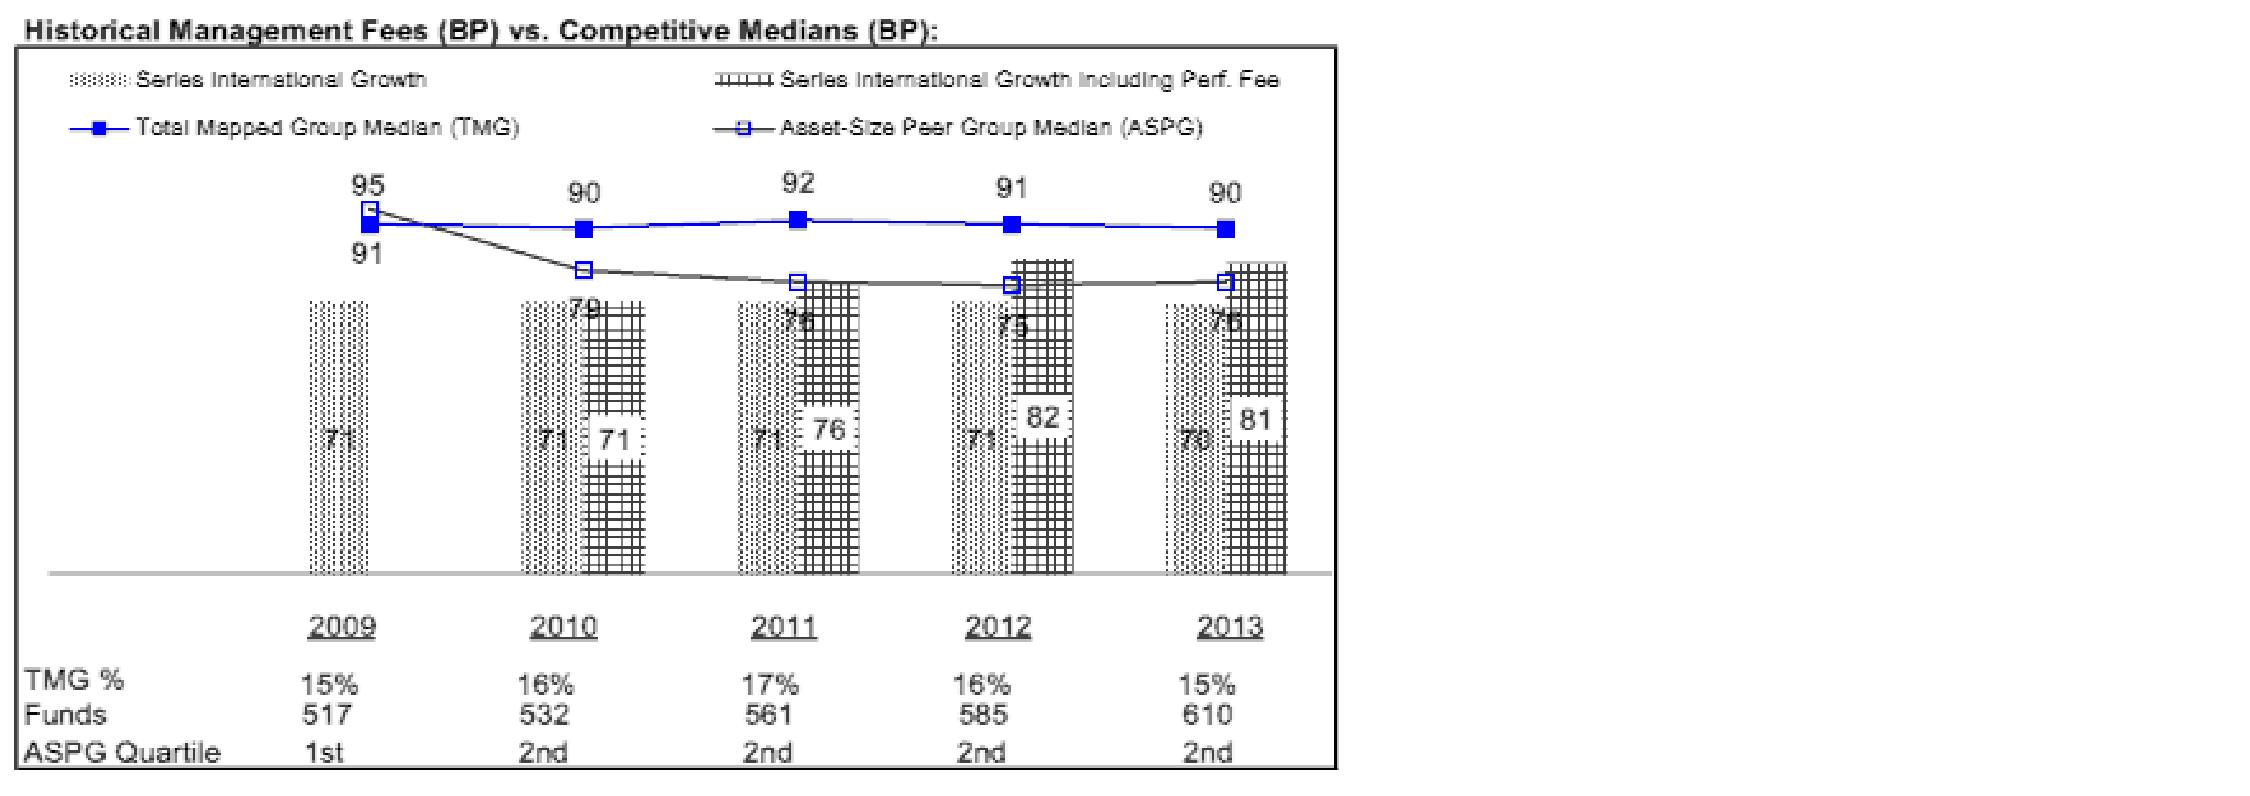
Fidelity Series International Small Cap Fund
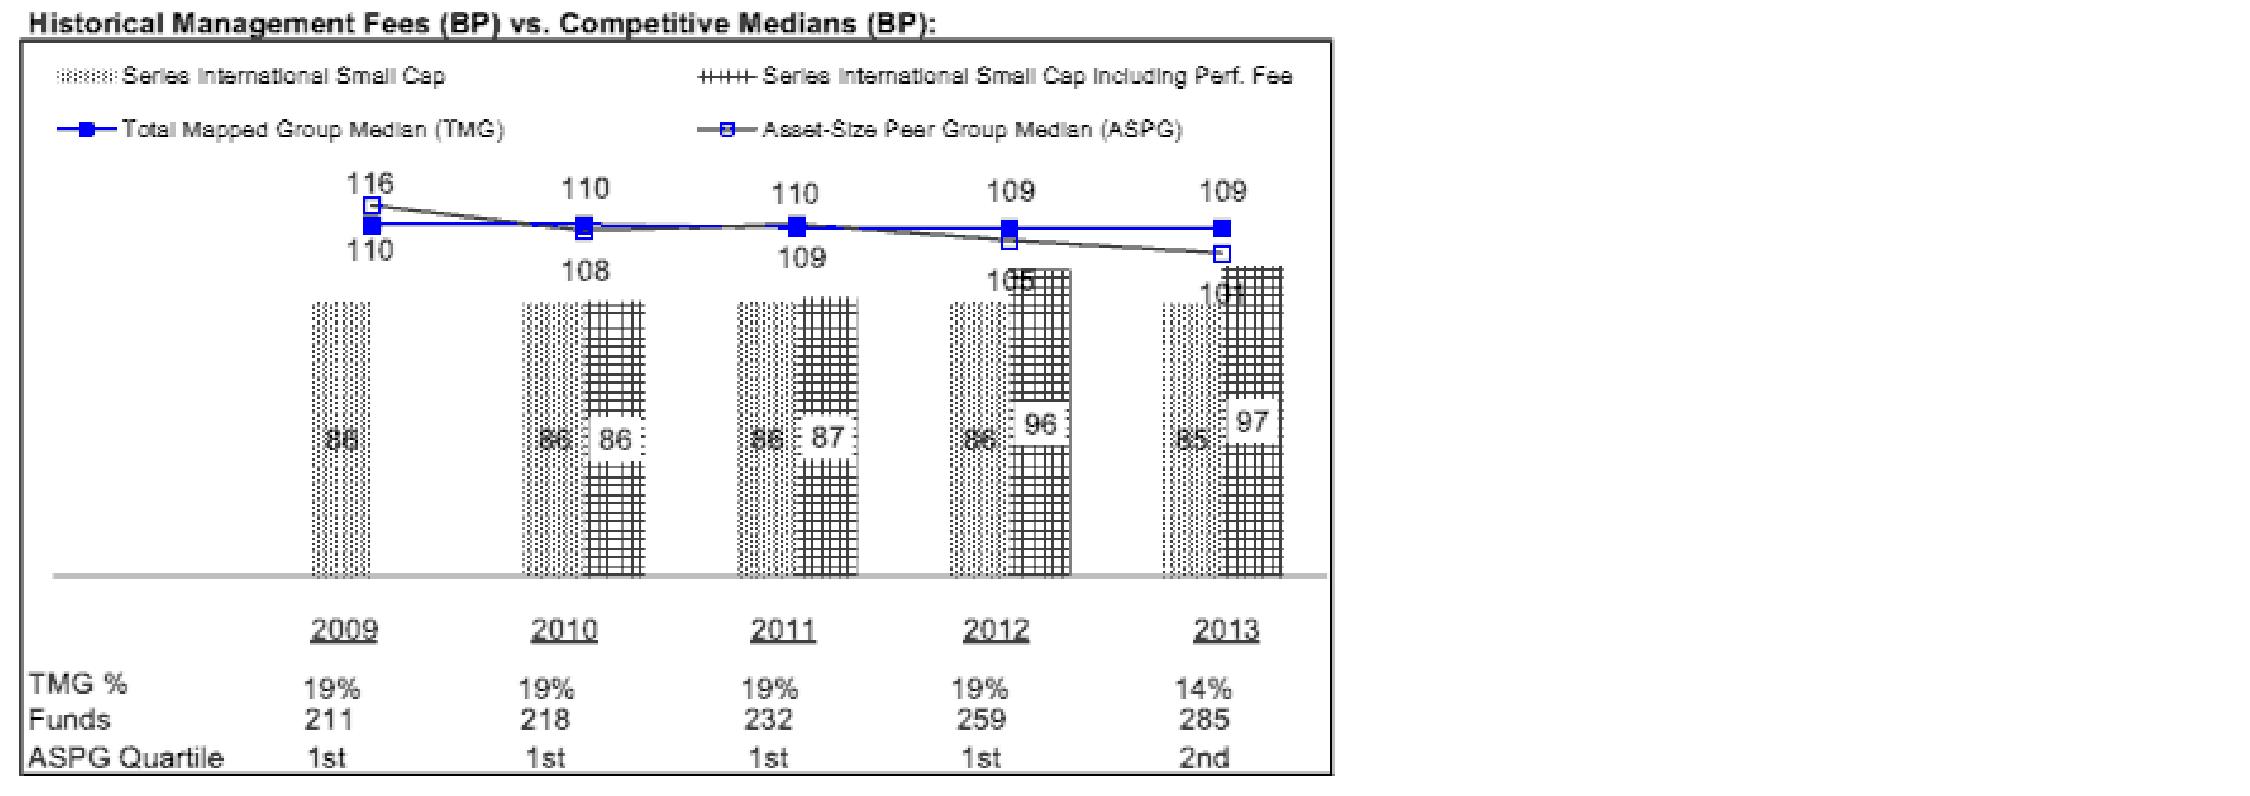
Annual Report
Board Approval of Investment Advisory Contracts and
Management Fees - continued
Fidelity Series International Value Fund
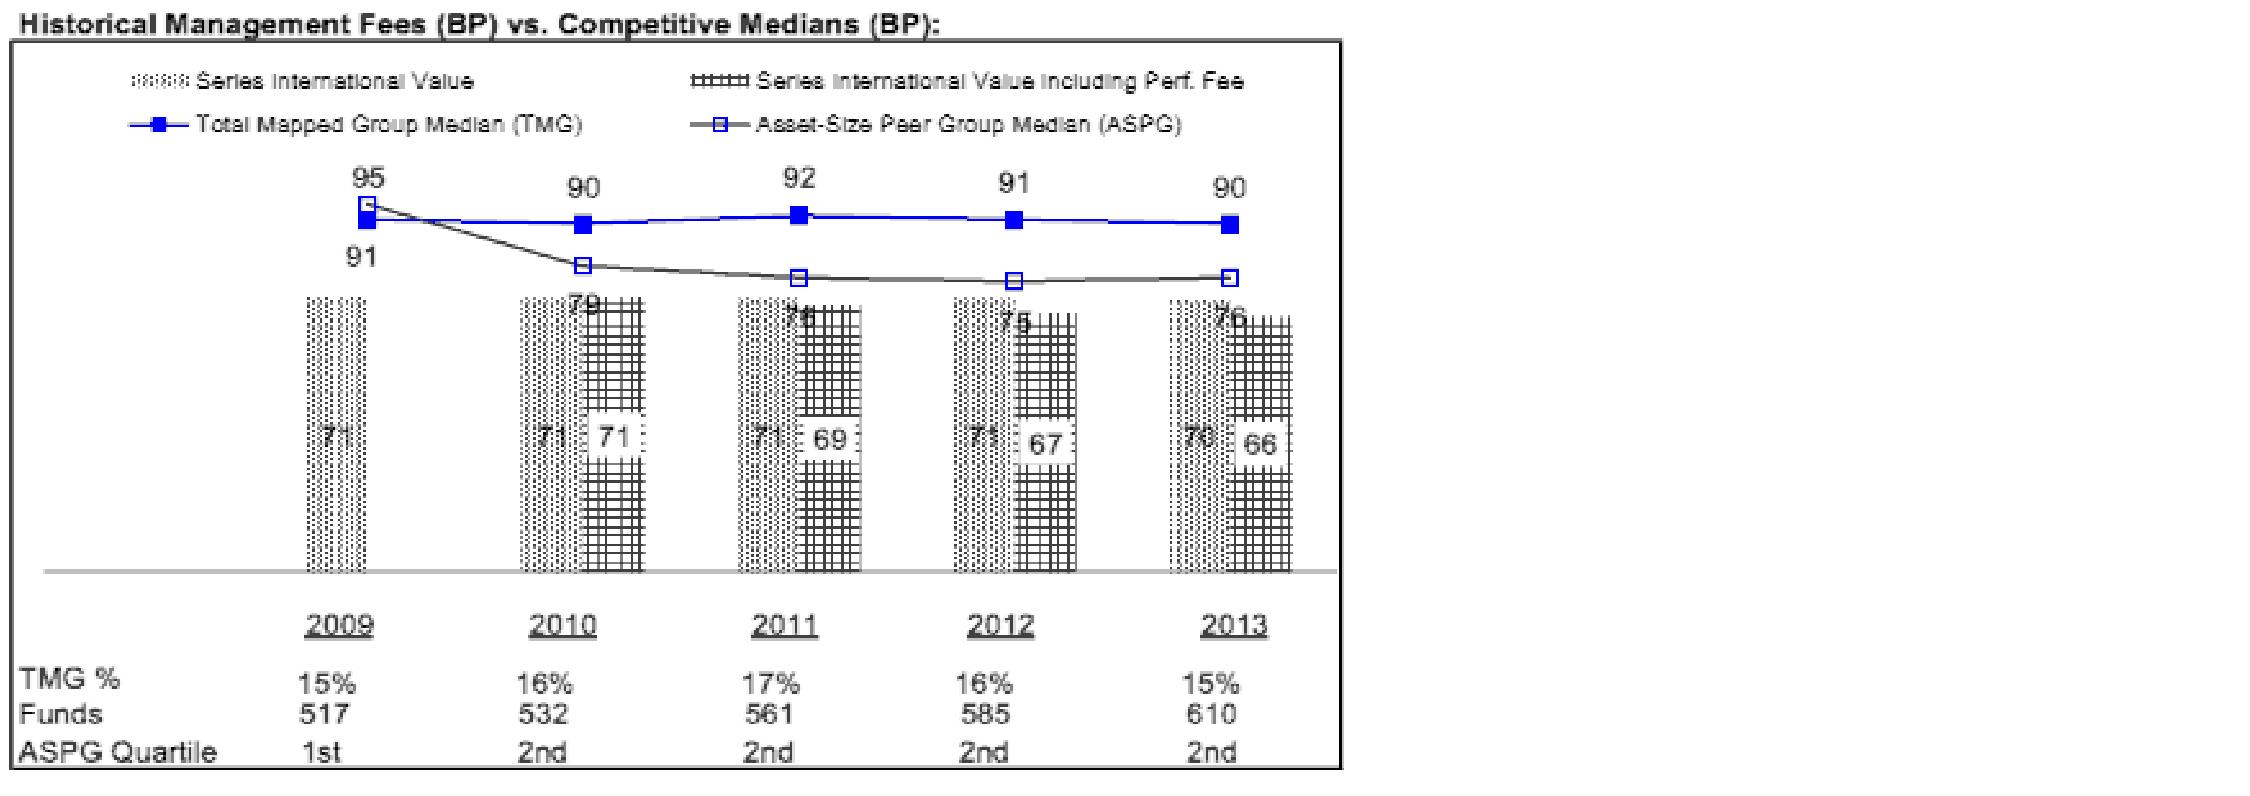
The Board noted that each fund's management fee rate ranked below the median of its Total Mapped Group and below the median of its ASPG for 2013. The Board also noted the effect of each of Fidelity Series International Growth Fund's and Fidelity Series International Small Cap Fund's positive performance adjustment and Fidelity Series International Value Fund's negative performance adjustment on the fund's management fee ranking.
The Board also noted that, in August 2013, the ad hoc Committee on Management Fees was formed to conduct an in-depth review of the management fee rates of Fidelity's active equity mutual funds. The Committee focused on the following areas: (i) standard fee structures; (ii) research consumption and trading evolution; (iii) management fee competitiveness/profitability by category; and (iv) factors that drive institutional pricing.
Based on its review, the Board concluded that each fund's management fee is fair and reasonable in light of the services that the fund receives and the other factors considered.
Total Expense Ratio. In its review of the total expense ratio of each class of each fund, the Board considered the fund's management fee as well as other fund or class expenses, as applicable, such as transfer agent fees, pricing and bookkeeping fees, and custodial, legal, and audit fees. The Board also noted the effects of any waivers and reimbursements on fees and expenses, as well as the impact of each fund's performance adjustment. As part of its review, the Board also considered the current and historical total expense ratios of each class of each fund compared to competitive fund median expenses. Each class of each fund is compared to those funds and classes in the Total Mapped Group (used by the Board for management fee comparisons) that have a similar sales load structure.
Annual Report
The Board noted that the total expense ratio of each class of each fund ranked below its competitive median for 2013.
Fees Charged to Other Fidelity Clients. The Board also considered Fidelity fee structures and other information with respect to clients of Fidelity, such as other funds advised or subadvised by Fidelity, pension plan clients, and other institutional clients. The Board noted the findings of the 2013 ad hoc joint committee (created with the board of other Fidelity funds), which reviewed and compared Fidelity's institutional investment advisory business with its business of providing services to the Fidelity funds, including the differences in services provided, fees charged, and costs incurred, as well as competition in their respective marketplaces.
Based on its review of total expense ratios and fees charged to other Fidelity clients, the Board concluded that the total expense ratio of each class of each fund was reasonable in light of the services that the fund and its shareholders receive and the other factors considered.
Costs of the Services and Profitability. The Board considered the revenues earned and the expenses incurred by Fidelity in conducting the business of developing, marketing, distributing, managing, administering and servicing each fund and servicing each fund's shareholders. The Board also considered the level of Fidelity's profits in respect of all the Fidelity funds.
On an annual basis, Fidelity presents to the Board Fidelity's profitability for each fund. Fidelity calculates the profitability for each fund, as well as aggregate profitability for groups of Fidelity funds and all Fidelity funds, using a series of detailed revenue and cost allocation methodologies which originate with the books and records of Fidelity on which Fidelity's audited financial statements are based. The Audit Committee of the Board reviews any significant changes from the prior year's methodologies.
PricewaterhouseCoopers LLP (PwC), independent registered public accounting firm and auditor to Fidelity and certain Fidelity funds, has been engaged annually by the Board as part of the Board's assessment of Fidelity's profitability analysis. PwC's engagement includes the review and assessment of the methodologies used by Fidelity in determining the revenues and expenses attributable to Fidelity's mutual fund business, and completion of agreed-upon procedures in respect of the mathematical accuracy of fund profitability and its conformity to established allocation methodologies. After considering PwC's reports issued under the engagement and information provided by Fidelity, the Board concluded that while other allocation methods may also be reasonable, Fidelity's profitability methodologies are reasonable in all material respects.
Annual Report
Board Approval of Investment Advisory Contracts and
Management Fees - continued
The Board also reviewed Fidelity's non-fund businesses and fall-out benefits related to the mutual fund business as well as cases where Fidelity's affiliates may benefit from or be related to the funds' business.
The Board considered the costs of the services provided by and the profits realized by Fidelity in connection with the operation of each fund and was satisfied that the profitability was not excessive in the circumstances.
Economies of Scale. The Board considered whether there have been economies of scale in respect of the management of the Fidelity funds, whether the Fidelity funds (including each fund) have appropriately benefited from any such economies of scale, and whether there is potential for realization of any further economies of scale. The Board considered the extent to which each fund will benefit from economies of scale through increased services to the fund, through waivers or reimbursements, or through fee or expense ratio reductions. The Board also noted that in 2013, it and the boards of other Fidelity funds created an ad hoc committee (the Economies of Scale Committee) to analyze whether Fidelity attains economies of scale in respect of the management and servicing of the Fidelity funds, whether the Fidelity funds have appropriately benefited from such economies of scale, and whether there is potential for realization of any further economies of scale.
The Board recognized that each fund's management contract incorporates a "group fee" structure, which provides for lower group fee rates as total group assets increase, and for higher group fee rates as total group assets decrease (with "group assets" defined to include fund assets under FMR's management plus sector fund assets previously under FMR's management and currently managed by Fidelity SelectCo, LLC). FMR calculates the group fee rates based on a tiered asset "breakpoint" schedule that varies based on asset class. The Board considered that the group fee is designed to deliver the benefits of economies of scale to fund shareholders when total Fidelity fund assets increase, even if assets of any particular fund are unchanged or have declined, because some portion of Fidelity's costs are attributable to services provided to all Fidelity funds, and all funds benefit if those costs can be allocated among more assets. The Board also considered that although each fund is offered only to other Fidelity funds, it continues to incur investment management expenses. The Board further noted that each fund may continue to realize benefits from the group fee structure, even though assets may not be expected to grow significantly at the fund level. The Board concluded that, given the group fee structure, fund shareholders will benefit from lower management fees as group assets increase at the fund complex level, regardless of whether Fidelity achieves any such economies of scale.
The Board concluded, taking into account the analysis of the Economies of Scale Committee, that economies of scale, if any, are being appropriately shared between fund shareholders and Fidelity.
Annual Report
Additional Information Requested by the Board. In order to develop fully the factual basis for consideration of the Fidelity funds' Advisory Contracts, the Board requested and received additional information on certain topics, including: (i) fund performance trends and Fidelity's long-term strategies for certain funds; (ii) Fidelity's strategic marketing and product lineup goals; (iii) the methodology with respect to competitive fund data and peer group classifications; (iv) the arrangements with, and performance of, certain sub-advisers on behalf of the Fidelity funds, as well as certain proposed participating affiliate arrangements; (v) the realization of fall-out benefits in certain Fidelity business units; (vi) Fidelity's group fee structures, including the rationale for the individual fee rates of certain categories of funds and the definition of group assets; (vii) trends regarding industry use of performance fee structures and the performance adjustment methodologies applicable to the Fidelity funds; (viii) additional competitive analysis regarding the total expenses for certain classes; (ix) fund profitability methodology, including Fidelity's cost allocation methodology, and the impact of certain factors on fund profitability results; and (x) the process by which Fidelity determines sub-advisory fees for funds it advises.
Based on its evaluation of all of the conclusions noted above, and after considering all factors it believed relevant, the Board ultimately concluded that the advisory fee structures are fair and reasonable, and that each fund's Advisory Contracts should be renewed.
Annual Report
Investment Adviser
Fidelity Management & Research Company
Boston, MA
Investment Sub-Advisers
FMR Co., Inc.
Fidelity Management & Research (U.K.) Inc.
Fidelity Management & Research (Hong Kong) Limited
Fidelity Management & Research (Japan) Limited
FIL Investment Advisors
FIL Investment Advisors (UK) Limited
FIL Investments (Japan) Limited
General Distributor
Fidelity Distributors Corporation
Smithfield, RI
Transfer and Service Agents
Fidelity Investments Institutional Operations Company, Inc.
Boston, MA
Fidelity Service Company, Inc.
Boston, MA
Custodians
The Northern Trust Company
Chicago, IL
Fidelity Series Emerging Markets Fund
State Street Bank and Trust Company
Quincy, MA
Fidelity Series International Growth Fund, Fidelity Series International Small Cap Fund, Fidelity Series International Value Fund
(Fidelity Investment logo)(registered trademark)
Corporate Headquarters
245 Summer St., Boston, MA 02210
www.fidelity.com
GSV-S-ANN-1214
1.907943.104
(Fidelity Investment logo)(registered trademark)
Fidelity Advisor®
Total Emerging Markets
Fund - Class A, Class T,
and Class C
Annual Report
October 31, 2014
(Fidelity Cover Art)
Class A, Class T, and
Class C are classes of
Fidelity® Total Emerging
Markets Fund
Contents
Performance | (Click Here) | How the fund has done over time. |
Management's Discussion of Fund Performance | (Click Here) | The Portfolio Manager's review of fund performance and strategy. |
Shareholder Expense Example | (Click Here) | An example of shareholder expenses. |
Investment Changes | (Click Here) | A summary of major shifts in the fund's investments over the past six months. |
Investments | (Click Here) | A complete list of the fund's investments with their market values. |
Financial Statements | (Click Here) | Statements of assets and liabilities, operations, and changes in net assets, as well as financial highlights. |
Notes | (Click Here) | Notes to the financial statements. |
Report of Independent Registered Public Accounting Firm | (Click Here) | |
Trustees and Officers | (Click Here) | |
Distributions | (Click Here) | |
Board Approval of Investment Advisory Contracts and Management Fees | (Click Here) | |
To view a fund's proxy voting guidelines and proxy voting record for the 12-month period ended June 30, visit http://www.fidelity.com/proxyvotingresults or visit the Securities and Exchange Commission's (SEC) web site at http://www.sec.gov. You may also call 1-877-208-0098 to request a free copy of the proxy voting guidelines.
Standard & Poor's, S&P and S&P 500 are registered service marks of The McGraw-Hill Companies, Inc. and have been licensed for use by Fidelity Distributors Corporation.
Other third-party marks appearing herein are the property of their respective owners.
All other marks appearing herein are registered or unregistered trademarks or service marks of FMR LLC or an affiliated company. © 2014 FMR LLC. All rights reserved.
Annual Report
This report and the financial statements contained herein are submitted for the general information of the shareholders of the fund. This report is not authorized for distribution to prospective investors in the fund unless preceded or accompanied by an effective prospectus.
A fund files its complete schedule of portfolio holdings with the SEC for the first and third quarters of each fiscal year on Form N-Q. Forms N-Q are available on the SEC's web site at http://www.sec.gov. A fund's Forms N-Q may be reviewed and copied at the SEC's Public Reference Room in Washington, DC. Information regarding the operation of the SEC's Public Reference Room may be obtained by calling 1-800-SEC-0330. For a complete list of a fund's portfolio holdings, view the most recent holdings listing, semiannual report, or annual report on Fidelity's web site at http://www.fidelity.com, http://advisor.fidelity.com, or http://www.401k.com, as applicable.
NOT FDIC INSURED • MAY LOSE VALUE • NO BANK GUARANTEE
Neither the fund nor Fidelity Distributors Corporation is a bank.
Annual Report
Average annual total return reflects the change in the value of an investment, assuming reinvestment of the class' distributions from dividend income and capital gains (the profits earned upon the sale of securities that have grown in value, if any) and assuming a constant rate of performance each year. The $10,000 table and the fund's returns do not reflect the deduction of taxes that a shareholder would pay on fund distributions or the redemption of fund shares. During periods of reimbursement by Fidelity, a fund's total return will be greater than it would be had the reimbursement not occurred. How a fund did yesterday is no guarantee of how it will do tomorrow.
Average Annual Total Returns
Periods ended October 31, 2014 | Past 1
year | Life of fund A |
Class A (incl. 5.75% sales charge) | -2.64% | 4.01% |
Class T (incl. 3.50% sales charge) | -0.57% | 4.57% |
Class C (incl. contingent deferred sales charge) B | 1.56% | 5.29% |
A From November 1, 2011.
B Class C shares' contingent deferred sales charges included in the past one year and life of fund total return figures are 1% and 0%, respectively.
$10,000 Over Life of Fund
Let's say hypothetically that $10,000 was invested in Fidelity Advisor® Total Emerging Markets Fund - Class A on November 1, 2011, when the fund started, and the current 5.75% sales charge was paid. The chart shows how the value of your investment would have changed, and also shows how the MSCI Emerging Markets Index performed over the same period.
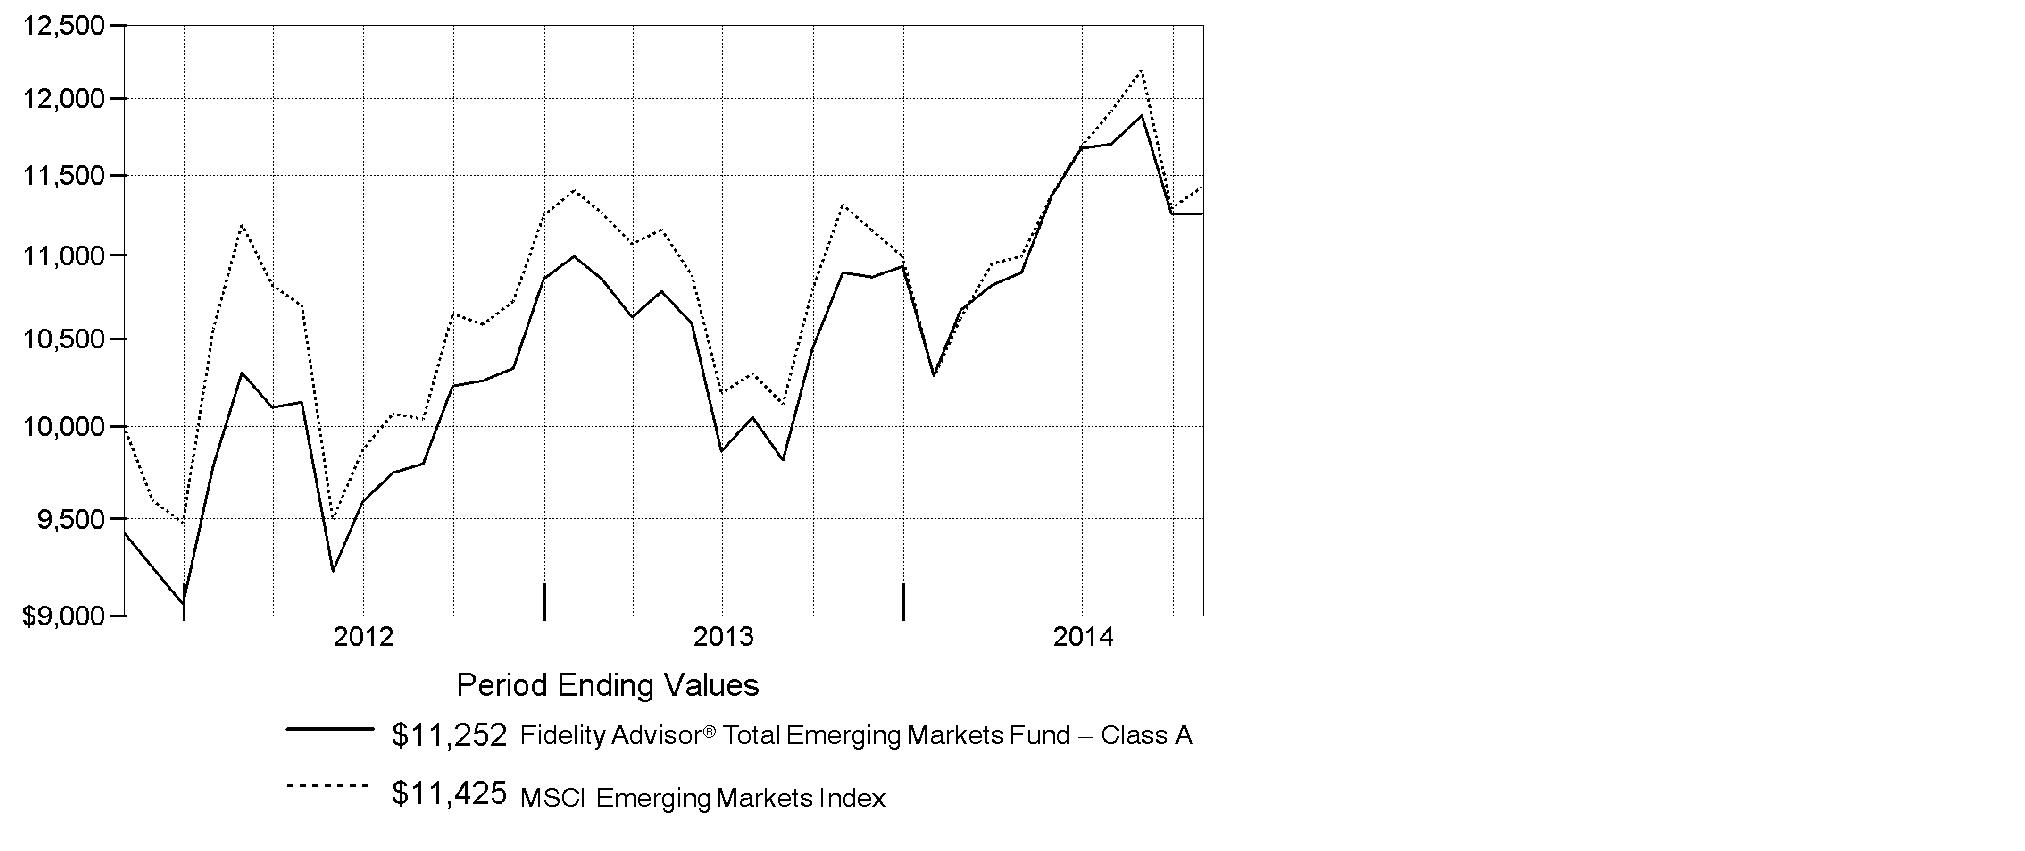
Annual Report
Market Recap: Global equities posted a healthy gain for the 12 months ending October 31, 2014, overcoming an October decline driven by recessionary pressures in China and tepid growth in Europe. The MSCI ACWI (All Country World Index) Index rose 8.15%, helped by investors' risk-taking and subdued market volatility for much of the period and supported by solid corporate earnings, especially in the United States. Stocks also benefited from easy monetary policies in Japan and the eurozone, as well as increased stimulus efforts in China. All but three of the 24 industry groups that compose the index marked a positive return. The U.S. (+17%) remained a pillar of strength, while a strongly rising dollar in the latter part of the period detracted from investors' returns in most non-U.S. markets. Canada (+5%) notched broad gains outside of its energy and materials sectors, as did Asia-Pacific ex Japan (+4%), led by investor enthusiasm for companies in India. The U.K., Europe and Japan, meanwhile, all underperformed. Turning to bonds, late-period strength in the U.S. dollar took its toll on performance: The Barclays® Global Aggregate GDP Weighted Index gained 1.09% for the year, lagging the 4.14% return of the Barclays® U.S. Aggregate Bond Index. Global corporate debt (+3%) fared relatively better, but still lagged the broad U.S. bond market.
Comments from John Carlson, Lead Portfolio Manager of Fidelity Advisor® Total Emerging Markets Fund: For the year, the fund's Class A, Class T and Class C shares gained 3.30%, 3.04% and 2.56%, respectively (excluding sales charges), compared with 0.98% for the MSCI Emerging Markets Index and 3.53% for the Fidelity Total Emerging Markets Composite IndexSM. Versus the Composite index, the fund's overweighting in equities, which underperformed, and underweighting in strong-performing EM debt detracted. However, the biggest contribution came from security selection among equities. Here, the equity sleeve's top individual contributor was South Korean cosmetics firm AMOREPACIFIC Group. Over the past year, the stock price tripled, benefiting from rapidly increasing demand for makeup among Chinese consumers, especially via e-commerce and duty-free sales. Conversely, positioning in Russia hurt results, including an investment in market-leading bank Sberbank. Turning to EM debt, underweighting Russia helped. We notably reduced exposure here in the first half of the period amid rising geopolitical uncertainty that caused a steep sell-off, although we added to our position shortly after that happened. On the flip side, it hurt to largely avoid Argentina.
Note to shareholders: Effective October 1, 2014, Per Johansson and Douglas Chow were no longer Co-Portfolio Managers of the fund, and Co-Portfolio Managers Gregory Lee and Tim Gannon became responsible for the energy and information technology subportfolios, respectively.
The views expressed above reflect those of the portfolio manager(s) only through the end of the period as stated on the cover of this report and do not necessarily represent the views of Fidelity or any other person in the Fidelity organization. Any such views are subject to change at any time based upon market or other conditions and Fidelity disclaims any responsibility to update such views. These views may not be relied on as investment advice and, because investment decisions for a Fidelity fund are based on numerous factors, may not be relied on as an indication of trading intent on behalf of any Fidelity fund.
Annual Report
Fidelity Total Emerging Markets Fund
Shareholder Expense Example
As a shareholder of the Fund, you incur two types of costs: (1) transaction costs, including sales charges (loads) on purchase payments or redemption proceeds, redemption fees and (2) ongoing costs, including management fees, distribution and/or service (12b-1) fees and other Fund expenses. This Example is intended to help you understand your ongoing costs (in dollars) of investing in the Fund and to compare these costs with the ongoing costs of investing in other mutual funds.
The Example is based on an investment of $1,000 invested at the beginning of the period and held for the entire period (May 1, 2014 to October 31, 2014).
Actual Expenses
The first line of the accompanying table for each class of the Fund provides information about actual account values and actual expenses. You may use the information in this line, together with the amount you invested, to estimate the expenses that you paid over the period. Simply divide your account value by $1,000.00 (for example, an $8,600 account value divided by $1,000.00 = 8.6), then multiply the result by the number in the first line for a class of the Fund under the heading entitled "Expenses Paid During Period" to estimate the expenses you paid on your account during this period. A small balance maintenance fee of $12.00 that is charged once a year may apply for certain accounts with a value of less than $2,000. This fee is not included in the table below. If it was, the estimate of expenses you paid during the period would be higher, and your ending account value lower, by this amount. In addition, the Fund, as a shareholder in the underlying Fidelity Central Funds, will indirectly bear its pro-rata share of the fees and expenses incurred by the underlying Fidelity Central Funds. These fees and expenses are not included in the Fund's annualized expense ratio used to calculate the expense estimate in the table below.
Hypothetical Example for Comparison Purposes
The second line of the accompanying table for each class of the Fund provides information about hypothetical account values and hypothetical expenses based on a Class' actual expense ratio and an assumed rate of return of 5% per year before expenses, which is not the Class' actual return. The hypothetical account values and expenses may not be used to estimate the actual ending account balance or expenses you paid for the period. You may use this information to compare the ongoing costs of investing in the Fund and other funds. To do so, compare this 5% hypothetical example with the 5% hypothetical examples that appear in the shareholder reports of the other funds. A small balance maintenance fee of $12.00 that is charged once a year may apply for certain accounts with a value of less than $2,000. This fee is not included in the table below. If it was, the estimate of expenses you paid during the period would be higher, and your ending account value lower, by this amount. In addition, the Fund, as a shareholder in the underlying Fidelity Central Funds, will indirectly bear its pro-rata share of the fees and expenses incurred by the underlying Fidelity Central Funds. These fees and expenses are not included in the Fund's annualized expense ratio used to calculate the expense estimate in the table below.
Please note that the expenses shown in the table are meant to highlight your ongoing costs only and do not reflect any transaction costs. Therefore, the second line of the table is useful in comparing ongoing costs only, and will not help you determine the relative total costs of owning different funds. In addition, if these transactional costs were included, your costs would have been higher.
Annual Report
| Annualized
Expense RatioB | Beginning
Account Value
May 1, 2014 | Ending
Account Value
October 31, 2014 | Expenses Paid
During Period*
May 1, 2014
to October 31, 2014 |
Class A | 1.65% | | | |
Actual | | $ 1,000.00 | $ 1,033.10 | $ 8.46 |
HypotheticalA | | $ 1,000.00 | $ 1,016.89 | $ 8.39 |
Class T | 1.90% | | | |
Actual | | $ 1,000.00 | $ 1,031.30 | $ 9.73 |
HypotheticalA | | $ 1,000.00 | $ 1,015.63 | $ 9.65 |
Class C | 2.40% | | | |
Actual | | $ 1,000.00 | $ 1,028.70 | $ 12.27 |
HypotheticalA | | $ 1,000.00 | $ 1,013.11 | $ 12.18 |
Total Emerging Markets | 1.40% | | | |
Actual | | $ 1,000.00 | $ 1,033.90 | $ 7.18 |
HypotheticalA | | $ 1,000.00 | $ 1,018.15 | $ 7.12 |
Institutional Class | 1.40% | | | |
Actual | | $ 1,000.00 | $ 1,033.90 | $ 7.18 |
HypotheticalA | | $ 1,000.00 | $ 1,018.15 | $ 7.12 |
A 5% return per year before expenses
B Annualized expense ratio reflects expenses net of applicable fee waivers.
* Expenses are equal to each Class' annualized expense ratio, multiplied by the average account value over the period, multiplied by 184/365 (to reflect the one-half year period).
Annual Report
Fidelity Total Emerging Markets Fund
Investment Changes (Unaudited)
Top Five Stocks as of October 31, 2014 |
| % of fund's
net assets | % of fund's net assets
6 months ago |
Samsung Electronics Co. Ltd. (Korea (South), Technology Hardware, Storage & Peripherals) | 2.9 | 3.1 |
Taiwan Semiconductor Manufacturing Co. Ltd. (Taiwan, Semiconductors & Semiconductor Equipment) | 2.3 | 2.6 |
Tencent Holdings Ltd. (Cayman Islands, Internet Software & Services) | 1.5 | 1.7 |
Naspers Ltd. Class N (South Africa, Media) | 1.3 | 0.9 |
Industrial & Commercial Bank of China Ltd. (H Shares) (China, Banks) | 1.1 | 1.2 |
| 9.1 | |
Top Five Market Sectors as of October 31, 2014 |
| % of fund's
net assets | % of fund's net assets
6 months ago |
Financials | 22.6 | 20.1 |
Information Technology | 13.8 | 12.5 |
Energy | 9.4 | 11.9 |
Consumer Discretionary | 6.8 | 5.9 |
Consumer Staples | 6.5 | 6.3 |
Top Five Countries as of October 31, 2014 |
(excluding cash equivalents) | % of fund's
net assets | % of fund's net assets
6 months ago |
Korea (South) | 13.5 | 13.7 |
India | 8.5 | 5.2 |
Brazil | 7.1 | 7.9 |
Taiwan | 6.3 | 5.5 |
China | 5.9 | 4.7 |
Percentages are adjusted for the effect of open futures contracts, if applicable. |
Asset Allocation (% of fund's net assets) |
As of October 31, 2014 | As of April 30, 2014 |
 | Stocks and
Equity Futures 75.6% | | | Stocks and
Equity Futures 70.1% | |
 | Bonds 22.9% | | | Bonds 27.3% | |
 | Short-Term
Investments and
Net Other Assets (Liabilities) 1.5% | | | Short-Term
Investments and
Net Other Assets (Liabilities) 2.6% | |

Annual Report
Fidelity Total Emerging Markets Fund
Investments October 31, 2014
Showing Percentage of Net Assets
Common Stocks - 69.0% |
| Shares | | Value |
Argentina - 0.5% |
Grupo Financiero Galicia SA sponsored ADR | 7,910 | | $ 116,277 |
YPF SA Class D sponsored ADR | 7,637 | | 268,593 |
TOTAL ARGENTINA | | 384,870 |
Austria - 0.2% |
C.A.T. oil AG (Bearer) | 6,531 | | 124,402 |
Bermuda - 1.2% |
Aquarius Platinum Ltd. (Australia) (a) | 440,582 | | 119,908 |
Cosan Ltd. Class A | 11,963 | | 126,688 |
Credicorp Ltd. (United States) | 200 | | 32,200 |
GP Investments Ltd. Class A (depositary receipt) (a) | 76,222 | | 154,111 |
Hoegh LNG Holdings Ltd. (a) | 664 | | 8,565 |
Shangri-La Asia Ltd. | 150,000 | | 217,801 |
Yue Yuen Industrial (Holdings) Ltd. | 95,500 | | 320,592 |
TOTAL BERMUDA | | 979,865 |
Brazil - 2.2% |
BM&F BOVESPA SA | 52,970 | | 233,009 |
BR Properties SA | 27,480 | | 138,847 |
CCR SA | 5,100 | | 37,974 |
Cielo SA | 15,200 | | 249,602 |
Cosan SA Industria e Comercio | 6,639 | | 92,676 |
Fibria Celulose SA (a) | 17,500 | | 211,944 |
Localiza Rent A Car SA | 900 | | 12,974 |
Mills Estruturas e Servicos de Engenharia SA | 3,000 | | 19,553 |
Minerva SA (a) | 61,900 | | 318,506 |
Qualicorp SA (a) | 2,750 | | 27,967 |
Smiles SA | 13,200 | | 228,000 |
T4F Entretenimento SA (a) | 31,500 | | 35,595 |
Ultrapar Participacoes SA | 6,900 | | 150,509 |
TOTAL BRAZIL | | 1,757,156 |
British Virgin Islands - 0.1% |
Mail.Ru Group Ltd. GDR (Reg. S) (a) | 3,251 | | 78,804 |
Canada - 0.6% |
First Quantum Minerals Ltd. | 5,700 | | 85,977 |
Goldcorp, Inc. | 8,700 | | 163,263 |
Pan American Silver Corp. | 14,500 | | 133,835 |
Torex Gold Resources, Inc. (a) | 49,200 | | 52,385 |
TOTAL CANADA | | 435,460 |
Common Stocks - continued |
| Shares | | Value |
Cayman Islands - 5.5% |
58.com, Inc. ADR | 5,950 | | $ 235,442 |
Alibaba Group Holding Ltd. sponsored ADR | 1,100 | | 108,460 |
Anta Sports Products Ltd. | 121,000 | | 237,497 |
China Lodging Group Ltd. ADR (a) | 9,800 | | 269,402 |
China ZhengTong Auto Services Holdings Ltd. | 357,400 | | 202,468 |
Cimc Enric Holdings Ltd. | 132,000 | | 132,740 |
E-House China Holdings Ltd. ADR | 13,460 | | 134,465 |
Eurasia Drilling Co. Ltd. GDR (Reg. S) | 6,534 | | 163,350 |
GCL-Poly Energy Holdings Ltd. (a) | 234,000 | | 78,863 |
Greatview Aseptic Pack Co. Ltd. | 211,000 | | 138,906 |
Haitian International Holdings Ltd. | 59,000 | | 126,560 |
Hengan International Group Co. Ltd. | 28,000 | | 295,141 |
SINA Corp. (a) | 2,801 | | 114,757 |
Tencent Holdings Ltd. | 76,700 | | 1,232,743 |
Tingyi (Cayman Islands) Holding Corp. | 180,000 | | 447,794 |
Uni-President China Holdings Ltd. | 329,600 | | 306,254 |
Xueda Education Group sponsored ADR | 8,700 | | 24,447 |
Yingde Gases Group Co. Ltd. | 134,500 | | 105,023 |
TOTAL CAYMAN ISLANDS | | 4,354,312 |
Chile - 0.7% |
Embotelladora Andina SA ADR | 1,700 | | 26,350 |
Empresa Nacional de Electricidad SA | 75,303 | | 117,256 |
Inversiones La Construccion SA | 14,226 | | 202,727 |
Vina Concha y Toro SA | 120,325 | | 230,061 |
TOTAL CHILE | | 576,394 |
China - 5.9% |
Anhui Conch Cement Co. Ltd. (H Shares) | 46,000 | | 150,644 |
BBMG Corp. (H Shares) | 265,000 | | 187,385 |
China Life Insurance Co. Ltd. (H Shares) | 232,170 | | 692,789 |
China Pacific Insurance Group Co. Ltd. (H Shares) | 140,400 | | 525,399 |
China Shenhua Energy Co. Ltd. (H Shares) | 83,000 | | 233,939 |
China Suntien Green Energy Corp. Ltd. (H Shares) | 358,350 | | 95,179 |
China Telecom Corp. Ltd. (H Shares) | 788,357 | | 502,542 |
Industrial & Commercial Bank of China Ltd. (H Shares) | 1,324,500 | | 879,415 |
Maanshan Iron & Steel Ltd. (H Shares) (a) | 778,000 | | 202,861 |
PetroChina Co. Ltd.: | | | |
(H Shares) | 460,000 | | 575,894 |
sponsored ADR | 500 | | 62,750 |
Common Stocks - continued |
| Shares | | Value |
China - continued |
PICC Property & Casualty Co. Ltd. (H Shares) | 269,500 | | $ 494,381 |
Sinopec Engineering Group Co. Ltd. (H Shares) (d) | 88,500 | | 85,595 |
TOTAL CHINA | | 4,688,773 |
Colombia - 0.5% |
BanColombia SA sponsored ADR | 7,141 | | 403,966 |
Denmark - 0.0% |
Auriga Industries A/S Series B (a) | 681 | | 35,142 |
Egypt - 0.2% |
Citadel Capital Corp. (a) | 307,200 | | 170,140 |
Greece - 0.4% |
National Bank of Greece SA (a) | 79,160 | | 190,942 |
Public Power Corp. of Greece (a) | 12,794 | | 97,159 |
TOTAL GREECE | | 288,101 |
Hong Kong - 2.5% |
China Power International Development Ltd. | 321,600 | | 145,274 |
China Resources Power Holdings Co. Ltd. | 64,535 | | 187,838 |
China Unicom Ltd. | 147,400 | | 221,471 |
CNOOC Ltd. | 322,000 | | 504,216 |
CNOOC Ltd. sponsored ADR | 400 | | 62,548 |
Far East Horizon Ltd. | 255,000 | | 237,165 |
Lenovo Group Ltd. | 162,000 | | 238,789 |
Sinotruk Hong Kong Ltd. | 227,000 | | 117,664 |
Techtronic Industries Co. Ltd. | 97,000 | | 303,668 |
TOTAL HONG KONG | | 2,018,633 |
India - 8.5% |
Adani Ports & Special Economic Zone | 53,689 | | 249,554 |
Axis Bank Ltd. (a) | 103,278 | | 761,183 |
Bharti Airtel Ltd. (a) | 49,801 | | 323,605 |
Bharti Infratel Ltd. | 81,123 | | 388,777 |
Coal India Ltd. | 69,344 | | 418,138 |
Eicher Motors Ltd. | 1,733 | | 359,959 |
GAIL India Ltd. | 25,361 | | 217,976 |
Grasim Industries Ltd. | 4,012 | | 240,753 |
HCL Technologies Ltd. | 4,819 | | 126,384 |
Infosys Ltd. | 8,364 | | 554,409 |
ITC Ltd. (a) | 75,310 | | 435,436 |
JK Cement Ltd. | 17,887 | | 175,695 |
Larsen & Toubro Ltd. (a) | 7,434 | | 200,341 |
LIC Housing Finance Ltd. | 29,517 | | 173,818 |
Common Stocks - continued |
| Shares | | Value |
India - continued |
Lupin Ltd. | 14,411 | | $ 333,663 |
Petronet LNG Ltd. (a) | 71,884 | | 233,384 |
Phoenix Mills Ltd. | 40,098 | | 252,445 |
Power Grid Corp. of India Ltd. | 57,775 | | 137,082 |
SREI Infrastructure Finance Ltd. | 313,747 | | 242,544 |
State Bank of India | 4,956 | | 218,096 |
Tata Consultancy Services Ltd. | 7,001 | | 297,875 |
Wipro Ltd. | 14,659 | | 135,407 |
Yes Bank Ltd. | 26,641 | | 301,674 |
TOTAL INDIA | | 6,778,198 |
Indonesia - 1.1% |
PT AKR Corporindo Tbk | 171,200 | | 69,750 |
PT Bakrieland Development Tbk (a) | 17,571,300 | | 73,717 |
PT Bank Rakyat Indonesia Tbk | 574,900 | | 526,836 |
PT Kalbe Farma Tbk | 1,651,600 | | 233,194 |
TOTAL INDONESIA | | 903,497 |
Israel - 0.4% |
Bezeq The Israel Telecommunication Corp. Ltd. | 192,650 | | 325,692 |
Kenya - 0.2% |
Equity Bank Ltd. (a) | 311,500 | | 177,602 |
Korea (South) - 12.0% |
AMOREPACIFIC Group, Inc. | 385 | | 423,898 |
Daewoo International Corp. | 25,428 | | 801,100 |
E-Mart Co. Ltd. | 1,898 | | 349,766 |
Fila Korea Ltd. | 2,076 | | 215,436 |
Hana Financial Group, Inc. | 14,815 | | 510,864 |
Hankook Shell Oil Co. Ltd. | 149 | | 67,813 |
Hyundai Industrial Development & Construction Co. | 8,576 | | 322,065 |
Hyundai Mobis | 2,545 | | 592,166 |
KB Financial Group, Inc. | 13,310 | | 518,974 |
KEPCO Plant Service & Engineering Co. Ltd. | 1,557 | | 127,088 |
Korea Electric Power Corp. | 4,800 | | 209,579 |
Korea Zinc Co. Ltd. | 492 | | 184,309 |
Korean Reinsurance Co. | 32,699 | | 346,941 |
LG Chemical Ltd. | 1,204 | | 224,116 |
LG Corp. | 3,739 | | 221,324 |
NAVER Corp. | 439 | | 308,072 |
POSCO | 927 | | 266,328 |
Samsung C&T Corp. | 4,609 | | 310,142 |
Samsung Electronics Co. Ltd. | 1,995 | | 2,309,819 |
Common Stocks - continued |
| Shares | | Value |
Korea (South) - continued |
Shinhan Financial Group Co. Ltd. | 14,859 | | $ 695,622 |
SK Hynix, Inc. (a) | 8,762 | | 386,950 |
SK Telecom Co. Ltd. sponsored ADR | 5,006 | | 139,117 |
TOTAL KOREA (SOUTH) | | 9,531,489 |
Luxembourg - 0.5% |
Globant SA (a) | 4,840 | | 62,630 |
Tenaris SA sponsored ADR | 8,800 | | 348,832 |
TOTAL LUXEMBOURG | | 411,462 |
Mexico - 4.9% |
America Movil S.A.B. de CV Series L sponsored ADR | 29,973 | | 731,641 |
Banregio Grupo Financiero S.A.B. de CV | 18,969 | | 109,704 |
CEMEX S.A.B. de CV sponsored ADR | 25,808 | | 317,438 |
El Puerto de Liverpool S.A.B. de CV Class C | 21,400 | | 251,071 |
Fomento Economico Mexicano S.A.B. de CV sponsored ADR | 3,950 | | 380,148 |
Grupo Aeroportuario del Pacifico SA de CV Series B | 28,000 | | 190,503 |
Grupo Aeroportuario Norte S.A.B. de CV | 19,700 | | 98,147 |
Grupo Comercial Chedraui S.A.B. de CV | 83,376 | | 293,290 |
Grupo Financiero Banorte S.A.B. de CV Series O | 49,560 | | 317,942 |
Grupo Televisa SA de CV (CPO) sponsored ADR | 23,900 | | 863,746 |
Macquarie Mexican (REIT) | 165,870 | | 301,285 |
TOTAL MEXICO | | 3,854,915 |
Nigeria - 1.3% |
Guaranty Trust Bank PLC | 556,759 | | 84,026 |
Guaranty Trust Bank PLC GDR (Reg. S) | 37,730 | | 290,521 |
Transnational Corp. of Nigeria PLC | 3,207,008 | | 78,215 |
Zenith Bank PLC | 4,383,603 | | 561,017 |
TOTAL NIGERIA | | 1,013,779 |
Panama - 0.2% |
Copa Holdings SA Class A | 1,200 | | 140,304 |
Philippines - 1.9% |
Alliance Global Group, Inc. | 513,700 | | 288,935 |
LT Group, Inc. | 436,400 | | 138,151 |
Metropolitan Bank & Trust Co. | 215,484 | | 395,376 |
PNOC Energy Development Corp. | 644,500 | | 110,343 |
Robinsons Land Corp. | 980,100 | | 535,075 |
TOTAL PHILIPPINES | | 1,467,880 |
Common Stocks - continued |
| Shares | | Value |
Poland - 0.6% |
Cyfrowy Polsat SA | 35,000 | | $ 267,697 |
Powszechny Zaklad Ubezpieczen SA | 1,598 | | 239,513 |
TOTAL POLAND | | 507,210 |
Puerto Rico - 0.1% |
Popular, Inc. (a) | 3,430 | | 109,348 |
Romania - 0.0% |
SNGN Romgaz SA GDR (d) | 1,769 | | 16,682 |
Russia - 2.2% |
Bashneft OJSC rights (a) | 150 | | 0 |
E.ON Russia JSC (a) | 2,321,800 | | 134,902 |
LUKOIL Oil Co. sponsored ADR (United Kingdom) | 8,700 | | 427,170 |
Mobile TeleSystems OJSC (a) | 29,411 | | 174,373 |
NOVATEK OAO GDR (Reg. S) | 4,100 | | 440,340 |
Sberbank (Savings Bank of the Russian Federation) (a) | 289,250 | | 512,658 |
TMK OAO GDR (Reg. S) | 11,400 | | 89,262 |
TOTAL RUSSIA | | 1,778,705 |
Singapore - 0.6% |
Ezion Holdings Ltd. | 83,040 | | 97,787 |
First Resources Ltd. | 213,000 | | 345,078 |
TOTAL SINGAPORE | | 442,865 |
South Africa - 4.6% |
Alexander Forbes Group Holding (a) | 137,755 | | 107,409 |
Aspen Pharmacare Holdings Ltd. | 14,338 | | 511,448 |
Barclays Africa Group Ltd. | 17,953 | | 283,478 |
Bidvest Group Ltd. | 11,856 | | 326,096 |
Blue Label Telecoms Ltd. | 134,400 | | 118,806 |
Impala Platinum Holdings Ltd. (a) | 22,700 | | 165,242 |
JSE Ltd. | 16,790 | | 163,489 |
Life Healthcare Group Holdings Ltd. | 65,700 | | 248,391 |
MTN Group Ltd. | 30,427 | | 673,106 |
Naspers Ltd. Class N | 8,300 | | 1,032,926 |
TOTAL SOUTH AFRICA | | 3,630,391 |
Taiwan - 6.3% |
Catcher Technology Co. Ltd. | 23,000 | | 193,857 |
Cathay Financial Holding Co. Ltd. | 50,600 | | 83,277 |
E.SUN Financial Holdings Co. Ltd. | 270,697 | | 171,188 |
Hon Hai Precision Industry Co. Ltd. (Foxconn) | 255,624 | | 807,788 |
Inotera Memories, Inc. (a) | 95,000 | | 146,591 |
Common Stocks - continued |
| Shares | | Value |
Taiwan - continued |
King's Town Bank | 33,000 | | $ 36,035 |
Largan Precision Co. Ltd. | 3,000 | | 210,419 |
MediaTek, Inc. | 29,000 | | 413,560 |
Pegatron Corp. | 76,000 | | 138,294 |
Radiant Opto-Electronics Corp. | 30,000 | | 104,666 |
Taiwan Fertilizer Co. Ltd. | 122,000 | | 216,104 |
Taiwan Semiconductor Manufacturing Co. Ltd. | 380,000 | | 1,644,683 |
Taiwan Semiconductor Manufacturing Co. Ltd. sponsored ADR | 5,442 | | 119,833 |
Unified-President Enterprises Corp. | 295,243 | | 506,876 |
Universal Cement Corp. | 109,740 | | 96,452 |
Vanguard International Semiconductor Corp. | 69,000 | | 103,502 |
Voltronic Power Technology Corp. | 50 | | 403 |
TOTAL TAIWAN | | 4,993,528 |
Thailand - 1.0% |
Intouch Holdings PCL NVDR | 80,300 | | 182,306 |
Kasikornbank PCL (For. Reg.) | 57,860 | | 419,066 |
Thai Union Frozen Products PCL (For. Reg.) | 94,100 | | 215,163 |
TOTAL THAILAND | | 816,535 |
Turkey - 1.5% |
Aksa Akrilik Kimya Sanayii | 3,000 | | 9,867 |
Aselsan A/S | 25,000 | | 113,603 |
Aygaz A/S | 21,647 | | 91,257 |
Tupras Turkiye Petrol Rafinelleri A/S | 12,200 | | 264,842 |
Turkcell Iletisim Hizmet A/S (a) | 5,240 | | 30,462 |
Turkcell Iletisim Hizmet A/S sponsored ADR (a) | 14,440 | | 211,257 |
Turkiye Garanti Bankasi A/S | 81,250 | | 317,110 |
Turkiye Halk Bankasi A/S | 26,240 | | 175,315 |
TOTAL TURKEY | | 1,213,713 |
United Arab Emirates - 0.4% |
DP World Ltd. | 6,124 | | 117,336 |
First Gulf Bank PJSC | 41,207 | | 203,623 |
TOTAL UNITED ARAB EMIRATES | | 320,959 |
United Kingdom - 0.0% |
China Pacific Insurance Group Co. Ltd. (UBS Warrant Programme) warrants ELS 6/29/15 (a)(d) | 8,100 | | 26,833 |
United States of America - 0.2% |
Cognizant Technology Solutions Corp. Class A (a) | 3,020 | | 147,527 |
TOTAL COMMON STOCKS (Cost $47,476,311) |
54,905,132
|
Nonconvertible Preferred Stocks - 6.5% |
| Shares | | Value |
Brazil - 4.7% |
Ambev SA sponsored ADR | 49,000 | | $ 327,320 |
Banco do Estado Rio Grande do Sul SA | 59,130 | | 353,172 |
Braskem SA (PN-A) | 30,500 | | 223,159 |
Companhia Paranaense de Energia-Copel: | | | |
(PN-B) | 815 | | 11,383 |
(PN-B) sponsored | 6,811 | | 96,035 |
Gerdau SA sponsored ADR | 51,211 | | 231,986 |
Itau Unibanco Holding SA sponsored ADR | 57,978 | | 855,755 |
Marcopolo SA (PN) | 85,100 | | 145,617 |
Petroleo Brasileiro SA - Petrobras: | | | |
(PN) sponsored (non-vtg.) | 2,806 | | 34,317 |
sponsored ADR | 51,921 | | 607,476 |
TIM Participacoes SA sponsored ADR | 6,104 | | 167,982 |
Vale SA (PN-A) sponsored ADR | 78,100 | | 684,156 |
TOTAL BRAZIL | | 3,738,358 |
Chile - 0.1% |
Embotelladora Andina SA Class A | 38,679 | | 99,148 |
Korea (South) - 1.5% |
Hyundai Motor Co. Series 2 | 3,017 | | 359,419 |
Samsung Electronics Co. Ltd. | 446 | | 408,872 |
Samsung Fire & Marine Insurance Co. Ltd. | 2,070 | | 390,132 |
TOTAL KOREA (SOUTH) | | 1,158,423 |
Russia - 0.2% |
Surgutneftegas (a) | 292,550 | | 200,621 |
TOTAL NONCONVERTIBLE PREFERRED STOCKS (Cost $5,815,014) |
5,196,550
|
Nonconvertible Bonds - 4.2% |
| Principal Amount | | |
Azerbaijan - 0.3% |
International Bank of Azerbaijan OJSC 5.625% 6/11/19 (Reg. S) | | $ 200,000 | | 198,200 |
Georgia - 0.4% |
Georgia Bank Joint Stock Co. 7.75% 7/5/17 (d) | | 300,000 | | 317,481 |
Indonesia - 0.2% |
PT Pertamina Persero 5.625% 5/20/43 (d) | | 200,000 | | 191,500 |
Nonconvertible Bonds - continued |
| Principal Amount | | Value |
Ireland - 0.1% |
Vnesheconombank Via VEB Finance PLC 6.8% 11/22/25 (d) | | $ 100,000 | | $ 98,875 |
Kazakhstan - 0.4% |
KazMunaiGaz National Co. 5.75% 4/30/43 (d) | | 300,000 | | 291,750 |
Luxembourg - 0.6% |
RSHB Capital SA: | | | | |
5.1% 7/25/18 (d) | | 400,000 | | 383,020 |
6.299% 5/15/17 (Reg. S) | | 100,000 | | 100,250 |
TOTAL LUXEMBOURG | | 483,270 |
Mexico - 0.3% |
Petroleos Mexicanos 6.375% 1/23/45 | | 175,000 | | 200,795 |
Netherlands - 0.4% |
Indosat Palapa Co. BV 7.375% 7/29/20 (d) | | 100,000 | | 106,250 |
Mozambique Ematum Finance 2020 6.305% 9/11/20 (Reg. S) | | 200,000 | | 199,750 |
TOTAL NETHERLANDS | | 306,000 |
Trinidad & Tobago - 0.2% |
Petroleum Co. of Trinidad & Tobago Ltd. 9.75% 8/14/19 (d) | | 150,000 | | 187,500 |
Venezuela - 1.3% |
Petroleos de Venezuela SA: | | | | |
5.5% 4/12/37 | | 500,000 | | 232,500 |
6% 11/15/26 (Reg. S) | | 700,000 | | 342,300 |
8.5% 11/2/17 (d) | | 250,000 | | 189,350 |
9% 11/17/21 (Reg. S) | | 150,000 | | 95,063 |
9.75% 5/17/35 (d) | | 300,000 | | 183,150 |
TOTAL VENEZUELA | | 1,042,363 |
TOTAL NONCONVERTIBLE BONDS (Cost $3,390,824) |
3,317,734
|
Government Obligations - 18.8% |
|
Armenia - 0.5% |
Republic of Armenia 6% 9/30/20 (d) | | 400,000 | | 418,000 |
Government Obligations - continued |
| Principal Amount | | Value |
Azerbaijan - 0.7% |
Azerbaijan Republic 4.75% 3/18/24 (d) | | $ 200,000 | | $ 208,250 |
State Oil Co. of Azerbaijan Republic 4.75% 3/13/23 (Reg. S) | | 325,000 | | 322,758 |
TOTAL AZERBAIJAN | | 531,008 |
Barbados - 0.4% |
Barbados Government 7% 8/4/22 (d) | | 350,000 | | 326,375 |
Belarus - 0.4% |
Belarus Republic 8.75% 8/3/15 (Reg. S) | | 325,000 | | 331,565 |
Belize - 0.3% |
Belize Government 5% 2/20/38 (c)(d) | | 332,500 | | 251,038 |
Bolivia - 0.2% |
Plurinational State of Bolivia 4.875% 10/29/22 (d) | | 200,000 | | 205,250 |
Brazil - 0.2% |
Brazilian Federative Republic 5% 1/27/45 | | 200,000 | | 196,000 |
Colombia - 0.3% |
Colombian Republic 11.75% 2/25/20 | | 150,000 | | 213,375 |
Congo - 0.3% |
Congo Republic 3.5% 6/30/29 (c) | | 312,550 | | 285,564 |
Costa Rica - 0.3% |
Costa Rican Republic 7% 4/4/44 (d) | | 200,000 | | 206,500 |
Croatia - 0.3% |
Croatia Republic 6% 1/26/24 (d) | | 250,000 | | 270,313 |
Dominican Republic - 0.5% |
Dominican Republic: | | | | |
5.875% 4/18/24 (d) | | 150,000 | | 158,250 |
7.45% 4/30/44 (d) | | 200,000 | | 223,500 |
TOTAL DOMINICAN REPUBLIC | | 381,750 |
El Salvador - 0.5% |
El Salvador Republic: | | | | |
6.375% 1/18/27 (d) | | 200,000 | | 205,000 |
7.625% 2/1/41 (d) | | 150,000 | | 162,000 |
TOTAL EL SALVADOR | | 367,000 |
Gabon - 0.3% |
Gabonese Republic 6.375% 12/12/24 (d) | | 200,000 | | 212,000 |
Georgia - 0.3% |
Georgia Republic 6.875% 4/12/21 (d) | | 200,000 | | 225,540 |
Government Obligations - continued |
| Principal Amount | | Value |
Ghana - 0.5% |
Ghana Republic: | | | | |
7.875% 8/7/23 (Reg.S) | | $ 200,000 | | $ 201,300 |
8.125% 1/18/26 (d) | | 200,000 | | 201,000 |
TOTAL GHANA | | 402,300 |
Guatemala - 0.2% |
Guatemalan Republic 4.875% 2/13/28 (d) | | 200,000 | | 204,500 |
Hungary - 0.6% |
Hungarian Republic 7.625% 3/29/41 | | 350,000 | | 452,375 |
Indonesia - 0.9% |
Indonesian Republic: | | | | |
5.875% 1/15/24 (d) | | 400,000 | | 455,000 |
6.75% 1/15/44 (d) | | 200,000 | | 245,250 |
TOTAL INDONESIA | | 700,250 |
Ivory Coast - 0.6% |
Ivory Coast: | | | | |
5.375% 7/23/24 (d) | | 200,000 | | 191,500 |
7.7743% 12/31/32 | | 275,000 | | 265,430 |
TOTAL IVORY COAST | | 456,930 |
Jamaica - 0.2% |
Jamaican Government 8% 6/24/19 | | 150,000 | | 162,000 |
Jordan - 0.4% |
Jordanian Kingdom 3.875% 11/12/15 | | 300,000 | | 303,450 |
Kenya - 0.3% |
Republic of Kenya 6.875% 6/24/24 (d) | | 200,000 | | 213,000 |
Lebanon - 0.3% |
Lebanese Republic 11.625% 5/11/16 (Reg. S) | | 250,000 | | 278,750 |
Mexico - 0.7% |
United Mexican States 5.75% 10/12/2110 | | 500,000 | | 529,418 |
Mongolia - 0.2% |
Mongolian People's Republic 5.125% 12/5/22 (Reg. S) | | 200,000 | | 178,000 |
Morocco - 0.2% |
Moroccan Kingdom 5.5% 12/11/42 (d) | | 200,000 | | 203,500 |
Namibia - 0.3% |
Republic of Namibia 5.5% 11/3/21 (d) | | 200,000 | | 216,000 |
Netherlands - 0.3% |
Republic of Angola 7% 8/16/19 (Issued by Northern Lights III BV for Republic of Angola) (Reg. S) | | 250,000 | | 267,188 |
Government Obligations - continued |
| Principal Amount | | Value |
Nigeria - 0.3% |
Republic of Nigeria 6.375% 7/12/23 | | $ 200,000 | | $ 212,000 |
Pakistan - 0.3% |
Islamic Republic of Pakistan 7.25% 4/15/19 (d) | | 200,000 | | 206,500 |
Panama - 0.2% |
Panamanian Republic 4.3% 4/29/53 | | 200,000 | | 180,000 |
Philippines - 0.5% |
Philippine Republic: | | | | |
9.5% 2/2/30 | | 150,000 | | 239,438 |
10.625% 3/16/25 | | 100,000 | | 158,250 |
TOTAL PHILIPPINES | | 397,688 |
Romania - 0.3% |
Romanian Republic 6.125% 1/22/44 (d) | | 200,000 | | 234,250 |
Russia - 1.6% |
Russian Federation: | | | | |
4.875% 9/16/23 (d) | | 200,000 | | 200,290 |
5.625% 4/4/42 (d) | | 200,000 | | 201,834 |
5.875% 9/16/43 (d) | | 200,000 | | 209,000 |
7.5% 3/31/30 (Reg. S) | | 245,625 | | 278,659 |
12.75% 6/24/28 (Reg. S) | | 225,000 | | 370,733 |
TOTAL RUSSIA | | 1,260,516 |
Senegal - 0.3% |
Republic of Senegal 8.75% 5/13/21 (d) | | 200,000 | | 229,000 |
Serbia - 0.4% |
Republic of Serbia 7.25% 9/28/21 (d) | | 260,000 | | 298,870 |
Sri Lanka - 0.4% |
Democratic Socialist Republic of Sri Lanka 6.25% 10/4/20 (d) | | 300,000 | | 319,500 |
Tanzania - 0.3% |
United Republic of Tanzania 6.3289% 3/9/20 (f) | | 200,000 | | 216,250 |
Turkey - 1.1% |
Turkish Republic: | | | | |
6.625% 2/17/45 | | 200,000 | | 239,560 |
7.375% 2/5/25 | | 300,000 | | 370,785 |
11.875% 1/15/30 | | 165,000 | | 287,925 |
TOTAL TURKEY | | 898,270 |
Government Obligations - continued |
| Principal Amount | | Value |
Ukraine - 0.5% |
Ukraine Government: | | | | |
6.58% 11/21/16 (d) | | $ 250,000 | | $ 220,050 |
6.75% 11/14/17 (d) | | 200,000 | | 174,500 |
TOTAL UKRAINE | | 394,550 |
United States of America - 0.1% |
U.S. Treasury Bills, yield at date of purchase 0.01% to 0.02% 12/11/14 to 12/18/14 (e) | | 80,000 | | 79,999 |
Venezuela - 0.8% |
Venezuelan Republic: | | | | |
7% 3/31/38 | | 650,000 | | 373,750 |
8.25% 10/13/24 | | 300,000 | | 181,200 |
9% 5/7/23 (Reg. S) | | 100,000 | | 64,250 |
TOTAL VENEZUELA | | 619,200 |
Vietnam - 0.3% |
Vietnamese Socialist Republic 6.75% 1/29/20 (d) | | 200,000 | | 224,000 |
Zambia - 0.2% |
Republic of Zambia 5.375% 9/20/22 (d) | | 200,000 | | 191,420 |
TOTAL GOVERNMENT OBLIGATIONS (Cost $14,511,051) |
14,950,952
|
Money Market Funds - 1.6% |
| Shares | | |
Fidelity Cash Central Fund, 0.11% (b)
(Cost $1,289,861) | 1,289,861 | |
1,289,861
|
TOTAL INVESTMENT PORTFOLIO - 100.1% (Cost $72,483,061) | | 79,660,229 |
NET OTHER ASSETS (LIABILITIES) - (0.1)% | | (116,546) |
NET ASSETS - 100% | $ 79,543,683 |
Futures Contracts |
| Expiration Date | | Underlying Face Amount at Value | | Unrealized
Appreciation/
(Depreciation) |
Purchased |
Equity Index Contracts |
2 NYSE E-mini MSCI EAFE Index Contracts (United States) | Dec. 2014 | | $ 101,360 | | $ 134 |
|
The face value of futures purchased as a percentage of net assets is 0.1% |
Security Type Abbreviations |
ELS | - | Equity-Linked Security |
Legend |
(a) Non-income producing |
(b) Affiliated fund that is generally available only to investment companies and other accounts managed by Fidelity Investments. The rate quoted is the annualized seven-day yield of the fund at period end. A complete unaudited listing of the fund's holdings as of its most recent quarter end is available upon request. In addition, each Fidelity Central Fund's financial statements, which are not covered by the Fund's Report of Independent Registered Public Accounting Firm, are available on the SEC's website or upon request. |
(c) Security initially issued at one coupon which converts to a higher coupon at a specified date. The rate shown is the rate at period end. |
(d) Security exempt from registration under Rule 144A of the Securities Act of 1933. These securities may be resold in transactions exempt from registration, normally to qualified institutional buyers. At the end of the period, the value of these securities amounted to $9,788,966 or 12.3% of net assets. |
(e) Security or a portion of the security was pledged to cover margin requirements for futures contracts. At period end, the value of securities pledged amounted to $10,000. |
(f) Coupon rates for floating and adjustable rate securities reflect the rates in effect at period end. |
Affiliated Central Funds |
Information regarding fiscal year to date income earned by the Fund from investments in Fidelity Central Funds is as follows: |
Fund | Income earned |
Fidelity Cash Central Fund | $ 1,867 |
Fidelity Securities Lending Cash Central Fund | 202 |
Total | $ 2,069 |
Other Information |
Categorizations in the Schedule of Investments are based on country or territory of incorporation. |
The following is a summary of the inputs used, as of October 31, 2014, involving the Fund's assets and liabilities carried at fair value. The inputs or methodology used for valuing securities may not be an indication of the risk associated with investing in those securities. For more information on valuation inputs, and their aggregation into the levels used in the table below, please refer to the Investment Valuation section in the accompanying Notes to Financial Statements. |
Valuation Inputs at Reporting Date: |
Description | Total | Level 1 | Level 2 | Level 3 |
Investments in Securities: | | | | |
Equities: | | | | |
Consumer Discretionary | $ 5,431,798 | $ 4,149,772 | $ 1,282,026 | $ - |
Consumer Staples | 5,138,380 | 2,448,487 | 2,689,893 | - |
Energy | 5,715,973 | 3,557,436 | 2,158,537 | - |
Financials | 16,526,711 | 8,453,373 | 8,073,338 | - |
Health Care | 1,354,663 | 787,806 | 566,857 | - |
Industrials | 4,734,133 | 3,102,632 | 1,631,501 | - |
Information Technology | 10,958,598 | 4,530,768 | 6,427,830 | - |
Materials | 4,613,011 | 2,712,952 | 1,900,059 | - |
Telecommunication Services | 4,072,331 | 2,423,168 | 1,649,163 | - |
Utilities | 1,556,084 | 547,992 | 1,008,092 | - |
Corporate Bonds | 3,317,734 | - | 3,317,734 | - |
Government Obligations | 14,950,952 | - | 14,950,952 | - |
Money Market Funds | 1,289,861 | 1,289,861 | - | - |
Total Investments in Securities: | $ 79,660,229 | $ 34,004,247 | $ 45,655,982 | $ - |
Derivative Instruments: | | | | |
Assets | | | | |
Futures Contracts | $ 134 | $ 134 | $ - | $ - |
The following is a summary of transfers between Level 1 and Level 2 for the period ended October 31, 2014. Transfers are assumed to have occurred at the beginning of the period, and are primarily attributable to the valuation techniques used for foreign equity securities, as discussed in the accompanying Notes to Financial Statements: |
Transfers | Total |
Level 1 to Level 2 | $ 14,745,499 |
Level 2 to Level 1 | $ 0 |
Value of Derivative Instruments |
The following table is a summary of the Fund's value of derivative instruments by primary risk exposure as of October 31, 2014. For additional information on derivative instruments, please refer to the Derivative Instruments section in the accompanying Notes to Financial Statements. |
Primary Risk Exposure /
Derivative Type | Value |
| Asset | Liability |
Equity Risk | | |
Futures Contracts (a) | $ 134 | $ - |
Total Value of Derivatives | $ 134 | $ - |
(a) Reflects gross cumulative appreciation (depreciation) on futures contracts as presented in the Schedule of Investments. Only the period end receivable or payable for daily variation margin and net unrealized appreciation (depreciation) are presented in the Statement of Assets and Liabilities. |
Other Information |
The composition of credit quality ratings as a percentage of net assets is as follows (Unaudited): |
AAA,AA,A | 1.0% |
BBB | 6.8% |
BB | 6.0% |
B | 4.8% |
CCC,CC,C | 3.4% |
Not Rated | 0.9% |
Equities | 75.5% |
Short-Term Investments and Net Other Assets | 1.6% |
| 100.0% |
We have used ratings from Moody's Investors Service, Inc. Where Moody's® ratings are not available, we have used S&P® ratings. All ratings are as of the date indicated and do not reflect subsequent changes. |
See accompanying notes which are an integral part of the financial statements.
Annual Report
Fidelity Total Emerging Markets Fund
Statement of Assets and Liabilities
| October 31, 2014 |
| | |
Assets | | |
Investment in securities, at value - See accompanying schedule: Unaffiliated issuers (cost $71,193,200) | $ 78,370,368 | |
Fidelity Central Funds (cost $1,289,861) | 1,289,861 | |
Total Investments (cost $72,483,061) | | $ 79,660,229 |
Cash | | 438,649 |
Foreign currency held at value (cost $102,812) | | 102,789 |
Receivable for investments sold | | 860,000 |
Receivable for fund shares sold | | 33,205 |
Dividends receivable | | 67,683 |
Interest receivable | | 309,501 |
Distributions receivable from Fidelity Central Funds | | 102 |
Receivable for daily variation margin for derivative instruments | | 134 |
Prepaid expenses | | 165 |
Receivable from investment adviser for expense reductions | | 56,666 |
Other receivables | | 23,555 |
Total assets | | 81,552,678 |
| | |
Liabilities | | |
Payable for investments purchased | $ 1,640,340 | |
Payable for fund shares redeemed | 4,963 | |
Accrued management fee | 52,153 | |
Distribution and service plan fees payable | 13,150 | |
Other affiliated payables | 21,763 | |
Other payables and accrued expenses | 276,626 | |
Total liabilities | | 2,008,995 |
| | |
Net Assets | | $ 79,543,683 |
Net Assets consist of: | | |
Paid in capital | | $ 71,679,847 |
Undistributed net investment income | | 1,150,725 |
Accumulated undistributed net realized gain (loss) on investments and foreign currency transactions | | (362,249) |
Net unrealized appreciation (depreciation) on investments and assets and liabilities in foreign currencies | | 7,075,360 |
Net Assets | | $ 79,543,683 |
See accompanying notes which are an integral part of the financial statements.
Annual Report
Fidelity Total Emerging Markets Fund
Financial Statements - continued
Statement of Assets and Liabilities - continued
| October 31, 2014 |
| | |
Calculation of Maximum Offering Price Class A:
Net Asset Value and redemption price per share ($13,627,168 ÷ 1,179,223 shares) | | $ 11.56 |
| | |
Maximum offering price per share (100/94.25 of $11.56) | | $ 12.27 |
Class T:
Net Asset Value and redemption price per share ($5,276,506 ÷ 457,380 shares) | | $ 11.54 |
| | |
Maximum offering price per share (100/96.50 of $11.54) | | $ 11.96 |
Class C:
Net Asset Value and offering price per share ($10,103,945 ÷ 881,138 shares)A | | $ 11.47 |
| | |
Total Emerging Markets:
Net Asset Value, offering price and redemption price per share ($45,763,108 ÷ 3,946,439 shares) | | $ 11.60 |
| | |
Institutional Class:
Net Asset Value, offering price and redemption price per share ($4,772,956 ÷ 411,824 shares) | | $ 11.59 |
A Redemption price per share is equal to net asset value less any applicable contingent deferred sales charge.
See accompanying notes which are an integral part of the financial statements.
Annual Report
Statement of Operations
| Year ended October 31, 2014 |
| | |
Investment Income | | |
Dividends | | $ 1,495,470 |
Interest | | 1,253,596 |
Income from Fidelity Central Funds | | 2,069 |
Income before foreign taxes withheld | | 2,751,135 |
Less foreign taxes withheld | | (173,322) |
Total income | | 2,577,813 |
| | |
Expenses | | |
Management fee | $ 633,325 | |
Transfer agent fees | 176,181 | |
Distribution and service plan fees | 153,365 | |
Accounting and security lending fees | 40,995 | |
Custodian fees and expenses | 355,802 | |
Independent trustees' compensation | 327 | |
Registration fees | 64,678 | |
Audit | 98,715 | |
Legal | 301 | |
Miscellaneous | 3,723 | |
Total expenses before reductions | 1,527,412 | |
Expense reductions | (265,974) | 1,261,438 |
Net investment income (loss) | | 1,316,375 |
Realized and Unrealized Gain (Loss) Net realized gain (loss) on: | | |
Investment securities: | | |
Unaffiliated issuers (net of foreign taxes of $11,196) | 3,174,799 | |
Foreign currency transactions | (75,868) | |
Futures contracts | 42,055 | |
Total net realized gain (loss) | | 3,140,986 |
Change in net unrealized appreciation (depreciation) on: Investment securities (net of increase in deferred foreign taxes of $89,295) | (2,661,136) | |
Assets and liabilities in foreign currencies | (4,394) | |
Futures contracts | 9,141 | |
Total change in net unrealized appreciation (depreciation) | | (2,656,389) |
Net gain (loss) | | 484,597 |
Net increase (decrease) in net assets resulting from operations | | $ 1,800,972 |
See accompanying notes which are an integral part of the financial statements.
Annual Report
Fidelity Total Emerging Markets Fund
Financial Statements - continued
Statement of Changes in Net Assets
| Year ended
October 31,
2014 | Year ended
October 31,
2013 |
Increase (Decrease) in Net Assets | | |
Operations | | |
Net investment income (loss) | $ 1,316,375 | $ 1,900,179 |
Net realized gain (loss) | 3,140,986 | (1,878,240) |
Change in net unrealized appreciation (depreciation) | (2,656,389) | 1,872,247 |
Net increase (decrease) in net assets resulting
from operations | 1,800,972 | 1,894,186 |
Distributions to shareholders from net investment income | (1,381,318) | (1,561,667) |
Distributions to shareholders from net realized gain | - | (137,352) |
Total distributions | (1,381,318) | (1,699,019) |
Share transactions - net increase (decrease) | (8,457,450) | (15,755,086) |
Redemption fees | 27,840 | 87,191 |
Total increase (decrease) in net assets | (8,009,956) | (15,472,728) |
| | |
Net Assets | | |
Beginning of period | 87,553,639 | 103,026,367 |
End of period (including undistributed net investment income of $1,150,725 and undistributed net investment income of $1,219,736, respectively) | $ 79,543,683 | $ 87,553,639 |
See accompanying notes which are an integral part of the financial statements.
Annual Report
Financial Highlights - Class A
Years ended October 31, | 2014 | 2013 | 2012 G |
Selected Per-Share Data | | | |
Net asset value, beginning of period | $ 11.37 | $ 10.86 | $ 10.00 |
Income from Investment Operations | | | |
Net investment income (loss) C | .18 | .18 | .20 |
Net realized and unrealized gain (loss) | .19 | .48 F | .68 |
Total from investment operations | .37 | .66 | .88 |
Distributions from net investment income | (.18) | (.15) | (.02) |
Distributions from net realized gain | - | (.01) | - |
Total distributions | (.18) | (.16) | (.02) |
Redemption fees added to paid in capital C | - I | .01 | - I |
Net asset value, end of period | $ 11.56 | $ 11.37 | $ 10.86 |
Total ReturnA, B | 3.30% | 6.23% | 8.80% |
Ratios to Average Net Assets D, H | | | |
Expenses before reductions | 1.98% | 1.89% | 1.87% |
Expenses net of fee waivers, if any | 1.65% | 1.65% | 1.65% |
Expenses net of all reductions | 1.65% | 1.62% | 1.62% |
Net investment income (loss) | 1.61% | 1.61% | 1.92% |
Supplemental Data | | | |
Net assets, end of period (000 omitted) | $ 13,627 | $ 18,837 | $ 7,675 |
Portfolio turnover rate E | 102% | 120% | 70% |
A Total returns would have been lower if certain expenses had not been reduced during the applicable periods shown.
B Total returns do not include the effect of the sales charges.
C Calculated based on average shares outstanding during the period.
D Fees and expenses of any underlying Fidelity Central Funds are not included in the Fund's expense ratio. The Fund indirectly bears its proportionate share of the expenses of any underlying Fidelity Central Funds.
E Amount does not include the portfolio activity of any underlying Fidelity Central Funds.
F The amount shown for a share outstanding does not correspond with the aggregate net gain (loss) on investments for the period due to the timing of sales and repurchases of shares in relation to fluctuating market values of the investments of the Fund.
G For the period November 1, 2011 (commencement of operations) to October 31, 2012.
H Expense ratios reflect operating expenses of the class. Expenses before reductions do not reflect amounts reimbursed by the investment adviser or reductions from brokerage service arrangements or reductions from other expense offset arrangements and do not represent the amount paid by the class during periods when reimbursements or reductions occur. Expense ratios before reductions for start-up periods may not be representative of longer-term operating periods. Expenses net of fee waivers reflect expenses after reimbursement by the investment adviser but prior to reductions from brokerage service arrangements or other expense offset arrangements. Expenses net of all reductions represent the net expenses paid by the class.
I Amount represents less than $.01 per share.
See accompanying notes which are an integral part of the financial statements.
Annual Report
Financial Highlights - Class T
Years ended October 31, | 2014 | 2013 | 2012 G |
Selected Per-Share Data | | | |
Net asset value, beginning of period | $ 11.34 | $ 10.84 | $ 10.00 |
Income from Investment Operations | | | |
Net investment income (loss) C | .15 | .15 | .17 |
Net realized and unrealized gain (loss) | .19 | .48 F | .68 |
Total from investment operations | .34 | .63 | .85 |
Distributions from net investment income | (.14) | (.12) | (.01) |
Distributions from net realized gain | - | (.01) | - |
Total distributions | (.14) | (.14) J | (.01) |
Redemption fees added to paid in capital C | - I | .01 | - I |
Net asset value, end of period | $ 11.54 | $ 11.34 | $ 10.84 |
Total ReturnA, B | 3.04% | 5.93% | 8.56% |
Ratios to Average Net Assets D, H | | | |
Expenses before reductions | 2.32% | 2.13% | 2.10% |
Expenses net of fee waivers, if any | 1.90% | 1.90% | 1.90% |
Expenses net of all reductions | 1.90% | 1.88% | 1.87% |
Net investment income (loss) | 1.36% | 1.36% | 1.67% |
Supplemental Data | | | |
Net assets, end of period (000 omitted) | $ 5,277 | $ 5,967 | $ 5,823 |
Portfolio turnover rateE | 102% | 120% | 70% |
A Total returns would have been lower if certain expenses had not been reduced during the applicable periods shown.
B Total returns do not include the effect of the sales charges.
C Calculated based on average shares outstanding during the period.
D Fees and expenses of any underlying Fidelity Central Funds are not included in the Fund's expense ratio. The Fund indirectly bears its proportionate share of the expenses of any underlying Fidelity Central Funds.
E Amount does not include the portfolio activity of any underlying Fidelity Central Funds.
F The amount shown for a share outstanding does not correspond with the aggregate net gain (loss) on investments for the period due to the timing of sales and repurchases of shares in relation to fluctuating market values of the investments of the Fund.
G For the period November 1, 2011 (commencement of operations) to October 31, 2012.
H Expense ratios reflect operating expenses of the class. Expenses before reductions do not reflect amounts reimbursed by the investment adviser or reductions from brokerage service arrangements or reductions from other expense offset arrangements and do not represent the amount paid by the class during periods when reimbursements or reductions occur. Expense ratios before reductions for start-up periods may not be representative of longer-term operating periods. Expenses net of fee waivers reflect expenses after reimbursement by the investment adviser but prior to reductions from brokerage service arrangements or other expense offset arrangements. Expenses net of all reductions represent the net expenses paid by the class.
I Amount represents less than $.01 per share.
J Total distributions of $.14 per share is comprised of distributions from net investment income of $.124 and distributions from net realized gain of $.014 per share.
See accompanying notes which are an integral part of the financial statements.
Annual Report
Financial Highlights - Class C
Years ended October 31, | 2014 | 2013 | 2012 G |
Selected Per-Share Data | | | |
Net asset value, beginning of period | $ 11.29 | $ 10.80 | $ 10.00 |
Income from Investment Operations | | | |
Net investment income (loss) C | .10 | .09 | .12 |
Net realized and unrealized gain (loss) | .19 | .47 F | .69 |
Total from investment operations | .29 | .56 | .81 |
Distributions from net investment income | (.11) | (.07) | (.01) |
Distributions from net realized gain | - | (.01) | - |
Total distributions | (.11) | (.08) | (.01) |
Redemption fees added to paid in capital C | - I | .01 | - I |
Net asset value, end of period | $ 11.47 | $ 11.29 | $ 10.80 |
Total ReturnA, B | 2.56% | 5.31% | 8.07% |
Ratios to Average Net Assets D, H | | | |
Expenses before reductions | 2.72% | 2.65% | 2.63% |
Expenses net of fee waivers, if any | 2.40% | 2.40% | 2.40% |
Expenses net of all reductions | 2.40% | 2.37% | 2.37% |
Net investment income (loss) | .86% | .86% | 1.17% |
Supplemental Data | | | |
Net assets, end of period (000 omitted) | $ 10,104 | $ 7,436 | $ 5,824 |
Portfolio turnover rateE | 102% | 120% | 70% |
A Total returns would have been lower if certain expenses had not been reduced during the applicable periods shown.
B Total returns do not include the effect of the contingent deferred sales charge.
C Calculated based on average shares outstanding during the period.
D Fees and expenses of any underlying Fidelity Central Funds are not included in the Fund's expense ratio. The Fund indirectly bears its proportionate share of the expenses of any underlying Fidelity Central Funds.
E Amount does not include the portfolio activity of any underlying Fidelity Central Funds.
F The amount shown for a share outstanding does not correspond with the aggregate net gain (loss) on investments for the period due to the timing of sales and repurchases of shares in relation to fluctuating market values of the investments of the Fund.
G For the period November 1, 2011 (commencement of operations) to October 31, 2012.
H Expense ratios reflect operating expenses of the class. Expenses before reductions do not reflect amounts reimbursed by the investment adviser or reductions from brokerage service arrangements or reductions from other expense offset arrangements and do not represent the amount paid by the class during periods when reimbursements or reductions occur. Expense ratios before reductions for start-up periods may not be representative of longer-term operating periods. Expenses net of fee waivers reflect expenses after reimbursement by the investment adviser but prior to reductions from brokerage service arrangements or other expense offset arrangements. Expenses net of all reductions represent the net expenses paid by the class.
I Amount represents less than $.01 per share.
See accompanying notes which are an integral part of the financial statements.
Annual Report
Financial Highlights - Total Emerging Markets
Years ended October 31, | 2014 | 2013 | 2012 F |
Selected Per-Share Data | | | |
Net asset value, beginning of period | $ 11.40 | $ 10.89 | $ 10.00 |
Income from Investment Operations | | | |
Net investment income (loss) B | .21 | .21 | .22 |
Net realized and unrealized gain (loss) | .19 | .47 E | .69 |
Total from investment operations | .40 | .68 | .91 |
Distributions from net investment income | (.20) | (.17) | (.02) |
Distributions from net realized gain | - | (.01) | - |
Total distributions | (.20) | (.18) | (.02) |
Redemption fees added to paid in capital B | - H | .01 | - H |
Net asset value, end of period | $ 11.60 | $ 11.40 | $ 10.89 |
Total ReturnA | 3.56% | 6.44% | 9.15% |
Ratios to Average Net Assets C, G | | | |
Expenses before reductions | 1.73% | 1.56% | 1.60% |
Expenses net of fee waivers, if any | 1.40% | 1.40% | 1.40% |
Expenses net of all reductions | 1.40% | 1.38% | 1.38% |
Net investment income (loss) | 1.86% | 1.85% | 2.16% |
Supplemental Data | | | |
Net assets, end of period (000 omitted) | $ 45,763 | $ 49,959 | $ 81,416 |
Portfolio turnover rateD | 102% | 120% | 70% |
A Total returns would have been lower if certain expenses had not been reduced during the applicable periods shown.
B Calculated based on average shares outstanding during the period.
C Fees and expenses of any underlying Fidelity Central Funds are not included in the Fund's expense ratio. The Fund indirectly bears its proportionate share of the expenses of any underlying Fidelity Central Funds.
D Amount does not include the portfolio activity of any underlying Fidelity Central Funds.
E The amount shown for a share outstanding does not correspond with the aggregate net gain (loss) on investments for the period due to the timing of sales and repurchases of shares in relation to fluctuating market values of the investments of the Fund.
F For the period November 1, 2011 (commencement of operations) to October 31, 2012.
G Expense ratios reflect operating expenses of the class. Expenses before reductions do not reflect amounts reimbursed by the investment adviser or reductions from brokerage service arrangements or reductions from other expense offset arrangements and do not represent the amount paid by the class during periods when reimbursements or reductions occur. Expense ratios before reductions for start-up periods may not be representative of longer-term operating periods. Expenses net of fee waivers reflect expenses after reimbursement by the investment adviser but prior to reductions from brokerage service arrangements or other expense offset arrangements. Expenses net of all reductions represent the net expenses paid by the class.
H Amount represents less than $.01 per share.
See accompanying notes which are an integral part of the financial statements.
Annual Report
Financial Highlights - Institutional Class
Years ended October 31, | 2014 | 2013 | 2012 F |
Selected Per-Share Data | | | |
Net asset value, beginning of period | $ 11.40 | $ 10.89 | $ 10.00 |
Income from Investment Operations | | | |
Net investment income (loss) B | .21 | .20 | .22 |
Net realized and unrealized gain (loss) | .18 | .48 E | .69 |
Total from investment operations | .39 | .68 | .91 |
Distributions from net investment income | (.20) | (.17) | (.02) |
Distributions from net realized gain | - | (.01) | - |
Total distributions | (.20) | (.18) | (.02) |
Redemption fees added to paid in capital B | - H | .01 | - H |
Net asset value, end of period | $ 11.59 | $ 11.40 | $ 10.89 |
Total ReturnA | 3.51% | 6.44% | 9.15% |
Ratios to Average Net Assets C, G | | | |
Expenses before reductions | 1.71% | 1.63% | 1.62% |
Expenses net of fee waivers, if any | 1.40% | 1.40% | 1.40% |
Expenses net of all reductions | 1.40% | 1.37% | 1.37% |
Net investment income (loss) | 1.86% | 1.86% | 2.17% |
Supplemental Data | | | |
Net assets, end of period (000 omitted) | $ 4,773 | $ 5,354 | $ 2,287 |
Portfolio turnover rateD | 102% | 120% | 70% |
A Total returns would have been lower if certain expenses had not been reduced during the applicable periods shown.
B Calculated based on average shares outstanding during the period.
C Fees and expenses of any underlying Fidelity Central Funds are not included in the Fund's expense ratio. The Fund indirectly bears its proportionate share of the expenses of any underlying Fidelity Central Funds.
D Amount does not include the portfolio activity of any underlying Fidelity Central Funds.
E The amount shown for a share outstanding does not correspond with the aggregate net gain (loss) on investments for the period due to the timing of sales and repurchases of shares in relation to fluctuating market values of the investments of the Fund.
F For the period November 1, 2011 (commencement of operations) to October 31, 2012.
G Expense ratios reflect operating expenses of the class. Expenses before reductions do not reflect amounts reimbursed by the investment adviser or reductions from brokerage service arrangements or reductions from other expense offset arrangements and do not represent the amount paid by the class during periods when reimbursements or reductions occur. Expense ratios before reductions for start-up periods may not be representative of longer-term operating periods. Expenses net of fee waivers reflect expenses after reimbursement by the investment adviser but prior to reductions from brokerage service arrangements or other expense offset arrangements. Expenses net of all reductions represent the net expenses paid by the class.
H Amount represents less than $.01 per share.
See accompanying notes which are an integral part of the financial statements.
Annual Report
Notes to Financial Statements
For the period ended October 31, 2014
1. Organization.
Fidelity Total Emerging Markets Fund (the Fund) is a fund of Fidelity Investment Trust (the Trust) and is authorized to issue an unlimited number of shares. The Trust is registered under the Investment Company Act of 1940, as amended (the 1940 Act), as an open-end management investment company organized as a Massachusetts business trust. The Fund offers Class A, Class T, Class C, Total Emerging Markets and Institutional Class shares, each of which has equal rights as to assets and voting privileges. Each class has exclusive voting rights with respect to matters that affect that class. The Fund's investments in emerging markets can be subject to social, economic, regulatory, and political uncertainties and can be extremely volatile.
2. Investments in Fidelity Central Funds.
The Fund invests in Fidelity Central Funds, which are open-end investment companies generally available only to other investment companies and accounts managed by the investment adviser and its affiliates. The Fund's Schedule of Investments lists each of the Fidelity Central Funds held as of period end, if any, as an investment of the Fund, but does not include the underlying holdings of each Fidelity Central Fund. As an Investing Fund, the Fund indirectly bears its proportionate share of the expenses of the underlying Fidelity Central Funds.
The Money Market Central Funds seek preservation of capital and current income and are managed by Fidelity Investments Money Management, Inc. (FIMM), an affiliate of the investment adviser. Annualized expenses of the Money Market Central Funds as of their most recent shareholder report date are less than .01%.
A complete unaudited list of holdings for each Fidelity Central Fund is available upon request or at the Securities and Exchange Commission (the SEC) website at www.sec.gov. In addition, the financial statements of the Fidelity Central Funds, which are not covered by the Fund's Report of Independent Registered Public Accounting Firm, are available on the SEC website or upon request.
3. Significant Accounting Policies.
The financial statements have been prepared in conformity with accounting principles generally accepted in the United States of America (GAAP), which require management to make certain estimates and assumptions at the date of the financial statements. Actual results could differ from those estimates. Subsequent events, if any, through the date that the financial statements were issued have been evaluated in the preparation of the financial statements. The following summarizes the significant accounting policies of the Fund:
Investment Valuation. Investments are valued as of 4:00 p.m. Eastern time on the last calendar day of the period. In accordance with valuation policies and procedures
Annual Report
Notes to Financial Statements - continued
3. Significant Accounting Policies - continued
Investment Valuation - continued
approved by the Board of Trustees (the Board), the Fund attempts to obtain prices from one or more third party pricing vendors or brokers to value its investments. When current market prices, quotations or currency exchange rates are not readily available or reliable, investments will be fair valued in good faith by the Fidelity Management & Research Company (FMR) Fair Value Committee (the Committee), in accordance with procedures adopted by the Board. Factors used in determining fair value vary by investment type and may include market or investment specific events, changes in interest rates and credit quality. The frequency with which these procedures are used cannot be predicted and they may be utilized to a significant extent. The Committee oversees the Fund's valuation policies and procedures and is responsible for approving and reporting to the Board all fair value determinations.
The Fund categorizes the inputs to valuation techniques used to value its investments into a disclosure hierarchy consisting of three levels as shown below:
Level 1 - quoted prices in active markets for identical investments
Level 2 - other significant observable inputs (including quoted prices for similar investments, interest rates, prepayment speeds, etc.)
Level 3 - unobservable inputs (including the Fund's own assumptions based on the best information available)
Valuation techniques used to value the Fund's investments by major category are as follows:
Equity securities, including restricted securities, for which market quotations are readily available, are valued at the last reported sale price or official closing price as reported by a third party pricing vendor on the primary market or exchange on which they are traded and are categorized as Level 1 in the hierarchy. In the event there were no sales during the day or closing prices are not available, securities are valued at the last quoted bid price or may be valued using the last available price and are generally categorized as Level 2 in the hierarchy. For foreign equity securities, when market or security specific events arise, comparisons to the valuation of American Depositary Receipts (ADRs), futures contracts, Exchange-Traded Funds (ETFs) and certain indexes as well as quoted prices for similar securities may be used and would be categorized as Level 2 in the hierarchy. Utilizing these techniques may result in transfers between Level 1 and Level 2. For equity securities, including restricted securities, where observable inputs are limited, assumptions about market activity and risk are used and these securities may be categorized as Level 3 in the hierarchy.
Annual Report
3. Significant Accounting Policies - continued
Investment Valuation - continued
Debt securities, including restricted securities, are valued based on evaluated prices received from third party pricing vendors or from brokers who make markets in such securities. Corporate bonds, foreign government and government agency obligations and U.S. government and government agency obligations are valued by pricing vendors who utilize matrix pricing which considers yield or price of bonds of comparable quality, coupon, maturity and type or by broker-supplied prices. When independent prices are unavailable or unreliable, debt securities may be valued utilizing pricing methodologies which consider similar factors that would be used by third party pricing vendors. Debt securities are generally categorized as Level 2 in the hierarchy but may be Level 3 depending on the circumstances.
Futures contracts are valued at the settlement price established each day by the board of trade or exchange on which they are traded and are categorized as Level 1 in the hierarchy. Investments in open-end mutual funds, including the Fidelity Central Funds, are valued at their closing net asset value (NAV) each business day and are categorized as Level 1 in the hierarchy.
Changes in valuation techniques may result in transfers in or out of an assigned level within the disclosure hierarchy. The aggregate value of investments by input level, as of October 31, 2014, including information on transfers between Levels 1 and 2, is included at the end of the Fund's Schedule of Investments.
Foreign Currency. The Fund may use foreign currency contracts to facilitate transactions in foreign-denominated securities. Gains and losses from these transactions may arise from changes in the value of the foreign currency or if the counterparties do not perform under the contracts' terms.
Foreign-denominated assets, including investment securities, and liabilities are translated into U.S. dollars at the exchange rates at period end. Purchases and sales of investment securities, income and dividends received and expenses denominated in foreign currencies are translated into U.S. dollars at the exchange rate in effect on the transaction date.
The effects of exchange rate fluctuations on investments are included with the net realized and unrealized gain (loss) on investment securities. Other foreign currency transactions resulting in realized and unrealized gain (loss) are disclosed separately.
Investment Transactions and Income. For financial reporting purposes, the Fund's investment holdings and NAV include trades executed through the end of the last business day of the period. The NAV per share for processing shareholder transactions is calculated as of the close of business of the New York Stock Exchange (NYSE), normally
Annual Report
Notes to Financial Statements - continued
3. Significant Accounting Policies - continued
Investment Transactions and Income - continued
4:00 p.m. Eastern time and includes trades executed through the end of the prior business day. Gains and losses on securities sold are determined on the basis of identified cost. Dividend income is recorded on the ex-dividend date, except for certain dividends from foreign securities where the ex-dividend date may have passed, which are recorded as soon as the Fund is informed of the ex-dividend date. Non-cash dividends included in dividend income, if any, are recorded at the fair market value of the securities received. Income and capital gain distributions from Fidelity Central Funds, if any, are recorded on the ex-dividend date. Distributions received on securities that represent a return of capital or capital gain are recorded as a reduction of cost of investments and/or as a realized gain. Subsequent to ex-dividend date the Fund determines the components of these distributions, based upon receipt of tax filings or other correspondence relating to the underlying investment. Interest income is accrued as earned and includes coupon interest and amortization of premium and accretion of discount on debt securities as applicable. Investment income is recorded net of foreign taxes withheld where recovery of such taxes is uncertain.
Class Allocations and Expenses. Investment income, realized and unrealized capital gains and losses, common expenses of the Fund, and certain fund-level expense reductions, if any, are allocated daily on a pro-rata basis to each class based on the relative net assets of each class to the total net assets of the Fund. Each class differs with respect to transfer agent and distribution and service plan fees incurred. Certain expense reductions may also differ by class. For the reporting period, the allocated portion of income and expenses to each class as a percent of its average net assets may vary due to the timing of recording these transactions in relation to fluctuating net assets of the classes. Expenses directly attributable to a fund are charged to that fund. Expenses attributable to more than one fund are allocated among the respective funds on the basis of relative net assets or other appropriate methods. Expense estimates are accrued in the period to which they relate and adjustments are made when actual amounts are known.
Income Tax Information and Distributions to Shareholders. Each year, the Fund intends to qualify as a regulated investment company under Subchapter M of the Internal Revenue Code, including distributing substantially all of its taxable income and realized gains. As a result, no provision for U.S. Federal income taxes is required. As of October 31, 2014, the Fund did not have any unrecognized tax benefits in the financial statements; nor is the Fund aware of any tax positions for which it is reasonably possible that the total amounts of unrecognized tax benefits will significantly change in the next twelve months. The Fund files a U.S. federal tax return, in addition to state and local tax returns as required. The Fund's federal income tax returns are subject to examination by the Internal Revenue Service (IRS) for a period of three fiscal years after they are filed. State and local tax returns may be subject to examination for an additional fiscal year
Annual Report
3. Significant Accounting Policies - continued
Income Tax Information and Distributions to Shareholders - continued
depending on the jurisdiction. Foreign taxes are provided for based on the Fund's understanding of the tax rules and rates that exist in the foreign markets in which it invests. The Fund is subject to a tax imposed on capital gains by certain countries in which it invests. An estimated deferred tax liability for net unrealized appreciation on the applicable securities is included in Other payables and accrued expenses on the Statement of Assets & Liabilities.
Distributions are declared and recorded on the ex-dividend date. Income dividends and capital gain distributions are declared separately for each class. Income and capital gain distributions are determined in accordance with income tax regulations, which may differ from GAAP. In addition, the Fund claimed a portion of the payment made to redeeming shareholders as a distribution for income tax purposes.
Capital accounts within the financial statements are adjusted for permanent book-tax differences. These adjustments have no impact on net assets or the results of operations. Capital accounts are not adjusted for temporary book-tax differences which will reverse in a subsequent period.
Book-tax differences are primarily due to futures contracts, foreign currency transactions, certain foreign taxes, passive foreign investment companies (PFIC), market discount, capital loss carryforwards and losses deferred due to wash sales.
The federal tax cost of investment securities and unrealized appreciation (depreciation) as of period end were as follows:
Gross unrealized appreciation | $ 10,884,326 |
Gross unrealized depreciation | (4,096,936) |
Net unrealized appreciation (depreciation) on securities | $ 6,787,390 |
| |
Tax Cost | $ 72,872,839 |
The tax-based components of distributable earnings as of period end were as follows:
Undistributed ordinary income | $ 1,043,841 |
Undistributed long-term capital gain | $ 134,651 |
Net unrealized appreciation (depreciation) on securities and other investments | $ 6,784,523 |
The tax character of distributions paid was as follows:
| October 31, 2014 | October 31, 2013 |
Ordinary Income | $ 1,381,318 | $ 1,699,019 |
Annual Report
Notes to Financial Statements - continued
3. Significant Accounting Policies - continued
Short-Term Trading (Redemption) Fees. Shares held by investors in the Fund less than 90 days may have been subject to a redemption fee equal to 1.50% of the NAV of shares redeemed. All redemption fees, which reduce the proceeds of the shareholder redemption, are retained by the Fund and accounted for as an addition to paid in capital.
Restricted Securities. The Fund may invest in securities that are subject to legal or contractual restrictions on resale. These securities generally may be resold in transactions exempt from registration or to the public if the securities are registered. Disposal of these securities may involve time-consuming negotiations and expense, and prompt sale at an acceptable price may be difficult. Information regarding restricted securities is included at the end of the Fund's Schedule of Investments.
New Accounting Pronouncement. In June 2014, the Financial Accounting Standards Board issued Accounting Standard Update No. 2014-11, Repurchase-to-Maturity Transactions, Repurchase Financings, and Disclosures. The Update amends the accounting for certain repurchase agreements and expands disclosure requirements for reverse repurchase agreements, securities lending and other similar transactions. The disclosure requirements are effective for annual and interim reporting periods beginning after December 15, 2014. Management is currently evaluating the impact of the Update on the Fund's financial statements and related disclosures.
4. Derivative Instruments.
Risk Exposures and the Use of Derivative Instruments. The Fund's investment objective allows the Fund to enter into various types of derivative contracts, including futures contracts. Derivatives are investments whose value is primarily derived from underlying assets, indices or reference rates and may be transacted on an exchange or over-the-counter (OTC). Derivatives may involve a future commitment to buy or sell a specified asset based on specified terms, to exchange future cash flows at periodic intervals based on a notional principal amount, or for one party to make one or more payments upon the occurrence of specified events in exchange for periodic payments from the other party.
The Fund used derivatives to increase returns and to manage exposure to certain risks as defined below. The success of any strategy involving derivatives depends on analysis of numerous economic factors, and if the strategies for investment do not work as intended, the Fund may not achieve its objectives.
The Fund's use of derivatives increased or decreased its exposure to the following risk:
Equity Risk | Equity risk relates to the fluctuations in the value of financial instruments as a result of changes in market prices (other than those arising from interest rate risk or foreign exchange risk), whether caused by factors specific to an individual investment, its issuer, or all factors affecting all instruments traded in a market or market segment. |
Annual Report
4. Derivative Instruments - continued
Risk Exposures and the Use of Derivative Instruments - continued
The Fund is also exposed to additional risks from investing in derivatives, such as liquidity risk and counterparty credit risk. Liquidity risk is the risk that the Fund will be unable to close out the derivative in the open market in a timely manner. Counterparty credit risk is the risk that the counterparty will not be able to fulfill its obligation to the Fund. Counterparty credit risk related to exchange-traded futures contracts may be mitigated by the protection provided by the exchange on which they trade.
Investing in derivatives may involve greater risks than investing in the underlying assets directly and, to varying degrees, may involve risk of loss in excess of any initial investment and collateral received and amounts recognized in the Statement of Assets and Liabilities. In addition, there may be the risk that the change in value of the derivative contract does not correspond to the change in value of the underlying instrument.
Futures Contracts. A futures contract is an agreement between two parties to buy or sell a specified underlying instrument for a fixed price at a specified future date. The Fund used futures contracts to manage its exposure to the stock market.
Upon entering into a futures contract, a fund is required to deposit either cash or securities (initial margin) with a clearing broker in an amount equal to a certain percentage of the face value of the contract. Futures contracts are marked-to-market daily and subsequent daily payments (variation margin) are made or received by a fund depending on the daily fluctuations in the value of the futures contracts and are recorded as unrealized appreciation or (depreciation). This receivable and/or payable, if any, is included in daily variation margin for derivative instruments in the Statement of Assets and Liabilities. Realized gain or (loss) is recorded upon the expiration or closing of a futures contract.
Any open futures contracts at period end are presented in the Schedule of Investments under the caption "Futures Contracts." The underlying face amount at value reflects each contract's exposure to the underlying instrument or index at period end and is representative of volume of activity during the period. Securities deposited to meet initial margin requirements are identified in the Schedule of Investments.
During the period the Fund recognized net realized gain (loss) of $42,055 and a change in net unrealized appreciation (depreciation) of $9,141 related to its investment in futures contracts. These amounts are included in the Statement of Operations.
5. Purchases and Sales of Investments.
Purchases and sales of securities, other than short-term securities, aggregated $78,871,035 and $87,196,124, respectively.
Annual Report
Notes to Financial Statements - continued
6. Fees and Other Transactions with Affiliates.
Management Fee. Fidelity Management & Research Company (the investment adviser) and its affiliates provide the Fund with investment management related services for which the Fund pays a monthly management fee. The management fee is the sum of an individual fund fee rate that is based on an annual rate of .55% of the Fund's average net assets and an annualized group fee rate that averaged .25% during the period. The group fee rate is based upon the average net assets of all the mutual funds advised by the investment adviser, including any mutual funds previously advised by the investment adviser that are currently advised by Fidelity SelectCo, LLC, an affiliate of the investment adviser. The group fee rate decreases as assets under management increase and increases as assets under management decrease. For the reporting period, the total annual management fee rate was .80% of the Fund's average net assets.
Distribution and Service Plan Fees. In accordance with Rule 12b-1 of the 1940 Act, the Fund has adopted separate Distribution and Service Plans for each class of shares. Certain classes pay Fidelity Distributors Corporation (FDC), an affiliate of the investment adviser, separate Distribution and Service Fees, each of which is based on an annual percentage of each class' average net assets. In addition, FDC may pay financial intermediaries for selling shares of the Fund and providing shareholder support services. For the period, the Distribution and Service Fee rates, total fees and amounts retained by FDC were as follows:
| Distribution
Fee | Service
Fee | Total Fees | Retained
by FDC |
Class A | -% | .25% | $ 37,836 | $ 14,585 |
Class T | .25% | .25% | 27,474 | 10,294 |
Class C | .75% | .25% | 88,055 | 66,764 |
| | | $ 153,365 | $ 91,643 |
Sales Load. FDC may receive a front-end sales charge of up to 5.75% for selling Class A shares and 3.50% for selling Class T shares, some of which is paid to financial intermediaries for selling shares of the Fund. Depending on the holding period, FDC may receive contingent deferred sales charges levied on Class A, Class T, and Class C redemptions. The deferred sales charges range from 1.00% for Class C shares, 1.00% for certain purchases of Class A shares and .25% for certain purchases of Class T shares.
For the period, sales charge amounts retained by FDC were as follows:
| Retained
by FDC |
Class A | $ 5,093 |
Class T | 1,444 |
Class C* | 1,370 |
| $ 7,907 |
* When Class C shares are initially sold, FDC pays commissions from its own resources to financial intermediaries through which the sales are made.
Annual Report
6. Fees and Other Transactions with Affiliates - continued
Transfer Agent Fees. Fidelity Investments Institutional Operations Company, Inc., (FIIOC), an affiliate of the investment adviser, is the transfer, dividend disbursing and shareholder servicing agent for each class of the Fund. FIIOC receives account fees and asset-based fees that vary according to the account size and type of account of the shareholders of the respective classes of the Fund. FIIOC pays for typesetting, printing and mailing of shareholder reports, except proxy statements.
For the period, transfer agent fees for each class were as follows:
| Amount | % of
Class-Level Average
Net Assets |
Class A | $ 32,080 | .21 |
Class T | 16,754 | .31 |
Class C | 19,208 | .22 |
Total Emerging Markets | 99,220 | .22 |
Institutional Class | 8,919 | .19 |
| $ 176,181 | |
Accounting and Security Lending Fees. Fidelity Service Company, Inc. (FSC), an affiliate of the investment adviser, maintains the Fund's accounting records. The accounting fee is based on the level of average net assets for each month. Under a separate contract, FSC administers the security lending program. The security lending fee is based on the number and duration of lending transactions.
Brokerage Commissions. The Fund placed a portion of its portfolio transactions with brokerage firms which are affiliates of the investment adviser. Brokerage commissions are included in net realized gain (loss) and change in net unrealized appreciation (depreciation) in the Statement of Operations. The commissions paid to these affiliated firms were $699 for the period.
7. Committed Line of Credit.
The Fund participates with other funds managed by the investment adviser or an affiliate in a $4.25 billion credit facility (the "line of credit") to be utilized for temporary or emergency purposes to fund shareholder redemptions or for other short-term liquidity purposes. The Fund has agreed to pay commitment fees on its pro-rata portion of the line of credit, which amounted to $130 and is reflected in Miscellaneous expenses on the Statement of Operations. During the period, the Fund did not borrow on this line of credit.
Annual Report
Notes to Financial Statements - continued
8. Security Lending.
The Fund lends portfolio securities through a lending agent from time to time in order to earn additional income. For equity securities, a lending agent is used and may loan securities to certain qualified borrowers, including Fidelity Capital Markets (FCM), a broker-dealer affiliated with the Fund. On the settlement date of the loan, the Fund receives collateral (in the form of U.S. Treasury obligations, letters of credit and/or cash) against the loaned securities and maintains collateral in an amount not less than 100% of the market value of the loaned securities during the period of the loan. The market value of the loaned securities is determined at the close of business of the Fund and any additional required collateral is delivered to the Fund on the next business day. If the borrower defaults on its obligation to return the securities loaned because of insolvency or other reasons, the Fund may apply collateral received from the borrower against the obligation. The Fund may experience delays and costs in recovering the securities loaned. Any cash collateral received is invested in the Fidelity Securities Lending Cash Central Fund. At period end, there were no security loans outstanding. Security lending income represents the income earned on investing cash collateral, less rebates paid to borrowers and any lending agent fees associated with the loan, plus any premium payments received for lending certain types of securities. Security lending income is presented in the Statement of Operations as a component of income from Fidelity Central Funds. Total security lending income during the period amounted to $202. During the period, there were no securities loaned to FCM.
9. Expense Reductions.
The investment adviser contractually agreed to reimburse each class to the extent annual operating expenses exceeded certain levels of average net assets as noted in the table below. This reimbursement will remain in place through December 31, 2015. Some expenses, for example interest expense, including commitment fees, are excluded from this reimbursement.
The following classes were in reimbursement during the period:
| Expense
Limitations | Reimbursement |
Class A | 1.65% | $ 49,666 |
Class T | 1.90% | 22,953 |
Class C | 2.40% | 28,693 |
Total Emerging Markets | 1.40% | 149,847 |
Institutional Class | 1.40% | 14,635 |
| | $ 265,794 |
In addition, the investment adviser reimbursed a portion of the Fund's operating expenses during the period in the amount of $180.
Annual Report
10. Distributions to Shareholders.
Distributions to shareholders of each class were as follows:
Years ended October 31, | 2014 | 2013 |
From net investment income | | |
Class A | $ 298,475 | $ 104,565 |
Class T | 72,882 | 69,282 |
Class C | 71,691 | 35,970 |
Total Emerging Markets | 837,446 | 1,316,259 |
Institutional Class | 100,824 | 35,591 |
Total | $ 1,381,318 | $ 1,561,667 |
From net realized gain | | |
Class A | $ - | $ 10,027 |
Class T | - | 7,822 |
Class C | - | 7,516 |
Total Emerging Markets | - | 109,039 |
Institutional Class | - | 2,948 |
Total | $ - | $ 137,352 |
11. Share Transactions.
Share transactions for each class were as follows and may contain automatic conversions between classes or exchanges between funds:
| Shares | Shares | Dollars | Dollars |
Years ended October 31, | 2014 | 2013 | 2014 | 2013 |
Class A | | | | |
Shares sold | 374,099 | 1,550,621 | $ 4,265,512 | $ 17,267,543 |
Reinvestment of distributions | 24,147 | 9,656 | 267,553 | 105,541 |
Shares redeemed | (876,261) | (609,546) | (9,758,391) | (6,666,165) |
Net increase (decrease) | (478,015) | 950,731 | $ (5,225,326) | $ 10,706,919 |
Class T | | | | |
Shares sold | 73,071 | 277,882 | $ 838,229 | $ 3,114,089 |
Reinvestment of distributions | 6,487 | 7,041 | 71,875 | 76,883 |
Shares redeemed | (148,531) | (295,695) | (1,659,489) | (3,268,261) |
Net increase (decrease) | (68,973) | (10,772) | $ (749,385) | $ (77,289) |
Class C | | | | |
Shares sold | 312,027 | 431,831 | $ 3,545,260 | $ 4,824,945 |
Reinvestment of distributions | 6,236 | 3,973 | 69,031 | 43,420 |
Shares redeemed | (95,617) | (316,804) | (1,079,948) | (3,521,280) |
Net increase (decrease) | 222,646 | 119,000 | $ 2,534,343 | $ 1,347,085 |
Annual Report
Notes to Financial Statements - continued
11. Share Transactions - continued
| Shares | Shares | Dollars | Dollars |
Years ended October 31, | 2014 | 2013 | 2014 | 2013 |
Total Emerging Markets | | | | |
Shares sold | 1,227,986 | 5,085,608 | $ 14,240,572 | $ 57,439,168 |
Reinvestment of distributions | 69,851 | 113,766 | 774,644 | 1,243,462 |
Shares redeemed | (1,734,596) | (8,294,710) | (19,517,156) | (89,232,029) |
Net increase (decrease) | (436,759) | (3,095,336) | $ (4,501,940) | $ (30,549,399) |
Institutional Class | | | | |
Shares sold | 216,506 | 491,268 | $ 2,508,322 | $ 5,357,985 |
Reinvestment of distributions | 8,910 | 3,526 | 98,814 | 38,539 |
Shares redeemed | (283,392) | (235,091) | (3,122,278) | (2,578,926) |
Net increase (decrease) | (57,976) | 259,703 | $ (515,142) | $ 2,817,598 |
12. Other.
The Fund's organizational documents provide former and current trustees and officers with a limited indemnification against liabilities arising in connection with the performance of their duties to the Fund. In the normal course of business, the Fund may also enter into contracts that provide general indemnifications. The Fund's maximum exposure under these arrangements is unknown as this would be dependent on future claims that may be made against the Fund. The risk of material loss from such claims is considered remote.
At the end of the period, the investment adviser or its affiliates were the owners of record of 29% of the total outstanding shares of the Fund.
Annual Report
To the Trustees of Fidelity Investment Trust and the Shareholders of Fidelity Total Emerging Markets Fund:
In our opinion, the accompanying statement of assets and liabilities, including the schedule of investments, and the related statements of operations and of changes in net assets and the financial highlights present fairly, in all material respects, the financial position of Fidelity Total Emerging Markets Fund (a fund of Fidelity Investment Trust) at October 31, 2014, the results of its operations for the year then ended, the changes in its net assets for each of the two years in the period then ended period indicated and the financial highlights for each of the five years in the period then ended, in conformity with accounting principles generally accepted in the United States of America. These financial statements and financial highlights (hereafter referred to as "financial statements") are the responsibility of the Fidelity Total Emerging Markets Fund's management. Our responsibility is to express an opinion on these financial statements based on our audits. We conducted our audits of these financial statements in accordance with the standards of the Public Company Accounting Oversight Board (United States). Those standards require that we plan and perform the audit to obtain reasonable assurance about whether the financial statements are free of material misstatement. An audit includes examining, on a test basis, evidence supporting the amounts and disclosures in the financial statements, assessing the accounting principles used and significant estimates made by management, and evaluating the overall financial statement presentation. We believe that our audits, which included confirmation of securities at October 31, 2014 by correspondence with the custodian and brokers, provide a reasonable basis for our opinion.
PricewaterhouseCoopers LLP
Boston, Massachusetts
December 19, 2014
Annual Report
The Trustees, Member of the Advisory Board, and officers of the trust and fund, as applicable, are listed below. The Board of Trustees governs the fund and is responsible for protecting the interests of shareholders. The Trustees are experienced executives who meet periodically throughout the year to oversee the fund's activities, review contractual arrangements with companies that provide services to the fund, oversee management of the risks associated with such activities and contractual arrangements, and review the fund's performance. Except for James C. Curvey, each of the Trustees oversees 174 funds. Mr. Curvey oversees 407 funds.
The Trustees hold office without limit in time except that (a) any Trustee may resign; (b) any Trustee may be removed by written instrument, signed by at least two-thirds of the number of Trustees prior to such removal; (c) any Trustee who requests to be retired or who has become incapacitated by illness or injury may be retired by written instrument signed by a majority of the other Trustees; and (d) any Trustee may be removed at any special meeting of shareholders by a two-thirds vote of the outstanding voting securities of the trust. Each Trustee who is not an interested person (as defined in the 1940 Act) of the trust and the fund (Independent Trustee), shall retire not later than the last day of the calendar year in which his or her 75th birthday occurs. The Independent Trustees may waive this mandatory retirement age policy with respect to individual Trustees. The officers and Advisory Board Member hold office without limit in time, except that any officer and Advisory Board Member may resign or may be removed by a vote of a majority of the Trustees at any regular meeting or any special meeting of the Trustees. Except as indicated, each individual has held the office shown or other offices in the same company for the past five years.
Experience, Skills, Attributes, and Qualifications of the Fund's Trustees. The Governance and Nominating Committee has adopted a statement of policy that describes the experience, qualifications, attributes, and skills that are necessary and desirable for potential Independent Trustee candidates (Statement of Policy). The Board believes that each Trustee satisfied at the time he or she was initially elected or appointed a Trustee, and continues to satisfy, the standards contemplated by the Statement of Policy. The Governance and Nominating Committee also engages professional search firms to help identify potential Independent Trustee candidates who have the experience, qualifications, attributes, and skills consistent with the Statement of Policy. From time to time, additional criteria based on the composition and skills of the current Independent Trustees, as well as experience or skills that may be appropriate in light of future changes to board composition, business conditions, and regulatory or other developments, have also been considered by the professional search firms and the Governance and Nominating Committee. In addition, the Board takes into account the Trustees' commitment and participation in Board and committee meetings, as well as their leadership of standing and ad hoc committees throughout their tenure.
In determining that a particular Trustee was and continues to be qualified to serve as a Trustee, the Board has considered a variety of criteria, none of which, in isolation, was controlling. The Board believes that, collectively, the Trustees have balanced and diverse experience, qualifications, attributes, and skills, which allow the Board to operate effectively in governing the fund and protecting the interests of shareholders. Information about the specific experience, skills, attributes, and qualifications of each Trustee, which in each case led to the Board's conclusion that the Trustee should serve (or continue to serve) as a trustee of the fund, is provided below.
Annual Report
Trustees and Officers - continued
Board Structure and Oversight Function. James C. Curvey is an interested person (as defined in the 1940 Act) and currently serves as Chairman. The Trustees have determined that an interested Chairman is appropriate and benefits shareholders because an interested Chairman has a personal and professional stake in the quality and continuity of services provided to the fund. Independent Trustees exercise their informed business judgment to appoint an individual of their choosing to serve as Chairman, regardless of whether the Trustee happens to be independent or a member of management. The Independent Trustees have determined that they can act independently and effectively without having an Independent Trustee serve as Chairman and that a key structural component for assuring that they are in a position to do so is for the Independent Trustees to constitute a substantial majority for the Board. The Independent Trustees also regularly meet in executive session. Ned C. Lautenbach serves as Chairman of the Independent Trustees and as such (i) acts as a liaison between the Independent Trustees and management with respect to matters important to the Independent Trustees and (ii) with management prepares agendas for Board meetings.
Fidelity funds are overseen by different Boards of Trustees. The fund's Board oversees Fidelity's equity and high income funds and another Board oversees Fidelity's investment-grade bond, money market, and asset allocation funds. The asset allocation funds may invest in Fidelity funds overseen by the fund's Board. The use of separate Boards, each with its own committee structure, allows the Trustees of each group of Fidelity funds to focus on the unique issues of the funds they oversee, including common research, investment, and operational issues. On occasion, the separate Boards establish joint committees to address issues of overlapping consequences for the Fidelity funds overseen by each Board.
The Trustees operate using a system of committees to facilitate the timely and efficient consideration of all matters of importance to the Trustees, the fund, and fund shareholders and to facilitate compliance with legal and regulatory requirements and oversight of the fund's activities and associated risks. The Board, acting through its committees, has charged FMR and its affiliates with (i) identifying events or circumstances the occurrence of which could have demonstrably adverse effects on the fund's business and/or reputation; (ii) implementing processes and controls to lessen the possibility that such events or circumstances occur or to mitigate the effects of such events or circumstances if they do occur; and (iii) creating and maintaining a system designed to evaluate continuously business and market conditions in order to facilitate the identification and implementation processes described in (i) and (ii) above. Because the day-to-day operations and activities of the fund are carried out by or through FMR, its affiliates and other service providers, the fund's exposure to risks is mitigated but not eliminated by the processes overseen by the Trustees. While each of the Board's committees has responsibility for overseeing different aspects of the fund's activities, oversight is exercised primarily through the Operations, Audit, and Compliance Committees. In addition, the Independent Trustees have worked with FMR to enhance the Board's oversight of investment and financial risks, legal and regulatory risks, technology risks, and operational risks, including the development of additional risk reporting to the Board. For example, a working group comprised of Independent Trustees and FMR has worked and continues to work to review the Fidelity fund's valuation-related activities, reporting and risk management. Appropriate personnel, including but not limited to the fund's Chief Compliance Officer (CCO), FMR's internal auditor, the independent accountants, the fund's Treasurer and portfolio management personnel, make periodic reports to the Board's committees, as appropriate, including an annual review of FMR's risk management program for the Fidelity funds. The responsibilities of each standing committee, including their oversight responsibilities, are described further under "Standing Committees of the Fund's Trustees."
Annual Report
The fund's Statement of Additional Information (SAI) includes more information about the Trustees. To request a free copy, call Fidelity at 1-877-208-0098.
Interested Trustees*:
Correspondence intended for each Trustee who is an interested person may be sent to Fidelity Investments, 245 Summer Street, Boston, Massachusetts 02210.
Name, Year of Birth; Principal Occupations and Other Relevant Experience+ |
James C. Curvey (1935) |
Year of Election or Appointment: 2007 Trustee Chairman of the Board of Trustees |
| Mr. Curvey also serves as Trustee of other Fidelity funds. Mr. Curvey is a Director of Fidelity Research & Analysis Co. (2009-present), and Vice Chairman (2007-present) and Director of FMR LLC. In addition, Mr. Curvey serves as an Overseer for the Boston Symphony Orchestra and a member of the board of Artis-Naples, Naples, Florida, and as Trustee for Brewster Academy, Wolfeboro, New Hampshire. Previously, Mr. Curvey served as a Director of Fidelity Investments Money Management, Inc. (2009-2014), a Director of FMR (2007-2014), and a Director of FMR Co., Inc. (2007-2014). |
Charles S. Morrison (1960) |
Year of Election or Appointment: 2014 Trustee |
| Mr. Morrison also serves as Trustee of other funds. He serves as a Director of Fidelity Investments Money Management, Inc. (FIMM) (2014-present), Director of Fidelity SelectCo, LLC (2014-present), President, Asset Management (2014-present), and is an employee of Fidelity Investments. Previously, Mr. Morrison served as Vice President of Fidelity's Fixed Income and Asset Allocation Funds (2012-2014), President, Fixed Income (2011-2014), Vice President of Fidelity's Money Market Funds (2005-2009), President, Money Market Group Leader of FMR (2009), and Senior Vice President, Money Market Group of FMR (2004-2009). Mr. Morrison also served as Vice President of Fidelity's Bond Funds (2002-2005), certain Balanced Funds (2002-2005), and certain Asset Allocation Funds (2002-2007), and as Senior Vice President (2002-2005) of Fidelity's Bond Division. |
* Trustees have been determined to be "Interested Trustees" by virtue of, among other things, their affiliation with the trust or various entities under common control with FMR.
+ The information above includes each Trustee's principal occupation during the last five years and other information relating to the experience, attributes, and skills relevant to each Trustee's qualifications to serve as a Trustee, which led to the conclusion that each Trustee should serve as a Trustee for the fund.
Annual Report
Independent Trustees:
Correspondence intended for each Independent Trustee (that is, the Trustees other than the Interested Trustees) may be sent to Fidelity Investments, P.O. Box 55235, Boston, Massachusetts 02205-5235.
Name, Year of Birth; Principal Occupations and Other Relevant Experience+ |
Dennis J. Dirks (1948) |
Year of Election or Appointment: 2005 Trustee |
| Mr. Dirks also serves as Trustee of other Fidelity funds. Prior to his retirement in May 2003, Mr. Dirks was Chief Operating Officer and a member of the Board of The Depository Trust & Clearing Corporation (DTCC). He also served as President, Chief Operating Officer, and Board member of The Depository Trust Company (DTC) and President and Board member of the National Securities Clearing Corporation (NSCC). In addition, Mr. Dirks served as Chief Executive Officer and Board member of the Government Securities Clearing Corporation, Chief Executive Officer and Board member of the Mortgage-Backed Securities Clearing Corporation, as a Trustee and a member of the Finance Committee of Manhattan College (2005-2008), and as a Trustee and a member of the Finance Committee of AHRC of Nassau County (2006-2008). Mr. Dirks is a member of the Independent Directors Council (IDC) Governing Council (2010-present) and Board of Directors for The Brookville Center for Children's Services, Inc. (2009-present). |
Alan J. Lacy (1953) |
Year of Election or Appointment: 2008 Trustee |
| Mr. Lacy also serves as Trustee of other Fidelity funds. Mr. Lacy serves as Senior Adviser (2007-present) of Oak Hill Capital Partners, L.P. (private equity). Mr. Lacy also served as Chief Executive Officer (2000-2005) and Vice Chairman (2005-2006) of Sears Holdings Corporation and Sears, Roebuck and Co. (retail). In addition, Mr. Lacy serves as a member of the Board of Directors of Dave & Buster's Entertainment, Inc. (restaurant and entertainment complexes, 2010-present), Earth Fare, Inc. (retail grocery, 2012-present), The Hillman Companies, Inc. (hardware wholesalers, 2010-present), and Bristol-Myers Squibb Company (global pharmaceuticals, 2008-present). Mr. Lacy is a member of the Board of Trustees of The National Parks Conservation Association (2006-present). Previously, Mr. Lacy served as Chairman of the Board of Trustees of the National Parks Conservation Association (2008-2011) and as a member of the Board of Directors for the Western Union Company (global money transfer, 2006-2011). |
Ned C. Lautenbach (1944) |
Year of Election or Appointment: 2000 Trustee Chairman of the Independent Trustees |
| Mr. Lautenbach also serves as Trustee of other Fidelity funds. Mr. Lautenbach currently serves as the Lead Director of the Eaton Corporation Board of Directors (diversified industrial, 1997-present). Mr. Lautenbach is Chairman of the Board of Directors of the Philharmonic Center for the Arts in Naples, Florida (2012-present) and a member of the Council on Foreign Relations (1994-present). Previously, Mr. Lautenbach was a Partner/Advisory Partner at Clayton, Dubilier & Rice, LLC (private equity investment, 1998-2010), as well as a Director of Sony Corporation (2006-2007). |
Joseph Mauriello (1944) |
Year of Election or Appointment: 2008 Trustee |
| Mr. Mauriello also serves as Trustee of other Fidelity funds. Prior to his retirement in January 2006, Mr. Mauriello served in numerous senior management positions including Deputy Chairman and Chief Operating Officer (2004-2005), and Vice Chairman of Financial Services (2002-2004) of KPMG LLP US (professional services, 1965-2005). Mr. Mauriello currently serves as a member of the Board of Directors of XL Group plc. (global insurance and re-insurance, 2006-present). Previously, Mr. Mauriello served as a Director of the Hamilton Funds of the Bank of New York (2006-2007) and of Arcadia Resources Inc. (health care services and products, 2007-2012). |
Robert W. Selander (1950) |
Year of Election or Appointment: 2011 Trustee |
| Mr. Selander also serves as Trustee of other Fidelity funds. Previously, Mr. Selander served as a Member of the Advisory Board of other Fidelity funds (2011), and Executive Vice Chairman (2010), Chief Executive Officer (2009-2010), and President and Chief Executive Officer (1997-2009) of Mastercard, Inc. |
Cornelia M. Small (1944) |
Year of Election or Appointment: 2005 Trustee |
| Ms. Small also serves as Trustee of other Fidelity funds. Ms. Small is a member of the Board of Directors (2009-present) and Chair of the Investment Committee (2010-present) of the Teagle Foundation. Ms. Small also serves on the Investment Committee of the Berkshire Taconic Community Foundation (2008-present). Previously, Ms. Small served as Chairperson (2002-2008) and a member of the Investment Committee and Chairperson (2008-2012) and a member of the Board of Trustees of Smith College. In addition, Ms. Small served as Chief Investment Officer, Director of Global Equity Investments, and a member of the Board of Directors of Scudder, Stevens & Clark and Scudder Kemper Investments. |
William S. Stavropoulos (1939) |
Year of Election or Appointment: 2001 Trustee Vice Chairman of the Independent Trustees |
| Mr. Stavropoulos also serves as Trustee of other Fidelity funds. Mr. Stavropoulos serves as President and Founder of the Michigan Baseball Foundation, the Great Lakes Loons (2007-present). Mr. Stavropoulos is Chairman Emeritus of the Board of Directors of The Dow Chemical Company, where he previously served in numerous senior management positions, including President, CEO (1995-2000; 2002-2004), Chairman of the Executive Committee (2000-2006), and as a member of the Board of Directors (1990-2006). Currently, Mr. Stavropoulos is Chairman of the Board of Directors of Univar Inc. (global distributor of commodity and specialty chemicals), a Director of Teradata Corporation (data warehousing and technology solutions), and Maersk Inc. (industrial conglomerate), and a member of the Advisory Board for Metalmark Capital LLC (private equity investment, 2005-present). Mr. Stavropoulos is an operating advisor to Clayton, Dubilier & Rice, LLC (private equity investment). In addition, Mr. Stavropoulos is a member of the University of Notre Dame Advisory Council for the College of Science, a Trustee of the Rollin L. Gerstacker Foundation, and a Director of the Naples Philharmonic Center for the Arts. Previously, Mr. Stavropoulos served as a Director of Chemical Financial Corporation (bank holding company, 1993-2012) and Tyco International, Ltd. (multinational manufacturing and services, 2007-2012). |
David M. Thomas (1949) |
Year of Election or Appointment: 2008 Trustee |
| Mr. Thomas also serves as Trustee of other Fidelity funds. Mr. Thomas serves as Non-Executive Chairman of the Board of Directors of Fortune Brands Home and Security (home and security products, 2011-present), and as a member of the Board of Directors of Interpublic Group of Companies, Inc. (marketing communication, 2004-present). Previously, Mr. Thomas served as Executive Chairman (2005-2006) and Chairman and Chief Executive Officer (2000-2005) of IMS Health, Inc. (pharmaceutical and healthcare information solutions), and a Director of Fortune Brands, Inc. (consumer products, 2000-2011). |
+ The information above includes each Trustee's principal occupation during the last five years and other information relating to the experience, attributes, and skills relevant to each Trustee's qualifications to serve as a Trustee, which led to the conclusion that each Trustee should serve as a Trustee for the fund.
Advisory Board Member and Officers:
Correspondence intended for each officer and Peter S. Lynch may be sent to Fidelity Investments, 245 Summer Street, Boston, Massachusetts 02210. Officers appear below in alphabetical order.
Name, Year of Birth; Principal Occupation |
Peter S. Lynch (1944) |
Year of Election or Appointment: 2003 Member of the Advisory Board |
| Mr. Lynch also serves as Member of the Advisory Board of other Fidelity funds. Mr. Lynch is Vice Chairman and a Director of FMR and FMR Co., Inc. In addition, Mr. Lynch serves as a Trustee of Boston College and as the Chairman of the Inner-City Scholarship Fund. Previously, Mr. Lynch served on the Special Olympics International Board of Directors (1997-2006). |
Elizabeth Paige Baumann (1968) |
Year of Election or Appointment: 2012 Anti-Money Laundering (AML) Officer |
| Ms. Baumann also serves as AML Officer of other funds. She is Chief AML Officer of FMR LLC (2012-present) and is an employee of Fidelity Investments. Previously, Ms. Baumann served as Vice President and Deputy Anti-Money Laundering Officer (2007-2012). |
William C. Coffey (1969) |
Year of Election or Appointment: 2009 Assistant Secretary |
| Mr. Coffey also serves as Assistant Secretary of other funds. He is Senior Vice President and Deputy General Counsel of FMR LLC (2010-present), and is an employee of Fidelity Investments. Previously, Mr. Coffey served as Vice President and Associate General Counsel of FMR LLC (2005-2009). |
Timothy M. Cohen (1969) |
Year of Election or Appointment: 2014 Vice President of certain Equity Funds |
| Mr. Cohen also serves as Vice President of other funds. Mr. Cohen serves as a Director and Chief Compliance Officer of Fidelity Management & Research (U.K.) Inc. (2013-present) and is an employee of Fidelity Investments. |
Jonathan Davis (1968) |
Year of Election or Appointment: 2010 Assistant Treasurer |
| Mr. Davis also serves as Assistant Treasurer of other funds. Mr. Davis is an employee of Fidelity Investments. Previously, Mr. Davis served as Vice President and Associate General Counsel of FMR LLC (2003-2010). |
Adrien E. Deberghes (1967) |
Year of Election or Appointment: 2008 Deputy Treasurer |
| Mr. Deberghes also serves as an officer of other funds. He is an employee of Fidelity Investments (2008-present). Prior to joining Fidelity Investments, Mr. Deberghes was Senior Vice President of Mutual Fund Administration at State Street Corporation (2007-2008), Senior Director of Mutual Fund Administration at Investors Bank & Trust (2005-2007), and Director of Finance for Dunkin' Brands (2000-2005). |
Stephanie J. Dorsey (1969) |
Year of Election or Appointment: 2010 Assistant Treasurer |
| Ms. Dorsey also serves as an officer of other funds. She is an employee of Fidelity Investments (2008-present) and has served in other fund officer roles. Prior to joining Fidelity Investments, Ms. Dorsey served as Treasurer (2004-2008) of the JPMorgan Mutual Funds and Vice President (2004-2008) of JPMorgan Chase Bank. |
Howard J. Galligan III (1966) |
Year of Election or Appointment: 2014 Chief Financial Officer |
| Mr. Galligan also serves as Chief Financial Officer of other funds. Mr. Galligan serves as President of Fidelity Pricing and Cash Management Services (FPCMS) (2014-present) and as a Director of Strategic Advisers, Inc. (2008-present). Previously, Mr. Galligan served as Chief Administrative Officer of Asset Management (2011-2014) and Chief Operating Officer and Senior Vice President of Investment Support for Strategic Advisers, Inc. (2003-2011). |
Scott C. Goebel (1968) |
Year of Election or Appointment: 2008 Secretary and Chief Legal Officer (CLO) |
| Mr. Goebel serves as Secretary and CLO of other funds. Mr. Goebel also serves as Secretary of Fidelity SelectCo, LLC (2013-present), Fidelity Investments Money Management, Inc. (FIMM) (2010-present) and Fidelity Research and Analysis Company (FRAC) (2010-present); General Counsel, Secretary, and Senior Vice President of FMR (2008-present) and FMR Co., Inc. (2008-present); Chief Legal Officer of Fidelity Management & Research (Hong Kong) Limited (2008-present); and Assistant Secretary of Fidelity Management & Research (Japan) Limited (2008-present) and Fidelity Management & Research (U.K.) Inc. (2008-present). Previously, Mr. Goebel served as Secretary and CLO of other Fidelity funds (2008-2013), Assistant Secretary of FIMM (2008-2010), FRAC (2008-2010), and certain funds (2007-2008); and as Vice President and Secretary of Fidelity Distributors Corporation (FDC) (2005-2007). Mr. Goebel has been employed by FMR LLC or an affiliate since 2001. |
Brian B. Hogan (1964) |
Year of Election or Appointment: 2009 Vice President |
| Mr. Hogan also serves as Trustee or Vice President of other funds. Mr. Hogan serves as a Director of Fidelity SelectCo, LLC (2014-present) and President of FMR's Equity Division (2009-present). Previously, Mr. Hogan served as Senior Vice President, Equity Research of FMR (2006-2009) and as a portfolio manager. |
Chris Maher (1972) |
Year of Election or Appointment: 2013 Assistant Treasurer |
| Mr. Maher serves as Assistant Treasurer of other funds. Mr. Maher is Vice President of Valuation Oversight and is an employee of Fidelity Investments. Previously, Mr. Maher served as Vice President of Asset Management Compliance (2013), Vice President of FMR's Program Management Group (2010-2013), and Vice President of Valuation Oversight (2008-2010). |
Kenneth B. Robins (1969) |
Year of Election or Appointment: 2008 President and Treasurer |
| Mr. Robins also serves as an officer of other funds. Mr. Robins serves as Executive Vice President of Fidelity Investments Money Management, Inc. (FIMM) (2013-present) and is an employee of Fidelity Investments (2004-present). Previously, Mr. Robins served in other fund officer roles. |
Stephen Sadoski (1971) |
Year of Election or Appointment: 2012 Deputy Treasurer |
| Mr. Sadoski also serves as Deputy Treasurer of other funds. He is an employee of Fidelity Investments (2012-present) and has served in another fund officer role. Prior to joining Fidelity Investments, Mr. Sadoski served as an assistant chief accountant in the Division of Investment Management of the Securities and Exchange Commission (SEC) (2009-2012) and as a senior manager at Deloitte & Touche LLP (1997-2009). |
Stacie M. Smith (1974) |
Year of Election or Appointment: 2013 Deputy Treasurer |
| Ms. Smith also serves as an officer of other funds. She is an employee of Fidelity Investments (2009-present) and has served in other fund officer roles. Prior to joining Fidelity Investments, Ms. Smith served as Senior Audit Manager of Ernst & Young LLP (1996-2009). |
Renee Stagnone (1975) |
Year of Election or Appointment: 2013 Deputy Treasurer |
| Ms. Stagnone also serves as Deputy Treasurer of other funds. Ms. Stagnone is an employee of Fidelity Investments. |
Linda J. Wondrack (1964) |
Year of Election or Appointment: 2014 Chief Compliance Officer |
| Ms. Wondrack also serves as Chief Compliance Officer of other funds. Ms. Wondrack is Executive Vice President and head of the Ethics Office and Asset Management Compliance for Fidelity Investments (2012-present). Ms. Wondrack also serves as Chief Compliance Officer of Fidelity SelectCo, LLC (2014-present); Chief Compliance Officer of Impresa Management LLC (2013-present); and Chief Compliance Officer of FMR Co., Inc., Fidelity Investments Money Management, Inc., Fidelity Management & Research (Japan) Limited, Fidelity Management & Research (U.K.) Inc., Fidelity Management & Research (Hong Kong), Fidelity Management & Research Company, Pyramis Global Advisors, LLC, and Strategic Advisers, Inc., Ballyrock Investment Advisors LLC, and Northern Neck Investors LLC (2012-present). Previously, Ms. Wondrack served as Senior Vice President and Chief Compliance Officer for Columbia Management Investment Advisers, LLC (2005-2012); Chief Compliance Officer for certain funds within the Columbia Family of Funds (2007-2012); and Senior Vice President of Compliance Risk Management at Bank of America (2005-2010). |
Joseph F. Zambello (1957) |
Year of Election or Appointment: 2011 Deputy Treasurer |
| Mr. Zambello also serves as Deputy Treasurer of other funds. Mr. Zambello is an employee of Fidelity Investments. Previously, Mr. Zambello served as Vice President of FMR's Program Management Group (2009-2011) and Vice President of the Transfer Agent Oversight Group (2005-2009). |
Annual Report
The Board of Trustees of Fidelity Total Emerging Markets Fund voted to pay to shareholders of record at the opening of business on record date, the following distributions per share derived from capital gains realized from sales of portfolio securities and dividends derived from net investment income:
| Pay Date | Record Date | Dividends | Capital Gains |
Class A | 12/08/14 | 12/05/14 | $0.170 | $0.02 |
Class T | 12/08/14 | 12/05/14 | $0.140 | $0.02 |
Class C | 12/08/14 | 12/05/14 | $0.098 | $0.02 |
The fund hereby designates as a capital gain dividend with respect to the taxable year ended October 31st, 2014, $135,843, or, if subsequently determined to be different, the net capital gain of such year.
Class A designates 100%, Class T designates 100%, and Class C designates 100% of the dividends distributed during the fiscal year as amounts which may be taken into account as a dividend for purposes of the maximum rate under section 1(h)(11) of the Internal Revenue Code.
The amounts per share which represent income derived from sources within, and taxes paid to, foreign countries or possessions of the United States are as follows:
| Pay Date | Income | Taxes |
Class A | 12/09/13 | $0.2119 | $0.0349 |
Class T | 12/09/13 | $0.1739 | $0.0349 |
Class C | 12/09/13 | $0.1399 | $0.0349 |
The fund will notify shareholders in January 2015 of amounts for use in preparing 2014 income tax returns.
Annual Report
Board Approval of Investment Advisory Contracts and Management Fees
Fidelity Total Emerging Markets Fund
Each year, the Board of Trustees, including the Independent Trustees (together, the Board), votes on the renewal of the management contract with Fidelity Management & Research Company (FMR) and the sub-advisory agreements (together, the Advisory Contracts) for the fund. The Board, assisted by the advice of fund counsel and Independent Trustees' counsel, requests and considers a broad range of information relevant to the renewal of the Advisory Contracts throughout the year.
The Board meets regularly and, at each of its meetings, covers an extensive agenda of topics and materials and considers factors that are relevant to its annual consideration of the renewal of the fund's Advisory Contracts, including the services and support provided to the fund and its shareholders. The Board has established various standing committees (Committees), each composed of and chaired by Independent Trustees with varying backgrounds, to which the Board has assigned specific subject matter responsibilities in order to enhance effective decision-making by the Board. The Board, acting directly and through its Committees, requests and receives information concerning the annual consideration of the renewal of the fund's Advisory Contracts. The Board also meets as needed to consider matters specifically related to the Board's annual consideration of the renewal of the Advisory Contracts. Members of the Board may also meet with trustees of other Fidelity funds through ad hoc joint committees to discuss certain matters relevant to the Fidelity funds.
At its July 2014 meeting, the Board, including the Independent Trustees, unanimously determined to renew the fund's Advisory Contracts. In reaching its determination, the Board considered all factors it believed relevant, including (i) the nature, extent, and quality of the services to be provided to the fund and its shareholders (including the investment performance of the fund); (ii) the competitiveness of the fund's management fee and total expense ratio relative to peer funds; (iii) the total costs of the services to be provided by and the profits to be realized by Fidelity from its relationship with the fund; (iv) the extent to which economies of scale exist and would be realized as the fund grows; and (v) whether fee levels reflect these economies of scale, if any, for the benefit of fund shareholders. In connection with separate internal corporate reorganizations involving Fidelity Management & Research (U.K.) Inc. (FMR U.K.) and Fidelity Management & Research (Japan) Inc. (FMR Japan), the Board approved certain non-material amendments to the fund's sub-advisory agreements with FMR U.K. and FMR Japan to reflect that, after these reorganizations, FMR Investment Management (UK) Limited and Fidelity Management & Research (Japan) Limited will carry on the business of FMR U.K. and FMR Japan, respectively. The Board noted that no changes to the portfolio managers or to the foreign research or investment advisory services provided to the fund were expected in connection with either reorganization and that the same personnel and resources would continue to be available to the fund at the new entities.
Annual Report
In considering whether to renew the Advisory Contracts for the fund, the Board reached a determination, with the assistance of fund counsel and Independent Trustees' counsel and through the exercise of its business judgment, that the renewal of the Advisory Contracts was in the best interests of the fund and its shareholders and that the compensation payable under the Advisory Contracts was fair and reasonable. The Board's decision to renew the Advisory Contracts was not based on any single factor, but rather was based on a comprehensive consideration of all the information provided to the Board at its meetings throughout the year. The Board, in reaching its determination to renew the Advisory Contracts, was aware that shareholders of the fund have a broad range of investment choices available to them, including a wide choice among funds offered by Fidelity's competitors, and that the fund's shareholders, who have the opportunity to review and weigh the disclosure provided by the fund in its prospectus and other public disclosures, have chosen to invest in this fund, which is part of the Fidelity family of funds.
Nature, Extent, and Quality of Services Provided. The Board considered Fidelity's staffing as it relates to the fund, including the backgrounds of investment personnel of FMR and the sub-advisers (together, the Investment Advisers), and also considered the fund's investment objective, strategies, and related investment philosophy. The Independent Trustees also had discussions with senior management of Fidelity's investment operations and investment groups. The Board considered the structure of the portfolio manager compensation program and whether this structure provides appropriate incentives to act in the best interests of the fund. Additionally, the Board considered the portfolio managers' investments, if any, in the funds that they manage.
Resources Dedicated to Investment Management and Support Services. The Board and the Fund Oversight and Research Committees reviewed the general qualifications and capabilities of Fidelity's investment staff, including its size, education, experience, and resources, as well as Fidelity's approach to recruiting, training, managing, and compensating investment personnel. The Board noted that Fidelity has continued to increase the resources devoted to non-U.S. offices, including expansion of Fidelity's global investment organization. The Board also noted that Fidelity's analysts have extensive resources, tools and capabilities that allow them to conduct sophisticated quantitative and fundamental analysis, as well as credit analysis of issuers, counterparties and guarantors. Further, the Board believes that Fidelity's investment professionals have sufficient access to global information and data so as to provide competitive investment results over time, and that those professionals also have access to sophisticated tools that permit them to assess portfolio construction and risk and performance attribution characteristics continuously, as well as to transmit new information and research conclusions rapidly around the world. Additionally, in its deliberations, the Board considered Fidelity's trading and risk management capabilities and resources and global compliance infrastructure, which are an integral part of the investment management process.
Annual Report
Board Approval of Investment Advisory Contracts and
Management Fees - continued
Shareholder and Administrative Services. The Board considered (i) the nature, extent, quality, and cost of advisory, administrative, and shareholder services performed by the Investment Advisers and their affiliates under the Advisory Contracts and under separate agreements covering transfer agency, pricing and bookkeeping, and securities lending services for the fund; (ii) the nature and extent of the supervision of third party service providers, principally custodians and subcustodians; and (iii) the resources devoted to, and the record of compliance with, the fund's compliance policies and procedures. The Board also reviewed the allocation of fund brokerage, including allocations to brokers affiliated with the Investment Advisers, the use of brokerage commissions to pay fund expenses, and the use of "soft" commission dollars to pay for research services.
The Board noted that the growth of fund assets over time across the complex allows Fidelity to reinvest in the development of services designed to enhance the value or convenience of the Fidelity funds as investment vehicles. These services include 24-hour access to account information and market information through telephone representatives and over the Internet, investor education materials and asset allocation tools, and the expanded availability of Fidelity Investor Centers.
In 2014, the Board formed an ad hoc Committee on Transfer Agency Fees to review the variety of transfer agency fee structures throughout the industry and Fidelity's competitive positioning with respect to industry participants.
Investment in a Large Fund Family. The Board considered the benefits to shareholders of investing in a Fidelity fund, including the benefits of investing in a fund that is part of a large family of funds offering a variety of investment disciplines and providing a large variety of mutual fund investor services. The Board noted that Fidelity had taken, or had made recommendations that resulted in the Fidelity funds taking, a number of actions over the previous year that benefited particular funds, including (i) continuing to dedicate additional resources to investment research and to the support of the senior management team that oversees asset management; (ii) persisting in efforts to enhance Fidelity's global research capabilities; (iii) launching new funds and making other enhancements to meet client needs for income-oriented solutions; (iv) reducing fund expenses for certain index funds; (v) continuing to launch dedicated lower cost underlying funds to meet portfolio construction needs related to expanding underlying fund options for Fidelity funds of funds, specifically for the Freedom Fund product lines; (vi) rationalizing product lines and gaining increased efficiencies through fund mergers; (vii) launching sector-based exchange-traded funds and establishing a new Fidelity adviser to manage sector-based funds and products; (viii) continuing to develop and implement technology to improve security and increase efficiency; (ix) modifying the eligibility criteria for certain share classes to increase their marketability to a portion of the defined contribution plan market; (x) waiving redemption fees for certain qualified fund-of-fund and wrap programs and certain retirement plan transactions; and (xi) launching new Institutional Class shares of certain money market funds to attract and retain assets and to fill a gap in the money market fund lineup.
Annual Report
Investment Performance. The Board considered whether the fund has operated in accordance with its investment objective, as well as its record of compliance with its investment restrictions and its performance history.
The Board took into account discussions with the Investment Advisers about fund investment performance that occur at Board meetings throughout the year. In this regard the Board noted that as part of regularly scheduled fund reviews and other reports to the Board on fund performance, the Board periodically considers annualized return information for the fund, for different time periods, measured against a securities market index ("benchmark index") and a peer group of funds with similar objectives ("peer group"). In its evaluation of fund investment performance, the Board gave particular attention to information indicating changes in performance of certain Fidelity funds for specific time periods and the Investment Advisers' explanations for any overperformance or underperformance.
In addition to reviewing absolute and relative fund performance, the Independent Trustees periodically consider the appropriateness of fund performance metrics in evaluating the results achieved. In general, the Independent Trustees believe that fund performance should be evaluated based on net performance (after fees and expenses) of both the highest performing and lowest performing classes, where applicable, compared to appropriate benchmark indices, over appropriate time periods which may include full market cycles, and compared to peer groups, as applicable, over the same periods, taking into account relevant factors including the following: general market conditions; issuer-specific information; tactical opportunities for investment; and fund cash flows and other factors.
The Independent Trustees recognize that shareholders evaluate performance on a net basis over their own holding periods, for which one-, three-, and five-year periods are often used as a proxy. For this reason, the performance information reviewed by the Board also included net cumulative calendar year total return information for the fund and an appropriate benchmark index for the most recent one-year period, as shown below. A peer group comparison is not shown below.
Annual Report
Board Approval of Investment Advisory Contracts and
Management Fees - continued
Fidelity Total Emerging Markets Fund

Based on its review, the Board concluded that the nature, extent, and quality of services provided to the fund under the Advisory Contracts should benefit the fund's shareholders.
Competitiveness of Management Fee and Total Expense Ratio. The Board considered the fund's management fee and total expense ratio compared to "mapped groups" of competitive funds and classes. Fidelity creates "mapped groups" by combining similar Lipper investment objective categories that have comparable investment mandates. Combining Lipper investment objective categories aids the Board's management fee and total expense ratio comparisons by broadening the competitive group used for comparison and by reducing the number of universes to which various Fidelity funds are compared.
Management Fee. The Board considered two proprietary management fee comparisons for the 12-month (or shorter) periods shown in the chart below. The group of Lipper funds used by the Board for management fee comparisons is referred to below as the "Total Mapped Group." The Total Mapped Group comparison focuses on a fund's standing in terms of gross management fees before expense reimbursements or caps relative to the total universe of funds with comparable investment mandates, regardless of whether their management fee structures also are comparable. Funds with comparable investment mandates offer exposure to similar types of securities. Funds with comparable management fee structures have similar management fee contractual arrangements (e.g., flat rate charged for advisory services, all-inclusive fee rate, etc.). "TMG %" represents the percentage of funds in the Total Mapped Group that had management fees that were lower than the fund's. For example, a hypothetical TMG % of 20% would mean that 80% of the funds in the Total Mapped Group had higher, and 20% had lower, management fees than the fund. The fund's actual TMG %s are in the chart below. The "Asset-Size Peer Group" (ASPG) comparison focuses on a fund's standing relative to a subset of non-Fidelity funds within the Total Mapped Group that are similar in size and management fee structure. For example, if a fund is in the first quartile of the ASPG, the fund's management fee ranks in the least expensive or lowest 25% of funds in the ASPG. The ASPG represents at least 15% of the funds in the Total Mapped Group with comparable asset size and management fee structures, subject to a minimum of 50 funds (or all funds in the Total Mapped Group if fewer than 50). Additional information, such as the ASPG quartile in which the fund's management fee rate ranked, is also included in the chart and considered by the Board.
Annual Report
Fidelity Total Emerging Markets Fund
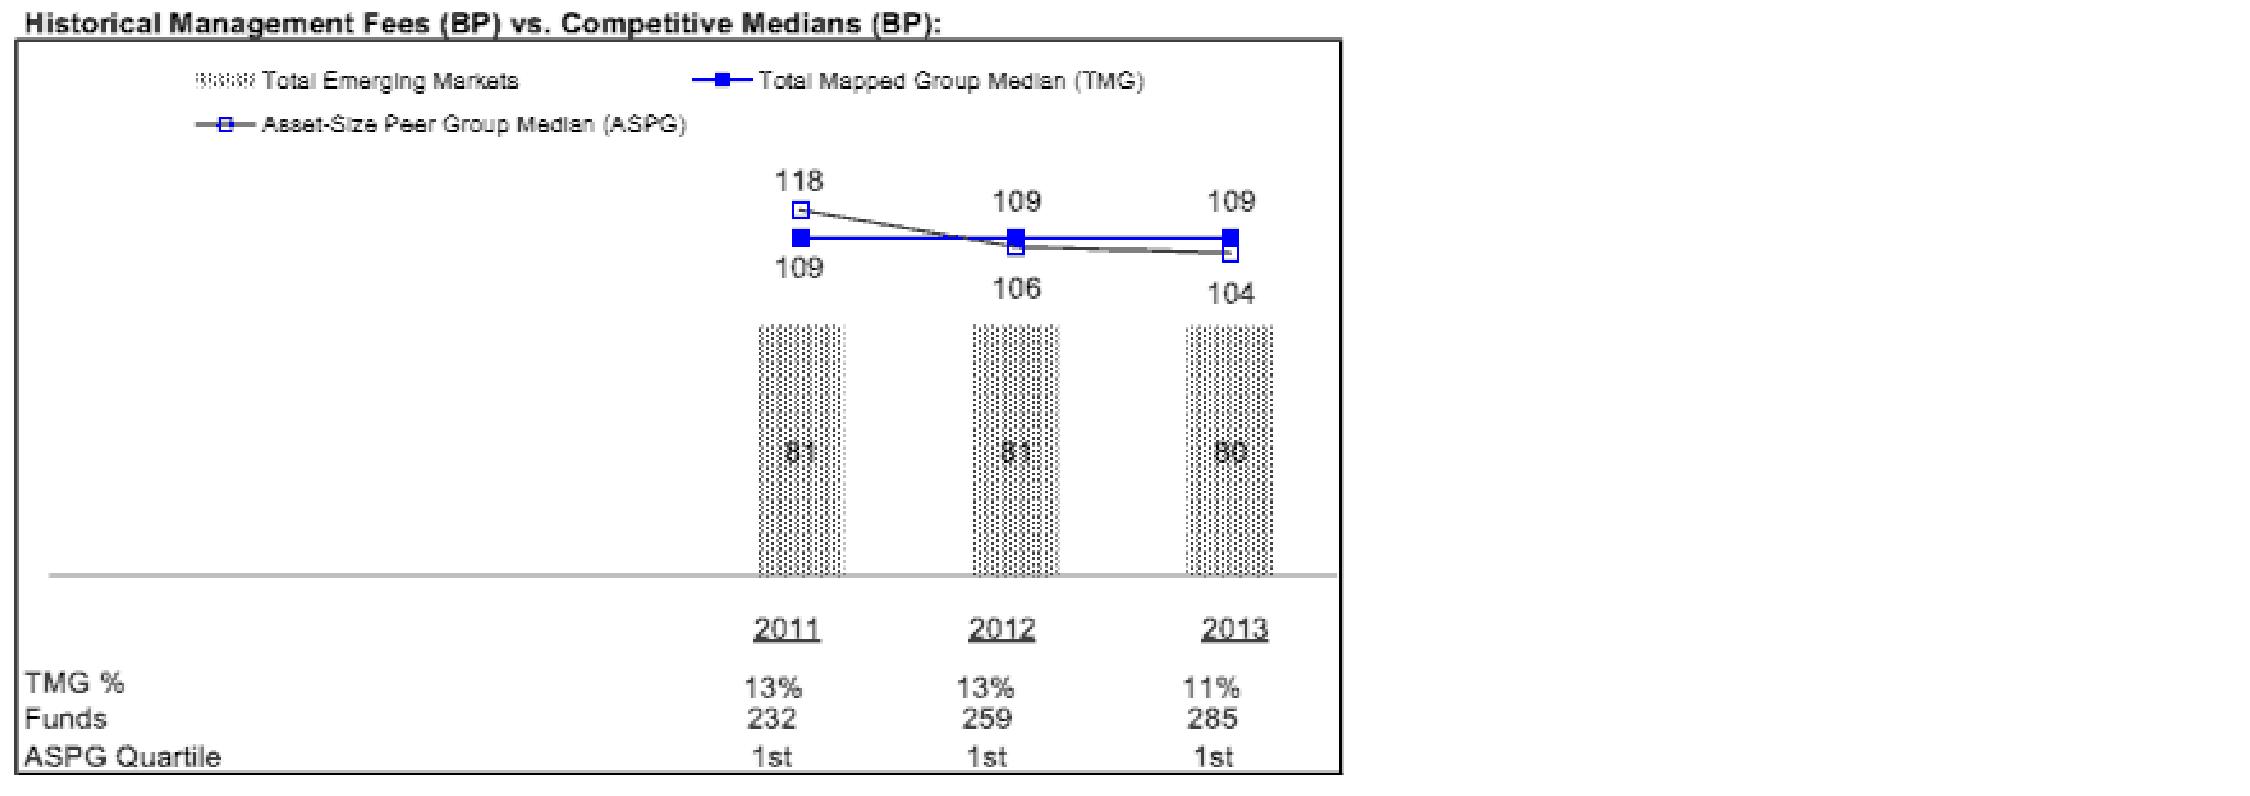
The Board noted that the fund's management fee rate ranked below the median of its Total Mapped Group and below the median of its ASPG for 2013.
The Board also noted that, in August 2013, the ad hoc Committee on Management Fees was formed to conduct an in-depth review of the management fee rates of Fidelity's active equity mutual funds. The Committee focused on the following areas: (i) standard fee structures; (ii) research consumption and trading evolution; (iii) management fee competitiveness/profitability by category; and (iv) factors that drive institutional pricing.
Based on its review, the Board concluded that the fund's management fee is fair and reasonable in light of the services that the fund receives and the other factors considered.
Annual Report
Board Approval of Investment Advisory Contracts and
Management Fees - continued
Total Expense Ratio. In its review of each class's total expense ratio the Board considered the fund's management fee as well as other fund or class expenses, as applicable, such as transfer agent fees, pricing and bookkeeping fees, fund-paid 12b-1 fees, and custodial, legal, and audit fees. The Board also noted the effects of any waivers and reimbursements on fees and expenses. As part of its review, the Board also considered the current and historical total expense ratios of each class of the fund compared to competitive fund median expenses. Each class of the fund is compared to those funds and classes in the Total Mapped Group (used by the Board for management fee comparisons) that have a similar sales load structure.
The Board noted that the total expense ratio of each of Class A and the retail class ranked below its competitive median for 2013 and the total expense ratio of each of Class T, Class C, and Institutional Class ranked above its competitive median for 2013. The Board considered that, in general, various factors can affect total expense ratios. The Board noted that the total expense ratio of Class T was above the competitive median primarily because of higher 12b-1 fees on Class T as compared to most competitor funds. Class T has a higher 12b-1 fee, but a lower front-end sales charge, than traditionally priced front-end sales charge classes. The Board considered that Class T is primarily sold load-waived in the retirement plan market where its 0.50% 12b-1 fee is comparable to competing no-load, higher 12b-1 fee classes designed specifically for retirement plans. The Board noted that the fund offers multiple classes, each of which has a different sales load and 12b-1 fee structure, and that the multiple structures are intended to offer a range of pricing options for the intermediary market. The Board also noted that the total expense ratios of the classes of the fund vary primarily by the level of their 12b-1 fees, although differences in transfer agent fees may also cause expenses to vary from class to class.
The Board further considered that FMR contractually agreed to reimburse Class A, Class T, Class C, Institutional Class, and the retail class of the fund to the extent that total operating expenses (excluding interest, certain taxes, certain securities lending costs, brokerage commissions, extraordinary expenses, and acquired fund fees and expenses, if any), as a percentage of their respective average net assets, exceed 1.65%, 1.90%, 2.40%, 1.40%, and 1.40% through December 31, 2014.
Fees Charged to Other Fidelity Clients. The Board also considered Fidelity fee structures and other information with respect to clients of Fidelity, such as other funds advised or subadvised by Fidelity, pension plan clients, and other institutional clients. The Board noted the findings of the 2013 ad hoc joint committee (created with the board of other Fidelity funds), which reviewed and compared Fidelity's institutional investment advisory business with its business of providing services to the Fidelity funds, including the differences in services provided, fees charged, and costs incurred, as well as competition in their respective marketplaces.
Annual Report
Based on its review of total expense ratios and fees charged to other Fidelity clients, the Board concluded that the total expense ratio of each class of the fund was reasonable, although in some cases above the median of the universe presented for comparison, in light of the services that the fund and its shareholders receive and the other factors considered.
Costs of the Services and Profitability. The Board considered the revenues earned and the expenses incurred by Fidelity in conducting the business of developing, marketing, distributing, managing, administering and servicing the fund and servicing the fund's shareholders. The Board also considered the level of Fidelity's profits in respect of all the Fidelity funds.
On an annual basis, Fidelity presents to the Board Fidelity's profitability for the fund. Fidelity calculates the profitability for each fund, as well as aggregate profitability for groups of Fidelity funds and all Fidelity funds, using a series of detailed revenue and cost allocation methodologies which originate with the books and records of Fidelity on which Fidelity's audited financial statements are based. The Audit Committee of the Board reviews any significant changes from the prior year's methodologies.
PricewaterhouseCoopers LLP (PwC), independent registered public accounting firm and auditor to Fidelity and certain Fidelity funds, has been engaged annually by the Board as part of the Board's assessment of Fidelity's profitability analysis. PwC's engagement includes the review and assessment of the methodologies used by Fidelity in determining the revenues and expenses attributable to Fidelity's mutual fund business, and completion of agreed-upon procedures in respect of the mathematical accuracy of fund profitability and its conformity to established allocation methodologies. After considering PwC's reports issued under the engagement and information provided by Fidelity, the Board concluded that while other allocation methods may also be reasonable, Fidelity's profitability methodologies are reasonable in all material respects.
The Board also reviewed Fidelity's non-fund businesses and fall-out benefits related to the mutual fund business as well as cases where Fidelity's affiliates may benefit from or be related to the fund's business.
The Board considered the costs of the services provided by and the profits realized by Fidelity in connection with the operation of the fund and was satisfied that the profitability was not excessive in the circumstances.
Economies of Scale. The Board considered whether there have been economies of scale in respect of the management of the Fidelity funds, whether the Fidelity funds (including the fund) have appropriately benefited from any such economies of scale, and whether there is potential for realization of any further economies of scale. The Board considered the extent to which the fund will benefit from economies of scale through increased services to the fund, through waivers or reimbursements, or through fee or expense ratio reductions. The Board also noted that in 2013, it and the boards of other Fidelity funds created an ad hoc committee (the Economies of Scale Committee) to analyze whether Fidelity attains economies of scale in respect of the management and servicing of the Fidelity funds, whether the Fidelity funds have appropriately benefited from such economies of scale, and whether there is potential for realization of any further economies of scale.
Annual Report
Board Approval of Investment Advisory Contracts and
Management Fees - continued
The Board recognized that the fund's management contract incorporates a "group fee" structure, which provides for lower group fee rates as total group assets increase, and for higher group fee rates as total group assets decrease (with "group assets" defined to include fund assets under FMR's management plus sector fund assets previously under FMR's management and currently managed by Fidelity SelectCo, LLC). FMR calculates the group fee rates based on a tiered asset "breakpoint" schedule that varies based on asset class. The Board considered that the group fee is designed to deliver the benefits of economies of scale to fund shareholders when total Fidelity fund assets increase, even if assets of any particular fund are unchanged or have declined, because some portion of Fidelity's costs are attributable to services provided to all Fidelity funds, and all funds benefit if those costs can be allocated among more assets. The Board concluded that, given the group fee structure, fund shareholders will benefit from lower management fees as group assets increase at the fund complex level, regardless of whether Fidelity achieves any such economies of scale.
The Board concluded, taking into account the analysis of the Economies of Scale Committee, that economies of scale, if any, are being appropriately shared between fund shareholders and Fidelity.
Additional Information Requested by the Board. In order to develop fully the factual basis for consideration of the Fidelity funds' Advisory Contracts, the Board requested and received additional information on certain topics, including: (i) fund performance trends and Fidelity's long-term strategies for certain funds; (ii) the potential to further rationalize the Fidelity fund lineup with the possibility of achieving savings for the funds and Fidelity; (iii) the methodology with respect to competitive fund data and peer group classifications; (iv) the arrangements with, and performance of, certain sub-advisers on behalf of the Fidelity funds, as well as certain proposed participating affiliate arrangements; (v) the realization of fall-out benefits in certain Fidelity business units; (vi) Fidelity's group fee structures, including the rationale for the individual fee rates of certain categories of funds and the definition of group assets; (vii) trends regarding industry use of performance fee structures and the performance adjustment methodologies applicable to the Fidelity funds; (viii) additional competitive analysis regarding the total expenses for certain classes; and (ix) fund profitability methodology, including Fidelity's cost allocation methodology, and the impact of certain factors on fund profitability results.
Annual Report
Based on its evaluation of all of the conclusions noted above, and after considering all factors it believed relevant, the Board ultimately concluded that the advisory fee structures are fair and reasonable, and that the fund's Advisory Contracts should be renewed.
Annual Report
Investment Adviser
Fidelity Management & Research Company
Boston, MA
Investment Sub-Advisers
FMR Co., Inc.
Fidelity Management & Research
(U.K.) Inc.
Fidelity Management & Research
(Hong Kong) Limited
Fidelity Management & Research
(Japan) Limited
FIL Investment Advisors
FIL Investment Advisors (UK) Limited
FIL Investments (Japan) Limited
General Distributor
Fidelity Distributors Corporation
Smithfield, RI
Transfer and Service Agents
Fidelity Investments Institutional Operations Company, Inc.
Boston, MA
Fidelity Service Company, Inc.
Boston, MA
Custodian
The Northern Trust Company
Chicago, IL
(Fidelity Investment logo)(registered trademark)
ATEK-UANN-1214
1.931267.102
(Fidelity Investment logo)(registered trademark)
Fidelity Advisor®
Total Emerging Markets
Fund - Institutional Class
Annual Report
October 31, 2014
(Fidelity Cover Art)
Institutional Class is a
class of Fidelity® Total
Emerging Markets Fund
Contents
Performance | (Click Here) | How the fund has done over time. |
Management's Discussion of Fund Performance | (Click Here) | The Portfolio Manager's review of fund performance and strategy. |
Shareholder Expense Example | (Click Here) | An example of shareholder expenses. |
Investment Changes | (Click Here) | A summary of major shifts in the fund's investments over the past six months. |
Investments | (Click Here) | A complete list of the fund's investments with their market values. |
Financial Statements | (Click Here) | Statements of assets and liabilities, operations, and changes in net assets, as well as financial highlights. |
Notes | (Click Here) | Notes to the financial statements. |
Report of Independent Registered Public Accounting Firm | (Click Here) | |
Trustees and Officers | (Click Here) | |
Distributions | (Click Here) | |
Board Approval of Investment Advisory Contracts and Management Fees | (Click Here) | |
To view a fund's proxy voting guidelines and proxy voting record for the 12-month period ended June 30, visit http://www.fidelity.com/proxyvotingresults or visit the Securities and Exchange Commission's (SEC) web site at http://www.sec.gov. You may also call 1-877-208-0098 to request a free copy of the proxy voting guidelines.
Standard & Poor's, S&P and S&P 500 are registered service marks of The McGraw-Hill Companies, Inc. and have been licensed for use by Fidelity Distributors Corporation.
Other third-party marks appearing herein are the property of their respective owners.
All other marks appearing herein are registered or unregistered trademarks or service marks of FMR LLC or an affiliated company. © 2014 FMR LLC. All rights reserved.
Annual Report
This report and the financial statements contained herein are submitted for the general information of the shareholders of the fund. This report is not authorized for distribution to prospective investors in the fund unless preceded or accompanied by an effective prospectus.
A fund files its complete schedule of portfolio holdings with the SEC for the first and third quarters of each fiscal year on Form N-Q. Forms N-Q are available on the SEC's web site at http://www.sec.gov. A fund's Forms N-Q may be reviewed and copied at the SEC's Public Reference Room in Washington, DC. Information regarding the operation of the SEC's Public Reference Room may be obtained by calling 1-800-SEC-0330. For a complete list of a fund's portfolio holdings, view the most recent holdings listing, semiannual report, or annual report on Fidelity's web site at http://www.fidelity.com, http://www.advisor.fidelity.com, or http://www.401k.com, as applicable.
NOT FDIC INSURED • MAY LOSE VALUE • NO BANK GUARANTEE
Neither the fund nor Fidelity Distributors Corporation is a bank.
Annual Report
Average annual total return reflects the change in the value of an investment, assuming reinvestment of the class' distributions from dividend income and capital gains (the profits earned upon the sale of securities that have grown in value, if any) and assuming a constant rate of performance each year. The $10,000 table and the fund's returns do not reflect the deduction of taxes that a shareholder would pay on fund distributions or the redemption of fund shares. During periods of reimbursement by Fidelity, a fund's total return will be greater than it would be had the reimbursement not occurred. How a fund did yesterday is no guarantee of how it will do tomorrow.
Average Annual Total Returns
Periods ended October 31, 2014 | Past 1
year | Life of
fund A |
Institutional Class | 3.51% | 6.34% |
A From November 1, 2011.
$10,000 Over Life of Fund
Let's say hypothetically that $10,000 was invested in Fidelity Advisor® Total Emerging Markets Fund - Institutional Class on November 1, 2011, when the fund started. The chart shows how the value of your investment would have changed, and also shows how the MSCI Emerging Markets Index performed over the same period.
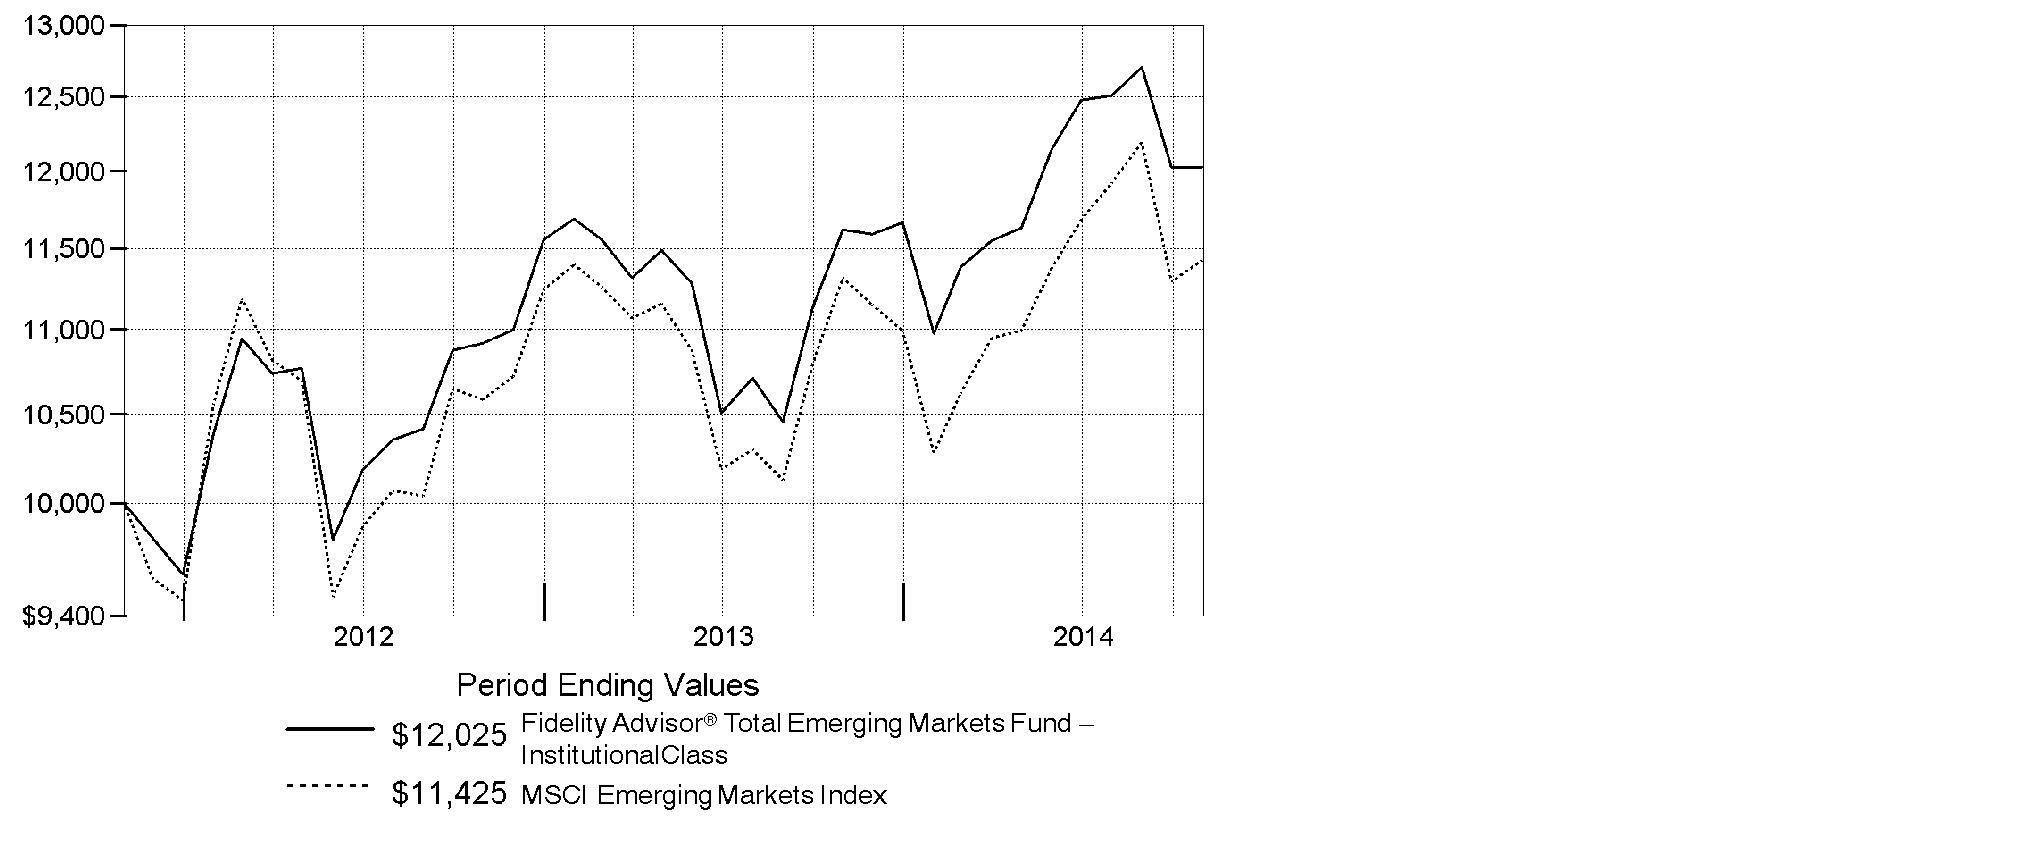
Annual Report
Market Recap: Global equities posted a healthy gain for the 12 months ending October 31, 2014, overcoming an October decline driven by recessionary pressures in China and tepid growth in Europe. The MSCI ACWI (All Country World Index) Index rose 8.15%, helped by investors' risk-taking and subdued market volatility for much of the period and supported by solid corporate earnings, especially in the United States. Stocks also benefited from easy monetary policies in Japan and the eurozone, as well as increased stimulus efforts in China. All but three of the 24 industry groups that compose the index marked a positive return. The U.S. (+17%) remained a pillar of strength, while a strongly rising dollar in the latter part of the period detracted from investors' returns in most non-U.S. markets. Canada (+5%) notched broad gains outside of its energy and materials sectors, as did Asia-Pacific ex Japan (+4%), led by investor enthusiasm for companies in India. The U.K., Europe and Japan, meanwhile, all underperformed. Turning to bonds, late-period strength in the U.S. dollar took its toll on performance: The Barclays® Global Aggregate GDP Weighted Index gained 1.09% for the year, lagging the 4.14% return of the Barclays® U.S. Aggregate Bond Index. Global corporate debt (+3%) fared relatively better, but still lagged the broad U.S. bond market.
Comments from John Carlson, Lead Portfolio Manager of Fidelity Advisor® Total Emerging Markets Fund: For the year, the fund's Institutional Class shares gained 3.51%, compared with 0.98% for the MSCI Emerging Markets Index and 3.53% for the Fidelity Total Emerging Markets Composite IndexSM. Versus the Composite index, the fund's overweighting in equities, which underperformed, and underweighting in strong-performing EM debt detracted. However, the biggest contribution came from security selection among equities. Here, the equity sleeve's top individual contributor was South Korean cosmetics firm AMOREPACIFIC Group. Over the past year, the stock price tripled, benefiting from rapidly increasing demand for makeup among Chinese consumers, especially via e-commerce and duty-free sales. Conversely, positioning in Russia hurt results, including an investment in market-leading bank Sberbank. Turning to EM debt, underweighting Russia helped. We notably reduced exposure here in the first half of the period amid rising geopolitical uncertainty that caused a steep sell-off, although we added to our position shortly after that happened. On the flip side, it hurt to largely avoid Argentina.
Note to shareholders: Effective October 1, 2014, Per Johansson and Douglas Chow were no longer Co-Portfolio Managers of the fund, and Co-Portfolio Managers Gregory Lee and Tim Gannon became responsible for the energy and information technology subportfolios, respectively.
The views expressed above reflect those of the portfolio manager(s) only through the end of the period as stated on the cover of this report and do not necessarily represent the views of Fidelity or any other person in the Fidelity organization. Any such views are subject to change at any time based upon market or other conditions and Fidelity disclaims any responsibility to update such views. These views may not be relied on as investment advice and, because investment decisions for a Fidelity fund are based on numerous factors, may not be relied on as an indication of trading intent on behalf of any Fidelity fund.
Annual Report
Fidelity Total Emerging Markets Fund
Shareholder Expense Example
As a shareholder of the Fund, you incur two types of costs: (1) transaction costs, including sales charges (loads) on purchase payments or redemption proceeds, redemption fees and (2) ongoing costs, including management fees, distribution and/or service (12b-1) fees and other Fund expenses. This Example is intended to help you understand your ongoing costs (in dollars) of investing in the Fund and to compare these costs with the ongoing costs of investing in other mutual funds.
The Example is based on an investment of $1,000 invested at the beginning of the period and held for the entire period (May 1, 2014 to October 31, 2014).
Actual Expenses
The first line of the accompanying table for each class of the Fund provides information about actual account values and actual expenses. You may use the information in this line, together with the amount you invested, to estimate the expenses that you paid over the period. Simply divide your account value by $1,000.00 (for example, an $8,600 account value divided by $1,000.00 = 8.6), then multiply the result by the number in the first line for a class of the Fund under the heading entitled "Expenses Paid During Period" to estimate the expenses you paid on your account during this period. A small balance maintenance fee of $12.00 that is charged once a year may apply for certain accounts with a value of less than $2,000. This fee is not included in the table below. If it was, the estimate of expenses you paid during the period would be higher, and your ending account value lower, by this amount. In addition, the Fund, as a shareholder in the underlying Fidelity Central Funds, will indirectly bear its pro-rata share of the fees and expenses incurred by the underlying Fidelity Central Funds. These fees and expenses are not included in the Fund's annualized expense ratio used to calculate the expense estimate in the table below.
Hypothetical Example for Comparison Purposes
The second line of the accompanying table for each class of the Fund provides information about hypothetical account values and hypothetical expenses based on a Class' actual expense ratio and an assumed rate of return of 5% per year before expenses, which is not the Class' actual return. The hypothetical account values and expenses may not be used to estimate the actual ending account balance or expenses you paid for the period. You may use this information to compare the ongoing costs of investing in the Fund and other funds. To do so, compare this 5% hypothetical example with the 5% hypothetical examples that appear in the shareholder reports of the other funds. A small balance maintenance fee of $12.00 that is charged once a year may apply for certain accounts with a value of less than $2,000. This fee is not included in the table below. If it was, the estimate of expenses you paid during the period would be higher, and your ending account value lower, by this amount. In addition, the Fund, as a shareholder in the underlying Fidelity Central Funds, will indirectly bear its pro-rata share of the fees and expenses incurred by the underlying Fidelity Central Funds. These fees and expenses are not included in the Fund's annualized expense ratio used to calculate the expense estimate in the table below.
Please note that the expenses shown in the table are meant to highlight your ongoing costs only and do not reflect any transaction costs. Therefore, the second line of the table is useful in comparing ongoing costs only, and will not help you determine the relative total costs of owning different funds. In addition, if these transactional costs were included, your costs would have been higher.
Annual Report
Shareholder Expense Example - continued
| Annualized
Expense RatioB | Beginning
Account Value
May 1, 2014 | Ending
Account Value
October 31, 2014 | Expenses Paid
During Period*
May 1, 2014
to October 31, 2014 |
Class A | 1.65% | | | |
Actual | | $ 1,000.00 | $ 1,033.10 | $ 8.46 |
HypotheticalA | | $ 1,000.00 | $ 1,016.89 | $ 8.39 |
Class T | 1.90% | | | |
Actual | | $ 1,000.00 | $ 1,031.30 | $ 9.73 |
HypotheticalA | | $ 1,000.00 | $ 1,015.63 | $ 9.65 |
Class C | 2.40% | | | |
Actual | | $ 1,000.00 | $ 1,028.70 | $ 12.27 |
HypotheticalA | | $ 1,000.00 | $ 1,013.11 | $ 12.18 |
Total Emerging Markets | 1.40% | | | |
Actual | | $ 1,000.00 | $ 1,033.90 | $ 7.18 |
HypotheticalA | | $ 1,000.00 | $ 1,018.15 | $ 7.12 |
Institutional Class | 1.40% | | | |
Actual | | $ 1,000.00 | $ 1,033.90 | $ 7.18 |
HypotheticalA | | $ 1,000.00 | $ 1,018.15 | $ 7.12 |
A 5% return per year before expenses
B Annualized expense ratio reflects expenses net of applicable fee waivers.
* Expenses are equal to each Class' annualized expense ratio, multiplied by the average account value over the period, multiplied by 184/365 (to reflect the one-half year period).
Annual Report
Fidelity Total Emerging Markets Fund
Investment Changes (Unaudited)
Top Five Stocks as of October 31, 2014 |
| % of fund's
net assets | % of fund's net assets
6 months ago |
Samsung Electronics Co. Ltd. (Korea (South), Technology Hardware, Storage & Peripherals) | 2.9 | 3.1 |
Taiwan Semiconductor Manufacturing Co. Ltd. (Taiwan, Semiconductors & Semiconductor Equipment) | 2.3 | 2.6 |
Tencent Holdings Ltd. (Cayman Islands, Internet Software & Services) | 1.5 | 1.7 |
Naspers Ltd. Class N (South Africa, Media) | 1.3 | 0.9 |
Industrial & Commercial Bank of China Ltd. (H Shares) (China, Banks) | 1.1 | 1.2 |
| 9.1 | |
Top Five Market Sectors as of October 31, 2014 |
| % of fund's
net assets | % of fund's net assets
6 months ago |
Financials | 22.6 | 20.1 |
Information Technology | 13.8 | 12.5 |
Energy | 9.4 | 11.9 |
Consumer Discretionary | 6.8 | 5.9 |
Consumer Staples | 6.5 | 6.3 |
Top Five Countries as of October 31, 2014 |
(excluding cash equivalents) | % of fund's
net assets | % of fund's net assets
6 months ago |
Korea (South) | 13.5 | 13.7 |
India | 8.5 | 5.2 |
Brazil | 7.1 | 7.9 |
Taiwan | 6.3 | 5.5 |
China | 5.9 | 4.7 |
Percentages are adjusted for the effect of open futures contracts, if applicable. |
Asset Allocation (% of fund's net assets) |
As of October 31, 2014 | As of April 30, 2014 |
 | Stocks and
Equity Futures 75.6% | | | Stocks and
Equity Futures 70.1% | |
 | Bonds 22.9% | | | Bonds 27.3% | |
 | Short-Term
Investments and
Net Other Assets (Liabilities) 1.5% | | | Short-Term
Investments and
Net Other Assets (Liabilities) 2.6% | |

Annual Report
Fidelity Total Emerging Markets Fund
Investments October 31, 2014
Showing Percentage of Net Assets
Common Stocks - 69.0% |
| Shares | | Value |
Argentina - 0.5% |
Grupo Financiero Galicia SA sponsored ADR | 7,910 | | $ 116,277 |
YPF SA Class D sponsored ADR | 7,637 | | 268,593 |
TOTAL ARGENTINA | | 384,870 |
Austria - 0.2% |
C.A.T. oil AG (Bearer) | 6,531 | | 124,402 |
Bermuda - 1.2% |
Aquarius Platinum Ltd. (Australia) (a) | 440,582 | | 119,908 |
Cosan Ltd. Class A | 11,963 | | 126,688 |
Credicorp Ltd. (United States) | 200 | | 32,200 |
GP Investments Ltd. Class A (depositary receipt) (a) | 76,222 | | 154,111 |
Hoegh LNG Holdings Ltd. (a) | 664 | | 8,565 |
Shangri-La Asia Ltd. | 150,000 | | 217,801 |
Yue Yuen Industrial (Holdings) Ltd. | 95,500 | | 320,592 |
TOTAL BERMUDA | | 979,865 |
Brazil - 2.2% |
BM&F BOVESPA SA | 52,970 | | 233,009 |
BR Properties SA | 27,480 | | 138,847 |
CCR SA | 5,100 | | 37,974 |
Cielo SA | 15,200 | | 249,602 |
Cosan SA Industria e Comercio | 6,639 | | 92,676 |
Fibria Celulose SA (a) | 17,500 | | 211,944 |
Localiza Rent A Car SA | 900 | | 12,974 |
Mills Estruturas e Servicos de Engenharia SA | 3,000 | | 19,553 |
Minerva SA (a) | 61,900 | | 318,506 |
Qualicorp SA (a) | 2,750 | | 27,967 |
Smiles SA | 13,200 | | 228,000 |
T4F Entretenimento SA (a) | 31,500 | | 35,595 |
Ultrapar Participacoes SA | 6,900 | | 150,509 |
TOTAL BRAZIL | | 1,757,156 |
British Virgin Islands - 0.1% |
Mail.Ru Group Ltd. GDR (Reg. S) (a) | 3,251 | | 78,804 |
Canada - 0.6% |
First Quantum Minerals Ltd. | 5,700 | | 85,977 |
Goldcorp, Inc. | 8,700 | | 163,263 |
Pan American Silver Corp. | 14,500 | | 133,835 |
Torex Gold Resources, Inc. (a) | 49,200 | | 52,385 |
TOTAL CANADA | | 435,460 |
Common Stocks - continued |
| Shares | | Value |
Cayman Islands - 5.5% |
58.com, Inc. ADR | 5,950 | | $ 235,442 |
Alibaba Group Holding Ltd. sponsored ADR | 1,100 | | 108,460 |
Anta Sports Products Ltd. | 121,000 | | 237,497 |
China Lodging Group Ltd. ADR (a) | 9,800 | | 269,402 |
China ZhengTong Auto Services Holdings Ltd. | 357,400 | | 202,468 |
Cimc Enric Holdings Ltd. | 132,000 | | 132,740 |
E-House China Holdings Ltd. ADR | 13,460 | | 134,465 |
Eurasia Drilling Co. Ltd. GDR (Reg. S) | 6,534 | | 163,350 |
GCL-Poly Energy Holdings Ltd. (a) | 234,000 | | 78,863 |
Greatview Aseptic Pack Co. Ltd. | 211,000 | | 138,906 |
Haitian International Holdings Ltd. | 59,000 | | 126,560 |
Hengan International Group Co. Ltd. | 28,000 | | 295,141 |
SINA Corp. (a) | 2,801 | | 114,757 |
Tencent Holdings Ltd. | 76,700 | | 1,232,743 |
Tingyi (Cayman Islands) Holding Corp. | 180,000 | | 447,794 |
Uni-President China Holdings Ltd. | 329,600 | | 306,254 |
Xueda Education Group sponsored ADR | 8,700 | | 24,447 |
Yingde Gases Group Co. Ltd. | 134,500 | | 105,023 |
TOTAL CAYMAN ISLANDS | | 4,354,312 |
Chile - 0.7% |
Embotelladora Andina SA ADR | 1,700 | | 26,350 |
Empresa Nacional de Electricidad SA | 75,303 | | 117,256 |
Inversiones La Construccion SA | 14,226 | | 202,727 |
Vina Concha y Toro SA | 120,325 | | 230,061 |
TOTAL CHILE | | 576,394 |
China - 5.9% |
Anhui Conch Cement Co. Ltd. (H Shares) | 46,000 | | 150,644 |
BBMG Corp. (H Shares) | 265,000 | | 187,385 |
China Life Insurance Co. Ltd. (H Shares) | 232,170 | | 692,789 |
China Pacific Insurance Group Co. Ltd. (H Shares) | 140,400 | | 525,399 |
China Shenhua Energy Co. Ltd. (H Shares) | 83,000 | | 233,939 |
China Suntien Green Energy Corp. Ltd. (H Shares) | 358,350 | | 95,179 |
China Telecom Corp. Ltd. (H Shares) | 788,357 | | 502,542 |
Industrial & Commercial Bank of China Ltd. (H Shares) | 1,324,500 | | 879,415 |
Maanshan Iron & Steel Ltd. (H Shares) (a) | 778,000 | | 202,861 |
PetroChina Co. Ltd.: | | | |
(H Shares) | 460,000 | | 575,894 |
sponsored ADR | 500 | | 62,750 |
Common Stocks - continued |
| Shares | | Value |
China - continued |
PICC Property & Casualty Co. Ltd. (H Shares) | 269,500 | | $ 494,381 |
Sinopec Engineering Group Co. Ltd. (H Shares) (d) | 88,500 | | 85,595 |
TOTAL CHINA | | 4,688,773 |
Colombia - 0.5% |
BanColombia SA sponsored ADR | 7,141 | | 403,966 |
Denmark - 0.0% |
Auriga Industries A/S Series B (a) | 681 | | 35,142 |
Egypt - 0.2% |
Citadel Capital Corp. (a) | 307,200 | | 170,140 |
Greece - 0.4% |
National Bank of Greece SA (a) | 79,160 | | 190,942 |
Public Power Corp. of Greece (a) | 12,794 | | 97,159 |
TOTAL GREECE | | 288,101 |
Hong Kong - 2.5% |
China Power International Development Ltd. | 321,600 | | 145,274 |
China Resources Power Holdings Co. Ltd. | 64,535 | | 187,838 |
China Unicom Ltd. | 147,400 | | 221,471 |
CNOOC Ltd. | 322,000 | | 504,216 |
CNOOC Ltd. sponsored ADR | 400 | | 62,548 |
Far East Horizon Ltd. | 255,000 | | 237,165 |
Lenovo Group Ltd. | 162,000 | | 238,789 |
Sinotruk Hong Kong Ltd. | 227,000 | | 117,664 |
Techtronic Industries Co. Ltd. | 97,000 | | 303,668 |
TOTAL HONG KONG | | 2,018,633 |
India - 8.5% |
Adani Ports & Special Economic Zone | 53,689 | | 249,554 |
Axis Bank Ltd. (a) | 103,278 | | 761,183 |
Bharti Airtel Ltd. (a) | 49,801 | | 323,605 |
Bharti Infratel Ltd. | 81,123 | | 388,777 |
Coal India Ltd. | 69,344 | | 418,138 |
Eicher Motors Ltd. | 1,733 | | 359,959 |
GAIL India Ltd. | 25,361 | | 217,976 |
Grasim Industries Ltd. | 4,012 | | 240,753 |
HCL Technologies Ltd. | 4,819 | | 126,384 |
Infosys Ltd. | 8,364 | | 554,409 |
ITC Ltd. (a) | 75,310 | | 435,436 |
JK Cement Ltd. | 17,887 | | 175,695 |
Larsen & Toubro Ltd. (a) | 7,434 | | 200,341 |
LIC Housing Finance Ltd. | 29,517 | | 173,818 |
Common Stocks - continued |
| Shares | | Value |
India - continued |
Lupin Ltd. | 14,411 | | $ 333,663 |
Petronet LNG Ltd. (a) | 71,884 | | 233,384 |
Phoenix Mills Ltd. | 40,098 | | 252,445 |
Power Grid Corp. of India Ltd. | 57,775 | | 137,082 |
SREI Infrastructure Finance Ltd. | 313,747 | | 242,544 |
State Bank of India | 4,956 | | 218,096 |
Tata Consultancy Services Ltd. | 7,001 | | 297,875 |
Wipro Ltd. | 14,659 | | 135,407 |
Yes Bank Ltd. | 26,641 | | 301,674 |
TOTAL INDIA | | 6,778,198 |
Indonesia - 1.1% |
PT AKR Corporindo Tbk | 171,200 | | 69,750 |
PT Bakrieland Development Tbk (a) | 17,571,300 | | 73,717 |
PT Bank Rakyat Indonesia Tbk | 574,900 | | 526,836 |
PT Kalbe Farma Tbk | 1,651,600 | | 233,194 |
TOTAL INDONESIA | | 903,497 |
Israel - 0.4% |
Bezeq The Israel Telecommunication Corp. Ltd. | 192,650 | | 325,692 |
Kenya - 0.2% |
Equity Bank Ltd. (a) | 311,500 | | 177,602 |
Korea (South) - 12.0% |
AMOREPACIFIC Group, Inc. | 385 | | 423,898 |
Daewoo International Corp. | 25,428 | | 801,100 |
E-Mart Co. Ltd. | 1,898 | | 349,766 |
Fila Korea Ltd. | 2,076 | | 215,436 |
Hana Financial Group, Inc. | 14,815 | | 510,864 |
Hankook Shell Oil Co. Ltd. | 149 | | 67,813 |
Hyundai Industrial Development & Construction Co. | 8,576 | | 322,065 |
Hyundai Mobis | 2,545 | | 592,166 |
KB Financial Group, Inc. | 13,310 | | 518,974 |
KEPCO Plant Service & Engineering Co. Ltd. | 1,557 | | 127,088 |
Korea Electric Power Corp. | 4,800 | | 209,579 |
Korea Zinc Co. Ltd. | 492 | | 184,309 |
Korean Reinsurance Co. | 32,699 | | 346,941 |
LG Chemical Ltd. | 1,204 | | 224,116 |
LG Corp. | 3,739 | | 221,324 |
NAVER Corp. | 439 | | 308,072 |
POSCO | 927 | | 266,328 |
Samsung C&T Corp. | 4,609 | | 310,142 |
Samsung Electronics Co. Ltd. | 1,995 | | 2,309,819 |
Common Stocks - continued |
| Shares | | Value |
Korea (South) - continued |
Shinhan Financial Group Co. Ltd. | 14,859 | | $ 695,622 |
SK Hynix, Inc. (a) | 8,762 | | 386,950 |
SK Telecom Co. Ltd. sponsored ADR | 5,006 | | 139,117 |
TOTAL KOREA (SOUTH) | | 9,531,489 |
Luxembourg - 0.5% |
Globant SA (a) | 4,840 | | 62,630 |
Tenaris SA sponsored ADR | 8,800 | | 348,832 |
TOTAL LUXEMBOURG | | 411,462 |
Mexico - 4.9% |
America Movil S.A.B. de CV Series L sponsored ADR | 29,973 | | 731,641 |
Banregio Grupo Financiero S.A.B. de CV | 18,969 | | 109,704 |
CEMEX S.A.B. de CV sponsored ADR | 25,808 | | 317,438 |
El Puerto de Liverpool S.A.B. de CV Class C | 21,400 | | 251,071 |
Fomento Economico Mexicano S.A.B. de CV sponsored ADR | 3,950 | | 380,148 |
Grupo Aeroportuario del Pacifico SA de CV Series B | 28,000 | | 190,503 |
Grupo Aeroportuario Norte S.A.B. de CV | 19,700 | | 98,147 |
Grupo Comercial Chedraui S.A.B. de CV | 83,376 | | 293,290 |
Grupo Financiero Banorte S.A.B. de CV Series O | 49,560 | | 317,942 |
Grupo Televisa SA de CV (CPO) sponsored ADR | 23,900 | | 863,746 |
Macquarie Mexican (REIT) | 165,870 | | 301,285 |
TOTAL MEXICO | | 3,854,915 |
Nigeria - 1.3% |
Guaranty Trust Bank PLC | 556,759 | | 84,026 |
Guaranty Trust Bank PLC GDR (Reg. S) | 37,730 | | 290,521 |
Transnational Corp. of Nigeria PLC | 3,207,008 | | 78,215 |
Zenith Bank PLC | 4,383,603 | | 561,017 |
TOTAL NIGERIA | | 1,013,779 |
Panama - 0.2% |
Copa Holdings SA Class A | 1,200 | | 140,304 |
Philippines - 1.9% |
Alliance Global Group, Inc. | 513,700 | | 288,935 |
LT Group, Inc. | 436,400 | | 138,151 |
Metropolitan Bank & Trust Co. | 215,484 | | 395,376 |
PNOC Energy Development Corp. | 644,500 | | 110,343 |
Robinsons Land Corp. | 980,100 | | 535,075 |
TOTAL PHILIPPINES | | 1,467,880 |
Common Stocks - continued |
| Shares | | Value |
Poland - 0.6% |
Cyfrowy Polsat SA | 35,000 | | $ 267,697 |
Powszechny Zaklad Ubezpieczen SA | 1,598 | | 239,513 |
TOTAL POLAND | | 507,210 |
Puerto Rico - 0.1% |
Popular, Inc. (a) | 3,430 | | 109,348 |
Romania - 0.0% |
SNGN Romgaz SA GDR (d) | 1,769 | | 16,682 |
Russia - 2.2% |
Bashneft OJSC rights (a) | 150 | | 0 |
E.ON Russia JSC (a) | 2,321,800 | | 134,902 |
LUKOIL Oil Co. sponsored ADR (United Kingdom) | 8,700 | | 427,170 |
Mobile TeleSystems OJSC (a) | 29,411 | | 174,373 |
NOVATEK OAO GDR (Reg. S) | 4,100 | | 440,340 |
Sberbank (Savings Bank of the Russian Federation) (a) | 289,250 | | 512,658 |
TMK OAO GDR (Reg. S) | 11,400 | | 89,262 |
TOTAL RUSSIA | | 1,778,705 |
Singapore - 0.6% |
Ezion Holdings Ltd. | 83,040 | | 97,787 |
First Resources Ltd. | 213,000 | | 345,078 |
TOTAL SINGAPORE | | 442,865 |
South Africa - 4.6% |
Alexander Forbes Group Holding (a) | 137,755 | | 107,409 |
Aspen Pharmacare Holdings Ltd. | 14,338 | | 511,448 |
Barclays Africa Group Ltd. | 17,953 | | 283,478 |
Bidvest Group Ltd. | 11,856 | | 326,096 |
Blue Label Telecoms Ltd. | 134,400 | | 118,806 |
Impala Platinum Holdings Ltd. (a) | 22,700 | | 165,242 |
JSE Ltd. | 16,790 | | 163,489 |
Life Healthcare Group Holdings Ltd. | 65,700 | | 248,391 |
MTN Group Ltd. | 30,427 | | 673,106 |
Naspers Ltd. Class N | 8,300 | | 1,032,926 |
TOTAL SOUTH AFRICA | | 3,630,391 |
Taiwan - 6.3% |
Catcher Technology Co. Ltd. | 23,000 | | 193,857 |
Cathay Financial Holding Co. Ltd. | 50,600 | | 83,277 |
E.SUN Financial Holdings Co. Ltd. | 270,697 | | 171,188 |
Hon Hai Precision Industry Co. Ltd. (Foxconn) | 255,624 | | 807,788 |
Inotera Memories, Inc. (a) | 95,000 | | 146,591 |
Common Stocks - continued |
| Shares | | Value |
Taiwan - continued |
King's Town Bank | 33,000 | | $ 36,035 |
Largan Precision Co. Ltd. | 3,000 | | 210,419 |
MediaTek, Inc. | 29,000 | | 413,560 |
Pegatron Corp. | 76,000 | | 138,294 |
Radiant Opto-Electronics Corp. | 30,000 | | 104,666 |
Taiwan Fertilizer Co. Ltd. | 122,000 | | 216,104 |
Taiwan Semiconductor Manufacturing Co. Ltd. | 380,000 | | 1,644,683 |
Taiwan Semiconductor Manufacturing Co. Ltd. sponsored ADR | 5,442 | | 119,833 |
Unified-President Enterprises Corp. | 295,243 | | 506,876 |
Universal Cement Corp. | 109,740 | | 96,452 |
Vanguard International Semiconductor Corp. | 69,000 | | 103,502 |
Voltronic Power Technology Corp. | 50 | | 403 |
TOTAL TAIWAN | | 4,993,528 |
Thailand - 1.0% |
Intouch Holdings PCL NVDR | 80,300 | | 182,306 |
Kasikornbank PCL (For. Reg.) | 57,860 | | 419,066 |
Thai Union Frozen Products PCL (For. Reg.) | 94,100 | | 215,163 |
TOTAL THAILAND | | 816,535 |
Turkey - 1.5% |
Aksa Akrilik Kimya Sanayii | 3,000 | | 9,867 |
Aselsan A/S | 25,000 | | 113,603 |
Aygaz A/S | 21,647 | | 91,257 |
Tupras Turkiye Petrol Rafinelleri A/S | 12,200 | | 264,842 |
Turkcell Iletisim Hizmet A/S (a) | 5,240 | | 30,462 |
Turkcell Iletisim Hizmet A/S sponsored ADR (a) | 14,440 | | 211,257 |
Turkiye Garanti Bankasi A/S | 81,250 | | 317,110 |
Turkiye Halk Bankasi A/S | 26,240 | | 175,315 |
TOTAL TURKEY | | 1,213,713 |
United Arab Emirates - 0.4% |
DP World Ltd. | 6,124 | | 117,336 |
First Gulf Bank PJSC | 41,207 | | 203,623 |
TOTAL UNITED ARAB EMIRATES | | 320,959 |
United Kingdom - 0.0% |
China Pacific Insurance Group Co. Ltd. (UBS Warrant Programme) warrants ELS 6/29/15 (a)(d) | 8,100 | | 26,833 |
United States of America - 0.2% |
Cognizant Technology Solutions Corp. Class A (a) | 3,020 | | 147,527 |
TOTAL COMMON STOCKS (Cost $47,476,311) |
54,905,132
|
Nonconvertible Preferred Stocks - 6.5% |
| Shares | | Value |
Brazil - 4.7% |
Ambev SA sponsored ADR | 49,000 | | $ 327,320 |
Banco do Estado Rio Grande do Sul SA | 59,130 | | 353,172 |
Braskem SA (PN-A) | 30,500 | | 223,159 |
Companhia Paranaense de Energia-Copel: | | | |
(PN-B) | 815 | | 11,383 |
(PN-B) sponsored | 6,811 | | 96,035 |
Gerdau SA sponsored ADR | 51,211 | | 231,986 |
Itau Unibanco Holding SA sponsored ADR | 57,978 | | 855,755 |
Marcopolo SA (PN) | 85,100 | | 145,617 |
Petroleo Brasileiro SA - Petrobras: | | | |
(PN) sponsored (non-vtg.) | 2,806 | | 34,317 |
sponsored ADR | 51,921 | | 607,476 |
TIM Participacoes SA sponsored ADR | 6,104 | | 167,982 |
Vale SA (PN-A) sponsored ADR | 78,100 | | 684,156 |
TOTAL BRAZIL | | 3,738,358 |
Chile - 0.1% |
Embotelladora Andina SA Class A | 38,679 | | 99,148 |
Korea (South) - 1.5% |
Hyundai Motor Co. Series 2 | 3,017 | | 359,419 |
Samsung Electronics Co. Ltd. | 446 | | 408,872 |
Samsung Fire & Marine Insurance Co. Ltd. | 2,070 | | 390,132 |
TOTAL KOREA (SOUTH) | | 1,158,423 |
Russia - 0.2% |
Surgutneftegas (a) | 292,550 | | 200,621 |
TOTAL NONCONVERTIBLE PREFERRED STOCKS (Cost $5,815,014) |
5,196,550
|
Nonconvertible Bonds - 4.2% |
| Principal Amount | | |
Azerbaijan - 0.3% |
International Bank of Azerbaijan OJSC 5.625% 6/11/19 (Reg. S) | | $ 200,000 | | 198,200 |
Georgia - 0.4% |
Georgia Bank Joint Stock Co. 7.75% 7/5/17 (d) | | 300,000 | | 317,481 |
Indonesia - 0.2% |
PT Pertamina Persero 5.625% 5/20/43 (d) | | 200,000 | | 191,500 |
Nonconvertible Bonds - continued |
| Principal Amount | | Value |
Ireland - 0.1% |
Vnesheconombank Via VEB Finance PLC 6.8% 11/22/25 (d) | | $ 100,000 | | $ 98,875 |
Kazakhstan - 0.4% |
KazMunaiGaz National Co. 5.75% 4/30/43 (d) | | 300,000 | | 291,750 |
Luxembourg - 0.6% |
RSHB Capital SA: | | | | |
5.1% 7/25/18 (d) | | 400,000 | | 383,020 |
6.299% 5/15/17 (Reg. S) | | 100,000 | | 100,250 |
TOTAL LUXEMBOURG | | 483,270 |
Mexico - 0.3% |
Petroleos Mexicanos 6.375% 1/23/45 | | 175,000 | | 200,795 |
Netherlands - 0.4% |
Indosat Palapa Co. BV 7.375% 7/29/20 (d) | | 100,000 | | 106,250 |
Mozambique Ematum Finance 2020 6.305% 9/11/20 (Reg. S) | | 200,000 | | 199,750 |
TOTAL NETHERLANDS | | 306,000 |
Trinidad & Tobago - 0.2% |
Petroleum Co. of Trinidad & Tobago Ltd. 9.75% 8/14/19 (d) | | 150,000 | | 187,500 |
Venezuela - 1.3% |
Petroleos de Venezuela SA: | | | | |
5.5% 4/12/37 | | 500,000 | | 232,500 |
6% 11/15/26 (Reg. S) | | 700,000 | | 342,300 |
8.5% 11/2/17 (d) | | 250,000 | | 189,350 |
9% 11/17/21 (Reg. S) | | 150,000 | | 95,063 |
9.75% 5/17/35 (d) | | 300,000 | | 183,150 |
TOTAL VENEZUELA | | 1,042,363 |
TOTAL NONCONVERTIBLE BONDS (Cost $3,390,824) |
3,317,734
|
Government Obligations - 18.8% |
|
Armenia - 0.5% |
Republic of Armenia 6% 9/30/20 (d) | | 400,000 | | 418,000 |
Government Obligations - continued |
| Principal Amount | | Value |
Azerbaijan - 0.7% |
Azerbaijan Republic 4.75% 3/18/24 (d) | | $ 200,000 | | $ 208,250 |
State Oil Co. of Azerbaijan Republic 4.75% 3/13/23 (Reg. S) | | 325,000 | | 322,758 |
TOTAL AZERBAIJAN | | 531,008 |
Barbados - 0.4% |
Barbados Government 7% 8/4/22 (d) | | 350,000 | | 326,375 |
Belarus - 0.4% |
Belarus Republic 8.75% 8/3/15 (Reg. S) | | 325,000 | | 331,565 |
Belize - 0.3% |
Belize Government 5% 2/20/38 (c)(d) | | 332,500 | | 251,038 |
Bolivia - 0.2% |
Plurinational State of Bolivia 4.875% 10/29/22 (d) | | 200,000 | | 205,250 |
Brazil - 0.2% |
Brazilian Federative Republic 5% 1/27/45 | | 200,000 | | 196,000 |
Colombia - 0.3% |
Colombian Republic 11.75% 2/25/20 | | 150,000 | | 213,375 |
Congo - 0.3% |
Congo Republic 3.5% 6/30/29 (c) | | 312,550 | | 285,564 |
Costa Rica - 0.3% |
Costa Rican Republic 7% 4/4/44 (d) | | 200,000 | | 206,500 |
Croatia - 0.3% |
Croatia Republic 6% 1/26/24 (d) | | 250,000 | | 270,313 |
Dominican Republic - 0.5% |
Dominican Republic: | | | | |
5.875% 4/18/24 (d) | | 150,000 | | 158,250 |
7.45% 4/30/44 (d) | | 200,000 | | 223,500 |
TOTAL DOMINICAN REPUBLIC | | 381,750 |
El Salvador - 0.5% |
El Salvador Republic: | | | | |
6.375% 1/18/27 (d) | | 200,000 | | 205,000 |
7.625% 2/1/41 (d) | | 150,000 | | 162,000 |
TOTAL EL SALVADOR | | 367,000 |
Gabon - 0.3% |
Gabonese Republic 6.375% 12/12/24 (d) | | 200,000 | | 212,000 |
Georgia - 0.3% |
Georgia Republic 6.875% 4/12/21 (d) | | 200,000 | | 225,540 |
Government Obligations - continued |
| Principal Amount | | Value |
Ghana - 0.5% |
Ghana Republic: | | | | |
7.875% 8/7/23 (Reg.S) | | $ 200,000 | | $ 201,300 |
8.125% 1/18/26 (d) | | 200,000 | | 201,000 |
TOTAL GHANA | | 402,300 |
Guatemala - 0.2% |
Guatemalan Republic 4.875% 2/13/28 (d) | | 200,000 | | 204,500 |
Hungary - 0.6% |
Hungarian Republic 7.625% 3/29/41 | | 350,000 | | 452,375 |
Indonesia - 0.9% |
Indonesian Republic: | | | | |
5.875% 1/15/24 (d) | | 400,000 | | 455,000 |
6.75% 1/15/44 (d) | | 200,000 | | 245,250 |
TOTAL INDONESIA | | 700,250 |
Ivory Coast - 0.6% |
Ivory Coast: | | | | |
5.375% 7/23/24 (d) | | 200,000 | | 191,500 |
7.7743% 12/31/32 | | 275,000 | | 265,430 |
TOTAL IVORY COAST | | 456,930 |
Jamaica - 0.2% |
Jamaican Government 8% 6/24/19 | | 150,000 | | 162,000 |
Jordan - 0.4% |
Jordanian Kingdom 3.875% 11/12/15 | | 300,000 | | 303,450 |
Kenya - 0.3% |
Republic of Kenya 6.875% 6/24/24 (d) | | 200,000 | | 213,000 |
Lebanon - 0.3% |
Lebanese Republic 11.625% 5/11/16 (Reg. S) | | 250,000 | | 278,750 |
Mexico - 0.7% |
United Mexican States 5.75% 10/12/2110 | | 500,000 | | 529,418 |
Mongolia - 0.2% |
Mongolian People's Republic 5.125% 12/5/22 (Reg. S) | | 200,000 | | 178,000 |
Morocco - 0.2% |
Moroccan Kingdom 5.5% 12/11/42 (d) | | 200,000 | | 203,500 |
Namibia - 0.3% |
Republic of Namibia 5.5% 11/3/21 (d) | | 200,000 | | 216,000 |
Netherlands - 0.3% |
Republic of Angola 7% 8/16/19 (Issued by Northern Lights III BV for Republic of Angola) (Reg. S) | | 250,000 | | 267,188 |
Government Obligations - continued |
| Principal Amount | | Value |
Nigeria - 0.3% |
Republic of Nigeria 6.375% 7/12/23 | | $ 200,000 | | $ 212,000 |
Pakistan - 0.3% |
Islamic Republic of Pakistan 7.25% 4/15/19 (d) | | 200,000 | | 206,500 |
Panama - 0.2% |
Panamanian Republic 4.3% 4/29/53 | | 200,000 | | 180,000 |
Philippines - 0.5% |
Philippine Republic: | | | | |
9.5% 2/2/30 | | 150,000 | | 239,438 |
10.625% 3/16/25 | | 100,000 | | 158,250 |
TOTAL PHILIPPINES | | 397,688 |
Romania - 0.3% |
Romanian Republic 6.125% 1/22/44 (d) | | 200,000 | | 234,250 |
Russia - 1.6% |
Russian Federation: | | | | |
4.875% 9/16/23 (d) | | 200,000 | | 200,290 |
5.625% 4/4/42 (d) | | 200,000 | | 201,834 |
5.875% 9/16/43 (d) | | 200,000 | | 209,000 |
7.5% 3/31/30 (Reg. S) | | 245,625 | | 278,659 |
12.75% 6/24/28 (Reg. S) | | 225,000 | | 370,733 |
TOTAL RUSSIA | | 1,260,516 |
Senegal - 0.3% |
Republic of Senegal 8.75% 5/13/21 (d) | | 200,000 | | 229,000 |
Serbia - 0.4% |
Republic of Serbia 7.25% 9/28/21 (d) | | 260,000 | | 298,870 |
Sri Lanka - 0.4% |
Democratic Socialist Republic of Sri Lanka 6.25% 10/4/20 (d) | | 300,000 | | 319,500 |
Tanzania - 0.3% |
United Republic of Tanzania 6.3289% 3/9/20 (f) | | 200,000 | | 216,250 |
Turkey - 1.1% |
Turkish Republic: | | | | |
6.625% 2/17/45 | | 200,000 | | 239,560 |
7.375% 2/5/25 | | 300,000 | | 370,785 |
11.875% 1/15/30 | | 165,000 | | 287,925 |
TOTAL TURKEY | | 898,270 |
Government Obligations - continued |
| Principal Amount | | Value |
Ukraine - 0.5% |
Ukraine Government: | | | | |
6.58% 11/21/16 (d) | | $ 250,000 | | $ 220,050 |
6.75% 11/14/17 (d) | | 200,000 | | 174,500 |
TOTAL UKRAINE | | 394,550 |
United States of America - 0.1% |
U.S. Treasury Bills, yield at date of purchase 0.01% to 0.02% 12/11/14 to 12/18/14 (e) | | 80,000 | | 79,999 |
Venezuela - 0.8% |
Venezuelan Republic: | | | | |
7% 3/31/38 | | 650,000 | | 373,750 |
8.25% 10/13/24 | | 300,000 | | 181,200 |
9% 5/7/23 (Reg. S) | | 100,000 | | 64,250 |
TOTAL VENEZUELA | | 619,200 |
Vietnam - 0.3% |
Vietnamese Socialist Republic 6.75% 1/29/20 (d) | | 200,000 | | 224,000 |
Zambia - 0.2% |
Republic of Zambia 5.375% 9/20/22 (d) | | 200,000 | | 191,420 |
TOTAL GOVERNMENT OBLIGATIONS (Cost $14,511,051) |
14,950,952
|
Money Market Funds - 1.6% |
| Shares | | |
Fidelity Cash Central Fund, 0.11% (b)
(Cost $1,289,861) | 1,289,861 | |
1,289,861
|
TOTAL INVESTMENT PORTFOLIO - 100.1% (Cost $72,483,061) | | 79,660,229 |
NET OTHER ASSETS (LIABILITIES) - (0.1)% | | (116,546) |
NET ASSETS - 100% | $ 79,543,683 |
Futures Contracts |
| Expiration Date | | Underlying Face Amount at Value | | Unrealized
Appreciation/
(Depreciation) |
Purchased |
Equity Index Contracts |
2 NYSE E-mini MSCI EAFE Index Contracts (United States) | Dec. 2014 | | $ 101,360 | | $ 134 |
|
The face value of futures purchased as a percentage of net assets is 0.1% |
Security Type Abbreviations |
ELS | - | Equity-Linked Security |
Legend |
(a) Non-income producing |
(b) Affiliated fund that is generally available only to investment companies and other accounts managed by Fidelity Investments. The rate quoted is the annualized seven-day yield of the fund at period end. A complete unaudited listing of the fund's holdings as of its most recent quarter end is available upon request. In addition, each Fidelity Central Fund's financial statements, which are not covered by the Fund's Report of Independent Registered Public Accounting Firm, are available on the SEC's website or upon request. |
(c) Security initially issued at one coupon which converts to a higher coupon at a specified date. The rate shown is the rate at period end. |
(d) Security exempt from registration under Rule 144A of the Securities Act of 1933. These securities may be resold in transactions exempt from registration, normally to qualified institutional buyers. At the end of the period, the value of these securities amounted to $9,788,966 or 12.3% of net assets. |
(e) Security or a portion of the security was pledged to cover margin requirements for futures contracts. At period end, the value of securities pledged amounted to $10,000. |
(f) Coupon rates for floating and adjustable rate securities reflect the rates in effect at period end. |
Affiliated Central Funds |
Information regarding fiscal year to date income earned by the Fund from investments in Fidelity Central Funds is as follows: |
Fund | Income earned |
Fidelity Cash Central Fund | $ 1,867 |
Fidelity Securities Lending Cash Central Fund | 202 |
Total | $ 2,069 |
Other Information |
Categorizations in the Schedule of Investments are based on country or territory of incorporation. |
The following is a summary of the inputs used, as of October 31, 2014, involving the Fund's assets and liabilities carried at fair value. The inputs or methodology used for valuing securities may not be an indication of the risk associated with investing in those securities. For more information on valuation inputs, and their aggregation into the levels used in the table below, please refer to the Investment Valuation section in the accompanying Notes to Financial Statements. |
Valuation Inputs at Reporting Date: |
Description | Total | Level 1 | Level 2 | Level 3 |
Investments in Securities: | | | | |
Equities: | | | | |
Consumer Discretionary | $ 5,431,798 | $ 4,149,772 | $ 1,282,026 | $ - |
Consumer Staples | 5,138,380 | 2,448,487 | 2,689,893 | - |
Energy | 5,715,973 | 3,557,436 | 2,158,537 | - |
Financials | 16,526,711 | 8,453,373 | 8,073,338 | - |
Health Care | 1,354,663 | 787,806 | 566,857 | - |
Industrials | 4,734,133 | 3,102,632 | 1,631,501 | - |
Information Technology | 10,958,598 | 4,530,768 | 6,427,830 | - |
Materials | 4,613,011 | 2,712,952 | 1,900,059 | - |
Telecommunication Services | 4,072,331 | 2,423,168 | 1,649,163 | - |
Utilities | 1,556,084 | 547,992 | 1,008,092 | - |
Corporate Bonds | 3,317,734 | - | 3,317,734 | - |
Government Obligations | 14,950,952 | - | 14,950,952 | - |
Money Market Funds | 1,289,861 | 1,289,861 | - | - |
Total Investments in Securities: | $ 79,660,229 | $ 34,004,247 | $ 45,655,982 | $ - |
Derivative Instruments: | | | | |
Assets | | | | |
Futures Contracts | $ 134 | $ 134 | $ - | $ - |
The following is a summary of transfers between Level 1 and Level 2 for the period ended October 31, 2014. Transfers are assumed to have occurred at the beginning of the period, and are primarily attributable to the valuation techniques used for foreign equity securities, as discussed in the accompanying Notes to Financial Statements: |
Transfers | Total |
Level 1 to Level 2 | $ 14,745,499 |
Level 2 to Level 1 | $ 0 |
Value of Derivative Instruments |
The following table is a summary of the Fund's value of derivative instruments by primary risk exposure as of October 31, 2014. For additional information on derivative instruments, please refer to the Derivative Instruments section in the accompanying Notes to Financial Statements. |
Primary Risk Exposure /
Derivative Type | Value |
| Asset | Liability |
Equity Risk | | |
Futures Contracts (a) | $ 134 | $ - |
Total Value of Derivatives | $ 134 | $ - |
(a) Reflects gross cumulative appreciation (depreciation) on futures contracts as presented in the Schedule of Investments. Only the period end receivable or payable for daily variation margin and net unrealized appreciation (depreciation) are presented in the Statement of Assets and Liabilities. |
Other Information |
The composition of credit quality ratings as a percentage of net assets is as follows (Unaudited): |
AAA,AA,A | 1.0% |
BBB | 6.8% |
BB | 6.0% |
B | 4.8% |
CCC,CC,C | 3.4% |
Not Rated | 0.9% |
Equities | 75.5% |
Short-Term Investments and Net Other Assets | 1.6% |
| 100.0% |
We have used ratings from Moody's Investors Service, Inc. Where Moody's® ratings are not available, we have used S&P® ratings. All ratings are as of the date indicated and do not reflect subsequent changes. |
See accompanying notes which are an integral part of the financial statements.
Annual Report
Fidelity Total Emerging Markets Fund
Statement of Assets and Liabilities
| October 31, 2014 |
| | |
Assets | | |
Investment in securities, at value - See accompanying schedule: Unaffiliated issuers (cost $71,193,200) | $ 78,370,368 | |
Fidelity Central Funds (cost $1,289,861) | 1,289,861 | |
Total Investments (cost $72,483,061) | | $ 79,660,229 |
Cash | | 438,649 |
Foreign currency held at value (cost $102,812) | | 102,789 |
Receivable for investments sold | | 860,000 |
Receivable for fund shares sold | | 33,205 |
Dividends receivable | | 67,683 |
Interest receivable | | 309,501 |
Distributions receivable from Fidelity Central Funds | | 102 |
Receivable for daily variation margin for derivative instruments | | 134 |
Prepaid expenses | | 165 |
Receivable from investment adviser for expense reductions | | 56,666 |
Other receivables | | 23,555 |
Total assets | | 81,552,678 |
| | |
Liabilities | | |
Payable for investments purchased | $ 1,640,340 | |
Payable for fund shares redeemed | 4,963 | |
Accrued management fee | 52,153 | |
Distribution and service plan fees payable | 13,150 | |
Other affiliated payables | 21,763 | |
Other payables and accrued expenses | 276,626 | |
Total liabilities | | 2,008,995 |
| | |
Net Assets | | $ 79,543,683 |
Net Assets consist of: | | |
Paid in capital | | $ 71,679,847 |
Undistributed net investment income | | 1,150,725 |
Accumulated undistributed net realized gain (loss) on investments and foreign currency transactions | | (362,249) |
Net unrealized appreciation (depreciation) on investments and assets and liabilities in foreign currencies | | 7,075,360 |
Net Assets | | $ 79,543,683 |
See accompanying notes which are an integral part of the financial statements.
Annual Report
Statement of Assets and Liabilities - continued
| October 31, 2014 |
| | |
Calculation of Maximum Offering Price Class A:
Net Asset Value and redemption price per share ($13,627,168 ÷ 1,179,223 shares) | | $ 11.56 |
| | |
Maximum offering price per share (100/94.25 of $11.56) | | $ 12.27 |
Class T:
Net Asset Value and redemption price per share ($5,276,506 ÷ 457,380 shares) | | $ 11.54 |
| | |
Maximum offering price per share (100/96.50 of $11.54) | | $ 11.96 |
Class C:
Net Asset Value and offering price per share ($10,103,945 ÷ 881,138 shares)A | | $ 11.47 |
| | |
Total Emerging Markets:
Net Asset Value, offering price and redemption price per share ($45,763,108 ÷ 3,946,439 shares) | | $ 11.60 |
| | |
Institutional Class:
Net Asset Value, offering price and redemption price per share ($4,772,956 ÷ 411,824 shares) | | $ 11.59 |
A Redemption price per share is equal to net asset value less any applicable contingent deferred sales charge.
See accompanying notes which are an integral part of the financial statements.
Annual Report
Fidelity Total Emerging Markets Fund
Financial Statements - continued
Statement of Operations
| Year ended October 31, 2014 |
| | |
Investment Income | | |
Dividends | | $ 1,495,470 |
Interest | | 1,253,596 |
Income from Fidelity Central Funds | | 2,069 |
Income before foreign taxes withheld | | 2,751,135 |
Less foreign taxes withheld | | (173,322) |
Total income | | 2,577,813 |
| | |
Expenses | | |
Management fee | $ 633,325 | |
Transfer agent fees | 176,181 | |
Distribution and service plan fees | 153,365 | |
Accounting and security lending fees | 40,995 | |
Custodian fees and expenses | 355,802 | |
Independent trustees' compensation | 327 | |
Registration fees | 64,678 | |
Audit | 98,715 | |
Legal | 301 | |
Miscellaneous | 3,723 | |
Total expenses before reductions | 1,527,412 | |
Expense reductions | (265,974) | 1,261,438 |
Net investment income (loss) | | 1,316,375 |
Realized and Unrealized Gain (Loss) Net realized gain (loss) on: | | |
Investment securities: | | |
Unaffiliated issuers (net of foreign taxes of $11,196) | 3,174,799 | |
Foreign currency transactions | (75,868) | |
Futures contracts | 42,055 | |
Total net realized gain (loss) | | 3,140,986 |
Change in net unrealized appreciation (depreciation) on: Investment securities (net of increase in deferred foreign taxes of $89,295) | (2,661,136) | |
Assets and liabilities in foreign currencies | (4,394) | |
Futures contracts | 9,141 | |
Total change in net unrealized appreciation (depreciation) | | (2,656,389) |
Net gain (loss) | | 484,597 |
Net increase (decrease) in net assets resulting from operations | | $ 1,800,972 |
See accompanying notes which are an integral part of the financial statements.
Annual Report
Statement of Changes in Net Assets
| Year ended
October 31,
2014 | Year ended
October 31,
2013 |
Increase (Decrease) in Net Assets | | |
Operations | | |
Net investment income (loss) | $ 1,316,375 | $ 1,900,179 |
Net realized gain (loss) | 3,140,986 | (1,878,240) |
Change in net unrealized appreciation (depreciation) | (2,656,389) | 1,872,247 |
Net increase (decrease) in net assets resulting
from operations | 1,800,972 | 1,894,186 |
Distributions to shareholders from net investment income | (1,381,318) | (1,561,667) |
Distributions to shareholders from net realized gain | - | (137,352) |
Total distributions | (1,381,318) | (1,699,019) |
Share transactions - net increase (decrease) | (8,457,450) | (15,755,086) |
Redemption fees | 27,840 | 87,191 |
Total increase (decrease) in net assets | (8,009,956) | (15,472,728) |
| | |
Net Assets | | |
Beginning of period | 87,553,639 | 103,026,367 |
End of period (including undistributed net investment income of $1,150,725 and undistributed net investment income of $1,219,736, respectively) | $ 79,543,683 | $ 87,553,639 |
See accompanying notes which are an integral part of the financial statements.
Annual Report
Financial Highlights - Class A
Years ended October 31, | 2014 | 2013 | 2012 G |
Selected Per-Share Data | | | |
Net asset value, beginning of period | $ 11.37 | $ 10.86 | $ 10.00 |
Income from Investment Operations | | | |
Net investment income (loss) C | .18 | .18 | .20 |
Net realized and unrealized gain (loss) | .19 | .48 F | .68 |
Total from investment operations | .37 | .66 | .88 |
Distributions from net investment income | (.18) | (.15) | (.02) |
Distributions from net realized gain | - | (.01) | - |
Total distributions | (.18) | (.16) | (.02) |
Redemption fees added to paid in capital C | - I | .01 | - I |
Net asset value, end of period | $ 11.56 | $ 11.37 | $ 10.86 |
Total ReturnA, B | 3.30% | 6.23% | 8.80% |
Ratios to Average Net Assets D, H | | | |
Expenses before reductions | 1.98% | 1.89% | 1.87% |
Expenses net of fee waivers, if any | 1.65% | 1.65% | 1.65% |
Expenses net of all reductions | 1.65% | 1.62% | 1.62% |
Net investment income (loss) | 1.61% | 1.61% | 1.92% |
Supplemental Data | | | |
Net assets, end of period (000 omitted) | $ 13,627 | $ 18,837 | $ 7,675 |
Portfolio turnover rate E | 102% | 120% | 70% |
A Total returns would have been lower if certain expenses had not been reduced during the applicable periods shown.
B Total returns do not include the effect of the sales charges.
C Calculated based on average shares outstanding during the period.
D Fees and expenses of any underlying Fidelity Central Funds are not included in the Fund's expense ratio. The Fund indirectly bears its proportionate share of the expenses of any underlying Fidelity Central Funds.
E Amount does not include the portfolio activity of any underlying Fidelity Central Funds.
F The amount shown for a share outstanding does not correspond with the aggregate net gain (loss) on investments for the period due to the timing of sales and repurchases of shares in relation to fluctuating market values of the investments of the Fund.
G For the period November 1, 2011 (commencement of operations) to October 31, 2012.
H Expense ratios reflect operating expenses of the class. Expenses before reductions do not reflect amounts reimbursed by the investment adviser or reductions from brokerage service arrangements or reductions from other expense offset arrangements and do not represent the amount paid by the class during periods when reimbursements or reductions occur. Expense ratios before reductions for start-up periods may not be representative of longer-term operating periods. Expenses net of fee waivers reflect expenses after reimbursement by the investment adviser but prior to reductions from brokerage service arrangements or other expense offset arrangements. Expenses net of all reductions represent the net expenses paid by the class.
I Amount represents less than $.01 per share.
See accompanying notes which are an integral part of the financial statements.
Annual Report
Financial Highlights - Class T
Years ended October 31, | 2014 | 2013 | 2012 G |
Selected Per-Share Data | | | |
Net asset value, beginning of period | $ 11.34 | $ 10.84 | $ 10.00 |
Income from Investment Operations | | | |
Net investment income (loss) C | .15 | .15 | .17 |
Net realized and unrealized gain (loss) | .19 | .48 F | .68 |
Total from investment operations | .34 | .63 | .85 |
Distributions from net investment income | (.14) | (.12) | (.01) |
Distributions from net realized gain | - | (.01) | - |
Total distributions | (.14) | (.14) J | (.01) |
Redemption fees added to paid in capital C | - I | .01 | - I |
Net asset value, end of period | $ 11.54 | $ 11.34 | $ 10.84 |
Total ReturnA, B | 3.04% | 5.93% | 8.56% |
Ratios to Average Net Assets D, H | | | |
Expenses before reductions | 2.32% | 2.13% | 2.10% |
Expenses net of fee waivers, if any | 1.90% | 1.90% | 1.90% |
Expenses net of all reductions | 1.90% | 1.88% | 1.87% |
Net investment income (loss) | 1.36% | 1.36% | 1.67% |
Supplemental Data | | | |
Net assets, end of period (000 omitted) | $ 5,277 | $ 5,967 | $ 5,823 |
Portfolio turnover rateE | 102% | 120% | 70% |
A Total returns would have been lower if certain expenses had not been reduced during the applicable periods shown.
B Total returns do not include the effect of the sales charges.
C Calculated based on average shares outstanding during the period.
D Fees and expenses of any underlying Fidelity Central Funds are not included in the Fund's expense ratio. The Fund indirectly bears its proportionate share of the expenses of any underlying Fidelity Central Funds.
E Amount does not include the portfolio activity of any underlying Fidelity Central Funds.
F The amount shown for a share outstanding does not correspond with the aggregate net gain (loss) on investments for the period due to the timing of sales and repurchases of shares in relation to fluctuating market values of the investments of the Fund.
G For the period November 1, 2011 (commencement of operations) to October 31, 2012.
H Expense ratios reflect operating expenses of the class. Expenses before reductions do not reflect amounts reimbursed by the investment adviser or reductions from brokerage service arrangements or reductions from other expense offset arrangements and do not represent the amount paid by the class during periods when reimbursements or reductions occur. Expense ratios before reductions for start-up periods may not be representative of longer-term operating periods. Expenses net of fee waivers reflect expenses after reimbursement by the investment adviser but prior to reductions from brokerage service arrangements or other expense offset arrangements. Expenses net of all reductions represent the net expenses paid by the class.
I Amount represents less than $.01 per share.
J Total distributions of $.14 per share is comprised of distributions from net investment income of $.124 and distributions from net realized gain of $.014 per share.
See accompanying notes which are an integral part of the financial statements.
Annual Report
Financial Highlights - Class C
Years ended October 31, | 2014 | 2013 | 2012 G |
Selected Per-Share Data | | | |
Net asset value, beginning of period | $ 11.29 | $ 10.80 | $ 10.00 |
Income from Investment Operations | | | |
Net investment income (loss) C | .10 | .09 | .12 |
Net realized and unrealized gain (loss) | .19 | .47 F | .69 |
Total from investment operations | .29 | .56 | .81 |
Distributions from net investment income | (.11) | (.07) | (.01) |
Distributions from net realized gain | - | (.01) | - |
Total distributions | (.11) | (.08) | (.01) |
Redemption fees added to paid in capital C | - I | .01 | - I |
Net asset value, end of period | $ 11.47 | $ 11.29 | $ 10.80 |
Total ReturnA, B | 2.56% | 5.31% | 8.07% |
Ratios to Average Net Assets D, H | | | |
Expenses before reductions | 2.72% | 2.65% | 2.63% |
Expenses net of fee waivers, if any | 2.40% | 2.40% | 2.40% |
Expenses net of all reductions | 2.40% | 2.37% | 2.37% |
Net investment income (loss) | .86% | .86% | 1.17% |
Supplemental Data | | | |
Net assets, end of period (000 omitted) | $ 10,104 | $ 7,436 | $ 5,824 |
Portfolio turnover rateE | 102% | 120% | 70% |
A Total returns would have been lower if certain expenses had not been reduced during the applicable periods shown.
B Total returns do not include the effect of the contingent deferred sales charge.
C Calculated based on average shares outstanding during the period.
D Fees and expenses of any underlying Fidelity Central Funds are not included in the Fund's expense ratio. The Fund indirectly bears its proportionate share of the expenses of any underlying Fidelity Central Funds.
E Amount does not include the portfolio activity of any underlying Fidelity Central Funds.
F The amount shown for a share outstanding does not correspond with the aggregate net gain (loss) on investments for the period due to the timing of sales and repurchases of shares in relation to fluctuating market values of the investments of the Fund.
G For the period November 1, 2011 (commencement of operations) to October 31, 2012.
H Expense ratios reflect operating expenses of the class. Expenses before reductions do not reflect amounts reimbursed by the investment adviser or reductions from brokerage service arrangements or reductions from other expense offset arrangements and do not represent the amount paid by the class during periods when reimbursements or reductions occur. Expense ratios before reductions for start-up periods may not be representative of longer-term operating periods. Expenses net of fee waivers reflect expenses after reimbursement by the investment adviser but prior to reductions from brokerage service arrangements or other expense offset arrangements. Expenses net of all reductions represent the net expenses paid by the class.
I Amount represents less than $.01 per share.
See accompanying notes which are an integral part of the financial statements.
Annual Report
Financial Highlights - Total Emerging Markets
Years ended October 31, | 2014 | 2013 | 2012 F |
Selected Per-Share Data | | | |
Net asset value, beginning of period | $ 11.40 | $ 10.89 | $ 10.00 |
Income from Investment Operations | | | |
Net investment income (loss) B | .21 | .21 | .22 |
Net realized and unrealized gain (loss) | .19 | .47 E | .69 |
Total from investment operations | .40 | .68 | .91 |
Distributions from net investment income | (.20) | (.17) | (.02) |
Distributions from net realized gain | - | (.01) | - |
Total distributions | (.20) | (.18) | (.02) |
Redemption fees added to paid in capital B | - H | .01 | - H |
Net asset value, end of period | $ 11.60 | $ 11.40 | $ 10.89 |
Total ReturnA | 3.56% | 6.44% | 9.15% |
Ratios to Average Net Assets C, G | | | |
Expenses before reductions | 1.73% | 1.56% | 1.60% |
Expenses net of fee waivers, if any | 1.40% | 1.40% | 1.40% |
Expenses net of all reductions | 1.40% | 1.38% | 1.38% |
Net investment income (loss) | 1.86% | 1.85% | 2.16% |
Supplemental Data | | | |
Net assets, end of period (000 omitted) | $ 45,763 | $ 49,959 | $ 81,416 |
Portfolio turnover rateD | 102% | 120% | 70% |
A Total returns would have been lower if certain expenses had not been reduced during the applicable periods shown.
B Calculated based on average shares outstanding during the period.
C Fees and expenses of any underlying Fidelity Central Funds are not included in the Fund's expense ratio. The Fund indirectly bears its proportionate share of the expenses of any underlying Fidelity Central Funds.
D Amount does not include the portfolio activity of any underlying Fidelity Central Funds.
E The amount shown for a share outstanding does not correspond with the aggregate net gain (loss) on investments for the period due to the timing of sales and repurchases of shares in relation to fluctuating market values of the investments of the Fund.
F For the period November 1, 2011 (commencement of operations) to October 31, 2012.
G Expense ratios reflect operating expenses of the class. Expenses before reductions do not reflect amounts reimbursed by the investment adviser or reductions from brokerage service arrangements or reductions from other expense offset arrangements and do not represent the amount paid by the class during periods when reimbursements or reductions occur. Expense ratios before reductions for start-up periods may not be representative of longer-term operating periods. Expenses net of fee waivers reflect expenses after reimbursement by the investment adviser but prior to reductions from brokerage service arrangements or other expense offset arrangements. Expenses net of all reductions represent the net expenses paid by the class.
H Amount represents less than $.01 per share.
See accompanying notes which are an integral part of the financial statements.
Annual Report
Financial Highlights - Institutional Class
Years ended October 31, | 2014 | 2013 | 2012 F |
Selected Per-Share Data | | | |
Net asset value, beginning of period | $ 11.40 | $ 10.89 | $ 10.00 |
Income from Investment Operations | | | |
Net investment income (loss) B | .21 | .20 | .22 |
Net realized and unrealized gain (loss) | .18 | .48 E | .69 |
Total from investment operations | .39 | .68 | .91 |
Distributions from net investment income | (.20) | (.17) | (.02) |
Distributions from net realized gain | - | (.01) | - |
Total distributions | (.20) | (.18) | (.02) |
Redemption fees added to paid in capital B | - H | .01 | - H |
Net asset value, end of period | $ 11.59 | $ 11.40 | $ 10.89 |
Total ReturnA | 3.51% | 6.44% | 9.15% |
Ratios to Average Net Assets C, G | | | |
Expenses before reductions | 1.71% | 1.63% | 1.62% |
Expenses net of fee waivers, if any | 1.40% | 1.40% | 1.40% |
Expenses net of all reductions | 1.40% | 1.37% | 1.37% |
Net investment income (loss) | 1.86% | 1.86% | 2.17% |
Supplemental Data | | | |
Net assets, end of period (000 omitted) | $ 4,773 | $ 5,354 | $ 2,287 |
Portfolio turnover rateD | 102% | 120% | 70% |
A Total returns would have been lower if certain expenses had not been reduced during the applicable periods shown.
B Calculated based on average shares outstanding during the period.
C Fees and expenses of any underlying Fidelity Central Funds are not included in the Fund's expense ratio. The Fund indirectly bears its proportionate share of the expenses of any underlying Fidelity Central Funds.
D Amount does not include the portfolio activity of any underlying Fidelity Central Funds.
E The amount shown for a share outstanding does not correspond with the aggregate net gain (loss) on investments for the period due to the timing of sales and repurchases of shares in relation to fluctuating market values of the investments of the Fund.
F For the period November 1, 2011 (commencement of operations) to October 31, 2012.
G Expense ratios reflect operating expenses of the class. Expenses before reductions do not reflect amounts reimbursed by the investment adviser or reductions from brokerage service arrangements or reductions from other expense offset arrangements and do not represent the amount paid by the class during periods when reimbursements or reductions occur. Expense ratios before reductions for start-up periods may not be representative of longer-term operating periods. Expenses net of fee waivers reflect expenses after reimbursement by the investment adviser but prior to reductions from brokerage service arrangements or other expense offset arrangements. Expenses net of all reductions represent the net expenses paid by the class.
H Amount represents less than $.01 per share.
See accompanying notes which are an integral part of the financial statements.
Annual Report
Notes to Financial Statements
For the period ended October 31, 2014
1. Organization.
Fidelity Total Emerging Markets Fund (the Fund) is a fund of Fidelity Investment Trust (the Trust) and is authorized to issue an unlimited number of shares. The Trust is registered under the Investment Company Act of 1940, as amended (the 1940 Act), as an open-end management investment company organized as a Massachusetts business trust. The Fund offers Class A, Class T, Class C, Total Emerging Markets and Institutional Class shares, each of which has equal rights as to assets and voting privileges. Each class has exclusive voting rights with respect to matters that affect that class. The Fund's investments in emerging markets can be subject to social, economic, regulatory, and political uncertainties and can be extremely volatile.
2. Investments in Fidelity Central Funds.
The Fund invests in Fidelity Central Funds, which are open-end investment companies generally available only to other investment companies and accounts managed by the investment adviser and its affiliates. The Fund's Schedule of Investments lists each of the Fidelity Central Funds held as of period end, if any, as an investment of the Fund, but does not include the underlying holdings of each Fidelity Central Fund. As an Investing Fund, the Fund indirectly bears its proportionate share of the expenses of the underlying Fidelity Central Funds.
The Money Market Central Funds seek preservation of capital and current income and are managed by Fidelity Investments Money Management, Inc. (FIMM), an affiliate of the investment adviser. Annualized expenses of the Money Market Central Funds as of their most recent shareholder report date are less than .01%.
A complete unaudited list of holdings for each Fidelity Central Fund is available upon request or at the Securities and Exchange Commission (the SEC) website at www.sec.gov. In addition, the financial statements of the Fidelity Central Funds, which are not covered by the Fund's Report of Independent Registered Public Accounting Firm, are available on the SEC website or upon request.
3. Significant Accounting Policies.
The financial statements have been prepared in conformity with accounting principles generally accepted in the United States of America (GAAP), which require management to make certain estimates and assumptions at the date of the financial statements. Actual results could differ from those estimates. Subsequent events, if any, through the date that the financial statements were issued have been evaluated in the preparation of the financial statements. The following summarizes the significant accounting policies of the Fund:
Investment Valuation. Investments are valued as of 4:00 p.m. Eastern time on the last calendar day of the period. In accordance with valuation policies and procedures
Annual Report
3. Significant Accounting Policies - continued
Investment Valuation - continued
approved by the Board of Trustees (the Board), the Fund attempts to obtain prices from one or more third party pricing vendors or brokers to value its investments. When current market prices, quotations or currency exchange rates are not readily available or reliable, investments will be fair valued in good faith by the Fidelity Management & Research Company (FMR) Fair Value Committee (the Committee), in accordance with procedures adopted by the Board. Factors used in determining fair value vary by investment type and may include market or investment specific events, changes in interest rates and credit quality. The frequency with which these procedures are used cannot be predicted and they may be utilized to a significant extent. The Committee oversees the Fund's valuation policies and procedures and is responsible for approving and reporting to the Board all fair value determinations.
The Fund categorizes the inputs to valuation techniques used to value its investments into a disclosure hierarchy consisting of three levels as shown below:
Level 1 - quoted prices in active markets for identical investments
Level 2 - other significant observable inputs (including quoted prices for similar investments, interest rates, prepayment speeds, etc.)
Level 3 - unobservable inputs (including the Fund's own assumptions based on the best information available)
Valuation techniques used to value the Fund's investments by major category are as follows:
Equity securities, including restricted securities, for which market quotations are readily available, are valued at the last reported sale price or official closing price as reported by a third party pricing vendor on the primary market or exchange on which they are traded and are categorized as Level 1 in the hierarchy. In the event there were no sales during the day or closing prices are not available, securities are valued at the last quoted bid price or may be valued using the last available price and are generally categorized as Level 2 in the hierarchy. For foreign equity securities, when market or security specific events arise, comparisons to the valuation of American Depositary Receipts (ADRs), futures contracts, Exchange-Traded Funds (ETFs) and certain indexes as well as quoted prices for similar securities may be used and would be categorized as Level 2 in the hierarchy. Utilizing these techniques may result in transfers between Level 1 and Level 2. For equity securities, including restricted securities, where observable inputs are limited, assumptions about market activity and risk are used and these securities may be categorized as Level 3 in the hierarchy.
Annual Report
Notes to Financial Statements - continued
3. Significant Accounting Policies - continued
Investment Valuation - continued
Debt securities, including restricted securities, are valued based on evaluated prices received from third party pricing vendors or from brokers who make markets in such securities. Corporate bonds, foreign government and government agency obligations and U.S. government and government agency obligations are valued by pricing vendors who utilize matrix pricing which considers yield or price of bonds of comparable quality, coupon, maturity and type or by broker-supplied prices. When independent prices are unavailable or unreliable, debt securities may be valued utilizing pricing methodologies which consider similar factors that would be used by third party pricing vendors. Debt securities are generally categorized as Level 2 in the hierarchy but may be Level 3 depending on the circumstances.
Futures contracts are valued at the settlement price established each day by the board of trade or exchange on which they are traded and are categorized as Level 1 in the hierarchy. Investments in open-end mutual funds, including the Fidelity Central Funds, are valued at their closing net asset value (NAV) each business day and are categorized as Level 1 in the hierarchy.
Changes in valuation techniques may result in transfers in or out of an assigned level within the disclosure hierarchy. The aggregate value of investments by input level, as of October 31, 2014, including information on transfers between Levels 1 and 2, is included at the end of the Fund's Schedule of Investments.
Foreign Currency. The Fund may use foreign currency contracts to facilitate transactions in foreign-denominated securities. Gains and losses from these transactions may arise from changes in the value of the foreign currency or if the counterparties do not perform under the contracts' terms.
Foreign-denominated assets, including investment securities, and liabilities are translated into U.S. dollars at the exchange rates at period end. Purchases and sales of investment securities, income and dividends received and expenses denominated in foreign currencies are translated into U.S. dollars at the exchange rate in effect on the transaction date.
The effects of exchange rate fluctuations on investments are included with the net realized and unrealized gain (loss) on investment securities. Other foreign currency transactions resulting in realized and unrealized gain (loss) are disclosed separately.
Investment Transactions and Income. For financial reporting purposes, the Fund's investment holdings and NAV include trades executed through the end of the last business day of the period. The NAV per share for processing shareholder transactions is calculated as of the close of business of the New York Stock Exchange (NYSE), normally
Annual Report
3. Significant Accounting Policies - continued
Investment Transactions and Income - continued
4:00 p.m. Eastern time and includes trades executed through the end of the prior business day. Gains and losses on securities sold are determined on the basis of identified cost. Dividend income is recorded on the ex-dividend date, except for certain dividends from foreign securities where the ex-dividend date may have passed, which are recorded as soon as the Fund is informed of the ex-dividend date. Non-cash dividends included in dividend income, if any, are recorded at the fair market value of the securities received. Income and capital gain distributions from Fidelity Central Funds, if any, are recorded on the ex-dividend date. Distributions received on securities that represent a return of capital or capital gain are recorded as a reduction of cost of investments and/or as a realized gain. Subsequent to ex-dividend date the Fund determines the components of these distributions, based upon receipt of tax filings or other correspondence relating to the underlying investment. Interest income is accrued as earned and includes coupon interest and amortization of premium and accretion of discount on debt securities as applicable. Investment income is recorded net of foreign taxes withheld where recovery of such taxes is uncertain.
Class Allocations and Expenses. Investment income, realized and unrealized capital gains and losses, common expenses of the Fund, and certain fund-level expense reductions, if any, are allocated daily on a pro-rata basis to each class based on the relative net assets of each class to the total net assets of the Fund. Each class differs with respect to transfer agent and distribution and service plan fees incurred. Certain expense reductions may also differ by class. For the reporting period, the allocated portion of income and expenses to each class as a percent of its average net assets may vary due to the timing of recording these transactions in relation to fluctuating net assets of the classes. Expenses directly attributable to a fund are charged to that fund. Expenses attributable to more than one fund are allocated among the respective funds on the basis of relative net assets or other appropriate methods. Expense estimates are accrued in the period to which they relate and adjustments are made when actual amounts are known.
Income Tax Information and Distributions to Shareholders. Each year, the Fund intends to qualify as a regulated investment company under Subchapter M of the Internal Revenue Code, including distributing substantially all of its taxable income and realized gains. As a result, no provision for U.S. Federal income taxes is required. As of October 31, 2014, the Fund did not have any unrecognized tax benefits in the financial statements; nor is the Fund aware of any tax positions for which it is reasonably possible that the total amounts of unrecognized tax benefits will significantly change in the next twelve months. The Fund files a U.S. federal tax return, in addition to state and local tax returns as required. The Fund's federal income tax returns are subject to examination by the Internal Revenue Service (IRS) for a period of three fiscal years after they are filed. State and local tax returns may be subject to examination for an additional fiscal year
Annual Report
Notes to Financial Statements - continued
3. Significant Accounting Policies - continued
Income Tax Information and Distributions to Shareholders - continued
depending on the jurisdiction. Foreign taxes are provided for based on the Fund's understanding of the tax rules and rates that exist in the foreign markets in which it invests. The Fund is subject to a tax imposed on capital gains by certain countries in which it invests. An estimated deferred tax liability for net unrealized appreciation on the applicable securities is included in Other payables and accrued expenses on the Statement of Assets & Liabilities.
Distributions are declared and recorded on the ex-dividend date. Income dividends and capital gain distributions are declared separately for each class. Income and capital gain distributions are determined in accordance with income tax regulations, which may differ from GAAP. In addition, the Fund claimed a portion of the payment made to redeeming shareholders as a distribution for income tax purposes.
Capital accounts within the financial statements are adjusted for permanent book-tax differences. These adjustments have no impact on net assets or the results of operations. Capital accounts are not adjusted for temporary book-tax differences which will reverse in a subsequent period.
Book-tax differences are primarily due to futures contracts, foreign currency transactions, certain foreign taxes, passive foreign investment companies (PFIC), market discount, capital loss carryforwards and losses deferred due to wash sales.
The federal tax cost of investment securities and unrealized appreciation (depreciation) as of period end were as follows:
Gross unrealized appreciation | $ 10,884,326 |
Gross unrealized depreciation | (4,096,936) |
Net unrealized appreciation (depreciation) on securities | $ 6,787,390 |
| |
Tax Cost | $ 72,872,839 |
The tax-based components of distributable earnings as of period end were as follows:
Undistributed ordinary income | $ 1,043,841 |
Undistributed long-term capital gain | $ 134,651 |
Net unrealized appreciation (depreciation) on securities and other investments | $ 6,784,523 |
The tax character of distributions paid was as follows:
| October 31, 2014 | October 31, 2013 |
Ordinary Income | $ 1,381,318 | $ 1,699,019 |
Annual Report
3. Significant Accounting Policies - continued
Short-Term Trading (Redemption) Fees. Shares held by investors in the Fund less than 90 days may have been subject to a redemption fee equal to 1.50% of the NAV of shares redeemed. All redemption fees, which reduce the proceeds of the shareholder redemption, are retained by the Fund and accounted for as an addition to paid in capital.
Restricted Securities. The Fund may invest in securities that are subject to legal or contractual restrictions on resale. These securities generally may be resold in transactions exempt from registration or to the public if the securities are registered. Disposal of these securities may involve time-consuming negotiations and expense, and prompt sale at an acceptable price may be difficult. Information regarding restricted securities is included at the end of the Fund's Schedule of Investments.
New Accounting Pronouncement. In June 2014, the Financial Accounting Standards Board issued Accounting Standard Update No. 2014-11, Repurchase-to-Maturity Transactions, Repurchase Financings, and Disclosures. The Update amends the accounting for certain repurchase agreements and expands disclosure requirements for reverse repurchase agreements, securities lending and other similar transactions. The disclosure requirements are effective for annual and interim reporting periods beginning after December 15, 2014. Management is currently evaluating the impact of the Update on the Fund's financial statements and related disclosures.
4. Derivative Instruments.
Risk Exposures and the Use of Derivative Instruments. The Fund's investment objective allows the Fund to enter into various types of derivative contracts, including futures contracts. Derivatives are investments whose value is primarily derived from underlying assets, indices or reference rates and may be transacted on an exchange or over-the-counter (OTC). Derivatives may involve a future commitment to buy or sell a specified asset based on specified terms, to exchange future cash flows at periodic intervals based on a notional principal amount, or for one party to make one or more payments upon the occurrence of specified events in exchange for periodic payments from the other party.
The Fund used derivatives to increase returns and to manage exposure to certain risks as defined below. The success of any strategy involving derivatives depends on analysis of numerous economic factors, and if the strategies for investment do not work as intended, the Fund may not achieve its objectives.
The Fund's use of derivatives increased or decreased its exposure to the following risk:
Equity Risk | Equity risk relates to the fluctuations in the value of financial instruments as a result of changes in market prices (other than those arising from interest rate risk or foreign exchange risk), whether caused by factors specific to an individual investment, its issuer, or all factors affecting all instruments traded in a market or market segment. |
Annual Report
Notes to Financial Statements - continued
4. Derivative Instruments - continued
Risk Exposures and the Use of Derivative Instruments - continued
The Fund is also exposed to additional risks from investing in derivatives, such as liquidity risk and counterparty credit risk. Liquidity risk is the risk that the Fund will be unable to close out the derivative in the open market in a timely manner. Counterparty credit risk is the risk that the counterparty will not be able to fulfill its obligation to the Fund. Counterparty credit risk related to exchange-traded futures contracts may be mitigated by the protection provided by the exchange on which they trade.
Investing in derivatives may involve greater risks than investing in the underlying assets directly and, to varying degrees, may involve risk of loss in excess of any initial investment and collateral received and amounts recognized in the Statement of Assets and Liabilities. In addition, there may be the risk that the change in value of the derivative contract does not correspond to the change in value of the underlying instrument.
Futures Contracts. A futures contract is an agreement between two parties to buy or sell a specified underlying instrument for a fixed price at a specified future date. The Fund used futures contracts to manage its exposure to the stock market.
Upon entering into a futures contract, a fund is required to deposit either cash or securities (initial margin) with a clearing broker in an amount equal to a certain percentage of the face value of the contract. Futures contracts are marked-to-market daily and subsequent daily payments (variation margin) are made or received by a fund depending on the daily fluctuations in the value of the futures contracts and are recorded as unrealized appreciation or (depreciation). This receivable and/or payable, if any, is included in daily variation margin for derivative instruments in the Statement of Assets and Liabilities. Realized gain or (loss) is recorded upon the expiration or closing of a futures contract.
Any open futures contracts at period end are presented in the Schedule of Investments under the caption "Futures Contracts." The underlying face amount at value reflects each contract's exposure to the underlying instrument or index at period end and is representative of volume of activity during the period. Securities deposited to meet initial margin requirements are identified in the Schedule of Investments.
During the period the Fund recognized net realized gain (loss) of $42,055 and a change in net unrealized appreciation (depreciation) of $9,141 related to its investment in futures contracts. These amounts are included in the Statement of Operations.
5. Purchases and Sales of Investments.
Purchases and sales of securities, other than short-term securities, aggregated $78,871,035 and $87,196,124, respectively.
Annual Report
6. Fees and Other Transactions with Affiliates.
Management Fee. Fidelity Management & Research Company (the investment adviser) and its affiliates provide the Fund with investment management related services for which the Fund pays a monthly management fee. The management fee is the sum of an individual fund fee rate that is based on an annual rate of .55% of the Fund's average net assets and an annualized group fee rate that averaged .25% during the period. The group fee rate is based upon the average net assets of all the mutual funds advised by the investment adviser, including any mutual funds previously advised by the investment adviser that are currently advised by Fidelity SelectCo, LLC, an affiliate of the investment adviser. The group fee rate decreases as assets under management increase and increases as assets under management decrease. For the reporting period, the total annual management fee rate was .80% of the Fund's average net assets.
Distribution and Service Plan Fees. In accordance with Rule 12b-1 of the 1940 Act, the Fund has adopted separate Distribution and Service Plans for each class of shares. Certain classes pay Fidelity Distributors Corporation (FDC), an affiliate of the investment adviser, separate Distribution and Service Fees, each of which is based on an annual percentage of each class' average net assets. In addition, FDC may pay financial intermediaries for selling shares of the Fund and providing shareholder support services. For the period, the Distribution and Service Fee rates, total fees and amounts retained by FDC were as follows:
| Distribution
Fee | Service
Fee | Total Fees | Retained
by FDC |
Class A | -% | .25% | $ 37,836 | $ 14,585 |
Class T | .25% | .25% | 27,474 | 10,294 |
Class C | .75% | .25% | 88,055 | 66,764 |
| | | $ 153,365 | $ 91,643 |
Sales Load. FDC may receive a front-end sales charge of up to 5.75% for selling Class A shares and 3.50% for selling Class T shares, some of which is paid to financial intermediaries for selling shares of the Fund. Depending on the holding period, FDC may receive contingent deferred sales charges levied on Class A, Class T, and Class C redemptions. The deferred sales charges range from 1.00% for Class C shares, 1.00% for certain purchases of Class A shares and .25% for certain purchases of Class T shares.
For the period, sales charge amounts retained by FDC were as follows:
| Retained
by FDC |
Class A | $ 5,093 |
Class T | 1,444 |
Class C* | 1,370 |
| $ 7,907 |
* When Class C shares are initially sold, FDC pays commissions from its own resources to financial intermediaries through which the sales are made.
Annual Report
Notes to Financial Statements - continued
6. Fees and Other Transactions with Affiliates - continued
Transfer Agent Fees. Fidelity Investments Institutional Operations Company, Inc., (FIIOC), an affiliate of the investment adviser, is the transfer, dividend disbursing and shareholder servicing agent for each class of the Fund. FIIOC receives account fees and asset-based fees that vary according to the account size and type of account of the shareholders of the respective classes of the Fund. FIIOC pays for typesetting, printing and mailing of shareholder reports, except proxy statements.
For the period, transfer agent fees for each class were as follows:
| Amount | % of
Class-Level Average
Net Assets |
Class A | $ 32,080 | .21 |
Class T | 16,754 | .31 |
Class C | 19,208 | .22 |
Total Emerging Markets | 99,220 | .22 |
Institutional Class | 8,919 | .19 |
| $ 176,181 | |
Accounting and Security Lending Fees. Fidelity Service Company, Inc. (FSC), an affiliate of the investment adviser, maintains the Fund's accounting records. The accounting fee is based on the level of average net assets for each month. Under a separate contract, FSC administers the security lending program. The security lending fee is based on the number and duration of lending transactions.
Brokerage Commissions. The Fund placed a portion of its portfolio transactions with brokerage firms which are affiliates of the investment adviser. Brokerage commissions are included in net realized gain (loss) and change in net unrealized appreciation (depreciation) in the Statement of Operations. The commissions paid to these affiliated firms were $699 for the period.
7. Committed Line of Credit.
The Fund participates with other funds managed by the investment adviser or an affiliate in a $4.25 billion credit facility (the "line of credit") to be utilized for temporary or emergency purposes to fund shareholder redemptions or for other short-term liquidity purposes. The Fund has agreed to pay commitment fees on its pro-rata portion of the line of credit, which amounted to $130 and is reflected in Miscellaneous expenses on the Statement of Operations. During the period, the Fund did not borrow on this line of credit.
Annual Report
8. Security Lending.
The Fund lends portfolio securities through a lending agent from time to time in order to earn additional income. For equity securities, a lending agent is used and may loan securities to certain qualified borrowers, including Fidelity Capital Markets (FCM), a broker-dealer affiliated with the Fund. On the settlement date of the loan, the Fund receives collateral (in the form of U.S. Treasury obligations, letters of credit and/or cash) against the loaned securities and maintains collateral in an amount not less than 100% of the market value of the loaned securities during the period of the loan. The market value of the loaned securities is determined at the close of business of the Fund and any additional required collateral is delivered to the Fund on the next business day. If the borrower defaults on its obligation to return the securities loaned because of insolvency or other reasons, the Fund may apply collateral received from the borrower against the obligation. The Fund may experience delays and costs in recovering the securities loaned. Any cash collateral received is invested in the Fidelity Securities Lending Cash Central Fund. At period end, there were no security loans outstanding. Security lending income represents the income earned on investing cash collateral, less rebates paid to borrowers and any lending agent fees associated with the loan, plus any premium payments received for lending certain types of securities. Security lending income is presented in the Statement of Operations as a component of income from Fidelity Central Funds. Total security lending income during the period amounted to $202. During the period, there were no securities loaned to FCM.
9. Expense Reductions.
The investment adviser contractually agreed to reimburse each class to the extent annual operating expenses exceeded certain levels of average net assets as noted in the table below. This reimbursement will remain in place through December 31, 2015. Some expenses, for example interest expense, including commitment fees, are excluded from this reimbursement.
The following classes were in reimbursement during the period:
| Expense
Limitations | Reimbursement |
Class A | 1.65% | $ 49,666 |
Class T | 1.90% | 22,953 |
Class C | 2.40% | 28,693 |
Total Emerging Markets | 1.40% | 149,847 |
Institutional Class | 1.40% | 14,635 |
| | $ 265,794 |
In addition, the investment adviser reimbursed a portion of the Fund's operating expenses during the period in the amount of $180.
Annual Report
Notes to Financial Statements - continued
10. Distributions to Shareholders.
Distributions to shareholders of each class were as follows:
Years ended October 31, | 2014 | 2013 |
From net investment income | | |
Class A | $ 298,475 | $ 104,565 |
Class T | 72,882 | 69,282 |
Class C | 71,691 | 35,970 |
Total Emerging Markets | 837,446 | 1,316,259 |
Institutional Class | 100,824 | 35,591 |
Total | $ 1,381,318 | $ 1,561,667 |
From net realized gain | | |
Class A | $ - | $ 10,027 |
Class T | - | 7,822 |
Class C | - | 7,516 |
Total Emerging Markets | - | 109,039 |
Institutional Class | - | 2,948 |
Total | $ - | $ 137,352 |
11. Share Transactions.
Share transactions for each class were as follows and may contain automatic conversions between classes or exchanges between funds:
| Shares | Shares | Dollars | Dollars |
Years ended October 31, | 2014 | 2013 | 2014 | 2013 |
Class A | | | | |
Shares sold | 374,099 | 1,550,621 | $ 4,265,512 | $ 17,267,543 |
Reinvestment of distributions | 24,147 | 9,656 | 267,553 | 105,541 |
Shares redeemed | (876,261) | (609,546) | (9,758,391) | (6,666,165) |
Net increase (decrease) | (478,015) | 950,731 | $ (5,225,326) | $ 10,706,919 |
Class T | | | | |
Shares sold | 73,071 | 277,882 | $ 838,229 | $ 3,114,089 |
Reinvestment of distributions | 6,487 | 7,041 | 71,875 | 76,883 |
Shares redeemed | (148,531) | (295,695) | (1,659,489) | (3,268,261) |
Net increase (decrease) | (68,973) | (10,772) | $ (749,385) | $ (77,289) |
Class C | | | | |
Shares sold | 312,027 | 431,831 | $ 3,545,260 | $ 4,824,945 |
Reinvestment of distributions | 6,236 | 3,973 | 69,031 | 43,420 |
Shares redeemed | (95,617) | (316,804) | (1,079,948) | (3,521,280) |
Net increase (decrease) | 222,646 | 119,000 | $ 2,534,343 | $ 1,347,085 |
Annual Report
11. Share Transactions - continued
| Shares | Shares | Dollars | Dollars |
Years ended October 31, | 2014 | 2013 | 2014 | 2013 |
Total Emerging Markets | | | | |
Shares sold | 1,227,986 | 5,085,608 | $ 14,240,572 | $ 57,439,168 |
Reinvestment of distributions | 69,851 | 113,766 | 774,644 | 1,243,462 |
Shares redeemed | (1,734,596) | (8,294,710) | (19,517,156) | (89,232,029) |
Net increase (decrease) | (436,759) | (3,095,336) | $ (4,501,940) | $ (30,549,399) |
Institutional Class | | | | |
Shares sold | 216,506 | 491,268 | $ 2,508,322 | $ 5,357,985 |
Reinvestment of distributions | 8,910 | 3,526 | 98,814 | 38,539 |
Shares redeemed | (283,392) | (235,091) | (3,122,278) | (2,578,926) |
Net increase (decrease) | (57,976) | 259,703 | $ (515,142) | $ 2,817,598 |
12. Other.
The Fund's organizational documents provide former and current trustees and officers with a limited indemnification against liabilities arising in connection with the performance of their duties to the Fund. In the normal course of business, the Fund may also enter into contracts that provide general indemnifications. The Fund's maximum exposure under these arrangements is unknown as this would be dependent on future claims that may be made against the Fund. The risk of material loss from such claims is considered remote.
At the end of the period, the investment adviser or its affiliates were the owners of record of 29% of the total outstanding shares of the Fund.
Annual Report
To the Trustees of Fidelity Investment Trust and the Shareholders of Fidelity Total Emerging Markets Fund:
In our opinion, the accompanying statement of assets and liabilities, including the schedule of investments, and the related statements of operations and of changes in net assets and the financial highlights present fairly, in all material respects, the financial position of Fidelity Total Emerging Markets Fund (a fund of Fidelity Investment Trust) at October 31, 2014, the results of its operations for the year then ended, the changes in its net assets for each of the two years in the period then ended period indicated and the financial highlights for each of the five years in the period then ended, in conformity with accounting principles generally accepted in the United States of America. These financial statements and financial highlights (hereafter referred to as "financial statements") are the responsibility of the Fidelity Total Emerging Markets Fund's management. Our responsibility is to express an opinion on these financial statements based on our audits. We conducted our audits of these financial statements in accordance with the standards of the Public Company Accounting Oversight Board (United States). Those standards require that we plan and perform the audit to obtain reasonable assurance about whether the financial statements are free of material misstatement. An audit includes examining, on a test basis, evidence supporting the amounts and disclosures in the financial statements, assessing the accounting principles used and significant estimates made by management, and evaluating the overall financial statement presentation. We believe that our audits, which included confirmation of securities at October 31, 2014 by correspondence with the custodian and brokers, provide a reasonable basis for our opinion.
PricewaterhouseCoopers LLP
Boston, Massachusetts
December 19, 2014
Annual Report
The Trustees, Member of the Advisory Board, and officers of the trust and fund, as applicable, are listed below. The Board of Trustees governs the fund and is responsible for protecting the interests of shareholders. The Trustees are experienced executives who meet periodically throughout the year to oversee the fund's activities, review contractual arrangements with companies that provide services to the fund, oversee management of the risks associated with such activities and contractual arrangements, and review the fund's performance. Except for James C. Curvey, each of the Trustees oversees 174 funds. Mr. Curvey oversees 407 funds.
The Trustees hold office without limit in time except that (a) any Trustee may resign; (b) any Trustee may be removed by written instrument, signed by at least two-thirds of the number of Trustees prior to such removal; (c) any Trustee who requests to be retired or who has become incapacitated by illness or injury may be retired by written instrument signed by a majority of the other Trustees; and (d) any Trustee may be removed at any special meeting of shareholders by a two-thirds vote of the outstanding voting securities of the trust. Each Trustee who is not an interested person (as defined in the 1940 Act) of the trust and the fund (Independent Trustee), shall retire not later than the last day of the calendar year in which his or her 75th birthday occurs. The Independent Trustees may waive this mandatory retirement age policy with respect to individual Trustees. The officers and Advisory Board Member hold office without limit in time, except that any officer and Advisory Board Member may resign or may be removed by a vote of a majority of the Trustees at any regular meeting or any special meeting of the Trustees. Except as indicated, each individual has held the office shown or other offices in the same company for the past five years.
Experience, Skills, Attributes, and Qualifications of the Fund's Trustees. The Governance and Nominating Committee has adopted a statement of policy that describes the experience, qualifications, attributes, and skills that are necessary and desirable for potential Independent Trustee candidates (Statement of Policy). The Board believes that each Trustee satisfied at the time he or she was initially elected or appointed a Trustee, and continues to satisfy, the standards contemplated by the Statement of Policy. The Governance and Nominating Committee also engages professional search firms to help identify potential Independent Trustee candidates who have the experience, qualifications, attributes, and skills consistent with the Statement of Policy. From time to time, additional criteria based on the composition and skills of the current Independent Trustees, as well as experience or skills that may be appropriate in light of future changes to board composition, business conditions, and regulatory or other developments, have also been considered by the professional search firms and the Governance and Nominating Committee. In addition, the Board takes into account the Trustees' commitment and participation in Board and committee meetings, as well as their leadership of standing and ad hoc committees throughout their tenure.
In determining that a particular Trustee was and continues to be qualified to serve as a Trustee, the Board has considered a variety of criteria, none of which, in isolation, was controlling. The Board believes that, collectively, the Trustees have balanced and diverse experience, qualifications, attributes, and skills, which allow the Board to operate effectively in governing the fund and protecting the interests of shareholders. Information about the specific experience, skills, attributes, and qualifications of each Trustee, which in each case led to the Board's conclusion that the Trustee should serve (or continue to serve) as a trustee of the fund, is provided below.
Annual Report
Board Structure and Oversight Function. James C. Curvey is an interested person (as defined in the 1940 Act) and currently serves as Chairman. The Trustees have determined that an interested Chairman is appropriate and benefits shareholders because an interested Chairman has a personal and professional stake in the quality and continuity of services provided to the fund. Independent Trustees exercise their informed business judgment to appoint an individual of their choosing to serve as Chairman, regardless of whether the Trustee happens to be independent or a member of management. The Independent Trustees have determined that they can act independently and effectively without having an Independent Trustee serve as Chairman and that a key structural component for assuring that they are in a position to do so is for the Independent Trustees to constitute a substantial majority for the Board. The Independent Trustees also regularly meet in executive session. Ned C. Lautenbach serves as Chairman of the Independent Trustees and as such (i) acts as a liaison between the Independent Trustees and management with respect to matters important to the Independent Trustees and (ii) with management prepares agendas for Board meetings.
Fidelity funds are overseen by different Boards of Trustees. The fund's Board oversees Fidelity's equity and high income funds and another Board oversees Fidelity's investment-grade bond, money market, and asset allocation funds. The asset allocation funds may invest in Fidelity funds overseen by the fund's Board. The use of separate Boards, each with its own committee structure, allows the Trustees of each group of Fidelity funds to focus on the unique issues of the funds they oversee, including common research, investment, and operational issues. On occasion, the separate Boards establish joint committees to address issues of overlapping consequences for the Fidelity funds overseen by each Board.
The Trustees operate using a system of committees to facilitate the timely and efficient consideration of all matters of importance to the Trustees, the fund, and fund shareholders and to facilitate compliance with legal and regulatory requirements and oversight of the fund's activities and associated risks. The Board, acting through its committees, has charged FMR and its affiliates with (i) identifying events or circumstances the occurrence of which could have demonstrably adverse effects on the fund's business and/or reputation; (ii) implementing processes and controls to lessen the possibility that such events or circumstances occur or to mitigate the effects of such events or circumstances if they do occur; and (iii) creating and maintaining a system designed to evaluate continuously business and market conditions in order to facilitate the identification and implementation processes described in (i) and (ii) above. Because the day-to-day operations and activities of the fund are carried out by or through FMR, its affiliates and other service providers, the fund's exposure to risks is mitigated but not eliminated by the processes overseen by the Trustees. While each of the Board's committees has responsibility for overseeing different aspects of the fund's activities, oversight is exercised primarily through the Operations, Audit, and Compliance Committees. In addition, the Independent Trustees have worked with FMR to enhance the Board's oversight of investment and financial risks, legal and regulatory risks, technology risks, and operational risks, including the development of additional risk reporting to the Board. For example, a working group comprised of Independent Trustees and FMR has worked and continues to work to review the Fidelity fund's valuation-related activities, reporting and risk management. Appropriate personnel, including but not limited to the fund's Chief Compliance Officer (CCO), FMR's internal auditor, the independent accountants, the fund's Treasurer and portfolio management personnel, make periodic reports to the Board's committees, as appropriate, including an annual review of FMR's risk management program for the Fidelity funds. The responsibilities of each standing committee, including their oversight responsibilities, are described further under "Standing Committees of the Fund's Trustees."
Annual Report
Trustees and Officers - continued
The fund's Statement of Additional Information (SAI) includes more information about the Trustees. To request a free copy, call Fidelity at 1-877-208-0098.
Interested Trustees*:
Correspondence intended for each Trustee who is an interested person may be sent to Fidelity Investments, 245 Summer Street, Boston, Massachusetts 02210.
Name, Year of Birth; Principal Occupations and Other Relevant Experience+ |
James C. Curvey (1935) |
Year of Election or Appointment: 2007 Trustee Chairman of the Board of Trustees |
| Mr. Curvey also serves as Trustee of other Fidelity funds. Mr. Curvey is a Director of Fidelity Research & Analysis Co. (2009-present), and Vice Chairman (2007-present) and Director of FMR LLC. In addition, Mr. Curvey serves as an Overseer for the Boston Symphony Orchestra and a member of the board of Artis-Naples, Naples, Florida, and as Trustee for Brewster Academy, Wolfeboro, New Hampshire. Previously, Mr. Curvey served as a Director of Fidelity Investments Money Management, Inc. (2009-2014), a Director of FMR (2007-2014), and a Director of FMR Co., Inc. (2007-2014). |
Charles S. Morrison (1960) |
Year of Election or Appointment: 2014 Trustee |
| Mr. Morrison also serves as Trustee of other funds. He serves as a Director of Fidelity Investments Money Management, Inc. (FIMM) (2014-present), Director of Fidelity SelectCo, LLC (2014-present), President, Asset Management (2014-present), and is an employee of Fidelity Investments. Previously, Mr. Morrison served as Vice President of Fidelity's Fixed Income and Asset Allocation Funds (2012-2014), President, Fixed Income (2011-2014), Vice President of Fidelity's Money Market Funds (2005-2009), President, Money Market Group Leader of FMR (2009), and Senior Vice President, Money Market Group of FMR (2004-2009). Mr. Morrison also served as Vice President of Fidelity's Bond Funds (2002-2005), certain Balanced Funds (2002-2005), and certain Asset Allocation Funds (2002-2007), and as Senior Vice President (2002-2005) of Fidelity's Bond Division. |
* Trustees have been determined to be "Interested Trustees" by virtue of, among other things, their affiliation with the trust or various entities under common control with FMR.
+ The information above includes each Trustee's principal occupation during the last five years and other information relating to the experience, attributes, and skills relevant to each Trustee's qualifications to serve as a Trustee, which led to the conclusion that each Trustee should serve as a Trustee for the fund.
Annual Report
Trustees and Officers - continued
Independent Trustees:
Correspondence intended for each Independent Trustee (that is, the Trustees other than the Interested Trustees) may be sent to Fidelity Investments, P.O. Box 55235, Boston, Massachusetts 02205-5235.
Name, Year of Birth; Principal Occupations and Other Relevant Experience+ |
Dennis J. Dirks (1948) |
Year of Election or Appointment: 2005 Trustee |
| Mr. Dirks also serves as Trustee of other Fidelity funds. Prior to his retirement in May 2003, Mr. Dirks was Chief Operating Officer and a member of the Board of The Depository Trust & Clearing Corporation (DTCC). He also served as President, Chief Operating Officer, and Board member of The Depository Trust Company (DTC) and President and Board member of the National Securities Clearing Corporation (NSCC). In addition, Mr. Dirks served as Chief Executive Officer and Board member of the Government Securities Clearing Corporation, Chief Executive Officer and Board member of the Mortgage-Backed Securities Clearing Corporation, as a Trustee and a member of the Finance Committee of Manhattan College (2005-2008), and as a Trustee and a member of the Finance Committee of AHRC of Nassau County (2006-2008). Mr. Dirks is a member of the Independent Directors Council (IDC) Governing Council (2010-present) and Board of Directors for The Brookville Center for Children's Services, Inc. (2009-present). |
Alan J. Lacy (1953) |
Year of Election or Appointment: 2008 Trustee |
| Mr. Lacy also serves as Trustee of other Fidelity funds. Mr. Lacy serves as Senior Adviser (2007-present) of Oak Hill Capital Partners, L.P. (private equity). Mr. Lacy also served as Chief Executive Officer (2000-2005) and Vice Chairman (2005-2006) of Sears Holdings Corporation and Sears, Roebuck and Co. (retail). In addition, Mr. Lacy serves as a member of the Board of Directors of Dave & Buster's Entertainment, Inc. (restaurant and entertainment complexes, 2010-present), Earth Fare, Inc. (retail grocery, 2012-present), The Hillman Companies, Inc. (hardware wholesalers, 2010-present), and Bristol-Myers Squibb Company (global pharmaceuticals, 2008-present). Mr. Lacy is a member of the Board of Trustees of The National Parks Conservation Association (2006-present). Previously, Mr. Lacy served as Chairman of the Board of Trustees of the National Parks Conservation Association (2008-2011) and as a member of the Board of Directors for the Western Union Company (global money transfer, 2006-2011). |
Ned C. Lautenbach (1944) |
Year of Election or Appointment: 2000 Trustee Chairman of the Independent Trustees |
| Mr. Lautenbach also serves as Trustee of other Fidelity funds. Mr. Lautenbach currently serves as the Lead Director of the Eaton Corporation Board of Directors (diversified industrial, 1997-present). Mr. Lautenbach is Chairman of the Board of Directors of the Philharmonic Center for the Arts in Naples, Florida (2012-present) and a member of the Council on Foreign Relations (1994-present). Previously, Mr. Lautenbach was a Partner/Advisory Partner at Clayton, Dubilier & Rice, LLC (private equity investment, 1998-2010), as well as a Director of Sony Corporation (2006-2007). |
Joseph Mauriello (1944) |
Year of Election or Appointment: 2008 Trustee |
| Mr. Mauriello also serves as Trustee of other Fidelity funds. Prior to his retirement in January 2006, Mr. Mauriello served in numerous senior management positions including Deputy Chairman and Chief Operating Officer (2004-2005), and Vice Chairman of Financial Services (2002-2004) of KPMG LLP US (professional services, 1965-2005). Mr. Mauriello currently serves as a member of the Board of Directors of XL Group plc. (global insurance and re-insurance, 2006-present). Previously, Mr. Mauriello served as a Director of the Hamilton Funds of the Bank of New York (2006-2007) and of Arcadia Resources Inc. (health care services and products, 2007-2012). |
Robert W. Selander (1950) |
Year of Election or Appointment: 2011 Trustee |
| Mr. Selander also serves as Trustee of other Fidelity funds. Previously, Mr. Selander served as a Member of the Advisory Board of other Fidelity funds (2011), and Executive Vice Chairman (2010), Chief Executive Officer (2009-2010), and President and Chief Executive Officer (1997-2009) of Mastercard, Inc. |
Cornelia M. Small (1944) |
Year of Election or Appointment: 2005 Trustee |
| Ms. Small also serves as Trustee of other Fidelity funds. Ms. Small is a member of the Board of Directors (2009-present) and Chair of the Investment Committee (2010-present) of the Teagle Foundation. Ms. Small also serves on the Investment Committee of the Berkshire Taconic Community Foundation (2008-present). Previously, Ms. Small served as Chairperson (2002-2008) and a member of the Investment Committee and Chairperson (2008-2012) and a member of the Board of Trustees of Smith College. In addition, Ms. Small served as Chief Investment Officer, Director of Global Equity Investments, and a member of the Board of Directors of Scudder, Stevens & Clark and Scudder Kemper Investments. |
William S. Stavropoulos (1939) |
Year of Election or Appointment: 2001 Trustee Vice Chairman of the Independent Trustees |
| Mr. Stavropoulos also serves as Trustee of other Fidelity funds. Mr. Stavropoulos serves as President and Founder of the Michigan Baseball Foundation, the Great Lakes Loons (2007-present). Mr. Stavropoulos is Chairman Emeritus of the Board of Directors of The Dow Chemical Company, where he previously served in numerous senior management positions, including President, CEO (1995-2000; 2002-2004), Chairman of the Executive Committee (2000-2006), and as a member of the Board of Directors (1990-2006). Currently, Mr. Stavropoulos is Chairman of the Board of Directors of Univar Inc. (global distributor of commodity and specialty chemicals), a Director of Teradata Corporation (data warehousing and technology solutions), and Maersk Inc. (industrial conglomerate), and a member of the Advisory Board for Metalmark Capital LLC (private equity investment, 2005-present). Mr. Stavropoulos is an operating advisor to Clayton, Dubilier & Rice, LLC (private equity investment). In addition, Mr. Stavropoulos is a member of the University of Notre Dame Advisory Council for the College of Science, a Trustee of the Rollin L. Gerstacker Foundation, and a Director of the Naples Philharmonic Center for the Arts. Previously, Mr. Stavropoulos served as a Director of Chemical Financial Corporation (bank holding company, 1993-2012) and Tyco International, Ltd. (multinational manufacturing and services, 2007-2012). |
David M. Thomas (1949) |
Year of Election or Appointment: 2008 Trustee |
| Mr. Thomas also serves as Trustee of other Fidelity funds. Mr. Thomas serves as Non-Executive Chairman of the Board of Directors of Fortune Brands Home and Security (home and security products, 2011-present), and as a member of the Board of Directors of Interpublic Group of Companies, Inc. (marketing communication, 2004-present). Previously, Mr. Thomas served as Executive Chairman (2005-2006) and Chairman and Chief Executive Officer (2000-2005) of IMS Health, Inc. (pharmaceutical and healthcare information solutions), and a Director of Fortune Brands, Inc. (consumer products, 2000-2011). |
+ The information above includes each Trustee's principal occupation during the last five years and other information relating to the experience, attributes, and skills relevant to each Trustee's qualifications to serve as a Trustee, which led to the conclusion that each Trustee should serve as a Trustee for the fund.
Advisory Board Member and Officers:
Correspondence intended for each officer and Peter S. Lynch may be sent to Fidelity Investments, 245 Summer Street, Boston, Massachusetts 02210. Officers appear below in alphabetical order.
Name, Year of Birth; Principal Occupation |
Peter S. Lynch (1944) |
Year of Election or Appointment: 2003 Member of the Advisory Board |
| Mr. Lynch also serves as Member of the Advisory Board of other Fidelity funds. Mr. Lynch is Vice Chairman and a Director of FMR and FMR Co., Inc. In addition, Mr. Lynch serves as a Trustee of Boston College and as the Chairman of the Inner-City Scholarship Fund. Previously, Mr. Lynch served on the Special Olympics International Board of Directors (1997-2006). |
Elizabeth Paige Baumann (1968) |
Year of Election or Appointment: 2012 Anti-Money Laundering (AML) Officer |
| Ms. Baumann also serves as AML Officer of other funds. She is Chief AML Officer of FMR LLC (2012-present) and is an employee of Fidelity Investments. Previously, Ms. Baumann served as Vice President and Deputy Anti-Money Laundering Officer (2007-2012). |
William C. Coffey (1969) |
Year of Election or Appointment: 2009 Assistant Secretary |
| Mr. Coffey also serves as Assistant Secretary of other funds. He is Senior Vice President and Deputy General Counsel of FMR LLC (2010-present), and is an employee of Fidelity Investments. Previously, Mr. Coffey served as Vice President and Associate General Counsel of FMR LLC (2005-2009). |
Timothy M. Cohen (1969) |
Year of Election or Appointment: 2014 Vice President of certain Equity Funds |
| Mr. Cohen also serves as Vice President of other funds. Mr. Cohen serves as a Director and Chief Compliance Officer of Fidelity Management & Research (U.K.) Inc. (2013-present) and is an employee of Fidelity Investments. |
Jonathan Davis (1968) |
Year of Election or Appointment: 2010 Assistant Treasurer |
| Mr. Davis also serves as Assistant Treasurer of other funds. Mr. Davis is an employee of Fidelity Investments. Previously, Mr. Davis served as Vice President and Associate General Counsel of FMR LLC (2003-2010). |
Adrien E. Deberghes (1967) |
Year of Election or Appointment: 2008 Deputy Treasurer |
| Mr. Deberghes also serves as an officer of other funds. He is an employee of Fidelity Investments (2008-present). Prior to joining Fidelity Investments, Mr. Deberghes was Senior Vice President of Mutual Fund Administration at State Street Corporation (2007-2008), Senior Director of Mutual Fund Administration at Investors Bank & Trust (2005-2007), and Director of Finance for Dunkin' Brands (2000-2005). |
Stephanie J. Dorsey (1969) |
Year of Election or Appointment: 2010 Assistant Treasurer |
| Ms. Dorsey also serves as an officer of other funds. She is an employee of Fidelity Investments (2008-present) and has served in other fund officer roles. Prior to joining Fidelity Investments, Ms. Dorsey served as Treasurer (2004-2008) of the JPMorgan Mutual Funds and Vice President (2004-2008) of JPMorgan Chase Bank. |
Howard J. Galligan III (1966) |
Year of Election or Appointment: 2014 Chief Financial Officer |
| Mr. Galligan also serves as Chief Financial Officer of other funds. Mr. Galligan serves as President of Fidelity Pricing and Cash Management Services (FPCMS) (2014-present) and as a Director of Strategic Advisers, Inc. (2008-present). Previously, Mr. Galligan served as Chief Administrative Officer of Asset Management (2011-2014) and Chief Operating Officer and Senior Vice President of Investment Support for Strategic Advisers, Inc. (2003-2011). |
Scott C. Goebel (1968) |
Year of Election or Appointment: 2008 Secretary and Chief Legal Officer (CLO) |
| Mr. Goebel serves as Secretary and CLO of other funds. Mr. Goebel also serves as Secretary of Fidelity SelectCo, LLC (2013-present), Fidelity Investments Money Management, Inc. (FIMM) (2010-present) and Fidelity Research and Analysis Company (FRAC) (2010-present); General Counsel, Secretary, and Senior Vice President of FMR (2008-present) and FMR Co., Inc. (2008-present); Chief Legal Officer of Fidelity Management & Research (Hong Kong) Limited (2008-present); and Assistant Secretary of Fidelity Management & Research (Japan) Limited (2008-present) and Fidelity Management & Research (U.K.) Inc. (2008-present). Previously, Mr. Goebel served as Secretary and CLO of other Fidelity funds (2008-2013), Assistant Secretary of FIMM (2008-2010), FRAC (2008-2010), and certain funds (2007-2008); and as Vice President and Secretary of Fidelity Distributors Corporation (FDC) (2005-2007). Mr. Goebel has been employed by FMR LLC or an affiliate since 2001. |
Brian B. Hogan (1964) |
Year of Election or Appointment: 2009 Vice President |
| Mr. Hogan also serves as Trustee or Vice President of other funds. Mr. Hogan serves as a Director of Fidelity SelectCo, LLC (2014-present) and President of FMR's Equity Division (2009-present). Previously, Mr. Hogan served as Senior Vice President, Equity Research of FMR (2006-2009) and as a portfolio manager. |
Chris Maher (1972) |
Year of Election or Appointment: 2013 Assistant Treasurer |
| Mr. Maher serves as Assistant Treasurer of other funds. Mr. Maher is Vice President of Valuation Oversight and is an employee of Fidelity Investments. Previously, Mr. Maher served as Vice President of Asset Management Compliance (2013), Vice President of FMR's Program Management Group (2010-2013), and Vice President of Valuation Oversight (2008-2010). |
Kenneth B. Robins (1969) |
Year of Election or Appointment: 2008 President and Treasurer |
| Mr. Robins also serves as an officer of other funds. Mr. Robins serves as Executive Vice President of Fidelity Investments Money Management, Inc. (FIMM) (2013-present) and is an employee of Fidelity Investments (2004-present). Previously, Mr. Robins served in other fund officer roles. |
Stephen Sadoski (1971) |
Year of Election or Appointment: 2012 Deputy Treasurer |
| Mr. Sadoski also serves as Deputy Treasurer of other funds. He is an employee of Fidelity Investments (2012-present) and has served in another fund officer role. Prior to joining Fidelity Investments, Mr. Sadoski served as an assistant chief accountant in the Division of Investment Management of the Securities and Exchange Commission (SEC) (2009-2012) and as a senior manager at Deloitte & Touche LLP (1997-2009). |
Stacie M. Smith (1974) |
Year of Election or Appointment: 2013 Deputy Treasurer |
| Ms. Smith also serves as an officer of other funds. She is an employee of Fidelity Investments (2009-present) and has served in other fund officer roles. Prior to joining Fidelity Investments, Ms. Smith served as Senior Audit Manager of Ernst & Young LLP (1996-2009). |
Renee Stagnone (1975) |
Year of Election or Appointment: 2013 Deputy Treasurer |
| Ms. Stagnone also serves as Deputy Treasurer of other funds. Ms. Stagnone is an employee of Fidelity Investments. |
Linda J. Wondrack (1964) |
Year of Election or Appointment: 2014 Chief Compliance Officer |
| Ms. Wondrack also serves as Chief Compliance Officer of other funds. Ms. Wondrack is Executive Vice President and head of the Ethics Office and Asset Management Compliance for Fidelity Investments (2012-present). Ms. Wondrack also serves as Chief Compliance Officer of Fidelity SelectCo, LLC (2014-present); Chief Compliance Officer of Impresa Management LLC (2013-present); and Chief Compliance Officer of FMR Co., Inc., Fidelity Investments Money Management, Inc., Fidelity Management & Research (Japan) Limited, Fidelity Management & Research (U.K.) Inc., Fidelity Management & Research (Hong Kong), Fidelity Management & Research Company, Pyramis Global Advisors, LLC, and Strategic Advisers, Inc., Ballyrock Investment Advisors LLC, and Northern Neck Investors LLC (2012-present). Previously, Ms. Wondrack served as Senior Vice President and Chief Compliance Officer for Columbia Management Investment Advisers, LLC (2005-2012); Chief Compliance Officer for certain funds within the Columbia Family of Funds (2007-2012); and Senior Vice President of Compliance Risk Management at Bank of America (2005-2010). |
Joseph F. Zambello (1957) |
Year of Election or Appointment: 2011 Deputy Treasurer |
| Mr. Zambello also serves as Deputy Treasurer of other funds. Mr. Zambello is an employee of Fidelity Investments. Previously, Mr. Zambello served as Vice President of FMR's Program Management Group (2009-2011) and Vice President of the Transfer Agent Oversight Group (2005-2009). |
Annual Report
The Board of Trustees of Fidelity Total Emerging Markets Fund voted to pay to shareholders of record at the opening of business on record date, the following distributions per share derived from capital gains realized from sales of portfolio securities and dividends derived from net investment income:
| Pay Date | Record Date | Dividends | Capital Gains |
Institutional Class | 12/08/14 | 12/05/14 | $0.199 | $0.02 |
The fund hereby designates as a capital gain dividend with respect to the taxable year ended October 31st, 2014, $135,843, or, if subsequently determined to be different, the net capital gain of such year.
Institutional Class designates 92% of the dividends distributed during the fiscal year as amounts which may be taken into account as a dividend for purposes of the maximum rate under section 1(h)(11) of the Internal Revenue Code.
The amounts per share which represent income derived from sources within, and taxes paid to, foreign countries or possessions of the United States are as follows:
| Pay Date | Income | Taxes |
Institutional Class | 12/06/13 | $0.2359 | $0.0349 |
The fund will notify shareholders in January 2015 of amounts for use in preparing 2014 income tax returns.
Annual Report
Board Approval of Investment Advisory Contracts and Management Fees
Fidelity Total Emerging Markets Fund
Each year, the Board of Trustees, including the Independent Trustees (together, the Board), votes on the renewal of the management contract with Fidelity Management & Research Company (FMR) and the sub-advisory agreements (together, the Advisory Contracts) for the fund. The Board, assisted by the advice of fund counsel and Independent Trustees' counsel, requests and considers a broad range of information relevant to the renewal of the Advisory Contracts throughout the year.
The Board meets regularly and, at each of its meetings, covers an extensive agenda of topics and materials and considers factors that are relevant to its annual consideration of the renewal of the fund's Advisory Contracts, including the services and support provided to the fund and its shareholders. The Board has established various standing committees (Committees), each composed of and chaired by Independent Trustees with varying backgrounds, to which the Board has assigned specific subject matter responsibilities in order to enhance effective decision-making by the Board. The Board, acting directly and through its Committees, requests and receives information concerning the annual consideration of the renewal of the fund's Advisory Contracts. The Board also meets as needed to consider matters specifically related to the Board's annual consideration of the renewal of the Advisory Contracts. Members of the Board may also meet with trustees of other Fidelity funds through ad hoc joint committees to discuss certain matters relevant to the Fidelity funds.
At its July 2014 meeting, the Board, including the Independent Trustees, unanimously determined to renew the fund's Advisory Contracts. In reaching its determination, the Board considered all factors it believed relevant, including (i) the nature, extent, and quality of the services to be provided to the fund and its shareholders (including the investment performance of the fund); (ii) the competitiveness of the fund's management fee and total expense ratio relative to peer funds; (iii) the total costs of the services to be provided by and the profits to be realized by Fidelity from its relationship with the fund; (iv) the extent to which economies of scale exist and would be realized as the fund grows; and (v) whether fee levels reflect these economies of scale, if any, for the benefit of fund shareholders. In connection with separate internal corporate reorganizations involving Fidelity Management & Research (U.K.) Inc. (FMR U.K.) and Fidelity Management & Research (Japan) Inc. (FMR Japan), the Board approved certain non-material amendments to the fund's sub-advisory agreements with FMR U.K. and FMR Japan to reflect that, after these reorganizations, FMR Investment Management (UK) Limited and Fidelity Management & Research (Japan) Limited will carry on the business of FMR U.K. and FMR Japan, respectively. The Board noted that no changes to the portfolio managers or to the foreign research or investment advisory services provided to the fund were expected in connection with either reorganization and that the same personnel and resources would continue to be available to the fund at the new entities.
Annual Report
Board Approval of Investment Advisory Contracts and
Management Fees - continued
In considering whether to renew the Advisory Contracts for the fund, the Board reached a determination, with the assistance of fund counsel and Independent Trustees' counsel and through the exercise of its business judgment, that the renewal of the Advisory Contracts was in the best interests of the fund and its shareholders and that the compensation payable under the Advisory Contracts was fair and reasonable. The Board's decision to renew the Advisory Contracts was not based on any single factor, but rather was based on a comprehensive consideration of all the information provided to the Board at its meetings throughout the year. The Board, in reaching its determination to renew the Advisory Contracts, was aware that shareholders of the fund have a broad range of investment choices available to them, including a wide choice among funds offered by Fidelity's competitors, and that the fund's shareholders, who have the opportunity to review and weigh the disclosure provided by the fund in its prospectus and other public disclosures, have chosen to invest in this fund, which is part of the Fidelity family of funds.
Nature, Extent, and Quality of Services Provided. The Board considered Fidelity's staffing as it relates to the fund, including the backgrounds of investment personnel of FMR and the sub-advisers (together, the Investment Advisers), and also considered the fund's investment objective, strategies, and related investment philosophy. The Independent Trustees also had discussions with senior management of Fidelity's investment operations and investment groups. The Board considered the structure of the portfolio manager compensation program and whether this structure provides appropriate incentives to act in the best interests of the fund. Additionally, the Board considered the portfolio managers' investments, if any, in the funds that they manage.
Resources Dedicated to Investment Management and Support Services. The Board and the Fund Oversight and Research Committees reviewed the general qualifications and capabilities of Fidelity's investment staff, including its size, education, experience, and resources, as well as Fidelity's approach to recruiting, training, managing, and compensating investment personnel. The Board noted that Fidelity has continued to increase the resources devoted to non-U.S. offices, including expansion of Fidelity's global investment organization. The Board also noted that Fidelity's analysts have extensive resources, tools and capabilities that allow them to conduct sophisticated quantitative and fundamental analysis, as well as credit analysis of issuers, counterparties and guarantors. Further, the Board believes that Fidelity's investment professionals have sufficient access to global information and data so as to provide competitive investment results over time, and that those professionals also have access to sophisticated tools that permit them to assess portfolio construction and risk and performance attribution characteristics continuously, as well as to transmit new information and research conclusions rapidly around the world. Additionally, in its deliberations, the Board considered Fidelity's trading and risk management capabilities and resources and global compliance infrastructure, which are an integral part of the investment management process.
Annual Report
Shareholder and Administrative Services. The Board considered (i) the nature, extent, quality, and cost of advisory, administrative, and shareholder services performed by the Investment Advisers and their affiliates under the Advisory Contracts and under separate agreements covering transfer agency, pricing and bookkeeping, and securities lending services for the fund; (ii) the nature and extent of the supervision of third party service providers, principally custodians and subcustodians; and (iii) the resources devoted to, and the record of compliance with, the fund's compliance policies and procedures. The Board also reviewed the allocation of fund brokerage, including allocations to brokers affiliated with the Investment Advisers, the use of brokerage commissions to pay fund expenses, and the use of "soft" commission dollars to pay for research services.
The Board noted that the growth of fund assets over time across the complex allows Fidelity to reinvest in the development of services designed to enhance the value or convenience of the Fidelity funds as investment vehicles. These services include 24-hour access to account information and market information through telephone representatives and over the Internet, investor education materials and asset allocation tools, and the expanded availability of Fidelity Investor Centers.
In 2014, the Board formed an ad hoc Committee on Transfer Agency Fees to review the variety of transfer agency fee structures throughout the industry and Fidelity's competitive positioning with respect to industry participants.
Investment in a Large Fund Family. The Board considered the benefits to shareholders of investing in a Fidelity fund, including the benefits of investing in a fund that is part of a large family of funds offering a variety of investment disciplines and providing a large variety of mutual fund investor services. The Board noted that Fidelity had taken, or had made recommendations that resulted in the Fidelity funds taking, a number of actions over the previous year that benefited particular funds, including (i) continuing to dedicate additional resources to investment research and to the support of the senior management team that oversees asset management; (ii) persisting in efforts to enhance Fidelity's global research capabilities; (iii) launching new funds and making other enhancements to meet client needs for income-oriented solutions; (iv) reducing fund expenses for certain index funds; (v) continuing to launch dedicated lower cost underlying funds to meet portfolio construction needs related to expanding underlying fund options for Fidelity funds of funds, specifically for the Freedom Fund product lines; (vi) rationalizing product lines and gaining increased efficiencies through fund mergers; (vii) launching sector-based exchange-traded funds and establishing a new Fidelity adviser to manage sector-based funds and products; (viii) continuing to develop and implement technology to improve security and increase efficiency; (ix) modifying the eligibility criteria for certain share classes to increase their marketability to a portion of the defined contribution plan market; (x) waiving redemption fees for certain qualified fund-of-fund and wrap programs and certain retirement plan transactions; and (xi) launching new Institutional Class shares of certain money market funds to attract and retain assets and to fill a gap in the money market fund lineup.
Annual Report
Board Approval of Investment Advisory Contracts and
Management Fees - continued
Investment Performance. The Board considered whether the fund has operated in accordance with its investment objective, as well as its record of compliance with its investment restrictions and its performance history.
The Board took into account discussions with the Investment Advisers about fund investment performance that occur at Board meetings throughout the year. In this regard the Board noted that as part of regularly scheduled fund reviews and other reports to the Board on fund performance, the Board periodically considers annualized return information for the fund, for different time periods, measured against a securities market index ("benchmark index") and a peer group of funds with similar objectives ("peer group"). In its evaluation of fund investment performance, the Board gave particular attention to information indicating changes in performance of certain Fidelity funds for specific time periods and the Investment Advisers' explanations for any overperformance or underperformance.
In addition to reviewing absolute and relative fund performance, the Independent Trustees periodically consider the appropriateness of fund performance metrics in evaluating the results achieved. In general, the Independent Trustees believe that fund performance should be evaluated based on net performance (after fees and expenses) of both the highest performing and lowest performing classes, where applicable, compared to appropriate benchmark indices, over appropriate time periods which may include full market cycles, and compared to peer groups, as applicable, over the same periods, taking into account relevant factors including the following: general market conditions; issuer-specific information; tactical opportunities for investment; and fund cash flows and other factors.
The Independent Trustees recognize that shareholders evaluate performance on a net basis over their own holding periods, for which one-, three-, and five-year periods are often used as a proxy. For this reason, the performance information reviewed by the Board also included net cumulative calendar year total return information for the fund and an appropriate benchmark index for the most recent one-year period, as shown below. A peer group comparison is not shown below.
Annual Report
Fidelity Total Emerging Markets Fund

Based on its review, the Board concluded that the nature, extent, and quality of services provided to the fund under the Advisory Contracts should benefit the fund's shareholders.
Competitiveness of Management Fee and Total Expense Ratio. The Board considered the fund's management fee and total expense ratio compared to "mapped groups" of competitive funds and classes. Fidelity creates "mapped groups" by combining similar Lipper investment objective categories that have comparable investment mandates. Combining Lipper investment objective categories aids the Board's management fee and total expense ratio comparisons by broadening the competitive group used for comparison and by reducing the number of universes to which various Fidelity funds are compared.
Management Fee. The Board considered two proprietary management fee comparisons for the 12-month (or shorter) periods shown in the chart below. The group of Lipper funds used by the Board for management fee comparisons is referred to below as the "Total Mapped Group." The Total Mapped Group comparison focuses on a fund's standing in terms of gross management fees before expense reimbursements or caps relative to the total universe of funds with comparable investment mandates, regardless of whether their management fee structures also are comparable. Funds with comparable investment mandates offer exposure to similar types of securities. Funds with comparable management fee structures have similar management fee contractual arrangements (e.g., flat rate charged for advisory services, all-inclusive fee rate, etc.). "TMG %" represents the percentage of funds in the Total Mapped Group that had management fees that were lower than the fund's. For example, a hypothetical TMG % of 20% would mean that 80% of the funds in the Total Mapped Group had higher, and 20% had lower, management fees than the fund. The fund's actual TMG %s are in the chart below. The "Asset-Size Peer Group" (ASPG) comparison focuses on a fund's standing relative to a subset of non-Fidelity funds within the Total Mapped Group that are similar in size and management fee structure. For example, if a fund is in the first quartile of the ASPG, the fund's management fee ranks in the least expensive or lowest 25% of funds in the ASPG. The ASPG represents at least 15% of the funds in the Total Mapped Group with comparable asset size and management fee structures, subject to a minimum of 50 funds (or all funds in the Total Mapped Group if fewer than 50). Additional information, such as the ASPG quartile in which the fund's management fee rate ranked, is also included in the chart and considered by the Board.
Annual Report
Board Approval of Investment Advisory Contracts and
Management Fees - continued
Fidelity Total Emerging Markets Fund

The Board noted that the fund's management fee rate ranked below the median of its Total Mapped Group and below the median of its ASPG for 2013.
The Board also noted that, in August 2013, the ad hoc Committee on Management Fees was formed to conduct an in-depth review of the management fee rates of Fidelity's active equity mutual funds. The Committee focused on the following areas: (i) standard fee structures; (ii) research consumption and trading evolution; (iii) management fee competitiveness/profitability by category; and (iv) factors that drive institutional pricing.
Based on its review, the Board concluded that the fund's management fee is fair and reasonable in light of the services that the fund receives and the other factors considered.
Annual Report
Total Expense Ratio. In its review of each class's total expense ratio the Board considered the fund's management fee as well as other fund or class expenses, as applicable, such as transfer agent fees, pricing and bookkeeping fees, fund-paid 12b-1 fees, and custodial, legal, and audit fees. The Board also noted the effects of any waivers and reimbursements on fees and expenses. As part of its review, the Board also considered the current and historical total expense ratios of each class of the fund compared to competitive fund median expenses. Each class of the fund is compared to those funds and classes in the Total Mapped Group (used by the Board for management fee comparisons) that have a similar sales load structure.
The Board noted that the total expense ratio of each of Class A and the retail class ranked below its competitive median for 2013 and the total expense ratio of each of Class T, Class C, and Institutional Class ranked above its competitive median for 2013. The Board considered that, in general, various factors can affect total expense ratios. The Board noted that the total expense ratio of Class T was above the competitive median primarily because of higher 12b-1 fees on Class T as compared to most competitor funds. Class T has a higher 12b-1 fee, but a lower front-end sales charge, than traditionally priced front-end sales charge classes. The Board considered that Class T is primarily sold load-waived in the retirement plan market where its 0.50% 12b-1 fee is comparable to competing no-load, higher 12b-1 fee classes designed specifically for retirement plans. The Board noted that the fund offers multiple classes, each of which has a different sales load and 12b-1 fee structure, and that the multiple structures are intended to offer a range of pricing options for the intermediary market. The Board also noted that the total expense ratios of the classes of the fund vary primarily by the level of their 12b-1 fees, although differences in transfer agent fees may also cause expenses to vary from class to class.
The Board further considered that FMR contractually agreed to reimburse Class A, Class T, Class C, Institutional Class, and the retail class of the fund to the extent that total operating expenses (excluding interest, certain taxes, certain securities lending costs, brokerage commissions, extraordinary expenses, and acquired fund fees and expenses, if any), as a percentage of their respective average net assets, exceed 1.65%, 1.90%, 2.40%, 1.40%, and 1.40% through December 31, 2014.
Fees Charged to Other Fidelity Clients. The Board also considered Fidelity fee structures and other information with respect to clients of Fidelity, such as other funds advised or subadvised by Fidelity, pension plan clients, and other institutional clients. The Board noted the findings of the 2013 ad hoc joint committee (created with the board of other Fidelity funds), which reviewed and compared Fidelity's institutional investment advisory business with its business of providing services to the Fidelity funds, including the differences in services provided, fees charged, and costs incurred, as well as competition in their respective marketplaces.
Annual Report
Board Approval of Investment Advisory Contracts and
Management Fees - continued
Based on its review of total expense ratios and fees charged to other Fidelity clients, the Board concluded that the total expense ratio of each class of the fund was reasonable, although in some cases above the median of the universe presented for comparison, in light of the services that the fund and its shareholders receive and the other factors considered.
Costs of the Services and Profitability. The Board considered the revenues earned and the expenses incurred by Fidelity in conducting the business of developing, marketing, distributing, managing, administering and servicing the fund and servicing the fund's shareholders. The Board also considered the level of Fidelity's profits in respect of all the Fidelity funds.
On an annual basis, Fidelity presents to the Board Fidelity's profitability for the fund. Fidelity calculates the profitability for each fund, as well as aggregate profitability for groups of Fidelity funds and all Fidelity funds, using a series of detailed revenue and cost allocation methodologies which originate with the books and records of Fidelity on which Fidelity's audited financial statements are based. The Audit Committee of the Board reviews any significant changes from the prior year's methodologies.
PricewaterhouseCoopers LLP (PwC), independent registered public accounting firm and auditor to Fidelity and certain Fidelity funds, has been engaged annually by the Board as part of the Board's assessment of Fidelity's profitability analysis. PwC's engagement includes the review and assessment of the methodologies used by Fidelity in determining the revenues and expenses attributable to Fidelity's mutual fund business, and completion of agreed-upon procedures in respect of the mathematical accuracy of fund profitability and its conformity to established allocation methodologies. After considering PwC's reports issued under the engagement and information provided by Fidelity, the Board concluded that while other allocation methods may also be reasonable, Fidelity's profitability methodologies are reasonable in all material respects.
The Board also reviewed Fidelity's non-fund businesses and fall-out benefits related to the mutual fund business as well as cases where Fidelity's affiliates may benefit from or be related to the fund's business.
The Board considered the costs of the services provided by and the profits realized by Fidelity in connection with the operation of the fund and was satisfied that the profitability was not excessive in the circumstances.
Economies of Scale. The Board considered whether there have been economies of scale in respect of the management of the Fidelity funds, whether the Fidelity funds (including the fund) have appropriately benefited from any such economies of scale, and whether there is potential for realization of any further economies of scale. The Board considered the extent to which the fund will benefit from economies of scale through increased services to the fund, through waivers or reimbursements, or through fee or expense ratio reductions. The Board also noted that in 2013, it and the boards of other Fidelity funds created an ad hoc committee (the Economies of Scale Committee) to analyze whether Fidelity attains economies of scale in respect of the management and servicing of the Fidelity funds, whether the Fidelity funds have appropriately benefited from such economies of scale, and whether there is potential for realization of any further economies of scale.
Annual Report
The Board recognized that the fund's management contract incorporates a "group fee" structure, which provides for lower group fee rates as total group assets increase, and for higher group fee rates as total group assets decrease (with "group assets" defined to include fund assets under FMR's management plus sector fund assets previously under FMR's management and currently managed by Fidelity SelectCo, LLC). FMR calculates the group fee rates based on a tiered asset "breakpoint" schedule that varies based on asset class. The Board considered that the group fee is designed to deliver the benefits of economies of scale to fund shareholders when total Fidelity fund assets increase, even if assets of any particular fund are unchanged or have declined, because some portion of Fidelity's costs are attributable to services provided to all Fidelity funds, and all funds benefit if those costs can be allocated among more assets. The Board concluded that, given the group fee structure, fund shareholders will benefit from lower management fees as group assets increase at the fund complex level, regardless of whether Fidelity achieves any such economies of scale.
The Board concluded, taking into account the analysis of the Economies of Scale Committee, that economies of scale, if any, are being appropriately shared between fund shareholders and Fidelity.
Additional Information Requested by the Board. In order to develop fully the factual basis for consideration of the Fidelity funds' Advisory Contracts, the Board requested and received additional information on certain topics, including: (i) fund performance trends and Fidelity's long-term strategies for certain funds; (ii) the potential to further rationalize the Fidelity fund lineup with the possibility of achieving savings for the funds and Fidelity; (iii) the methodology with respect to competitive fund data and peer group classifications; (iv) the arrangements with, and performance of, certain sub-advisers on behalf of the Fidelity funds, as well as certain proposed participating affiliate arrangements; (v) the realization of fall-out benefits in certain Fidelity business units; (vi) Fidelity's group fee structures, including the rationale for the individual fee rates of certain categories of funds and the definition of group assets; (vii) trends regarding industry use of performance fee structures and the performance adjustment methodologies applicable to the Fidelity funds; (viii) additional competitive analysis regarding the total expenses for certain classes; and (ix) fund profitability methodology, including Fidelity's cost allocation methodology, and the impact of certain factors on fund profitability results.
Annual Report
Board Approval of Investment Advisory Contracts and
Management Fees - continued
Based on its evaluation of all of the conclusions noted above, and after considering all factors it believed relevant, the Board ultimately concluded that the advisory fee structures are fair and reasonable, and that the fund's Advisory Contracts should be renewed.
Annual Report
Investment Adviser
Fidelity Management & Research Company
Boston, MA
Investment Sub-Advisers
FMR Co., Inc.
Fidelity Management & Research
(U.K.) Inc.
Fidelity Management & Research
(Hong Kong) Limited
Fidelity Management & Research
(Japan) Limited
FIL Investment Advisors
FIL Investment Advisors (UK) Limited
FIL Investments (Japan) Limited
General Distributor
Fidelity Distributors Corporation
Smithfield, RI
Transfer and Service Agents
Fidelity Investments Institutional Operations Company, Inc.
Boston, MA
Fidelity Service Company, Inc.
Boston, MA
Custodian
The Northern Trust Company
Chicago, IL
(Fidelity Investment logo)(registered trademark)
ATEKI-UANN-1214
1.931260.102
(Fidelity Investment logo)(registered trademark)
Fidelity Advisor®
Total International Equity
Fund - Class A, Class T, Class B,
and Class C
Annual Report
October 31, 2014
(Fidelity Cover Art)
Class A, Class T,
Class B, and Class C are
classes of Fidelity® Total
International Equity Fund
Contents
Performance | (Click Here) | How the fund has done over time. |
Management's Discussion of Fund Performance | (Click Here) | The Portfolio Manager's review of fund performance and strategy. |
Shareholder Expense Example | (Click Here) | An example of shareholder expenses. |
Investment Changes | (Click Here) | A summary of major shifts in the fund's investments over the past six months. |
Investments | (Click Here) | A complete list of the fund's investments with their market values. |
Financial Statements | (Click Here) | Statements of assets and liabilities, operations, and changes in net assets, as well as financial highlights. |
Notes | (Click Here) | Notes to the financial statements. |
Report of Independent Registered Public Accounting Firm | (Click Here) | |
Trustees and Officers | (Click Here) | |
Distributions | (Click Here) | |
Board Approval of Investment Advisory Contracts and Management Fees | (Click Here) | |
To view a fund's proxy voting guidelines and proxy voting record for the 12-month period ended June 30, visit http://www.fidelity.com/proxyvotingresults or visit the Securities and Exchange Commission's (SEC) web site at http://www.sec.gov. You may also call 1-877-208-0098 to request a free copy of the proxy voting guidelines.
Standard & Poor's, S&P and S&P 500 are registered service marks of The McGraw-Hill Companies, Inc. and have been licensed for use by Fidelity Distributors Corporation.
Other third-party marks appearing herein are the property of their respective owners.
All other marks appearing herein are registered or unregistered trademarks or service marks of FMR LLC or an affiliated company. © 2014 FMR LLC. All rights reserved.
Annual Report
This report and the financial statements contained herein are submitted for the general information of the shareholders of the fund. This report is not authorized for distribution to prospective investors in the fund unless preceded or accompanied by an effective prospectus.
A fund files its complete schedule of portfolio holdings with the SEC for the first and third quarters of each fiscal year on Form N-Q. Forms N-Q are available on the SEC's web site at http://www.sec.gov. A fund's Forms N-Q may be reviewed and copied at the SEC's Public Reference Room in Washington, DC. Information regarding the operation of the SEC's Public Reference Room may be obtained by calling 1-800-SEC-0330. For a complete list of a fund's portfolio holdings, view the most recent holdings listing, semiannual report, or annual report on Fidelity's web site at http://www.fidelity.com, http://www.advisor.fidelity.com, or http://www.401k.com, as applicable.
NOT FDIC INSURED • MAY LOSE VALUE • NO BANK GUARANTEE
Neither the fund nor Fidelity Distributors Corporation is a bank.
Annual Report
Average annual total return reflects the change in the value of an investment, assuming reinvestment of the class' distributions from dividend income and capital gains (the profits earned upon the sale of securities that have grown in value, if any) and assuming a constant rate of performance each year. The $10,000 table and the fund's returns do not reflect the deduction of taxes that a shareholder would pay on fund distributions or the redemption of fund shares. During periods of reimbursement by Fidelity, a fund's total return will be greater than it would be had the reimbursement not occurred. How a fund did yesterday is no guarantee of how it will do tomorrow.
Average Annual Total Returns
Periods ended October 31, 2014 | Past 1
year | Past 5
years | Life of
fund A |
Class A (incl. 5.75% sales charge) | -5.57% | 5.89% | -1.92% |
Class T (incl. 3.50% sales charge) | -3.56% | 6.14% | -1.82% |
Class B (incl. contingent deferred sales charge) B | -5.40% | 6.05% | -1.82% |
Class C (incl. contingent deferred sales charge) C | -1.53% | 6.35% | -1.81% |
A From November 1, 2007.
B Class B shares' contingent deferred sales charges included in the past one year, past five years, and life of fund total return figures are 5%, 2%, and 1%, respectively.
C Class C shares' contingent deferred sales charges included in the past one year, past five years, and life of fund total return figures are 1%, 0%, and 0%, respectively.
Annual Report
$10,000 Over Life of Fund
Let's say hypothetically that $10,000 was invested in Fidelity Advisor® Total International Equity Fund - Class A on November 1, 2007, when the fund started, and the current 5.75% sales charge was paid. The chart shows how the value of your investment would have changed, and also shows how the MSCI ACWI (All Country World Index) ex USA Index performed over the same period.
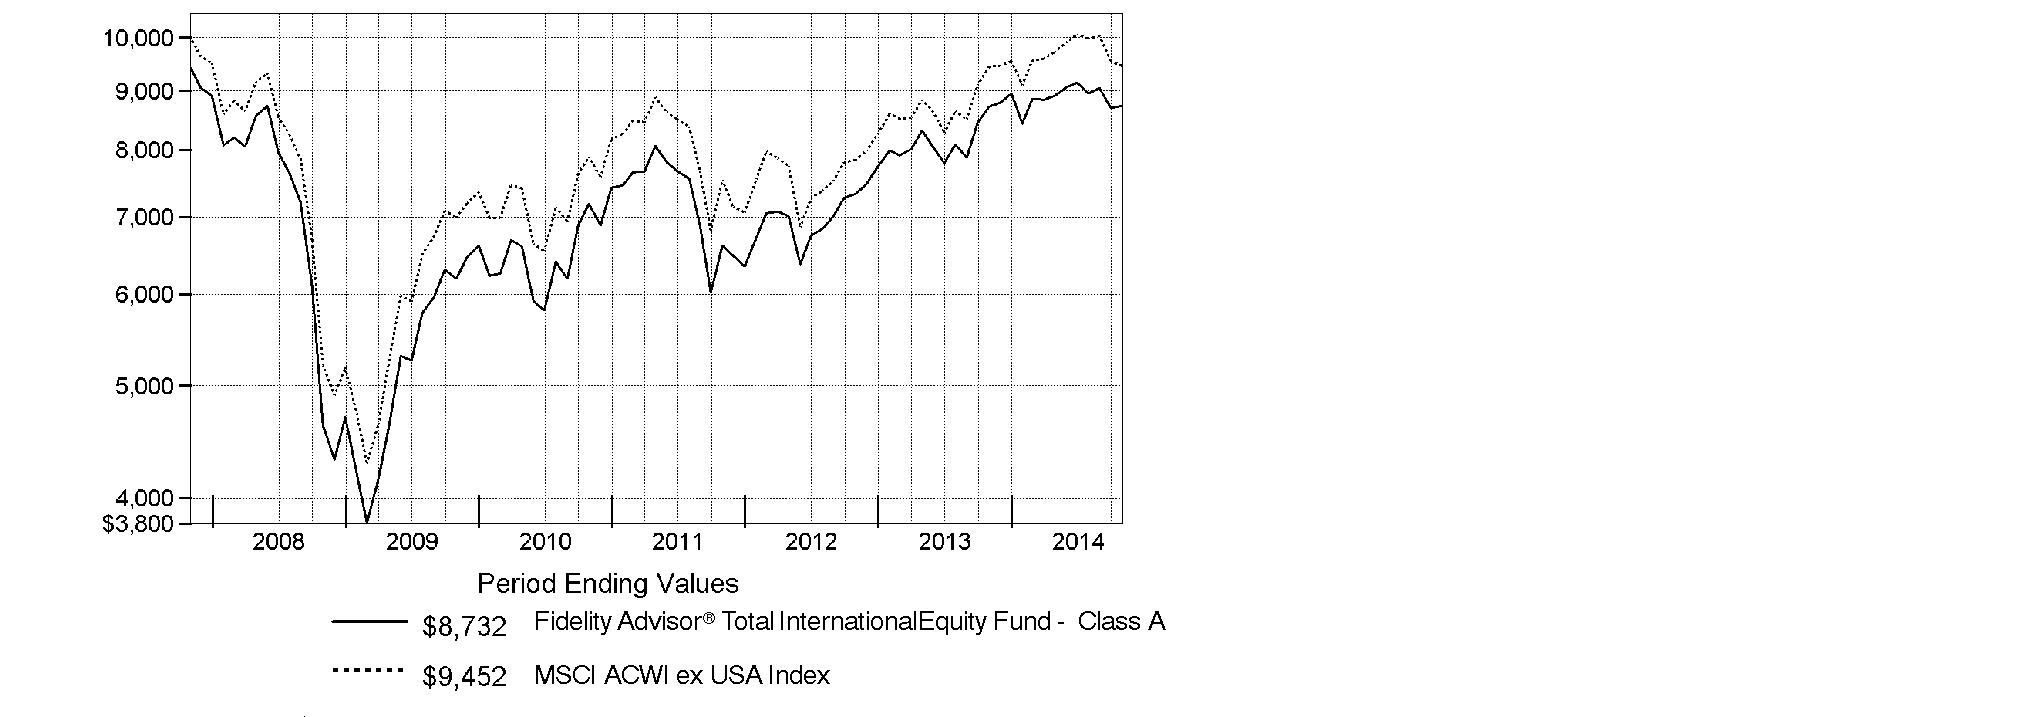
Annual Report
Market Recap: Global equities posted a healthy gain for the 12 months ending October 31, 2014, overcoming an October market decline driven by recessionary pressures in China and tepid growth in Europe. The MSCI ACWI (All Country World Index) Index rose 8.15%, helped by subdued market volatility for much of the period and supported by solid corporate earnings, especially in the United States. Stocks also benefited from easy monetary policies in Japan and the eurozone, as well as increased stimulus efforts in China. All but three of the 24 industry groups that compose the index marked a positive return. The U.S. (+17%) remained a pillar of strength, while a strongly rising dollar in the latter part of the period detracted from investors' returns in most non-U.S. markets. Canada (+5%) notched broad gains outside of its energy and materials sectors, as did Asia-Pacific ex Japan (+4%), led by investor enthusiasm for companies in India. The U.K., Europe and Japan, meanwhile, all underperformed. Among sectors, health care (+24%) led the index, with a strong contribution from the pharmaceuticals, biotechnology & life sciences industry. Information technology (+21%) also outperformed. Conversely, materials (-4%) and energy (-1%) lagged the index due to a higher supply of and lower demand for commodities.
Comments from Alexander Zavratsky, Co-Portfolio Manager of Fidelity Advisor® Total International Equity Fund: For the year, the fund's Class A, Class T, Class B and Class C shares returned 0.19%, -0.06%, -0.56% and -0.57%, respectively (excluding sales charges), compared with an advance of 0.18% for the MSCI ACWI (All Country World Index) ex USA Index. The fund benefited the most from its out-of-index investments in the U.S. Favorable positioning in the U.K. and India also helped. On the negative side, the fund lost ground in Hong Kong, while a significant underweighting in outperforming Canada further detracted. On an individual basis, U.K.-based hotel company InterContinental Hotel Group was the fund's top relative contributor. A stake in Japan-based Astellas Pharma helped, due in part to the firm's September announcement that the U.S. government had approved expanded use of its Xtandi® cancer drug. Selling our holdings in U.K.-based food retailer Tesco in the first half of the year also helped, as sliding sales and a loss in market share steadily eroded its stock price. In contrast, one notable laggard was Andritz, an Austrian industrial engineering firm that saw its stock return -21%. Another performance challenge was the fund's overweighting, on average, in Japanese bank holding company Sumitomo Mitsui Financial Group, about which we became more bearish and ultimately sold the stock during the period.
Annual Report
Note to shareholders: Sammy Simnegar became a Co-Manager on June 21, 2014, succeeding Ashish Swarup.
The views expressed above reflect those of the portfolio manager(s) only through the end of the period as stated on the cover of this report and do not necessarily represent the views of Fidelity or any other person in the Fidelity organization. Any such views are subject to change at any time based upon market or other conditions and Fidelity disclaims any responsibility to update such views. These views may not be relied on as investment advice and, because investment decisions for a Fidelity fund are based on numerous factors, may not be relied on as an indication of trading intent on behalf of any Fidelity fund.
Annual Report
Shareholder Expense Example
As a shareholder of the Fund, you incur two types of costs: (1) transaction costs, including sales charges (loads) on purchase payments or redemption proceeds, redemption fees and (2) ongoing costs, including management fees, distribution and/or service (12b-1) fees and other Fund expenses. This Example is intended to help you understand your ongoing costs (in dollars) of investing in the Fund and to compare these costs with the ongoing costs of investing in other mutual funds.
The Example is based on an investment of $1,000 invested at the beginning of the period and held for the entire period (May 1, 2014 to October 31, 2014).
Actual Expenses
The first line of the accompanying table for each class of the Fund provides information about actual account values and actual expenses. You may use the information in this line, together with the amount you invested, to estimate the expenses that you paid over the period. Simply divide your account value by $1,000.00 (for example, an $8,600 account value divided by $1,000.00 = 8.6), then multiply the result by the number in the first line for a class of the Fund under the heading entitled "Expenses Paid During Period" to estimate the expenses you paid on your account during this period. A small balance maintenance fee of $12.00 that is charged once a year may apply for certain accounts with a value of less than $2,000. This fee is not included in the table below. If it was, the estimate of expenses you paid during the period would be higher, and your ending account value lower, by this amount. In addition, the Fund, as a shareholder in the underlying Fidelity Central Funds, will indirectly bear its pro-rata share of the fees and expenses incurred by the underlying Fidelity Central Funds. These fees and expenses are not included in the Fund's annualized expense ratio used to calculate the expense estimate in the table below.
Hypothetical Example for Comparison Purposes
The second line of the accompanying table for each class of the Fund provides information about hypothetical account values and hypothetical expenses based on a Class' actual expense ratio and an assumed rate of return of 5% per year before expenses, which is not the Class' actual return. The hypothetical account values and expenses may not be used to estimate the actual ending account balance or expenses you paid for the period. You may use this information to compare the ongoing costs of investing in the Fund and other funds. To do so, compare this 5% hypothetical example with the 5% hypothetical examples that appear in the shareholder reports of the other funds. A small balance maintenance fee of $12.00 that is charged once a year may apply for certain accounts with a value of less than $2,000. This fee is not included in the table below. If it was, the estimate of expenses you paid during the period would be higher, and your ending account value lower, by this amount. In addition, the Fund, as a shareholder in the underlying Fidelity Central Funds, will indirectly bear its pro-rata share of the fees and expenses incurred by the underlying Fidelity Central Funds. These fees and expenses are not included in the Fund's annualized expense ratio used to calculate the expense estimate in the table below.
Please note that the expenses shown in the table are meant to highlight your ongoing costs only and do not reflect any transaction costs. Therefore, the second line of the table is useful in comparing ongoing costs only, and will not help you determine the relative total costs of owning different funds. In addition, if these transactional costs were included, your costs would have been higher.
Annual Report
| Annualized
Expense RatioB | Beginning
Account Value
May 1, 2014 | Ending
Account Value
October 31, 2014 | Expenses Paid
During Period*
May 1, 2014 to
October 31, 2014 |
Class A | 1.44% | | | |
Actual | | $ 1,000.00 | $ 980.40 | $ 7.19 |
HypotheticalA | | $ 1,000.00 | $ 1,017.95 | $ 7.32 |
Class T | 1.69% | | | |
Actual | | $ 1,000.00 | $ 980.50 | $ 8.44 |
HypotheticalA | | $ 1,000.00 | $ 1,016.69 | $ 8.59 |
Class B | 2.20% | | | |
Actual | | $ 1,000.00 | $ 976.90 | $ 10.96 |
HypotheticalA | | $ 1,000.00 | $ 1,014.12 | $ 11.17 |
Class C | 2.20% | | | |
Actual | | $ 1,000.00 | $ 978.00 | $ 10.97 |
HypotheticalA | | $ 1,000.00 | $ 1,014.12 | $ 11.17 |
Total International Equity | 1.04% | | | |
Actual | | $ 1,000.00 | $ 982.90 | $ 5.20 |
HypotheticalA | | $ 1,000.00 | $ 1,019.96 | $ 5.30 |
Institutional Class | 1.15% | | | |
Actual | | $ 1,000.00 | $ 981.60 | $ 5.74 |
HypotheticalA | | $ 1,000.00 | $ 1,019.41 | $ 5.85 |
A 5% return per year before expenses
B Annualized expense ratio reflects expenses net of applicable fee waivers.
* Expenses are equal to each Class' annualized expense ratio, multiplied by the average account value over the period, multiplied by 184/365 (to reflect the one-half year period).
Annual Report
Investment Changes (Unaudited)
Geographic Diversification (% of fund's net assets) |
As of October 31, 2014 |
 | United Kingdom 15.9% | |
 | Japan 13.5% | |
 | United States of America* 9.4% | |
 | Switzerland 7.8% | |
 | France 6.4% | |
 | Germany 4.9% | |
 | Australia 3.8% | |
 | Sweden 3.2% | |
 | India 2.8% | |
 | Other 32.3% | |

Percentages are based on country or territory of incorporation and are adjusted for the effect of futures contracts, if applicable. |
* Includes Short-Term Investments and Net Other Assets (Liabilities). |
As of April 30, 2014 |
| United Kingdom 15.7% | |
| Japan 12.4% | |
| United States of America* 9.7% | |
| Switzerland 8.2% | |
| France 7.5% | |
| Germany 4.7% | |
| India 4.2% | |
| Korea (South) 3.8% | |
| Sweden 3.4% | |
| Other 30.4% | |

Percentages are based on country or territory of incorporation and are adjusted for the effect of futures contracts, if applicable. |
* Includes Short-Term Investments and Net Other Assets (Liabilities). |
Asset Allocation as of October 31, 2014 |
| % of fund's
net assets | % of fund's net assets
6 months ago |
Stocks | 98.7 | 97.0 |
Short-Term Investments and Net Other Assets (Liabilities) | 1.3 | 3.0 |
Top Ten Stocks as of October 31, 2014 |
| % of fund's
net assets | % of fund's net assets
6 months ago |
Nestle SA (Switzerland, Food Products) | 2.2 | 2.2 |
Roche Holding AG (participation certificate) (Switzerland, Pharmaceuticals) | 1.9 | 1.7 |
Novartis AG (Switzerland, Pharmaceuticals) | 1.7 | 1.4 |
Prudential PLC (United Kingdom, Insurance) | 1.5 | 1.4 |
Anheuser-Busch InBev SA NV (Belgium, Beverages) | 1.3 | 1.7 |
Total SA (France, Oil, Gas & Consumable Fuels) | 1.2 | 1.8 |
Bayer AG (Germany, Pharmaceuticals) | 1.2 | 0.9 |
ING Groep NV (Certificaten Van Aandelen) (Netherlands, Banks) | 1.0 | 0.9 |
Samsung Electronics Co. Ltd. (Korea (South), Technology Hardware, Storage & Peripherals) | 1.0 | 0.0 |
HSBC Holdings PLC sponsored ADR (United Kingdom, Banks) | 1.0 | 0.8 |
| 14.0 | |
Market Sectors as of October 31, 2014 |
| % of fund's
net assets | % of fund's net assets
6 months ago |
Financials | 21.0 | 20.0 |
Consumer Discretionary | 14.5 | 13.4 |
Health Care | 13.2 | 12.0 |
Industrials | 12.7 | 12.3 |
Consumer Staples | 10.9 | 12.7 |
Information Technology | 10.6 | 8.0 |
Materials | 6.0 | 6.2 |
Telecommunication Services | 4.1 | 6.0 |
Energy | 4.1 | 3.5 |
Utilities | 1.6 | 2.9 |
Annual Report
Investments October 31, 2014
Showing Percentage of Net Assets
Common Stocks - 97.1% |
| Shares | | Value |
Australia - 3.8% |
Ansell Ltd. | 36,338 | | $ 637,392 |
Australia & New Zealand Banking Group Ltd. | 71,673 | | 2,120,846 |
Carsales.com Ltd. | 36,462 | | 344,069 |
CSL Ltd. | 42,674 | | 3,012,909 |
DuluxGroup Ltd. | 11,047 | | 52,207 |
Imdex Ltd. (a) | 42,463 | | 22,484 |
RCG Corp. Ltd. | 76,989 | | 41,646 |
SEEK Ltd. | 21,138 | | 310,198 |
Sydney Airport unit | 279,741 | | 1,087,559 |
Telstra Corp. Ltd. | 150,660 | | 749,708 |
TFS Corp. Ltd. | 42,449 | | 58,836 |
Transurban Group unit | 247,376 | | 1,771,684 |
Westpac Banking Corp. | 98,983 | | 3,038,211 |
TOTAL AUSTRALIA | | 13,247,749 |
Austria - 0.4% |
Andritz AG | 29,961 | | 1,446,258 |
Zumtobel AG | 3,400 | | 59,927 |
TOTAL AUSTRIA | | 1,506,185 |
Bailiwick of Jersey - 0.9% |
Shire PLC | 32,580 | | 2,186,018 |
Wolseley PLC | 12,722 | | 675,055 |
WPP PLC | 13,800 | | 269,551 |
TOTAL BAILIWICK OF JERSEY | | 3,130,624 |
Belgium - 2.1% |
Anheuser-Busch InBev SA NV | 41,971 | | 4,654,349 |
Gimv NV | 1,319 | | 59,918 |
KBC Ancora (a) | 4,181 | | 120,952 |
KBC Groupe SA (a) | 38,317 | | 2,052,725 |
UCB SA | 5,288 | | 426,690 |
TOTAL BELGIUM | | 7,314,634 |
Bermuda - 0.8% |
Brilliance China Automotive Holdings Ltd. | 218,000 | | 376,980 |
China Gas Holdings Ltd. | 218,000 | | 389,758 |
China Resources Gas Group Ltd. | 126,000 | | 360,169 |
Credicorp Ltd. (United States) | 3,700 | | 595,700 |
Lazard Ltd. Class A | 15,500 | | 762,755 |
Petra Diamonds Ltd. (a) | 19,900 | | 52,844 |
Common Stocks - continued |
| Shares | | Value |
Bermuda - continued |
Travelport Worldwide Ltd. | 13,500 | | $ 195,075 |
Vostok Nafta Investment Ltd. SDR (a) | 7,560 | | 48,426 |
TOTAL BERMUDA | | 2,781,707 |
Brazil - 1.5% |
Arezzo Industria e Comercio SA | 3,500 | | 40,538 |
BB Seguridade Participacoes SA | 40,200 | | 536,346 |
CCR SA | 68,300 | | 508,550 |
Cetip SA - Mercados Organizado | 24,800 | | 314,266 |
Cielo SA | 37,700 | | 619,078 |
Estacio Participacoes SA | 42,300 | | 489,935 |
Iguatemi Empresa de Shopping Centers SA | 28,500 | | 288,692 |
Kroton Educacional SA | 82,200 | | 585,840 |
Linx SA | 11,700 | | 243,075 |
Qualicorp SA (a) | 38,100 | | 387,473 |
Smiles SA | 18,600 | | 321,272 |
T4F Entretenimento SA (a) | 10,200 | | 11,526 |
Ultrapar Participacoes SA | 22,800 | | 497,332 |
Weg SA | 34,700 | | 409,331 |
TOTAL BRAZIL | | 5,253,254 |
British Virgin Islands - 0.1% |
Gem Diamonds Ltd. (a) | 23,773 | | 59,041 |
Mail.Ru Group Ltd. GDR (a)(e) | 13,900 | | 336,936 |
TOTAL BRITISH VIRGIN ISLANDS | | 395,977 |
Canada - 0.8% |
Canadian Pacific Railway Ltd. | 4,766 | | 991,343 |
Imperial Oil Ltd. | 14,900 | | 716,940 |
Pason Systems, Inc. | 5,600 | | 134,006 |
Potash Corp. of Saskatchewan, Inc. | 20,800 | | 709,974 |
ShawCor Ltd. Class A | 2,000 | | 88,106 |
TOTAL CANADA | | 2,640,369 |
Cayman Islands - 2.5% |
51job, Inc. sponsored ADR (a) | 1,100 | | 33,770 |
58.com, Inc. ADR | 900 | | 35,613 |
Alibaba Group Holding Ltd. sponsored ADR | 4,900 | | 483,140 |
Autohome, Inc. ADR Class A | 5,800 | | 306,762 |
Baidu.com, Inc. sponsored ADR (a) | 2,100 | | 501,417 |
Bitauto Holdings Ltd. ADR (a) | 3,800 | | 318,136 |
Haitian International Holdings Ltd. | 146,000 | | 313,181 |
Melco Crown Entertainment Ltd. sponsored ADR | 13,900 | | 377,246 |
Common Stocks - continued |
| Shares | | Value |
Cayman Islands - continued |
Sands China Ltd. | 319,200 | | $ 1,990,886 |
SouFun Holdings Ltd. ADR | 34,200 | | 333,450 |
Tencent Holdings Ltd. | 173,300 | | 2,785,325 |
Wynn Macau Ltd. | 374,800 | | 1,354,942 |
TOTAL CAYMAN ISLANDS | | 8,833,868 |
China - 0.3% |
China Pacific Insurance Group Co. Ltd. (H Shares) | 144,200 | | 539,619 |
PICC Property & Casualty Co. Ltd. (H Shares) | 226,000 | | 414,583 |
TOTAL CHINA | | 954,202 |
Colombia - 0.1% |
Grupo de Inversiones Suramerica SA | 19,997 | | 415,782 |
Denmark - 1.5% |
A.P. Moller - Maersk A/S Series B | 415 | | 967,017 |
Jyske Bank A/S (Reg.) (a) | 16,554 | | 891,873 |
Novo Nordisk A/S Series B sponsored ADR | 71,000 | | 3,207,780 |
Spar Nord Bank A/S | 13,331 | | 134,668 |
TOTAL DENMARK | | 5,201,338 |
Egypt - 0.1% |
Commercial International Bank SAE sponsored GDR | 58,000 | | 394,400 |
Finland - 0.6% |
Kone Oyj (B Shares) | 7,500 | | 322,373 |
Sampo Oyj (A Shares) | 28,753 | | 1,375,335 |
Tikkurila Oyj | 20,380 | | 420,886 |
TOTAL FINLAND | | 2,118,594 |
France - 6.4% |
Atos Origin SA | 13,703 | | 946,001 |
AXA SA | 60,106 | | 1,386,675 |
BNP Paribas SA | 31,354 | | 1,970,064 |
Bureau Veritas SA | 12,800 | | 316,476 |
Cap Gemini SA | 15,902 | | 1,045,401 |
Coface SA | 3,500 | | 43,597 |
GDF Suez | 48,569 | | 1,178,027 |
Havas SA | 98,586 | | 796,853 |
Ingenico SA | 3,033 | | 302,050 |
Laurent-Perrier Group SA | 859 | | 68,893 |
LVMH Moet Hennessy - Louis Vuitton SA | 2,185 | | 370,606 |
Orange SA | 80,300 | | 1,278,406 |
Pernod Ricard SA | 2,500 | | 284,559 |
Common Stocks - continued |
| Shares | | Value |
France - continued |
Publicis Groupe SA (a) | 4,400 | | $ 304,751 |
Renault SA | 10,111 | | 750,480 |
Safran SA | 25,714 | | 1,627,287 |
Saft Groupe SA | 1,254 | | 37,243 |
Sanofi SA | 31,612 | | 2,868,476 |
Schneider Electric SA | 8,290 | | 653,236 |
Total SA | 70,715 | | 4,221,919 |
Vetoquinol SA | 1,500 | | 67,670 |
Virbac SA | 460 | | 102,867 |
Vivendi SA | 61,109 | | 1,491,371 |
Zodiac Aerospace | 9,900 | | 301,905 |
TOTAL FRANCE | | 22,414,813 |
Germany - 4.4% |
Allianz SE | 13,864 | | 2,204,683 |
alstria office REIT-AG | 2,900 | | 35,956 |
BASF AG | 24,471 | | 2,153,968 |
Bayer AG | 28,312 | | 4,025,113 |
CompuGroup Medical AG | 6,146 | | 140,944 |
Continental AG | 3,983 | | 781,887 |
CTS Eventim AG | 7,966 | | 210,034 |
Fielmann AG | 2,158 | | 140,705 |
Fresenius SE & Co. KGaA | 18,300 | | 941,385 |
GEA Group AG | 16,708 | | 768,306 |
Linde AG | 18,149 | | 3,346,694 |
Siemens AG | 4,547 | | 512,872 |
TOTAL GERMANY | | 15,262,547 |
Greece - 0.2% |
Folli Follie SA | 11,900 | | 389,216 |
Greek Organization of Football Prognostics SA | 29,900 | | 362,327 |
Titan Cement Co. SA (Reg.) | 4,344 | | 96,299 |
TOTAL GREECE | | 847,842 |
Hong Kong - 0.2% |
AIA Group Ltd. | 59,200 | | 330,361 |
Galaxy Entertainment Group Ltd. | 62,000 | | 423,950 |
TOTAL HONG KONG | | 754,311 |
India - 2.8% |
Apollo Hospitals Enterprise Ltd. (a) | 15,570 | | 282,558 |
Asian Paints India Ltd. | 30,401 | | 324,794 |
Axis Bank Ltd. (a) | 52,112 | | 384,077 |
Common Stocks - continued |
| Shares | | Value |
India - continued |
Exide Industries Ltd. | 107,368 | | $ 275,273 |
Grasim Industries Ltd. | 5,109 | | 306,582 |
Havells India Ltd. | 76,303 | | 354,870 |
HCL Technologies Ltd. | 17,231 | | 451,903 |
HDFC Bank Ltd. | 33,095 | | 536,647 |
Housing Development Finance Corp. Ltd. | 79,086 | | 1,424,279 |
ICICI Bank Ltd. (a) | 17,048 | | 452,744 |
ITC Ltd. (a) | 105,347 | | 609,107 |
Jyothy Laboratories Ltd. (a) | 16,584 | | 67,645 |
Larsen & Toubro Ltd. (a) | 21,630 | | 582,912 |
LIC Housing Finance Ltd. | 60,567 | | 356,663 |
Lupin Ltd. | 15,749 | | 364,643 |
Mahindra & Mahindra Ltd. (a) | 20,039 | | 426,065 |
Motherson Sumi Systems Ltd. | 40,123 | | 274,716 |
Sun Pharmaceutical Industries Ltd. | 38,990 | | 536,574 |
Sun TV Ltd. | 66,511 | | 353,725 |
Tata Consultancy Services Ltd. | 16,606 | | 706,544 |
Tata Motors Ltd. (a) | 54,875 | | 479,423 |
Titan Co. Ltd. (a) | 58,658 | | 385,323 |
TOTAL INDIA | | 9,937,067 |
Indonesia - 1.4% |
PT ACE Hardware Indonesia Tbk | 4,495,200 | | 301,708 |
PT Astra International Tbk | 1,051,800 | | 589,756 |
PT Bank Central Asia Tbk | 634,800 | | 685,293 |
PT Bank Rakyat Indonesia Tbk | 638,600 | | 585,211 |
PT Global Mediacom Tbk | 2,698,800 | | 438,017 |
PT Indocement Tunggal Prakarsa Tbk | 208,900 | | 414,037 |
PT Jasa Marga Tbk | 697,200 | | 366,556 |
PT Media Nusantara Citra Tbk | 1,468,800 | | 340,512 |
PT Semen Gresik (Persero) Tbk | 330,800 | | 434,523 |
PT Surya Citra Media Tbk | 1,114,500 | | 311,970 |
PT Tower Bersama Infrastructure Tbk | 500,800 | | 368,887 |
TOTAL INDONESIA | | 4,836,470 |
Ireland - 1.2% |
Actavis PLC (a) | 4,600 | | 1,116,604 |
CRH PLC sponsored ADR | 61,429 | | 1,376,624 |
FBD Holdings PLC | 5,372 | | 90,881 |
Common Stocks - continued |
| Shares | | Value |
Ireland - continued |
James Hardie Industries PLC: | | | |
CDI | 15,656 | | $ 166,997 |
sponsored ADR | 29,355 | | 1,565,502 |
TOTAL IRELAND | | 4,316,608 |
Israel - 0.6% |
Azrieli Group | 13,296 | | 426,821 |
Ituran Location & Control Ltd. | 1,761 | | 36,083 |
Sarine Technologies Ltd. | 39,000 | | 90,445 |
Strauss Group Ltd. | 4,359 | | 70,309 |
Teva Pharmaceutical Industries Ltd. sponsored ADR | 27,109 | | 1,530,845 |
TOTAL ISRAEL | | 2,154,503 |
Italy - 0.8% |
Azimut Holding SpA | 25,814 | | 602,982 |
Beni Stabili SpA SIIQ | 222,926 | | 153,508 |
Interpump Group SpA | 51,891 | | 676,283 |
Intesa Sanpaolo SpA | 305,700 | | 898,684 |
Telecom Italia SpA (a) | 550,300 | | 623,645 |
TOTAL ITALY | | 2,955,102 |
Japan - 13.5% |
Air Water, Inc. | 3,000 | | 47,821 |
Aozora Bank Ltd. | 215,000 | | 755,705 |
Artnature, Inc. | 8,000 | | 108,188 |
Asahi Co. Ltd. | 4,800 | | 53,370 |
Astellas Pharma, Inc. | 195,000 | | 3,026,497 |
Autobacs Seven Co. Ltd. | 4,400 | | 64,547 |
Azbil Corp. | 4,700 | | 113,343 |
Broadleaf Co. Ltd. | 3,200 | | 50,576 |
Coca-Cola Central Japan Co. Ltd. | 30,700 | | 552,387 |
Cosmos Pharmaceutical Corp. | 700 | | 100,085 |
Daiichikosho Co. Ltd. | 1,600 | | 40,378 |
Daikokutenbussan Co. Ltd. | 5,000 | | 145,488 |
DENSO Corp. | 74,700 | | 3,423,772 |
Dentsu, Inc. | 19,400 | | 721,283 |
East Japan Railway Co. | 21,300 | | 1,663,599 |
Fanuc Corp. | 7,300 | | 1,286,521 |
Fast Retailing Co. Ltd. | 3,900 | | 1,449,854 |
Fujitsu Ltd. | 97,000 | | 589,708 |
Glory Ltd. | 2,100 | | 54,116 |
Goldcrest Co. Ltd. | 6,860 | | 124,110 |
Harmonic Drive Systems, Inc. | 6,000 | | 77,459 |
Common Stocks - continued |
| Shares | | Value |
Japan - continued |
Hitachi Ltd. | 154,000 | | $ 1,210,051 |
Hoya Corp. | 34,500 | | 1,220,846 |
Itochu Corp. | 135,300 | | 1,635,580 |
Iwatsuka Confectionary Co. Ltd. | 1,400 | | 75,625 |
Japan Tobacco, Inc. | 75,600 | | 2,579,401 |
KDDI Corp. | 20,400 | | 1,339,657 |
Keyence Corp. | 6,121 | | 2,966,131 |
Kobayashi Pharmaceutical Co. Ltd. | 1,500 | | 92,590 |
Koshidaka Holdings Co. Ltd. | 4,000 | | 68,304 |
Kyoto Kimono Yuzen Co. Ltd. | 2,600 | | 23,428 |
Lasertec Corp. | 4,500 | | 56,303 |
Medikit Co. Ltd. | 1,500 | | 46,739 |
Meiko Network Japan Co. Ltd. | 2,700 | | 30,360 |
Miraial Co. Ltd. | 2,400 | | 36,953 |
Mitsubishi Electric Corp. | 60,000 | | 773,628 |
Mitsubishi UFJ Financial Group, Inc. | 488,100 | | 2,845,240 |
Mitsui Fudosan Co. Ltd. | 63,000 | | 2,026,486 |
Nabtesco Corp. | 3,800 | | 91,962 |
Nagaileben Co. Ltd. | 6,100 | | 117,248 |
ND Software Co. Ltd. | 3,000 | | 53,760 |
Nihon M&A Center, Inc. | 1,500 | | 43,109 |
Nihon Parkerizing Co. Ltd. | 7,000 | | 167,088 |
Nippon Seiki Co. Ltd. | 3,000 | | 63,909 |
Nippon Telegraph & Telephone Corp. | 21,500 | | 1,337,705 |
NS Tool Co. Ltd. | 3,800 | | 43,645 |
OBIC Co. Ltd. | 4,000 | | 142,796 |
OMRON Corp. | 16,900 | | 799,956 |
ORIX Corp. | 62,000 | | 860,575 |
OSG Corp. | 12,400 | | 202,197 |
Paramount Bed Holdings Co. Ltd. | 1,300 | | 36,975 |
San-Ai Oil Co. Ltd. | 8,000 | | 55,377 |
Seven & i Holdings Co., Ltd. | 34,700 | | 1,355,248 |
Seven Bank Ltd. | 423,000 | | 1,766,618 |
SHO-BOND Holdings Co. Ltd. | 22,700 | | 877,134 |
Shoei Co. Ltd. | 5,900 | | 90,165 |
SK Kaken Co. Ltd. | 1,000 | | 76,533 |
SoftBank Corp. | 7,500 | | 545,996 |
Software Service, Inc. | 1,600 | | 60,932 |
Sony Financial Holdings, Inc. | 43,700 | | 697,658 |
Sumitomo Mitsui Trust Holdings, Inc. | 272,920 | | 1,114,257 |
Techno Medica Co. Ltd. | 1,800 | | 38,980 |
TFP Consulting Group Co. Ltd. | 2,000 | | 58,346 |
Common Stocks - continued |
| Shares | | Value |
Japan - continued |
The Nippon Synthetic Chemical Industry Co. Ltd. | 10,000 | | $ 61,056 |
TKC Corp. | 3,000 | | 58,894 |
Tocalo Co. Ltd. | 2,800 | | 52,819 |
Toyota Motor Corp. | 31,700 | | 1,907,618 |
Tsutsumi Jewelry Co. Ltd. | 2,000 | | 49,193 |
USS Co. Ltd. | 128,500 | | 2,022,333 |
Workman Co. Ltd. | 2,000 | | 104,531 |
Yamato Kogyo Co. Ltd. | 23,400 | | 758,043 |
TOTAL JAPAN | | 47,188,785 |
Kenya - 0.4% |
East African Breweries Ltd. | 96,600 | | 307,781 |
Kenya Commercial Bank Ltd. | 481,600 | | 296,121 |
Safaricom Ltd. | 6,274,300 | | 855,746 |
TOTAL KENYA | | 1,459,648 |
Korea (South) - 1.7% |
Bgf Retail (a) | 1,204 | | 76,199 |
Coway Co. Ltd. | 7,564 | | 574,457 |
KEPCO Plant Service & Engineering Co. Ltd. | 3,828 | | 312,455 |
Leeno Industrial, Inc. | 1,964 | | 77,778 |
NAVER Corp. | 1,947 | | 1,366,322 |
Samsung Electronics Co. Ltd. | 3,127 | | 3,620,463 |
TOTAL KOREA (SOUTH) | | 6,027,674 |
Luxembourg - 0.2% |
RTL Group SA | 6,227 | | 578,698 |
Samsonite International SA | 79,100 | | 262,828 |
TOTAL LUXEMBOURG | | 841,526 |
Malaysia - 0.3% |
Astro Malaysia Holdings Bhd | 337,500 | | 338,595 |
Public Bank Bhd | 94,100 | | 530,305 |
Tune Insurance Holdings Bhd | 441,000 | | 290,939 |
TOTAL MALAYSIA | | 1,159,839 |
Malta - 0.1% |
Brait SA | 51,016 | | 383,346 |
Mexico - 1.6% |
Banregio Grupo Financiero S.A.B. de CV | 56,700 | | 327,916 |
Consorcio ARA S.A.B. de CV (a) | 230,655 | | 106,196 |
Fomento Economico Mexicano S.A.B. de CV: | | | |
unit | 68,500 | | 658,841 |
Common Stocks - continued |
| Shares | | Value |
Mexico - continued |
Fomento Economico Mexicano S.A.B. de CV: - continued | | | |
sponsored ADR | 5,833 | | $ 561,368 |
Grupo Aeroportuario del Pacifico SA de CV Series B | 51,900 | | 353,111 |
Grupo Aeroportuario del Sureste SA de CV Series B | 32,100 | | 429,120 |
Grupo Aeroportuario Norte S.A.B. de CV | 66,000 | | 328,818 |
Grupo Financiero Banorte S.A.B. de CV Series O | 104,300 | | 669,116 |
Grupo Mexico SA de CV Series B | 153,100 | | 526,051 |
Grupo Televisa SA de CV | 98,400 | | 711,133 |
Megacable Holdings S.A.B. de CV unit | 71,300 | | 326,631 |
Promotora y Operadora de Infraestructura S.A.B. de CV (a) | 27,600 | | 350,620 |
Qualitas Controladora S.A.B. de CV | 101,200 | | 261,750 |
TOTAL MEXICO | | 5,610,671 |
Netherlands - 1.6% |
Aalberts Industries NV | 7,600 | | 202,336 |
ASM International NV (depositary receipt) | 1,050 | | 34,367 |
Heijmans NV (Certificaten Van Aandelen) | 8,481 | | 115,207 |
ING Groep NV (Certificaten Van Aandelen) (a) | 253,023 | | 3,623,381 |
Reed Elsevier NV | 69,904 | | 1,608,778 |
VastNed Retail NV | 3,438 | | 156,974 |
TOTAL NETHERLANDS | | 5,741,043 |
Nigeria - 0.3% |
Dangote Cement PLC | 262,417 | | 340,596 |
Guaranty Trust Bank PLC GDR (Reg. S) | 38,400 | | 295,680 |
Nigerian Breweries PLC | 277,569 | | 271,453 |
TOTAL NIGERIA | | 907,729 |
Norway - 0.3% |
Statoil ASA | 40,700 | | 931,437 |
Philippines - 0.7% |
Alliance Global Group, Inc. | 722,700 | | 406,490 |
GT Capital Holdings, Inc. | 16,525 | | 371,308 |
Jollibee Food Corp. | 14,560 | | 63,458 |
Metropolitan Bank & Trust Co. | 159,590 | | 292,820 |
Robinsons Retail Holdings, Inc. | 203,460 | | 289,559 |
SM Investments Corp. | 22,980 | | 400,441 |
SM Prime Holdings, Inc. | 1,147,600 | | 446,103 |
TOTAL PHILIPPINES | | 2,270,179 |
Common Stocks - continued |
| Shares | | Value |
Russia - 0.4% |
Magnit OJSC GDR (Reg. S) | 10,200 | | $ 683,400 |
NOVATEK OAO GDR (Reg. S) | 5,000 | | 537,000 |
TOTAL RUSSIA | | 1,220,400 |
Singapore - 0.3% |
Singapore Telecommunications Ltd. | 325,000 | | 956,565 |
South Africa - 2.7% |
Alexander Forbes Group Holding (a) | 440,894 | | 343,769 |
Aspen Pharmacare Holdings Ltd. | 18,700 | | 667,044 |
Bidvest Group Ltd. | 20,332 | | 559,226 |
Clicks Group Ltd. | 126,095 | | 858,563 |
Coronation Fund Managers Ltd. | 35,200 | | 304,776 |
FirstRand Ltd. | 131,700 | | 563,588 |
Life Healthcare Group Holdings Ltd. | 93,500 | | 353,494 |
Mr Price Group Ltd. | 21,800 | | 450,932 |
MTN Group Ltd. | 69,800 | | 1,544,115 |
Nampak Ltd. | 122,830 | | 500,797 |
Naspers Ltd. Class N | 17,300 | | 2,152,966 |
Remgro Ltd. | 21,400 | | 490,834 |
Sanlam Ltd. | 78,100 | | 493,181 |
TOTAL SOUTH AFRICA | | 9,283,285 |
Spain - 2.0% |
Amadeus IT Holding SA Class A | 29,964 | | 1,100,197 |
Banco Bilbao Vizcaya Argentaria SA | 136,679 | | 1,528,739 |
Iberdrola SA | 212,300 | | 1,500,753 |
Inditex SA | 84,310 | | 2,368,214 |
Prosegur Compania de Seguridad SA (Reg.) | 83,576 | | 490,152 |
TOTAL SPAIN | | 6,988,055 |
Sweden - 3.2% |
ASSA ABLOY AB (B Shares) | 38,500 | | 2,039,145 |
Atlas Copco AB (A Shares) | 57,159 | | 1,649,558 |
Fagerhult AB | 46,655 | | 859,284 |
H&M Hennes & Mauritz AB (B Shares) | 37,639 | | 1,497,068 |
Intrum Justitia AB | 24,563 | | 729,823 |
Meda AB (A Shares) | 38,100 | | 500,491 |
Nordea Bank AB | 137,267 | | 1,760,417 |
Svenska Cellulosa AB (SCA) (B Shares) | 24,726 | | 552,841 |
Svenska Handelsbanken AB (A Shares) | 30,315 | | 1,445,517 |
TOTAL SWEDEN | | 11,034,144 |
Common Stocks - continued |
| Shares | | Value |
Switzerland - 7.8% |
Compagnie Financiere Richemont SA Series A | 4,451 | | $ 374,483 |
Credit Suisse Group AG | 49,298 | | 1,313,486 |
Nestle SA | 103,458 | | 7,586,996 |
Novartis AG | 64,870 | | 6,020,122 |
Roche Holding AG (participation certificate) | 22,895 | | 6,756,352 |
Schindler Holding AG: | | | |
(participation certificate) | 6,511 | | 909,503 |
(Reg.) | 2,251 | | 304,610 |
SGS SA (Reg.) | 150 | | 329,263 |
Syngenta AG (Switzerland) | 1,602 | | 495,431 |
UBS AG (NY Shares) | 188,297 | | 3,272,602 |
TOTAL SWITZERLAND | | 27,362,848 |
Taiwan - 1.2% |
Addcn Technology Co. Ltd. | 4,000 | | 38,469 |
Delta Electronics, Inc. | 95,000 | | 569,035 |
Giant Manufacturing Co. Ltd. | 41,000 | | 331,458 |
Merida Industry Co. Ltd. | 49,500 | | 341,395 |
Taiwan Semiconductor Manufacturing Co. Ltd. | 661,035 | | 2,861,034 |
TOTAL TAIWAN | | 4,141,391 |
Thailand - 0.5% |
Airports of Thailand PCL (For. Reg.) | 57,700 | | 428,613 |
Bangkok Dusit Medical Services PCL (For. Reg.) | 585,700 | | 332,499 |
Bumrungrad Hospital PCL (For. Reg.) | 86,300 | | 352,344 |
Kasikornbank PCL (For. Reg.) | 85,800 | | 621,429 |
TOTAL THAILAND | | 1,734,885 |
Turkey - 0.6% |
Albaraka Turk Katilim Bankasi A/S | 81,907 | | 57,856 |
Coca-Cola Icecek Sanayi A/S | 53,889 | | 1,229,241 |
TAV Havalimanlari Holding A/S | 51,000 | | 427,935 |
Tofas Turk Otomobil Fabrikasi A/S | 8,618 | | 54,089 |
Tupras Turkiye Petrol Rafinelleri A/S | 19,000 | | 412,458 |
TOTAL TURKEY | | 2,181,579 |
United Arab Emirates - 0.2% |
DP World Ltd. | 16,669 | | 319,378 |
First Gulf Bank PJSC | 79,996 | | 395,297 |
TOTAL UNITED ARAB EMIRATES | | 714,675 |
United Kingdom - 15.9% |
Advanced Computer Software Group PLC | 22,800 | | 39,391 |
Common Stocks - continued |
| Shares | | Value |
United Kingdom - continued |
Al Noor Hospitals Group PLC | 21,900 | | $ 356,991 |
AstraZeneca PLC (United Kingdom) | 33,328 | | 2,434,557 |
Babcock International Group PLC | 46,423 | | 813,178 |
BAE Systems PLC | 295,421 | | 2,167,747 |
Bank of Georgia Holdings PLC | 7,100 | | 290,761 |
Barclays PLC | 447,074 | | 1,719,410 |
Bellway PLC | 6,228 | | 174,252 |
Berendsen PLC | 45,355 | | 732,799 |
BG Group PLC | 134,327 | | 2,238,698 |
BHP Billiton PLC | 109,137 | | 2,819,730 |
British American Tobacco PLC (United Kingdom) | 5,000 | | 283,388 |
Britvic PLC | 11,317 | | 123,196 |
BT Group PLC | 52,775 | | 311,126 |
Bunzl PLC | 44,657 | | 1,210,871 |
Burberry Group PLC | 14,300 | | 350,227 |
Compass Group PLC | 81,207 | | 1,306,863 |
Dechra Pharmaceuticals PLC | 9,000 | | 109,132 |
Derwent London PLC | 2,000 | | 95,054 |
Diageo PLC | 10,651 | | 314,123 |
Elementis PLC | 34,808 | | 146,946 |
GlaxoSmithKline PLC | 87,497 | | 1,978,654 |
Great Portland Estates PLC | 13,372 | | 146,851 |
H&T Group PLC | 10,000 | | 25,435 |
Hilton Food Group PLC | 5,400 | | 32,394 |
HSBC Holdings PLC sponsored ADR | 68,466 | | 3,493,135 |
Imperial Tobacco Group PLC | 43,447 | | 1,884,204 |
Informa PLC | 181,654 | | 1,397,747 |
InterContinental Hotel Group PLC ADR | 60,596 | | 2,303,254 |
Intertek Group PLC | 7,000 | | 304,807 |
ITE Group PLC | 20,600 | | 56,104 |
ITV PLC | 361,119 | | 1,172,695 |
Johnson Matthey PLC | 27,877 | | 1,326,250 |
Liberty Global PLC Class A (a) | 16,700 | | 759,349 |
Meggitt PLC | 14,039 | | 101,309 |
National Grid PLC | 152,291 | | 2,259,993 |
Next PLC | 5,900 | | 608,294 |
Persimmon PLC | 3,737 | | 87,459 |
Prudential PLC | 228,088 | | 5,281,612 |
Reckitt Benckiser Group PLC | 34,751 | | 2,918,537 |
Rolls-Royce Group PLC | 78,652 | | 1,060,659 |
Rotork PLC | 10,003 | | 408,846 |
Royal Dutch Shell PLC Class A sponsored ADR | 36,429 | | 2,615,238 |
Common Stocks - continued |
| Shares | | Value |
United Kingdom - continued |
SABMiller PLC | 50,863 | | $ 2,868,135 |
Shaftesbury PLC | 56,637 | | 648,712 |
Spectris PLC | 5,970 | | 172,095 |
Spirax-Sarco Engineering PLC | 5,107 | | 232,836 |
Standard Chartered PLC (United Kingdom) | 23,349 | | 350,954 |
Ted Baker PLC | 2,775 | | 86,342 |
Ultra Electronics Holdings PLC | 4,501 | | 125,644 |
Unite Group PLC | 84,677 | | 578,405 |
Vodafone Group PLC sponsored ADR | 75,826 | | 2,518,940 |
TOTAL UNITED KINGDOM | | 55,843,329 |
United States of America - 8.1% |
A.O. Smith Corp. | 6,400 | | 341,440 |
AbbVie, Inc. | 8,429 | | 534,904 |
Altria Group, Inc. | 16,000 | | 773,440 |
ANSYS, Inc. (a) | 400 | | 31,424 |
Autoliv, Inc. | 17,154 | | 1,573,708 |
Berkshire Hathaway, Inc. Class B (a) | 6,816 | | 955,331 |
BorgWarner, Inc. | 30,394 | | 1,733,066 |
Broadridge Financial Solutions, Inc. | 1,140 | | 50,080 |
Constellation Brands, Inc. Class A (sub. vtg.) (a) | 9,100 | | 833,014 |
Cummins, Inc. | 7,091 | | 1,036,562 |
Dril-Quip, Inc. (a) | 870 | | 78,257 |
Evercore Partners, Inc. Class A | 1,160 | | 60,053 |
FMC Technologies, Inc. (a) | 11,403 | | 639,024 |
Google, Inc.: | | | |
Class A (a) | 2,890 | | 1,641,144 |
Class C (a) | 1,890 | | 1,056,661 |
International Flavors & Fragrances, Inc. | 3,300 | | 327,195 |
Kansas City Southern | 2,600 | | 319,254 |
Kennedy-Wilson Holdings, Inc. | 5,283 | | 143,116 |
Las Vegas Sands Corp. | 5,600 | | 348,656 |
Martin Marietta Materials, Inc. | 11,080 | | 1,295,474 |
MasterCard, Inc. Class A | 27,890 | | 2,335,788 |
Mead Johnson Nutrition Co. Class A | 5,700 | | 566,067 |
Mohawk Industries, Inc. (a) | 8,535 | | 1,212,311 |
National Oilwell Varco, Inc. | 4,046 | | 293,901 |
Oceaneering International, Inc. | 9,038 | | 635,100 |
Philip Morris International, Inc. | 13,200 | | 1,174,932 |
PPG Industries, Inc. | 1,800 | | 366,642 |
Praxair, Inc. | 2,200 | | 277,178 |
PriceSmart, Inc. | 7,385 | | 657,487 |
Common Stocks - continued |
| Shares | | Value |
United States of America - continued |
ResMed, Inc. (d) | 11,020 | | $ 575,464 |
ResMed, Inc. CDI | 129,128 | | 679,013 |
Solera Holdings, Inc. | 18,894 | | 981,543 |
SS&C Technologies Holdings, Inc. (a) | 21,354 | | 1,031,825 |
T-Mobile U.S., Inc. (a) | 15,300 | | 446,607 |
Union Pacific Corp. | 7,000 | | 815,150 |
Visa, Inc. Class A | 9,831 | | 2,373,498 |
W.R. Grace & Co. (a) | 3,500 | | 331,100 |
TOTAL UNITED STATES OF AMERICA | | 28,525,409 |
TOTAL COMMON STOCKS (Cost $290,918,842) |
340,176,388
|
Nonconvertible Preferred Stocks - 1.6% |
| | | |
Brazil - 1.0% |
Ambev SA sponsored ADR | 136,200 | | 909,816 |
Banco Bradesco SA (PN) sponsored ADR | 71,100 | | 1,065,078 |
Companhia Brasileira de Distribuicao Grupo Pao de Acucar sponsored ADR | 10,200 | | 426,360 |
Itau Unibanco Holding SA sponsored ADR | 75,000 | | 1,107,000 |
TOTAL BRAZIL | | 3,508,254 |
Colombia - 0.1% |
Grupo Aval Acciones y Valores SA | 525,754 | | 356,465 |
Germany - 0.5% |
Henkel AG & Co. KGaA | 3,000 | | 296,169 |
Sartorius AG (non-vtg.) | 1,050 | | 114,475 |
Volkswagen AG | 6,090 | | 1,297,768 |
TOTAL GERMANY | | 1,708,412 |
United Kingdom - 0.0% |
Rolls-Royce Group PLC | 7,078,680 | | 11,324 |
TOTAL NONCONVERTIBLE PREFERRED STOCKS (Cost $5,704,650) |
5,584,455
|
Money Market Funds - 0.9% |
| Shares | | Value |
Fidelity Cash Central Fund, 0.11% (b) | 2,704,556 | | $ 2,704,556 |
Fidelity Securities Lending Cash Central Fund, 0.11% (b)(c) | 452,625 | | 452,625 |
TOTAL MONEY MARKET FUNDS (Cost $3,157,181) |
3,157,181
|
TOTAL INVESTMENT PORTFOLIO - 99.6% (Cost $299,780,673) | 348,918,024 |
NET OTHER ASSETS (LIABILITIES) - 0.4% | | 1,402,864 |
NET ASSETS - 100% | $ 350,320,888 |
Legend |
(a) Non-income producing |
(b) Affiliated fund that is generally available only to investment companies and other accounts managed by Fidelity Investments. The rate quoted is the annualized seven-day yield of the fund at period end. A complete unaudited listing of the fund's holdings as of its most recent quarter end is available upon request. In addition, each Fidelity Central Fund's financial statements, which are not covered by the Fund's Report of Independent Registered Public Accounting Firm, are available on the SEC's website or upon request. |
(c) Investment made with cash collateral received from securities on loan. |
(d) Security or a portion of the security is on loan at period end. |
(e) Security exempt from registration under Rule 144A of the Securities Act of 1933. These securities may be resold in transactions exempt from registration, normally to qualified institutional buyers. At the end of the period, the value of these securities amounted to $336,936 or 0.1% of net assets. |
Affiliated Central Funds |
Information regarding fiscal year to date income earned by the Fund from investments in Fidelity Central Funds is as follows: |
Fund | Income earned |
Fidelity Cash Central Fund | $ 5,978 |
Fidelity Securities Lending Cash Central Fund | 110,200 |
Total | $ 116,178 |
Other Information |
Categorizations in the Schedule of Investments are based on country or territory of incorporation. |
The following is a summary of the inputs used, as of October 31, 2014, involving the Fund's assets and liabilities carried at fair value. The inputs or methodology used for valuing securities may not be an indication of the risk associated with investing in those securities. For more information on valuation inputs, and their aggregation into the levels used in the tables below, please refer to the Investment Valuation section in the accompanying Notes to Financial Statements. |
Valuation Inputs at Reporting Date: |
Description | Total | Level 1 | Level 2 | Level 3 |
Investments in Securities: | | | | |
Equities: | | | | |
Consumer Discretionary | $ 51,485,253 | $ 31,400,031 | $ 20,085,222 | $ - |
Consumer Staples | 37,901,378 | 19,087,199 | 18,814,179 | - |
Energy | 14,094,793 | 6,647,362 | 7,447,431 | - |
Financials | 73,719,494 | 33,537,412 | 40,182,082 | - |
Health Care | 47,021,999 | 15,198,757 | 31,823,242 | - |
Industrials | 43,672,266 | 30,186,330 | 13,485,936 | - |
Information Technology | 36,382,263 | 21,380,327 | 15,001,936 | - |
Materials | 21,426,223 | 15,220,061 | 6,206,162 | - |
Telecommunication Services | 14,368,474 | 6,856,779 | 7,511,695 | - |
Utilities | 5,688,700 | 2,678,780 | 3,009,920 | - |
Money Market Funds | 3,157,181 | 3,157,181 | - | - |
Total Investments in Securities: | $ 348,918,024 | $ 185,350,219 | $ 163,567,805 | $ - |
The following is a summary of transfers between Level 1 and Level 2 for the period ended October 31, 2014. Transfers are assumed to have occurred at the beginning of the period, and are primarily attributable to the valuation techniques used for foreign equity securities, as discussed in the accompanying Notes to Financial Statements: |
Transfers | Total |
Level 1 to Level 2 | $ 31,040,538 |
Level 2 to Level 1 | $ 0 |
See accompanying notes which are an integral part of the financial statements.
Annual Report
Statement of Assets and Liabilities
| October 31, 2014 |
| | |
Assets | | |
Investment in securities, at value (including securities loaned of $443,870) - See accompanying schedule: Unaffiliated issuers (cost $296,623,492) | $ 345,760,843 | |
Fidelity Central Funds (cost $3,157,181) | 3,157,181 | |
Total Investments (cost $299,780,673) | | $ 348,918,024 |
Foreign currency held at value (cost $531,237) | | 530,341 |
Receivable for investments sold | | 3,130,638 |
Receivable for fund shares sold | | 34,825 |
Dividends receivable | | 809,645 |
Distributions receivable from Fidelity Central Funds | | 794 |
Prepaid expenses | | 1,062 |
Receivable from investment adviser for expense reductions | | 886 |
Other receivables | | 1,769 |
Total assets | | 353,427,984 |
| | |
Liabilities | | |
Payable to custodian bank | $ 268,222 | |
Payable for investments purchased | 1,568,693 | |
Payable for fund shares redeemed | 167,932 | |
Accrued management fee | 237,167 | |
Distribution and service plan fees payable | 9,184 | |
Other affiliated payables | 54,537 | |
Other payables and accrued expenses | 348,736 | |
Collateral on securities loaned, at value | 452,625 | |
Total liabilities | | 3,107,096 |
| | |
Net Assets | | $ 350,320,888 |
Net Assets consist of: | | |
Paid in capital | | $ 318,656,094 |
Undistributed net investment income | | 5,238,848 |
Accumulated undistributed net realized gain (loss) on investments and foreign currency transactions | | (22,463,589) |
Net unrealized appreciation (depreciation) on investments and assets and liabilities in foreign currencies | | 48,889,535 |
Net Assets | | $ 350,320,888 |
See accompanying notes which are an integral part of the financial statements.
Annual Report
Statement of Assets and Liabilities - continued
| October 31, 2014 |
| | |
Calculation of Maximum Offering Price Class A:
Net Asset Value and redemption price per share ($9,163,958 ÷ 1,145,034 shares) | | $ 8.00 |
| | |
Maximum offering price per share (100/94.25 of $8.00) | | $ 8.49 |
Class T:
Net Asset Value and redemption price per share ($10,282,207 ÷ 1,278,916 shares) | | $ 8.04 |
| | |
Maximum offering price per share (100/96.50 of $8.04) | | $ 8.33 |
Class B:
Net Asset Value and offering price per share ($167,965 ÷ 20,859 shares)A | | $ 8.05 |
| | |
Class C:
Net Asset Value and offering price per share ($4,028,383 ÷ 503,849 shares)A | | $ 8.00 |
| | |
Total International Equity:
Net Asset Value, offering price and redemption price per share ($324,438,192 ÷ 40,382,479 shares) | | $ 8.03 |
| | |
Institutional Class:
Net Asset Value, offering price and redemption price per share ($2,240,183 ÷ 280,204 shares) | | $ 7.99 |
A Redemption price per share is equal to net asset value less any applicable contingent deferred sales charge.
See accompanying notes which are an integral part of the financial statements.
Annual Report
Financial Statements - continued
Statement of Operations
| Year ended October 31, 2014 |
| | |
Investment Income | | |
Dividends | | $ 11,693,447 |
Income from Fidelity Central Funds | | 116,178 |
Income before foreign taxes withheld | | 11,809,625 |
Less foreign taxes withheld | | (748,463) |
Total income | | 11,061,162 |
| | |
Expenses | | |
Management fee
Basic fee | $ 2,527,278 | |
Performance adjustment | 193,246 | |
Transfer agent fees | 465,968 | |
Distribution and service plan fees | 109,662 | |
Accounting and security lending fees | 187,763 | |
Custodian fees and expenses | 227,812 | |
Independent trustees' compensation | 1,481 | |
Registration fees | 71,601 | |
Audit | 96,390 | |
Legal | 1,290 | |
Interest | 723 | |
Miscellaneous | 6,436 | |
Total expenses before reductions | 3,889,650 | |
Expense reductions | (2,484) | 3,887,166 |
Net investment income (loss) | | 7,173,996 |
Realized and Unrealized Gain (Loss) Net realized gain (loss) on: | | |
Investment securities: | | |
Unaffiliated issuers (net of foreign taxes of $589,388) | 5,722,532 | |
Foreign currency transactions | (82,685) | |
Total net realized gain (loss) | | 5,639,847 |
Change in net unrealized appreciation (depreciation) on: Investment securities (net of increase in deferred foreign taxes of $98,574) | (11,108,073) | |
Assets and liabilities in foreign currencies | (29,837) | |
Total change in net unrealized appreciation (depreciation) | | (11,137,910) |
Net gain (loss) | | (5,498,063) |
Net increase (decrease) in net assets resulting from operations | | $ 1,675,933 |
See accompanying notes which are an integral part of the financial statements.
Annual Report
Statement of Changes in Net Assets
| Year ended
October 31,
2014 | Year ended
October 31,
2013 |
Increase (Decrease) in Net Assets | | |
Operations | | |
Net investment income (loss) | $ 7,173,996 | $ 5,165,980 |
Net realized gain (loss) | 5,639,847 | 8,529,722 |
Change in net unrealized appreciation (depreciation) | (11,137,910) | 44,726,463 |
Net increase (decrease) in net assets resulting
from operations | 1,675,933 | 58,422,165 |
Distributions to shareholders from net investment income | (5,090,375) | (5,845,552) |
Distributions to shareholders from net realized gain | (7,679,276) | (9,769,201) |
Total distributions | (12,769,651) | (15,614,753) |
Share transactions - net increase (decrease) | 13,925,925 | 10,109,727 |
Redemption fees | 3,247 | 2,498 |
Total increase (decrease) in net assets | 2,835,454 | 52,919,637 |
| | |
Net Assets | | |
Beginning of period | 347,485,434 | 294,565,797 |
End of period (including undistributed net investment income of $5,238,848 and undistributed net investment income of $4,647,078, respectively) | $ 350,320,888 | $ 347,485,434 |
See accompanying notes which are an integral part of the financial statements.
Annual Report
Financial Highlights - Class A
Years ended October 31, | 2014 | 2013 | 2012 | 2011 | 2010 |
Selected Per-Share Data | | | | | |
Net asset value, beginning of period | $ 8.27 | $ 7.31 | $ 6.67 | $ 7.36 | $ 6.40 |
Income from Investment Operations | | | | | |
Net investment income (loss) C | .13 | .09 | .13 | .11 | .08 |
Net realized and unrealized gain (loss) | (.12) | 1.24 | .59 | (.69) | .95 |
Total from investment operations | .01 | 1.33 | .72 | (.58) | 1.03 |
Distributions from net investment income | (.10) | (.13) | (.08) | (.09) | (.04) |
Distributions from net realized gain | (.18) | (.25) | - | (.02) | (.03) |
Total distributions | (.28) | (.37) H | (.08) | (.11) | (.07) |
Redemption fees added to paid in capital C,G | - | - | - | - | - |
Net asset value, end of period | $ 8.00 | $ 8.27 | $ 7.31 | $ 6.67 | $ 7.36 |
Total ReturnA, B | .19% | 19.00% | 10.88% | (8.03)% | 16.17% |
Ratios to Average Net Assets D, F | | | | | |
Expenses before reductions | 1.44% | 1.50% | 1.57% | 1.73% | 2.02% |
Expenses net of fee waivers, if any | 1.44% | 1.45% | 1.45% | 1.45% | 1.50% |
Expenses net of all reductions | 1.44% | 1.43% | 1.42% | 1.42% | 1.47% |
Net investment income (loss) | 1.63% | 1.21% | 1.88% | 1.44% | 1.15% |
Supplemental Data | | | | | |
Net assets, end of period (000 omitted) | $ 9,164 | $ 9,034 | $ 5,767 | $ 4,307 | $ 5,029 |
Portfolio turnover rateE | 85% | 89% | 110% | 75% | 67% |
A Total returns would have been lower if certain expenses had not been reduced during the applicable periods shown.
B Total returns do not include the effect of the sales charges.
C Calculated based on average shares outstanding during the period.
D Fees and expenses of any underlying Fidelity Central Funds are not included in the Fund's expense ratio. The Fund indirectly bears its proportionate share of the expenses of any underlying Fidelity Central Funds.
E Amount does not include the portfolio activity of any underlying Fidelity Central Funds.
F Expense ratios reflect operating expenses of the class. Expenses before reductions do not reflect amounts reimbursed by the investment adviser or reductions from brokerage service arrangements or reductions from other expense offset arrangements and do not represent the amount paid by the class during periods when reimbursements or reductions occur. Expenses net of fee waivers reflect expenses after reimbursement by the investment adviser but prior to reductions from brokerage service arrangements or other expense offset arrangements. Expenses net of all reductions represent the net expenses paid by the class.
G Amount represents less than $.01 per share.
H Total distributions of $.37 per share is comprised of distributions from net investment income of $.126 and distributions from net realized gain of $.245 per share.
See accompanying notes which are an integral part of the financial statements.
Annual Report
Financial Highlights - Class T
Years ended October 31, | 2014 | 2013 | 2012 | 2011 | 2010 |
Selected Per-Share Data | | | | | |
Net asset value, beginning of period | $ 8.32 | $ 7.37 | $ 6.73 | $ 7.41 | $ 6.40 |
Income from Investment Operations | | | | | |
Net investment income (loss) C | .11 | .07 | .11 | .09 | .06 |
Net realized and unrealized gain (loss) | (.12) | 1.25 | .59 | (.68) | .95 |
Total from investment operations | (.01) | 1.32 | .70 | (.59) | 1.01 |
Distributions from net investment income | (.09) | (.13) | (.06) | (.07) | - |
Distributions from net realized gain | (.18) | (.25) | - | (.02) | - |
Total distributions | (.27) | (.37)H | (.06) | (.09) | - |
Redemption fees added to paid in capital C,G | - | - | - | - | - |
Net asset value, end of period | $ 8.04 | $ 8.32 | $ 7.37 | $ 6.73 | $ 7.41 |
Total ReturnA, B | (.06)% | 18.73% | 10.52% | (8.08)% | 15.78% |
Ratios to Average Net Assets D, F | | | | | |
Expenses before reductions | 1.68% | 1.75% | 1.84% | 2.02% | 2.31% |
Expenses net of fee waivers, if any | 1.68% | 1.70% | 1.70% | 1.70% | 1.75% |
Expenses net of all reductions | 1.68% | 1.67% | 1.67% | 1.67% | 1.72% |
Net investment income (loss) | 1.38% | .96% | 1.63% | 1.19% | .90% |
Supplemental Data | | | | | |
Net assets, end of period (000 omitted) | $ 10,282 | $ 7,909 | $ 2,348 | $ 997 | $ 1,004 |
Portfolio turnover rateE | 85% | 89% | 110% | 75% | 67% |
A Total returns would have been lower if certain expenses had not been reduced during the applicable periods shown.
B Total returns do not include the effect of the sales charges.
C Calculated based on average shares outstanding during the period.
D Fees and expenses of any underlying Fidelity Central Funds are not included in the Fund's expense ratio. The Fund indirectly bears its proportionate share of the expenses of any underlying Fidelity Central Funds.
E Amount does not include the portfolio activity of any underlying Fidelity Central Funds.
F Expense ratios reflect operating expenses of the class. Expenses before reductions do not reflect amounts reimbursed by the investment adviser or reductions from brokerage service arrangements or reductions from other expense offset arrangements and do not represent the amount paid by the class during periods when reimbursements or reductions occur. Expenses net of fee waivers reflect expenses after reimbursement by the investment adviser but prior to reductions from brokerage service arrangements or other expense offset arrangements. Expenses net of all reductions represent the net expenses paid by the class.
G Amount represents less than $.01 per share.
H Total distributions of $.37 per share is comprised of distributions from net investment income of $.128 and distributions from net realized gain of $.245 per share.
See accompanying notes which are an integral part of the financial statements.
Annual Report
Financial Highlights - Class B
Years ended October 31, | 2014 | 2013 | 2012 | 2011 | 2010 |
Selected Per-Share Data | | | | | |
Net asset value, beginning of period | $ 8.31 | $ 7.33 | $ 6.68 | $ 7.37 | $ 6.39 |
Income from Investment Operations | | | | | |
Net investment income (loss) C | .07 | .04 | .08 | .05 | .03 |
Net realized and unrealized gain (loss) | (.12) | 1.24 | .59 | (.68) | .95 |
Total from investment operations | (.05) | 1.28 | .67 | (.63) | .98 |
Distributions from net investment income | (.03) | (.05) | (.02) | (.04) | - |
Distributions from net realized gain | (.18) | (.25) | - | (.02) | - |
Total distributions | (.21) | (.30) | (.02) | (.06) | - |
Redemption fees added to paid in capital C,G | - | - | - | - | - |
Net asset value, end of period | $ 8.05 | $ 8.31 | $ 7.33 | $ 6.68 | $ 7.37 |
Total ReturnA, B | (.56)% | 18.05% | 10.05% | (8.66)% | 15.34% |
Ratios to Average Net Assets D, F | | | | | |
Expenses before reductions | 2.22% | 2.26% | 2.34% | 2.51% | 2.81% |
Expenses net of fee waivers, if any | 2.20% | 2.20% | 2.20% | 2.20% | 2.25% |
Expenses net of all reductions | 2.20% | 2.18% | 2.17% | 2.17% | 2.22% |
Net investment income (loss) | .87% | .46% | 1.13% | .69% | .40% |
Supplemental Data | | | | | |
Net assets, end of period (000 omitted) | $ 168 | $ 192 | $ 220 | $ 254 | $ 327 |
Portfolio turnover rateE | 85% | 89% | 110% | 75% | 67% |
A Total returns would have been lower if certain expenses had not been reduced during the applicable periods shown.
B Total returns do not include the effect of the contingent deferred sales charge.
C Calculated based on average shares outstanding during the period.
D Fees and expenses of any underlying Fidelity Central Funds are not included in the Fund's expense ratio. The Fund indirectly bears its proportionate share of the expenses of any underlying Fidelity Central Funds.
E Amount does not include the portfolio activity of any underlying Fidelity Central Funds.
F Expense ratios reflect operating expenses of the class. Expenses before reductions do not reflect amounts reimbursed by the investment adviser or reductions from brokerage service arrangements or reductions from other expense offset arrangements and do not represent the amount paid by the class during periods when reimbursements or reductions occur. Expenses net of fee waivers reflect expenses after reimbursement by the investment adviser but prior to reductions from brokerage service arrangements or other expense offset arrangements. Expenses net of all reductions represent the net expenses paid by the class.
G Amount represents less than $.01 per share.
See accompanying notes which are an integral part of the financial statements.
Annual Report
Financial Highlights - Class C
Years ended October 31, | 2014 | 2013 | 2012 | 2011 | 2010 |
Selected Per-Share Data | | | | | |
Net asset value, beginning of period | $ 8.28 | $ 7.31 | $ 6.67 | $ 7.36 | $ 6.39 |
Income from Investment Operations | | | | | |
Net investment income (loss) C | .07 | .04 | .08 | .05 | .03 |
Net realized and unrealized gain (loss) | (.12) | 1.25 | .58 | (.69) | .94 |
Total from investment operations | (.05) | 1.29 | .66 | (.64) | .97 |
Distributions from net investment income | (.05) | (.08) | (.02) | (.03) | - |
Distributions from net realized gain | (.18) | (.25) | - | (.02) | - |
Total distributions | (.23) | (.32) H | (.02) | (.05) | - |
Redemption fees added to paid in capital C,G | - | - | - | - | - |
Net asset value, end of period | $ 8.00 | $ 8.28 | $ 7.31 | $ 6.67 | $ 7.36 |
Total ReturnA, B | (.57)% | 18.30% | 9.98% | (8.72)% | 15.18% |
Ratios to Average Net Assets D, F | | | | | |
Expenses before reductions | 2.22% | 2.26% | 2.31% | 2.51% | 2.80% |
Expenses net of fee waivers, if any | 2.20% | 2.20% | 2.20% | 2.20% | 2.25% |
Expenses net of all reductions | 2.20% | 2.18% | 2.17% | 2.17% | 2.22% |
Net investment income (loss) | .87% | .46% | 1.13% | .69% | .40% |
Supplemental Data | | | | | |
Net assets, end of period (000 omitted) | $ 4,028 | $ 3,584 | $ 2,737 | $ 1,396 | $ 1,423 |
Portfolio turnover rateE | 85% | 89% | 110% | 75% | 67% |
A Total returns would have been lower if certain expenses had not been reduced during the applicable periods shown.
B Total returns do not include the effect of the contingent deferred sales charge.
C Calculated based on average shares outstanding during the period.
D Fees and expenses of any underlying Fidelity Central Funds are not included in the Fund's expense ratio. The Fund indirectly bears its proportionate share of the expenses of any underlying Fidelity Central Funds.
E Amount does not include the portfolio activity of any underlying Fidelity Central Funds.
F Expense ratios reflect operating expenses of the class. Expenses before reductions do not reflect amounts reimbursed by the investment adviser or reductions from brokerage service arrangements or reductions from other expense offset arrangements and do not represent the amount paid by the class during periods when reimbursements or reductions occur. Expenses net of fee waivers reflect expenses after reimbursement by the investment adviser but prior to reductions from brokerage service arrangements or other expense offset arrangements. Expenses net of all reductions represent the net expenses paid by the class.
G Amount represents less than $.01 per share.
H Total distributions of $.32 per share is comprised of distributions from net investment income of $.075 and distributions from net realized gain of $.245 per share.
See accompanying notes which are an integral part of the financial statements.
Annual Report
Financial Highlights - Total International Equity
Years ended October 31, | 2014 | 2013 | 2012 | 2011 | 2010 |
Selected Per-Share Data | | | | | |
Net asset value, beginning of period | $ 8.29 | $ 7.32 | $ 6.69 | $ 7.37 | $ 6.41 |
Income from Investment Operations | | | | | |
Net investment income (loss) B | .16 | .12 | .15 | .12 | .09 |
Net realized and unrealized gain (loss) | (.12) | 1.24 | .58 | (.68) | .96 |
Total from investment operations | .04 | 1.36 | .73 | (.56) | 1.05 |
Distributions from net investment income | (.12) | (.15) | (.10) | (.10) | (.06) |
Distributions from net realized gain | (.18) | (.25) | - | (.02) | (.03) |
Total distributions | (.30) | (.39) G | (.10) | (.12) | (.09) |
Redemption fees added to paid in capital B, F | - | - | - | - | - |
Net asset value, end of period | $ 8.03 | $ 8.29 | $ 7.32 | $ 6.69 | $ 7.37 |
Total ReturnA | .55% | 19.48% | 11.03% | (7.70)% | 16.45% |
Ratios to Average Net Assets C, E | | | | | |
Expenses before reductions | 1.04% | 1.09% | 1.16% | 1.42% | 1.79% |
Expenses net of fee waivers, if any | 1.04% | 1.09% | 1.16% | 1.20% | 1.25% |
Expenses net of all reductions | 1.04% | 1.07% | 1.13% | 1.17% | 1.22% |
Net investment income (loss) | 2.03% | 1.57% | 2.16% | 1.69% | 1.40% |
Supplemental Data | | | | | |
Net assets, end of period (000 omitted) | $ 324,438 | $ 324,395 | $ 281,979 | $ 131,338 | $ 60,826 |
Portfolio turnover rateD | 85% | 89% | 110% | 75% | 67% |
A Total returns would have been lower if certain expenses had not been reduced during the applicable periods shown.
B Calculated based on average shares outstanding during the period.
C Fees and expenses of any underlying Fidelity Central Funds are not included in the Fund's expense ratio. The Fund indirectly bears its proportionate share of the expenses of any underlying Fidelity Central Funds.
D Amount does not include the portfolio activity of any underlying Fidelity Central Funds.
E Expense ratios reflect operating expenses of the class. Expenses before reductions do not reflect amounts reimbursed by the investment adviser or reductions from brokerage service arrangements or reductions from other expense offset arrangements and do not represent the amount paid by the class during periods when reimbursements or reductions occur. Expenses net of fee waivers reflect expenses after reimbursement by the investment adviser but prior to reductions from brokerage service arrangements or other expense offset arrangements. Expenses net of all reductions represent the net expenses paid by the class.
F Amount represents less than $.01 per share.
G Total distributions of $.39 per share is comprised of distributions from net investment income of $.148 and distributions from net realized gain of $.245 per share.
See accompanying notes which are an integral part of the financial statements.
Annual Report
Financial Highlights - Institutional Class
Years ended October 31, | 2014 | 2013 | 2012 | 2011 | 2010 |
Selected Per-Share Data | | | | | |
Net asset value, beginning of period | $ 8.26 | $ 7.30 | $ 6.67 | $ 7.35 | $ 6.41 |
Income from Investment Operations | | | | | |
Net investment income (loss) B | .15 | .11 | .14 | .12 | .10 |
Net realized and unrealized gain (loss) | (.12) | 1.24 | .59 | (.68) | .95 |
Total from investment operations | .03 | 1.35 | .73 | (.56) | 1.05 |
Distributions from net investment income | (.12) | (.15) | (.10) | (.10) | (.08) |
Distributions from net realized gain | (.18) | (.25) | - | (.02) | (.03) |
Total distributions | (.30) | (.39)G | (.10) | (.12) | (.11) |
Redemption fees added to paid in capital B, F | - | - | - | - | - |
Net asset value, end of period | $ 7.99 | $ 8.26 | $ 7.30 | $ 6.67 | $ 7.35 |
Total ReturnA | .37% | 19.40% | 11.06% | (7.72)% | 16.48% |
Ratios to Average Net Assets C, E | | | | | |
Expenses before reductions | 1.15% | 1.21% | 1.27% | 1.48% | 1.82% |
Expenses net of fee waivers, if any | 1.15% | 1.20% | 1.20% | 1.20% | 1.25% |
Expenses net of all reductions | 1.15% | 1.18% | 1.17% | 1.17% | 1.23% |
Net investment income (loss) | 1.91% | 1.46% | 2.13% | 1.69% | 1.40% |
Supplemental Data | | | | | |
Net assets, end of period (000 omitted) | $ 2,240 | $ 2,372 | $ 1,514 | $ 197 | $ 28 |
Portfolio turnover rateD | 85% | 89% | 110% | 75% | 67% |
A Total returns would have been lower if certain expenses had not been reduced during the applicable periods shown.
B Calculated based on average shares outstanding during the period.
C Fees and expenses of any underlying Fidelity Central Funds are not included in the Fund's expense ratio. The Fund indirectly bears its proportionate share of the expenses of any underlying Fidelity Central Funds.
D Amount does not include the portfolio activity of any underlying Fidelity Central Funds.
E Expense ratios reflect operating expenses of the class. Expenses before reductions do not reflect amounts reimbursed by the investment adviser or reductions from brokerage service arrangements or reductions from other expense offset arrangements and do not represent the amount paid by the class during periods when reimbursements or reductions occur. Expenses net of fee waivers reflect expenses after reimbursement by the investment adviser but prior to reductions from brokerage service arrangements or other expense offset arrangements. Expenses net of all reductions represent the net expenses paid by the class.
F Amount represents less than $.01 per share.
G Total distributions of $.39 per share is comprised of distributions from net investment income of $.148 and distributions from net realized gain of $.245 per share.
See accompanying notes which are an integral part of the financial statements.
Annual Report
Notes to Financial Statements
For the period ended October 31, 2014
1. Organization.
Fidelity Total International Equity Fund (the Fund) is a fund of Fidelity Investment Trust (the Trust) and is authorized to issue an unlimited number of shares. The Trust is registered under the Investment Company Act of 1940, as amended (the 1940 Act), as an open-end management investment company organized as a Massachusetts business trust. The Fund offers Class A, Class T, Class C, Total International Equity and Institutional Class shares, each of which, along with Class B shares, has equal rights as to assets and voting privileges. Class B shares are closed to new accounts and additional purchases, except for exchanges and reinvestments. Each class has exclusive voting rights with respect to matters that affect that class. Class B shares will automatically convert to Class A shares after a holding period of seven years from the initial date of purchase. The Fund's investments in emerging markets can be subject to social, economic, regulatory, and political uncertainties and can be extremely volatile.
2. Investments in Fidelity Central Funds.
The Fund invests in Fidelity Central Funds, which are open-end investment companies generally available only to other investment companies and accounts managed by the investment adviser and its affiliates. The Fund's Schedule of Investments lists each of the Fidelity Central Funds held as of period end, if any, as an investment of the Fund, but does not include the underlying holdings of each Fidelity Central Fund. As an Investing Fund, the Fund indirectly bears its proportionate share of the expenses of the underlying Fidelity Central Funds.
The Money Market Central Funds seek preservation of capital and current income and are managed by Fidelity Investments Money Management, Inc. (FIMM), an affiliate of the investment adviser. Annualized expenses of the Money Market Central Funds as of their most recent shareholder report date are less than .01%.
A complete unaudited list of holdings for each Fidelity Central Fund is available upon request or at the Securities and Exchange Commission (the SEC) website at www.sec.gov. In addition, the financial statements of the Fidelity Central Funds, which are not covered by the Fund's Report of Independent Registered Public Accounting Firm, are available on the SEC website or upon request.
3. Significant Accounting Policies.
The financial statements have been prepared in conformity with accounting principles generally accepted in the United States of America (GAAP), which require management to make certain estimates and assumptions at the date of the financial statements. Actual results could differ from those estimates. Subsequent events, if any, through the date that the financial statements were issued have been evaluated in the preparation of the financial statements. The following summarizes the significant accounting policies of the Fund:
Annual Report
Notes to Financial Statements - continued
3. Significant Accounting Policies - continued
Investment Valuation. Investments are valued as of 4:00 p.m. Eastern time on the last calendar day of the period. In accordance with valuation policies and procedures approved by the Board of Trustees (the Board), the Fund attempts to obtain prices from one or more third party pricing vendors or brokers to value its investments. When current market prices, quotations or currency exchange rates are not readily available or reliable, investments will be fair valued in good faith by the Fidelity Management & Research Company (FMR) Fair Value Committee (the Committee), in accordance with procedures adopted by the Board. Factors used in determining fair value vary by investment type and may include market or investment specific events. The frequency with which these procedures are used cannot be predicted and they may be utilized to a significant extent. The Committee oversees the Fund's valuation policies and procedures and is responsible for approving and reporting to the Board all fair value determinations.
The Fund categorizes the inputs to valuation techniques used to value its investments into a disclosure hierarchy consisting of three levels as shown below:
Level 1 - quoted prices in active markets for identical investments
Level 2 - other significant observable inputs (including quoted prices for similar investments, interest rates, prepayment speeds, etc.)
Level 3 - unobservable inputs (including the Fund's own assumptions based on the best information available)
Valuation techniques used to value the Fund's investments by major category are as follows:
Equity securities, including restricted securities, for which market quotations are readily available, are valued at the last reported sale price or official closing price as reported by a third party pricing vendor on the primary market or exchange on which they are traded and are categorized as Level 1 in the hierarchy. In the event there were no sales during the day or closing prices are not available, securities are valued at the last quoted bid price or may be valued using the last available price and are generally categorized as Level 2 in the hierarchy. For foreign equity securities, when market or security specific events arise, comparisons to the valuation of American Depositary Receipts (ADRs), futures contracts, Exchange-Traded Funds (ETFs) and certain indexes as well as quoted prices for similar securities may be used and would be categorized as Level 2 in the hierarchy. Utilizing these techniques may result in transfers between Level 1 and Level 2. For equity securities, including restricted securities, where observable inputs are limited, assumptions about market activity and risk are used and these securities may be categorized as Level 3 in the hierarchy.
Annual Report
3. Significant Accounting Policies - continued
Investment Valuation - continued
The U.S. dollar value of foreign currency contracts is determined using currency exchange rates supplied by a pricing service and are categorized as Level 2 in the hierarchy. Investments in open-end mutual funds are valued at their closing net asset value (NAV) each business day and are categorized as Level 1 in the hierarchy.
Changes in valuation techniques may result in transfers in or out of an assigned level within the disclosure hierarchy. The aggregate value of investments by input level, as of October 31, 2014, including information on transfers between Levels 1 and 2 is included at the end of the Fund's Schedule of Investments.
Foreign Currency. The Fund may use foreign currency contracts to facilitate transactions in foreign-denominated securities. Gains and losses from these transactions may arise from changes in the value of the foreign currency or if the counterparties do not perform under the contracts' terms.
Foreign-denominated assets, including investment securities, and liabilities are translated into U.S. dollars at the exchange rates at period end. Purchases and sales of investment securities, income and dividends received and expenses denominated in foreign currencies are translated into U.S. dollars at the exchange rate in effect on the transaction date.
The effects of exchange rate fluctuations on investments are included with the net realized and unrealized gain (loss) on investment securities. Other foreign currency transactions resulting in realized and unrealized gain (loss) are disclosed separately.
Investment Transactions and Income. For financial reporting purposes, the Fund's investment holdings and NAV include trades executed through the end of the last business day of the period. The NAV per share for processing shareholder transactions is calculated as of the close of business of the New York Stock Exchange (NYSE), normally 4:00 p.m. Eastern time and includes trades executed through the end of the prior business day. Gains and losses on securities sold are determined on the basis of identified cost and may include proceeds received from litigation. Dividend income is recorded on the ex-dividend date, except for certain dividends from foreign securities where the ex-dividend date may have passed, which are recorded as soon as the Fund is informed of the ex-dividend date. Non-cash dividends included in dividend income, if any, are recorded at the fair market value of the securities received. Income and capital gain distributions from Fidelity Central Funds, if any, are recorded on the ex-dividend date. Distributions received on securities that represent a return of capital or capital gain are recorded as a reduction of cost of investments and/or as a realized gain. Subsequent to ex-dividend date the Fund determines the components of these distributions, based
Annual Report
Notes to Financial Statements - continued
3. Significant Accounting Policies - continued
Investment Transactions and Income - continued
upon receipt of tax filings or other correspondence relating to the underlying investment. Interest income is accrued as earned and includes coupon interest and amortization of premium and accretion of discount on debt securities as applicable. Investment income is recorded net of foreign taxes withheld where recovery of such taxes is uncertain.
Class Allocations and Expenses. Investment income, realized and unrealized capital gains and losses, common expenses of the Fund, and certain fund-level expense reductions, if any, are allocated daily on a pro-rata basis to each class based on the relative net assets of each class to the total net assets of the Fund. Each class differs with respect to transfer agent and distribution and service plan fees incurred. Certain expense reductions may also differ by class. For the reporting period, the allocated portion of income and expenses to each class as a percent of its average net assets may vary due to the timing of recording these transactions in relation to fluctuating net assets of the classes. Expenses directly attributable to a fund are charged to that fund. Expenses attributable to more than one fund are allocated among the respective funds on the basis of relative net assets or other appropriate methods. Expense estimates are accrued in the period to which they relate and adjustments are made when actual amounts are known.
Income Tax Information and Distributions to Shareholders. Each year, the Fund intends to qualify as a regulated investment company under Subchapter M of the Internal Revenue Code, including distributing substantially all of its taxable income and realized gains. As a result, no provision for U.S. Federal income taxes is required. As of October 31, 2014, the Fund did not have any unrecognized tax benefits in the financial statements; nor is the Fund aware of any tax positions for which it is reasonably possible that the total amounts of unrecognized tax benefits will significantly change in the next twelve months. The Fund files a U.S. federal tax return, in addition to state and local tax returns as required. The Fund's federal income tax returns are subject to examination by the Internal Revenue Service (IRS) for a period of three fiscal years after they are filed. State and local tax returns may be subject to examination for an additional fiscal year depending on the jurisdiction. Foreign taxes are provided for based on the Fund's understanding of the tax rules and rates that exist in the foreign markets in which it invests. The Fund is subject to a tax imposed on capital gains by certain countries in which it invests. An estimated deferred tax liability for net unrealized appreciation on the applicable securities is included in Other payables and accrued expenses on the Statement of Assets & Liabilities.
Distributions are declared and recorded on the ex-dividend date. Income dividends and capital gain distributions are declared separately for each class. Income and capital gain distributions are determined in accordance with income tax regulations, which may differ from GAAP. In addition, the Fund claimed a portion of the payment made to redeeming shareholders as a distribution for income tax purposes.
Annual Report
3. Significant Accounting Policies - continued
Income Tax Information and Distributions to Shareholders - continued
Capital accounts within the financial statements are adjusted for permanent book-tax differences. These adjustments have no impact on net assets or the results of operations. Capital accounts are not adjusted for temporary book-tax differences which will reverse in a subsequent period.
Book-tax differences are primarily due to foreign currency transactions, partnerships, certain foreign taxes, passive foreign investment companies (PFIC), capital loss carryforwards and losses deferred due to wash sales.
The federal tax cost of investment securities and unrealized appreciation (depreciation) as of period end were as follows:
Gross unrealized appreciation | $ 58,023,153 |
Gross unrealized depreciation | (10,503,108) |
Net unrealized appreciation (depreciation) on securities | $ 47,520,045 |
| |
Tax Cost | $ 301,397,979 |
The tax-based components of distributable earnings as of period end were as follows:
Undistributed ordinary income | $ 5,259,862 |
Undistributed long-term capital gain | $ 1,617,012 |
Capital Loss Carryforward | $ (22,463,295) |
Net unrealized appreciation (depreciation) on securities and other investments | $ 47,496,394 |
Capital loss carry forwards are only available to offset future capital gains of the Fund to the extent provided by regulations and may be limited. Under the Regulated Investment Company Modernization Act of 2012 (the Act), the Fund is permitted to carry forward capital losses incurred in taxable years beginning after December 22, 2010 for an unlimited period and such capital losses are required to be used prior to any losses that expire. Capital loss carryforwards were as follows:
Fiscal year of expiration: | |
2017 | $ (13,607,298) |
2019 | (8,855,997) |
Total capital loss carryforward | $ (22,463,295) |
Due to large subscriptions in a prior period, $22,463,295 of capital losses that will be available to offset future capital gains of the Fund will be limited by approximately $4,535,766 per year.
Annual Report
Notes to Financial Statements - continued
3. Significant Accounting Policies - continued
Income Tax Information and Distributions to Shareholders - continued
The tax character of distributions paid was as follows:
| October 31, 2014 | October 31, 2013 |
Ordinary Income | $ 9,375,496 | $ 15,216,010 |
Long-term Capital Gains | 3,394,155 | 398,743 |
Total | $ 12,769,651 | $ 15,614,753 |
Short-Term Trading (Redemption) Fees. Shares held by investors in the Fund less than 30 days may have been subject to a redemption fee equal to 1.00% of the NAV of shares redeemed. All redemption fees, which reduce the proceeds of the shareholder redemption, are retained by the Fund and accounted for as an addition to paid in capital.
Restricted Securities. The Fund may invest in securities that are subject to legal or contractual restrictions on resale. These securities generally may be resold in transactions exempt from registration or to the public if the securities are registered. Disposal of these securities may involve time-consuming negotiations and expense, and prompt sale at an acceptable price may be difficult. Information regarding restricted securities is included at the end of the Fund's Schedule of Investments.
New Accounting Pronouncement. In June 2014, the Financial Accounting Standards Board issued Accounting Standard Update No. 2014-11, Repurchase-to-Maturity Transactions, Repurchase Financings, and Disclosures. The Update amends the accounting for certain repurchase agreements and expands disclosure requirements for reverse repurchase agreements, securities lending and other similar transactions. The disclosure requirements are effective for annual and interim reporting periods beginning after December 15, 2014. Management is currently evaluating the impact of the Update on the Fund's financial statements and related disclosures.
4. Purchases and Sales of Investments.
Purchases and sales of securities, other than short-term securities, aggregated $309,792,512 and $301,150,794, respectively.
5. Fees and Other Transactions with Affiliates.
Management Fee. Fidelity Management & Research Company (the investment adviser) and its affiliates provide the Fund with investment management related services for which the Fund pays a monthly management fee. The management fee is the sum of an individual fund fee rate that is based on an annual rate of .45% of the Fund's average net assets and an annualized group fee rate that averaged .25% during the period. The group fee rate is based upon the average net assets of all the mutual funds
Annual Report
5. Fees and Other Transactions with Affiliates - continued
Management Fee - continued
advised by the investment adviser, including any mutual funds previously advised by the investment adviser that are currently advised by Fidelity SelectCo, LLC, an affiliate of the investment adviser. The group fee rate decreases as assets under management increase and increases as assets under management decrease. In addition, the management fee is subject to a performance adjustment (up to a maximum of ± .20% of the Fund's average net assets over a 36 month performance period). The upward or downward adjustment to the management fee is based on the relative investment performance of Total International Equity as compared to its benchmark index, the MSCI All Country World ex USA Index, over the same 36 month performance period. For the reporting period, the total annual management fee rate, including the performance adjustment, was ..75% of the Fund's average net assets. The performance adjustment included in the management fee rate may be higher or lower than the maximum performance adjustment rate due to the difference between the average net assets for the reporting and performance periods.
Distribution and Service Plan Fees. In accordance with Rule 12b-1 of the 1940 Act, the Fund has adopted separate Distribution and Service Plans for each class of shares. Certain classes pay Fidelity Distributors Corporation (FDC), an affiliate of the investment adviser, separate Distribution and Service Fees, each of which is based on an annual percentage of each class' average net assets. In addition, FDC may pay financial intermediaries for selling shares of the Fund and providing shareholder support services. For the period, the Distribution and Service Fee rates, total fees and amounts retained by FDC were as follows:
| Distribution
Fee | Service
Fee | Total Fees | Retained
by FDC |
Class A | -% | .25% | $ 23,345 | $ 783 |
Class T | .25% | .25% | 45,742 | 42 |
Class B | .75% | .25% | 1,819 | 1,368 |
Class C | .75% | .25% | 38,756 | 4,324 |
| | | $ 109,662 | $ 6,517 |
Sales Load. FDC may receive a front-end sales charge of up to 5.75% for selling Class A shares and 3.50% for selling Class T shares, some of which is paid to financial intermediaries for selling shares of the Fund. Depending on the holding period, FDC may receive contingent deferred sales charges levied on Class A, Class T, Class B and Class C redemptions. The deferred sales charges range from 5.00% to 1.00% for Class B shares, 1.00% for Class C shares, 1.00% for certain purchases of Class A shares and .25% for certain purchases of Class T shares.
Annual Report
Notes to Financial Statements - continued
5. Fees and Other Transactions with Affiliates - continued
Sales Load - continued
For the period, sales charge amounts retained by FDC were as follows:
| Retained
by FDC |
Class A | $ 2,209 |
Class T | 1,579 |
Class B* | 44 |
Class C* | 255 |
| $ 4,087 |
* When Class B and Class C shares are initially sold, FDC pays commissions from its own resources to financial intermediaries through which the sales are made.
Transfer Agent Fees. Fidelity Investments Institutional Operations Company, Inc., (FIIOC), an affiliate of the investment adviser, is the transfer, dividend disbursing and shareholder servicing agent for each class of the Fund. FIIOC receives account fees and asset-based fees that vary according to the account size and type of account of the shareholders of the respective classes of the Fund. FIIOC pays for typesetting, printing and mailing of shareholder reports, except proxy statements.
For the period, transfer agent fees for each class were as follows:
| Amount | % of
Class-Level Average
Net Assets |
Class A | $ 25,151 | .27 |
Class T | 24,329 | .27 |
Class B | 548 | .30 |
Class C | 11,816 | .30 |
Total International Equity | 398,576 | .12 |
Institutional Class | 5,548 | .24 |
| $ 465,968 | |
Accounting and Security Lending Fees. Fidelity Service Company, Inc. (FSC), an affiliate of the investment adviser, maintains the Fund's accounting records. The accounting fee is based on the level of average net assets for each month. Under a separate contract, FSC administers the security lending program. The security lending fee is based on the number and duration of lending transactions.
Brokerage Commissions. The Fund placed a portion of its portfolio transactions with brokerage firms which are affiliates of the investment adviser. Brokerage commissions are included in net realized gain (loss) and change in net unrealized appreciation (depreciation) in the Statement of Operations. The commissions paid to these affiliated firms were $1,000 for the period.
Annual Report
5. Fees and Other Transactions with Affiliates - continued
Interfund Lending Program. Pursuant to an Exemptive Order issued by the SEC, the Fund, along with other registered investment companies having management contracts with FMR or other affiliated entities of FMR, may participate in an interfund lending program. This program provides an alternative credit facility allowing the funds to borrow from, or lend money to, other participating affiliated funds. At period end, there were no interfund loans outstanding. The Fund's activity in this program during the period for which loans were outstanding was as follows:
Borrower or Lender | Average Loan
Balance | Weighted Average Interest Rate | Interest Expense |
Borrower | $ 11,277,714 | .33% | $ 723 |
Other. During the period, the investment adviser reimbursed the Fund for certain losses in the amount of $1,056.
6. Committed Line of Credit.
The Fund participates with other funds managed by the investment adviser or an affiliate in a $4.25 billion credit facility (the "line of credit") to be utilized for temporary or emergency purposes to fund shareholder redemptions or for other short-term liquidity purposes. The Fund has agreed to pay commitment fees on its pro-rata portion of the line of credit, which amounted to $583 and is reflected in Miscellaneous expenses on the Statement of Operations. During the period, the Fund did not borrow on this line of credit.
7. Security Lending.
The Fund lends portfolio securities through a lending agent from time to time in order to earn additional income. For equity securities, a lending agent is used and may loan securities to certain qualified borrowers, including Fidelity Capital Markets (FCM), a broker-dealer affiliated with the Fund. On the settlement date of the loan, the Fund receives collateral (in the form of U.S. Treasury obligations, letters of credit and/or cash) against the loaned securities and maintains collateral in an amount not less than 100% of the market value of the loaned securities during the period of the loan. The market value of the loaned securities is determined at the close of business of the Fund and any additional required collateral is delivered to the Fund on the next business day. If the borrower defaults on its obligation to return the securities loaned because of insolvency or other reasons, the Fund may apply collateral received from the borrower against the obligation. The Fund may experience delays and costs in recovering the securities loaned. Any cash collateral received is invested in the Fidelity Securities Lending Cash
Annual Report
Notes to Financial Statements - continued
7. Security Lending - continued
Central Fund. The value of loaned securities and cash collateral at period end are disclosed on the Fund's Statement of Assets and Liabilities. At period end, there were no security loans outstanding with FCM. Security lending income represents the income earned on investing cash collateral, less rebates paid to borrowers and any lending agent fees associated with the loan, plus any premium payments received for lending certain types of securities. Security lending income is presented in the Statement of Operations as a component of income from Fidelity Central Funds. Total security lending income during the period amounted to $110,200, including $462 from securities loaned to FCM.
8. Expense Reductions.
The investment adviser contractually agreed to reimburse each class to the extent annual operating expenses exceeded certain levels of average net assets as noted in the table below. This reimbursement will remain in place through December 31, 2015. Some expenses, for example interest expense, including commitment fees, are excluded from this reimbursement.
The following classes were in reimbursement during the period:
| Expense
Limitations | Reimbursement |
Class B | 2.20% | $ 38 |
Class C | 2.20% | 880 |
| | $ 918 |
In addition, the investment adviser reimbursed a portion of the Fund's operating expenses during the period in the amount of $1,566.
9. Distributions to Shareholders.
Distributions to shareholders of each class were as follows:
Years ended October 31, | 2014 | 2013 |
From net investment income | | |
Class A | $ 114,661 | $ 102,760 |
Class T | 92,140 | 49,034 |
Class B | 757 | 1,541 |
Class C | 24,034 | 28,314 |
Total International Equity | 4,825,256 | 5,630,153 |
Institutional Class | 33,527 | 33,750 |
Total | $ 5,090,375 | $ 5,845,552 |
Annual Report
9. Distributions to Shareholders - continued
Years ended October 31, | 2014 | 2013 |
From net realized gain | | |
Class A | $ 201,491 | $ 199,811 |
Class T | 179,326 | 93,853 |
Class B | 4,154 | 6,990 |
Class C | 83,657 | 92,492 |
Total International Equity | 7,158,781 | 9,320,186 |
Institutional Class | 51,867 | 55,869 |
Total | $ 7,679,276 | $ 9,769,201 |
10. Share Transactions.
Share transactions for each class were as follows and may contain automatic conversions between classes or exchanges between funds:
| Shares | Dollars |
Years ended October 31, | 2014 | 2013 | 2014 | 2013 |
Class A | | | | |
Shares sold | 232,039 | 510,102 | $ 1,877,334 | $ 3,880,513 |
Reinvestment of distributions | 38,586 | 41,103 | 306,762 | 293,886 |
Shares redeemed | (217,382) | (248,440) | (1,752,622) | (1,903,860) |
Net increase (decrease) | 53,243 | 302,765 | $ 431,474 | $ 2,270,539 |
Class T | | | | |
Shares sold | 525,401 | 807,518 | $ 4,252,382 | $ 6,202,497 |
Reinvestment of distributions | 33,829 | 19,724 | 270,968 | 142,209 |
Shares redeemed | (230,852) | (195,438) | (1,883,437) | (1,518,035) |
Net increase (decrease) | 328,378 | 631,804 | $ 2,639,913 | $ 4,826,671 |
Class B | | | | |
Shares sold | 2,568 | 827 | $ 21,032 | $ 6,304 |
Reinvestment of distributions | 604 | 1,165 | 4,866 | 8,437 |
Shares redeemed | (5,357) | (8,955) | (43,506) | (69,218) |
Net increase (decrease) | (2,185) | (6,963) | $ (17,608) | $ (54,477) |
Class C | | | | |
Shares sold | 174,035 | 129,341 | $ 1,421,548 | $ 986,204 |
Reinvestment of distributions | 10,201 | 12,546 | 81,608 | 90,328 |
Shares redeemed | (113,485) | (83,065) | (922,884) | (635,648) |
Net increase (decrease) | 70,751 | 58,822 | $ 580,272 | $ 440,884 |
Total International Equity | | | | |
Shares sold | 7,329,051 | 10,376,724 | $ 59,640,689 | $ 77,880,274 |
Reinvestment of distributions | 1,486,031 | 2,062,441 | 11,828,806 | 14,746,450 |
Shares redeemed | (7,554,096) | (11,840,491) | (61,144,473) | (90,585,484) |
Net increase (decrease) | 1,260,986 | 598,674 | $ 10,325,022 | $ 2,041,240 |
Annual Report
Notes to Financial Statements - continued
10. Share Transactions - continued
| Shares | Shares | Dollars | Dollars |
Years ended October 31, | 2014 | 2013 | 2014 | 2013 |
Institutional Class | | | | |
Shares sold | 127,536 | 142,800 | $ 1,054,194 | $ 1,078,337 |
Reinvestment of distributions | 10,120 | 12,587 | 80,252 | 89,619 |
Shares redeemed | (144,685) | (75,629) | (1,167,594) | (583,086) |
Net increase (decrease) | (7,029) | 79,758 | $ (33,148) | $ 584,870 |
11. Other.
The Fund's organizational documents provide former and current trustees and officers with a limited indemnification against liabilities arising in connection with the performance of their duties to the Fund. In the normal course of business, the Fund may also enter into contracts that provide general indemnifications. The Fund's maximum exposure under these arrangements is unknown as this would be dependent on future claims that may be made against the Fund. The risk of material loss from such claims is considered remote.
At the end of the period, a shareholder of record owned approximately 72% of the total outstanding shares of the Fund.
Annual Report
To the Trustees of Fidelity Investment Trust and Shareholders of Fidelity Total International Equity Fund:
We have audited the accompanying statement of assets and liabilities of Fidelity Total International Equity Fund (the Fund), a fund of Fidelity Investment Trust, including the schedule of investments, as of October 31, 2014, and the related statement of operations for the year then ended, the statement of changes in net assets for each of the two years in the period then ended, and the financial highlights for each of the five years in the period then ended. These financial statements and financial highlights are the responsibility of the Fund's management. Our responsibility is to express an opinion on these financial statements and financial highlights based on our audits.
We conducted our audits in accordance with the standards of the Public Company Accounting Oversight Board (United States). Those standards require that we plan and perform the audit to obtain reasonable assurance about whether the financial statements and financial highlights are free of material misstatement. The Fund is not required to have, nor were we engaged to perform, an audit of its internal control over financial reporting. Our audits included consideration of internal control over financial reporting as a basis for designing audit procedures that are appropriate in the circumstances, but not for the purpose of expressing an opinion on the effectiveness of the Fund's internal control over financial reporting. Accordingly, we express no such opinion. An audit also includes examining, on a test basis, evidence supporting the amounts and disclosures in the financial statements, assessing the accounting principles used and significant estimates made by management, as well as evaluating the overall financial statement presentation. Our procedures included confirmation of securities owned as of October 31, 2014, by correspondence with the custodians and brokers; where replies were not received from brokers, we performed other auditing procedures. We believe that our audits provide a reasonable basis for our opinion.
In our opinion, the financial statements and financial highlights referred to above present fairly, in all material respects, the financial position of Fidelity Total International Equity Fund as of October 31, 2014, the results of its operations for the year then ended, the changes in its net assets for each of the two years in the period then ended, and the financial highlights for each of the five years in the period then ended, in conformity with accounting principles generally accepted in the United States of America.
DELOITTE & TOUCHE LLP
Boston, Massachusetts
December 16, 2014
Annual Report
The Trustees, Member of the Advisory Board, and officers of the trust and fund, as applicable, are listed below. The Board of Trustees governs the fund and is responsible for protecting the interests of shareholders. The Trustees are experienced executives who meet periodically throughout the year to oversee the fund's activities, review contractual arrangements with companies that provide services to the fund, oversee management of the risks associated with such activities and contractual arrangements, and review the fund's performance. Except for James C. Curvey, each of the Trustees oversees 174 funds. Mr. Curvey oversees 407 funds.
The Trustees hold office without limit in time except that (a) any Trustee may resign; (b) any Trustee may be removed by written instrument, signed by at least two-thirds of the number of Trustees prior to such removal; (c) any Trustee who requests to be retired or who has become incapacitated by illness or injury may be retired by written instrument signed by a majority of the other Trustees; and (d) any Trustee may be removed at any special meeting of shareholders by a two-thirds vote of the outstanding voting securities of the trust. Each Trustee who is not an interested person (as defined in the 1940 Act) of the trust and the fund (Independent Trustee), shall retire not later than the last day of the calendar year in which his or her 75th birthday occurs. The Independent Trustees may waive this mandatory retirement age policy with respect to individual Trustees. The officers and Advisory Board Member hold office without limit in time, except that any officer and Advisory Board Member may resign or may be removed by a vote of a majority of the Trustees at any regular meeting or any special meeting of the Trustees. Except as indicated, each individual has held the office shown or other offices in the same company for the past five years.
Experience, Skills, Attributes, and Qualifications of the Fund's Trustees. The Governance and Nominating Committee has adopted a statement of policy that describes the experience, qualifications, attributes, and skills that are necessary and desirable for potential Independent Trustee candidates (Statement of Policy). The Board believes that each Trustee satisfied at the time he or she was initially elected or appointed a Trustee, and continues to satisfy, the standards contemplated by the Statement of Policy. The Governance and Nominating Committee also engages professional search firms to help identify potential Independent Trustee candidates who have the experience, qualifications, attributes, and skills consistent with the Statement of Policy. From time to time, additional criteria based on the composition and skills of the current Independent Trustees, as well as experience or skills that may be appropriate in light of future changes to board composition, business conditions, and regulatory or other developments, have also been considered by the professional search firms and the Governance and Nominating Committee. In addition, the Board takes into account the Trustees' commitment and participation in Board and committee meetings, as well as their leadership of standing and ad hoc committees throughout their tenure.
In determining that a particular Trustee was and continues to be qualified to serve as a Trustee, the Board has considered a variety of criteria, none of which, in isolation, was controlling. The Board believes that, collectively, the Trustees have balanced and diverse experience, qualifications, attributes, and skills, which allow the Board to operate effectively in governing the fund and protecting the interests of shareholders. Information about the specific experience, skills, attributes, and qualifications of each Trustee, which in each case led to the Board's conclusion that the Trustee should serve (or continue to serve) as a trustee of the fund, is provided below.
Annual Report
Trustees and Officers - continued
Board Structure and Oversight Function. James C. Curvey is an interested person (as defined in the 1940 Act) and currently serves as Chairman. The Trustees have determined that an interested Chairman is appropriate and benefits shareholders because an interested Chairman has a personal and professional stake in the quality and continuity of services provided to the fund. Independent Trustees exercise their informed business judgment to appoint an individual of their choosing to serve as Chairman, regardless of whether the Trustee happens to be independent or a member of management. The Independent Trustees have determined that they can act independently and effectively without having an Independent Trustee serve as Chairman and that a key structural component for assuring that they are in a position to do so is for the Independent Trustees to constitute a substantial majority for the Board. The Independent Trustees also regularly meet in executive session. Ned C. Lautenbach serves as Chairman of the Independent Trustees and as such (i) acts as a liaison between the Independent Trustees and management with respect to matters important to the Independent Trustees and (ii) with management prepares agendas for Board meetings.
Fidelity funds are overseen by different Boards of Trustees. The fund's Board oversees Fidelity's equity and high income funds and another Board oversees Fidelity's investment-grade bond, money market, and asset allocation funds. The asset allocation funds may invest in Fidelity funds overseen by the fund's Board. The use of separate Boards, each with its own committee structure, allows the Trustees of each group of Fidelity funds to focus on the unique issues of the funds they oversee, including common research, investment, and operational issues. On occasion, the separate Boards establish joint committees to address issues of overlapping consequences for the Fidelity funds overseen by each Board.
The Trustees operate using a system of committees to facilitate the timely and efficient consideration of all matters of importance to the Trustees, the fund, and fund shareholders and to facilitate compliance with legal and regulatory requirements and oversight of the fund's activities and associated risks. The Board, acting through its committees, has charged FMR and its affiliates with (i) identifying events or circumstances the occurrence of which could have demonstrably adverse effects on the fund's business and/or reputation; (ii) implementing processes and controls to lessen the possibility that such events or circumstances occur or to mitigate the effects of such events or circumstances if they do occur; and (iii) creating and maintaining a system designed to evaluate continuously business and market conditions in order to facilitate the identification and implementation processes described in (i) and (ii) above. Because the day-to-day operations and activities of the fund are carried out by or through FMR, its affiliates and other service providers, the fund's exposure to risks is mitigated but not eliminated by the processes overseen by the Trustees. While each of the Board's committees has responsibility for overseeing different aspects of the fund's activities, oversight is exercised primarily through the Operations, Audit, and Compliance Committees. In addition, the Independent Trustees have worked with FMR to enhance the Board's oversight of investment and financial risks, legal and regulatory risks, technology risks, and operational risks, including the development of additional risk reporting to the Board. For example, a working group comprised of Independent Trustees and FMR has worked and continues to work to review the Fidelity funds' valuation-related activities, reporting and risk management. Appropriate personnel, including but not limited to the fund's Chief Compliance Officer (CCO), FMR's internal auditor, the independent accountants, the fund's Treasurer and portfolio management personnel, make periodic reports to the Board's committees, as appropriate, including an annual review of FMR's risk management program for the Fidelity funds. The responsibilities of each standing committee, including their oversight responsibilities, are described further under "Standing Committees of the Fund's Trustees."
Annual Report
The fund's Statement of Additional Information (SAI) includes more information about the Trustees. To request a free copy, call Fidelity at 1-877-208-0098.
Interested Trustees*:
Correspondence intended for each Trustee who is an interested person may be sent to Fidelity Investments, 245 Summer Street, Boston, Massachusetts 02210.
Name, Year of Birth; Principal Occupations and Other Relevant Experience+ |
James C. Curvey (1935) |
Year of Election or Appointment: 2007 Trustee Chairman of the Board of Trustees |
| Mr. Curvey also serves as Trustee of other Fidelity funds. Mr. Curvey is a Director of Fidelity Research & Analysis Co. (2009-present), and Vice Chairman (2007-present) and Director of FMR LLC. In addition, Mr. Curvey serves as an Overseer for the Boston Symphony Orchestra and a member of the board of Artis Naples, Naples, Florida, and as a Trustee for Brewster Academy, Wolfeboro, New Hampshire. Previously, Mr. Curvey served as a Director of Fidelity Investments Money Management, Inc. (2009-2014), a Director of FMR (2007-2014), and a Director of FMR Co., Inc. (2007-2014). |
Charles S. Morrison (1960) |
Year of Election or Appointment: 2014 Trustee |
| Mr. Morrison also serves as Trustee of other funds. He serves as a Director of Fidelity Investments Money Mangement, Inc. (FIMM) (2014-present), Director of Fidelity SelectCo, LLC (2014-present), President, Asset Management (2014-present) and is an employee of Fidelity Investments. Previously, Mr. Morrison served as Vice President of Fidelity's Fixed Income and Asset Allocation Funds (2012-2014), President, Fixed Income (2011-2014), Vice President of Fidelity's Money Market Funds (2005-2009), President, Money Market Group Leader of FMR (2009), and Senior Vice President, Money Market Group of FMR (2004-2009). Mr. Morrison also served as Vice President of Fidelity's Bond Funds (2002-2005), certain Balanced Funds (2002-2005), and certain Asset Allocation Funds (2002-2007), and as Senior Vice President (2002-2005) of Fidelity's Bond Division. |
* Trustees have been determined to be "Interested Trustees" by virtue of, among other things, their affiliation with the trust or various entities under common control with FMR.
+ The information above includes each Trustee's principal occupation during the last five years and other information relating to the experience, attributes, and skills relevant to each Trustee's qualifications to serve as a Trustee, which led to the conclusion that each Trustee should serve as a Trustee for the fund.
Annual Report
Independent Trustees:
Correspondence intended for each Independent Trustee (that is, the Trustees other than the Interested Trustees) may be sent to Fidelity Investments, P.O. Box 55235, Boston, Massachusetts 02205-5235.
Name, Year of Birth; Principal Occupations and Other Relevant Experience+ |
Dennis J. Dirks (1948) |
Year of Election or Appointment: 2005 Trustee |
| Mr. Dirks also serves as Trustee of other Fidelity funds. Prior to his retirement in May 2003, Mr. Dirks was Chief Operating Officer and a member of the Board of The Depository Trust & Clearing Corporation (DTCC). He also served as President, Chief Operating Officer, and Board member of The Depository Trust Company (DTC) and President and Board member of the National Securities Clearing Corporation (NSCC). In addition, Mr. Dirks served as Chief Executive Officer and Board member of the Government Securities Clearing Corporation, Chief Executive Officer and Board member of the Mortgage-Backed Securities Clearing Corporation, as a Trustee and a member of the Finance Committee of Manhattan College (2005-2008), and as a Trustee and a member of the Finance Committee of AHRC of Nassau County (2006-2008). Mr. Dirks is a member of the Independent Directors Council (IDC) Governing Council (2010-present) and Board of Directors for The Brookville Center for Children's Services, Inc. (2009-present). |
Alan J. Lacy (1953) |
Year of Election or Appointment: 2008 Trustee |
| Mr. Lacy also serves as Trustee of other Fidelity funds. Mr. Lacy serves as Senior Adviser (2007-present) of Oak Hill Capital Partners, L.P. (private equity). Mr. Lacy also served as Chief Executive Officer (2000-2005) and Vice Chairman (2005-2006) of Sears Holdings Corporation and Sears, Roebuck and Co. (retail). In addition, Mr. Lacy serves as a member of the Board of Directors of Dave & Buster's Entertainment, Inc. (restaurant and entertainment complexes, 2010-present), Earth Fare, Inc. (retail grocery, 2012-present), The Hillman Companies, Inc. (hardware wholesalers, 2010-present), and Bristol-Myers Squibb Company (global pharmaceuticals, 2008-present). Mr. Lacy is a member of the Board of Trustees of The National Parks Conservation Association (2006-present). Previously, Mr. Lacy served as Chairman of the Board of Trustees of the National Parks Conservation Association (2008-2011) and as a member of the Board of Directors for the Western Union Company (global money transfer, 2006-2011). |
Ned C. Lautenbach (1944) |
Year of Election or Appointment: 2000 Trustee Chairman of the Independent Trustees |
| Mr. Lautenbach also serves as Trustee of other Fidelity funds. Mr. Lautenbach currently serves as the Lead Director of the Eaton Corporation Board of Directors (diversified industrial, 1997-present). Mr. Lautenbach is Chairman of the Board of Directors of the Philharmonic Center for the Arts in Naples, Florida (2012-present) and a member of the Council on Foreign Relations (1994-present). Previously, Mr. Lautenbach was a Partner/Advisory Partner at Clayton, Dubilier & Rice, LLC (private equity investment, 1998-2010), as well as a Director of Sony Corporation (2006-2007). |
Joseph Mauriello (1944) |
Year of Election or Appointment: 2008 Trustee |
| Mr. Mauriello also serves as Trustee of other Fidelity funds. Prior to his retirement in January 2006, Mr. Mauriello served in numerous senior management positions including Deputy Chairman and Chief Operating Officer (2004-2005), and Vice Chairman of Financial Services (2002-2004) of KPMG LLP US (professional services, 1965-2005). Mr. Mauriello currently serves as a member of the Board of Directors of XL Group plc. (global insurance and re-insurance, 2006-present). Previously, Mr. Mauriello served as a Director of the Hamilton Funds of the Bank of New York (2006-2007) and of Arcadia Resources Inc. (health care services and products, 2007-2012). |
Robert W. Selander (1950) |
Year of Election or Appointment: 2011 Trustee |
| Mr. Selander also serves as Trustee of other Fidelity funds. Previously, Mr. Selander served as a Member of the Advisory Board of other Fidelity funds (2011), and Executive Vice Chairman (2010), Chief Executive Officer (2009-2010), and President and Chief Executive Officer (1997-2009) of Mastercard, Inc. |
Cornelia M. Small (1944) |
Year of Election or Appointment: 2005 Trustee |
| Ms. Small also serves as Trustee of other Fidelity funds. Ms. Small is a member of the Board of Directors (2009-present) and Chair of the Investment Committee (2010-present) of the Teagle Foundation. Ms. Small also serves on the Investment Committee of the Berkshire Taconic Community Foundation (2008-present). Previously, Ms. Small served as Chairperson (2002-2008) and a member of the Investment Committee and Chairperson (2008-2012) and a member of the Board of Trustees of Smith College. In addition, Ms. Small served as Chief Investment Officer, Director of Global Equity Investments, and a member of the Board of Directors of Scudder, Stevens & Clark and Scudder Kemper Investments. |
William S. Stavropoulos (1939) |
Year of Election or Appointment: 2001 Trustee Vice Chairman of the Independent Trustees |
| Mr. Stavropoulos also serves as Trustee of other Fidelity funds. Mr. Stavropoulos serves as President and Founder of the Michigan Baseball Foundation, the Great Lakes Loons (2007-present). Mr. Stavropoulos is Chairman Emeritus of the Board of Directors of The Dow Chemical Company, where he previously served in numerous senior management positions, including President, CEO (1995-2000; 2002-2004), Chairman of the Executive Committee (2000-2006), and as a member of the Board of Directors (1990-2006). Currently, Mr. Stavropoulos is Chairman of the Board of Directors of Univar Inc. (global distributor of commodity and specialty chemicals), a Director of Teradata Corporation (data warehousing and technology solutions), and Maersk Inc. (industrial conglomerate), and a member of the Advisory Board for Metalmark Capital LLC (private equity investment, 2005-present). Mr. Stavropoulos is an operating advisor to Clayton, Dubilier & Rice, LLC (private equity investment). In addition, Mr. Stavropoulos is a member of the University of Notre Dame Advisory Council for the College of Science, a Trustee of the Rollin L. Gerstacker Foundation, and a Director of the Naples Philharmonic Center for the Arts. Previously, Mr. Stavropoulos served as a Director of Chemical Financial Corporation (bank holding company, 1993-2012) and Tyco International, Ltd. (multinational manufacturing and services, 2007-2012). |
David M. Thomas (1949) |
Year of Election or Appointment: 2008 Trustee |
| Mr. Thomas also serves as Trustee of other Fidelity funds. Mr. Thomas serves as Non-Executive Chairman of the Board of Directors of Fortune Brands Home and Security (home and security products, 2011-present), and as a member of the Board of Directors of Interpublic Group of Companies, Inc. (marketing communication, 2004-present). Previously, Mr. Thomas served as Executive Chairman (2005-2006) and Chairman and Chief Executive Officer (2000-2005) of IMS Health, Inc. (pharmaceutical and healthcare information solutions), and a Director of Fortune Brands, Inc. (consumer products, 2000-2011). |
+ The information above includes each Trustee's principal occupation during the last five years and other information relating to the experience, attributes, and skills relevant to each Trustee's qualifications to serve as a Trustee, which led to the conclusion that each Trustee should serve as a Trustee for the fund.
Advisory Board Member and Officers:
Correspondence intended for each officer and Peter S. Lynch may be sent to Fidelity Investments, 245 Summer Street, Boston, Massachusetts 02210. Officers appear below in alphabetical order.
Name, Year of Birth; Principal Occupation |
Peter S. Lynch (1944) |
Year of Election or Appointment: 2003 Member of the Advisory Board |
| Mr. Lynch also serves as Member of the Advisory Board of other Fidelity funds. Mr. Lynch is Vice Chairman and a Director of FMR and FMR Co., Inc. In addition, Mr. Lynch serves as a Trustee of Boston College and as the Chairman of the Inner-City Scholarship Fund. Previously, Mr. Lynch served on the Special Olympics International Board of Directors (1997-2006). |
Elizabeth Paige Baumann (1968) |
Year of Election or Appointment: 2012 Anti-Money Laundering (AML) Officer |
| Ms. Baumann also serves as AML Officer of other funds. She is Chief AML Officer of FMR LLC (2012-present) and is an employee of Fidelity Investments. Previously, Ms. Baumann served as Vice President and Deputy Anti-Money Laundering Officer (2007-2012). |
William C. Coffey (1969) |
Year of Election or Appointment: 2009 Assistant Secretary |
| Mr. Coffey also serves as Assistant Secretary of other funds. He is Senior Vice President and Deputy General Counsel of FMR LLC (2010-present), and is an employee of Fidelity Investments. Previously, Mr. Coffey served as Vice President and Associate General Counsel of FMR LLC (2005-2009). |
Timothy M. Cohen (1969) |
Year of Election or Appointment: 2014 Vice President of certain Equity Funds |
| Mr. Cohen also serves as Vice President of other funds. Mr. Cohen serves as a Director and Chief Compliance Officer of Fidelity Management & Research (U.K.) Inc. (2013-present) and is an employee of Fidelity Investments. |
Jonathan Davis (1968) |
Year of Election or Appointment: 2010 Assistant Treasurer |
| Mr. Davis also serves as Assistant Treasurer of other funds. Mr. Davis is an employee of Fidelity Investments. Previously, Mr. Davis served as Vice President and Associate General Counsel of FMR LLC (2003-2010). |
Adrien E. Deberghes (1967) |
Year of Election or Appointment: 2008 Deputy Treasurer |
| Mr. Deberghes also serves as an officer of other funds. He is an employee of Fidelity Investments (2008-present). Prior to joining Fidelity Investments, Mr. Deberghes was Senior Vice President of Mutual Fund Administration at State Street Corporation (2007-2008), Senior Director of Mutual Fund Administration at Investors Bank & Trust (2005-2007), and Director of Finance for Dunkin' Brands (2000-2005). |
Stephanie J. Dorsey (1969) |
Year of Election or Appointment: 2010 Assistant Treasurer |
| Ms. Dorsey also serves as an officer of other funds. She is an employee of Fidelity Investments (2008-present) and has served in other fund officer roles. Prior to joining Fidelity Investments, Ms. Dorsey served as Treasurer (2004-2008) of the JPMorgan Mutual Funds and Vice President (2004-2008) of JPMorgan Chase Bank. |
Howard J. Galligan III (1966) |
Year of Election or Appointment: 2014 Chief Financial Officer |
| Mr. Galligan also serves as Chief Financial Officer of other funds. Mr. Galligan serves as President of Fidelity Pricing and Cash Management Services (FPCMS) (2014-present) and as a Director of Strategic Advisers, Inc. (2008-present). Previously, Mr. Galligan served as Chief Administrative Officer of Asset Management (2011-2014) and Chief Operating Officer and Senior Vice President of Investment Support for Strategic Advisers, Inc. (2003-2011). |
Scott C. Goebel (1968) |
Year of Election or Appointment: 2008 Secretary and Chief Legal Officer (CLO) |
| Mr. Goebel serves as Secretary and CLO of other funds. Mr. Goebel also serves as Secretary of Fidelity SelectCo, LLC (2013-present), Fidelity Investments Money Management, Inc. (FIMM) (2010-present) and Fidelity Research and Analysis Company (FRAC) (2010-present); General Counsel, Secretary, and Senior Vice President of FMR (2008-present) and FMR Co., Inc. (2008-present); Chief Legal Officer of Fidelity Management & Research (Hong Kong) Limited (2008-present); and Assistant Secretary of Fidelity Management & Research (Japan) Limited (2008-present) and Fidelity Management & Research (U.K.) Inc. (2008-present). Previously, Mr. Goebel served as Secretary and CLO of other Fidelity funds (2008-2013), Assistant Secretary of FIMM (2008-2010), FRAC (2008-2010), and certain funds (2007-2008); and as Vice President and Secretary of Fidelity Distributors Corporation (FDC) (2005-2007). Mr. Goebel has been employed by FMR LLC or an affiliate since 2001. |
Brian B. Hogan (1964) |
Year of Election or Appointment: 2009 Vice President |
| Mr. Hogan also serves as Trustee or Vice President of other funds. Mr. Hogan serves as a Director of Fidelity SelectCo, LLC (2014-present) and President of FMR's Equity Division (2009-present). Previously, Mr. Hogan served as Senior Vice President, Equity Research of FMR (2006-2009) and as a portfolio manager. |
Chris Maher (1972) |
Year of Election or Appointment: 2013 Assistant Treasurer |
| Mr. Maher serves as Assistant Treasurer of other funds. Mr. Maher is Vice President of Valuation Oversight and is an employee of Fidelity Investments. Previously, Mr. Maher served as Vice President of Asset Management Compliance (2013), Vice President of FMR's Program Management Group (2010-2013), and Vice President of Valuation Oversight (2008-2010). |
Kenneth B. Robins (1969) |
Year of Election or Appointment: 2008 President and Treasurer |
| Mr. Robins also serves as an officer of other funds. Mr. Robins serves as Executive Vice President of Fidelity Investments Money Management, Inc. (FIMM) (2013-present) and is an employee of Fidelity Investments (2004-present). Previously, Mr. Robins served in other fund officer roles. |
Stephen Sadoski (1971) |
Year of Election or Appointment: 2012 Deputy Treasurer |
| Mr. Sadoski also serves as Deputy Treasurer of other funds. He is an employee of Fidelity Investments (2012-present) and has served in another fund officer role. Prior to joining Fidelity Investments, Mr. Sadoski served as an assistant chief accountant in the Division of Investment Management of the Securities and Exchange Commission (SEC) (2009-2012) and as a senior manager at Deloitte & Touche LLP (1997-2009). |
Stacie M. Smith (1974) |
Year of Election or Appointment: 2013 Deputy Treasurer |
| Ms. Smith also serves as an officer of other funds. She is an employee of Fidelity Investments (2009-present) and has served in other fund officer roles. Prior to joining Fidelity Investments, Ms. Smith served as Senior Audit Manager of Ernst & Young LLP (1996-2009). |
Renee Stagnone (1975) |
Year of Election or Appointment: 2013 Deputy Treasurer |
| Ms. Stagnone also serves as Deputy Treasurer of other funds. Ms. Stagnone is an employee of Fidelity Investments. |
Linda J. Wondrack (1964) |
Year of Election or Appointment: 2014 Chief Compliance Officer |
| Ms. Wondrack also serves as Chief Compliance Officer of other funds. Ms. Wondrack is Executive Vice President and head of the Ethics Office and Asset Management Compliance for Fidelity Investments (2012-present). Ms. Wondrack also serves as Chief Compliance Officer of Fidelity SelectCo, LLC (2014-present); Chief Compliance Officer of Impresa Management LLC (2013-present); and Chief Compliance Officer of FMR Co., Inc., Fidelity Investments Money Management, Inc., Fidelity Management & Research (Japan) Limited, Fidelity Management & Research (U.K.) Inc., Fidelity Management & Research (Hong Kong), Fidelity Management & Research Company, Pyramis Global Advisors, LLC, and Strategic Advisers, Inc., Ballyrock Investment Advisors LLC, and Northern Neck Investors LLC (2012-present). Previously, Ms. Wondrack served as Senior Vice President and Chief Compliance Officer for Columbia Management Investment Advisers, LLC (2005-2012); Chief Compliance Officer for certain funds within the Columbia Family of Funds (2007-2012); and Senior Vice President of Compliance Risk Management at Bank of America (2005-2010). |
Joseph F. Zambello (1957) |
Year of Election or Appointment: 2011 Deputy Treasurer |
| Mr. Zambello also serves as Deputy Treasurer of other funds. Mr. Zambello is an employee of Fidelity Investments. Previously, Mr. Zambello served as Vice President of FMR's Program Management Group (2009-2011) and Vice President of the Transfer Agent Oversight Group (2005-2009). |
Annual Report
The Board of Trustees of Fidelity Total International Equity Fund voted to pay to shareholders of record at the opening of business on record date, the following distributions per share derived from capital gains realized from sales of portfolio securities, and dividends derived from net investment income:
| Pay Date | Record Date | Dividends | Capital Gains |
Class A | 12/08/14 | 12/05/14 | $0.100 | $0.040 |
| | | | |
Class T | 12/08/14 | 12/05/14 | $0.090 | $0.040 |
| | | | |
Class B | 12/08/14 | 12/05/14 | $0.041 | $0.040 |
| | | | |
Class C | 12/08/14 | 12/05/14 | $0.053 | $0.040 |
The fund hereby designates as a capital gain dividend with respect to the taxable year ended October 31st, 2014, $1,957,679, or, if subsequently determined to be different, the net capital gain of such year.
Class A designates 3%, Class T designates 3%, Class B designates 4%, and Class C designates 4% of the dividends distributed in December 2013 as indicated in the Corporate Qualifying memo distributed by the Tax department, during the fiscal year as qualifying for the dividends-received deduction for corporate shareholders.
Class A designates 71%, Class T designates 75%, Class B designates 100%, and Class C designates 93% of the dividends distributed during the fiscal year as amounts which may be taken into account as a dividend for purposes of the maximum rate under section 1(h)(11) of the Internal Revenue Code.
The amounts per share which represent income derived from sources within, and taxes paid to, foreign countries or possessions of the United States are as follows:
| Pay Date | Income | Taxes |
Class A | 12/09/2013 | $0.1033 | $0.0119 |
| | | |
Class T | 12/09/2013 | $0.0985 | $0.0119 |
| | | |
Class B | 12/09/2013 | $0.0698 | $0.0119 |
| | | |
Class C | 12/09/2013 | $0.0789 | $0.0119 |
The fund will notify shareholders in January 2015 of amounts for use in preparing 2014 income tax returns.
Annual Report
Board Approval of Investment Advisory Contracts and Management Fees
Fidelity Total International Equity Fund
Each year, the Board of Trustees, including the Independent Trustees (together, the Board), votes on the renewal of the management contract with Fidelity Management & Research Company (FMR) and the sub-advisory agreements (together, the Advisory Contracts) for the fund. The Board, assisted by the advice of fund counsel and Independent Trustees' counsel, requests and considers a broad range of information relevant to the renewal of the Advisory Contracts throughout the year.
The Board meets regularly and, at each of its meetings, covers an extensive agenda of topics and materials and considers factors that are relevant to its annual consideration of the renewal of the fund's Advisory Contracts, including the services and support provided to the fund and its shareholders. The Board has established various standing committees (Committees), each composed of and chaired by Independent Trustees with varying backgrounds, to which the Board has assigned specific subject matter responsibilities in order to enhance effective decision-making by the Board. The Board, acting directly and through its Committees, requests and receives information concerning the annual consideration of the renewal of the fund's Advisory Contracts. The Board also meets as needed to consider matters specifically related to the Board's annual consideration of the renewal of the Advisory Contracts. Members of the Board may also meet with trustees of other Fidelity funds through ad hoc joint committees to discuss certain matters relevant to the Fidelity funds.
At its July 2014 meeting, the Board, including the Independent Trustees, unanimously determined to renew the fund's Advisory Contracts. In reaching its determination, the Board considered all factors it believed relevant, including (i) the nature, extent, and quality of the services to be provided to the fund and its shareholders (including the investment performance of the fund); (ii) the competitiveness of the fund's management fee and total expense ratio relative to peer funds; (iii) the total costs of the services to be provided by and the profits to be realized by Fidelity from its relationship with the fund; (iv) the extent to which economies of scale exist and would be realized as the fund grows; and (v) whether fee levels reflect these economies of scale, if any, for the benefit of fund shareholders. In connection with separate internal corporate reorganizations involving Fidelity Management & Research (U.K.) Inc. (FMR U.K.) and Fidelity Management & Research (Japan) Inc. (FMR Japan), the Board approved certain non-material amendments to the fund's sub-advisory agreements with FMR U.K. and FMR Japan to reflect that, after these reorganizations, FMR Investment Management (UK) Limited and Fidelity Management & Research (Japan) Limited will carry on the business of FMR U.K. and FMR Japan, respectively. The Board noted that no changes to the portfolio managers or to the foreign research or investment advisory services provided to the fund were expected in connection with either reorganization and that the same personnel and resources would continue to be available to the fund at the new entities.
Annual Report
Board Approval of Investment Advisory Contracts and
Management Fees - continued
In considering whether to renew the Advisory Contracts for the fund, the Board reached a determination, with the assistance of fund counsel and Independent Trustees' counsel and through the exercise of its business judgment, that the renewal of the Advisory Contracts was in the best interests of the fund and its shareholders and that the compensation payable under the Advisory Contracts was fair and reasonable. The Board's decision to renew the Advisory Contracts was not based on any single factor, but rather was based on a comprehensive consideration of all the information provided to the Board at its meetings throughout the year. The Board, in reaching its determination to renew the Advisory Contracts, was aware that shareholders of the fund have a broad range of investment choices available to them, including a wide choice among funds offered by Fidelity's competitors, and that the fund's shareholders, who have the opportunity to review and weigh the disclosure provided by the fund in its prospectus and other public disclosures, have chosen to invest in this fund, which is part of the Fidelity family of funds.
Nature, Extent, and Quality of Services Provided. The Board considered Fidelity's staffing as it relates to the fund, including the backgrounds of investment personnel of FMR and the sub-advisers (together, the Investment Advisers), and also considered the fund's investment objective, strategies, and related investment philosophy. The Independent Trustees also had discussions with senior management of Fidelity's investment operations and investment groups. The Board considered the structure of the portfolio manager compensation program and whether this structure provides appropriate incentives to act in the best interests of the fund. Additionally, the Board considered the portfolio managers' investments, if any, in the funds that they manage.
Resources Dedicated to Investment Management and Support Services. The Board and the Fund Oversight and Research Committees reviewed the general qualifications and capabilities of Fidelity's investment staff, including its size, education, experience, and resources, as well as Fidelity's approach to recruiting, training, managing, and compensating investment personnel. The Board noted that Fidelity has continued to increase the resources devoted to non-U.S. offices, including expansion of Fidelity's global investment organization. The Board also noted that Fidelity's analysts have extensive resources, tools and capabilities that allow them to conduct sophisticated quantitative and fundamental analysis, as well as credit analysis of issuers, counterparties and guarantors. Further, the Board believes that Fidelity's investment professionals have sufficient access to global information and data so as to provide competitive investment results over time, and that those professionals also have access to sophisticated tools that permit them to assess portfolio construction and risk and performance attribution characteristics continuously, as well as to transmit new information and research conclusions rapidly around the world. Additionally, in its deliberations, the Board considered Fidelity's trading and risk management capabilities and resources and global compliance infrastructure, which are an integral part of the investment management process.
Annual Report
Shareholder and Administrative Services. The Board considered (i) the nature, extent, quality, and cost of advisory, administrative, and shareholder services performed by the Investment Advisers and their affiliates under the Advisory Contracts and under separate agreements covering transfer agency, pricing and bookkeeping, and securities lending services for the fund; (ii) the nature and extent of the supervision of third party service providers, principally custodians and subcustodians; and (iii) the resources devoted to, and the record of compliance with, the fund's compliance policies and procedures. The Board also reviewed the allocation of fund brokerage, including allocations to brokers affiliated with the Investment Advisers, the use of brokerage commissions to pay fund expenses, and the use of "soft" commission dollars to pay for research services.
The Board noted that the growth of fund assets over time across the complex allows Fidelity to reinvest in the development of services designed to enhance the value or convenience of the Fidelity funds as investment vehicles. These services include 24-hour access to account information and market information through telephone representatives and over the Internet, investor education materials and asset allocation tools, and the expanded availability of Fidelity Investor Centers.
In 2014, the Board formed an ad hoc Committee on Transfer Agency Fees to review the variety of transfer agency fee structures throughout the industry and Fidelity's competitive positioning with respect to industry participants.
Investment in a Large Fund Family. The Board considered the benefits to shareholders of investing in a Fidelity fund, including the benefits of investing in a fund that is part of a large family of funds offering a variety of investment disciplines and providing a large variety of mutual fund investor services. The Board noted that Fidelity had taken, or had made recommendations that resulted in the Fidelity funds taking, a number of actions over the previous year that benefited particular funds, including (i) continuing to dedicate additional resources to investment research and to the support of the senior management team that oversees asset management; (ii) persisting in efforts to enhance Fidelity's global research capabilities; (iii) launching new funds and making other enhancements to meet client needs for income-oriented solutions; (iv) reducing fund expenses for certain index funds; (v) continuing to launch dedicated lower cost underlying funds to meet portfolio construction needs related to expanding underlying fund options for Fidelity funds of funds, specifically for the Freedom Fund product lines; (vi) rationalizing product lines and gaining increased efficiencies through fund mergers; (vii) launching sector-based exchange-traded funds and establishing a new Fidelity adviser to manage sector-based funds and products; (viii) continuing to develop and implement technology to improve security and increase efficiency; (ix) modifying the eligibility criteria for certain share classes to increase their marketability to a portion of the defined contribution plan market; (x) waiving redemption fees for certain qualified fund-of-fund and wrap programs and certain retirement plan transactions; and (xi) launching new Institutional Class shares of certain money market funds to attract and retain assets and to fill a gap in the money market fund lineup.
Annual Report
Board Approval of Investment Advisory Contracts and
Management Fees - continued
Investment Performance. The Board considered whether the fund has operated in accordance with its investment objective, as well as its record of compliance with its investment restrictions and its performance history.
The Board took into account discussions with the Investment Advisers about fund investment performance that occur at Board meetings throughout the year. In this regard the Board noted that as part of regularly scheduled fund reviews and other reports to the Board on fund performance, the Board periodically considers annualized return information for the fund, for different time periods, measured against a securities market index ("benchmark index") and a peer group of funds with similar objectives ("peer group"). In its evaluation of fund investment performance, the Board gave particular attention to information indicating changes in performance of certain Fidelity funds for specific time periods and the Investment Advisers' explanations for any overperformance or underperformance.
In addition to reviewing absolute and relative fund performance, the Independent Trustees periodically consider the appropriateness of fund performance metrics in evaluating the results achieved. In general, the Independent Trustees believe that fund performance should be evaluated based on net performance (after fees and expenses) of both the highest performing and lowest performing classes, where applicable, compared to appropriate benchmark indices, over appropriate time periods which may include full market cycles, and compared to peer groups, as applicable, over the same periods, taking into account relevant factors including the following: general market conditions; issuer-specific information; tactical opportunities for investment; and fund cash flows and other factors.
The Independent Trustees recognize that shareholders evaluate performance on a net basis over their own holding periods, for which one-, three-, and five-year periods are often used as a proxy. For this reason, the performance information reviewed by the Board also included net cumulative calendar year total return information for the fund and an appropriate benchmark index and peer group for the most recent one-, three-, and five-year periods, as shown below. Returns are shown compared to the 25th percentile (top of box, 75% beaten) and 75th percentile (bottom of box, 25% beaten) of the peer universe. Returns of the benchmark index are "net MA," i.e., adjusted for tax withholding rates applicable to U.S.-based funds organized as Massachusetts business trusts.
Annual Report
Fidelity Total International Equity Fund
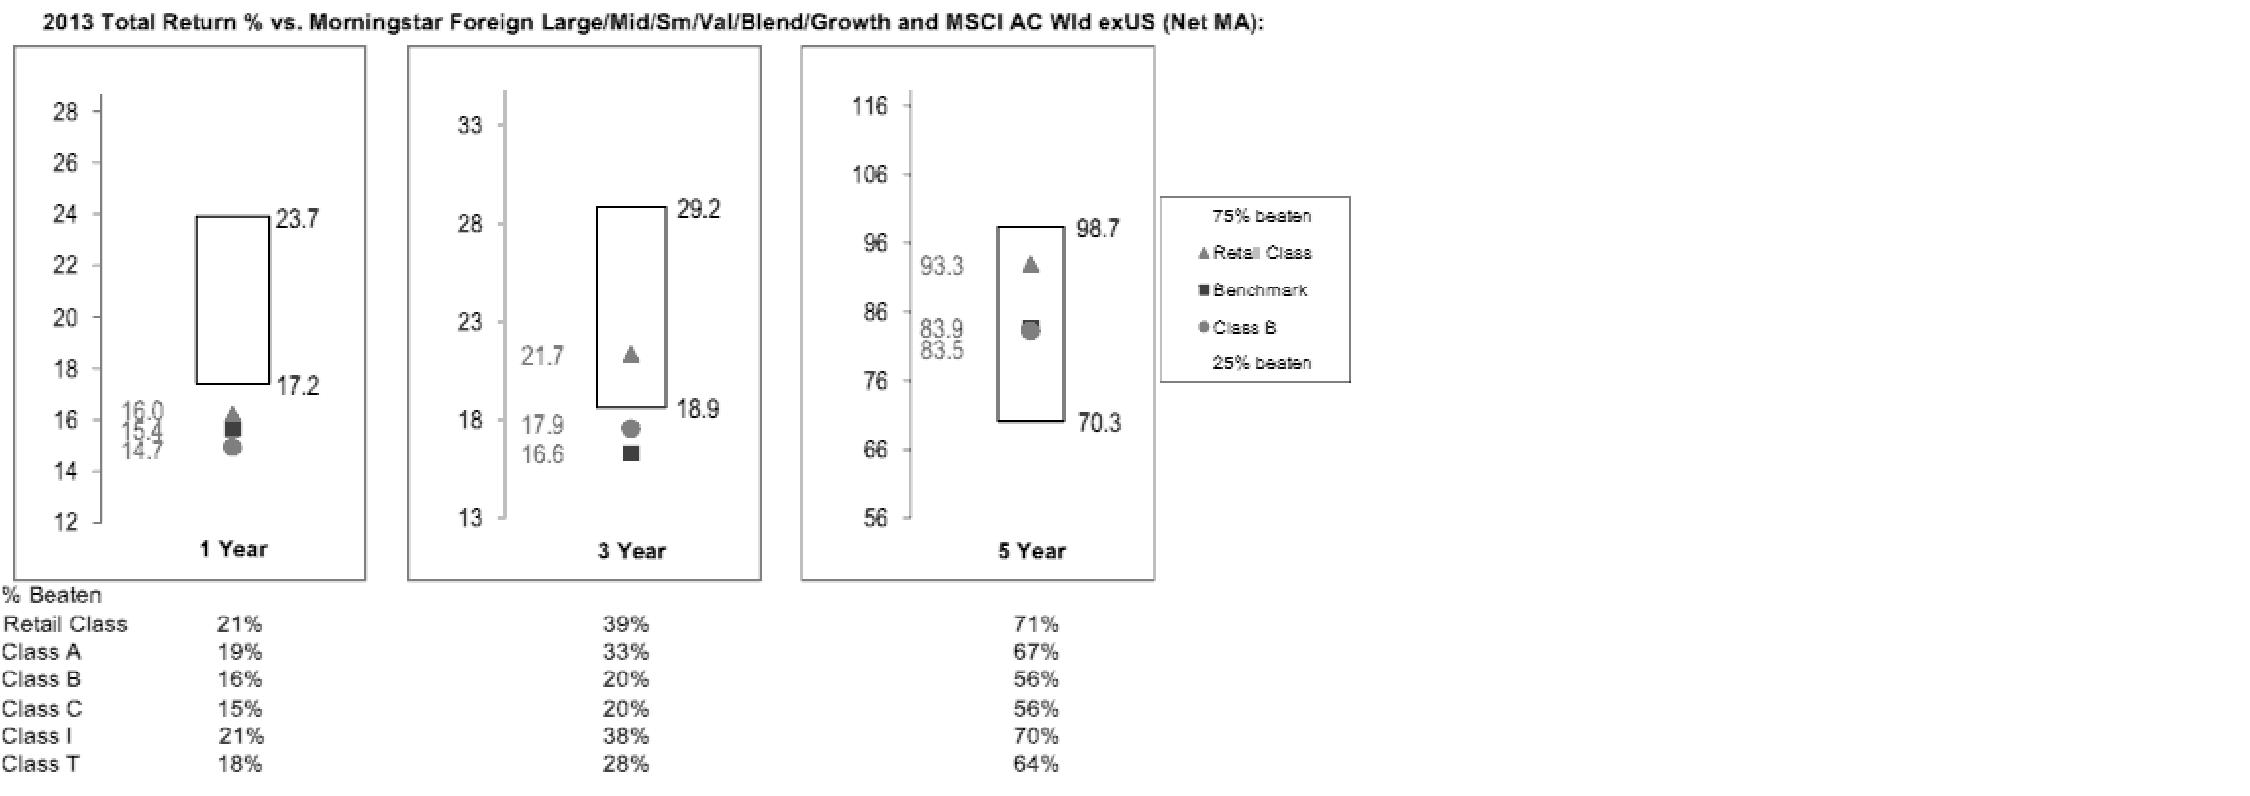
The Board also considered that the fund's management fee is subject to upward or downward adjustment depending upon whether, and to what extent, the fund's investment performance for the performance period exceeds, or is exceeded by, a securities index, thus leading to a performance adjustment for the same period. The Board noted that the performance adjustment provides FMR with a strong economic incentive to seek to achieve superior performance for the fund's shareholders and helps to more closely align the interests of FMR and the fund's shareholders.
Based on its review, the Board concluded that the nature, extent, and quality of services provided to the fund under the Advisory Contracts should benefit the fund's shareholders.
Competitiveness of Management Fee and Total Expense Ratio. The Board considered the fund's management fee and total expense ratio compared to "mapped groups" of competitive funds and classes. Fidelity creates "mapped groups" by combining similar Lipper investment objective categories that have comparable investment mandates. Combining Lipper investment objective categories aids the Board's management fee and total expense ratio comparisons by broadening the competitive group used for comparison and by reducing the number of universes to which various Fidelity funds are compared.
Management Fee. The Board considered two proprietary management fee comparisons for the 12-month periods shown in the chart below. The group of Lipper funds used by the Board for management fee comparisons is referred to below as the "Total Mapped Group." The Total Mapped Group comparison focuses on a fund's standing in terms of gross management fees before expense reimbursements or caps, and without giving effect to the fund's performance adjustment, relative to the total universe of funds with comparable investment mandates, regardless of whether their management fee structures also are comparable. Funds with comparable investment mandates offer exposure to similar types of securities. Funds with comparable management fee structures have similar management fee contractual arrangements (e.g., flat rate charged for advisory services, all-inclusive fee rate, etc.). "TMG %" represents the percentage of funds in the Total Mapped Group that had management fees that were lower than the fund's. For example, a hypothetical TMG % of 20% would mean that 80% of the funds in the Total Mapped Group had higher, and 20% had lower, management fees than the fund. The fund's actual TMG %s are in the chart below. The "Asset-Size Peer Group" (ASPG) comparison focuses on a fund's standing relative to a subset of non-Fidelity funds within the Total Mapped Group that are similar in size and management fee structure. For example, if a fund is in the first quartile of the ASPG, the fund's management fee ranks in the least expensive or lowest 25% of funds in the ASPG. The ASPG represents at least 15% of the funds in the Total Mapped Group with comparable asset size and management fee structures, subject to a minimum of 50 funds (or all funds in the Total Mapped Group if fewer than 50). Additional information, such as the ASPG quartile in which the fund's management fee rate ranked and the impact of the fund's performance adjustment, is also included in the chart and considered by the Board.
Annual Report
Board Approval of Investment Advisory Contracts and
Management Fees - continued
Fidelity Total International Equity Fund

The Board noted that the fund's management fee rate ranked below the median of its Total Mapped Group and below the median of its ASPG for 2013. The Board also noted the effect of the fund's positive performance adjustment on the fund's management fee ranking.
Annual Report
The Board also noted that, in August 2013, the ad hoc Committee on Management Fees was formed to conduct an in-depth review of the management fee rates of Fidelity's active equity mutual funds. The Committee focused on the following areas: (i) standard fee structures; (ii) research consumption and trading evolution; (iii) management fee competitiveness/profitability by category; and (iv) factors that drive institutional pricing.
Based on its review, the Board concluded that the fund's management fee is fair and reasonable in light of the services that the fund receives and the other factors considered.
Total Expense Ratio. In its review of each class's total expense ratio, the Board considered the fund's management fee as well as other fund or class expenses, as applicable, such as transfer agent fees, pricing and bookkeeping fees, fund-paid 12b-1 fees, and custodial, legal, and audit fees. The Board also noted the effects of any waivers and reimbursements on fees and expenses, as well as the impact of the fund's performance adjustment. As part of its review, the Board also considered the current and historical total expense ratios of each class of the fund compared to competitive fund median expenses. Each class of the fund is compared to those funds and classes in the Total Mapped Group (used by the Board for management fee comparisons) that have a similar sales load structure.
The Board noted that the total expense ratio of the retail class ranked below its competitive median for 2013 and the total expense ratio of each of Class A, Class T, Class B, Class C, and Institutional Class ranked above its competitive median for 2013. The Board considered that, in general, various factors can affect total expense ratios. The Board noted that the total expense ratio of Class T was above the competitive median primarily because of higher 12b-1 fees on Class T as compared to most competitor funds. Class T has a higher 12b-1 fee, but a lower front-end sales charge, than traditionally priced front-end sales charge classes. The Board considered that Class T is primarily sold load-waived in the retirement plan market where its 0.50% 12b-1 fee is comparable to competing no-load, higher 12b-1 fee classes designed specifically for retirement plans. The Board noted that the fund offers multiple classes, each of which has a different sales load and 12b-1 fee structure, and that the multiple structures are intended to offer a range of pricing options for the intermediary market. The Board also noted that the total expense ratios of the classes vary primarily by the level of their 12b-1 fees, although differences in transfer agent fees may also cause expenses to vary from class to class.
The Board further considered that FMR contractually agreed to reimburse Class A, Class T, Class B, Class C, Institutional Class, and the retail class of the fund to the extent that total operating expenses (excluding interest, certain taxes, certain securities lending costs, brokerage commissions, extraordinary expenses, and acquired fund fees and expenses, if any), as a percentage of their respective average net assets, exceed 1.45%, 1.70%, 2.20%, 2.20%, 1.20%, and 1.20% through December 31, 2014.
Annual Report
Board Approval of Investment Advisory Contracts and
Management Fees - continued
Fees Charged to Other Fidelity Clients. The Board also considered Fidelity fee structures and other information with respect to clients of Fidelity, such as other funds advised or subadvised by Fidelity, pension plan clients, and other institutional clients. The Board noted the findings of the 2013 ad hoc joint committee (created with the board of other Fidelity funds), which reviewed and compared Fidelity's institutional investment advisory business with its business of providing services to the Fidelity funds, including the differences in services provided, fees charged, and costs incurred, as well as competition in their respective marketplaces.
Based on its review of total expense ratios and fees charged to other Fidelity clients, the Board concluded that the total expense ratio of each class of the fund was reasonable, although in some cases above the median of the universe presented for comparison, in light of the services that the fund and its shareholders receive and the other factors considered.
Costs of the Services and Profitability. The Board considered the revenues earned and the expenses incurred by Fidelity in conducting the business of developing, marketing, distributing, managing, administering and servicing the fund and servicing the fund's shareholders. The Board also considered the level of Fidelity's profits in respect of all the Fidelity funds.
On an annual basis, Fidelity presents to the Board Fidelity's profitability for the fund. Fidelity calculates the profitability for each fund, as well as aggregate profitability for groups of Fidelity funds and all Fidelity funds, using a series of detailed revenue and cost allocation methodologies which originate with the books and records of Fidelity on which Fidelity's audited financial statements are based. The Audit Committee of the Board reviews any significant changes from the prior year's methodologies.
PricewaterhouseCoopers LLP (PwC), independent registered public accounting firm and auditor to Fidelity and certain Fidelity funds, has been engaged annually by the Board as part of the Board's assessment of Fidelity's profitability analysis. PwC's engagement includes the review and assessment of the methodologies used by Fidelity in determining the revenues and expenses attributable to Fidelity's mutual fund business, and completion of agreed-upon procedures in respect of the mathematical accuracy of fund profitability and its conformity to established allocation methodologies. After considering PwC's reports issued under the engagement and information provided by Fidelity, the Board concluded that while other allocation methods may also be reasonable, Fidelity's profitability methodologies are reasonable in all material respects.
The Board also reviewed Fidelity's non-fund businesses and fall-out benefits related to the mutual fund business as well as cases where Fidelity's affiliates may benefit from or be related to the fund's business.
Annual Report
The Board considered the costs of the services provided by and the profits realized by Fidelity in connection with the operation of the fund and was satisfied that the profitability was not excessive in the circumstances.
Economies of Scale. The Board considered whether there have been economies of scale in respect of the management of the Fidelity funds, whether the Fidelity funds (including the fund) have appropriately benefited from any such economies of scale, and whether there is potential for realization of any further economies of scale. The Board considered the extent to which the fund will benefit from economies of scale through increased services to the fund, through waivers or reimbursements, or through fee or expense ratio reductions. The Board also noted that in 2013, it and the boards of other Fidelity funds created an ad hoc committee (the Economies of Scale Committee) to analyze whether Fidelity attains economies of scale in respect of the management and servicing of the Fidelity funds, whether the Fidelity funds have appropriately benefited from such economies of scale, and whether there is potential for realization of any further economies of scale.
The Board recognized that the fund's management contract incorporates a "group fee" structure, which provides for lower group fee rates as total group assets increase, and for higher group fee rates as total group assets decrease (with "group assets" defined to include fund assets under FMR's management plus sector fund assets previously under FMR's management and currently managed by Fidelity SelectCo, LLC). FMR calculates the group fee rates based on a tiered asset "breakpoint" schedule that varies based on asset class. The Board considered that the group fee is designed to deliver the benefits of economies of scale to fund shareholders when total Fidelity fund assets increase, even if assets of any particular fund are unchanged or have declined, because some portion of Fidelity's costs are attributable to services provided to all Fidelity funds, and all funds benefit if those costs can be allocated among more assets. The Board concluded that, given the group fee structure, fund shareholders will benefit from lower management fees as group assets increase at the fund complex level, regardless of whether Fidelity achieves any such economies of scale.
The Board concluded, taking into account the analysis of the Economies of Scale Committee, that economies of scale, if any, are being appropriately shared between fund shareholders and Fidelity.
Additional Information Requested by the Board. In order to develop fully the factual basis for consideration of the Fidelity funds' Advisory Contracts, the Board requested and received additional information on certain topics, including: (i) fund performance trends and Fidelity's long-term strategies for certain funds; (ii) Fidelity's strategic marketing and product lineup goals; (iii) the methodology with respect to competitive fund data and peer group classifications; (iv) the arrangements with, and performance of, certain sub-advisers on behalf of the Fidelity funds, as well as certain proposed participating affiliate arrangements; (v) the realization of fall-out benefits in certain Fidelity business units; (vi) Fidelity's group fee structures, including the rationale for the individual fee rates of certain categories of funds and the definition of group assets; (vii) trends regarding industry use of performance fee structures and the performance adjustment methodologies applicable to the Fidelity funds; (viii) additional competitive analysis regarding the total expenses for certain classes; (ix) fund profitability methodology, including Fidelity's cost allocation methodology, and the impact of certain factors on fund profitability results; and (x) the process by which Fidelity determines sub-advisory fees for funds it advises.
Annual Report
Board Approval of Investment Advisory Contracts and
Management Fees - continued
Based on its evaluation of all of the conclusions noted above, and after considering all factors it believed relevant, the Board ultimately concluded that the advisory fee structures are fair and reasonable, and that the fund's Advisory Contracts should be renewed.
Annual Report
Investment Adviser
Fidelity Management & Research Company
Boston, MA
Investment Sub-Advisers
FMR Co., Inc.
Fidelity Management & Research
(U.K.) Inc.
Fidelity Management & Research
(Hong Kong) Limited
Fidelity Management & Research
(Japan) Limited
FIL Investment Advisors
FIL Investments (Japan) Limited
FIL Investment Advisors
(U.K.) Limited
General Distributor
Fidelity Distributors Corporation
Smithfield, RI
Transfer and Service Agents
Fidelity Investments Institutional Operations Company, Inc.
Boston, MA
Fidelity Service Company, Inc.
Boston, MA
Custodian
State Street Bank & Trust Company
Quincy, MA
(Fidelity Investment logo)(registered trademark)
ATIE-UANN-1214
1.853363.106
(Fidelity Investment logo)(registered trademark)
Fidelity Advisor®
Total International Equity
Fund - Institutional Class
Annual Report
October 31, 2014
(Fidelity Cover Art)
Institutional Class is
a class of Fidelity®
Total International Equity Fund
Contents
Performance | (Click Here) | How the fund has done over time. |
Management's Discussion of Fund Performance | (Click Here) | The Portfolio Manager's review of fund performance and strategy. |
Shareholder Expense Example | (Click Here) | An example of shareholder expenses. |
Investment Changes | (Click Here) | A summary of major shifts in the fund's investments over the past six months. |
Investments | (Click Here) | A complete list of the fund's investments with their market values. |
Financial Statements | (Click Here) | Statements of assets and liabilities, operations, and changes in net assets, as well as financial highlights. |
Notes | (Click Here) | Notes to the financial statements. |
Report of Independent Registered Public Accounting Firm | (Click Here) | |
Trustees and Officers | (Click Here) | |
Distributions | (Click Here) | |
Board Approval of Investment Advisory Contracts and Management Fees | (Click Here) | |
To view a fund's proxy voting guidelines and proxy voting record for the 12-month period ended June 30, visit http://www.fidelity.com/proxyvotingresults or visit the Securities and Exchange Commission's (SEC) web site at http://www.sec.gov. You may also call 1-877-208-0098 to request a free copy of the proxy voting guidelines.
Standard & Poor's, S&P and S&P 500 are registered service marks of The McGraw-Hill Companies, Inc. and have been licensed for use by Fidelity Distributors Corporation.
Other third-party marks appearing herein are the property of their respective owners.
All other marks appearing herein are registered or unregistered trademarks or service marks of FMR LLC or an affiliated company. © 2014 FMR LLC. All rights reserved.
Annual Report
This report and the financial statements contained herein are submitted for the general information of the shareholders of the fund. This report is not authorized for distribution to prospective investors in the fund unless preceded or accompanied by an effective prospectus.
A fund files its complete schedule of portfolio holdings with the SEC for the first and third quarters of each fiscal year on Form N-Q. Forms N-Q are available on the SEC's web site at http://www.sec.gov. A fund's Forms N-Q may be reviewed and copied at the SEC's Public Reference Room in Washington, DC. Information regarding the operation of the SEC's Public Reference Room may be obtained by calling 1-800-SEC-0330. For a complete list of a fund's portfolio holdings, view the most recent holdings listing, semiannual report, or annual report on Fidelity's web site at http://www.fidelity.com, http://www.advisor.fidelity.com, or http://www.401k.com, as applicable.
NOT FDIC INSURED • MAY LOSE VALUE • NO BANK GUARANTEE
Neither the fund nor Fidelity Distributors Corporation is a bank.
Annual Report
Average annual total return reflects the change in the value of an investment, assuming reinvestment of the class' distributions from dividend income and capital gains (the profits earned upon the sale of securities that have grown in value, if any) and assuming a constant rate of performance each year. The $10,000 table and the fund's returns do not reflect the deduction of taxes that a shareholder would pay on fund distributions or the redemption of fund shares. During periods of reimbursement by Fidelity, a fund's total return will be greater than it would be had the reimbursement not occurred. How a fund did yesterday is no guarantee of how it will do tomorrow.
Average Annual Total Returns
Periods ended October 31, 2014 | Past 1
year | Past 5
years | Life of
fund A |
Institutional Class | 0.37% | 7.42% | -0.83% |
A From November 1, 2007.
$10,000 Over Life of Fund
Let's say hypothetically that $10,000 was invested in Fidelity Advisor® Total International Equity Fund - Institutional Class on November 1, 2007, when the fund started. The chart shows how the value of your investment would have changed, and also shows how the MSCI ACWI (All Country World Index) ex USA Index performed over the same period.
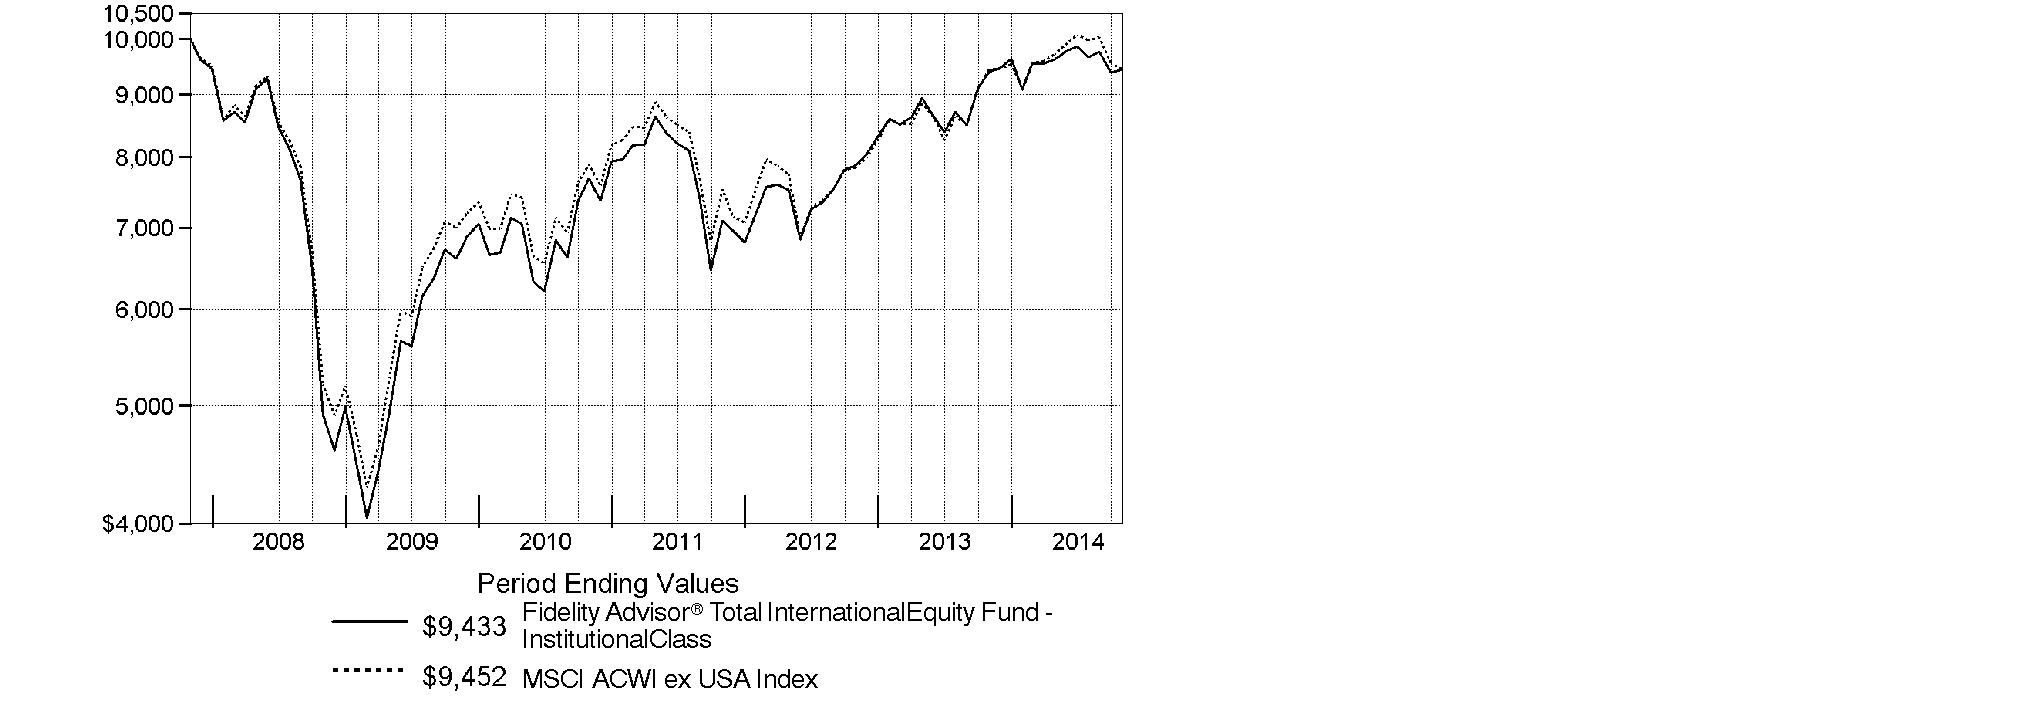
Annual Report
Market Recap: Global equities posted a healthy gain for the 12 months ending October 31, 2014, overcoming an October market decline driven by recessionary pressures in China and tepid growth in Europe. The MSCI ACWI (All Country World Index) Index rose 8.15%, helped by subdued market volatility for much of the period and supported by solid corporate earnings, especially in the United States. Stocks also benefited from easy monetary policies in Japan and the eurozone, as well as increased stimulus efforts in China. All but three of the 24 industry groups that compose the index marked a positive return. The U.S. (+17%) remained a pillar of strength, while a strongly rising dollar in the latter part of the period detracted from investors' returns in most non-U.S. markets. Canada (+5%) notched broad gains outside of its energy and materials sectors, as did Asia-Pacific ex Japan (+4%), led by investor enthusiasm for companies in India. The U.K., Europe and Japan, meanwhile, all underperformed. Among sectors, health care (+24%) led the index, with a strong contribution from the pharmaceuticals, biotechnology & life sciences industry. Information technology (+21%) also outperformed. Conversely, materials (-4%) and energy (-1%) lagged the index due to a higher supply of and lower demand for commodities.
Comments from Alexander Zavratsky, Co-Portfolio Manager of Fidelity Advisor® Total International Equity Fund: For the year, the fund's Institutional Class shares gained 0.37%, compared with an advance of 0.18% for the MSCI ACWI (All Country World Index) ex USA Index. The fund benefited the most from its positioning in the U.S. Favorable out-of-index investments in the U.K. and India also helped. On the negative side, the fund lost ground in Hong Kong, while a significant underweighting in outperforming Canada further detracted. On an individual basis, U.K.-based hotel company InterContinental Hotel Group was the fund's top relative contributor. A stake in Japan-based Astellas Pharma helped, due in part to the firm's September announcement that the U.S. government had approved expanded use of its Xtandi® cancer drug. Selling our holdings in U.K.-based food retailer Tesco in the first half of the year also helped, as sliding sales and a loss in market share steadily eroded its stock price. In contrast, one notable laggard was Andritz, an Austrian industrial engineering firm that saw its stock return -21%. Another performance challenge was the fund's overweighting, on average, in Japanese bank holding company Sumitomo Mitsui Financial Group, about which we became more bearish and ultimately sold the stock during the period.
Annual Report
Note to shareholders: Sammy Simnegar became a Co-Manager on June 21, 2014, succeeding Ashish Swarup.
The views expressed above reflect those of the portfolio manager(s) only through the end of the period as stated on the cover of this report and do not necessarily represent the views of Fidelity or any other person in the Fidelity organization. Any such views are subject to change at any time based upon market or other conditions and Fidelity disclaims any responsibility to update such views. These views may not be relied on as investment advice and, because investment decisions for a Fidelity fund are based on numerous factors, may not be relied on as an indication of trading intent on behalf of any Fidelity fund.
Annual Report
Shareholder Expense Example
As a shareholder of the Fund, you incur two types of costs: (1) transaction costs, including sales charges (loads) on purchase payments or redemption proceeds, redemption fees and (2) ongoing costs, including management fees, distribution and/or service (12b-1) fees and other Fund expenses. This Example is intended to help you understand your ongoing costs (in dollars) of investing in the Fund and to compare these costs with the ongoing costs of investing in other mutual funds.
The Example is based on an investment of $1,000 invested at the beginning of the period and held for the entire period (May 1, 2014 to October 31, 2014).
Actual Expenses
The first line of the accompanying table for each class of the Fund provides information about actual account values and actual expenses. You may use the information in this line, together with the amount you invested, to estimate the expenses that you paid over the period. Simply divide your account value by $1,000.00 (for example, an $8,600 account value divided by $1,000.00 = 8.6), then multiply the result by the number in the first line for a class of the Fund under the heading entitled "Expenses Paid During Period" to estimate the expenses you paid on your account during this period. A small balance maintenance fee of $12.00 that is charged once a year may apply for certain accounts with a value of less than $2,000. This fee is not included in the table below. If it was, the estimate of expenses you paid during the period would be higher, and your ending account value lower, by this amount. In addition, the Fund, as a shareholder in the underlying Fidelity Central Funds, will indirectly bear its pro-rata share of the fees and expenses incurred by the underlying Fidelity Central Funds. These fees and expenses are not included in the Fund's annualized expense ratio used to calculate the expense estimate in the table below.
Hypothetical Example for Comparison Purposes
The second line of the accompanying table for each class of the Fund provides information about hypothetical account values and hypothetical expenses based on a Class' actual expense ratio and an assumed rate of return of 5% per year before expenses, which is not the Class' actual return. The hypothetical account values and expenses may not be used to estimate the actual ending account balance or expenses you paid for the period. You may use this information to compare the ongoing costs of investing in the Fund and other funds. To do so, compare this 5% hypothetical example with the 5% hypothetical examples that appear in the shareholder reports of the other funds. A small balance maintenance fee of $12.00 that is charged once a year may apply for certain accounts with a value of less than $2,000. This fee is not included in the table below. If it was, the estimate of expenses you paid during the period would be higher, and your ending account value lower, by this amount. In addition, the Fund, as a shareholder in the underlying Fidelity Central Funds, will indirectly bear its pro-rata share of the fees and expenses incurred by the underlying Fidelity Central Funds. These fees and expenses are not included in the Fund's annualized expense ratio used to calculate the expense estimate in the table below.
Please note that the expenses shown in the table are meant to highlight your ongoing costs only and do not reflect any transaction costs. Therefore, the second line of the table is useful in comparing ongoing costs only, and will not help you determine the relative total costs of owning different funds. In addition, if these transactional costs were included, your costs would have been higher.
Annual Report
Shareholder Expense Example - continued
| Annualized
Expense RatioB | Beginning
Account Value
May 1, 2014 | Ending
Account Value
October 31, 2014 | Expenses Paid
During Period*
May 1, 2014 to
October 31, 2014 |
Class A | 1.44% | | | |
Actual | | $ 1,000.00 | $ 980.40 | $ 7.19 |
HypotheticalA | | $ 1,000.00 | $ 1,017.95 | $ 7.32 |
Class T | 1.69% | | | |
Actual | | $ 1,000.00 | $ 980.50 | $ 8.44 |
HypotheticalA | | $ 1,000.00 | $ 1,016.69 | $ 8.59 |
Class B | 2.20% | | | |
Actual | | $ 1,000.00 | $ 976.90 | $ 10.96 |
HypotheticalA | | $ 1,000.00 | $ 1,014.12 | $ 11.17 |
Class C | 2.20% | | | |
Actual | | $ 1,000.00 | $ 978.00 | $ 10.97 |
HypotheticalA | | $ 1,000.00 | $ 1,014.12 | $ 11.17 |
Total International Equity | 1.04% | | | |
Actual | | $ 1,000.00 | $ 982.90 | $ 5.20 |
HypotheticalA | | $ 1,000.00 | $ 1,019.96 | $ 5.30 |
Institutional Class | 1.15% | | | |
Actual | | $ 1,000.00 | $ 981.60 | $ 5.74 |
HypotheticalA | | $ 1,000.00 | $ 1,019.41 | $ 5.85 |
A 5% return per year before expenses
B Annualized expense ratio reflects expenses net of applicable fee waivers.
* Expenses are equal to each Class' annualized expense ratio, multiplied by the average account value over the period, multiplied by 184/365 (to reflect the one-half year period).
Annual Report
Investment Changes (Unaudited)
Geographic Diversification (% of fund's net assets) |
As of October 31, 2014 |
 | United Kingdom 15.9% | |
 | Japan 13.5% | |
 | United States of America* 9.4% | |
 | Switzerland 7.8% | |
 | France 6.4% | |
 | Germany 4.9% | |
 | Australia 3.8% | |
 | Sweden 3.2% | |
 | India 2.8% | |
 | Other 32.3% | |

Percentages are based on country or territory of incorporation and are adjusted for the effect of futures contracts, if applicable. |
* Includes Short-Term Investments and Net Other Assets (Liabilities). |
As of April 30, 2014 |
| United Kingdom 15.7% | |
| Japan 12.4% | |
| United States of America* 9.7% | |
| Switzerland 8.2% | |
| France 7.5% | |
| Germany 4.7% | |
| India 4.2% | |
| Korea (South) 3.8% | |
| Sweden 3.4% | |
| Other 30.4% | |

Percentages are based on country or territory of incorporation and are adjusted for the effect of futures contracts, if applicable. |
* Includes Short-Term Investments and Net Other Assets (Liabilities). |
Asset Allocation as of October 31, 2014 |
| % of fund's
net assets | % of fund's net assets
6 months ago |
Stocks | 98.7 | 97.0 |
Short-Term Investments and Net Other Assets (Liabilities) | 1.3 | 3.0 |
Top Ten Stocks as of October 31, 2014 |
| % of fund's
net assets | % of fund's net assets
6 months ago |
Nestle SA (Switzerland, Food Products) | 2.2 | 2.2 |
Roche Holding AG (participation certificate) (Switzerland, Pharmaceuticals) | 1.9 | 1.7 |
Novartis AG (Switzerland, Pharmaceuticals) | 1.7 | 1.4 |
Prudential PLC (United Kingdom, Insurance) | 1.5 | 1.4 |
Anheuser-Busch InBev SA NV (Belgium, Beverages) | 1.3 | 1.7 |
Total SA (France, Oil, Gas & Consumable Fuels) | 1.2 | 1.8 |
Bayer AG (Germany, Pharmaceuticals) | 1.2 | 0.9 |
ING Groep NV (Certificaten Van Aandelen) (Netherlands, Banks) | 1.0 | 0.9 |
Samsung Electronics Co. Ltd. (Korea (South), Technology Hardware, Storage & Peripherals) | 1.0 | 0.0 |
HSBC Holdings PLC sponsored ADR (United Kingdom, Banks) | 1.0 | 0.8 |
| 14.0 | |
Market Sectors as of October 31, 2014 |
| % of fund's
net assets | % of fund's net assets
6 months ago |
Financials | 21.0 | 20.0 |
Consumer Discretionary | 14.5 | 13.4 |
Health Care | 13.2 | 12.0 |
Industrials | 12.7 | 12.3 |
Consumer Staples | 10.9 | 12.7 |
Information Technology | 10.6 | 8.0 |
Materials | 6.0 | 6.2 |
Telecommunication Services | 4.1 | 6.0 |
Energy | 4.1 | 3.5 |
Utilities | 1.6 | 2.9 |
Annual Report
Investments October 31, 2014
Showing Percentage of Net Assets
Common Stocks - 97.1% |
| Shares | | Value |
Australia - 3.8% |
Ansell Ltd. | 36,338 | | $ 637,392 |
Australia & New Zealand Banking Group Ltd. | 71,673 | | 2,120,846 |
Carsales.com Ltd. | 36,462 | | 344,069 |
CSL Ltd. | 42,674 | | 3,012,909 |
DuluxGroup Ltd. | 11,047 | | 52,207 |
Imdex Ltd. (a) | 42,463 | | 22,484 |
RCG Corp. Ltd. | 76,989 | | 41,646 |
SEEK Ltd. | 21,138 | | 310,198 |
Sydney Airport unit | 279,741 | | 1,087,559 |
Telstra Corp. Ltd. | 150,660 | | 749,708 |
TFS Corp. Ltd. | 42,449 | | 58,836 |
Transurban Group unit | 247,376 | | 1,771,684 |
Westpac Banking Corp. | 98,983 | | 3,038,211 |
TOTAL AUSTRALIA | | 13,247,749 |
Austria - 0.4% |
Andritz AG | 29,961 | | 1,446,258 |
Zumtobel AG | 3,400 | | 59,927 |
TOTAL AUSTRIA | | 1,506,185 |
Bailiwick of Jersey - 0.9% |
Shire PLC | 32,580 | | 2,186,018 |
Wolseley PLC | 12,722 | | 675,055 |
WPP PLC | 13,800 | | 269,551 |
TOTAL BAILIWICK OF JERSEY | | 3,130,624 |
Belgium - 2.1% |
Anheuser-Busch InBev SA NV | 41,971 | | 4,654,349 |
Gimv NV | 1,319 | | 59,918 |
KBC Ancora (a) | 4,181 | | 120,952 |
KBC Groupe SA (a) | 38,317 | | 2,052,725 |
UCB SA | 5,288 | | 426,690 |
TOTAL BELGIUM | | 7,314,634 |
Bermuda - 0.8% |
Brilliance China Automotive Holdings Ltd. | 218,000 | | 376,980 |
China Gas Holdings Ltd. | 218,000 | | 389,758 |
China Resources Gas Group Ltd. | 126,000 | | 360,169 |
Credicorp Ltd. (United States) | 3,700 | | 595,700 |
Lazard Ltd. Class A | 15,500 | | 762,755 |
Petra Diamonds Ltd. (a) | 19,900 | | 52,844 |
Common Stocks - continued |
| Shares | | Value |
Bermuda - continued |
Travelport Worldwide Ltd. | 13,500 | | $ 195,075 |
Vostok Nafta Investment Ltd. SDR (a) | 7,560 | | 48,426 |
TOTAL BERMUDA | | 2,781,707 |
Brazil - 1.5% |
Arezzo Industria e Comercio SA | 3,500 | | 40,538 |
BB Seguridade Participacoes SA | 40,200 | | 536,346 |
CCR SA | 68,300 | | 508,550 |
Cetip SA - Mercados Organizado | 24,800 | | 314,266 |
Cielo SA | 37,700 | | 619,078 |
Estacio Participacoes SA | 42,300 | | 489,935 |
Iguatemi Empresa de Shopping Centers SA | 28,500 | | 288,692 |
Kroton Educacional SA | 82,200 | | 585,840 |
Linx SA | 11,700 | | 243,075 |
Qualicorp SA (a) | 38,100 | | 387,473 |
Smiles SA | 18,600 | | 321,272 |
T4F Entretenimento SA (a) | 10,200 | | 11,526 |
Ultrapar Participacoes SA | 22,800 | | 497,332 |
Weg SA | 34,700 | | 409,331 |
TOTAL BRAZIL | | 5,253,254 |
British Virgin Islands - 0.1% |
Gem Diamonds Ltd. (a) | 23,773 | | 59,041 |
Mail.Ru Group Ltd. GDR (a)(e) | 13,900 | | 336,936 |
TOTAL BRITISH VIRGIN ISLANDS | | 395,977 |
Canada - 0.8% |
Canadian Pacific Railway Ltd. | 4,766 | | 991,343 |
Imperial Oil Ltd. | 14,900 | | 716,940 |
Pason Systems, Inc. | 5,600 | | 134,006 |
Potash Corp. of Saskatchewan, Inc. | 20,800 | | 709,974 |
ShawCor Ltd. Class A | 2,000 | | 88,106 |
TOTAL CANADA | | 2,640,369 |
Cayman Islands - 2.5% |
51job, Inc. sponsored ADR (a) | 1,100 | | 33,770 |
58.com, Inc. ADR | 900 | | 35,613 |
Alibaba Group Holding Ltd. sponsored ADR | 4,900 | | 483,140 |
Autohome, Inc. ADR Class A | 5,800 | | 306,762 |
Baidu.com, Inc. sponsored ADR (a) | 2,100 | | 501,417 |
Bitauto Holdings Ltd. ADR (a) | 3,800 | | 318,136 |
Haitian International Holdings Ltd. | 146,000 | | 313,181 |
Melco Crown Entertainment Ltd. sponsored ADR | 13,900 | | 377,246 |
Common Stocks - continued |
| Shares | | Value |
Cayman Islands - continued |
Sands China Ltd. | 319,200 | | $ 1,990,886 |
SouFun Holdings Ltd. ADR | 34,200 | | 333,450 |
Tencent Holdings Ltd. | 173,300 | | 2,785,325 |
Wynn Macau Ltd. | 374,800 | | 1,354,942 |
TOTAL CAYMAN ISLANDS | | 8,833,868 |
China - 0.3% |
China Pacific Insurance Group Co. Ltd. (H Shares) | 144,200 | | 539,619 |
PICC Property & Casualty Co. Ltd. (H Shares) | 226,000 | | 414,583 |
TOTAL CHINA | | 954,202 |
Colombia - 0.1% |
Grupo de Inversiones Suramerica SA | 19,997 | | 415,782 |
Denmark - 1.5% |
A.P. Moller - Maersk A/S Series B | 415 | | 967,017 |
Jyske Bank A/S (Reg.) (a) | 16,554 | | 891,873 |
Novo Nordisk A/S Series B sponsored ADR | 71,000 | | 3,207,780 |
Spar Nord Bank A/S | 13,331 | | 134,668 |
TOTAL DENMARK | | 5,201,338 |
Egypt - 0.1% |
Commercial International Bank SAE sponsored GDR | 58,000 | | 394,400 |
Finland - 0.6% |
Kone Oyj (B Shares) | 7,500 | | 322,373 |
Sampo Oyj (A Shares) | 28,753 | | 1,375,335 |
Tikkurila Oyj | 20,380 | | 420,886 |
TOTAL FINLAND | | 2,118,594 |
France - 6.4% |
Atos Origin SA | 13,703 | | 946,001 |
AXA SA | 60,106 | | 1,386,675 |
BNP Paribas SA | 31,354 | | 1,970,064 |
Bureau Veritas SA | 12,800 | | 316,476 |
Cap Gemini SA | 15,902 | | 1,045,401 |
Coface SA | 3,500 | | 43,597 |
GDF Suez | 48,569 | | 1,178,027 |
Havas SA | 98,586 | | 796,853 |
Ingenico SA | 3,033 | | 302,050 |
Laurent-Perrier Group SA | 859 | | 68,893 |
LVMH Moet Hennessy - Louis Vuitton SA | 2,185 | | 370,606 |
Orange SA | 80,300 | | 1,278,406 |
Pernod Ricard SA | 2,500 | | 284,559 |
Common Stocks - continued |
| Shares | | Value |
France - continued |
Publicis Groupe SA (a) | 4,400 | | $ 304,751 |
Renault SA | 10,111 | | 750,480 |
Safran SA | 25,714 | | 1,627,287 |
Saft Groupe SA | 1,254 | | 37,243 |
Sanofi SA | 31,612 | | 2,868,476 |
Schneider Electric SA | 8,290 | | 653,236 |
Total SA | 70,715 | | 4,221,919 |
Vetoquinol SA | 1,500 | | 67,670 |
Virbac SA | 460 | | 102,867 |
Vivendi SA | 61,109 | | 1,491,371 |
Zodiac Aerospace | 9,900 | | 301,905 |
TOTAL FRANCE | | 22,414,813 |
Germany - 4.4% |
Allianz SE | 13,864 | | 2,204,683 |
alstria office REIT-AG | 2,900 | | 35,956 |
BASF AG | 24,471 | | 2,153,968 |
Bayer AG | 28,312 | | 4,025,113 |
CompuGroup Medical AG | 6,146 | | 140,944 |
Continental AG | 3,983 | | 781,887 |
CTS Eventim AG | 7,966 | | 210,034 |
Fielmann AG | 2,158 | | 140,705 |
Fresenius SE & Co. KGaA | 18,300 | | 941,385 |
GEA Group AG | 16,708 | | 768,306 |
Linde AG | 18,149 | | 3,346,694 |
Siemens AG | 4,547 | | 512,872 |
TOTAL GERMANY | | 15,262,547 |
Greece - 0.2% |
Folli Follie SA | 11,900 | | 389,216 |
Greek Organization of Football Prognostics SA | 29,900 | | 362,327 |
Titan Cement Co. SA (Reg.) | 4,344 | | 96,299 |
TOTAL GREECE | | 847,842 |
Hong Kong - 0.2% |
AIA Group Ltd. | 59,200 | | 330,361 |
Galaxy Entertainment Group Ltd. | 62,000 | | 423,950 |
TOTAL HONG KONG | | 754,311 |
India - 2.8% |
Apollo Hospitals Enterprise Ltd. (a) | 15,570 | | 282,558 |
Asian Paints India Ltd. | 30,401 | | 324,794 |
Axis Bank Ltd. (a) | 52,112 | | 384,077 |
Common Stocks - continued |
| Shares | | Value |
India - continued |
Exide Industries Ltd. | 107,368 | | $ 275,273 |
Grasim Industries Ltd. | 5,109 | | 306,582 |
Havells India Ltd. | 76,303 | | 354,870 |
HCL Technologies Ltd. | 17,231 | | 451,903 |
HDFC Bank Ltd. | 33,095 | | 536,647 |
Housing Development Finance Corp. Ltd. | 79,086 | | 1,424,279 |
ICICI Bank Ltd. (a) | 17,048 | | 452,744 |
ITC Ltd. (a) | 105,347 | | 609,107 |
Jyothy Laboratories Ltd. (a) | 16,584 | | 67,645 |
Larsen & Toubro Ltd. (a) | 21,630 | | 582,912 |
LIC Housing Finance Ltd. | 60,567 | | 356,663 |
Lupin Ltd. | 15,749 | | 364,643 |
Mahindra & Mahindra Ltd. (a) | 20,039 | | 426,065 |
Motherson Sumi Systems Ltd. | 40,123 | | 274,716 |
Sun Pharmaceutical Industries Ltd. | 38,990 | | 536,574 |
Sun TV Ltd. | 66,511 | | 353,725 |
Tata Consultancy Services Ltd. | 16,606 | | 706,544 |
Tata Motors Ltd. (a) | 54,875 | | 479,423 |
Titan Co. Ltd. (a) | 58,658 | | 385,323 |
TOTAL INDIA | | 9,937,067 |
Indonesia - 1.4% |
PT ACE Hardware Indonesia Tbk | 4,495,200 | | 301,708 |
PT Astra International Tbk | 1,051,800 | | 589,756 |
PT Bank Central Asia Tbk | 634,800 | | 685,293 |
PT Bank Rakyat Indonesia Tbk | 638,600 | | 585,211 |
PT Global Mediacom Tbk | 2,698,800 | | 438,017 |
PT Indocement Tunggal Prakarsa Tbk | 208,900 | | 414,037 |
PT Jasa Marga Tbk | 697,200 | | 366,556 |
PT Media Nusantara Citra Tbk | 1,468,800 | | 340,512 |
PT Semen Gresik (Persero) Tbk | 330,800 | | 434,523 |
PT Surya Citra Media Tbk | 1,114,500 | | 311,970 |
PT Tower Bersama Infrastructure Tbk | 500,800 | | 368,887 |
TOTAL INDONESIA | | 4,836,470 |
Ireland - 1.2% |
Actavis PLC (a) | 4,600 | | 1,116,604 |
CRH PLC sponsored ADR | 61,429 | | 1,376,624 |
FBD Holdings PLC | 5,372 | | 90,881 |
Common Stocks - continued |
| Shares | | Value |
Ireland - continued |
James Hardie Industries PLC: | | | |
CDI | 15,656 | | $ 166,997 |
sponsored ADR | 29,355 | | 1,565,502 |
TOTAL IRELAND | | 4,316,608 |
Israel - 0.6% |
Azrieli Group | 13,296 | | 426,821 |
Ituran Location & Control Ltd. | 1,761 | | 36,083 |
Sarine Technologies Ltd. | 39,000 | | 90,445 |
Strauss Group Ltd. | 4,359 | | 70,309 |
Teva Pharmaceutical Industries Ltd. sponsored ADR | 27,109 | | 1,530,845 |
TOTAL ISRAEL | | 2,154,503 |
Italy - 0.8% |
Azimut Holding SpA | 25,814 | | 602,982 |
Beni Stabili SpA SIIQ | 222,926 | | 153,508 |
Interpump Group SpA | 51,891 | | 676,283 |
Intesa Sanpaolo SpA | 305,700 | | 898,684 |
Telecom Italia SpA (a) | 550,300 | | 623,645 |
TOTAL ITALY | | 2,955,102 |
Japan - 13.5% |
Air Water, Inc. | 3,000 | | 47,821 |
Aozora Bank Ltd. | 215,000 | | 755,705 |
Artnature, Inc. | 8,000 | | 108,188 |
Asahi Co. Ltd. | 4,800 | | 53,370 |
Astellas Pharma, Inc. | 195,000 | | 3,026,497 |
Autobacs Seven Co. Ltd. | 4,400 | | 64,547 |
Azbil Corp. | 4,700 | | 113,343 |
Broadleaf Co. Ltd. | 3,200 | | 50,576 |
Coca-Cola Central Japan Co. Ltd. | 30,700 | | 552,387 |
Cosmos Pharmaceutical Corp. | 700 | | 100,085 |
Daiichikosho Co. Ltd. | 1,600 | | 40,378 |
Daikokutenbussan Co. Ltd. | 5,000 | | 145,488 |
DENSO Corp. | 74,700 | | 3,423,772 |
Dentsu, Inc. | 19,400 | | 721,283 |
East Japan Railway Co. | 21,300 | | 1,663,599 |
Fanuc Corp. | 7,300 | | 1,286,521 |
Fast Retailing Co. Ltd. | 3,900 | | 1,449,854 |
Fujitsu Ltd. | 97,000 | | 589,708 |
Glory Ltd. | 2,100 | | 54,116 |
Goldcrest Co. Ltd. | 6,860 | | 124,110 |
Harmonic Drive Systems, Inc. | 6,000 | | 77,459 |
Common Stocks - continued |
| Shares | | Value |
Japan - continued |
Hitachi Ltd. | 154,000 | | $ 1,210,051 |
Hoya Corp. | 34,500 | | 1,220,846 |
Itochu Corp. | 135,300 | | 1,635,580 |
Iwatsuka Confectionary Co. Ltd. | 1,400 | | 75,625 |
Japan Tobacco, Inc. | 75,600 | | 2,579,401 |
KDDI Corp. | 20,400 | | 1,339,657 |
Keyence Corp. | 6,121 | | 2,966,131 |
Kobayashi Pharmaceutical Co. Ltd. | 1,500 | | 92,590 |
Koshidaka Holdings Co. Ltd. | 4,000 | | 68,304 |
Kyoto Kimono Yuzen Co. Ltd. | 2,600 | | 23,428 |
Lasertec Corp. | 4,500 | | 56,303 |
Medikit Co. Ltd. | 1,500 | | 46,739 |
Meiko Network Japan Co. Ltd. | 2,700 | | 30,360 |
Miraial Co. Ltd. | 2,400 | | 36,953 |
Mitsubishi Electric Corp. | 60,000 | | 773,628 |
Mitsubishi UFJ Financial Group, Inc. | 488,100 | | 2,845,240 |
Mitsui Fudosan Co. Ltd. | 63,000 | | 2,026,486 |
Nabtesco Corp. | 3,800 | | 91,962 |
Nagaileben Co. Ltd. | 6,100 | | 117,248 |
ND Software Co. Ltd. | 3,000 | | 53,760 |
Nihon M&A Center, Inc. | 1,500 | | 43,109 |
Nihon Parkerizing Co. Ltd. | 7,000 | | 167,088 |
Nippon Seiki Co. Ltd. | 3,000 | | 63,909 |
Nippon Telegraph & Telephone Corp. | 21,500 | | 1,337,705 |
NS Tool Co. Ltd. | 3,800 | | 43,645 |
OBIC Co. Ltd. | 4,000 | | 142,796 |
OMRON Corp. | 16,900 | | 799,956 |
ORIX Corp. | 62,000 | | 860,575 |
OSG Corp. | 12,400 | | 202,197 |
Paramount Bed Holdings Co. Ltd. | 1,300 | | 36,975 |
San-Ai Oil Co. Ltd. | 8,000 | | 55,377 |
Seven & i Holdings Co., Ltd. | 34,700 | | 1,355,248 |
Seven Bank Ltd. | 423,000 | | 1,766,618 |
SHO-BOND Holdings Co. Ltd. | 22,700 | | 877,134 |
Shoei Co. Ltd. | 5,900 | | 90,165 |
SK Kaken Co. Ltd. | 1,000 | | 76,533 |
SoftBank Corp. | 7,500 | | 545,996 |
Software Service, Inc. | 1,600 | | 60,932 |
Sony Financial Holdings, Inc. | 43,700 | | 697,658 |
Sumitomo Mitsui Trust Holdings, Inc. | 272,920 | | 1,114,257 |
Techno Medica Co. Ltd. | 1,800 | | 38,980 |
TFP Consulting Group Co. Ltd. | 2,000 | | 58,346 |
Common Stocks - continued |
| Shares | | Value |
Japan - continued |
The Nippon Synthetic Chemical Industry Co. Ltd. | 10,000 | | $ 61,056 |
TKC Corp. | 3,000 | | 58,894 |
Tocalo Co. Ltd. | 2,800 | | 52,819 |
Toyota Motor Corp. | 31,700 | | 1,907,618 |
Tsutsumi Jewelry Co. Ltd. | 2,000 | | 49,193 |
USS Co. Ltd. | 128,500 | | 2,022,333 |
Workman Co. Ltd. | 2,000 | | 104,531 |
Yamato Kogyo Co. Ltd. | 23,400 | | 758,043 |
TOTAL JAPAN | | 47,188,785 |
Kenya - 0.4% |
East African Breweries Ltd. | 96,600 | | 307,781 |
Kenya Commercial Bank Ltd. | 481,600 | | 296,121 |
Safaricom Ltd. | 6,274,300 | | 855,746 |
TOTAL KENYA | | 1,459,648 |
Korea (South) - 1.7% |
Bgf Retail (a) | 1,204 | | 76,199 |
Coway Co. Ltd. | 7,564 | | 574,457 |
KEPCO Plant Service & Engineering Co. Ltd. | 3,828 | | 312,455 |
Leeno Industrial, Inc. | 1,964 | | 77,778 |
NAVER Corp. | 1,947 | | 1,366,322 |
Samsung Electronics Co. Ltd. | 3,127 | | 3,620,463 |
TOTAL KOREA (SOUTH) | | 6,027,674 |
Luxembourg - 0.2% |
RTL Group SA | 6,227 | | 578,698 |
Samsonite International SA | 79,100 | | 262,828 |
TOTAL LUXEMBOURG | | 841,526 |
Malaysia - 0.3% |
Astro Malaysia Holdings Bhd | 337,500 | | 338,595 |
Public Bank Bhd | 94,100 | | 530,305 |
Tune Insurance Holdings Bhd | 441,000 | | 290,939 |
TOTAL MALAYSIA | | 1,159,839 |
Malta - 0.1% |
Brait SA | 51,016 | | 383,346 |
Mexico - 1.6% |
Banregio Grupo Financiero S.A.B. de CV | 56,700 | | 327,916 |
Consorcio ARA S.A.B. de CV (a) | 230,655 | | 106,196 |
Fomento Economico Mexicano S.A.B. de CV: | | | |
unit | 68,500 | | 658,841 |
Common Stocks - continued |
| Shares | | Value |
Mexico - continued |
Fomento Economico Mexicano S.A.B. de CV: - continued | | | |
sponsored ADR | 5,833 | | $ 561,368 |
Grupo Aeroportuario del Pacifico SA de CV Series B | 51,900 | | 353,111 |
Grupo Aeroportuario del Sureste SA de CV Series B | 32,100 | | 429,120 |
Grupo Aeroportuario Norte S.A.B. de CV | 66,000 | | 328,818 |
Grupo Financiero Banorte S.A.B. de CV Series O | 104,300 | | 669,116 |
Grupo Mexico SA de CV Series B | 153,100 | | 526,051 |
Grupo Televisa SA de CV | 98,400 | | 711,133 |
Megacable Holdings S.A.B. de CV unit | 71,300 | | 326,631 |
Promotora y Operadora de Infraestructura S.A.B. de CV (a) | 27,600 | | 350,620 |
Qualitas Controladora S.A.B. de CV | 101,200 | | 261,750 |
TOTAL MEXICO | | 5,610,671 |
Netherlands - 1.6% |
Aalberts Industries NV | 7,600 | | 202,336 |
ASM International NV (depositary receipt) | 1,050 | | 34,367 |
Heijmans NV (Certificaten Van Aandelen) | 8,481 | | 115,207 |
ING Groep NV (Certificaten Van Aandelen) (a) | 253,023 | | 3,623,381 |
Reed Elsevier NV | 69,904 | | 1,608,778 |
VastNed Retail NV | 3,438 | | 156,974 |
TOTAL NETHERLANDS | | 5,741,043 |
Nigeria - 0.3% |
Dangote Cement PLC | 262,417 | | 340,596 |
Guaranty Trust Bank PLC GDR (Reg. S) | 38,400 | | 295,680 |
Nigerian Breweries PLC | 277,569 | | 271,453 |
TOTAL NIGERIA | | 907,729 |
Norway - 0.3% |
Statoil ASA | 40,700 | | 931,437 |
Philippines - 0.7% |
Alliance Global Group, Inc. | 722,700 | | 406,490 |
GT Capital Holdings, Inc. | 16,525 | | 371,308 |
Jollibee Food Corp. | 14,560 | | 63,458 |
Metropolitan Bank & Trust Co. | 159,590 | | 292,820 |
Robinsons Retail Holdings, Inc. | 203,460 | | 289,559 |
SM Investments Corp. | 22,980 | | 400,441 |
SM Prime Holdings, Inc. | 1,147,600 | | 446,103 |
TOTAL PHILIPPINES | | 2,270,179 |
Common Stocks - continued |
| Shares | | Value |
Russia - 0.4% |
Magnit OJSC GDR (Reg. S) | 10,200 | | $ 683,400 |
NOVATEK OAO GDR (Reg. S) | 5,000 | | 537,000 |
TOTAL RUSSIA | | 1,220,400 |
Singapore - 0.3% |
Singapore Telecommunications Ltd. | 325,000 | | 956,565 |
South Africa - 2.7% |
Alexander Forbes Group Holding (a) | 440,894 | | 343,769 |
Aspen Pharmacare Holdings Ltd. | 18,700 | | 667,044 |
Bidvest Group Ltd. | 20,332 | | 559,226 |
Clicks Group Ltd. | 126,095 | | 858,563 |
Coronation Fund Managers Ltd. | 35,200 | | 304,776 |
FirstRand Ltd. | 131,700 | | 563,588 |
Life Healthcare Group Holdings Ltd. | 93,500 | | 353,494 |
Mr Price Group Ltd. | 21,800 | | 450,932 |
MTN Group Ltd. | 69,800 | | 1,544,115 |
Nampak Ltd. | 122,830 | | 500,797 |
Naspers Ltd. Class N | 17,300 | | 2,152,966 |
Remgro Ltd. | 21,400 | | 490,834 |
Sanlam Ltd. | 78,100 | | 493,181 |
TOTAL SOUTH AFRICA | | 9,283,285 |
Spain - 2.0% |
Amadeus IT Holding SA Class A | 29,964 | | 1,100,197 |
Banco Bilbao Vizcaya Argentaria SA | 136,679 | | 1,528,739 |
Iberdrola SA | 212,300 | | 1,500,753 |
Inditex SA | 84,310 | | 2,368,214 |
Prosegur Compania de Seguridad SA (Reg.) | 83,576 | | 490,152 |
TOTAL SPAIN | | 6,988,055 |
Sweden - 3.2% |
ASSA ABLOY AB (B Shares) | 38,500 | | 2,039,145 |
Atlas Copco AB (A Shares) | 57,159 | | 1,649,558 |
Fagerhult AB | 46,655 | | 859,284 |
H&M Hennes & Mauritz AB (B Shares) | 37,639 | | 1,497,068 |
Intrum Justitia AB | 24,563 | | 729,823 |
Meda AB (A Shares) | 38,100 | | 500,491 |
Nordea Bank AB | 137,267 | | 1,760,417 |
Svenska Cellulosa AB (SCA) (B Shares) | 24,726 | | 552,841 |
Svenska Handelsbanken AB (A Shares) | 30,315 | | 1,445,517 |
TOTAL SWEDEN | | 11,034,144 |
Common Stocks - continued |
| Shares | | Value |
Switzerland - 7.8% |
Compagnie Financiere Richemont SA Series A | 4,451 | | $ 374,483 |
Credit Suisse Group AG | 49,298 | | 1,313,486 |
Nestle SA | 103,458 | | 7,586,996 |
Novartis AG | 64,870 | | 6,020,122 |
Roche Holding AG (participation certificate) | 22,895 | | 6,756,352 |
Schindler Holding AG: | | | |
(participation certificate) | 6,511 | | 909,503 |
(Reg.) | 2,251 | | 304,610 |
SGS SA (Reg.) | 150 | | 329,263 |
Syngenta AG (Switzerland) | 1,602 | | 495,431 |
UBS AG (NY Shares) | 188,297 | | 3,272,602 |
TOTAL SWITZERLAND | | 27,362,848 |
Taiwan - 1.2% |
Addcn Technology Co. Ltd. | 4,000 | | 38,469 |
Delta Electronics, Inc. | 95,000 | | 569,035 |
Giant Manufacturing Co. Ltd. | 41,000 | | 331,458 |
Merida Industry Co. Ltd. | 49,500 | | 341,395 |
Taiwan Semiconductor Manufacturing Co. Ltd. | 661,035 | | 2,861,034 |
TOTAL TAIWAN | | 4,141,391 |
Thailand - 0.5% |
Airports of Thailand PCL (For. Reg.) | 57,700 | | 428,613 |
Bangkok Dusit Medical Services PCL (For. Reg.) | 585,700 | | 332,499 |
Bumrungrad Hospital PCL (For. Reg.) | 86,300 | | 352,344 |
Kasikornbank PCL (For. Reg.) | 85,800 | | 621,429 |
TOTAL THAILAND | | 1,734,885 |
Turkey - 0.6% |
Albaraka Turk Katilim Bankasi A/S | 81,907 | | 57,856 |
Coca-Cola Icecek Sanayi A/S | 53,889 | | 1,229,241 |
TAV Havalimanlari Holding A/S | 51,000 | | 427,935 |
Tofas Turk Otomobil Fabrikasi A/S | 8,618 | | 54,089 |
Tupras Turkiye Petrol Rafinelleri A/S | 19,000 | | 412,458 |
TOTAL TURKEY | | 2,181,579 |
United Arab Emirates - 0.2% |
DP World Ltd. | 16,669 | | 319,378 |
First Gulf Bank PJSC | 79,996 | | 395,297 |
TOTAL UNITED ARAB EMIRATES | | 714,675 |
United Kingdom - 15.9% |
Advanced Computer Software Group PLC | 22,800 | | 39,391 |
Common Stocks - continued |
| Shares | | Value |
United Kingdom - continued |
Al Noor Hospitals Group PLC | 21,900 | | $ 356,991 |
AstraZeneca PLC (United Kingdom) | 33,328 | | 2,434,557 |
Babcock International Group PLC | 46,423 | | 813,178 |
BAE Systems PLC | 295,421 | | 2,167,747 |
Bank of Georgia Holdings PLC | 7,100 | | 290,761 |
Barclays PLC | 447,074 | | 1,719,410 |
Bellway PLC | 6,228 | | 174,252 |
Berendsen PLC | 45,355 | | 732,799 |
BG Group PLC | 134,327 | | 2,238,698 |
BHP Billiton PLC | 109,137 | | 2,819,730 |
British American Tobacco PLC (United Kingdom) | 5,000 | | 283,388 |
Britvic PLC | 11,317 | | 123,196 |
BT Group PLC | 52,775 | | 311,126 |
Bunzl PLC | 44,657 | | 1,210,871 |
Burberry Group PLC | 14,300 | | 350,227 |
Compass Group PLC | 81,207 | | 1,306,863 |
Dechra Pharmaceuticals PLC | 9,000 | | 109,132 |
Derwent London PLC | 2,000 | | 95,054 |
Diageo PLC | 10,651 | | 314,123 |
Elementis PLC | 34,808 | | 146,946 |
GlaxoSmithKline PLC | 87,497 | | 1,978,654 |
Great Portland Estates PLC | 13,372 | | 146,851 |
H&T Group PLC | 10,000 | | 25,435 |
Hilton Food Group PLC | 5,400 | | 32,394 |
HSBC Holdings PLC sponsored ADR | 68,466 | | 3,493,135 |
Imperial Tobacco Group PLC | 43,447 | | 1,884,204 |
Informa PLC | 181,654 | | 1,397,747 |
InterContinental Hotel Group PLC ADR | 60,596 | | 2,303,254 |
Intertek Group PLC | 7,000 | | 304,807 |
ITE Group PLC | 20,600 | | 56,104 |
ITV PLC | 361,119 | | 1,172,695 |
Johnson Matthey PLC | 27,877 | | 1,326,250 |
Liberty Global PLC Class A (a) | 16,700 | | 759,349 |
Meggitt PLC | 14,039 | | 101,309 |
National Grid PLC | 152,291 | | 2,259,993 |
Next PLC | 5,900 | | 608,294 |
Persimmon PLC | 3,737 | | 87,459 |
Prudential PLC | 228,088 | | 5,281,612 |
Reckitt Benckiser Group PLC | 34,751 | | 2,918,537 |
Rolls-Royce Group PLC | 78,652 | | 1,060,659 |
Rotork PLC | 10,003 | | 408,846 |
Royal Dutch Shell PLC Class A sponsored ADR | 36,429 | | 2,615,238 |
Common Stocks - continued |
| Shares | | Value |
United Kingdom - continued |
SABMiller PLC | 50,863 | | $ 2,868,135 |
Shaftesbury PLC | 56,637 | | 648,712 |
Spectris PLC | 5,970 | | 172,095 |
Spirax-Sarco Engineering PLC | 5,107 | | 232,836 |
Standard Chartered PLC (United Kingdom) | 23,349 | | 350,954 |
Ted Baker PLC | 2,775 | | 86,342 |
Ultra Electronics Holdings PLC | 4,501 | | 125,644 |
Unite Group PLC | 84,677 | | 578,405 |
Vodafone Group PLC sponsored ADR | 75,826 | | 2,518,940 |
TOTAL UNITED KINGDOM | | 55,843,329 |
United States of America - 8.1% |
A.O. Smith Corp. | 6,400 | | 341,440 |
AbbVie, Inc. | 8,429 | | 534,904 |
Altria Group, Inc. | 16,000 | | 773,440 |
ANSYS, Inc. (a) | 400 | | 31,424 |
Autoliv, Inc. | 17,154 | | 1,573,708 |
Berkshire Hathaway, Inc. Class B (a) | 6,816 | | 955,331 |
BorgWarner, Inc. | 30,394 | | 1,733,066 |
Broadridge Financial Solutions, Inc. | 1,140 | | 50,080 |
Constellation Brands, Inc. Class A (sub. vtg.) (a) | 9,100 | | 833,014 |
Cummins, Inc. | 7,091 | | 1,036,562 |
Dril-Quip, Inc. (a) | 870 | | 78,257 |
Evercore Partners, Inc. Class A | 1,160 | | 60,053 |
FMC Technologies, Inc. (a) | 11,403 | | 639,024 |
Google, Inc.: | | | |
Class A (a) | 2,890 | | 1,641,144 |
Class C (a) | 1,890 | | 1,056,661 |
International Flavors & Fragrances, Inc. | 3,300 | | 327,195 |
Kansas City Southern | 2,600 | | 319,254 |
Kennedy-Wilson Holdings, Inc. | 5,283 | | 143,116 |
Las Vegas Sands Corp. | 5,600 | | 348,656 |
Martin Marietta Materials, Inc. | 11,080 | | 1,295,474 |
MasterCard, Inc. Class A | 27,890 | | 2,335,788 |
Mead Johnson Nutrition Co. Class A | 5,700 | | 566,067 |
Mohawk Industries, Inc. (a) | 8,535 | | 1,212,311 |
National Oilwell Varco, Inc. | 4,046 | | 293,901 |
Oceaneering International, Inc. | 9,038 | | 635,100 |
Philip Morris International, Inc. | 13,200 | | 1,174,932 |
PPG Industries, Inc. | 1,800 | | 366,642 |
Praxair, Inc. | 2,200 | | 277,178 |
PriceSmart, Inc. | 7,385 | | 657,487 |
Common Stocks - continued |
| Shares | | Value |
United States of America - continued |
ResMed, Inc. (d) | 11,020 | | $ 575,464 |
ResMed, Inc. CDI | 129,128 | | 679,013 |
Solera Holdings, Inc. | 18,894 | | 981,543 |
SS&C Technologies Holdings, Inc. (a) | 21,354 | | 1,031,825 |
T-Mobile U.S., Inc. (a) | 15,300 | | 446,607 |
Union Pacific Corp. | 7,000 | | 815,150 |
Visa, Inc. Class A | 9,831 | | 2,373,498 |
W.R. Grace & Co. (a) | 3,500 | | 331,100 |
TOTAL UNITED STATES OF AMERICA | | 28,525,409 |
TOTAL COMMON STOCKS (Cost $290,918,842) |
340,176,388
|
Nonconvertible Preferred Stocks - 1.6% |
| | | |
Brazil - 1.0% |
Ambev SA sponsored ADR | 136,200 | | 909,816 |
Banco Bradesco SA (PN) sponsored ADR | 71,100 | | 1,065,078 |
Companhia Brasileira de Distribuicao Grupo Pao de Acucar sponsored ADR | 10,200 | | 426,360 |
Itau Unibanco Holding SA sponsored ADR | 75,000 | | 1,107,000 |
TOTAL BRAZIL | | 3,508,254 |
Colombia - 0.1% |
Grupo Aval Acciones y Valores SA | 525,754 | | 356,465 |
Germany - 0.5% |
Henkel AG & Co. KGaA | 3,000 | | 296,169 |
Sartorius AG (non-vtg.) | 1,050 | | 114,475 |
Volkswagen AG | 6,090 | | 1,297,768 |
TOTAL GERMANY | | 1,708,412 |
United Kingdom - 0.0% |
Rolls-Royce Group PLC | 7,078,680 | | 11,324 |
TOTAL NONCONVERTIBLE PREFERRED STOCKS (Cost $5,704,650) |
5,584,455
|
Money Market Funds - 0.9% |
| Shares | | Value |
Fidelity Cash Central Fund, 0.11% (b) | 2,704,556 | | $ 2,704,556 |
Fidelity Securities Lending Cash Central Fund, 0.11% (b)(c) | 452,625 | | 452,625 |
TOTAL MONEY MARKET FUNDS (Cost $3,157,181) |
3,157,181
|
TOTAL INVESTMENT PORTFOLIO - 99.6% (Cost $299,780,673) | 348,918,024 |
NET OTHER ASSETS (LIABILITIES) - 0.4% | | 1,402,864 |
NET ASSETS - 100% | $ 350,320,888 |
Legend |
(a) Non-income producing |
(b) Affiliated fund that is generally available only to investment companies and other accounts managed by Fidelity Investments. The rate quoted is the annualized seven-day yield of the fund at period end. A complete unaudited listing of the fund's holdings as of its most recent quarter end is available upon request. In addition, each Fidelity Central Fund's financial statements, which are not covered by the Fund's Report of Independent Registered Public Accounting Firm, are available on the SEC's website or upon request. |
(c) Investment made with cash collateral received from securities on loan. |
(d) Security or a portion of the security is on loan at period end. |
(e) Security exempt from registration under Rule 144A of the Securities Act of 1933. These securities may be resold in transactions exempt from registration, normally to qualified institutional buyers. At the end of the period, the value of these securities amounted to $336,936 or 0.1% of net assets. |
Affiliated Central Funds |
Information regarding fiscal year to date income earned by the Fund from investments in Fidelity Central Funds is as follows: |
Fund | Income earned |
Fidelity Cash Central Fund | $ 5,978 |
Fidelity Securities Lending Cash Central Fund | 110,200 |
Total | $ 116,178 |
Other Information |
Categorizations in the Schedule of Investments are based on country or territory of incorporation. |
The following is a summary of the inputs used, as of October 31, 2014, involving the Fund's assets and liabilities carried at fair value. The inputs or methodology used for valuing securities may not be an indication of the risk associated with investing in those securities. For more information on valuation inputs, and their aggregation into the levels used in the tables below, please refer to the Investment Valuation section in the accompanying Notes to Financial Statements. |
Valuation Inputs at Reporting Date: |
Description | Total | Level 1 | Level 2 | Level 3 |
Investments in Securities: | | | | |
Equities: | | | | |
Consumer Discretionary | $ 51,485,253 | $ 31,400,031 | $ 20,085,222 | $ - |
Consumer Staples | 37,901,378 | 19,087,199 | 18,814,179 | - |
Energy | 14,094,793 | 6,647,362 | 7,447,431 | - |
Financials | 73,719,494 | 33,537,412 | 40,182,082 | - |
Health Care | 47,021,999 | 15,198,757 | 31,823,242 | - |
Industrials | 43,672,266 | 30,186,330 | 13,485,936 | - |
Information Technology | 36,382,263 | 21,380,327 | 15,001,936 | - |
Materials | 21,426,223 | 15,220,061 | 6,206,162 | - |
Telecommunication Services | 14,368,474 | 6,856,779 | 7,511,695 | - |
Utilities | 5,688,700 | 2,678,780 | 3,009,920 | - |
Money Market Funds | 3,157,181 | 3,157,181 | - | - |
Total Investments in Securities: | $ 348,918,024 | $ 185,350,219 | $ 163,567,805 | $ - |
The following is a summary of transfers between Level 1 and Level 2 for the period ended October 31, 2014. Transfers are assumed to have occurred at the beginning of the period, and are primarily attributable to the valuation techniques used for foreign equity securities, as discussed in the accompanying Notes to Financial Statements: |
Transfers | Total |
Level 1 to Level 2 | $ 31,040,538 |
Level 2 to Level 1 | $ 0 |
See accompanying notes which are an integral part of the financial statements.
Annual Report
Statement of Assets and Liabilities
| October 31, 2014 |
| | |
Assets | | |
Investment in securities, at value (including securities loaned of $443,870) - See accompanying schedule: Unaffiliated issuers (cost $296,623,492) | $ 345,760,843 | |
Fidelity Central Funds (cost $3,157,181) | 3,157,181 | |
Total Investments (cost $299,780,673) | | $ 348,918,024 |
Foreign currency held at value (cost $531,237) | | 530,341 |
Receivable for investments sold | | 3,130,638 |
Receivable for fund shares sold | | 34,825 |
Dividends receivable | | 809,645 |
Distributions receivable from Fidelity Central Funds | | 794 |
Prepaid expenses | | 1,062 |
Receivable from investment adviser for expense reductions | | 886 |
Other receivables | | 1,769 |
Total assets | | 353,427,984 |
| | |
Liabilities | | |
Payable to custodian bank | $ 268,222 | |
Payable for investments purchased | 1,568,693 | |
Payable for fund shares redeemed | 167,932 | |
Accrued management fee | 237,167 | |
Distribution and service plan fees payable | 9,184 | |
Other affiliated payables | 54,537 | |
Other payables and accrued expenses | 348,736 | |
Collateral on securities loaned, at value | 452,625 | |
Total liabilities | | 3,107,096 |
| | |
Net Assets | | $ 350,320,888 |
Net Assets consist of: | | |
Paid in capital | | $ 318,656,094 |
Undistributed net investment income | | 5,238,848 |
Accumulated undistributed net realized gain (loss) on investments and foreign currency transactions | | (22,463,589) |
Net unrealized appreciation (depreciation) on investments and assets and liabilities in foreign currencies | | 48,889,535 |
Net Assets | | $ 350,320,888 |
See accompanying notes which are an integral part of the financial statements.
Annual Report
Financial Statements - continued
Statement of Assets and Liabilities - continued
| October 31, 2014 |
| | |
Calculation of Maximum Offering Price Class A:
Net Asset Value and redemption price per share ($9,163,958 ÷ 1,145,034 shares) | | $ 8.00 |
| | |
Maximum offering price per share (100/94.25 of $8.00) | | $ 8.49 |
Class T:
Net Asset Value and redemption price per share ($10,282,207 ÷ 1,278,916 shares) | | $ 8.04 |
| | |
Maximum offering price per share (100/96.50 of $8.04) | | $ 8.33 |
Class B:
Net Asset Value and offering price per share ($167,965 ÷ 20,859 shares)A | | $ 8.05 |
| | |
Class C:
Net Asset Value and offering price per share ($4,028,383 ÷ 503,849 shares)A | | $ 8.00 |
| | |
Total International Equity:
Net Asset Value, offering price and redemption price per share ($324,438,192 ÷ 40,382,479 shares) | | $ 8.03 |
| | |
Institutional Class:
Net Asset Value, offering price and redemption price per share ($2,240,183 ÷ 280,204 shares) | | $ 7.99 |
A Redemption price per share is equal to net asset value less any applicable contingent deferred sales charge.
See accompanying notes which are an integral part of the financial statements.
Annual Report
Statement of Operations
| Year ended October 31, 2014 |
| | |
Investment Income | | |
Dividends | | $ 11,693,447 |
Income from Fidelity Central Funds | | 116,178 |
Income before foreign taxes withheld | | 11,809,625 |
Less foreign taxes withheld | | (748,463) |
Total income | | 11,061,162 |
| | |
Expenses | | |
Management fee
Basic fee | $ 2,527,278 | |
Performance adjustment | 193,246 | |
Transfer agent fees | 465,968 | |
Distribution and service plan fees | 109,662 | |
Accounting and security lending fees | 187,763 | |
Custodian fees and expenses | 227,812 | |
Independent trustees' compensation | 1,481 | |
Registration fees | 71,601 | |
Audit | 96,390 | |
Legal | 1,290 | |
Interest | 723 | |
Miscellaneous | 6,436 | |
Total expenses before reductions | 3,889,650 | |
Expense reductions | (2,484) | 3,887,166 |
Net investment income (loss) | | 7,173,996 |
Realized and Unrealized Gain (Loss) Net realized gain (loss) on: | | |
Investment securities: | | |
Unaffiliated issuers (net of foreign taxes of $589,388) | 5,722,532 | |
Foreign currency transactions | (82,685) | |
Total net realized gain (loss) | | 5,639,847 |
Change in net unrealized appreciation (depreciation) on: Investment securities (net of increase in deferred foreign taxes of $98,574) | (11,108,073) | |
Assets and liabilities in foreign currencies | (29,837) | |
Total change in net unrealized appreciation (depreciation) | | (11,137,910) |
Net gain (loss) | | (5,498,063) |
Net increase (decrease) in net assets resulting from operations | | $ 1,675,933 |
See accompanying notes which are an integral part of the financial statements.
Annual Report
Financial Statements - continued
Statement of Changes in Net Assets
| Year ended
October 31,
2014 | Year ended
October 31,
2013 |
Increase (Decrease) in Net Assets | | |
Operations | | |
Net investment income (loss) | $ 7,173,996 | $ 5,165,980 |
Net realized gain (loss) | 5,639,847 | 8,529,722 |
Change in net unrealized appreciation (depreciation) | (11,137,910) | 44,726,463 |
Net increase (decrease) in net assets resulting
from operations | 1,675,933 | 58,422,165 |
Distributions to shareholders from net investment income | (5,090,375) | (5,845,552) |
Distributions to shareholders from net realized gain | (7,679,276) | (9,769,201) |
Total distributions | (12,769,651) | (15,614,753) |
Share transactions - net increase (decrease) | 13,925,925 | 10,109,727 |
Redemption fees | 3,247 | 2,498 |
Total increase (decrease) in net assets | 2,835,454 | 52,919,637 |
| | |
Net Assets | | |
Beginning of period | 347,485,434 | 294,565,797 |
End of period (including undistributed net investment income of $5,238,848 and undistributed net investment income of $4,647,078, respectively) | $ 350,320,888 | $ 347,485,434 |
See accompanying notes which are an integral part of the financial statements.
Annual Report
Financial Highlights - Class A
Years ended October 31, | 2014 | 2013 | 2012 | 2011 | 2010 |
Selected Per-Share Data | | | | | |
Net asset value, beginning of period | $ 8.27 | $ 7.31 | $ 6.67 | $ 7.36 | $ 6.40 |
Income from Investment Operations | | | | | |
Net investment income (loss) C | .13 | .09 | .13 | .11 | .08 |
Net realized and unrealized gain (loss) | (.12) | 1.24 | .59 | (.69) | .95 |
Total from investment operations | .01 | 1.33 | .72 | (.58) | 1.03 |
Distributions from net investment income | (.10) | (.13) | (.08) | (.09) | (.04) |
Distributions from net realized gain | (.18) | (.25) | - | (.02) | (.03) |
Total distributions | (.28) | (.37) H | (.08) | (.11) | (.07) |
Redemption fees added to paid in capital C,G | - | - | - | - | - |
Net asset value, end of period | $ 8.00 | $ 8.27 | $ 7.31 | $ 6.67 | $ 7.36 |
Total ReturnA, B | .19% | 19.00% | 10.88% | (8.03)% | 16.17% |
Ratios to Average Net Assets D, F | | | | | |
Expenses before reductions | 1.44% | 1.50% | 1.57% | 1.73% | 2.02% |
Expenses net of fee waivers, if any | 1.44% | 1.45% | 1.45% | 1.45% | 1.50% |
Expenses net of all reductions | 1.44% | 1.43% | 1.42% | 1.42% | 1.47% |
Net investment income (loss) | 1.63% | 1.21% | 1.88% | 1.44% | 1.15% |
Supplemental Data | | | | | |
Net assets, end of period (000 omitted) | $ 9,164 | $ 9,034 | $ 5,767 | $ 4,307 | $ 5,029 |
Portfolio turnover rateE | 85% | 89% | 110% | 75% | 67% |
A Total returns would have been lower if certain expenses had not been reduced during the applicable periods shown.
B Total returns do not include the effect of the sales charges.
C Calculated based on average shares outstanding during the period.
D Fees and expenses of any underlying Fidelity Central Funds are not included in the Fund's expense ratio. The Fund indirectly bears its proportionate share of the expenses of any underlying Fidelity Central Funds.
E Amount does not include the portfolio activity of any underlying Fidelity Central Funds.
F Expense ratios reflect operating expenses of the class. Expenses before reductions do not reflect amounts reimbursed by the investment adviser or reductions from brokerage service arrangements or reductions from other expense offset arrangements and do not represent the amount paid by the class during periods when reimbursements or reductions occur. Expenses net of fee waivers reflect expenses after reimbursement by the investment adviser but prior to reductions from brokerage service arrangements or other expense offset arrangements. Expenses net of all reductions represent the net expenses paid by the class.
G Amount represents less than $.01 per share.
H Total distributions of $.37 per share is comprised of distributions from net investment income of $.126 and distributions from net realized gain of $.245 per share.
See accompanying notes which are an integral part of the financial statements.
Annual Report
Financial Highlights - Class T
Years ended October 31, | 2014 | 2013 | 2012 | 2011 | 2010 |
Selected Per-Share Data | | | | | |
Net asset value, beginning of period | $ 8.32 | $ 7.37 | $ 6.73 | $ 7.41 | $ 6.40 |
Income from Investment Operations | | | | | |
Net investment income (loss) C | .11 | .07 | .11 | .09 | .06 |
Net realized and unrealized gain (loss) | (.12) | 1.25 | .59 | (.68) | .95 |
Total from investment operations | (.01) | 1.32 | .70 | (.59) | 1.01 |
Distributions from net investment income | (.09) | (.13) | (.06) | (.07) | - |
Distributions from net realized gain | (.18) | (.25) | - | (.02) | - |
Total distributions | (.27) | (.37)H | (.06) | (.09) | - |
Redemption fees added to paid in capital C,G | - | - | - | - | - |
Net asset value, end of period | $ 8.04 | $ 8.32 | $ 7.37 | $ 6.73 | $ 7.41 |
Total ReturnA, B | (.06)% | 18.73% | 10.52% | (8.08)% | 15.78% |
Ratios to Average Net Assets D, F | | | | | |
Expenses before reductions | 1.68% | 1.75% | 1.84% | 2.02% | 2.31% |
Expenses net of fee waivers, if any | 1.68% | 1.70% | 1.70% | 1.70% | 1.75% |
Expenses net of all reductions | 1.68% | 1.67% | 1.67% | 1.67% | 1.72% |
Net investment income (loss) | 1.38% | .96% | 1.63% | 1.19% | .90% |
Supplemental Data | | | | | |
Net assets, end of period (000 omitted) | $ 10,282 | $ 7,909 | $ 2,348 | $ 997 | $ 1,004 |
Portfolio turnover rateE | 85% | 89% | 110% | 75% | 67% |
A Total returns would have been lower if certain expenses had not been reduced during the applicable periods shown.
B Total returns do not include the effect of the sales charges.
C Calculated based on average shares outstanding during the period.
D Fees and expenses of any underlying Fidelity Central Funds are not included in the Fund's expense ratio. The Fund indirectly bears its proportionate share of the expenses of any underlying Fidelity Central Funds.
E Amount does not include the portfolio activity of any underlying Fidelity Central Funds.
F Expense ratios reflect operating expenses of the class. Expenses before reductions do not reflect amounts reimbursed by the investment adviser or reductions from brokerage service arrangements or reductions from other expense offset arrangements and do not represent the amount paid by the class during periods when reimbursements or reductions occur. Expenses net of fee waivers reflect expenses after reimbursement by the investment adviser but prior to reductions from brokerage service arrangements or other expense offset arrangements. Expenses net of all reductions represent the net expenses paid by the class.
G Amount represents less than $.01 per share.
H Total distributions of $.37 per share is comprised of distributions from net investment income of $.128 and distributions from net realized gain of $.245 per share.
See accompanying notes which are an integral part of the financial statements.
Annual Report
Financial Highlights - Class B
Years ended October 31, | 2014 | 2013 | 2012 | 2011 | 2010 |
Selected Per-Share Data | | | | | |
Net asset value, beginning of period | $ 8.31 | $ 7.33 | $ 6.68 | $ 7.37 | $ 6.39 |
Income from Investment Operations | | | | | |
Net investment income (loss) C | .07 | .04 | .08 | .05 | .03 |
Net realized and unrealized gain (loss) | (.12) | 1.24 | .59 | (.68) | .95 |
Total from investment operations | (.05) | 1.28 | .67 | (.63) | .98 |
Distributions from net investment income | (.03) | (.05) | (.02) | (.04) | - |
Distributions from net realized gain | (.18) | (.25) | - | (.02) | - |
Total distributions | (.21) | (.30) | (.02) | (.06) | - |
Redemption fees added to paid in capital C,G | - | - | - | - | - |
Net asset value, end of period | $ 8.05 | $ 8.31 | $ 7.33 | $ 6.68 | $ 7.37 |
Total ReturnA, B | (.56)% | 18.05% | 10.05% | (8.66)% | 15.34% |
Ratios to Average Net Assets D, F | | | | | |
Expenses before reductions | 2.22% | 2.26% | 2.34% | 2.51% | 2.81% |
Expenses net of fee waivers, if any | 2.20% | 2.20% | 2.20% | 2.20% | 2.25% |
Expenses net of all reductions | 2.20% | 2.18% | 2.17% | 2.17% | 2.22% |
Net investment income (loss) | .87% | .46% | 1.13% | .69% | .40% |
Supplemental Data | | | | | |
Net assets, end of period (000 omitted) | $ 168 | $ 192 | $ 220 | $ 254 | $ 327 |
Portfolio turnover rateE | 85% | 89% | 110% | 75% | 67% |
A Total returns would have been lower if certain expenses had not been reduced during the applicable periods shown.
B Total returns do not include the effect of the contingent deferred sales charge.
C Calculated based on average shares outstanding during the period.
D Fees and expenses of any underlying Fidelity Central Funds are not included in the Fund's expense ratio. The Fund indirectly bears its proportionate share of the expenses of any underlying Fidelity Central Funds.
E Amount does not include the portfolio activity of any underlying Fidelity Central Funds.
F Expense ratios reflect operating expenses of the class. Expenses before reductions do not reflect amounts reimbursed by the investment adviser or reductions from brokerage service arrangements or reductions from other expense offset arrangements and do not represent the amount paid by the class during periods when reimbursements or reductions occur. Expenses net of fee waivers reflect expenses after reimbursement by the investment adviser but prior to reductions from brokerage service arrangements or other expense offset arrangements. Expenses net of all reductions represent the net expenses paid by the class.
G Amount represents less than $.01 per share.
See accompanying notes which are an integral part of the financial statements.
Annual Report
Financial Highlights - Class C
Years ended October 31, | 2014 | 2013 | 2012 | 2011 | 2010 |
Selected Per-Share Data | | | | | |
Net asset value, beginning of period | $ 8.28 | $ 7.31 | $ 6.67 | $ 7.36 | $ 6.39 |
Income from Investment Operations | | | | | |
Net investment income (loss) C | .07 | .04 | .08 | .05 | .03 |
Net realized and unrealized gain (loss) | (.12) | 1.25 | .58 | (.69) | .94 |
Total from investment operations | (.05) | 1.29 | .66 | (.64) | .97 |
Distributions from net investment income | (.05) | (.08) | (.02) | (.03) | - |
Distributions from net realized gain | (.18) | (.25) | - | (.02) | - |
Total distributions | (.23) | (.32) H | (.02) | (.05) | - |
Redemption fees added to paid in capital C,G | - | - | - | - | - |
Net asset value, end of period | $ 8.00 | $ 8.28 | $ 7.31 | $ 6.67 | $ 7.36 |
Total ReturnA, B | (.57)% | 18.30% | 9.98% | (8.72)% | 15.18% |
Ratios to Average Net Assets D, F | | | | | |
Expenses before reductions | 2.22% | 2.26% | 2.31% | 2.51% | 2.80% |
Expenses net of fee waivers, if any | 2.20% | 2.20% | 2.20% | 2.20% | 2.25% |
Expenses net of all reductions | 2.20% | 2.18% | 2.17% | 2.17% | 2.22% |
Net investment income (loss) | .87% | .46% | 1.13% | .69% | .40% |
Supplemental Data | | | | | |
Net assets, end of period (000 omitted) | $ 4,028 | $ 3,584 | $ 2,737 | $ 1,396 | $ 1,423 |
Portfolio turnover rateE | 85% | 89% | 110% | 75% | 67% |
A Total returns would have been lower if certain expenses had not been reduced during the applicable periods shown.
B Total returns do not include the effect of the contingent deferred sales charge.
C Calculated based on average shares outstanding during the period.
D Fees and expenses of any underlying Fidelity Central Funds are not included in the Fund's expense ratio. The Fund indirectly bears its proportionate share of the expenses of any underlying Fidelity Central Funds.
E Amount does not include the portfolio activity of any underlying Fidelity Central Funds.
F Expense ratios reflect operating expenses of the class. Expenses before reductions do not reflect amounts reimbursed by the investment adviser or reductions from brokerage service arrangements or reductions from other expense offset arrangements and do not represent the amount paid by the class during periods when reimbursements or reductions occur. Expenses net of fee waivers reflect expenses after reimbursement by the investment adviser but prior to reductions from brokerage service arrangements or other expense offset arrangements. Expenses net of all reductions represent the net expenses paid by the class.
G Amount represents less than $.01 per share.
H Total distributions of $.32 per share is comprised of distributions from net investment income of $.075 and distributions from net realized gain of $.245 per share.
See accompanying notes which are an integral part of the financial statements.
Annual Report
Financial Highlights - Total International Equity
Years ended October 31, | 2014 | 2013 | 2012 | 2011 | 2010 |
Selected Per-Share Data | | | | | |
Net asset value, beginning of period | $ 8.29 | $ 7.32 | $ 6.69 | $ 7.37 | $ 6.41 |
Income from Investment Operations | | | | | |
Net investment income (loss) B | .16 | .12 | .15 | .12 | .09 |
Net realized and unrealized gain (loss) | (.12) | 1.24 | .58 | (.68) | .96 |
Total from investment operations | .04 | 1.36 | .73 | (.56) | 1.05 |
Distributions from net investment income | (.12) | (.15) | (.10) | (.10) | (.06) |
Distributions from net realized gain | (.18) | (.25) | - | (.02) | (.03) |
Total distributions | (.30) | (.39) G | (.10) | (.12) | (.09) |
Redemption fees added to paid in capital B, F | - | - | - | - | - |
Net asset value, end of period | $ 8.03 | $ 8.29 | $ 7.32 | $ 6.69 | $ 7.37 |
Total ReturnA | .55% | 19.48% | 11.03% | (7.70)% | 16.45% |
Ratios to Average Net Assets C, E | | | | | |
Expenses before reductions | 1.04% | 1.09% | 1.16% | 1.42% | 1.79% |
Expenses net of fee waivers, if any | 1.04% | 1.09% | 1.16% | 1.20% | 1.25% |
Expenses net of all reductions | 1.04% | 1.07% | 1.13% | 1.17% | 1.22% |
Net investment income (loss) | 2.03% | 1.57% | 2.16% | 1.69% | 1.40% |
Supplemental Data | | | | | |
Net assets, end of period (000 omitted) | $ 324,438 | $ 324,395 | $ 281,979 | $ 131,338 | $ 60,826 |
Portfolio turnover rateD | 85% | 89% | 110% | 75% | 67% |
A Total returns would have been lower if certain expenses had not been reduced during the applicable periods shown.
B Calculated based on average shares outstanding during the period.
C Fees and expenses of any underlying Fidelity Central Funds are not included in the Fund's expense ratio. The Fund indirectly bears its proportionate share of the expenses of any underlying Fidelity Central Funds.
D Amount does not include the portfolio activity of any underlying Fidelity Central Funds.
E Expense ratios reflect operating expenses of the class. Expenses before reductions do not reflect amounts reimbursed by the investment adviser or reductions from brokerage service arrangements or reductions from other expense offset arrangements and do not represent the amount paid by the class during periods when reimbursements or reductions occur. Expenses net of fee waivers reflect expenses after reimbursement by the investment adviser but prior to reductions from brokerage service arrangements or other expense offset arrangements. Expenses net of all reductions represent the net expenses paid by the class.
F Amount represents less than $.01 per share.
G Total distributions of $.39 per share is comprised of distributions from net investment income of $.148 and distributions from net realized gain of $.245 per share.
See accompanying notes which are an integral part of the financial statements.
Annual Report
Financial Highlights - Institutional Class
Years ended October 31, | 2014 | 2013 | 2012 | 2011 | 2010 |
Selected Per-Share Data | | | | | |
Net asset value, beginning of period | $ 8.26 | $ 7.30 | $ 6.67 | $ 7.35 | $ 6.41 |
Income from Investment Operations | | | | | |
Net investment income (loss) B | .15 | .11 | .14 | .12 | .10 |
Net realized and unrealized gain (loss) | (.12) | 1.24 | .59 | (.68) | .95 |
Total from investment operations | .03 | 1.35 | .73 | (.56) | 1.05 |
Distributions from net investment income | (.12) | (.15) | (.10) | (.10) | (.08) |
Distributions from net realized gain | (.18) | (.25) | - | (.02) | (.03) |
Total distributions | (.30) | (.39)G | (.10) | (.12) | (.11) |
Redemption fees added to paid in capital B, F | - | - | - | - | - |
Net asset value, end of period | $ 7.99 | $ 8.26 | $ 7.30 | $ 6.67 | $ 7.35 |
Total ReturnA | .37% | 19.40% | 11.06% | (7.72)% | 16.48% |
Ratios to Average Net Assets C, E | | | | | |
Expenses before reductions | 1.15% | 1.21% | 1.27% | 1.48% | 1.82% |
Expenses net of fee waivers, if any | 1.15% | 1.20% | 1.20% | 1.20% | 1.25% |
Expenses net of all reductions | 1.15% | 1.18% | 1.17% | 1.17% | 1.23% |
Net investment income (loss) | 1.91% | 1.46% | 2.13% | 1.69% | 1.40% |
Supplemental Data | | | | | |
Net assets, end of period (000 omitted) | $ 2,240 | $ 2,372 | $ 1,514 | $ 197 | $ 28 |
Portfolio turnover rateD | 85% | 89% | 110% | 75% | 67% |
A Total returns would have been lower if certain expenses had not been reduced during the applicable periods shown.
B Calculated based on average shares outstanding during the period.
C Fees and expenses of any underlying Fidelity Central Funds are not included in the Fund's expense ratio. The Fund indirectly bears its proportionate share of the expenses of any underlying Fidelity Central Funds.
D Amount does not include the portfolio activity of any underlying Fidelity Central Funds.
E Expense ratios reflect operating expenses of the class. Expenses before reductions do not reflect amounts reimbursed by the investment adviser or reductions from brokerage service arrangements or reductions from other expense offset arrangements and do not represent the amount paid by the class during periods when reimbursements or reductions occur. Expenses net of fee waivers reflect expenses after reimbursement by the investment adviser but prior to reductions from brokerage service arrangements or other expense offset arrangements. Expenses net of all reductions represent the net expenses paid by the class.
F Amount represents less than $.01 per share.
G Total distributions of $.39 per share is comprised of distributions from net investment income of $.148 and distributions from net realized gain of $.245 per share.
See accompanying notes which are an integral part of the financial statements.
Annual Report
Notes to Financial Statements
For the period ended October 31, 2014
1. Organization.
Fidelity Total International Equity Fund (the Fund) is a fund of Fidelity Investment Trust (the Trust) and is authorized to issue an unlimited number of shares. The Trust is registered under the Investment Company Act of 1940, as amended (the 1940 Act), as an open-end management investment company organized as a Massachusetts business trust. The Fund offers Class A, Class T, Class C, Total International Equity and Institutional Class shares, each of which, along with Class B shares, has equal rights as to assets and voting privileges. Class B shares are closed to new accounts and additional purchases, except for exchanges and reinvestments. Each class has exclusive voting rights with respect to matters that affect that class. Class B shares will automatically convert to Class A shares after a holding period of seven years from the initial date of purchase. The Fund's investments in emerging markets can be subject to social, economic, regulatory, and political uncertainties and can be extremely volatile.
2. Investments in Fidelity Central Funds.
The Fund invests in Fidelity Central Funds, which are open-end investment companies generally available only to other investment companies and accounts managed by the investment adviser and its affiliates. The Fund's Schedule of Investments lists each of the Fidelity Central Funds held as of period end, if any, as an investment of the Fund, but does not include the underlying holdings of each Fidelity Central Fund. As an Investing Fund, the Fund indirectly bears its proportionate share of the expenses of the underlying Fidelity Central Funds.
The Money Market Central Funds seek preservation of capital and current income and are managed by Fidelity Investments Money Management, Inc. (FIMM), an affiliate of the investment adviser. Annualized expenses of the Money Market Central Funds as of their most recent shareholder report date are less than .01%.
A complete unaudited list of holdings for each Fidelity Central Fund is available upon request or at the Securities and Exchange Commission (the SEC) website at www.sec.gov. In addition, the financial statements of the Fidelity Central Funds, which are not covered by the Fund's Report of Independent Registered Public Accounting Firm, are available on the SEC website or upon request.
3. Significant Accounting Policies.
The financial statements have been prepared in conformity with accounting principles generally accepted in the United States of America (GAAP), which require management to make certain estimates and assumptions at the date of the financial statements. Actual results could differ from those estimates. Subsequent events, if any, through the date that the financial statements were issued have been evaluated in the preparation of the financial statements. The following summarizes the significant accounting policies of the Fund:
Annual Report
3. Significant Accounting Policies - continued
Investment Valuation. Investments are valued as of 4:00 p.m. Eastern time on the last calendar day of the period. In accordance with valuation policies and procedures approved by the Board of Trustees (the Board), the Fund attempts to obtain prices from one or more third party pricing vendors or brokers to value its investments. When current market prices, quotations or currency exchange rates are not readily available or reliable, investments will be fair valued in good faith by the Fidelity Management & Research Company (FMR) Fair Value Committee (the Committee), in accordance with procedures adopted by the Board. Factors used in determining fair value vary by investment type and may include market or investment specific events. The frequency with which these procedures are used cannot be predicted and they may be utilized to a significant extent. The Committee oversees the Fund's valuation policies and procedures and is responsible for approving and reporting to the Board all fair value determinations.
The Fund categorizes the inputs to valuation techniques used to value its investments into a disclosure hierarchy consisting of three levels as shown below:
Level 1 - quoted prices in active markets for identical investments
Level 2 - other significant observable inputs (including quoted prices for similar investments, interest rates, prepayment speeds, etc.)
Level 3 - unobservable inputs (including the Fund's own assumptions based on the best information available)
Valuation techniques used to value the Fund's investments by major category are as follows:
Equity securities, including restricted securities, for which market quotations are readily available, are valued at the last reported sale price or official closing price as reported by a third party pricing vendor on the primary market or exchange on which they are traded and are categorized as Level 1 in the hierarchy. In the event there were no sales during the day or closing prices are not available, securities are valued at the last quoted bid price or may be valued using the last available price and are generally categorized as Level 2 in the hierarchy. For foreign equity securities, when market or security specific events arise, comparisons to the valuation of American Depositary Receipts (ADRs), futures contracts, Exchange-Traded Funds (ETFs) and certain indexes as well as quoted prices for similar securities may be used and would be categorized as Level 2 in the hierarchy. Utilizing these techniques may result in transfers between Level 1 and Level 2. For equity securities, including restricted securities, where observable inputs are limited, assumptions about market activity and risk are used and these securities may be categorized as Level 3 in the hierarchy.
Annual Report
Notes to Financial Statements - continued
3. Significant Accounting Policies - continued
Investment Valuation - continued
The U.S. dollar value of foreign currency contracts is determined using currency exchange rates supplied by a pricing service and are categorized as Level 2 in the hierarchy. Investments in open-end mutual funds are valued at their closing net asset value (NAV) each business day and are categorized as Level 1 in the hierarchy.
Changes in valuation techniques may result in transfers in or out of an assigned level within the disclosure hierarchy. The aggregate value of investments by input level, as of October 31, 2014, including information on transfers between Levels 1 and 2 is included at the end of the Fund's Schedule of Investments.
Foreign Currency. The Fund may use foreign currency contracts to facilitate transactions in foreign-denominated securities. Gains and losses from these transactions may arise from changes in the value of the foreign currency or if the counterparties do not perform under the contracts' terms.
Foreign-denominated assets, including investment securities, and liabilities are translated into U.S. dollars at the exchange rates at period end. Purchases and sales of investment securities, income and dividends received and expenses denominated in foreign currencies are translated into U.S. dollars at the exchange rate in effect on the transaction date.
The effects of exchange rate fluctuations on investments are included with the net realized and unrealized gain (loss) on investment securities. Other foreign currency transactions resulting in realized and unrealized gain (loss) are disclosed separately.
Investment Transactions and Income. For financial reporting purposes, the Fund's investment holdings and NAV include trades executed through the end of the last business day of the period. The NAV per share for processing shareholder transactions is calculated as of the close of business of the New York Stock Exchange (NYSE), normally 4:00 p.m. Eastern time and includes trades executed through the end of the prior business day. Gains and losses on securities sold are determined on the basis of identified cost and may include proceeds received from litigation. Dividend income is recorded on the ex-dividend date, except for certain dividends from foreign securities where the ex-dividend date may have passed, which are recorded as soon as the Fund is informed of the ex-dividend date. Non-cash dividends included in dividend income, if any, are recorded at the fair market value of the securities received. Income and capital gain distributions from Fidelity Central Funds, if any, are recorded on the ex-dividend date. Distributions received on securities that represent a return of capital or capital gain are recorded as a reduction of cost of investments and/or as a realized gain. Subsequent to ex-dividend date the Fund determines the components of these distributions, based
Annual Report
3. Significant Accounting Policies - continued
Investment Transactions and Income - continued
upon receipt of tax filings or other correspondence relating to the underlying investment. Interest income is accrued as earned and includes coupon interest and amortization of premium and accretion of discount on debt securities as applicable. Investment income is recorded net of foreign taxes withheld where recovery of such taxes is uncertain.
Class Allocations and Expenses. Investment income, realized and unrealized capital gains and losses, common expenses of the Fund, and certain fund-level expense reductions, if any, are allocated daily on a pro-rata basis to each class based on the relative net assets of each class to the total net assets of the Fund. Each class differs with respect to transfer agent and distribution and service plan fees incurred. Certain expense reductions may also differ by class. For the reporting period, the allocated portion of income and expenses to each class as a percent of its average net assets may vary due to the timing of recording these transactions in relation to fluctuating net assets of the classes. Expenses directly attributable to a fund are charged to that fund. Expenses attributable to more than one fund are allocated among the respective funds on the basis of relative net assets or other appropriate methods. Expense estimates are accrued in the period to which they relate and adjustments are made when actual amounts are known.
Income Tax Information and Distributions to Shareholders. Each year, the Fund intends to qualify as a regulated investment company under Subchapter M of the Internal Revenue Code, including distributing substantially all of its taxable income and realized gains. As a result, no provision for U.S. Federal income taxes is required. As of October 31, 2014, the Fund did not have any unrecognized tax benefits in the financial statements; nor is the Fund aware of any tax positions for which it is reasonably possible that the total amounts of unrecognized tax benefits will significantly change in the next twelve months. The Fund files a U.S. federal tax return, in addition to state and local tax returns as required. The Fund's federal income tax returns are subject to examination by the Internal Revenue Service (IRS) for a period of three fiscal years after they are filed. State and local tax returns may be subject to examination for an additional fiscal year depending on the jurisdiction. Foreign taxes are provided for based on the Fund's understanding of the tax rules and rates that exist in the foreign markets in which it invests. The Fund is subject to a tax imposed on capital gains by certain countries in which it invests. An estimated deferred tax liability for net unrealized appreciation on the applicable securities is included in Other payables and accrued expenses on the Statement of Assets & Liabilities.
Distributions are declared and recorded on the ex-dividend date. Income dividends and capital gain distributions are declared separately for each class. Income and capital gain distributions are determined in accordance with income tax regulations, which may differ from GAAP. In addition, the Fund claimed a portion of the payment made to redeeming shareholders as a distribution for income tax purposes.
Annual Report
Notes to Financial Statements - continued
3. Significant Accounting Policies - continued
Income Tax Information and Distributions to Shareholders - continued
Capital accounts within the financial statements are adjusted for permanent book-tax differences. These adjustments have no impact on net assets or the results of operations. Capital accounts are not adjusted for temporary book-tax differences which will reverse in a subsequent period.
Book-tax differences are primarily due to foreign currency transactions, partnerships, certain foreign taxes, passive foreign investment companies (PFIC), capital loss carryforwards and losses deferred due to wash sales.
The federal tax cost of investment securities and unrealized appreciation (depreciation) as of period end were as follows:
Gross unrealized appreciation | $ 58,023,153 |
Gross unrealized depreciation | (10,503,108) |
Net unrealized appreciation (depreciation) on securities | $ 47,520,045 |
| |
Tax Cost | $ 301,397,979 |
The tax-based components of distributable earnings as of period end were as follows:
Undistributed ordinary income | $ 5,259,862 |
Undistributed long-term capital gain | $ 1,617,012 |
Capital Loss Carryforward | $ (22,463,295) |
Net unrealized appreciation (depreciation) on securities and other investments | $ 47,496,394 |
Capital loss carry forwards are only available to offset future capital gains of the Fund to the extent provided by regulations and may be limited. Under the Regulated Investment Company Modernization Act of 2012 (the Act), the Fund is permitted to carry forward capital losses incurred in taxable years beginning after December 22, 2010 for an unlimited period and such capital losses are required to be used prior to any losses that expire. Capital loss carryforwards were as follows:
Fiscal year of expiration: | |
2017 | $ (13,607,298) |
2019 | (8,855,997) |
Total capital loss carryforward | $ (22,463,295) |
Due to large subscriptions in a prior period, $22,463,295 of capital losses that will be available to offset future capital gains of the Fund will be limited by approximately $4,535,766 per year.
Annual Report
3. Significant Accounting Policies - continued
Income Tax Information and Distributions to Shareholders - continued
The tax character of distributions paid was as follows:
| October 31, 2014 | October 31, 2013 |
Ordinary Income | $ 9,375,496 | $ 15,216,010 |
Long-term Capital Gains | 3,394,155 | 398,743 |
Total | $ 12,769,651 | $ 15,614,753 |
Short-Term Trading (Redemption) Fees. Shares held by investors in the Fund less than 30 days may have been subject to a redemption fee equal to 1.00% of the NAV of shares redeemed. All redemption fees, which reduce the proceeds of the shareholder redemption, are retained by the Fund and accounted for as an addition to paid in capital.
Restricted Securities. The Fund may invest in securities that are subject to legal or contractual restrictions on resale. These securities generally may be resold in transactions exempt from registration or to the public if the securities are registered. Disposal of these securities may involve time-consuming negotiations and expense, and prompt sale at an acceptable price may be difficult. Information regarding restricted securities is included at the end of the Fund's Schedule of Investments.
New Accounting Pronouncement. In June 2014, the Financial Accounting Standards Board issued Accounting Standard Update No. 2014-11, Repurchase-to-Maturity Transactions, Repurchase Financings, and Disclosures. The Update amends the accounting for certain repurchase agreements and expands disclosure requirements for reverse repurchase agreements, securities lending and other similar transactions. The disclosure requirements are effective for annual and interim reporting periods beginning after December 15, 2014. Management is currently evaluating the impact of the Update on the Fund's financial statements and related disclosures.
4. Purchases and Sales of Investments.
Purchases and sales of securities, other than short-term securities, aggregated $309,792,512 and $301,150,794, respectively.
5. Fees and Other Transactions with Affiliates.
Management Fee. Fidelity Management & Research Company (the investment adviser) and its affiliates provide the Fund with investment management related services for which the Fund pays a monthly management fee. The management fee is the sum of an individual fund fee rate that is based on an annual rate of .45% of the Fund's average net assets and an annualized group fee rate that averaged .25% during the period. The group fee rate is based upon the average net assets of all the mutual funds
Annual Report
Notes to Financial Statements - continued
5. Fees and Other Transactions with Affiliates - continued
Management Fee - continued
advised by the investment adviser, including any mutual funds previously advised by the investment adviser that are currently advised by Fidelity SelectCo, LLC, an affiliate of the investment adviser. The group fee rate decreases as assets under management increase and increases as assets under management decrease. In addition, the management fee is subject to a performance adjustment (up to a maximum of ± .20% of the Fund's average net assets over a 36 month performance period). The upward or downward adjustment to the management fee is based on the relative investment performance of Total International Equity as compared to its benchmark index, the MSCI All Country World ex USA Index, over the same 36 month performance period. For the reporting period, the total annual management fee rate, including the performance adjustment, was ..75% of the Fund's average net assets. The performance adjustment included in the management fee rate may be higher or lower than the maximum performance adjustment rate due to the difference between the average net assets for the reporting and performance periods.
Distribution and Service Plan Fees. In accordance with Rule 12b-1 of the 1940 Act, the Fund has adopted separate Distribution and Service Plans for each class of shares. Certain classes pay Fidelity Distributors Corporation (FDC), an affiliate of the investment adviser, separate Distribution and Service Fees, each of which is based on an annual percentage of each class' average net assets. In addition, FDC may pay financial intermediaries for selling shares of the Fund and providing shareholder support services. For the period, the Distribution and Service Fee rates, total fees and amounts retained by FDC were as follows:
| Distribution
Fee | Service
Fee | Total Fees | Retained
by FDC |
Class A | -% | .25% | $ 23,345 | $ 783 |
Class T | .25% | .25% | 45,742 | 42 |
Class B | .75% | .25% | 1,819 | 1,368 |
Class C | .75% | .25% | 38,756 | 4,324 |
| | | $ 109,662 | $ 6,517 |
Sales Load. FDC may receive a front-end sales charge of up to 5.75% for selling Class A shares and 3.50% for selling Class T shares, some of which is paid to financial intermediaries for selling shares of the Fund. Depending on the holding period, FDC may receive contingent deferred sales charges levied on Class A, Class T, Class B and Class C redemptions. The deferred sales charges range from 5.00% to 1.00% for Class B shares, 1.00% for Class C shares, 1.00% for certain purchases of Class A shares and .25% for certain purchases of Class T shares.
Annual Report
5. Fees and Other Transactions with Affiliates - continued
Sales Load - continued
For the period, sales charge amounts retained by FDC were as follows:
| Retained
by FDC |
Class A | $ 2,209 |
Class T | 1,579 |
Class B* | 44 |
Class C* | 255 |
| $ 4,087 |
* When Class B and Class C shares are initially sold, FDC pays commissions from its own resources to financial intermediaries through which the sales are made.
Transfer Agent Fees. Fidelity Investments Institutional Operations Company, Inc., (FIIOC), an affiliate of the investment adviser, is the transfer, dividend disbursing and shareholder servicing agent for each class of the Fund. FIIOC receives account fees and asset-based fees that vary according to the account size and type of account of the shareholders of the respective classes of the Fund. FIIOC pays for typesetting, printing and mailing of shareholder reports, except proxy statements.
For the period, transfer agent fees for each class were as follows:
| Amount | % of
Class-Level Average
Net Assets |
Class A | $ 25,151 | .27 |
Class T | 24,329 | .27 |
Class B | 548 | .30 |
Class C | 11,816 | .30 |
Total International Equity | 398,576 | .12 |
Institutional Class | 5,548 | .24 |
| $ 465,968 | |
Accounting and Security Lending Fees. Fidelity Service Company, Inc. (FSC), an affiliate of the investment adviser, maintains the Fund's accounting records. The accounting fee is based on the level of average net assets for each month. Under a separate contract, FSC administers the security lending program. The security lending fee is based on the number and duration of lending transactions.
Brokerage Commissions. The Fund placed a portion of its portfolio transactions with brokerage firms which are affiliates of the investment adviser. Brokerage commissions are included in net realized gain (loss) and change in net unrealized appreciation (depreciation) in the Statement of Operations. The commissions paid to these affiliated firms were $1,000 for the period.
Annual Report
Notes to Financial Statements - continued
5. Fees and Other Transactions with Affiliates - continued
Interfund Lending Program. Pursuant to an Exemptive Order issued by the SEC, the Fund, along with other registered investment companies having management contracts with FMR or other affiliated entities of FMR, may participate in an interfund lending program. This program provides an alternative credit facility allowing the funds to borrow from, or lend money to, other participating affiliated funds. At period end, there were no interfund loans outstanding. The Fund's activity in this program during the period for which loans were outstanding was as follows:
Borrower or Lender | Average Loan
Balance | Weighted Average Interest Rate | Interest Expense |
Borrower | $ 11,277,714 | .33% | $ 723 |
Other. During the period, the investment adviser reimbursed the Fund for certain losses in the amount of $1,056.
6. Committed Line of Credit.
The Fund participates with other funds managed by the investment adviser or an affiliate in a $4.25 billion credit facility (the "line of credit") to be utilized for temporary or emergency purposes to fund shareholder redemptions or for other short-term liquidity purposes. The Fund has agreed to pay commitment fees on its pro-rata portion of the line of credit, which amounted to $583 and is reflected in Miscellaneous expenses on the Statement of Operations. During the period, the Fund did not borrow on this line of credit.
7. Security Lending.
The Fund lends portfolio securities through a lending agent from time to time in order to earn additional income. For equity securities, a lending agent is used and may loan securities to certain qualified borrowers, including Fidelity Capital Markets (FCM), a broker-dealer affiliated with the Fund. On the settlement date of the loan, the Fund receives collateral (in the form of U.S. Treasury obligations, letters of credit and/or cash) against the loaned securities and maintains collateral in an amount not less than 100% of the market value of the loaned securities during the period of the loan. The market value of the loaned securities is determined at the close of business of the Fund and any additional required collateral is delivered to the Fund on the next business day. If the borrower defaults on its obligation to return the securities loaned because of insolvency or other reasons, the Fund may apply collateral received from the borrower against the obligation. The Fund may experience delays and costs in recovering the securities loaned. Any cash collateral received is invested in the Fidelity Securities Lending Cash
Annual Report
7. Security Lending - continued
Central Fund. The value of loaned securities and cash collateral at period end are disclosed on the Fund's Statement of Assets and Liabilities. At period end, there were no security loans outstanding with FCM. Security lending income represents the income earned on investing cash collateral, less rebates paid to borrowers and any lending agent fees associated with the loan, plus any premium payments received for lending certain types of securities. Security lending income is presented in the Statement of Operations as a component of income from Fidelity Central Funds. Total security lending income during the period amounted to $110,200, including $462 from securities loaned to FCM.
8. Expense Reductions.
The investment adviser contractually agreed to reimburse each class to the extent annual operating expenses exceeded certain levels of average net assets as noted in the table below. This reimbursement will remain in place through December 31, 2015. Some expenses, for example interest expense, including commitment fees, are excluded from this reimbursement.
The following classes were in reimbursement during the period:
| Expense
Limitations | Reimbursement |
Class B | 2.20% | $ 38 |
Class C | 2.20% | 880 |
| | $ 918 |
In addition, the investment adviser reimbursed a portion of the Fund's operating expenses during the period in the amount of $1,566.
9. Distributions to Shareholders.
Distributions to shareholders of each class were as follows:
Years ended October 31, | 2014 | 2013 |
From net investment income | | |
Class A | $ 114,661 | $ 102,760 |
Class T | 92,140 | 49,034 |
Class B | 757 | 1,541 |
Class C | 24,034 | 28,314 |
Total International Equity | 4,825,256 | 5,630,153 |
Institutional Class | 33,527 | 33,750 |
Total | $ 5,090,375 | $ 5,845,552 |
Annual Report
Notes to Financial Statements - continued
9. Distributions to Shareholders - continued
Years ended October 31, | 2014 | 2013 |
From net realized gain | | |
Class A | $ 201,491 | $ 199,811 |
Class T | 179,326 | 93,853 |
Class B | 4,154 | 6,990 |
Class C | 83,657 | 92,492 |
Total International Equity | 7,158,781 | 9,320,186 |
Institutional Class | 51,867 | 55,869 |
Total | $ 7,679,276 | $ 9,769,201 |
10. Share Transactions.
Share transactions for each class were as follows and may contain automatic conversions between classes or exchanges between funds:
| Shares | Dollars |
Years ended October 31, | 2014 | 2013 | 2014 | 2013 |
Class A | | | | |
Shares sold | 232,039 | 510,102 | $ 1,877,334 | $ 3,880,513 |
Reinvestment of distributions | 38,586 | 41,103 | 306,762 | 293,886 |
Shares redeemed | (217,382) | (248,440) | (1,752,622) | (1,903,860) |
Net increase (decrease) | 53,243 | 302,765 | $ 431,474 | $ 2,270,539 |
Class T | | | | |
Shares sold | 525,401 | 807,518 | $ 4,252,382 | $ 6,202,497 |
Reinvestment of distributions | 33,829 | 19,724 | 270,968 | 142,209 |
Shares redeemed | (230,852) | (195,438) | (1,883,437) | (1,518,035) |
Net increase (decrease) | 328,378 | 631,804 | $ 2,639,913 | $ 4,826,671 |
Class B | | | | |
Shares sold | 2,568 | 827 | $ 21,032 | $ 6,304 |
Reinvestment of distributions | 604 | 1,165 | 4,866 | 8,437 |
Shares redeemed | (5,357) | (8,955) | (43,506) | (69,218) |
Net increase (decrease) | (2,185) | (6,963) | $ (17,608) | $ (54,477) |
Class C | | | | |
Shares sold | 174,035 | 129,341 | $ 1,421,548 | $ 986,204 |
Reinvestment of distributions | 10,201 | 12,546 | 81,608 | 90,328 |
Shares redeemed | (113,485) | (83,065) | (922,884) | (635,648) |
Net increase (decrease) | 70,751 | 58,822 | $ 580,272 | $ 440,884 |
Total International Equity | | | | |
Shares sold | 7,329,051 | 10,376,724 | $ 59,640,689 | $ 77,880,274 |
Reinvestment of distributions | 1,486,031 | 2,062,441 | 11,828,806 | 14,746,450 |
Shares redeemed | (7,554,096) | (11,840,491) | (61,144,473) | (90,585,484) |
Net increase (decrease) | 1,260,986 | 598,674 | $ 10,325,022 | $ 2,041,240 |
Annual Report
10. Share Transactions - continued
| Shares | Shares | Dollars | Dollars |
Years ended October 31, | 2014 | 2013 | 2014 | 2013 |
Institutional Class | | | | |
Shares sold | 127,536 | 142,800 | $ 1,054,194 | $ 1,078,337 |
Reinvestment of distributions | 10,120 | 12,587 | 80,252 | 89,619 |
Shares redeemed | (144,685) | (75,629) | (1,167,594) | (583,086) |
Net increase (decrease) | (7,029) | 79,758 | $ (33,148) | $ 584,870 |
11. Other.
The Fund's organizational documents provide former and current trustees and officers with a limited indemnification against liabilities arising in connection with the performance of their duties to the Fund. In the normal course of business, the Fund may also enter into contracts that provide general indemnifications. The Fund's maximum exposure under these arrangements is unknown as this would be dependent on future claims that may be made against the Fund. The risk of material loss from such claims is considered remote.
At the end of the period, a shareholder of record owned approximately 72% of the total outstanding shares of the Fund.
Annual Report
To the Trustees of Fidelity Investment Trust and Shareholders of Fidelity Total International Equity Fund:
We have audited the accompanying statement of assets and liabilities of Fidelity Total International Equity Fund (the Fund), a fund of Fidelity Investment Trust, including the schedule of investments, as of October 31, 2014, and the related statement of operations for the year then ended, the statement of changes in net assets for each of the two years in the period then ended, and the financial highlights for each of the five years in the period then ended. These financial statements and financial highlights are the responsibility of the Fund's management. Our responsibility is to express an opinion on these financial statements and financial highlights based on our audits.
We conducted our audits in accordance with the standards of the Public Company Accounting Oversight Board (United States). Those standards require that we plan and perform the audit to obtain reasonable assurance about whether the financial statements and financial highlights are free of material misstatement. The Fund is not required to have, nor were we engaged to perform, an audit of its internal control over financial reporting. Our audits included consideration of internal control over financial reporting as a basis for designing audit procedures that are appropriate in the circumstances, but not for the purpose of expressing an opinion on the effectiveness of the Fund's internal control over financial reporting. Accordingly, we express no such opinion. An audit also includes examining, on a test basis, evidence supporting the amounts and disclosures in the financial statements, assessing the accounting principles used and significant estimates made by management, as well as evaluating the overall financial statement presentation. Our procedures included confirmation of securities owned as of October 31, 2014, by correspondence with the custodians and brokers; where replies were not received from brokers, we performed other auditing procedures. We believe that our audits provide a reasonable basis for our opinion.
In our opinion, the financial statements and financial highlights referred to above present fairly, in all material respects, the financial position of Fidelity Total International Equity Fund as of October 31, 2014, the results of its operations for the year then ended, the changes in its net assets for each of the two years in the period then ended, and the financial highlights for each of the five years in the period then ended, in conformity with accounting principles generally accepted in the United States of America.
DELOITTE & TOUCHE LLP
Boston, Massachusetts
December 16, 2014
Annual Report
The Trustees, Member of the Advisory Board, and officers of the trust and fund, as applicable, are listed below. The Board of Trustees governs the fund and is responsible for protecting the interests of shareholders. The Trustees are experienced executives who meet periodically throughout the year to oversee the fund's activities, review contractual arrangements with companies that provide services to the fund, oversee management of the risks associated with such activities and contractual arrangements, and review the fund's performance. Except for James C. Curvey, each of the Trustees oversees 174 funds. Mr. Curvey oversees 407 funds.
The Trustees hold office without limit in time except that (a) any Trustee may resign; (b) any Trustee may be removed by written instrument, signed by at least two-thirds of the number of Trustees prior to such removal; (c) any Trustee who requests to be retired or who has become incapacitated by illness or injury may be retired by written instrument signed by a majority of the other Trustees; and (d) any Trustee may be removed at any special meeting of shareholders by a two-thirds vote of the outstanding voting securities of the trust. Each Trustee who is not an interested person (as defined in the 1940 Act) of the trust and the fund (Independent Trustee), shall retire not later than the last day of the calendar year in which his or her 75th birthday occurs. The Independent Trustees may waive this mandatory retirement age policy with respect to individual Trustees. The officers and Advisory Board Member hold office without limit in time, except that any officer and Advisory Board Member may resign or may be removed by a vote of a majority of the Trustees at any regular meeting or any special meeting of the Trustees. Except as indicated, each individual has held the office shown or other offices in the same company for the past five years.
Experience, Skills, Attributes, and Qualifications of the Fund's Trustees. The Governance and Nominating Committee has adopted a statement of policy that describes the experience, qualifications, attributes, and skills that are necessary and desirable for potential Independent Trustee candidates (Statement of Policy). The Board believes that each Trustee satisfied at the time he or she was initially elected or appointed a Trustee, and continues to satisfy, the standards contemplated by the Statement of Policy. The Governance and Nominating Committee also engages professional search firms to help identify potential Independent Trustee candidates who have the experience, qualifications, attributes, and skills consistent with the Statement of Policy. From time to time, additional criteria based on the composition and skills of the current Independent Trustees, as well as experience or skills that may be appropriate in light of future changes to board composition, business conditions, and regulatory or other developments, have also been considered by the professional search firms and the Governance and Nominating Committee. In addition, the Board takes into account the Trustees' commitment and participation in Board and committee meetings, as well as their leadership of standing and ad hoc committees throughout their tenure.
In determining that a particular Trustee was and continues to be qualified to serve as a Trustee, the Board has considered a variety of criteria, none of which, in isolation, was controlling. The Board believes that, collectively, the Trustees have balanced and diverse experience, qualifications, attributes, and skills, which allow the Board to operate effectively in governing the fund and protecting the interests of shareholders. Information about the specific experience, skills, attributes, and qualifications of each Trustee, which in each case led to the Board's conclusion that the Trustee should serve (or continue to serve) as a trustee of the fund, is provided below.
Annual Report
Trustees and Officers - continued
Board Structure and Oversight Function. James C. Curvey is an interested person (as defined in the 1940 Act) and currently serves as Chairman. The Trustees have determined that an interested Chairman is appropriate and benefits shareholders because an interested Chairman has a personal and professional stake in the quality and continuity of services provided to the fund. Independent Trustees exercise their informed business judgment to appoint an individual of their choosing to serve as Chairman, regardless of whether the Trustee happens to be independent or a member of management. The Independent Trustees have determined that they can act independently and effectively without having an Independent Trustee serve as Chairman and that a key structural component for assuring that they are in a position to do so is for the Independent Trustees to constitute a substantial majority for the Board. The Independent Trustees also regularly meet in executive session. Ned C. Lautenbach serves as Chairman of the Independent Trustees and as such (i) acts as a liaison between the Independent Trustees and management with respect to matters important to the Independent Trustees and (ii) with management prepares agendas for Board meetings.
Fidelity funds are overseen by different Boards of Trustees. The fund's Board oversees Fidelity's equity and high income funds and another Board oversees Fidelity's investment-grade bond, money market, and asset allocation funds. The asset allocation funds may invest in Fidelity funds overseen by the fund's Board. The use of separate Boards, each with its own committee structure, allows the Trustees of each group of Fidelity funds to focus on the unique issues of the funds they oversee, including common research, investment, and operational issues. On occasion, the separate Boards establish joint committees to address issues of overlapping consequences for the Fidelity funds overseen by each Board.
The Trustees operate using a system of committees to facilitate the timely and efficient consideration of all matters of importance to the Trustees, the fund, and fund shareholders and to facilitate compliance with legal and regulatory requirements and oversight of the fund's activities and associated risks. The Board, acting through its committees, has charged FMR and its affiliates with (i) identifying events or circumstances the occurrence of which could have demonstrably adverse effects on the fund's business and/or reputation; (ii) implementing processes and controls to lessen the possibility that such events or circumstances occur or to mitigate the effects of such events or circumstances if they do occur; and (iii) creating and maintaining a system designed to evaluate continuously business and market conditions in order to facilitate the identification and implementation processes described in (i) and (ii) above. Because the day-to-day operations and activities of the fund are carried out by or through FMR, its affiliates and other service providers, the fund's exposure to risks is mitigated but not eliminated by the processes overseen by the Trustees. While each of the Board's committees has responsibility for overseeing different aspects of the fund's activities, oversight is exercised primarily through the Operations, Audit, and Compliance Committees. In addition, the Independent Trustees have worked with FMR to enhance the Board's oversight of investment and financial risks, legal and regulatory risks, technology risks, and operational risks, including the development of additional risk reporting to the Board. For example, a working group comprised of Independent Trustees and FMR has worked and continues to work to review the Fidelity funds' valuation-related activities, reporting and risk management. Appropriate personnel, including but not limited to the fund's Chief Compliance Officer (CCO), FMR's internal auditor, the independent accountants, the fund's Treasurer and portfolio management personnel, make periodic reports to the Board's committees, as appropriate, including an annual review of FMR's risk management program for the Fidelity funds. The responsibilities of each standing committee, including their oversight responsibilities, are described further under "Standing Committees of the Fund's Trustees."
Annual Report
The fund's Statement of Additional Information (SAI) includes more information about the Trustees. To request a free copy, call Fidelity at 1-877-208-0098.
Interested Trustees*:
Correspondence intended for each Trustee who is an interested person may be sent to Fidelity Investments, 245 Summer Street, Boston, Massachusetts 02210.
Name, Year of Birth; Principal Occupations and Other Relevant Experience+ |
James C. Curvey (1935) |
Year of Election or Appointment: 2007 Trustee Chairman of the Board of Trustees |
| Mr. Curvey also serves as Trustee of other Fidelity funds. Mr. Curvey is a Director of Fidelity Research & Analysis Co. (2009-present), and Vice Chairman (2007-present) and Director of FMR LLC. In addition, Mr. Curvey serves as an Overseer for the Boston Symphony Orchestra and a member of the board of Artis Naples, Naples, Florida, and as a Trustee for Brewster Academy, Wolfeboro, New Hampshire. Previously, Mr. Curvey served as a Director of Fidelity Investments Money Management, Inc. (2009-2014), a Director of FMR (2007-2014), and a Director of FMR Co., Inc. (2007-2014). |
Charles S. Morrison (1960) |
Year of Election or Appointment: 2014 Trustee |
| Mr. Morrison also serves as Trustee of other funds. He serves as a Director of Fidelity Investments Money Mangement, Inc. (FIMM) (2014-present), Director of Fidelity SelectCo, LLC (2014-present), President, Asset Management (2014-present) and is an employee of Fidelity Investments. Previously, Mr. Morrison served as Vice President of Fidelity's Fixed Income and Asset Allocation Funds (2012-2014), President, Fixed Income (2011-2014), Vice President of Fidelity's Money Market Funds (2005-2009), President, Money Market Group Leader of FMR (2009), and Senior Vice President, Money Market Group of FMR (2004-2009). Mr. Morrison also served as Vice President of Fidelity's Bond Funds (2002-2005), certain Balanced Funds (2002-2005), and certain Asset Allocation Funds (2002-2007), and as Senior Vice President (2002-2005) of Fidelity's Bond Division. |
* Trustees have been determined to be "Interested Trustees" by virtue of, among other things, their affiliation with the trust or various entities under common control with FMR.
+ The information above includes each Trustee's principal occupation during the last five years and other information relating to the experience, attributes, and skills relevant to each Trustee's qualifications to serve as a Trustee, which led to the conclusion that each Trustee should serve as a Trustee for the fund.
Annual Report
Independent Trustees:
Correspondence intended for each Independent Trustee (that is, the Trustees other than the Interested Trustees) may be sent to Fidelity Investments, P.O. Box 55235, Boston, Massachusetts 02205-5235.
Name, Year of Birth; Principal Occupations and Other Relevant Experience+ |
Dennis J. Dirks (1948) |
Year of Election or Appointment: 2005 Trustee |
| Mr. Dirks also serves as Trustee of other Fidelity funds. Prior to his retirement in May 2003, Mr. Dirks was Chief Operating Officer and a member of the Board of The Depository Trust & Clearing Corporation (DTCC). He also served as President, Chief Operating Officer, and Board member of The Depository Trust Company (DTC) and President and Board member of the National Securities Clearing Corporation (NSCC). In addition, Mr. Dirks served as Chief Executive Officer and Board member of the Government Securities Clearing Corporation, Chief Executive Officer and Board member of the Mortgage-Backed Securities Clearing Corporation, as a Trustee and a member of the Finance Committee of Manhattan College (2005-2008), and as a Trustee and a member of the Finance Committee of AHRC of Nassau County (2006-2008). Mr. Dirks is a member of the Independent Directors Council (IDC) Governing Council (2010-present) and Board of Directors for The Brookville Center for Children's Services, Inc. (2009-present). |
Alan J. Lacy (1953) |
Year of Election or Appointment: 2008 Trustee |
| Mr. Lacy also serves as Trustee of other Fidelity funds. Mr. Lacy serves as Senior Adviser (2007-present) of Oak Hill Capital Partners, L.P. (private equity). Mr. Lacy also served as Chief Executive Officer (2000-2005) and Vice Chairman (2005-2006) of Sears Holdings Corporation and Sears, Roebuck and Co. (retail). In addition, Mr. Lacy serves as a member of the Board of Directors of Dave & Buster's Entertainment, Inc. (restaurant and entertainment complexes, 2010-present), Earth Fare, Inc. (retail grocery, 2012-present), The Hillman Companies, Inc. (hardware wholesalers, 2010-present), and Bristol-Myers Squibb Company (global pharmaceuticals, 2008-present). Mr. Lacy is a member of the Board of Trustees of The National Parks Conservation Association (2006-present). Previously, Mr. Lacy served as Chairman of the Board of Trustees of the National Parks Conservation Association (2008-2011) and as a member of the Board of Directors for the Western Union Company (global money transfer, 2006-2011). |
Ned C. Lautenbach (1944) |
Year of Election or Appointment: 2000 Trustee Chairman of the Independent Trustees |
| Mr. Lautenbach also serves as Trustee of other Fidelity funds. Mr. Lautenbach currently serves as the Lead Director of the Eaton Corporation Board of Directors (diversified industrial, 1997-present). Mr. Lautenbach is Chairman of the Board of Directors of the Philharmonic Center for the Arts in Naples, Florida (2012-present) and a member of the Council on Foreign Relations (1994-present). Previously, Mr. Lautenbach was a Partner/Advisory Partner at Clayton, Dubilier & Rice, LLC (private equity investment, 1998-2010), as well as a Director of Sony Corporation (2006-2007). |
Joseph Mauriello (1944) |
Year of Election or Appointment: 2008 Trustee |
| Mr. Mauriello also serves as Trustee of other Fidelity funds. Prior to his retirement in January 2006, Mr. Mauriello served in numerous senior management positions including Deputy Chairman and Chief Operating Officer (2004-2005), and Vice Chairman of Financial Services (2002-2004) of KPMG LLP US (professional services, 1965-2005). Mr. Mauriello currently serves as a member of the Board of Directors of XL Group plc. (global insurance and re-insurance, 2006-present). Previously, Mr. Mauriello served as a Director of the Hamilton Funds of the Bank of New York (2006-2007) and of Arcadia Resources Inc. (health care services and products, 2007-2012). |
Robert W. Selander (1950) |
Year of Election or Appointment: 2011 Trustee |
| Mr. Selander also serves as Trustee of other Fidelity funds. Previously, Mr. Selander served as a Member of the Advisory Board of other Fidelity funds (2011), and Executive Vice Chairman (2010), Chief Executive Officer (2009-2010), and President and Chief Executive Officer (1997-2009) of Mastercard, Inc. |
Cornelia M. Small (1944) |
Year of Election or Appointment: 2005 Trustee |
| Ms. Small also serves as Trustee of other Fidelity funds. Ms. Small is a member of the Board of Directors (2009-present) and Chair of the Investment Committee (2010-present) of the Teagle Foundation. Ms. Small also serves on the Investment Committee of the Berkshire Taconic Community Foundation (2008-present). Previously, Ms. Small served as Chairperson (2002-2008) and a member of the Investment Committee and Chairperson (2008-2012) and a member of the Board of Trustees of Smith College. In addition, Ms. Small served as Chief Investment Officer, Director of Global Equity Investments, and a member of the Board of Directors of Scudder, Stevens & Clark and Scudder Kemper Investments. |
William S. Stavropoulos (1939) |
Year of Election or Appointment: 2001 Trustee Vice Chairman of the Independent Trustees |
| Mr. Stavropoulos also serves as Trustee of other Fidelity funds. Mr. Stavropoulos serves as President and Founder of the Michigan Baseball Foundation, the Great Lakes Loons (2007-present). Mr. Stavropoulos is Chairman Emeritus of the Board of Directors of The Dow Chemical Company, where he previously served in numerous senior management positions, including President, CEO (1995-2000; 2002-2004), Chairman of the Executive Committee (2000-2006), and as a member of the Board of Directors (1990-2006). Currently, Mr. Stavropoulos is Chairman of the Board of Directors of Univar Inc. (global distributor of commodity and specialty chemicals), a Director of Teradata Corporation (data warehousing and technology solutions), and Maersk Inc. (industrial conglomerate), and a member of the Advisory Board for Metalmark Capital LLC (private equity investment, 2005-present). Mr. Stavropoulos is an operating advisor to Clayton, Dubilier & Rice, LLC (private equity investment). In addition, Mr. Stavropoulos is a member of the University of Notre Dame Advisory Council for the College of Science, a Trustee of the Rollin L. Gerstacker Foundation, and a Director of the Naples Philharmonic Center for the Arts. Previously, Mr. Stavropoulos served as a Director of Chemical Financial Corporation (bank holding company, 1993-2012) and Tyco International, Ltd. (multinational manufacturing and services, 2007-2012). |
David M. Thomas (1949) |
Year of Election or Appointment: 2008 Trustee |
| Mr. Thomas also serves as Trustee of other Fidelity funds. Mr. Thomas serves as Non-Executive Chairman of the Board of Directors of Fortune Brands Home and Security (home and security products, 2011-present), and as a member of the Board of Directors of Interpublic Group of Companies, Inc. (marketing communication, 2004-present). Previously, Mr. Thomas served as Executive Chairman (2005-2006) and Chairman and Chief Executive Officer (2000-2005) of IMS Health, Inc. (pharmaceutical and healthcare information solutions), and a Director of Fortune Brands, Inc. (consumer products, 2000-2011). |
+ The information above includes each Trustee's principal occupation during the last five years and other information relating to the experience, attributes, and skills relevant to each Trustee's qualifications to serve as a Trustee, which led to the conclusion that each Trustee should serve as a Trustee for the fund.
Advisory Board Member and Officers:
Correspondence intended for each officer and Peter S. Lynch may be sent to Fidelity Investments, 245 Summer Street, Boston, Massachusetts 02210. Officers appear below in alphabetical order.
Name, Year of Birth; Principal Occupation |
Peter S. Lynch (1944) |
Year of Election or Appointment: 2003 Member of the Advisory Board |
| Mr. Lynch also serves as Member of the Advisory Board of other Fidelity funds. Mr. Lynch is Vice Chairman and a Director of FMR and FMR Co., Inc. In addition, Mr. Lynch serves as a Trustee of Boston College and as the Chairman of the Inner-City Scholarship Fund. Previously, Mr. Lynch served on the Special Olympics International Board of Directors (1997-2006). |
Elizabeth Paige Baumann (1968) |
Year of Election or Appointment: 2012 Anti-Money Laundering (AML) Officer |
| Ms. Baumann also serves as AML Officer of other funds. She is Chief AML Officer of FMR LLC (2012-present) and is an employee of Fidelity Investments. Previously, Ms. Baumann served as Vice President and Deputy Anti-Money Laundering Officer (2007-2012). |
William C. Coffey (1969) |
Year of Election or Appointment: 2009 Assistant Secretary |
| Mr. Coffey also serves as Assistant Secretary of other funds. He is Senior Vice President and Deputy General Counsel of FMR LLC (2010-present), and is an employee of Fidelity Investments. Previously, Mr. Coffey served as Vice President and Associate General Counsel of FMR LLC (2005-2009). |
Timothy M. Cohen (1969) |
Year of Election or Appointment: 2014 Vice President of certain Equity Funds |
| Mr. Cohen also serves as Vice President of other funds. Mr. Cohen serves as a Director and Chief Compliance Officer of Fidelity Management & Research (U.K.) Inc. (2013-present) and is an employee of Fidelity Investments. |
Jonathan Davis (1968) |
Year of Election or Appointment: 2010 Assistant Treasurer |
| Mr. Davis also serves as Assistant Treasurer of other funds. Mr. Davis is an employee of Fidelity Investments. Previously, Mr. Davis served as Vice President and Associate General Counsel of FMR LLC (2003-2010). |
Adrien E. Deberghes (1967) |
Year of Election or Appointment: 2008 Deputy Treasurer |
| Mr. Deberghes also serves as an officer of other funds. He is an employee of Fidelity Investments (2008-present). Prior to joining Fidelity Investments, Mr. Deberghes was Senior Vice President of Mutual Fund Administration at State Street Corporation (2007-2008), Senior Director of Mutual Fund Administration at Investors Bank & Trust (2005-2007), and Director of Finance for Dunkin' Brands (2000-2005). |
Stephanie J. Dorsey (1969) |
Year of Election or Appointment: 2010 Assistant Treasurer |
| Ms. Dorsey also serves as an officer of other funds. She is an employee of Fidelity Investments (2008-present) and has served in other fund officer roles. Prior to joining Fidelity Investments, Ms. Dorsey served as Treasurer (2004-2008) of the JPMorgan Mutual Funds and Vice President (2004-2008) of JPMorgan Chase Bank. |
Howard J. Galligan III (1966) |
Year of Election or Appointment: 2014 Chief Financial Officer |
| Mr. Galligan also serves as Chief Financial Officer of other funds. Mr. Galligan serves as President of Fidelity Pricing and Cash Management Services (FPCMS) (2014-present) and as a Director of Strategic Advisers, Inc. (2008-present). Previously, Mr. Galligan served as Chief Administrative Officer of Asset Management (2011-2014) and Chief Operating Officer and Senior Vice President of Investment Support for Strategic Advisers, Inc. (2003-2011). |
Scott C. Goebel (1968) |
Year of Election or Appointment: 2008 Secretary and Chief Legal Officer (CLO) |
| Mr. Goebel serves as Secretary and CLO of other funds. Mr. Goebel also serves as Secretary of Fidelity SelectCo, LLC (2013-present), Fidelity Investments Money Management, Inc. (FIMM) (2010-present) and Fidelity Research and Analysis Company (FRAC) (2010-present); General Counsel, Secretary, and Senior Vice President of FMR (2008-present) and FMR Co., Inc. (2008-present); Chief Legal Officer of Fidelity Management & Research (Hong Kong) Limited (2008-present); and Assistant Secretary of Fidelity Management & Research (Japan) Limited (2008-present) and Fidelity Management & Research (U.K.) Inc. (2008-present). Previously, Mr. Goebel served as Secretary and CLO of other Fidelity funds (2008-2013), Assistant Secretary of FIMM (2008-2010), FRAC (2008-2010), and certain funds (2007-2008); and as Vice President and Secretary of Fidelity Distributors Corporation (FDC) (2005-2007). Mr. Goebel has been employed by FMR LLC or an affiliate since 2001. |
Brian B. Hogan (1964) |
Year of Election or Appointment: 2009 Vice President |
| Mr. Hogan also serves as Trustee or Vice President of other funds. Mr. Hogan serves as a Director of Fidelity SelectCo, LLC (2014-present) and President of FMR's Equity Division (2009-present). Previously, Mr. Hogan served as Senior Vice President, Equity Research of FMR (2006-2009) and as a portfolio manager. |
Chris Maher (1972) |
Year of Election or Appointment: 2013 Assistant Treasurer |
| Mr. Maher serves as Assistant Treasurer of other funds. Mr. Maher is Vice President of Valuation Oversight and is an employee of Fidelity Investments. Previously, Mr. Maher served as Vice President of Asset Management Compliance (2013), Vice President of FMR's Program Management Group (2010-2013), and Vice President of Valuation Oversight (2008-2010). |
Kenneth B. Robins (1969) |
Year of Election or Appointment: 2008 President and Treasurer |
| Mr. Robins also serves as an officer of other funds. Mr. Robins serves as Executive Vice President of Fidelity Investments Money Management, Inc. (FIMM) (2013-present) and is an employee of Fidelity Investments (2004-present). Previously, Mr. Robins served in other fund officer roles. |
Stephen Sadoski (1971) |
Year of Election or Appointment: 2012 Deputy Treasurer |
| Mr. Sadoski also serves as Deputy Treasurer of other funds. He is an employee of Fidelity Investments (2012-present) and has served in another fund officer role. Prior to joining Fidelity Investments, Mr. Sadoski served as an assistant chief accountant in the Division of Investment Management of the Securities and Exchange Commission (SEC) (2009-2012) and as a senior manager at Deloitte & Touche LLP (1997-2009). |
Stacie M. Smith (1974) |
Year of Election or Appointment: 2013 Deputy Treasurer |
| Ms. Smith also serves as an officer of other funds. She is an employee of Fidelity Investments (2009-present) and has served in other fund officer roles. Prior to joining Fidelity Investments, Ms. Smith served as Senior Audit Manager of Ernst & Young LLP (1996-2009). |
Renee Stagnone (1975) |
Year of Election or Appointment: 2013 Deputy Treasurer |
| Ms. Stagnone also serves as Deputy Treasurer of other funds. Ms. Stagnone is an employee of Fidelity Investments. |
Linda J. Wondrack (1964) |
Year of Election or Appointment: 2014 Chief Compliance Officer |
| Ms. Wondrack also serves as Chief Compliance Officer of other funds. Ms. Wondrack is Executive Vice President and head of the Ethics Office and Asset Management Compliance for Fidelity Investments (2012-present). Ms. Wondrack also serves as Chief Compliance Officer of Fidelity SelectCo, LLC (2014-present); Chief Compliance Officer of Impresa Management LLC (2013-present); and Chief Compliance Officer of FMR Co., Inc., Fidelity Investments Money Management, Inc., Fidelity Management & Research (Japan) Limited, Fidelity Management & Research (U.K.) Inc., Fidelity Management & Research (Hong Kong), Fidelity Management & Research Company, Pyramis Global Advisors, LLC, and Strategic Advisers, Inc., Ballyrock Investment Advisors LLC, and Northern Neck Investors LLC (2012-present). Previously, Ms. Wondrack served as Senior Vice President and Chief Compliance Officer for Columbia Management Investment Advisers, LLC (2005-2012); Chief Compliance Officer for certain funds within the Columbia Family of Funds (2007-2012); and Senior Vice President of Compliance Risk Management at Bank of America (2005-2010). |
Joseph F. Zambello (1957) |
Year of Election or Appointment: 2011 Deputy Treasurer |
| Mr. Zambello also serves as Deputy Treasurer of other funds. Mr. Zambello is an employee of Fidelity Investments. Previously, Mr. Zambello served as Vice President of FMR's Program Management Group (2009-2011) and Vice President of the Transfer Agent Oversight Group (2005-2009). |
Annual Report
The Board of Trustees of Fidelity Total International Equity Fund voted to pay to shareholders of record at the opening of business on record date, the following distributions per share derived from capital gains realized from sales of portfolio securities, and dividends derived from net investment income:
| Pay Date | Record Date | Dividends | Capital Gains |
Institutional Class | 12/8/14 | 12/5/14 | $0.120 | $0.040 |
The fund hereby designates as a capital gain dividend with respect to the taxable year ended October 31st, 2014, $1,957,679, or, if subsequently determined to be different, the net capital gain of such year.
Institutional Class designates 3% of the dividends distributed in December 2013 as indicated in the Corporate Qualifying memo distributed by the Tax department, during the fiscal year as qualifying for the dividends-received deduction for corporate shareholders.
Institutional Class designates 67% of the dividends distributed in December during the fiscal year as amounts which may be taken into account as a dividend for purposes of the maximum rate under section 1(h)(11) of the Internal Revenue Code.
The amounts per share which represent income derived from sources within, and taxes paid to, foreign countries or possessions of the United States are as follows:
| Pay Date | Income | Taxes |
Institutional Class | 12/09/2013 | $0.1100 | $0.0119 |
The fund will notify shareholders in January 2015 of amounts for use in preparing 2014 income tax returns.
Annual Report
Board Approval of Investment Advisory Contracts and Management Fees
Fidelity Total International Equity Fund
Each year, the Board of Trustees, including the Independent Trustees (together, the Board), votes on the renewal of the management contract with Fidelity Management & Research Company (FMR) and the sub-advisory agreements (together, the Advisory Contracts) for the fund. The Board, assisted by the advice of fund counsel and Independent Trustees' counsel, requests and considers a broad range of information relevant to the renewal of the Advisory Contracts throughout the year.
The Board meets regularly and, at each of its meetings, covers an extensive agenda of topics and materials and considers factors that are relevant to its annual consideration of the renewal of the fund's Advisory Contracts, including the services and support provided to the fund and its shareholders. The Board has established various standing committees (Committees), each composed of and chaired by Independent Trustees with varying backgrounds, to which the Board has assigned specific subject matter responsibilities in order to enhance effective decision-making by the Board. The Board, acting directly and through its Committees, requests and receives information concerning the annual consideration of the renewal of the fund's Advisory Contracts. The Board also meets as needed to consider matters specifically related to the Board's annual consideration of the renewal of the Advisory Contracts. Members of the Board may also meet with trustees of other Fidelity funds through ad hoc joint committees to discuss certain matters relevant to the Fidelity funds.
At its July 2014 meeting, the Board, including the Independent Trustees, unanimously determined to renew the fund's Advisory Contracts. In reaching its determination, the Board considered all factors it believed relevant, including (i) the nature, extent, and quality of the services to be provided to the fund and its shareholders (including the investment performance of the fund); (ii) the competitiveness of the fund's management fee and total expense ratio relative to peer funds; (iii) the total costs of the services to be provided by and the profits to be realized by Fidelity from its relationship with the fund; (iv) the extent to which economies of scale exist and would be realized as the fund grows; and (v) whether fee levels reflect these economies of scale, if any, for the benefit of fund shareholders. In connection with separate internal corporate reorganizations involving Fidelity Management & Research (U.K.) Inc. (FMR U.K.) and Fidelity Management & Research (Japan) Inc. (FMR Japan), the Board approved certain non-material amendments to the fund's sub-advisory agreements with FMR U.K. and FMR Japan to reflect that, after these reorganizations, FMR Investment Management (UK) Limited and Fidelity Management & Research (Japan) Limited will carry on the business of FMR U.K. and FMR Japan, respectively. The Board noted that no changes to the portfolio managers or to the foreign research or investment advisory services provided to the fund were expected in connection with either reorganization and that the same personnel and resources would continue to be available to the fund at the new entities.
Annual Report
In considering whether to renew the Advisory Contracts for the fund, the Board reached a determination, with the assistance of fund counsel and Independent Trustees' counsel and through the exercise of its business judgment, that the renewal of the Advisory Contracts was in the best interests of the fund and its shareholders and that the compensation payable under the Advisory Contracts was fair and reasonable. The Board's decision to renew the Advisory Contracts was not based on any single factor, but rather was based on a comprehensive consideration of all the information provided to the Board at its meetings throughout the year. The Board, in reaching its determination to renew the Advisory Contracts, was aware that shareholders of the fund have a broad range of investment choices available to them, including a wide choice among funds offered by Fidelity's competitors, and that the fund's shareholders, who have the opportunity to review and weigh the disclosure provided by the fund in its prospectus and other public disclosures, have chosen to invest in this fund, which is part of the Fidelity family of funds.
Nature, Extent, and Quality of Services Provided. The Board considered Fidelity's staffing as it relates to the fund, including the backgrounds of investment personnel of FMR and the sub-advisers (together, the Investment Advisers), and also considered the fund's investment objective, strategies, and related investment philosophy. The Independent Trustees also had discussions with senior management of Fidelity's investment operations and investment groups. The Board considered the structure of the portfolio manager compensation program and whether this structure provides appropriate incentives to act in the best interests of the fund. Additionally, the Board considered the portfolio managers' investments, if any, in the funds that they manage.
Resources Dedicated to Investment Management and Support Services. The Board and the Fund Oversight and Research Committees reviewed the general qualifications and capabilities of Fidelity's investment staff, including its size, education, experience, and resources, as well as Fidelity's approach to recruiting, training, managing, and compensating investment personnel. The Board noted that Fidelity has continued to increase the resources devoted to non-U.S. offices, including expansion of Fidelity's global investment organization. The Board also noted that Fidelity's analysts have extensive resources, tools and capabilities that allow them to conduct sophisticated quantitative and fundamental analysis, as well as credit analysis of issuers, counterparties and guarantors. Further, the Board believes that Fidelity's investment professionals have sufficient access to global information and data so as to provide competitive investment results over time, and that those professionals also have access to sophisticated tools that permit them to assess portfolio construction and risk and performance attribution characteristics continuously, as well as to transmit new information and research conclusions rapidly around the world. Additionally, in its deliberations, the Board considered Fidelity's trading and risk management capabilities and resources and global compliance infrastructure, which are an integral part of the investment management process.
Annual Report
Board Approval of Investment Advisory Contracts and
Management Fees - continued
Shareholder and Administrative Services. The Board considered (i) the nature, extent, quality, and cost of advisory, administrative, and shareholder services performed by the Investment Advisers and their affiliates under the Advisory Contracts and under separate agreements covering transfer agency, pricing and bookkeeping, and securities lending services for the fund; (ii) the nature and extent of the supervision of third party service providers, principally custodians and subcustodians; and (iii) the resources devoted to, and the record of compliance with, the fund's compliance policies and procedures. The Board also reviewed the allocation of fund brokerage, including allocations to brokers affiliated with the Investment Advisers, the use of brokerage commissions to pay fund expenses, and the use of "soft" commission dollars to pay for research services.
The Board noted that the growth of fund assets over time across the complex allows Fidelity to reinvest in the development of services designed to enhance the value or convenience of the Fidelity funds as investment vehicles. These services include 24-hour access to account information and market information through telephone representatives and over the Internet, investor education materials and asset allocation tools, and the expanded availability of Fidelity Investor Centers.
In 2014, the Board formed an ad hoc Committee on Transfer Agency Fees to review the variety of transfer agency fee structures throughout the industry and Fidelity's competitive positioning with respect to industry participants.
Investment in a Large Fund Family. The Board considered the benefits to shareholders of investing in a Fidelity fund, including the benefits of investing in a fund that is part of a large family of funds offering a variety of investment disciplines and providing a large variety of mutual fund investor services. The Board noted that Fidelity had taken, or had made recommendations that resulted in the Fidelity funds taking, a number of actions over the previous year that benefited particular funds, including (i) continuing to dedicate additional resources to investment research and to the support of the senior management team that oversees asset management; (ii) persisting in efforts to enhance Fidelity's global research capabilities; (iii) launching new funds and making other enhancements to meet client needs for income-oriented solutions; (iv) reducing fund expenses for certain index funds; (v) continuing to launch dedicated lower cost underlying funds to meet portfolio construction needs related to expanding underlying fund options for Fidelity funds of funds, specifically for the Freedom Fund product lines; (vi) rationalizing product lines and gaining increased efficiencies through fund mergers; (vii) launching sector-based exchange-traded funds and establishing a new Fidelity adviser to manage sector-based funds and products; (viii) continuing to develop and implement technology to improve security and increase efficiency; (ix) modifying the eligibility criteria for certain share classes to increase their marketability to a portion of the defined contribution plan market; (x) waiving redemption fees for certain qualified fund-of-fund and wrap programs and certain retirement plan transactions; and (xi) launching new Institutional Class shares of certain money market funds to attract and retain assets and to fill a gap in the money market fund lineup.
Annual Report
Investment Performance. The Board considered whether the fund has operated in accordance with its investment objective, as well as its record of compliance with its investment restrictions and its performance history.
The Board took into account discussions with the Investment Advisers about fund investment performance that occur at Board meetings throughout the year. In this regard the Board noted that as part of regularly scheduled fund reviews and other reports to the Board on fund performance, the Board periodically considers annualized return information for the fund, for different time periods, measured against a securities market index ("benchmark index") and a peer group of funds with similar objectives ("peer group"). In its evaluation of fund investment performance, the Board gave particular attention to information indicating changes in performance of certain Fidelity funds for specific time periods and the Investment Advisers' explanations for any overperformance or underperformance.
In addition to reviewing absolute and relative fund performance, the Independent Trustees periodically consider the appropriateness of fund performance metrics in evaluating the results achieved. In general, the Independent Trustees believe that fund performance should be evaluated based on net performance (after fees and expenses) of both the highest performing and lowest performing classes, where applicable, compared to appropriate benchmark indices, over appropriate time periods which may include full market cycles, and compared to peer groups, as applicable, over the same periods, taking into account relevant factors including the following: general market conditions; issuer-specific information; tactical opportunities for investment; and fund cash flows and other factors.
The Independent Trustees recognize that shareholders evaluate performance on a net basis over their own holding periods, for which one-, three-, and five-year periods are often used as a proxy. For this reason, the performance information reviewed by the Board also included net cumulative calendar year total return information for the fund and an appropriate benchmark index and peer group for the most recent one-, three-, and five-year periods, as shown below. Returns are shown compared to the 25th percentile (top of box, 75% beaten) and 75th percentile (bottom of box, 25% beaten) of the peer universe. Returns of the benchmark index are "net MA," i.e., adjusted for tax withholding rates applicable to U.S.-based funds organized as Massachusetts business trusts.
Annual Report
Board Approval of Investment Advisory Contracts and
Management Fees - continued
Fidelity Total International Equity Fund

The Board also considered that the fund's management fee is subject to upward or downward adjustment depending upon whether, and to what extent, the fund's investment performance for the performance period exceeds, or is exceeded by, a securities index, thus leading to a performance adjustment for the same period. The Board noted that the performance adjustment provides FMR with a strong economic incentive to seek to achieve superior performance for the fund's shareholders and helps to more closely align the interests of FMR and the fund's shareholders.
Based on its review, the Board concluded that the nature, extent, and quality of services provided to the fund under the Advisory Contracts should benefit the fund's shareholders.
Competitiveness of Management Fee and Total Expense Ratio. The Board considered the fund's management fee and total expense ratio compared to "mapped groups" of competitive funds and classes. Fidelity creates "mapped groups" by combining similar Lipper investment objective categories that have comparable investment mandates. Combining Lipper investment objective categories aids the Board's management fee and total expense ratio comparisons by broadening the competitive group used for comparison and by reducing the number of universes to which various Fidelity funds are compared.
Management Fee. The Board considered two proprietary management fee comparisons for the 12-month periods shown in the chart below. The group of Lipper funds used by the Board for management fee comparisons is referred to below as the "Total Mapped Group." The Total Mapped Group comparison focuses on a fund's standing in terms of gross management fees before expense reimbursements or caps, and without giving effect to the fund's performance adjustment, relative to the total universe of funds with comparable investment mandates, regardless of whether their management fee structures also are comparable. Funds with comparable investment mandates offer exposure to similar types of securities. Funds with comparable management fee structures have similar management fee contractual arrangements (e.g., flat rate charged for advisory services, all-inclusive fee rate, etc.). "TMG %" represents the percentage of funds in the Total Mapped Group that had management fees that were lower than the fund's. For example, a hypothetical TMG % of 20% would mean that 80% of the funds in the Total Mapped Group had higher, and 20% had lower, management fees than the fund. The fund's actual TMG %s are in the chart below. The "Asset-Size Peer Group" (ASPG) comparison focuses on a fund's standing relative to a subset of non-Fidelity funds within the Total Mapped Group that are similar in size and management fee structure. For example, if a fund is in the first quartile of the ASPG, the fund's management fee ranks in the least expensive or lowest 25% of funds in the ASPG. The ASPG represents at least 15% of the funds in the Total Mapped Group with comparable asset size and management fee structures, subject to a minimum of 50 funds (or all funds in the Total Mapped Group if fewer than 50). Additional information, such as the ASPG quartile in which the fund's management fee rate ranked and the impact of the fund's performance adjustment, is also included in the chart and considered by the Board.
Annual Report
Fidelity Total International Equity Fund
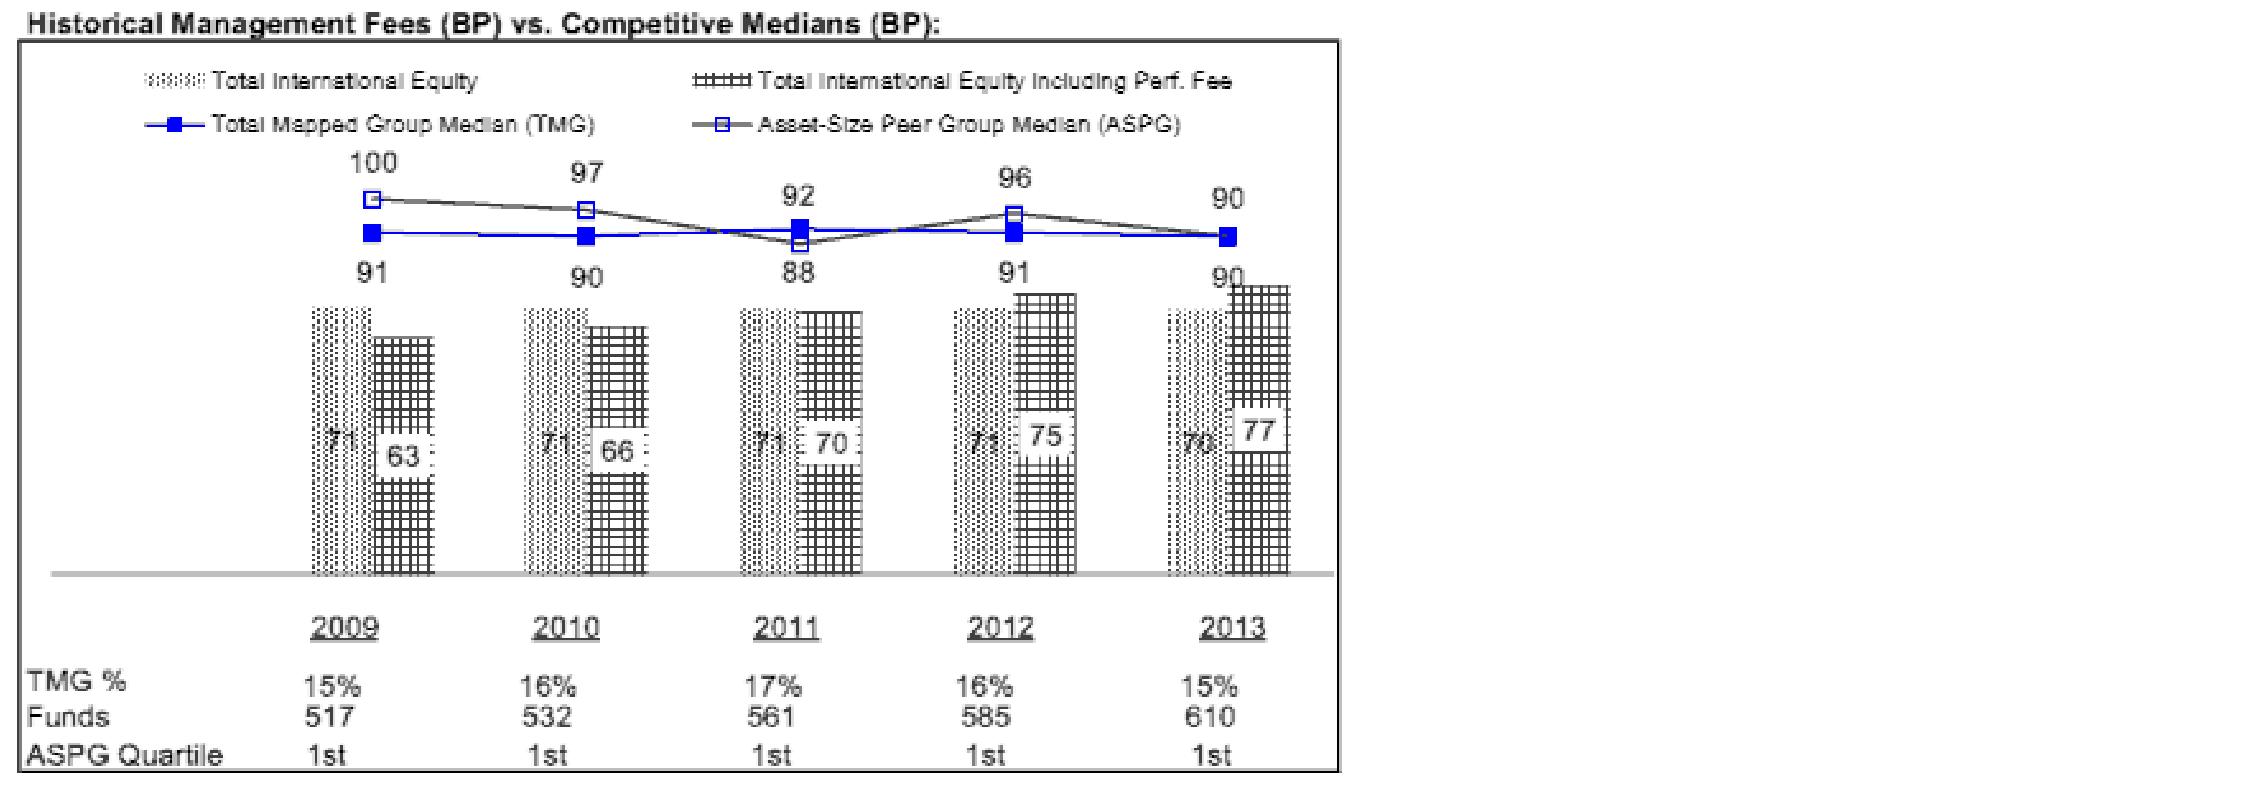
The Board noted that the fund's management fee rate ranked below the median of its Total Mapped Group and below the median of its ASPG for 2013. The Board also noted the effect of the fund's positive performance adjustment on the fund's management fee ranking.
Annual Report
Board Approval of Investment Advisory Contracts and
Management Fees - continued
The Board also noted that, in August 2013, the ad hoc Committee on Management Fees was formed to conduct an in-depth review of the management fee rates of Fidelity's active equity mutual funds. The Committee focused on the following areas: (i) standard fee structures; (ii) research consumption and trading evolution; (iii) management fee competitiveness/profitability by category; and (iv) factors that drive institutional pricing.
Based on its review, the Board concluded that the fund's management fee is fair and reasonable in light of the services that the fund receives and the other factors considered.
Total Expense Ratio. In its review of each class's total expense ratio, the Board considered the fund's management fee as well as other fund or class expenses, as applicable, such as transfer agent fees, pricing and bookkeeping fees, fund-paid 12b-1 fees, and custodial, legal, and audit fees. The Board also noted the effects of any waivers and reimbursements on fees and expenses, as well as the impact of the fund's performance adjustment. As part of its review, the Board also considered the current and historical total expense ratios of each class of the fund compared to competitive fund median expenses. Each class of the fund is compared to those funds and classes in the Total Mapped Group (used by the Board for management fee comparisons) that have a similar sales load structure.
The Board noted that the total expense ratio of the retail class ranked below its competitive median for 2013 and the total expense ratio of each of Class A, Class T, Class B, Class C, and Institutional Class ranked above its competitive median for 2013. The Board considered that, in general, various factors can affect total expense ratios. The Board noted that the total expense ratio of Class T was above the competitive median primarily because of higher 12b-1 fees on Class T as compared to most competitor funds. Class T has a higher 12b-1 fee, but a lower front-end sales charge, than traditionally priced front-end sales charge classes. The Board considered that Class T is primarily sold load-waived in the retirement plan market where its 0.50% 12b-1 fee is comparable to competing no-load, higher 12b-1 fee classes designed specifically for retirement plans. The Board noted that the fund offers multiple classes, each of which has a different sales load and 12b-1 fee structure, and that the multiple structures are intended to offer a range of pricing options for the intermediary market. The Board also noted that the total expense ratios of the classes vary primarily by the level of their 12b-1 fees, although differences in transfer agent fees may also cause expenses to vary from class to class.
The Board further considered that FMR contractually agreed to reimburse Class A, Class T, Class B, Class C, Institutional Class, and the retail class of the fund to the extent that total operating expenses (excluding interest, certain taxes, certain securities lending costs, brokerage commissions, extraordinary expenses, and acquired fund fees and expenses, if any), as a percentage of their respective average net assets, exceed 1.45%, 1.70%, 2.20%, 2.20%, 1.20%, and 1.20% through December 31, 2014.
Annual Report
Fees Charged to Other Fidelity Clients. The Board also considered Fidelity fee structures and other information with respect to clients of Fidelity, such as other funds advised or subadvised by Fidelity, pension plan clients, and other institutional clients. The Board noted the findings of the 2013 ad hoc joint committee (created with the board of other Fidelity funds), which reviewed and compared Fidelity's institutional investment advisory business with its business of providing services to the Fidelity funds, including the differences in services provided, fees charged, and costs incurred, as well as competition in their respective marketplaces.
Based on its review of total expense ratios and fees charged to other Fidelity clients, the Board concluded that the total expense ratio of each class of the fund was reasonable, although in some cases above the median of the universe presented for comparison, in light of the services that the fund and its shareholders receive and the other factors considered.
Costs of the Services and Profitability. The Board considered the revenues earned and the expenses incurred by Fidelity in conducting the business of developing, marketing, distributing, managing, administering and servicing the fund and servicing the fund's shareholders. The Board also considered the level of Fidelity's profits in respect of all the Fidelity funds.
On an annual basis, Fidelity presents to the Board Fidelity's profitability for the fund. Fidelity calculates the profitability for each fund, as well as aggregate profitability for groups of Fidelity funds and all Fidelity funds, using a series of detailed revenue and cost allocation methodologies which originate with the books and records of Fidelity on which Fidelity's audited financial statements are based. The Audit Committee of the Board reviews any significant changes from the prior year's methodologies.
PricewaterhouseCoopers LLP (PwC), independent registered public accounting firm and auditor to Fidelity and certain Fidelity funds, has been engaged annually by the Board as part of the Board's assessment of Fidelity's profitability analysis. PwC's engagement includes the review and assessment of the methodologies used by Fidelity in determining the revenues and expenses attributable to Fidelity's mutual fund business, and completion of agreed-upon procedures in respect of the mathematical accuracy of fund profitability and its conformity to established allocation methodologies. After considering PwC's reports issued under the engagement and information provided by Fidelity, the Board concluded that while other allocation methods may also be reasonable, Fidelity's profitability methodologies are reasonable in all material respects.
The Board also reviewed Fidelity's non-fund businesses and fall-out benefits related to the mutual fund business as well as cases where Fidelity's affiliates may benefit from or be related to the fund's business.
Annual Report
Board Approval of Investment Advisory Contracts and
Management Fees - continued
The Board considered the costs of the services provided by and the profits realized by Fidelity in connection with the operation of the fund and was satisfied that the profitability was not excessive in the circumstances.
Economies of Scale. The Board considered whether there have been economies of scale in respect of the management of the Fidelity funds, whether the Fidelity funds (including the fund) have appropriately benefited from any such economies of scale, and whether there is potential for realization of any further economies of scale. The Board considered the extent to which the fund will benefit from economies of scale through increased services to the fund, through waivers or reimbursements, or through fee or expense ratio reductions. The Board also noted that in 2013, it and the boards of other Fidelity funds created an ad hoc committee (the Economies of Scale Committee) to analyze whether Fidelity attains economies of scale in respect of the management and servicing of the Fidelity funds, whether the Fidelity funds have appropriately benefited from such economies of scale, and whether there is potential for realization of any further economies of scale.
The Board recognized that the fund's management contract incorporates a "group fee" structure, which provides for lower group fee rates as total group assets increase, and for higher group fee rates as total group assets decrease (with "group assets" defined to include fund assets under FMR's management plus sector fund assets previously under FMR's management and currently managed by Fidelity SelectCo, LLC). FMR calculates the group fee rates based on a tiered asset "breakpoint" schedule that varies based on asset class. The Board considered that the group fee is designed to deliver the benefits of economies of scale to fund shareholders when total Fidelity fund assets increase, even if assets of any particular fund are unchanged or have declined, because some portion of Fidelity's costs are attributable to services provided to all Fidelity funds, and all funds benefit if those costs can be allocated among more assets. The Board concluded that, given the group fee structure, fund shareholders will benefit from lower management fees as group assets increase at the fund complex level, regardless of whether Fidelity achieves any such economies of scale.
The Board concluded, taking into account the analysis of the Economies of Scale Committee, that economies of scale, if any, are being appropriately shared between fund shareholders and Fidelity.
Additional Information Requested by the Board. In order to develop fully the factual basis for consideration of the Fidelity funds' Advisory Contracts, the Board requested and received additional information on certain topics, including: (i) fund performance trends and Fidelity's long-term strategies for certain funds; (ii) Fidelity's strategic marketing and product lineup goals; (iii) the methodology with respect to competitive fund data and peer group classifications; (iv) the arrangements with, and performance of, certain sub-advisers on behalf of the Fidelity funds, as well as certain proposed participating affiliate arrangements; (v) the realization of fall-out benefits in certain Fidelity business units; (vi) Fidelity's group fee structures, including the rationale for the individual fee rates of certain categories of funds and the definition of group assets; (vii) trends regarding industry use of performance fee structures and the performance adjustment methodologies applicable to the Fidelity funds; (viii) additional competitive analysis regarding the total expenses for certain classes; (ix) fund profitability methodology, including Fidelity's cost allocation methodology, and the impact of certain factors on fund profitability results; and (x) the process by which Fidelity determines sub-advisory fees for funds it advises.
Annual Report
Based on its evaluation of all of the conclusions noted above, and after considering all factors it believed relevant, the Board ultimately concluded that the advisory fee structures are fair and reasonable, and that the fund's Advisory Contracts should be renewed.
Annual Report
Investment Adviser
Fidelity Management & Research Company
Boston, MA
Investment Sub-Advisers
FMR Co., Inc.
Fidelity Management & Research
(U.K.) Inc.
Fidelity Management & Research
(Hong Kong) Limited
Fidelity Management & Research
(Japan) Limited
FIL Investment Advisors
FIL Investments (Japan) Limited
FIL Investment Advisors
(U.K.) Limited
General Distributor
Fidelity Distributors Corporation
Smithfield, RI
Transfer and Service Agents
Fidelity Investments Institutional Operations Company, Inc.
Boston, MA
Fidelity Service Company, Inc.
Boston, MA
Custodian
State Street Bank & Trust Company
Quincy, MA
(Fidelity Investment logo)(registered trademark)
ATIEI-UANN-1214
1.853356.106
Fidelity®
Total International Equity
Fund
Annual Report
October 31, 2014
(Fidelity Cover Art)
Contents
Performance | (Click Here) | How the fund has done over time. |
Management's Discussion of Fund Performance | (Click Here) | The Portfolio Manager's review of fund performance and strategy. |
Shareholder Expense Example | (Click Here) | An example of shareholder expenses. |
Investment Changes | (Click Here) | A summary of major shifts in the fund's investments over the past six months. |
Investments | (Click Here) | A complete list of the fund's investments with their market values. |
Financial Statements | (Click Here) | Statements of assets and liabilities, operations, and changes in net assets, as well as financial highlights. |
Notes | (Click Here) | Notes to the financial statements. |
Report of Independent Registered Public Accounting Firm | (Click Here) | |
Trustees and Officers | (Click Here) | |
Distributions | (Click Here) | |
Board Approval of Investment Advisory Contracts and Management Fees | (Click Here) | |
To view a fund's proxy voting guidelines and proxy voting record for the 12-month period ended June 30, visit http://www.fidelity.com/proxyvotingresults or visit the Securities and Exchange Commission's (SEC) web site at http://www.sec.gov. You may also call 1-800-544-8544 to request a free copy of the proxy voting guidelines.
Standard & Poor's, S&P and S&P 500 are registered service marks of The McGraw-Hill Companies, Inc. and have been licensed for use by Fidelity Distributors Corporation.
Other third-party marks appearing herein are the property of their respective owners.
All other marks appearing herein are registered or unregistered trademarks or service marks of FMR LLC or an affiliated company. © 2014 FMR LLC. All rights reserved.
Annual Report
This report and the financial statements contained herein are submitted for the general information of the shareholders of the fund. This report is not authorized for distribution to prospective investors in the fund unless preceded or accompanied by an effective prospectus.
A fund files its complete schedule of portfolio holdings with the SEC for the first and third quarters of each fiscal year on Form N-Q. Forms N-Q are available on the SEC's web site at http://www.sec.gov. A fund's Forms N-Q may be reviewed and copied at the SEC's Public Reference Room in Washington, DC. Information regarding the operation of the SEC's Public Reference Room may be obtained by calling 1-800-SEC-0330. For a complete list of a fund's portfolio holdings, view the most recent holdings listing, semiannual report, or annual report on Fidelity's web site at http://www.fidelity.com, http://www.advisor.fidelity.com, or http://www.401k.com, as applicable.
NOT FDIC INSURED • MAY LOSE VALUE • NO BANK GUARANTEE
Neither the fund nor Fidelity Distributors Corporation is a bank.
Annual Report
Average annual total return reflects the change in the value of an investment, assuming reinvestment of the class' distributions from dividend income and capital gains (the profits earned upon the sale of securities that have grown in value, if any) and assuming a constant rate of performance each year. The $10,000 table and the fund's returns do not reflect the deduction of taxes that a shareholder would pay on fund distributions or the redemption of fund shares. During periods of reimbursement by Fidelity, a fund's total return will be greater than it would be had the reimbursement not occurred. How a fund did yesterday is no guarantee of how it will do tomorrow.
Average Annual Total Returns
Periods ended October 31, 2014 | Past 1
year | Past 5
years | Life of
fund A |
Fidelity® Total International Equity Fund | 0.55% | 7.47% | -0.80% |
A From November 1, 2007.
$10,000 Over Life of Fund
Let's say hypothetically that $10,000 was invested in Fidelity® Total International Equity Fund, a class of the fund, on November 1, 2007, when the fund started. The chart shows how the value of your investment would have changed, and also shows how the MSCI ACWI (All Country World Index) ex USA Index performed over the same period.
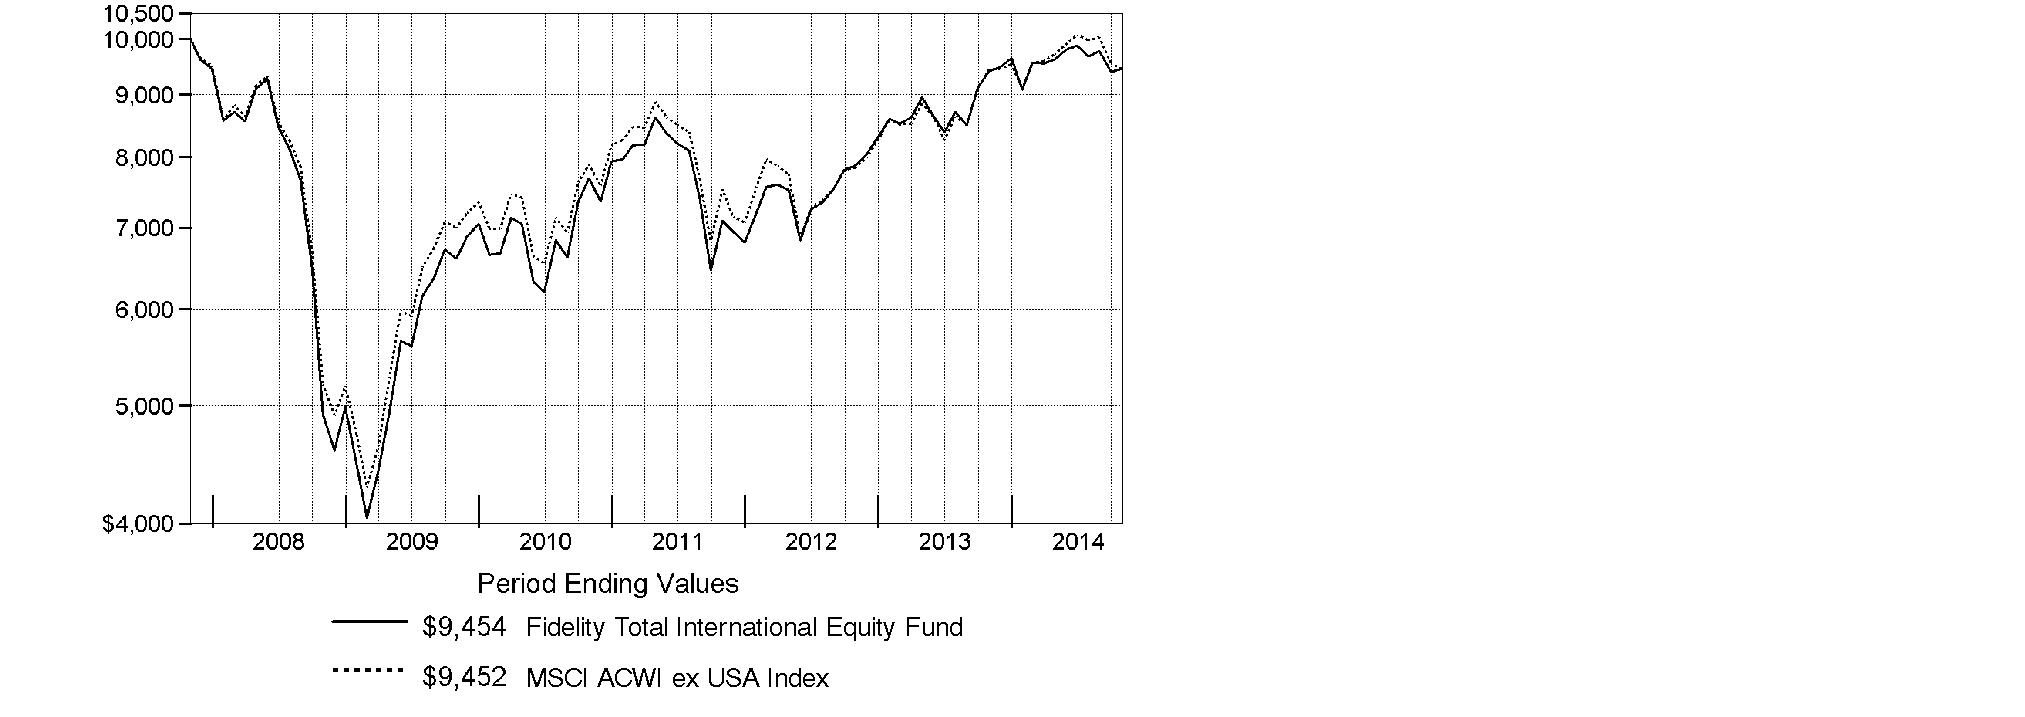
Annual Report
Market Recap: Global equities posted a healthy gain for the 12 months ending October 31, 2014, overcoming an October market decline driven by recessionary pressures in China and tepid growth in Europe. The MSCI ACWI (All Country World Index) Index rose 8.15%, helped by subdued market volatility for much of the period and supported by solid corporate earnings, especially in the United States. Stocks also benefited from easy monetary policies in Japan and the eurozone, as well as increased stimulus efforts in China. All but three of the 24 industry groups that compose the index marked a positive return. The U.S. (+17%) remained a pillar of strength, while a strongly rising dollar in the latter part of the period detracted from investors' returns in most non-U.S. markets. Canada (+5%) notched broad gains outside of its energy and materials sectors, as did Asia-Pacific ex Japan (+4%), led by investor enthusiasm for companies in India. The U.K., Europe and Japan, meanwhile, all underperformed. Among sectors, health care (+24%) led the index, with a strong contribution from the pharmaceuticals, biotechnology & life sciences industry. Information technology (+21%) also outperformed. Conversely, materials (-4%) and energy (-1%) lagged the index due to a higher supply of and lower demand for commodities.
Comments from Alexander Zavratsky, Co-Portfolio Manager of Fidelity® Total International Equity Fund: For the year, the fund's Retail Class shares gained 0.55%, compared with an advance of 0.18% for the MSCI ACWI (All Country World Index) ex USA Index. The fund benefited the most from its out-of-index investments in the U.S. Favorable positioning in the U.K. and India also helped. On the negative side, the fund lost ground in Hong Kong, while a significant underweighting in outperforming Canada further detracted. On an individual basis, U.K.-based hotel company InterContinental Hotel Group was the fund's top relative contributor. A stake in Japan-based Astellas Pharma helped, due in part to the firm's September announcement that the U.S. government had approved expanded use of its Xtandi® cancer drug. Selling our holdings in U.K.-based food retailer Tesco in the first half of the year also helped, as sliding sales and a loss in market share steadily eroded its stock price. In contrast, one notable laggard was Andritz, an Austrian industrial engineering firm that saw its stock return -21%. Another performance challenge was the fund's overweighting, on average, in Japanese bank holding company Sumitomo Mitsui Financial Group, about which we became more bearish and ultimately sold the stock during the period.
Note to shareholders: Sammy Simnegar became a Co-Manager on June 21, 2014, succeeding Ashish Swarup.
The views expressed above reflect those of the portfolio manager(s) only through the end of the period as stated on the cover of this report and do not necessarily represent the views of Fidelity or any other person in the Fidelity organization. Any such views are subject to change at any time based upon market or other conditions and Fidelity disclaims any responsibility to update such views. These views may not be relied on as investment advice and, because investment decisions for a Fidelity fund are based on numerous factors, may not be relied on as an indication of trading intent on behalf of any Fidelity fund.
Annual Report
Shareholder Expense Example
As a shareholder of the Fund, you incur two types of costs: (1) transaction costs, including sales charges (loads) on purchase payments or redemption proceeds, redemption fees and (2) ongoing costs, including management fees, distribution and/or service (12b-1) fees and other Fund expenses. This Example is intended to help you understand your ongoing costs (in dollars) of investing in the Fund and to compare these costs with the ongoing costs of investing in other mutual funds.
The Example is based on an investment of $1,000 invested at the beginning of the period and held for the entire period (May 1, 2014 to October 31, 2014).
Actual Expenses
The first line of the accompanying table for each class of the Fund provides information about actual account values and actual expenses. You may use the information in this line, together with the amount you invested, to estimate the expenses that you paid over the period. Simply divide your account value by $1,000.00 (for example, an $8,600 account value divided by $1,000.00 = 8.6), then multiply the result by the number in the first line for a class of the Fund under the heading entitled "Expenses Paid During Period" to estimate the expenses you paid on your account during this period. A small balance maintenance fee of $12.00 that is charged once a year may apply for certain accounts with a value of less than $2,000. This fee is not included in the table below. If it was, the estimate of expenses you paid during the period would be higher, and your ending account value lower, by this amount. In addition, the Fund, as a shareholder in the underlying Fidelity Central Funds, will indirectly bear its pro-rata share of the fees and expenses incurred by the underlying Fidelity Central Funds. These fees and expenses are not included in the Fund's annualized expense ratio used to calculate the expense estimate in the table below.
Hypothetical Example for Comparison Purposes
The second line of the accompanying table for each class of the Fund provides information about hypothetical account values and hypothetical expenses based on a Class' actual expense ratio and an assumed rate of return of 5% per year before expenses, which is not the Class' actual return. The hypothetical account values and expenses may not be used to estimate the actual ending account balance or expenses you paid for the period. You may use this information to compare the ongoing costs of investing in the Fund and other funds. To do so, compare this 5% hypothetical example with the 5% hypothetical examples that appear in the shareholder reports of the other funds. A small balance maintenance fee of $12.00 that is charged once a year may apply for certain accounts with a value of less than $2,000. This fee is not included in the table below. If it was, the estimate of expenses you paid during the period would be higher, and your ending account value lower, by this amount. In addition, the Fund, as a shareholder in the underlying Fidelity Central Funds, will indirectly bear its pro-rata share of the fees and expenses incurred by the underlying Fidelity Central Funds. These fees and expenses are not included in the Fund's annualized expense ratio used to calculate the expense estimate in the table below.
Please note that the expenses shown in the table are meant to highlight your ongoing costs only and do not reflect any transaction costs. Therefore, the second line of the table is useful in comparing ongoing costs only, and will not help you determine the relative total costs of owning different funds. In addition, if these transactional costs were included, your costs would have been higher.
Annual Report
Shareholder Expense Example - continued
| Annualized
Expense RatioB | Beginning
Account Value
May 1, 2014 | Ending
Account Value
October 31, 2014 | Expenses Paid
During Period*
May 1, 2014 to
October 31, 2014 |
Class A | 1.44% | | | |
Actual | | $ 1,000.00 | $ 980.40 | $ 7.19 |
HypotheticalA | | $ 1,000.00 | $ 1,017.95 | $ 7.32 |
Class T | 1.69% | | | |
Actual | | $ 1,000.00 | $ 980.50 | $ 8.44 |
HypotheticalA | | $ 1,000.00 | $ 1,016.69 | $ 8.59 |
Class B | 2.20% | | | |
Actual | | $ 1,000.00 | $ 976.90 | $ 10.96 |
HypotheticalA | | $ 1,000.00 | $ 1,014.12 | $ 11.17 |
Class C | 2.20% | | | |
Actual | | $ 1,000.00 | $ 978.00 | $ 10.97 |
HypotheticalA | | $ 1,000.00 | $ 1,014.12 | $ 11.17 |
Total International Equity | 1.04% | | | |
Actual | | $ 1,000.00 | $ 982.90 | $ 5.20 |
HypotheticalA | | $ 1,000.00 | $ 1,019.96 | $ 5.30 |
Institutional Class | 1.15% | | | |
Actual | | $ 1,000.00 | $ 981.60 | $ 5.74 |
HypotheticalA | | $ 1,000.00 | $ 1,019.41 | $ 5.85 |
A 5% return per year before expenses
B Annualized expense ratio reflects expenses net of applicable fee waivers.
* Expenses are equal to each Class' annualized expense ratio, multiplied by the average account value over the period, multiplied by 184/365 (to reflect the one-half year period).
Annual Report
Investment Changes (Unaudited)
Geographic Diversification (% of fund's net assets) |
As of October 31, 2014 |
 | United Kingdom 15.9% | |
 | Japan 13.5% | |
 | United States of America* 9.4% | |
 | Switzerland 7.8% | |
 | France 6.4% | |
 | Germany 4.9% | |
 | Australia 3.8% | |
 | Sweden 3.2% | |
 | India 2.8% | |
 | Other 32.3% | |

Percentages are based on country or territory of incorporation and are adjusted for the effect of futures contracts, if applicable. |
* Includes Short-Term Investments and Net Other Assets (Liabilities). |
As of April 30, 2014 |
| United Kingdom 15.7% | |
| Japan 12.4% | |
| United States of America* 9.7% | |
| Switzerland 8.2% | |
| France 7.5% | |
| Germany 4.7% | |
| India 4.2% | |
| Korea (South) 3.8% | |
| Sweden 3.4% | |
| Other 30.4% | |

Percentages are based on country or territory of incorporation and are adjusted for the effect of futures contracts, if applicable. |
* Includes Short-Term Investments and Net Other Assets (Liabilities). |
Asset Allocation as of October 31, 2014 |
| % of fund's
net assets | % of fund's net assets
6 months ago |
Stocks | 98.7 | 97.0 |
Short-Term Investments and Net Other Assets (Liabilities) | 1.3 | 3.0 |
Top Ten Stocks as of October 31, 2014 |
| % of fund's
net assets | % of fund's net assets
6 months ago |
Nestle SA (Switzerland, Food Products) | 2.2 | 2.2 |
Roche Holding AG (participation certificate) (Switzerland, Pharmaceuticals) | 1.9 | 1.7 |
Novartis AG (Switzerland, Pharmaceuticals) | 1.7 | 1.4 |
Prudential PLC (United Kingdom, Insurance) | 1.5 | 1.4 |
Anheuser-Busch InBev SA NV (Belgium, Beverages) | 1.3 | 1.7 |
Total SA (France, Oil, Gas & Consumable Fuels) | 1.2 | 1.8 |
Bayer AG (Germany, Pharmaceuticals) | 1.2 | 0.9 |
ING Groep NV (Certificaten Van Aandelen) (Netherlands, Banks) | 1.0 | 0.9 |
Samsung Electronics Co. Ltd. (Korea (South), Technology Hardware, Storage & Peripherals) | 1.0 | 0.0 |
HSBC Holdings PLC sponsored ADR (United Kingdom, Banks) | 1.0 | 0.8 |
| 14.0 | |
Market Sectors as of October 31, 2014 |
| % of fund's
net assets | % of fund's net assets
6 months ago |
Financials | 21.0 | 20.0 |
Consumer Discretionary | 14.5 | 13.4 |
Health Care | 13.2 | 12.0 |
Industrials | 12.7 | 12.3 |
Consumer Staples | 10.9 | 12.7 |
Information Technology | 10.6 | 8.0 |
Materials | 6.0 | 6.2 |
Telecommunication Services | 4.1 | 6.0 |
Energy | 4.1 | 3.5 |
Utilities | 1.6 | 2.9 |
Annual Report
Investments October 31, 2014
Showing Percentage of Net Assets
Common Stocks - 97.1% |
| Shares | | Value |
Australia - 3.8% |
Ansell Ltd. | 36,338 | | $ 637,392 |
Australia & New Zealand Banking Group Ltd. | 71,673 | | 2,120,846 |
Carsales.com Ltd. | 36,462 | | 344,069 |
CSL Ltd. | 42,674 | | 3,012,909 |
DuluxGroup Ltd. | 11,047 | | 52,207 |
Imdex Ltd. (a) | 42,463 | | 22,484 |
RCG Corp. Ltd. | 76,989 | | 41,646 |
SEEK Ltd. | 21,138 | | 310,198 |
Sydney Airport unit | 279,741 | | 1,087,559 |
Telstra Corp. Ltd. | 150,660 | | 749,708 |
TFS Corp. Ltd. | 42,449 | | 58,836 |
Transurban Group unit | 247,376 | | 1,771,684 |
Westpac Banking Corp. | 98,983 | | 3,038,211 |
TOTAL AUSTRALIA | | 13,247,749 |
Austria - 0.4% |
Andritz AG | 29,961 | | 1,446,258 |
Zumtobel AG | 3,400 | | 59,927 |
TOTAL AUSTRIA | | 1,506,185 |
Bailiwick of Jersey - 0.9% |
Shire PLC | 32,580 | | 2,186,018 |
Wolseley PLC | 12,722 | | 675,055 |
WPP PLC | 13,800 | | 269,551 |
TOTAL BAILIWICK OF JERSEY | | 3,130,624 |
Belgium - 2.1% |
Anheuser-Busch InBev SA NV | 41,971 | | 4,654,349 |
Gimv NV | 1,319 | | 59,918 |
KBC Ancora (a) | 4,181 | | 120,952 |
KBC Groupe SA (a) | 38,317 | | 2,052,725 |
UCB SA | 5,288 | | 426,690 |
TOTAL BELGIUM | | 7,314,634 |
Bermuda - 0.8% |
Brilliance China Automotive Holdings Ltd. | 218,000 | | 376,980 |
China Gas Holdings Ltd. | 218,000 | | 389,758 |
China Resources Gas Group Ltd. | 126,000 | | 360,169 |
Credicorp Ltd. (United States) | 3,700 | | 595,700 |
Lazard Ltd. Class A | 15,500 | | 762,755 |
Petra Diamonds Ltd. (a) | 19,900 | | 52,844 |
Common Stocks - continued |
| Shares | | Value |
Bermuda - continued |
Travelport Worldwide Ltd. | 13,500 | | $ 195,075 |
Vostok Nafta Investment Ltd. SDR (a) | 7,560 | | 48,426 |
TOTAL BERMUDA | | 2,781,707 |
Brazil - 1.5% |
Arezzo Industria e Comercio SA | 3,500 | | 40,538 |
BB Seguridade Participacoes SA | 40,200 | | 536,346 |
CCR SA | 68,300 | | 508,550 |
Cetip SA - Mercados Organizado | 24,800 | | 314,266 |
Cielo SA | 37,700 | | 619,078 |
Estacio Participacoes SA | 42,300 | | 489,935 |
Iguatemi Empresa de Shopping Centers SA | 28,500 | | 288,692 |
Kroton Educacional SA | 82,200 | | 585,840 |
Linx SA | 11,700 | | 243,075 |
Qualicorp SA (a) | 38,100 | | 387,473 |
Smiles SA | 18,600 | | 321,272 |
T4F Entretenimento SA (a) | 10,200 | | 11,526 |
Ultrapar Participacoes SA | 22,800 | | 497,332 |
Weg SA | 34,700 | | 409,331 |
TOTAL BRAZIL | | 5,253,254 |
British Virgin Islands - 0.1% |
Gem Diamonds Ltd. (a) | 23,773 | | 59,041 |
Mail.Ru Group Ltd. GDR (a)(e) | 13,900 | | 336,936 |
TOTAL BRITISH VIRGIN ISLANDS | | 395,977 |
Canada - 0.8% |
Canadian Pacific Railway Ltd. | 4,766 | | 991,343 |
Imperial Oil Ltd. | 14,900 | | 716,940 |
Pason Systems, Inc. | 5,600 | | 134,006 |
Potash Corp. of Saskatchewan, Inc. | 20,800 | | 709,974 |
ShawCor Ltd. Class A | 2,000 | | 88,106 |
TOTAL CANADA | | 2,640,369 |
Cayman Islands - 2.5% |
51job, Inc. sponsored ADR (a) | 1,100 | | 33,770 |
58.com, Inc. ADR | 900 | | 35,613 |
Alibaba Group Holding Ltd. sponsored ADR | 4,900 | | 483,140 |
Autohome, Inc. ADR Class A | 5,800 | | 306,762 |
Baidu.com, Inc. sponsored ADR (a) | 2,100 | | 501,417 |
Bitauto Holdings Ltd. ADR (a) | 3,800 | | 318,136 |
Haitian International Holdings Ltd. | 146,000 | | 313,181 |
Melco Crown Entertainment Ltd. sponsored ADR | 13,900 | | 377,246 |
Common Stocks - continued |
| Shares | | Value |
Cayman Islands - continued |
Sands China Ltd. | 319,200 | | $ 1,990,886 |
SouFun Holdings Ltd. ADR | 34,200 | | 333,450 |
Tencent Holdings Ltd. | 173,300 | | 2,785,325 |
Wynn Macau Ltd. | 374,800 | | 1,354,942 |
TOTAL CAYMAN ISLANDS | | 8,833,868 |
China - 0.3% |
China Pacific Insurance Group Co. Ltd. (H Shares) | 144,200 | | 539,619 |
PICC Property & Casualty Co. Ltd. (H Shares) | 226,000 | | 414,583 |
TOTAL CHINA | | 954,202 |
Colombia - 0.1% |
Grupo de Inversiones Suramerica SA | 19,997 | | 415,782 |
Denmark - 1.5% |
A.P. Moller - Maersk A/S Series B | 415 | | 967,017 |
Jyske Bank A/S (Reg.) (a) | 16,554 | | 891,873 |
Novo Nordisk A/S Series B sponsored ADR | 71,000 | | 3,207,780 |
Spar Nord Bank A/S | 13,331 | | 134,668 |
TOTAL DENMARK | | 5,201,338 |
Egypt - 0.1% |
Commercial International Bank SAE sponsored GDR | 58,000 | | 394,400 |
Finland - 0.6% |
Kone Oyj (B Shares) | 7,500 | | 322,373 |
Sampo Oyj (A Shares) | 28,753 | | 1,375,335 |
Tikkurila Oyj | 20,380 | | 420,886 |
TOTAL FINLAND | | 2,118,594 |
France - 6.4% |
Atos Origin SA | 13,703 | | 946,001 |
AXA SA | 60,106 | | 1,386,675 |
BNP Paribas SA | 31,354 | | 1,970,064 |
Bureau Veritas SA | 12,800 | | 316,476 |
Cap Gemini SA | 15,902 | | 1,045,401 |
Coface SA | 3,500 | | 43,597 |
GDF Suez | 48,569 | | 1,178,027 |
Havas SA | 98,586 | | 796,853 |
Ingenico SA | 3,033 | | 302,050 |
Laurent-Perrier Group SA | 859 | | 68,893 |
LVMH Moet Hennessy - Louis Vuitton SA | 2,185 | | 370,606 |
Orange SA | 80,300 | | 1,278,406 |
Pernod Ricard SA | 2,500 | | 284,559 |
Common Stocks - continued |
| Shares | | Value |
France - continued |
Publicis Groupe SA (a) | 4,400 | | $ 304,751 |
Renault SA | 10,111 | | 750,480 |
Safran SA | 25,714 | | 1,627,287 |
Saft Groupe SA | 1,254 | | 37,243 |
Sanofi SA | 31,612 | | 2,868,476 |
Schneider Electric SA | 8,290 | | 653,236 |
Total SA | 70,715 | | 4,221,919 |
Vetoquinol SA | 1,500 | | 67,670 |
Virbac SA | 460 | | 102,867 |
Vivendi SA | 61,109 | | 1,491,371 |
Zodiac Aerospace | 9,900 | | 301,905 |
TOTAL FRANCE | | 22,414,813 |
Germany - 4.4% |
Allianz SE | 13,864 | | 2,204,683 |
alstria office REIT-AG | 2,900 | | 35,956 |
BASF AG | 24,471 | | 2,153,968 |
Bayer AG | 28,312 | | 4,025,113 |
CompuGroup Medical AG | 6,146 | | 140,944 |
Continental AG | 3,983 | | 781,887 |
CTS Eventim AG | 7,966 | | 210,034 |
Fielmann AG | 2,158 | | 140,705 |
Fresenius SE & Co. KGaA | 18,300 | | 941,385 |
GEA Group AG | 16,708 | | 768,306 |
Linde AG | 18,149 | | 3,346,694 |
Siemens AG | 4,547 | | 512,872 |
TOTAL GERMANY | | 15,262,547 |
Greece - 0.2% |
Folli Follie SA | 11,900 | | 389,216 |
Greek Organization of Football Prognostics SA | 29,900 | | 362,327 |
Titan Cement Co. SA (Reg.) | 4,344 | | 96,299 |
TOTAL GREECE | | 847,842 |
Hong Kong - 0.2% |
AIA Group Ltd. | 59,200 | | 330,361 |
Galaxy Entertainment Group Ltd. | 62,000 | | 423,950 |
TOTAL HONG KONG | | 754,311 |
India - 2.8% |
Apollo Hospitals Enterprise Ltd. (a) | 15,570 | | 282,558 |
Asian Paints India Ltd. | 30,401 | | 324,794 |
Axis Bank Ltd. (a) | 52,112 | | 384,077 |
Common Stocks - continued |
| Shares | | Value |
India - continued |
Exide Industries Ltd. | 107,368 | | $ 275,273 |
Grasim Industries Ltd. | 5,109 | | 306,582 |
Havells India Ltd. | 76,303 | | 354,870 |
HCL Technologies Ltd. | 17,231 | | 451,903 |
HDFC Bank Ltd. | 33,095 | | 536,647 |
Housing Development Finance Corp. Ltd. | 79,086 | | 1,424,279 |
ICICI Bank Ltd. (a) | 17,048 | | 452,744 |
ITC Ltd. (a) | 105,347 | | 609,107 |
Jyothy Laboratories Ltd. (a) | 16,584 | | 67,645 |
Larsen & Toubro Ltd. (a) | 21,630 | | 582,912 |
LIC Housing Finance Ltd. | 60,567 | | 356,663 |
Lupin Ltd. | 15,749 | | 364,643 |
Mahindra & Mahindra Ltd. (a) | 20,039 | | 426,065 |
Motherson Sumi Systems Ltd. | 40,123 | | 274,716 |
Sun Pharmaceutical Industries Ltd. | 38,990 | | 536,574 |
Sun TV Ltd. | 66,511 | | 353,725 |
Tata Consultancy Services Ltd. | 16,606 | | 706,544 |
Tata Motors Ltd. (a) | 54,875 | | 479,423 |
Titan Co. Ltd. (a) | 58,658 | | 385,323 |
TOTAL INDIA | | 9,937,067 |
Indonesia - 1.4% |
PT ACE Hardware Indonesia Tbk | 4,495,200 | | 301,708 |
PT Astra International Tbk | 1,051,800 | | 589,756 |
PT Bank Central Asia Tbk | 634,800 | | 685,293 |
PT Bank Rakyat Indonesia Tbk | 638,600 | | 585,211 |
PT Global Mediacom Tbk | 2,698,800 | | 438,017 |
PT Indocement Tunggal Prakarsa Tbk | 208,900 | | 414,037 |
PT Jasa Marga Tbk | 697,200 | | 366,556 |
PT Media Nusantara Citra Tbk | 1,468,800 | | 340,512 |
PT Semen Gresik (Persero) Tbk | 330,800 | | 434,523 |
PT Surya Citra Media Tbk | 1,114,500 | | 311,970 |
PT Tower Bersama Infrastructure Tbk | 500,800 | | 368,887 |
TOTAL INDONESIA | | 4,836,470 |
Ireland - 1.2% |
Actavis PLC (a) | 4,600 | | 1,116,604 |
CRH PLC sponsored ADR | 61,429 | | 1,376,624 |
FBD Holdings PLC | 5,372 | | 90,881 |
Common Stocks - continued |
| Shares | | Value |
Ireland - continued |
James Hardie Industries PLC: | | | |
CDI | 15,656 | | $ 166,997 |
sponsored ADR | 29,355 | | 1,565,502 |
TOTAL IRELAND | | 4,316,608 |
Israel - 0.6% |
Azrieli Group | 13,296 | | 426,821 |
Ituran Location & Control Ltd. | 1,761 | | 36,083 |
Sarine Technologies Ltd. | 39,000 | | 90,445 |
Strauss Group Ltd. | 4,359 | | 70,309 |
Teva Pharmaceutical Industries Ltd. sponsored ADR | 27,109 | | 1,530,845 |
TOTAL ISRAEL | | 2,154,503 |
Italy - 0.8% |
Azimut Holding SpA | 25,814 | | 602,982 |
Beni Stabili SpA SIIQ | 222,926 | | 153,508 |
Interpump Group SpA | 51,891 | | 676,283 |
Intesa Sanpaolo SpA | 305,700 | | 898,684 |
Telecom Italia SpA (a) | 550,300 | | 623,645 |
TOTAL ITALY | | 2,955,102 |
Japan - 13.5% |
Air Water, Inc. | 3,000 | | 47,821 |
Aozora Bank Ltd. | 215,000 | | 755,705 |
Artnature, Inc. | 8,000 | | 108,188 |
Asahi Co. Ltd. | 4,800 | | 53,370 |
Astellas Pharma, Inc. | 195,000 | | 3,026,497 |
Autobacs Seven Co. Ltd. | 4,400 | | 64,547 |
Azbil Corp. | 4,700 | | 113,343 |
Broadleaf Co. Ltd. | 3,200 | | 50,576 |
Coca-Cola Central Japan Co. Ltd. | 30,700 | | 552,387 |
Cosmos Pharmaceutical Corp. | 700 | | 100,085 |
Daiichikosho Co. Ltd. | 1,600 | | 40,378 |
Daikokutenbussan Co. Ltd. | 5,000 | | 145,488 |
DENSO Corp. | 74,700 | | 3,423,772 |
Dentsu, Inc. | 19,400 | | 721,283 |
East Japan Railway Co. | 21,300 | | 1,663,599 |
Fanuc Corp. | 7,300 | | 1,286,521 |
Fast Retailing Co. Ltd. | 3,900 | | 1,449,854 |
Fujitsu Ltd. | 97,000 | | 589,708 |
Glory Ltd. | 2,100 | | 54,116 |
Goldcrest Co. Ltd. | 6,860 | | 124,110 |
Harmonic Drive Systems, Inc. | 6,000 | | 77,459 |
Common Stocks - continued |
| Shares | | Value |
Japan - continued |
Hitachi Ltd. | 154,000 | | $ 1,210,051 |
Hoya Corp. | 34,500 | | 1,220,846 |
Itochu Corp. | 135,300 | | 1,635,580 |
Iwatsuka Confectionary Co. Ltd. | 1,400 | | 75,625 |
Japan Tobacco, Inc. | 75,600 | | 2,579,401 |
KDDI Corp. | 20,400 | | 1,339,657 |
Keyence Corp. | 6,121 | | 2,966,131 |
Kobayashi Pharmaceutical Co. Ltd. | 1,500 | | 92,590 |
Koshidaka Holdings Co. Ltd. | 4,000 | | 68,304 |
Kyoto Kimono Yuzen Co. Ltd. | 2,600 | | 23,428 |
Lasertec Corp. | 4,500 | | 56,303 |
Medikit Co. Ltd. | 1,500 | | 46,739 |
Meiko Network Japan Co. Ltd. | 2,700 | | 30,360 |
Miraial Co. Ltd. | 2,400 | | 36,953 |
Mitsubishi Electric Corp. | 60,000 | | 773,628 |
Mitsubishi UFJ Financial Group, Inc. | 488,100 | | 2,845,240 |
Mitsui Fudosan Co. Ltd. | 63,000 | | 2,026,486 |
Nabtesco Corp. | 3,800 | | 91,962 |
Nagaileben Co. Ltd. | 6,100 | | 117,248 |
ND Software Co. Ltd. | 3,000 | | 53,760 |
Nihon M&A Center, Inc. | 1,500 | | 43,109 |
Nihon Parkerizing Co. Ltd. | 7,000 | | 167,088 |
Nippon Seiki Co. Ltd. | 3,000 | | 63,909 |
Nippon Telegraph & Telephone Corp. | 21,500 | | 1,337,705 |
NS Tool Co. Ltd. | 3,800 | | 43,645 |
OBIC Co. Ltd. | 4,000 | | 142,796 |
OMRON Corp. | 16,900 | | 799,956 |
ORIX Corp. | 62,000 | | 860,575 |
OSG Corp. | 12,400 | | 202,197 |
Paramount Bed Holdings Co. Ltd. | 1,300 | | 36,975 |
San-Ai Oil Co. Ltd. | 8,000 | | 55,377 |
Seven & i Holdings Co., Ltd. | 34,700 | | 1,355,248 |
Seven Bank Ltd. | 423,000 | | 1,766,618 |
SHO-BOND Holdings Co. Ltd. | 22,700 | | 877,134 |
Shoei Co. Ltd. | 5,900 | | 90,165 |
SK Kaken Co. Ltd. | 1,000 | | 76,533 |
SoftBank Corp. | 7,500 | | 545,996 |
Software Service, Inc. | 1,600 | | 60,932 |
Sony Financial Holdings, Inc. | 43,700 | | 697,658 |
Sumitomo Mitsui Trust Holdings, Inc. | 272,920 | | 1,114,257 |
Techno Medica Co. Ltd. | 1,800 | | 38,980 |
TFP Consulting Group Co. Ltd. | 2,000 | | 58,346 |
Common Stocks - continued |
| Shares | | Value |
Japan - continued |
The Nippon Synthetic Chemical Industry Co. Ltd. | 10,000 | | $ 61,056 |
TKC Corp. | 3,000 | | 58,894 |
Tocalo Co. Ltd. | 2,800 | | 52,819 |
Toyota Motor Corp. | 31,700 | | 1,907,618 |
Tsutsumi Jewelry Co. Ltd. | 2,000 | | 49,193 |
USS Co. Ltd. | 128,500 | | 2,022,333 |
Workman Co. Ltd. | 2,000 | | 104,531 |
Yamato Kogyo Co. Ltd. | 23,400 | | 758,043 |
TOTAL JAPAN | | 47,188,785 |
Kenya - 0.4% |
East African Breweries Ltd. | 96,600 | | 307,781 |
Kenya Commercial Bank Ltd. | 481,600 | | 296,121 |
Safaricom Ltd. | 6,274,300 | | 855,746 |
TOTAL KENYA | | 1,459,648 |
Korea (South) - 1.7% |
Bgf Retail (a) | 1,204 | | 76,199 |
Coway Co. Ltd. | 7,564 | | 574,457 |
KEPCO Plant Service & Engineering Co. Ltd. | 3,828 | | 312,455 |
Leeno Industrial, Inc. | 1,964 | | 77,778 |
NAVER Corp. | 1,947 | | 1,366,322 |
Samsung Electronics Co. Ltd. | 3,127 | | 3,620,463 |
TOTAL KOREA (SOUTH) | | 6,027,674 |
Luxembourg - 0.2% |
RTL Group SA | 6,227 | | 578,698 |
Samsonite International SA | 79,100 | | 262,828 |
TOTAL LUXEMBOURG | | 841,526 |
Malaysia - 0.3% |
Astro Malaysia Holdings Bhd | 337,500 | | 338,595 |
Public Bank Bhd | 94,100 | | 530,305 |
Tune Insurance Holdings Bhd | 441,000 | | 290,939 |
TOTAL MALAYSIA | | 1,159,839 |
Malta - 0.1% |
Brait SA | 51,016 | | 383,346 |
Mexico - 1.6% |
Banregio Grupo Financiero S.A.B. de CV | 56,700 | | 327,916 |
Consorcio ARA S.A.B. de CV (a) | 230,655 | | 106,196 |
Fomento Economico Mexicano S.A.B. de CV: | | | |
unit | 68,500 | | 658,841 |
Common Stocks - continued |
| Shares | | Value |
Mexico - continued |
Fomento Economico Mexicano S.A.B. de CV: - continued | | | |
sponsored ADR | 5,833 | | $ 561,368 |
Grupo Aeroportuario del Pacifico SA de CV Series B | 51,900 | | 353,111 |
Grupo Aeroportuario del Sureste SA de CV Series B | 32,100 | | 429,120 |
Grupo Aeroportuario Norte S.A.B. de CV | 66,000 | | 328,818 |
Grupo Financiero Banorte S.A.B. de CV Series O | 104,300 | | 669,116 |
Grupo Mexico SA de CV Series B | 153,100 | | 526,051 |
Grupo Televisa SA de CV | 98,400 | | 711,133 |
Megacable Holdings S.A.B. de CV unit | 71,300 | | 326,631 |
Promotora y Operadora de Infraestructura S.A.B. de CV (a) | 27,600 | | 350,620 |
Qualitas Controladora S.A.B. de CV | 101,200 | | 261,750 |
TOTAL MEXICO | | 5,610,671 |
Netherlands - 1.6% |
Aalberts Industries NV | 7,600 | | 202,336 |
ASM International NV (depositary receipt) | 1,050 | | 34,367 |
Heijmans NV (Certificaten Van Aandelen) | 8,481 | | 115,207 |
ING Groep NV (Certificaten Van Aandelen) (a) | 253,023 | | 3,623,381 |
Reed Elsevier NV | 69,904 | | 1,608,778 |
VastNed Retail NV | 3,438 | | 156,974 |
TOTAL NETHERLANDS | | 5,741,043 |
Nigeria - 0.3% |
Dangote Cement PLC | 262,417 | | 340,596 |
Guaranty Trust Bank PLC GDR (Reg. S) | 38,400 | | 295,680 |
Nigerian Breweries PLC | 277,569 | | 271,453 |
TOTAL NIGERIA | | 907,729 |
Norway - 0.3% |
Statoil ASA | 40,700 | | 931,437 |
Philippines - 0.7% |
Alliance Global Group, Inc. | 722,700 | | 406,490 |
GT Capital Holdings, Inc. | 16,525 | | 371,308 |
Jollibee Food Corp. | 14,560 | | 63,458 |
Metropolitan Bank & Trust Co. | 159,590 | | 292,820 |
Robinsons Retail Holdings, Inc. | 203,460 | | 289,559 |
SM Investments Corp. | 22,980 | | 400,441 |
SM Prime Holdings, Inc. | 1,147,600 | | 446,103 |
TOTAL PHILIPPINES | | 2,270,179 |
Common Stocks - continued |
| Shares | | Value |
Russia - 0.4% |
Magnit OJSC GDR (Reg. S) | 10,200 | | $ 683,400 |
NOVATEK OAO GDR (Reg. S) | 5,000 | | 537,000 |
TOTAL RUSSIA | | 1,220,400 |
Singapore - 0.3% |
Singapore Telecommunications Ltd. | 325,000 | | 956,565 |
South Africa - 2.7% |
Alexander Forbes Group Holding (a) | 440,894 | | 343,769 |
Aspen Pharmacare Holdings Ltd. | 18,700 | | 667,044 |
Bidvest Group Ltd. | 20,332 | | 559,226 |
Clicks Group Ltd. | 126,095 | | 858,563 |
Coronation Fund Managers Ltd. | 35,200 | | 304,776 |
FirstRand Ltd. | 131,700 | | 563,588 |
Life Healthcare Group Holdings Ltd. | 93,500 | | 353,494 |
Mr Price Group Ltd. | 21,800 | | 450,932 |
MTN Group Ltd. | 69,800 | | 1,544,115 |
Nampak Ltd. | 122,830 | | 500,797 |
Naspers Ltd. Class N | 17,300 | | 2,152,966 |
Remgro Ltd. | 21,400 | | 490,834 |
Sanlam Ltd. | 78,100 | | 493,181 |
TOTAL SOUTH AFRICA | | 9,283,285 |
Spain - 2.0% |
Amadeus IT Holding SA Class A | 29,964 | | 1,100,197 |
Banco Bilbao Vizcaya Argentaria SA | 136,679 | | 1,528,739 |
Iberdrola SA | 212,300 | | 1,500,753 |
Inditex SA | 84,310 | | 2,368,214 |
Prosegur Compania de Seguridad SA (Reg.) | 83,576 | | 490,152 |
TOTAL SPAIN | | 6,988,055 |
Sweden - 3.2% |
ASSA ABLOY AB (B Shares) | 38,500 | | 2,039,145 |
Atlas Copco AB (A Shares) | 57,159 | | 1,649,558 |
Fagerhult AB | 46,655 | | 859,284 |
H&M Hennes & Mauritz AB (B Shares) | 37,639 | | 1,497,068 |
Intrum Justitia AB | 24,563 | | 729,823 |
Meda AB (A Shares) | 38,100 | | 500,491 |
Nordea Bank AB | 137,267 | | 1,760,417 |
Svenska Cellulosa AB (SCA) (B Shares) | 24,726 | | 552,841 |
Svenska Handelsbanken AB (A Shares) | 30,315 | | 1,445,517 |
TOTAL SWEDEN | | 11,034,144 |
Common Stocks - continued |
| Shares | | Value |
Switzerland - 7.8% |
Compagnie Financiere Richemont SA Series A | 4,451 | | $ 374,483 |
Credit Suisse Group AG | 49,298 | | 1,313,486 |
Nestle SA | 103,458 | | 7,586,996 |
Novartis AG | 64,870 | | 6,020,122 |
Roche Holding AG (participation certificate) | 22,895 | | 6,756,352 |
Schindler Holding AG: | | | |
(participation certificate) | 6,511 | | 909,503 |
(Reg.) | 2,251 | | 304,610 |
SGS SA (Reg.) | 150 | | 329,263 |
Syngenta AG (Switzerland) | 1,602 | | 495,431 |
UBS AG (NY Shares) | 188,297 | | 3,272,602 |
TOTAL SWITZERLAND | | 27,362,848 |
Taiwan - 1.2% |
Addcn Technology Co. Ltd. | 4,000 | | 38,469 |
Delta Electronics, Inc. | 95,000 | | 569,035 |
Giant Manufacturing Co. Ltd. | 41,000 | | 331,458 |
Merida Industry Co. Ltd. | 49,500 | | 341,395 |
Taiwan Semiconductor Manufacturing Co. Ltd. | 661,035 | | 2,861,034 |
TOTAL TAIWAN | | 4,141,391 |
Thailand - 0.5% |
Airports of Thailand PCL (For. Reg.) | 57,700 | | 428,613 |
Bangkok Dusit Medical Services PCL (For. Reg.) | 585,700 | | 332,499 |
Bumrungrad Hospital PCL (For. Reg.) | 86,300 | | 352,344 |
Kasikornbank PCL (For. Reg.) | 85,800 | | 621,429 |
TOTAL THAILAND | | 1,734,885 |
Turkey - 0.6% |
Albaraka Turk Katilim Bankasi A/S | 81,907 | | 57,856 |
Coca-Cola Icecek Sanayi A/S | 53,889 | | 1,229,241 |
TAV Havalimanlari Holding A/S | 51,000 | | 427,935 |
Tofas Turk Otomobil Fabrikasi A/S | 8,618 | | 54,089 |
Tupras Turkiye Petrol Rafinelleri A/S | 19,000 | | 412,458 |
TOTAL TURKEY | | 2,181,579 |
United Arab Emirates - 0.2% |
DP World Ltd. | 16,669 | | 319,378 |
First Gulf Bank PJSC | 79,996 | | 395,297 |
TOTAL UNITED ARAB EMIRATES | | 714,675 |
United Kingdom - 15.9% |
Advanced Computer Software Group PLC | 22,800 | | 39,391 |
Common Stocks - continued |
| Shares | | Value |
United Kingdom - continued |
Al Noor Hospitals Group PLC | 21,900 | | $ 356,991 |
AstraZeneca PLC (United Kingdom) | 33,328 | | 2,434,557 |
Babcock International Group PLC | 46,423 | | 813,178 |
BAE Systems PLC | 295,421 | | 2,167,747 |
Bank of Georgia Holdings PLC | 7,100 | | 290,761 |
Barclays PLC | 447,074 | | 1,719,410 |
Bellway PLC | 6,228 | | 174,252 |
Berendsen PLC | 45,355 | | 732,799 |
BG Group PLC | 134,327 | | 2,238,698 |
BHP Billiton PLC | 109,137 | | 2,819,730 |
British American Tobacco PLC (United Kingdom) | 5,000 | | 283,388 |
Britvic PLC | 11,317 | | 123,196 |
BT Group PLC | 52,775 | | 311,126 |
Bunzl PLC | 44,657 | | 1,210,871 |
Burberry Group PLC | 14,300 | | 350,227 |
Compass Group PLC | 81,207 | | 1,306,863 |
Dechra Pharmaceuticals PLC | 9,000 | | 109,132 |
Derwent London PLC | 2,000 | | 95,054 |
Diageo PLC | 10,651 | | 314,123 |
Elementis PLC | 34,808 | | 146,946 |
GlaxoSmithKline PLC | 87,497 | | 1,978,654 |
Great Portland Estates PLC | 13,372 | | 146,851 |
H&T Group PLC | 10,000 | | 25,435 |
Hilton Food Group PLC | 5,400 | | 32,394 |
HSBC Holdings PLC sponsored ADR | 68,466 | | 3,493,135 |
Imperial Tobacco Group PLC | 43,447 | | 1,884,204 |
Informa PLC | 181,654 | | 1,397,747 |
InterContinental Hotel Group PLC ADR | 60,596 | | 2,303,254 |
Intertek Group PLC | 7,000 | | 304,807 |
ITE Group PLC | 20,600 | | 56,104 |
ITV PLC | 361,119 | | 1,172,695 |
Johnson Matthey PLC | 27,877 | | 1,326,250 |
Liberty Global PLC Class A (a) | 16,700 | | 759,349 |
Meggitt PLC | 14,039 | | 101,309 |
National Grid PLC | 152,291 | | 2,259,993 |
Next PLC | 5,900 | | 608,294 |
Persimmon PLC | 3,737 | | 87,459 |
Prudential PLC | 228,088 | | 5,281,612 |
Reckitt Benckiser Group PLC | 34,751 | | 2,918,537 |
Rolls-Royce Group PLC | 78,652 | | 1,060,659 |
Rotork PLC | 10,003 | | 408,846 |
Royal Dutch Shell PLC Class A sponsored ADR | 36,429 | | 2,615,238 |
Common Stocks - continued |
| Shares | | Value |
United Kingdom - continued |
SABMiller PLC | 50,863 | | $ 2,868,135 |
Shaftesbury PLC | 56,637 | | 648,712 |
Spectris PLC | 5,970 | | 172,095 |
Spirax-Sarco Engineering PLC | 5,107 | | 232,836 |
Standard Chartered PLC (United Kingdom) | 23,349 | | 350,954 |
Ted Baker PLC | 2,775 | | 86,342 |
Ultra Electronics Holdings PLC | 4,501 | | 125,644 |
Unite Group PLC | 84,677 | | 578,405 |
Vodafone Group PLC sponsored ADR | 75,826 | | 2,518,940 |
TOTAL UNITED KINGDOM | | 55,843,329 |
United States of America - 8.1% |
A.O. Smith Corp. | 6,400 | | 341,440 |
AbbVie, Inc. | 8,429 | | 534,904 |
Altria Group, Inc. | 16,000 | | 773,440 |
ANSYS, Inc. (a) | 400 | | 31,424 |
Autoliv, Inc. | 17,154 | | 1,573,708 |
Berkshire Hathaway, Inc. Class B (a) | 6,816 | | 955,331 |
BorgWarner, Inc. | 30,394 | | 1,733,066 |
Broadridge Financial Solutions, Inc. | 1,140 | | 50,080 |
Constellation Brands, Inc. Class A (sub. vtg.) (a) | 9,100 | | 833,014 |
Cummins, Inc. | 7,091 | | 1,036,562 |
Dril-Quip, Inc. (a) | 870 | | 78,257 |
Evercore Partners, Inc. Class A | 1,160 | | 60,053 |
FMC Technologies, Inc. (a) | 11,403 | | 639,024 |
Google, Inc.: | | | |
Class A (a) | 2,890 | | 1,641,144 |
Class C (a) | 1,890 | | 1,056,661 |
International Flavors & Fragrances, Inc. | 3,300 | | 327,195 |
Kansas City Southern | 2,600 | | 319,254 |
Kennedy-Wilson Holdings, Inc. | 5,283 | | 143,116 |
Las Vegas Sands Corp. | 5,600 | | 348,656 |
Martin Marietta Materials, Inc. | 11,080 | | 1,295,474 |
MasterCard, Inc. Class A | 27,890 | | 2,335,788 |
Mead Johnson Nutrition Co. Class A | 5,700 | | 566,067 |
Mohawk Industries, Inc. (a) | 8,535 | | 1,212,311 |
National Oilwell Varco, Inc. | 4,046 | | 293,901 |
Oceaneering International, Inc. | 9,038 | | 635,100 |
Philip Morris International, Inc. | 13,200 | | 1,174,932 |
PPG Industries, Inc. | 1,800 | | 366,642 |
Praxair, Inc. | 2,200 | | 277,178 |
PriceSmart, Inc. | 7,385 | | 657,487 |
Common Stocks - continued |
| Shares | | Value |
United States of America - continued |
ResMed, Inc. (d) | 11,020 | | $ 575,464 |
ResMed, Inc. CDI | 129,128 | | 679,013 |
Solera Holdings, Inc. | 18,894 | | 981,543 |
SS&C Technologies Holdings, Inc. (a) | 21,354 | | 1,031,825 |
T-Mobile U.S., Inc. (a) | 15,300 | | 446,607 |
Union Pacific Corp. | 7,000 | | 815,150 |
Visa, Inc. Class A | 9,831 | | 2,373,498 |
W.R. Grace & Co. (a) | 3,500 | | 331,100 |
TOTAL UNITED STATES OF AMERICA | | 28,525,409 |
TOTAL COMMON STOCKS (Cost $290,918,842) |
340,176,388
|
Nonconvertible Preferred Stocks - 1.6% |
| | | |
Brazil - 1.0% |
Ambev SA sponsored ADR | 136,200 | | 909,816 |
Banco Bradesco SA (PN) sponsored ADR | 71,100 | | 1,065,078 |
Companhia Brasileira de Distribuicao Grupo Pao de Acucar sponsored ADR | 10,200 | | 426,360 |
Itau Unibanco Holding SA sponsored ADR | 75,000 | | 1,107,000 |
TOTAL BRAZIL | | 3,508,254 |
Colombia - 0.1% |
Grupo Aval Acciones y Valores SA | 525,754 | | 356,465 |
Germany - 0.5% |
Henkel AG & Co. KGaA | 3,000 | | 296,169 |
Sartorius AG (non-vtg.) | 1,050 | | 114,475 |
Volkswagen AG | 6,090 | | 1,297,768 |
TOTAL GERMANY | | 1,708,412 |
United Kingdom - 0.0% |
Rolls-Royce Group PLC | 7,078,680 | | 11,324 |
TOTAL NONCONVERTIBLE PREFERRED STOCKS (Cost $5,704,650) |
5,584,455
|
Money Market Funds - 0.9% |
| Shares | | Value |
Fidelity Cash Central Fund, 0.11% (b) | 2,704,556 | | $ 2,704,556 |
Fidelity Securities Lending Cash Central Fund, 0.11% (b)(c) | 452,625 | | 452,625 |
TOTAL MONEY MARKET FUNDS (Cost $3,157,181) |
3,157,181
|
TOTAL INVESTMENT PORTFOLIO - 99.6% (Cost $299,780,673) | 348,918,024 |
NET OTHER ASSETS (LIABILITIES) - 0.4% | | 1,402,864 |
NET ASSETS - 100% | $ 350,320,888 |
Legend |
(a) Non-income producing |
(b) Affiliated fund that is generally available only to investment companies and other accounts managed by Fidelity Investments. The rate quoted is the annualized seven-day yield of the fund at period end. A complete unaudited listing of the fund's holdings as of its most recent quarter end is available upon request. In addition, each Fidelity Central Fund's financial statements, which are not covered by the Fund's Report of Independent Registered Public Accounting Firm, are available on the SEC's website or upon request. |
(c) Investment made with cash collateral received from securities on loan. |
(d) Security or a portion of the security is on loan at period end. |
(e) Security exempt from registration under Rule 144A of the Securities Act of 1933. These securities may be resold in transactions exempt from registration, normally to qualified institutional buyers. At the end of the period, the value of these securities amounted to $336,936 or 0.1% of net assets. |
Affiliated Central Funds |
Information regarding fiscal year to date income earned by the Fund from investments in Fidelity Central Funds is as follows: |
Fund | Income earned |
Fidelity Cash Central Fund | $ 5,978 |
Fidelity Securities Lending Cash Central Fund | 110,200 |
Total | $ 116,178 |
Other Information |
Categorizations in the Schedule of Investments are based on country or territory of incorporation. |
The following is a summary of the inputs used, as of October 31, 2014, involving the Fund's assets and liabilities carried at fair value. The inputs or methodology used for valuing securities may not be an indication of the risk associated with investing in those securities. For more information on valuation inputs, and their aggregation into the levels used in the tables below, please refer to the Investment Valuation section in the accompanying Notes to Financial Statements. |
Valuation Inputs at Reporting Date: |
Description | Total | Level 1 | Level 2 | Level 3 |
Investments in Securities: | | | | |
Equities: | | | | |
Consumer Discretionary | $ 51,485,253 | $ 31,400,031 | $ 20,085,222 | $ - |
Consumer Staples | 37,901,378 | 19,087,199 | 18,814,179 | - |
Energy | 14,094,793 | 6,647,362 | 7,447,431 | - |
Financials | 73,719,494 | 33,537,412 | 40,182,082 | - |
Health Care | 47,021,999 | 15,198,757 | 31,823,242 | - |
Industrials | 43,672,266 | 30,186,330 | 13,485,936 | - |
Information Technology | 36,382,263 | 21,380,327 | 15,001,936 | - |
Materials | 21,426,223 | 15,220,061 | 6,206,162 | - |
Telecommunication Services | 14,368,474 | 6,856,779 | 7,511,695 | - |
Utilities | 5,688,700 | 2,678,780 | 3,009,920 | - |
Money Market Funds | 3,157,181 | 3,157,181 | - | - |
Total Investments in Securities: | $ 348,918,024 | $ 185,350,219 | $ 163,567,805 | $ - |
The following is a summary of transfers between Level 1 and Level 2 for the period ended October 31, 2014. Transfers are assumed to have occurred at the beginning of the period, and are primarily attributable to the valuation techniques used for foreign equity securities, as discussed in the accompanying Notes to Financial Statements: |
Transfers | Total |
Level 1 to Level 2 | $ 31,040,538 |
Level 2 to Level 1 | $ 0 |
See accompanying notes which are an integral part of the financial statements.
Annual Report
Statement of Assets and Liabilities
| October 31, 2014 |
| | |
Assets | | |
Investment in securities, at value (including securities loaned of $443,870) - See accompanying schedule: Unaffiliated issuers (cost $296,623,492) | $ 345,760,843 | |
Fidelity Central Funds (cost $3,157,181) | 3,157,181 | |
Total Investments (cost $299,780,673) | | $ 348,918,024 |
Foreign currency held at value (cost $531,237) | | 530,341 |
Receivable for investments sold | | 3,130,638 |
Receivable for fund shares sold | | 34,825 |
Dividends receivable | | 809,645 |
Distributions receivable from Fidelity Central Funds | | 794 |
Prepaid expenses | | 1,062 |
Receivable from investment adviser for expense reductions | | 886 |
Other receivables | | 1,769 |
Total assets | | 353,427,984 |
| | |
Liabilities | | |
Payable to custodian bank | $ 268,222 | |
Payable for investments purchased | 1,568,693 | |
Payable for fund shares redeemed | 167,932 | |
Accrued management fee | 237,167 | |
Distribution and service plan fees payable | 9,184 | |
Other affiliated payables | 54,537 | |
Other payables and accrued expenses | 348,736 | |
Collateral on securities loaned, at value | 452,625 | |
Total liabilities | | 3,107,096 |
| | |
Net Assets | | $ 350,320,888 |
Net Assets consist of: | | |
Paid in capital | | $ 318,656,094 |
Undistributed net investment income | | 5,238,848 |
Accumulated undistributed net realized gain (loss) on investments and foreign currency transactions | | (22,463,589) |
Net unrealized appreciation (depreciation) on investments and assets and liabilities in foreign currencies | | 48,889,535 |
Net Assets | | $ 350,320,888 |
See accompanying notes which are an integral part of the financial statements.
Annual Report
Financial Statements - continued
Statement of Assets and Liabilities - continued
| October 31, 2014 |
| | |
Calculation of Maximum Offering Price Class A:
Net Asset Value and redemption price per share ($9,163,958 ÷ 1,145,034 shares) | | $ 8.00 |
| | |
Maximum offering price per share (100/94.25 of $8.00) | | $ 8.49 |
Class T:
Net Asset Value and redemption price per share ($10,282,207 ÷ 1,278,916 shares) | | $ 8.04 |
| | |
Maximum offering price per share (100/96.50 of $8.04) | | $ 8.33 |
Class B:
Net Asset Value and offering price per share ($167,965 ÷ 20,859 shares)A | | $ 8.05 |
| | |
Class C:
Net Asset Value and offering price per share ($4,028,383 ÷ 503,849 shares)A | | $ 8.00 |
| | |
Total International Equity:
Net Asset Value, offering price and redemption price per share ($324,438,192 ÷ 40,382,479 shares) | | $ 8.03 |
| | |
Institutional Class:
Net Asset Value, offering price and redemption price per share ($2,240,183 ÷ 280,204 shares) | | $ 7.99 |
A Redemption price per share is equal to net asset value less any applicable contingent deferred sales charge.
See accompanying notes which are an integral part of the financial statements.
Annual Report
Statement of Operations
| Year ended October 31, 2014 |
| | |
Investment Income | | |
Dividends | | $ 11,693,447 |
Income from Fidelity Central Funds | | 116,178 |
Income before foreign taxes withheld | | 11,809,625 |
Less foreign taxes withheld | | (748,463) |
Total income | | 11,061,162 |
| | |
Expenses | | |
Management fee
Basic fee | $ 2,527,278 | |
Performance adjustment | 193,246 | |
Transfer agent fees | 465,968 | |
Distribution and service plan fees | 109,662 | |
Accounting and security lending fees | 187,763 | |
Custodian fees and expenses | 227,812 | |
Independent trustees' compensation | 1,481 | |
Registration fees | 71,601 | |
Audit | 96,390 | |
Legal | 1,290 | |
Interest | 723 | |
Miscellaneous | 6,436 | |
Total expenses before reductions | 3,889,650 | |
Expense reductions | (2,484) | 3,887,166 |
Net investment income (loss) | | 7,173,996 |
Realized and Unrealized Gain (Loss) Net realized gain (loss) on: | | |
Investment securities: | | |
Unaffiliated issuers (net of foreign taxes of $589,388) | 5,722,532 | |
Foreign currency transactions | (82,685) | |
Total net realized gain (loss) | | 5,639,847 |
Change in net unrealized appreciation (depreciation) on: Investment securities (net of increase in deferred foreign taxes of $98,574) | (11,108,073) | |
Assets and liabilities in foreign currencies | (29,837) | |
Total change in net unrealized appreciation (depreciation) | | (11,137,910) |
Net gain (loss) | | (5,498,063) |
Net increase (decrease) in net assets resulting from operations | | $ 1,675,933 |
See accompanying notes which are an integral part of the financial statements.
Annual Report
Financial Statements - continued
Statement of Changes in Net Assets
| Year ended
October 31,
2014 | Year ended
October 31,
2013 |
Increase (Decrease) in Net Assets | | |
Operations | | |
Net investment income (loss) | $ 7,173,996 | $ 5,165,980 |
Net realized gain (loss) | 5,639,847 | 8,529,722 |
Change in net unrealized appreciation (depreciation) | (11,137,910) | 44,726,463 |
Net increase (decrease) in net assets resulting
from operations | 1,675,933 | 58,422,165 |
Distributions to shareholders from net investment income | (5,090,375) | (5,845,552) |
Distributions to shareholders from net realized gain | (7,679,276) | (9,769,201) |
Total distributions | (12,769,651) | (15,614,753) |
Share transactions - net increase (decrease) | 13,925,925 | 10,109,727 |
Redemption fees | 3,247 | 2,498 |
Total increase (decrease) in net assets | 2,835,454 | 52,919,637 |
| | |
Net Assets | | |
Beginning of period | 347,485,434 | 294,565,797 |
End of period (including undistributed net investment income of $5,238,848 and undistributed net investment income of $4,647,078, respectively) | $ 350,320,888 | $ 347,485,434 |
See accompanying notes which are an integral part of the financial statements.
Annual Report
Financial Highlights - Class A
Years ended October 31, | 2014 | 2013 | 2012 | 2011 | 2010 |
Selected Per-Share Data | | | | | |
Net asset value, beginning of period | $ 8.27 | $ 7.31 | $ 6.67 | $ 7.36 | $ 6.40 |
Income from Investment Operations | | | | | |
Net investment income (loss) C | .13 | .09 | .13 | .11 | .08 |
Net realized and unrealized gain (loss) | (.12) | 1.24 | .59 | (.69) | .95 |
Total from investment operations | .01 | 1.33 | .72 | (.58) | 1.03 |
Distributions from net investment income | (.10) | (.13) | (.08) | (.09) | (.04) |
Distributions from net realized gain | (.18) | (.25) | - | (.02) | (.03) |
Total distributions | (.28) | (.37) H | (.08) | (.11) | (.07) |
Redemption fees added to paid in capital C,G | - | - | - | - | - |
Net asset value, end of period | $ 8.00 | $ 8.27 | $ 7.31 | $ 6.67 | $ 7.36 |
Total ReturnA, B | .19% | 19.00% | 10.88% | (8.03)% | 16.17% |
Ratios to Average Net Assets D, F | | | | | |
Expenses before reductions | 1.44% | 1.50% | 1.57% | 1.73% | 2.02% |
Expenses net of fee waivers, if any | 1.44% | 1.45% | 1.45% | 1.45% | 1.50% |
Expenses net of all reductions | 1.44% | 1.43% | 1.42% | 1.42% | 1.47% |
Net investment income (loss) | 1.63% | 1.21% | 1.88% | 1.44% | 1.15% |
Supplemental Data | | | | | |
Net assets, end of period (000 omitted) | $ 9,164 | $ 9,034 | $ 5,767 | $ 4,307 | $ 5,029 |
Portfolio turnover rateE | 85% | 89% | 110% | 75% | 67% |
A Total returns would have been lower if certain expenses had not been reduced during the applicable periods shown.
B Total returns do not include the effect of the sales charges.
C Calculated based on average shares outstanding during the period.
D Fees and expenses of any underlying Fidelity Central Funds are not included in the Fund's expense ratio. The Fund indirectly bears its proportionate share of the expenses of any underlying Fidelity Central Funds.
E Amount does not include the portfolio activity of any underlying Fidelity Central Funds.
F Expense ratios reflect operating expenses of the class. Expenses before reductions do not reflect amounts reimbursed by the investment adviser or reductions from brokerage service arrangements or reductions from other expense offset arrangements and do not represent the amount paid by the class during periods when reimbursements or reductions occur. Expenses net of fee waivers reflect expenses after reimbursement by the investment adviser but prior to reductions from brokerage service arrangements or other expense offset arrangements. Expenses net of all reductions represent the net expenses paid by the class.
G Amount represents less than $.01 per share.
H Total distributions of $.37 per share is comprised of distributions from net investment income of $.126 and distributions from net realized gain of $.245 per share.
See accompanying notes which are an integral part of the financial statements.
Annual Report
Financial Highlights - Class T
Years ended October 31, | 2014 | 2013 | 2012 | 2011 | 2010 |
Selected Per-Share Data | | | | | |
Net asset value, beginning of period | $ 8.32 | $ 7.37 | $ 6.73 | $ 7.41 | $ 6.40 |
Income from Investment Operations | | | | | |
Net investment income (loss) C | .11 | .07 | .11 | .09 | .06 |
Net realized and unrealized gain (loss) | (.12) | 1.25 | .59 | (.68) | .95 |
Total from investment operations | (.01) | 1.32 | .70 | (.59) | 1.01 |
Distributions from net investment income | (.09) | (.13) | (.06) | (.07) | - |
Distributions from net realized gain | (.18) | (.25) | - | (.02) | - |
Total distributions | (.27) | (.37)H | (.06) | (.09) | - |
Redemption fees added to paid in capital C,G | - | - | - | - | - |
Net asset value, end of period | $ 8.04 | $ 8.32 | $ 7.37 | $ 6.73 | $ 7.41 |
Total ReturnA, B | (.06)% | 18.73% | 10.52% | (8.08)% | 15.78% |
Ratios to Average Net Assets D, F | | | | | |
Expenses before reductions | 1.68% | 1.75% | 1.84% | 2.02% | 2.31% |
Expenses net of fee waivers, if any | 1.68% | 1.70% | 1.70% | 1.70% | 1.75% |
Expenses net of all reductions | 1.68% | 1.67% | 1.67% | 1.67% | 1.72% |
Net investment income (loss) | 1.38% | .96% | 1.63% | 1.19% | .90% |
Supplemental Data | | | | | |
Net assets, end of period (000 omitted) | $ 10,282 | $ 7,909 | $ 2,348 | $ 997 | $ 1,004 |
Portfolio turnover rateE | 85% | 89% | 110% | 75% | 67% |
A Total returns would have been lower if certain expenses had not been reduced during the applicable periods shown.
B Total returns do not include the effect of the sales charges.
C Calculated based on average shares outstanding during the period.
D Fees and expenses of any underlying Fidelity Central Funds are not included in the Fund's expense ratio. The Fund indirectly bears its proportionate share of the expenses of any underlying Fidelity Central Funds.
E Amount does not include the portfolio activity of any underlying Fidelity Central Funds.
F Expense ratios reflect operating expenses of the class. Expenses before reductions do not reflect amounts reimbursed by the investment adviser or reductions from brokerage service arrangements or reductions from other expense offset arrangements and do not represent the amount paid by the class during periods when reimbursements or reductions occur. Expenses net of fee waivers reflect expenses after reimbursement by the investment adviser but prior to reductions from brokerage service arrangements or other expense offset arrangements. Expenses net of all reductions represent the net expenses paid by the class.
G Amount represents less than $.01 per share.
H Total distributions of $.37 per share is comprised of distributions from net investment income of $.128 and distributions from net realized gain of $.245 per share.
See accompanying notes which are an integral part of the financial statements.
Annual Report
Financial Highlights - Class B
Years ended October 31, | 2014 | 2013 | 2012 | 2011 | 2010 |
Selected Per-Share Data | | | | | |
Net asset value, beginning of period | $ 8.31 | $ 7.33 | $ 6.68 | $ 7.37 | $ 6.39 |
Income from Investment Operations | | | | | |
Net investment income (loss) C | .07 | .04 | .08 | .05 | .03 |
Net realized and unrealized gain (loss) | (.12) | 1.24 | .59 | (.68) | .95 |
Total from investment operations | (.05) | 1.28 | .67 | (.63) | .98 |
Distributions from net investment income | (.03) | (.05) | (.02) | (.04) | - |
Distributions from net realized gain | (.18) | (.25) | - | (.02) | - |
Total distributions | (.21) | (.30) | (.02) | (.06) | - |
Redemption fees added to paid in capital C,G | - | - | - | - | - |
Net asset value, end of period | $ 8.05 | $ 8.31 | $ 7.33 | $ 6.68 | $ 7.37 |
Total ReturnA, B | (.56)% | 18.05% | 10.05% | (8.66)% | 15.34% |
Ratios to Average Net Assets D, F | | | | | |
Expenses before reductions | 2.22% | 2.26% | 2.34% | 2.51% | 2.81% |
Expenses net of fee waivers, if any | 2.20% | 2.20% | 2.20% | 2.20% | 2.25% |
Expenses net of all reductions | 2.20% | 2.18% | 2.17% | 2.17% | 2.22% |
Net investment income (loss) | .87% | .46% | 1.13% | .69% | .40% |
Supplemental Data | | | | | |
Net assets, end of period (000 omitted) | $ 168 | $ 192 | $ 220 | $ 254 | $ 327 |
Portfolio turnover rateE | 85% | 89% | 110% | 75% | 67% |
A Total returns would have been lower if certain expenses had not been reduced during the applicable periods shown.
B Total returns do not include the effect of the contingent deferred sales charge.
C Calculated based on average shares outstanding during the period.
D Fees and expenses of any underlying Fidelity Central Funds are not included in the Fund's expense ratio. The Fund indirectly bears its proportionate share of the expenses of any underlying Fidelity Central Funds.
E Amount does not include the portfolio activity of any underlying Fidelity Central Funds.
F Expense ratios reflect operating expenses of the class. Expenses before reductions do not reflect amounts reimbursed by the investment adviser or reductions from brokerage service arrangements or reductions from other expense offset arrangements and do not represent the amount paid by the class during periods when reimbursements or reductions occur. Expenses net of fee waivers reflect expenses after reimbursement by the investment adviser but prior to reductions from brokerage service arrangements or other expense offset arrangements. Expenses net of all reductions represent the net expenses paid by the class.
G Amount represents less than $.01 per share.
See accompanying notes which are an integral part of the financial statements.
Annual Report
Financial Highlights - Class C
Years ended October 31, | 2014 | 2013 | 2012 | 2011 | 2010 |
Selected Per-Share Data | | | | | |
Net asset value, beginning of period | $ 8.28 | $ 7.31 | $ 6.67 | $ 7.36 | $ 6.39 |
Income from Investment Operations | | | | | |
Net investment income (loss) C | .07 | .04 | .08 | .05 | .03 |
Net realized and unrealized gain (loss) | (.12) | 1.25 | .58 | (.69) | .94 |
Total from investment operations | (.05) | 1.29 | .66 | (.64) | .97 |
Distributions from net investment income | (.05) | (.08) | (.02) | (.03) | - |
Distributions from net realized gain | (.18) | (.25) | - | (.02) | - |
Total distributions | (.23) | (.32) H | (.02) | (.05) | - |
Redemption fees added to paid in capital C,G | - | - | - | - | - |
Net asset value, end of period | $ 8.00 | $ 8.28 | $ 7.31 | $ 6.67 | $ 7.36 |
Total ReturnA, B | (.57)% | 18.30% | 9.98% | (8.72)% | 15.18% |
Ratios to Average Net Assets D, F | | | | | |
Expenses before reductions | 2.22% | 2.26% | 2.31% | 2.51% | 2.80% |
Expenses net of fee waivers, if any | 2.20% | 2.20% | 2.20% | 2.20% | 2.25% |
Expenses net of all reductions | 2.20% | 2.18% | 2.17% | 2.17% | 2.22% |
Net investment income (loss) | .87% | .46% | 1.13% | .69% | .40% |
Supplemental Data | | | | | |
Net assets, end of period (000 omitted) | $ 4,028 | $ 3,584 | $ 2,737 | $ 1,396 | $ 1,423 |
Portfolio turnover rateE | 85% | 89% | 110% | 75% | 67% |
A Total returns would have been lower if certain expenses had not been reduced during the applicable periods shown.
B Total returns do not include the effect of the contingent deferred sales charge.
C Calculated based on average shares outstanding during the period.
D Fees and expenses of any underlying Fidelity Central Funds are not included in the Fund's expense ratio. The Fund indirectly bears its proportionate share of the expenses of any underlying Fidelity Central Funds.
E Amount does not include the portfolio activity of any underlying Fidelity Central Funds.
F Expense ratios reflect operating expenses of the class. Expenses before reductions do not reflect amounts reimbursed by the investment adviser or reductions from brokerage service arrangements or reductions from other expense offset arrangements and do not represent the amount paid by the class during periods when reimbursements or reductions occur. Expenses net of fee waivers reflect expenses after reimbursement by the investment adviser but prior to reductions from brokerage service arrangements or other expense offset arrangements. Expenses net of all reductions represent the net expenses paid by the class.
G Amount represents less than $.01 per share.
H Total distributions of $.32 per share is comprised of distributions from net investment income of $.075 and distributions from net realized gain of $.245 per share.
See accompanying notes which are an integral part of the financial statements.
Annual Report
Financial Highlights - Total International Equity
Years ended October 31, | 2014 | 2013 | 2012 | 2011 | 2010 |
Selected Per-Share Data | | | | | |
Net asset value, beginning of period | $ 8.29 | $ 7.32 | $ 6.69 | $ 7.37 | $ 6.41 |
Income from Investment Operations | | | | | |
Net investment income (loss) B | .16 | .12 | .15 | .12 | .09 |
Net realized and unrealized gain (loss) | (.12) | 1.24 | .58 | (.68) | .96 |
Total from investment operations | .04 | 1.36 | .73 | (.56) | 1.05 |
Distributions from net investment income | (.12) | (.15) | (.10) | (.10) | (.06) |
Distributions from net realized gain | (.18) | (.25) | - | (.02) | (.03) |
Total distributions | (.30) | (.39) G | (.10) | (.12) | (.09) |
Redemption fees added to paid in capital B, F | - | - | - | - | - |
Net asset value, end of period | $ 8.03 | $ 8.29 | $ 7.32 | $ 6.69 | $ 7.37 |
Total ReturnA | .55% | 19.48% | 11.03% | (7.70)% | 16.45% |
Ratios to Average Net Assets C, E | | | | | |
Expenses before reductions | 1.04% | 1.09% | 1.16% | 1.42% | 1.79% |
Expenses net of fee waivers, if any | 1.04% | 1.09% | 1.16% | 1.20% | 1.25% |
Expenses net of all reductions | 1.04% | 1.07% | 1.13% | 1.17% | 1.22% |
Net investment income (loss) | 2.03% | 1.57% | 2.16% | 1.69% | 1.40% |
Supplemental Data | | | | | |
Net assets, end of period (000 omitted) | $ 324,438 | $ 324,395 | $ 281,979 | $ 131,338 | $ 60,826 |
Portfolio turnover rateD | 85% | 89% | 110% | 75% | 67% |
A Total returns would have been lower if certain expenses had not been reduced during the applicable periods shown.
B Calculated based on average shares outstanding during the period.
C Fees and expenses of any underlying Fidelity Central Funds are not included in the Fund's expense ratio. The Fund indirectly bears its proportionate share of the expenses of any underlying Fidelity Central Funds.
D Amount does not include the portfolio activity of any underlying Fidelity Central Funds.
E Expense ratios reflect operating expenses of the class. Expenses before reductions do not reflect amounts reimbursed by the investment adviser or reductions from brokerage service arrangements or reductions from other expense offset arrangements and do not represent the amount paid by the class during periods when reimbursements or reductions occur. Expenses net of fee waivers reflect expenses after reimbursement by the investment adviser but prior to reductions from brokerage service arrangements or other expense offset arrangements. Expenses net of all reductions represent the net expenses paid by the class.
F Amount represents less than $.01 per share.
G Total distributions of $.39 per share is comprised of distributions from net investment income of $.148 and distributions from net realized gain of $.245 per share.
See accompanying notes which are an integral part of the financial statements.
Annual Report
Financial Highlights - Institutional Class
Years ended October 31, | 2014 | 2013 | 2012 | 2011 | 2010 |
Selected Per-Share Data | | | | | |
Net asset value, beginning of period | $ 8.26 | $ 7.30 | $ 6.67 | $ 7.35 | $ 6.41 |
Income from Investment Operations | | | | | |
Net investment income (loss) B | .15 | .11 | .14 | .12 | .10 |
Net realized and unrealized gain (loss) | (.12) | 1.24 | .59 | (.68) | .95 |
Total from investment operations | .03 | 1.35 | .73 | (.56) | 1.05 |
Distributions from net investment income | (.12) | (.15) | (.10) | (.10) | (.08) |
Distributions from net realized gain | (.18) | (.25) | - | (.02) | (.03) |
Total distributions | (.30) | (.39)G | (.10) | (.12) | (.11) |
Redemption fees added to paid in capital B, F | - | - | - | - | - |
Net asset value, end of period | $ 7.99 | $ 8.26 | $ 7.30 | $ 6.67 | $ 7.35 |
Total ReturnA | .37% | 19.40% | 11.06% | (7.72)% | 16.48% |
Ratios to Average Net Assets C, E | | | | | |
Expenses before reductions | 1.15% | 1.21% | 1.27% | 1.48% | 1.82% |
Expenses net of fee waivers, if any | 1.15% | 1.20% | 1.20% | 1.20% | 1.25% |
Expenses net of all reductions | 1.15% | 1.18% | 1.17% | 1.17% | 1.23% |
Net investment income (loss) | 1.91% | 1.46% | 2.13% | 1.69% | 1.40% |
Supplemental Data | | | | | |
Net assets, end of period (000 omitted) | $ 2,240 | $ 2,372 | $ 1,514 | $ 197 | $ 28 |
Portfolio turnover rateD | 85% | 89% | 110% | 75% | 67% |
A Total returns would have been lower if certain expenses had not been reduced during the applicable periods shown.
B Calculated based on average shares outstanding during the period.
C Fees and expenses of any underlying Fidelity Central Funds are not included in the Fund's expense ratio. The Fund indirectly bears its proportionate share of the expenses of any underlying Fidelity Central Funds.
D Amount does not include the portfolio activity of any underlying Fidelity Central Funds.
E Expense ratios reflect operating expenses of the class. Expenses before reductions do not reflect amounts reimbursed by the investment adviser or reductions from brokerage service arrangements or reductions from other expense offset arrangements and do not represent the amount paid by the class during periods when reimbursements or reductions occur. Expenses net of fee waivers reflect expenses after reimbursement by the investment adviser but prior to reductions from brokerage service arrangements or other expense offset arrangements. Expenses net of all reductions represent the net expenses paid by the class.
F Amount represents less than $.01 per share.
G Total distributions of $.39 per share is comprised of distributions from net investment income of $.148 and distributions from net realized gain of $.245 per share.
See accompanying notes which are an integral part of the financial statements.
Annual Report
Notes to Financial Statements
For the period ended October 31, 2014
1. Organization.
Fidelity Total International Equity Fund (the Fund) is a fund of Fidelity Investment Trust (the Trust) and is authorized to issue an unlimited number of shares. The Trust is registered under the Investment Company Act of 1940, as amended (the 1940 Act), as an open-end management investment company organized as a Massachusetts business trust. The Fund offers Class A, Class T, Class C, Total International Equity and Institutional Class shares, each of which, along with Class B shares, has equal rights as to assets and voting privileges. Class B shares are closed to new accounts and additional purchases, except for exchanges and reinvestments. Each class has exclusive voting rights with respect to matters that affect that class. Class B shares will automatically convert to Class A shares after a holding period of seven years from the initial date of purchase. The Fund's investments in emerging markets can be subject to social, economic, regulatory, and political uncertainties and can be extremely volatile.
2. Investments in Fidelity Central Funds.
The Fund invests in Fidelity Central Funds, which are open-end investment companies generally available only to other investment companies and accounts managed by the investment adviser and its affiliates. The Fund's Schedule of Investments lists each of the Fidelity Central Funds held as of period end, if any, as an investment of the Fund, but does not include the underlying holdings of each Fidelity Central Fund. As an Investing Fund, the Fund indirectly bears its proportionate share of the expenses of the underlying Fidelity Central Funds.
The Money Market Central Funds seek preservation of capital and current income and are managed by Fidelity Investments Money Management, Inc. (FIMM), an affiliate of the investment adviser. Annualized expenses of the Money Market Central Funds as of their most recent shareholder report date are less than .01%.
A complete unaudited list of holdings for each Fidelity Central Fund is available upon request or at the Securities and Exchange Commission (the SEC) website at www.sec.gov. In addition, the financial statements of the Fidelity Central Funds, which are not covered by the Fund's Report of Independent Registered Public Accounting Firm, are available on the SEC website or upon request.
3. Significant Accounting Policies.
The financial statements have been prepared in conformity with accounting principles generally accepted in the United States of America (GAAP), which require management to make certain estimates and assumptions at the date of the financial statements. Actual results could differ from those estimates. Subsequent events, if any, through the date that the financial statements were issued have been evaluated in the preparation of the financial statements. The following summarizes the significant accounting policies of the Fund:
Annual Report
3. Significant Accounting Policies - continued
Investment Valuation. Investments are valued as of 4:00 p.m. Eastern time on the last calendar day of the period. In accordance with valuation policies and procedures approved by the Board of Trustees (the Board), the Fund attempts to obtain prices from one or more third party pricing vendors or brokers to value its investments. When current market prices, quotations or currency exchange rates are not readily available or reliable, investments will be fair valued in good faith by the Fidelity Management & Research Company (FMR) Fair Value Committee (the Committee), in accordance with procedures adopted by the Board. Factors used in determining fair value vary by investment type and may include market or investment specific events. The frequency with which these procedures are used cannot be predicted and they may be utilized to a significant extent. The Committee oversees the Fund's valuation policies and procedures and is responsible for approving and reporting to the Board all fair value determinations.
The Fund categorizes the inputs to valuation techniques used to value its investments into a disclosure hierarchy consisting of three levels as shown below:
Level 1 - quoted prices in active markets for identical investments
Level 2 - other significant observable inputs (including quoted prices for similar investments, interest rates, prepayment speeds, etc.)
Level 3 - unobservable inputs (including the Fund's own assumptions based on the best information available)
Valuation techniques used to value the Fund's investments by major category are as follows:
Equity securities, including restricted securities, for which market quotations are readily available, are valued at the last reported sale price or official closing price as reported by a third party pricing vendor on the primary market or exchange on which they are traded and are categorized as Level 1 in the hierarchy. In the event there were no sales during the day or closing prices are not available, securities are valued at the last quoted bid price or may be valued using the last available price and are generally categorized as Level 2 in the hierarchy. For foreign equity securities, when market or security specific events arise, comparisons to the valuation of American Depositary Receipts (ADRs), futures contracts, Exchange-Traded Funds (ETFs) and certain indexes as well as quoted prices for similar securities may be used and would be categorized as Level 2 in the hierarchy. Utilizing these techniques may result in transfers between Level 1 and Level 2. For equity securities, including restricted securities, where observable inputs are limited, assumptions about market activity and risk are used and these securities may be categorized as Level 3 in the hierarchy.
Annual Report
Notes to Financial Statements - continued
3. Significant Accounting Policies - continued
Investment Valuation - continued
The U.S. dollar value of foreign currency contracts is determined using currency exchange rates supplied by a pricing service and are categorized as Level 2 in the hierarchy. Investments in open-end mutual funds are valued at their closing net asset value (NAV) each business day and are categorized as Level 1 in the hierarchy.
Changes in valuation techniques may result in transfers in or out of an assigned level within the disclosure hierarchy. The aggregate value of investments by input level, as of October 31, 2014, including information on transfers between Levels 1 and 2 is included at the end of the Fund's Schedule of Investments.
Foreign Currency. The Fund may use foreign currency contracts to facilitate transactions in foreign-denominated securities. Gains and losses from these transactions may arise from changes in the value of the foreign currency or if the counterparties do not perform under the contracts' terms.
Foreign-denominated assets, including investment securities, and liabilities are translated into U.S. dollars at the exchange rates at period end. Purchases and sales of investment securities, income and dividends received and expenses denominated in foreign currencies are translated into U.S. dollars at the exchange rate in effect on the transaction date.
The effects of exchange rate fluctuations on investments are included with the net realized and unrealized gain (loss) on investment securities. Other foreign currency transactions resulting in realized and unrealized gain (loss) are disclosed separately.
Investment Transactions and Income. For financial reporting purposes, the Fund's investment holdings and NAV include trades executed through the end of the last business day of the period. The NAV per share for processing shareholder transactions is calculated as of the close of business of the New York Stock Exchange (NYSE), normally 4:00 p.m. Eastern time and includes trades executed through the end of the prior business day. Gains and losses on securities sold are determined on the basis of identified cost and may include proceeds received from litigation. Dividend income is recorded on the ex-dividend date, except for certain dividends from foreign securities where the ex-dividend date may have passed, which are recorded as soon as the Fund is informed of the ex-dividend date. Non-cash dividends included in dividend income, if any, are recorded at the fair market value of the securities received. Income and capital gain distributions from Fidelity Central Funds, if any, are recorded on the ex-dividend date. Distributions received on securities that represent a return of capital or capital gain are recorded as a reduction of cost of investments and/or as a realized gain. Subsequent to ex-dividend date the Fund determines the components of these distributions, based
Annual Report
3. Significant Accounting Policies - continued
Investment Transactions and Income - continued
upon receipt of tax filings or other correspondence relating to the underlying investment. Interest income is accrued as earned and includes coupon interest and amortization of premium and accretion of discount on debt securities as applicable. Investment income is recorded net of foreign taxes withheld where recovery of such taxes is uncertain.
Class Allocations and Expenses. Investment income, realized and unrealized capital gains and losses, common expenses of the Fund, and certain fund-level expense reductions, if any, are allocated daily on a pro-rata basis to each class based on the relative net assets of each class to the total net assets of the Fund. Each class differs with respect to transfer agent and distribution and service plan fees incurred. Certain expense reductions may also differ by class. For the reporting period, the allocated portion of income and expenses to each class as a percent of its average net assets may vary due to the timing of recording these transactions in relation to fluctuating net assets of the classes. Expenses directly attributable to a fund are charged to that fund. Expenses attributable to more than one fund are allocated among the respective funds on the basis of relative net assets or other appropriate methods. Expense estimates are accrued in the period to which they relate and adjustments are made when actual amounts are known.
Income Tax Information and Distributions to Shareholders. Each year, the Fund intends to qualify as a regulated investment company under Subchapter M of the Internal Revenue Code, including distributing substantially all of its taxable income and realized gains. As a result, no provision for U.S. Federal income taxes is required. As of October 31, 2014, the Fund did not have any unrecognized tax benefits in the financial statements; nor is the Fund aware of any tax positions for which it is reasonably possible that the total amounts of unrecognized tax benefits will significantly change in the next twelve months. The Fund files a U.S. federal tax return, in addition to state and local tax returns as required. The Fund's federal income tax returns are subject to examination by the Internal Revenue Service (IRS) for a period of three fiscal years after they are filed. State and local tax returns may be subject to examination for an additional fiscal year depending on the jurisdiction. Foreign taxes are provided for based on the Fund's understanding of the tax rules and rates that exist in the foreign markets in which it invests. The Fund is subject to a tax imposed on capital gains by certain countries in which it invests. An estimated deferred tax liability for net unrealized appreciation on the applicable securities is included in Other payables and accrued expenses on the Statement of Assets & Liabilities.
Distributions are declared and recorded on the ex-dividend date. Income dividends and capital gain distributions are declared separately for each class. Income and capital gain distributions are determined in accordance with income tax regulations, which may differ from GAAP. In addition, the Fund claimed a portion of the payment made to redeeming shareholders as a distribution for income tax purposes.
Annual Report
Notes to Financial Statements - continued
3. Significant Accounting Policies - continued
Income Tax Information and Distributions to Shareholders - continued
Capital accounts within the financial statements are adjusted for permanent book-tax differences. These adjustments have no impact on net assets or the results of operations. Capital accounts are not adjusted for temporary book-tax differences which will reverse in a subsequent period.
Book-tax differences are primarily due to foreign currency transactions, partnerships, certain foreign taxes, passive foreign investment companies (PFIC), capital loss carryforwards and losses deferred due to wash sales.
The federal tax cost of investment securities and unrealized appreciation (depreciation) as of period end were as follows:
Gross unrealized appreciation | $ 58,023,153 |
Gross unrealized depreciation | (10,503,108) |
Net unrealized appreciation (depreciation) on securities | $ 47,520,045 |
| |
Tax Cost | $ 301,397,979 |
The tax-based components of distributable earnings as of period end were as follows:
Undistributed ordinary income | $ 5,259,862 |
Undistributed long-term capital gain | $ 1,617,012 |
Capital Loss Carryforward | $ (22,463,295) |
Net unrealized appreciation (depreciation) on securities and other investments | $ 47,496,394 |
Capital loss carry forwards are only available to offset future capital gains of the Fund to the extent provided by regulations and may be limited. Under the Regulated Investment Company Modernization Act of 2012 (the Act), the Fund is permitted to carry forward capital losses incurred in taxable years beginning after December 22, 2010 for an unlimited period and such capital losses are required to be used prior to any losses that expire. Capital loss carryforwards were as follows:
Fiscal year of expiration: | |
2017 | $ (13,607,298) |
2019 | (8,855,997) |
Total capital loss carryforward | $ (22,463,295) |
Due to large subscriptions in a prior period, $22,463,295 of capital losses that will be available to offset future capital gains of the Fund will be limited by approximately $4,535,766 per year.
Annual Report
3. Significant Accounting Policies - continued
Income Tax Information and Distributions to Shareholders - continued
The tax character of distributions paid was as follows:
| October 31, 2014 | October 31, 2013 |
Ordinary Income | $ 9,375,496 | $ 15,216,010 |
Long-term Capital Gains | 3,394,155 | 398,743 |
Total | $ 12,769,651 | $ 15,614,753 |
Short-Term Trading (Redemption) Fees. Shares held by investors in the Fund less than 30 days may have been subject to a redemption fee equal to 1.00% of the NAV of shares redeemed. All redemption fees, which reduce the proceeds of the shareholder redemption, are retained by the Fund and accounted for as an addition to paid in capital.
Restricted Securities. The Fund may invest in securities that are subject to legal or contractual restrictions on resale. These securities generally may be resold in transactions exempt from registration or to the public if the securities are registered. Disposal of these securities may involve time-consuming negotiations and expense, and prompt sale at an acceptable price may be difficult. Information regarding restricted securities is included at the end of the Fund's Schedule of Investments.
New Accounting Pronouncement. In June 2014, the Financial Accounting Standards Board issued Accounting Standard Update No. 2014-11, Repurchase-to-Maturity Transactions, Repurchase Financings, and Disclosures. The Update amends the accounting for certain repurchase agreements and expands disclosure requirements for reverse repurchase agreements, securities lending and other similar transactions. The disclosure requirements are effective for annual and interim reporting periods beginning after December 15, 2014. Management is currently evaluating the impact of the Update on the Fund's financial statements and related disclosures.
4. Purchases and Sales of Investments.
Purchases and sales of securities, other than short-term securities, aggregated $309,792,512 and $301,150,794, respectively.
5. Fees and Other Transactions with Affiliates.
Management Fee. Fidelity Management & Research Company (the investment adviser) and its affiliates provide the Fund with investment management related services for which the Fund pays a monthly management fee. The management fee is the sum of an individual fund fee rate that is based on an annual rate of .45% of the Fund's average net assets and an annualized group fee rate that averaged .25% during the period. The group fee rate is based upon the average net assets of all the mutual funds
Annual Report
Notes to Financial Statements - continued
5. Fees and Other Transactions with Affiliates - continued
Management Fee - continued
advised by the investment adviser, including any mutual funds previously advised by the investment adviser that are currently advised by Fidelity SelectCo, LLC, an affiliate of the investment adviser. The group fee rate decreases as assets under management increase and increases as assets under management decrease. In addition, the management fee is subject to a performance adjustment (up to a maximum of ± .20% of the Fund's average net assets over a 36 month performance period). The upward or downward adjustment to the management fee is based on the relative investment performance of Total International Equity as compared to its benchmark index, the MSCI All Country World ex USA Index, over the same 36 month performance period. For the reporting period, the total annual management fee rate, including the performance adjustment, was ..75% of the Fund's average net assets. The performance adjustment included in the management fee rate may be higher or lower than the maximum performance adjustment rate due to the difference between the average net assets for the reporting and performance periods.
Distribution and Service Plan Fees. In accordance with Rule 12b-1 of the 1940 Act, the Fund has adopted separate Distribution and Service Plans for each class of shares. Certain classes pay Fidelity Distributors Corporation (FDC), an affiliate of the investment adviser, separate Distribution and Service Fees, each of which is based on an annual percentage of each class' average net assets. In addition, FDC may pay financial intermediaries for selling shares of the Fund and providing shareholder support services. For the period, the Distribution and Service Fee rates, total fees and amounts retained by FDC were as follows:
| Distribution
Fee | Service
Fee | Total Fees | Retained
by FDC |
Class A | -% | .25% | $ 23,345 | $ 783 |
Class T | .25% | .25% | 45,742 | 42 |
Class B | .75% | .25% | 1,819 | 1,368 |
Class C | .75% | .25% | 38,756 | 4,324 |
| | | $ 109,662 | $ 6,517 |
Sales Load. FDC may receive a front-end sales charge of up to 5.75% for selling Class A shares and 3.50% for selling Class T shares, some of which is paid to financial intermediaries for selling shares of the Fund. Depending on the holding period, FDC may receive contingent deferred sales charges levied on Class A, Class T, Class B and Class C redemptions. The deferred sales charges range from 5.00% to 1.00% for Class B shares, 1.00% for Class C shares, 1.00% for certain purchases of Class A shares and .25% for certain purchases of Class T shares.
Annual Report
5. Fees and Other Transactions with Affiliates - continued
Sales Load - continued
For the period, sales charge amounts retained by FDC were as follows:
| Retained
by FDC |
Class A | $ 2,209 |
Class T | 1,579 |
Class B* | 44 |
Class C* | 255 |
| $ 4,087 |
* When Class B and Class C shares are initially sold, FDC pays commissions from its own resources to financial intermediaries through which the sales are made.
Transfer Agent Fees. Fidelity Investments Institutional Operations Company, Inc., (FIIOC), an affiliate of the investment adviser, is the transfer, dividend disbursing and shareholder servicing agent for each class of the Fund. FIIOC receives account fees and asset-based fees that vary according to the account size and type of account of the shareholders of the respective classes of the Fund. FIIOC pays for typesetting, printing and mailing of shareholder reports, except proxy statements.
For the period, transfer agent fees for each class were as follows:
| Amount | % of
Class-Level Average
Net Assets |
Class A | $ 25,151 | .27 |
Class T | 24,329 | .27 |
Class B | 548 | .30 |
Class C | 11,816 | .30 |
Total International Equity | 398,576 | .12 |
Institutional Class | 5,548 | .24 |
| $ 465,968 | |
Accounting and Security Lending Fees. Fidelity Service Company, Inc. (FSC), an affiliate of the investment adviser, maintains the Fund's accounting records. The accounting fee is based on the level of average net assets for each month. Under a separate contract, FSC administers the security lending program. The security lending fee is based on the number and duration of lending transactions.
Brokerage Commissions. The Fund placed a portion of its portfolio transactions with brokerage firms which are affiliates of the investment adviser. Brokerage commissions are included in net realized gain (loss) and change in net unrealized appreciation (depreciation) in the Statement of Operations. The commissions paid to these affiliated firms were $1,000 for the period.
Annual Report
Notes to Financial Statements - continued
5. Fees and Other Transactions with Affiliates - continued
Interfund Lending Program. Pursuant to an Exemptive Order issued by the SEC, the Fund, along with other registered investment companies having management contracts with FMR or other affiliated entities of FMR, may participate in an interfund lending program. This program provides an alternative credit facility allowing the funds to borrow from, or lend money to, other participating affiliated funds. At period end, there were no interfund loans outstanding. The Fund's activity in this program during the period for which loans were outstanding was as follows:
Borrower or Lender | Average Loan
Balance | Weighted Average Interest Rate | Interest Expense |
Borrower | $ 11,277,714 | .33% | $ 723 |
Other. During the period, the investment adviser reimbursed the Fund for certain losses in the amount of $1,056.
6. Committed Line of Credit.
The Fund participates with other funds managed by the investment adviser or an affiliate in a $4.25 billion credit facility (the "line of credit") to be utilized for temporary or emergency purposes to fund shareholder redemptions or for other short-term liquidity purposes. The Fund has agreed to pay commitment fees on its pro-rata portion of the line of credit, which amounted to $583 and is reflected in Miscellaneous expenses on the Statement of Operations. During the period, the Fund did not borrow on this line of credit.
7. Security Lending.
The Fund lends portfolio securities through a lending agent from time to time in order to earn additional income. For equity securities, a lending agent is used and may loan securities to certain qualified borrowers, including Fidelity Capital Markets (FCM), a broker-dealer affiliated with the Fund. On the settlement date of the loan, the Fund receives collateral (in the form of U.S. Treasury obligations, letters of credit and/or cash) against the loaned securities and maintains collateral in an amount not less than 100% of the market value of the loaned securities during the period of the loan. The market value of the loaned securities is determined at the close of business of the Fund and any additional required collateral is delivered to the Fund on the next business day. If the borrower defaults on its obligation to return the securities loaned because of insolvency or other reasons, the Fund may apply collateral received from the borrower against the obligation. The Fund may experience delays and costs in recovering the securities loaned. Any cash collateral received is invested in the Fidelity Securities Lending Cash
Annual Report
7. Security Lending - continued
Central Fund. The value of loaned securities and cash collateral at period end are disclosed on the Fund's Statement of Assets and Liabilities. At period end, there were no security loans outstanding with FCM. Security lending income represents the income earned on investing cash collateral, less rebates paid to borrowers and any lending agent fees associated with the loan, plus any premium payments received for lending certain types of securities. Security lending income is presented in the Statement of Operations as a component of income from Fidelity Central Funds. Total security lending income during the period amounted to $110,200, including $462 from securities loaned to FCM.
8. Expense Reductions.
The investment adviser contractually agreed to reimburse each class to the extent annual operating expenses exceeded certain levels of average net assets as noted in the table below. This reimbursement will remain in place through December 31, 2015. Some expenses, for example interest expense, including commitment fees, are excluded from this reimbursement.
The following classes were in reimbursement during the period:
| Expense
Limitations | Reimbursement |
Class B | 2.20% | $ 38 |
Class C | 2.20% | 880 |
| | $ 918 |
In addition, the investment adviser reimbursed a portion of the Fund's operating expenses during the period in the amount of $1,566.
9. Distributions to Shareholders.
Distributions to shareholders of each class were as follows:
Years ended October 31, | 2014 | 2013 |
From net investment income | | |
Class A | $ 114,661 | $ 102,760 |
Class T | 92,140 | 49,034 |
Class B | 757 | 1,541 |
Class C | 24,034 | 28,314 |
Total International Equity | 4,825,256 | 5,630,153 |
Institutional Class | 33,527 | 33,750 |
Total | $ 5,090,375 | $ 5,845,552 |
Annual Report
Notes to Financial Statements - continued
9. Distributions to Shareholders - continued
Years ended October 31, | 2014 | 2013 |
From net realized gain | | |
Class A | $ 201,491 | $ 199,811 |
Class T | 179,326 | 93,853 |
Class B | 4,154 | 6,990 |
Class C | 83,657 | 92,492 |
Total International Equity | 7,158,781 | 9,320,186 |
Institutional Class | 51,867 | 55,869 |
Total | $ 7,679,276 | $ 9,769,201 |
10. Share Transactions.
Share transactions for each class were as follows and may contain automatic conversions between classes or exchanges between funds:
| Shares | Dollars |
Years ended October 31, | 2014 | 2013 | 2014 | 2013 |
Class A | | | | |
Shares sold | 232,039 | 510,102 | $ 1,877,334 | $ 3,880,513 |
Reinvestment of distributions | 38,586 | 41,103 | 306,762 | 293,886 |
Shares redeemed | (217,382) | (248,440) | (1,752,622) | (1,903,860) |
Net increase (decrease) | 53,243 | 302,765 | $ 431,474 | $ 2,270,539 |
Class T | | | | |
Shares sold | 525,401 | 807,518 | $ 4,252,382 | $ 6,202,497 |
Reinvestment of distributions | 33,829 | 19,724 | 270,968 | 142,209 |
Shares redeemed | (230,852) | (195,438) | (1,883,437) | (1,518,035) |
Net increase (decrease) | 328,378 | 631,804 | $ 2,639,913 | $ 4,826,671 |
Class B | | | | |
Shares sold | 2,568 | 827 | $ 21,032 | $ 6,304 |
Reinvestment of distributions | 604 | 1,165 | 4,866 | 8,437 |
Shares redeemed | (5,357) | (8,955) | (43,506) | (69,218) |
Net increase (decrease) | (2,185) | (6,963) | $ (17,608) | $ (54,477) |
Class C | | | | |
Shares sold | 174,035 | 129,341 | $ 1,421,548 | $ 986,204 |
Reinvestment of distributions | 10,201 | 12,546 | 81,608 | 90,328 |
Shares redeemed | (113,485) | (83,065) | (922,884) | (635,648) |
Net increase (decrease) | 70,751 | 58,822 | $ 580,272 | $ 440,884 |
Total International Equity | | | | |
Shares sold | 7,329,051 | 10,376,724 | $ 59,640,689 | $ 77,880,274 |
Reinvestment of distributions | 1,486,031 | 2,062,441 | 11,828,806 | 14,746,450 |
Shares redeemed | (7,554,096) | (11,840,491) | (61,144,473) | (90,585,484) |
Net increase (decrease) | 1,260,986 | 598,674 | $ 10,325,022 | $ 2,041,240 |
Annual Report
10. Share Transactions - continued
| Shares | Shares | Dollars | Dollars |
Years ended October 31, | 2014 | 2013 | 2014 | 2013 |
Institutional Class | | | | |
Shares sold | 127,536 | 142,800 | $ 1,054,194 | $ 1,078,337 |
Reinvestment of distributions | 10,120 | 12,587 | 80,252 | 89,619 |
Shares redeemed | (144,685) | (75,629) | (1,167,594) | (583,086) |
Net increase (decrease) | (7,029) | 79,758 | $ (33,148) | $ 584,870 |
11. Other.
The Fund's organizational documents provide former and current trustees and officers with a limited indemnification against liabilities arising in connection with the performance of their duties to the Fund. In the normal course of business, the Fund may also enter into contracts that provide general indemnifications. The Fund's maximum exposure under these arrangements is unknown as this would be dependent on future claims that may be made against the Fund. The risk of material loss from such claims is considered remote.
At the end of the period, a shareholder of record owned approximately 72% of the total outstanding shares of the Fund.
Annual Report
To the Trustees of Fidelity Investment Trust and Shareholders of Fidelity Total International Equity Fund:
We have audited the accompanying statement of assets and liabilities of Fidelity Total International Equity Fund (the Fund), a fund of Fidelity Investment Trust, including the schedule of investments, as of October 31, 2014, and the related statement of operations for the year then ended, the statement of changes in net assets for each of the two years in the period then ended, and the financial highlights for each of the five years in the period then ended. These financial statements and financial highlights are the responsibility of the Fund's management. Our responsibility is to express an opinion on these financial statements and financial highlights based on our audits.
We conducted our audits in accordance with the standards of the Public Company Accounting Oversight Board (United States). Those standards require that we plan and perform the audit to obtain reasonable assurance about whether the financial statements and financial highlights are free of material misstatement. The Fund is not required to have, nor were we engaged to perform, an audit of its internal control over financial reporting. Our audits included consideration of internal control over financial reporting as a basis for designing audit procedures that are appropriate in the circumstances, but not for the purpose of expressing an opinion on the effectiveness of the Fund's internal control over financial reporting. Accordingly, we express no such opinion. An audit also includes examining, on a test basis, evidence supporting the amounts and disclosures in the financial statements, assessing the accounting principles used and significant estimates made by management, as well as evaluating the overall financial statement presentation. Our procedures included confirmation of securities owned as of October 31, 2014, by correspondence with the custodians and brokers; where replies were not received from brokers, we performed other auditing procedures. We believe that our audits provide a reasonable basis for our opinion.
In our opinion, the financial statements and financial highlights referred to above present fairly, in all material respects, the financial position of Fidelity Total International Equity Fund as of October 31, 2014, the results of its operations for the year then ended, the changes in its net assets for each of the two years in the period then ended, and the financial highlights for each of the five years in the period then ended, in conformity with accounting principles generally accepted in the United States of America.
DELOITTE & TOUCHE LLP
Boston, Massachusetts
December 16, 2014
Annual Report
The Trustees, Member of the Advisory Board, and officers of the trust and fund, as applicable, are listed below. The Board of Trustees governs the fund and is responsible for protecting the interests of shareholders. The Trustees are experienced executives who meet periodically throughout the year to oversee the fund's activities, review contractual arrangements with companies that provide services to the fund, oversee management of the risks associated with such activities and contractual arrangements, and review the fund's performance. Except for James C. Curvey, each of the Trustees oversees 174 funds. Mr. Curvey oversees 407 funds.
The Trustees hold office without limit in time except that (a) any Trustee may resign; (b) any Trustee may be removed by written instrument, signed by at least two-thirds of the number of Trustees prior to such removal; (c) any Trustee who requests to be retired or who has become incapacitated by illness or injury may be retired by written instrument signed by a majority of the other Trustees; and (d) any Trustee may be removed at any special meeting of shareholders by a two-thirds vote of the outstanding voting securities of the trust. Each Trustee who is not an interested person (as defined in the 1940 Act) of the trust and the fund (Independent Trustee), shall retire not later than the last day of the calendar year in which his or her 75th birthday occurs. The Independent Trustees may waive this mandatory retirement age policy with respect to individual Trustees. The officers and Advisory Board Member hold office without limit in time, except that any officer and Advisory Board Member may resign or may be removed by a vote of a majority of the Trustees at any regular meeting or any special meeting of the Trustees. Except as indicated, each individual has held the office shown or other offices in the same company for the past five years.
Experience, Skills, Attributes, and Qualifications of the Fund's Trustees. The Governance and Nominating Committee has adopted a statement of policy that describes the experience, qualifications, attributes, and skills that are necessary and desirable for potential Independent Trustee candidates (Statement of Policy). The Board believes that each Trustee satisfied at the time he or she was initially elected or appointed a Trustee, and continues to satisfy, the standards contemplated by the Statement of Policy. The Governance and Nominating Committee also engages professional search firms to help identify potential Independent Trustee candidates who have the experience, qualifications, attributes, and skills consistent with the Statement of Policy. From time to time, additional criteria based on the composition and skills of the current Independent Trustees, as well as experience or skills that may be appropriate in light of future changes to board composition, business conditions, and regulatory or other developments, have also been considered by the professional search firms and the Governance and Nominating Committee. In addition, the Board takes into account the Trustees' commitment and participation in Board and committee meetings, as well as their leadership of standing and ad hoc committees throughout their tenure.
In determining that a particular Trustee was and continues to be qualified to serve as a Trustee, the Board has considered a variety of criteria, none of which, in isolation, was controlling. The Board believes that, collectively, the Trustees have balanced and diverse experience, qualifications, attributes, and skills, which allow the Board to operate effectively in governing the fund and protecting the interests of shareholders. Information about the specific experience, skills, attributes, and qualifications of each Trustee, which in each case led to the Board's conclusion that the Trustee should serve (or continue to serve) as a trustee of the fund, is provided below.
Annual Report
Trustees and Officers - continued
Board Structure and Oversight Function. James C. Curvey is an interested person (as defined in the 1940 Act) and currently serves as Chairman. The Trustees have determined that an interested Chairman is appropriate and benefits shareholders because an interested Chairman has a personal and professional stake in the quality and continuity of services provided to the fund. Independent Trustees exercise their informed business judgment to appoint an individual of their choosing to serve as Chairman, regardless of whether the Trustee happens to be independent or a member of management. The Independent Trustees have determined that they can act independently and effectively without having an Independent Trustee serve as Chairman and that a key structural component for assuring that they are in a position to do so is for the Independent Trustees to constitute a substantial majority for the Board. The Independent Trustees also regularly meet in executive session. Ned C. Lautenbach serves as Chairman of the Independent Trustees and as such (i) acts as a liaison between the Independent Trustees and management with respect to matters important to the Independent Trustees and (ii) with management prepares agendas for Board meetings.
Fidelity funds are overseen by different Boards of Trustees. The fund's Board oversees Fidelity's equity and high income funds and another Board oversees Fidelity's investment-grade bond, money market, and asset allocation funds. The asset allocation funds may invest in Fidelity funds overseen by the fund's Board. The use of separate Boards, each with its own committee structure, allows the Trustees of each group of Fidelity funds to focus on the unique issues of the funds they oversee, including common research, investment, and operational issues. On occasion, the separate Boards establish joint committees to address issues of overlapping consequences for the Fidelity funds overseen by each Board.
The Trustees operate using a system of committees to facilitate the timely and efficient consideration of all matters of importance to the Trustees, the fund, and fund shareholders and to facilitate compliance with legal and regulatory requirements and oversight of the fund's activities and associated risks. The Board, acting through its committees, has charged FMR and its affiliates with (i) identifying events or circumstances the occurrence of which could have demonstrably adverse effects on the fund's business and/or reputation; (ii) implementing processes and controls to lessen the possibility that such events or circumstances occur or to mitigate the effects of such events or circumstances if they do occur; and (iii) creating and maintaining a system designed to evaluate continuously business and market conditions in order to facilitate the identification and implementation processes described in (i) and (ii) above. Because the day-to-day operations and activities of the fund are carried out by or through FMR, its affiliates and other service providers, the fund's exposure to risks is mitigated but not eliminated by the processes overseen by the Trustees. While each of the Board's committees has responsibility for overseeing different aspects of the fund's activities, oversight is exercised primarily through the Operations, Audit, and Compliance Committees. In addition, the Independent Trustees have worked with FMR to enhance the Board's oversight of investment and financial risks, legal and regulatory risks, technology risks, and operational risks, including the development of additional risk reporting to the Board. For example, a working group comprised of Independent Trustees and FMR has worked and continues to work to review the Fidelity funds' valuation-related activities, reporting and risk management. Appropriate personnel, including but not limited to the fund's Chief Compliance Officer (CCO), FMR's internal auditor, the independent accountants, the fund's Treasurer and portfolio management personnel, make periodic reports to the Board's committees, as appropriate, including an annual review of FMR's risk management program for the Fidelity funds. The responsibilities of each standing committee, including their oversight responsibilities, are described further under "Standing Committees of the Fund's Trustees."
Annual Report
The fund's Statement of Additional Information (SAI) includes more information about the Trustees. To request a free copy, call Fidelity at 1-800-544-8544.
Interested Trustees*:
Correspondence intended for each Trustee who is an interested person may be sent to Fidelity Investments, 245 Summer Street, Boston, Massachusetts 02210.
Name, Year of Birth; Principal Occupations and Other Relevant Experience+ |
James C. Curvey (1935) |
Year of Election or Appointment: 2007 Trustee Chairman of the Board of Trustees |
| Mr. Curvey also serves as Trustee of other Fidelity funds. Mr. Curvey is a Director of Fidelity Research & Analysis Co. (2009-present), and Vice Chairman (2007-present) and Director of FMR LLC. In addition, Mr. Curvey serves as an Overseer for the Boston Symphony Orchestra and a member of the board of Artis Naples, Naples, Florida, and as a Trustee for Brewster Academy, Wolfeboro, New Hampshire. Previously, Mr. Curvey served as a Director of Fidelity Investments Money Management, Inc. (2009-2014), a Director of FMR (2007-2014), and a Director of FMR Co., Inc. (2007-2014). |
Charles S. Morrison (1960) |
Year of Election or Appointment: 2014 Trustee |
| Mr. Morrison also serves as Trustee of other funds. He serves as a Director of Fidelity Investments Money Mangement, Inc. (FIMM) (2014-present), Director of Fidelity SelectCo, LLC (2014-present), President, Asset Management (2014-present) and is an employee of Fidelity Investments. Previously, Mr. Morrison served as Vice President of Fidelity's Fixed Income and Asset Allocation Funds (2012-2014), President, Fixed Income (2011-2014), Vice President of Fidelity's Money Market Funds (2005-2009), President, Money Market Group Leader of FMR (2009), and Senior Vice President, Money Market Group of FMR (2004-2009). Mr. Morrison also served as Vice President of Fidelity's Bond Funds (2002-2005), certain Balanced Funds (2002-2005), and certain Asset Allocation Funds (2002-2007), and as Senior Vice President (2002-2005) of Fidelity's Bond Division. |
* Trustees have been determined to be "Interested Trustees" by virtue of, among other things, their affiliation with the trust or various entities under common control with FMR.
+ The information above includes each Trustee's principal occupation during the last five years and other information relating to the experience, attributes, and skills relevant to each Trustee's qualifications to serve as a Trustee, which led to the conclusion that each Trustee should serve as a Trustee for the fund.
Annual Report
Independent Trustees:
Correspondence intended for each Independent Trustee (that is, the Trustees other than the Interested Trustees) may be sent to Fidelity Investments, P.O. Box 55235, Boston, Massachusetts 02205-5235.
Name, Year of Birth; Principal Occupations and Other Relevant Experience+ |
Dennis J. Dirks (1948) |
Year of Election or Appointment: 2005 Trustee |
| Mr. Dirks also serves as Trustee of other Fidelity funds. Prior to his retirement in May 2003, Mr. Dirks was Chief Operating Officer and a member of the Board of The Depository Trust & Clearing Corporation (DTCC). He also served as President, Chief Operating Officer, and Board member of The Depository Trust Company (DTC) and President and Board member of the National Securities Clearing Corporation (NSCC). In addition, Mr. Dirks served as Chief Executive Officer and Board member of the Government Securities Clearing Corporation, Chief Executive Officer and Board member of the Mortgage-Backed Securities Clearing Corporation, as a Trustee and a member of the Finance Committee of Manhattan College (2005-2008), and as a Trustee and a member of the Finance Committee of AHRC of Nassau County (2006-2008). Mr. Dirks is a member of the Independent Directors Council (IDC) Governing Council (2010-present) and Board of Directors for The Brookville Center for Children's Services, Inc. (2009-present). |
Alan J. Lacy (1953) |
Year of Election or Appointment: 2008 Trustee |
| Mr. Lacy also serves as Trustee of other Fidelity funds. Mr. Lacy serves as Senior Adviser (2007-present) of Oak Hill Capital Partners, L.P. (private equity). Mr. Lacy also served as Chief Executive Officer (2000-2005) and Vice Chairman (2005-2006) of Sears Holdings Corporation and Sears, Roebuck and Co. (retail). In addition, Mr. Lacy serves as a member of the Board of Directors of Dave & Buster's Entertainment, Inc. (restaurant and entertainment complexes, 2010-present), Earth Fare, Inc. (retail grocery, 2012-present), The Hillman Companies, Inc. (hardware wholesalers, 2010-present), and Bristol-Myers Squibb Company (global pharmaceuticals, 2008-present). Mr. Lacy is a member of the Board of Trustees of The National Parks Conservation Association (2006-present). Previously, Mr. Lacy served as Chairman of the Board of Trustees of the National Parks Conservation Association (2008-2011) and as a member of the Board of Directors for the Western Union Company (global money transfer, 2006-2011). |
Ned C. Lautenbach (1944) |
Year of Election or Appointment: 2000 Trustee Chairman of the Independent Trustees |
| Mr. Lautenbach also serves as Trustee of other Fidelity funds. Mr. Lautenbach currently serves as the Lead Director of the Eaton Corporation Board of Directors (diversified industrial, 1997-present). Mr. Lautenbach is Chairman of the Board of Directors of the Philharmonic Center for the Arts in Naples, Florida (2012-present) and a member of the Council on Foreign Relations (1994-present). Previously, Mr. Lautenbach was a Partner/Advisory Partner at Clayton, Dubilier & Rice, LLC (private equity investment, 1998-2010), as well as a Director of Sony Corporation (2006-2007). |
Joseph Mauriello (1944) |
Year of Election or Appointment: 2008 Trustee |
| Mr. Mauriello also serves as Trustee of other Fidelity funds. Prior to his retirement in January 2006, Mr. Mauriello served in numerous senior management positions including Deputy Chairman and Chief Operating Officer (2004-2005), and Vice Chairman of Financial Services (2002-2004) of KPMG LLP US (professional services, 1965-2005). Mr. Mauriello currently serves as a member of the Board of Directors of XL Group plc. (global insurance and re-insurance, 2006-present). Previously, Mr. Mauriello served as a Director of the Hamilton Funds of the Bank of New York (2006-2007) and of Arcadia Resources Inc. (health care services and products, 2007-2012). |
Robert W. Selander (1950) |
Year of Election or Appointment: 2011 Trustee |
| Mr. Selander also serves as Trustee of other Fidelity funds. Previously, Mr. Selander served as a Member of the Advisory Board of other Fidelity funds (2011), and Executive Vice Chairman (2010), Chief Executive Officer (2009-2010), and President and Chief Executive Officer (1997-2009) of Mastercard, Inc. |
Cornelia M. Small (1944) |
Year of Election or Appointment: 2005 Trustee |
| Ms. Small also serves as Trustee of other Fidelity funds. Ms. Small is a member of the Board of Directors (2009-present) and Chair of the Investment Committee (2010-present) of the Teagle Foundation. Ms. Small also serves on the Investment Committee of the Berkshire Taconic Community Foundation (2008-present). Previously, Ms. Small served as Chairperson (2002-2008) and a member of the Investment Committee and Chairperson (2008-2012) and a member of the Board of Trustees of Smith College. In addition, Ms. Small served as Chief Investment Officer, Director of Global Equity Investments, and a member of the Board of Directors of Scudder, Stevens & Clark and Scudder Kemper Investments. |
William S. Stavropoulos (1939) |
Year of Election or Appointment: 2001 Trustee Vice Chairman of the Independent Trustees |
| Mr. Stavropoulos also serves as Trustee of other Fidelity funds. Mr. Stavropoulos serves as President and Founder of the Michigan Baseball Foundation, the Great Lakes Loons (2007-present). Mr. Stavropoulos is Chairman Emeritus of the Board of Directors of The Dow Chemical Company, where he previously served in numerous senior management positions, including President, CEO (1995-2000; 2002-2004), Chairman of the Executive Committee (2000-2006), and as a member of the Board of Directors (1990-2006). Currently, Mr. Stavropoulos is Chairman of the Board of Directors of Univar Inc. (global distributor of commodity and specialty chemicals), a Director of Teradata Corporation (data warehousing and technology solutions), and Maersk Inc. (industrial conglomerate), and a member of the Advisory Board for Metalmark Capital LLC (private equity investment, 2005-present). Mr. Stavropoulos is an operating advisor to Clayton, Dubilier & Rice, LLC (private equity investment). In addition, Mr. Stavropoulos is a member of the University of Notre Dame Advisory Council for the College of Science, a Trustee of the Rollin L. Gerstacker Foundation, and a Director of the Naples Philharmonic Center for the Arts. Previously, Mr. Stavropoulos served as a Director of Chemical Financial Corporation (bank holding company, 1993-2012) and Tyco International, Ltd. (multinational manufacturing and services, 2007-2012). |
David M. Thomas (1949) |
Year of Election or Appointment: 2008 Trustee |
| Mr. Thomas also serves as Trustee of other Fidelity funds. Mr. Thomas serves as Non-Executive Chairman of the Board of Directors of Fortune Brands Home and Security (home and security products, 2011-present), and as a member of the Board of Directors of Interpublic Group of Companies, Inc. (marketing communication, 2004-present). Previously, Mr. Thomas served as Executive Chairman (2005-2006) and Chairman and Chief Executive Officer (2000-2005) of IMS Health, Inc. (pharmaceutical and healthcare information solutions), and a Director of Fortune Brands, Inc. (consumer products, 2000-2011). |
+ The information above includes each Trustee's principal occupation during the last five years and other information relating to the experience, attributes, and skills relevant to each Trustee's qualifications to serve as a Trustee, which led to the conclusion that each Trustee should serve as a Trustee for the fund.
Advisory Board Member and Officers:
Correspondence intended for each officer and Peter S. Lynch may be sent to Fidelity Investments, 245 Summer Street, Boston, Massachusetts 02210. Officers appear below in alphabetical order.
Name, Year of Birth; Principal Occupation |
Peter S. Lynch (1944) |
Year of Election or Appointment: 2003 Member of the Advisory Board |
| Mr. Lynch also serves as Member of the Advisory Board of other Fidelity funds. Mr. Lynch is Vice Chairman and a Director of FMR and FMR Co., Inc. In addition, Mr. Lynch serves as a Trustee of Boston College and as the Chairman of the Inner-City Scholarship Fund. Previously, Mr. Lynch served on the Special Olympics International Board of Directors (1997-2006). |
Elizabeth Paige Baumann (1968) |
Year of Election or Appointment: 2012 Anti-Money Laundering (AML) Officer |
| Ms. Baumann also serves as AML Officer of other funds. She is Chief AML Officer of FMR LLC (2012-present) and is an employee of Fidelity Investments. Previously, Ms. Baumann served as Vice President and Deputy Anti-Money Laundering Officer (2007-2012). |
William C. Coffey (1969) |
Year of Election or Appointment: 2009 Assistant Secretary |
| Mr. Coffey also serves as Assistant Secretary of other funds. He is Senior Vice President and Deputy General Counsel of FMR LLC (2010-present), and is an employee of Fidelity Investments. Previously, Mr. Coffey served as Vice President and Associate General Counsel of FMR LLC (2005-2009). |
Timothy M. Cohen (1969) |
Year of Election or Appointment: 2014 Vice President of certain Equity Funds |
| Mr. Cohen also serves as Vice President of other funds. Mr. Cohen serves as a Director and Chief Compliance Officer of Fidelity Management & Research (U.K.) Inc. (2013-present) and is an employee of Fidelity Investments. |
Jonathan Davis (1968) |
Year of Election or Appointment: 2010 Assistant Treasurer |
| Mr. Davis also serves as Assistant Treasurer of other funds. Mr. Davis is an employee of Fidelity Investments. Previously, Mr. Davis served as Vice President and Associate General Counsel of FMR LLC (2003-2010). |
Adrien E. Deberghes (1967) |
Year of Election or Appointment: 2008 Deputy Treasurer |
| Mr. Deberghes also serves as an officer of other funds. He is an employee of Fidelity Investments (2008-present). Prior to joining Fidelity Investments, Mr. Deberghes was Senior Vice President of Mutual Fund Administration at State Street Corporation (2007-2008), Senior Director of Mutual Fund Administration at Investors Bank & Trust (2005-2007), and Director of Finance for Dunkin' Brands (2000-2005). |
Stephanie J. Dorsey (1969) |
Year of Election or Appointment: 2010 Assistant Treasurer |
| Ms. Dorsey also serves as an officer of other funds. She is an employee of Fidelity Investments (2008-present) and has served in other fund officer roles. Prior to joining Fidelity Investments, Ms. Dorsey served as Treasurer (2004-2008) of the JPMorgan Mutual Funds and Vice President (2004-2008) of JPMorgan Chase Bank. |
Howard J. Galligan III (1966) |
Year of Election or Appointment: 2014 Chief Financial Officer |
| Mr. Galligan also serves as Chief Financial Officer of other funds. Mr. Galligan serves as President of Fidelity Pricing and Cash Management Services (FPCMS) (2014-present) and as a Director of Strategic Advisers, Inc. (2008-present). Previously, Mr. Galligan served as Chief Administrative Officer of Asset Management (2011-2014) and Chief Operating Officer and Senior Vice President of Investment Support for Strategic Advisers, Inc. (2003-2011). |
Scott C. Goebel (1968) |
Year of Election or Appointment: 2008 Secretary and Chief Legal Officer (CLO) |
| Mr. Goebel serves as Secretary and CLO of other funds. Mr. Goebel also serves as Secretary of Fidelity SelectCo, LLC (2013-present), Fidelity Investments Money Management, Inc. (FIMM) (2010-present) and Fidelity Research and Analysis Company (FRAC) (2010-present); General Counsel, Secretary, and Senior Vice President of FMR (2008-present) and FMR Co., Inc. (2008-present); Chief Legal Officer of Fidelity Management & Research (Hong Kong) Limited (2008-present); and Assistant Secretary of Fidelity Management & Research (Japan) Limited (2008-present) and Fidelity Management & Research (U.K.) Inc. (2008-present). Previously, Mr. Goebel served as Secretary and CLO of other Fidelity funds (2008-2013), Assistant Secretary of FIMM (2008-2010), FRAC (2008-2010), and certain funds (2007-2008); and as Vice President and Secretary of Fidelity Distributors Corporation (FDC) (2005-2007). Mr. Goebel has been employed by FMR LLC or an affiliate since 2001. |
Brian B. Hogan (1964) |
Year of Election or Appointment: 2009 Vice President |
| Mr. Hogan also serves as Trustee or Vice President of other funds. Mr. Hogan serves as a Director of Fidelity SelectCo, LLC (2014-present) and President of FMR's Equity Division (2009-present). Previously, Mr. Hogan served as Senior Vice President, Equity Research of FMR (2006-2009) and as a portfolio manager. |
Chris Maher (1972) |
Year of Election or Appointment: 2013 Assistant Treasurer |
| Mr. Maher serves as Assistant Treasurer of other funds. Mr. Maher is Vice President of Valuation Oversight and is an employee of Fidelity Investments. Previously, Mr. Maher served as Vice President of Asset Management Compliance (2013), Vice President of FMR's Program Management Group (2010-2013), and Vice President of Valuation Oversight (2008-2010). |
Kenneth B. Robins (1969) |
Year of Election or Appointment: 2008 President and Treasurer |
| Mr. Robins also serves as an officer of other funds. Mr. Robins serves as Executive Vice President of Fidelity Investments Money Management, Inc. (FIMM) (2013-present) and is an employee of Fidelity Investments (2004-present). Previously, Mr. Robins served in other fund officer roles. |
Stephen Sadoski (1971) |
Year of Election or Appointment: 2012 Deputy Treasurer |
| Mr. Sadoski also serves as Deputy Treasurer of other funds. He is an employee of Fidelity Investments (2012-present) and has served in another fund officer role. Prior to joining Fidelity Investments, Mr. Sadoski served as an assistant chief accountant in the Division of Investment Management of the Securities and Exchange Commission (SEC) (2009-2012) and as a senior manager at Deloitte & Touche LLP (1997-2009). |
Stacie M. Smith (1974) |
Year of Election or Appointment: 2013 Deputy Treasurer |
| Ms. Smith also serves as an officer of other funds. She is an employee of Fidelity Investments (2009-present) and has served in other fund officer roles. Prior to joining Fidelity Investments, Ms. Smith served as Senior Audit Manager of Ernst & Young LLP (1996-2009). |
Renee Stagnone (1975) |
Year of Election or Appointment: 2013 Deputy Treasurer |
| Ms. Stagnone also serves as Deputy Treasurer of other funds. Ms. Stagnone is an employee of Fidelity Investments. |
Linda J. Wondrack (1964) |
Year of Election or Appointment: 2014 Chief Compliance Officer |
| Ms. Wondrack also serves as Chief Compliance Officer of other funds. Ms. Wondrack is Executive Vice President and head of the Ethics Office and Asset Management Compliance for Fidelity Investments (2012-present). Ms. Wondrack also serves as Chief Compliance Officer of Fidelity SelectCo, LLC (2014-present); Chief Compliance Officer of Impresa Management LLC (2013-present); and Chief Compliance Officer of FMR Co., Inc., Fidelity Investments Money Management, Inc., Fidelity Management & Research (Japan) Limited, Fidelity Management & Research (U.K.) Inc., Fidelity Management & Research (Hong Kong), Fidelity Management & Research Company, Pyramis Global Advisors, LLC, and Strategic Advisers, Inc., Ballyrock Investment Advisors LLC, and Northern Neck Investors LLC (2012-present). Previously, Ms. Wondrack served as Senior Vice President and Chief Compliance Officer for Columbia Management Investment Advisers, LLC (2005-2012); Chief Compliance Officer for certain funds within the Columbia Family of Funds (2007-2012); and Senior Vice President of Compliance Risk Management at Bank of America (2005-2010). |
Joseph F. Zambello (1957) |
Year of Election or Appointment: 2011 Deputy Treasurer |
| Mr. Zambello also serves as Deputy Treasurer of other funds. Mr. Zambello is an employee of Fidelity Investments. Previously, Mr. Zambello served as Vice President of FMR's Program Management Group (2009-2011) and Vice President of the Transfer Agent Oversight Group (2005-2009). |
Annual Report
The Board of Trustees of Fidelity Total International Equity Fund voted to pay on December 8, 2014, to shareholders of record at the opening of business on December 5, 2014, a distribution of $0.040 per share derived from capital gains realized from sales of portfolio securities and a dividend of $0.130 per share from net investment income.
The fund hereby designates as a capital gain dividend with respect to the taxable year ended October 31st, 2014, $1,957,679, or, if subsequently determined to be different, the net capital gain of such year.
The fund designates 3% of the dividends distributed during the fiscal year as qualifying for the dividends-received deduction for corporate shareholders.
The fund designates 66% of the dividends distributed in December 2013 during the fiscal year as amounts which may be taken into account as a dividend for the purposes of the maximum rate under section 1(h)(11) of the Internal Revenue Code.
The amounts per share which represent income derived from sources within, and taxes paid to, foreign countries or possessions of the United States are as follows:
| Pay Date | Income | Taxes |
International Value Fund | 12/09/2013 | $0.1124 | $0.0119 |
The fund will notify shareholders in January 2015 of amounts for use in preparing 2014 income tax returns.
Annual Report
Board Approval of Investment Advisory Contracts and Management Fees
Fidelity Total International Equity Fund
Each year, the Board of Trustees, including the Independent Trustees (together, the Board), votes on the renewal of the management contract with Fidelity Management & Research Company (FMR) and the sub-advisory agreements (together, the Advisory Contracts) for the fund. The Board, assisted by the advice of fund counsel and Independent Trustees' counsel, requests and considers a broad range of information relevant to the renewal of the Advisory Contracts throughout the year.
The Board meets regularly and, at each of its meetings, covers an extensive agenda of topics and materials and considers factors that are relevant to its annual consideration of the renewal of the fund's Advisory Contracts, including the services and support provided to the fund and its shareholders. The Board has established various standing committees (Committees), each composed of and chaired by Independent Trustees with varying backgrounds, to which the Board has assigned specific subject matter responsibilities in order to enhance effective decision-making by the Board. The Board, acting directly and through its Committees, requests and receives information concerning the annual consideration of the renewal of the fund's Advisory Contracts. The Board also meets as needed to consider matters specifically related to the Board's annual consideration of the renewal of the Advisory Contracts. Members of the Board may also meet with trustees of other Fidelity funds through ad hoc joint committees to discuss certain matters relevant to the Fidelity funds.
At its July 2014 meeting, the Board, including the Independent Trustees, unanimously determined to renew the fund's Advisory Contracts. In reaching its determination, the Board considered all factors it believed relevant, including (i) the nature, extent, and quality of the services to be provided to the fund and its shareholders (including the investment performance of the fund); (ii) the competitiveness of the fund's management fee and total expense ratio relative to peer funds; (iii) the total costs of the services to be provided by and the profits to be realized by Fidelity from its relationship with the fund; (iv) the extent to which economies of scale exist and would be realized as the fund grows; and (v) whether fee levels reflect these economies of scale, if any, for the benefit of fund shareholders. In connection with separate internal corporate reorganizations involving Fidelity Management & Research (U.K.) Inc. (FMR U.K.) and Fidelity Management & Research (Japan) Inc. (FMR Japan), the Board approved certain non-material amendments to the fund's sub-advisory agreements with FMR U.K. and FMR Japan to reflect that, after these reorganizations, FMR Investment Management (UK) Limited and Fidelity Management & Research (Japan) Limited will carry on the business of FMR U.K. and FMR Japan, respectively. The Board noted that no changes to the portfolio managers or to the foreign research or investment advisory services provided to the fund were expected in connection with either reorganization and that the same personnel and resources would continue to be available to the fund at the new entities.
Annual Report
In considering whether to renew the Advisory Contracts for the fund, the Board reached a determination, with the assistance of fund counsel and Independent Trustees' counsel and through the exercise of its business judgment, that the renewal of the Advisory Contracts was in the best interests of the fund and its shareholders and that the compensation payable under the Advisory Contracts was fair and reasonable. The Board's decision to renew the Advisory Contracts was not based on any single factor, but rather was based on a comprehensive consideration of all the information provided to the Board at its meetings throughout the year. The Board, in reaching its determination to renew the Advisory Contracts, was aware that shareholders of the fund have a broad range of investment choices available to them, including a wide choice among funds offered by Fidelity's competitors, and that the fund's shareholders, who have the opportunity to review and weigh the disclosure provided by the fund in its prospectus and other public disclosures, have chosen to invest in this fund, which is part of the Fidelity family of funds.
Nature, Extent, and Quality of Services Provided. The Board considered Fidelity's staffing as it relates to the fund, including the backgrounds of investment personnel of FMR and the sub-advisers (together, the Investment Advisers), and also considered the fund's investment objective, strategies, and related investment philosophy. The Independent Trustees also had discussions with senior management of Fidelity's investment operations and investment groups. The Board considered the structure of the portfolio manager compensation program and whether this structure provides appropriate incentives to act in the best interests of the fund. Additionally, the Board considered the portfolio managers' investments, if any, in the funds that they manage.
Resources Dedicated to Investment Management and Support Services. The Board and the Fund Oversight and Research Committees reviewed the general qualifications and capabilities of Fidelity's investment staff, including its size, education, experience, and resources, as well as Fidelity's approach to recruiting, training, managing, and compensating investment personnel. The Board noted that Fidelity has continued to increase the resources devoted to non-U.S. offices, including expansion of Fidelity's global investment organization. The Board also noted that Fidelity's analysts have extensive resources, tools and capabilities that allow them to conduct sophisticated quantitative and fundamental analysis, as well as credit analysis of issuers, counterparties and guarantors. Further, the Board believes that Fidelity's investment professionals have sufficient access to global information and data so as to provide competitive investment results over time, and that those professionals also have access to sophisticated tools that permit them to assess portfolio construction and risk and performance attribution characteristics continuously, as well as to transmit new information and research conclusions rapidly around the world. Additionally, in its deliberations, the Board considered Fidelity's trading and risk management capabilities and resources and global compliance infrastructure, which are an integral part of the investment management process.
Annual Report
Board Approval of Investment Advisory Contracts and
Management Fees - continued
Shareholder and Administrative Services. The Board considered (i) the nature, extent, quality, and cost of advisory, administrative, and shareholder services performed by the Investment Advisers and their affiliates under the Advisory Contracts and under separate agreements covering transfer agency, pricing and bookkeeping, and securities lending services for the fund; (ii) the nature and extent of the supervision of third party service providers, principally custodians and subcustodians; and (iii) the resources devoted to, and the record of compliance with, the fund's compliance policies and procedures. The Board also reviewed the allocation of fund brokerage, including allocations to brokers affiliated with the Investment Advisers, the use of brokerage commissions to pay fund expenses, and the use of "soft" commission dollars to pay for research services.
The Board noted that the growth of fund assets over time across the complex allows Fidelity to reinvest in the development of services designed to enhance the value or convenience of the Fidelity funds as investment vehicles. These services include 24-hour access to account information and market information through telephone representatives and over the Internet, investor education materials and asset allocation tools, and the expanded availability of Fidelity Investor Centers.
In 2014, the Board formed an ad hoc Committee on Transfer Agency Fees to review the variety of transfer agency fee structures throughout the industry and Fidelity's competitive positioning with respect to industry participants.
Investment in a Large Fund Family. The Board considered the benefits to shareholders of investing in a Fidelity fund, including the benefits of investing in a fund that is part of a large family of funds offering a variety of investment disciplines and providing a large variety of mutual fund investor services. The Board noted that Fidelity had taken, or had made recommendations that resulted in the Fidelity funds taking, a number of actions over the previous year that benefited particular funds, including (i) continuing to dedicate additional resources to investment research and to the support of the senior management team that oversees asset management; (ii) persisting in efforts to enhance Fidelity's global research capabilities; (iii) launching new funds and making other enhancements to meet client needs for income-oriented solutions; (iv) reducing fund expenses for certain index funds; (v) continuing to launch dedicated lower cost underlying funds to meet portfolio construction needs related to expanding underlying fund options for Fidelity funds of funds, specifically for the Freedom Fund product lines; (vi) rationalizing product lines and gaining increased efficiencies through fund mergers; (vii) launching sector-based exchange-traded funds and establishing a new Fidelity adviser to manage sector-based funds and products; (viii) continuing to develop and implement technology to improve security and increase efficiency; (ix) modifying the eligibility criteria for certain share classes to increase their marketability to a portion of the defined contribution plan market; (x) waiving redemption fees for certain qualified fund-of-fund and wrap programs and certain retirement plan transactions; and (xi) launching new Institutional Class shares of certain money market funds to attract and retain assets and to fill a gap in the money market fund lineup.
Annual Report
Investment Performance. The Board considered whether the fund has operated in accordance with its investment objective, as well as its record of compliance with its investment restrictions and its performance history.
The Board took into account discussions with the Investment Advisers about fund investment performance that occur at Board meetings throughout the year. In this regard the Board noted that as part of regularly scheduled fund reviews and other reports to the Board on fund performance, the Board periodically considers annualized return information for the fund, for different time periods, measured against a securities market index ("benchmark index") and a peer group of funds with similar objectives ("peer group"). In its evaluation of fund investment performance, the Board gave particular attention to information indicating changes in performance of certain Fidelity funds for specific time periods and the Investment Advisers' explanations for any overperformance or underperformance.
In addition to reviewing absolute and relative fund performance, the Independent Trustees periodically consider the appropriateness of fund performance metrics in evaluating the results achieved. In general, the Independent Trustees believe that fund performance should be evaluated based on net performance (after fees and expenses) of both the highest performing and lowest performing classes, where applicable, compared to appropriate benchmark indices, over appropriate time periods which may include full market cycles, and compared to peer groups, as applicable, over the same periods, taking into account relevant factors including the following: general market conditions; issuer-specific information; tactical opportunities for investment; and fund cash flows and other factors.
The Independent Trustees recognize that shareholders evaluate performance on a net basis over their own holding periods, for which one-, three-, and five-year periods are often used as a proxy. For this reason, the performance information reviewed by the Board also included net cumulative calendar year total return information for the fund and an appropriate benchmark index and peer group for the most recent one-, three-, and five-year periods, as shown below. Returns are shown compared to the 25th percentile (top of box, 75% beaten) and 75th percentile (bottom of box, 25% beaten) of the peer universe. Returns of the benchmark index are "net MA," i.e., adjusted for tax withholding rates applicable to U.S.-based funds organized as Massachusetts business trusts.
Annual Report
Board Approval of Investment Advisory Contracts and
Management Fees - continued
Fidelity Total International Equity Fund

The Board also considered that the fund's management fee is subject to upward or downward adjustment depending upon whether, and to what extent, the fund's investment performance for the performance period exceeds, or is exceeded by, a securities index, thus leading to a performance adjustment for the same period. The Board noted that the performance adjustment provides FMR with a strong economic incentive to seek to achieve superior performance for the fund's shareholders and helps to more closely align the interests of FMR and the fund's shareholders.
Based on its review, the Board concluded that the nature, extent, and quality of services provided to the fund under the Advisory Contracts should benefit the fund's shareholders.
Competitiveness of Management Fee and Total Expense Ratio. The Board considered the fund's management fee and total expense ratio compared to "mapped groups" of competitive funds and classes. Fidelity creates "mapped groups" by combining similar Lipper investment objective categories that have comparable investment mandates. Combining Lipper investment objective categories aids the Board's management fee and total expense ratio comparisons by broadening the competitive group used for comparison and by reducing the number of universes to which various Fidelity funds are compared.
Management Fee. The Board considered two proprietary management fee comparisons for the 12-month periods shown in the chart below. The group of Lipper funds used by the Board for management fee comparisons is referred to below as the "Total Mapped Group." The Total Mapped Group comparison focuses on a fund's standing in terms of gross management fees before expense reimbursements or caps, and without giving effect to the fund's performance adjustment, relative to the total universe of funds with comparable investment mandates, regardless of whether their management fee structures also are comparable. Funds with comparable investment mandates offer exposure to similar types of securities. Funds with comparable management fee structures have similar management fee contractual arrangements (e.g., flat rate charged for advisory services, all-inclusive fee rate, etc.). "TMG %" represents the percentage of funds in the Total Mapped Group that had management fees that were lower than the fund's. For example, a hypothetical TMG % of 20% would mean that 80% of the funds in the Total Mapped Group had higher, and 20% had lower, management fees than the fund. The fund's actual TMG %s are in the chart below. The "Asset-Size Peer Group" (ASPG) comparison focuses on a fund's standing relative to a subset of non-Fidelity funds within the Total Mapped Group that are similar in size and management fee structure. For example, if a fund is in the first quartile of the ASPG, the fund's management fee ranks in the least expensive or lowest 25% of funds in the ASPG. The ASPG represents at least 15% of the funds in the Total Mapped Group with comparable asset size and management fee structures, subject to a minimum of 50 funds (or all funds in the Total Mapped Group if fewer than 50). Additional information, such as the ASPG quartile in which the fund's management fee rate ranked and the impact of the fund's performance adjustment, is also included in the chart and considered by the Board.
Annual Report
Fidelity Total International Equity Fund

The Board noted that the fund's management fee rate ranked below the median of its Total Mapped Group and below the median of its ASPG for 2013. The Board also noted the effect of the fund's positive performance adjustment on the fund's management fee ranking.
Annual Report
Board Approval of Investment Advisory Contracts and
Management Fees - continued
The Board also noted that, in August 2013, the ad hoc Committee on Management Fees was formed to conduct an in-depth review of the management fee rates of Fidelity's active equity mutual funds. The Committee focused on the following areas: (i) standard fee structures; (ii) research consumption and trading evolution; (iii) management fee competitiveness/profitability by category; and (iv) factors that drive institutional pricing.
Based on its review, the Board concluded that the fund's management fee is fair and reasonable in light of the services that the fund receives and the other factors considered.
Total Expense Ratio. In its review of each class's total expense ratio, the Board considered the fund's management fee as well as other fund or class expenses, as applicable, such as transfer agent fees, pricing and bookkeeping fees, fund-paid 12b-1 fees, and custodial, legal, and audit fees. The Board also noted the effects of any waivers and reimbursements on fees and expenses, as well as the impact of the fund's performance adjustment. As part of its review, the Board also considered the current and historical total expense ratios of each class of the fund compared to competitive fund median expenses. Each class of the fund is compared to those funds and classes in the Total Mapped Group (used by the Board for management fee comparisons) that have a similar sales load structure.
The Board noted that the total expense ratio of the retail class ranked below its competitive median for 2013 and the total expense ratio of each of Class A, Class T, Class B, Class C, and Institutional Class ranked above its competitive median for 2013. The Board considered that, in general, various factors can affect total expense ratios. The Board noted that the total expense ratio of Class T was above the competitive median primarily because of higher 12b-1 fees on Class T as compared to most competitor funds. Class T has a higher 12b-1 fee, but a lower front-end sales charge, than traditionally priced front-end sales charge classes. The Board considered that Class T is primarily sold load-waived in the retirement plan market where its 0.50% 12b-1 fee is comparable to competing no-load, higher 12b-1 fee classes designed specifically for retirement plans. The Board noted that the fund offers multiple classes, each of which has a different sales load and 12b-1 fee structure, and that the multiple structures are intended to offer a range of pricing options for the intermediary market. The Board also noted that the total expense ratios of the classes vary primarily by the level of their 12b-1 fees, although differences in transfer agent fees may also cause expenses to vary from class to class.
The Board further considered that FMR contractually agreed to reimburse Class A, Class T, Class B, Class C, Institutional Class, and the retail class of the fund to the extent that total operating expenses (excluding interest, certain taxes, certain securities lending costs, brokerage commissions, extraordinary expenses, and acquired fund fees and expenses, if any), as a percentage of their respective average net assets, exceed 1.45%, 1.70%, 2.20%, 2.20%, 1.20%, and 1.20% through December 31, 2014.
Annual Report
Fees Charged to Other Fidelity Clients. The Board also considered Fidelity fee structures and other information with respect to clients of Fidelity, such as other funds advised or subadvised by Fidelity, pension plan clients, and other institutional clients. The Board noted the findings of the 2013 ad hoc joint committee (created with the board of other Fidelity funds), which reviewed and compared Fidelity's institutional investment advisory business with its business of providing services to the Fidelity funds, including the differences in services provided, fees charged, and costs incurred, as well as competition in their respective marketplaces.
Based on its review of total expense ratios and fees charged to other Fidelity clients, the Board concluded that the total expense ratio of each class of the fund was reasonable, although in some cases above the median of the universe presented for comparison, in light of the services that the fund and its shareholders receive and the other factors considered.
Costs of the Services and Profitability. The Board considered the revenues earned and the expenses incurred by Fidelity in conducting the business of developing, marketing, distributing, managing, administering and servicing the fund and servicing the fund's shareholders. The Board also considered the level of Fidelity's profits in respect of all the Fidelity funds.
On an annual basis, Fidelity presents to the Board Fidelity's profitability for the fund. Fidelity calculates the profitability for each fund, as well as aggregate profitability for groups of Fidelity funds and all Fidelity funds, using a series of detailed revenue and cost allocation methodologies which originate with the books and records of Fidelity on which Fidelity's audited financial statements are based. The Audit Committee of the Board reviews any significant changes from the prior year's methodologies.
PricewaterhouseCoopers LLP (PwC), independent registered public accounting firm and auditor to Fidelity and certain Fidelity funds, has been engaged annually by the Board as part of the Board's assessment of Fidelity's profitability analysis. PwC's engagement includes the review and assessment of the methodologies used by Fidelity in determining the revenues and expenses attributable to Fidelity's mutual fund business, and completion of agreed-upon procedures in respect of the mathematical accuracy of fund profitability and its conformity to established allocation methodologies. After considering PwC's reports issued under the engagement and information provided by Fidelity, the Board concluded that while other allocation methods may also be reasonable, Fidelity's profitability methodologies are reasonable in all material respects.
The Board also reviewed Fidelity's non-fund businesses and fall-out benefits related to the mutual fund business as well as cases where Fidelity's affiliates may benefit from or be related to the fund's business.
Annual Report
Board Approval of Investment Advisory Contracts and
Management Fees - continued
The Board considered the costs of the services provided by and the profits realized by Fidelity in connection with the operation of the fund and was satisfied that the profitability was not excessive in the circumstances.
Economies of Scale. The Board considered whether there have been economies of scale in respect of the management of the Fidelity funds, whether the Fidelity funds (including the fund) have appropriately benefited from any such economies of scale, and whether there is potential for realization of any further economies of scale. The Board considered the extent to which the fund will benefit from economies of scale through increased services to the fund, through waivers or reimbursements, or through fee or expense ratio reductions. The Board also noted that in 2013, it and the boards of other Fidelity funds created an ad hoc committee (the Economies of Scale Committee) to analyze whether Fidelity attains economies of scale in respect of the management and servicing of the Fidelity funds, whether the Fidelity funds have appropriately benefited from such economies of scale, and whether there is potential for realization of any further economies of scale.
The Board recognized that the fund's management contract incorporates a "group fee" structure, which provides for lower group fee rates as total group assets increase, and for higher group fee rates as total group assets decrease (with "group assets" defined to include fund assets under FMR's management plus sector fund assets previously under FMR's management and currently managed by Fidelity SelectCo, LLC). FMR calculates the group fee rates based on a tiered asset "breakpoint" schedule that varies based on asset class. The Board considered that the group fee is designed to deliver the benefits of economies of scale to fund shareholders when total Fidelity fund assets increase, even if assets of any particular fund are unchanged or have declined, because some portion of Fidelity's costs are attributable to services provided to all Fidelity funds, and all funds benefit if those costs can be allocated among more assets. The Board concluded that, given the group fee structure, fund shareholders will benefit from lower management fees as group assets increase at the fund complex level, regardless of whether Fidelity achieves any such economies of scale.
The Board concluded, taking into account the analysis of the Economies of Scale Committee, that economies of scale, if any, are being appropriately shared between fund shareholders and Fidelity.
Additional Information Requested by the Board. In order to develop fully the factual basis for consideration of the Fidelity funds' Advisory Contracts, the Board requested and received additional information on certain topics, including: (i) fund performance trends and Fidelity's long-term strategies for certain funds; (ii) Fidelity's strategic marketing and product lineup goals; (iii) the methodology with respect to competitive fund data and peer group classifications; (iv) the arrangements with, and performance of, certain sub-advisers on behalf of the Fidelity funds, as well as certain proposed participating affiliate arrangements; (v) the realization of fall-out benefits in certain Fidelity business units; (vi) Fidelity's group fee structures, including the rationale for the individual fee rates of certain categories of funds and the definition of group assets; (vii) trends regarding industry use of performance fee structures and the performance adjustment methodologies applicable to the Fidelity funds; (viii) additional competitive analysis regarding the total expenses for certain classes; (ix) fund profitability methodology, including Fidelity's cost allocation methodology, and the impact of certain factors on fund profitability results; and (x) the process by which Fidelity determines sub-advisory fees for funds it advises.
Annual Report
Based on its evaluation of all of the conclusions noted above, and after considering all factors it believed relevant, the Board ultimately concluded that the advisory fee structures are fair and reasonable, and that the fund's Advisory Contracts should be renewed.
Annual Report
Investment Adviser
Fidelity Management & Research Company
Boston, MA
Investment Sub-Advisers
FMR Co., Inc.
Fidelity Management & Research
(U.K.) Inc.
Fidelity Management & Research
(Hong Kong) Limited
Fidelity Management & Research
(Japan) Limited
FIL Investment Advisors
FIL Investments (Japan) Limited
FIL Investment Advisors (U.K.)
Limited
General Distributor
Fidelity Distributors Corporation
Smithfield, RI
Transfer and Service Agents
Fidelity Investments Institutional
Operations Company, Inc.
Boston, MA
Fidelity Service Company, Inc.
Boston, MA
Custodian
State Street Bank and Trust Company
Quincy, MA
The Fidelity Telephone Connection
Mutual Fund 24-Hour Service
Exchanges/Redemptions
and Account Assistance 1-800-544-6666
Product Information 1-800-544-8888
Retirement Accounts 1-800-544-4774
(8 a.m. - 9 p.m.)
TDD Service 1-800-544-0118
for the deaf and hearing impaired
(9 a.m. - 9 p.m. Eastern time)
Fidelity Automated Service
Telephone (FAST®)
1-800-544-5555
Automated line for quickest service
(Fidelity Investment logo)(registered trademark)
Corporate Headquarters
245 Summer St., Boston, MA 02210
www.fidelity.com
TIE-UANN-1214
1.912357.104
Item 2. Code of Ethics
As of the end of the period, October 31, 2014, Fidelity Investment Trust (the trust) has adopted a code of ethics, as defined in Item 2 of Form N-CSR, that applies to its President and Treasurer and its Chief Financial Officer. A copy of the code of ethics is filed as an exhibit to this Form N-CSR.
Item 3. Audit Committee Financial Expert
The Board of Trustees of the trust has determined that Joseph Mauriello is an audit committee financial expert, as defined in Item 3 of Form N-CSR. Mr. Mauriello is independent for purposes of Item 3 of Form N-CSR.
Item 4. Principal Accountant Fees and Services
Fees and Services
The following table presents fees billed by Deloitte & Touche LLP, the member firms of Deloitte Touche Tohmatsu, and their respective affiliates (collectively, "Deloitte Entities") in each of the last two fiscal years for services rendered to Fidelity Emerging Europe, Middle East, Africa (EMEA) Fund, Fidelity Global Equity Income Fund, Fidelity International Small Cap Fund, Fidelity International Small Cap Opportunities Fund, Fidelity International Value Fund, Fidelity Series Emerging Markets Fund, Fidelity Series International Small Cap Fund, Fidelity Series International Value Fund, and Fidelity Total International Equity Fund (the "Funds"):
Services Billed by Deloitte Entities
October 31, 2014 FeesA
| Audit Fees | Audit-Related Fees | Tax Fees | All Other Fees |
Fidelity Emerging Europe, Middle East, Africa (EMEA) Fund | $50,000 | $- | $6,000 | $600 |
Fidelity Global Equity Income Fund | $46,000 | $- | $6,000 | $600 |
Fidelity International Small Cap Fund | $124,000 | $- | $6,900 | $800 |
Fidelity International Small Cap Opportunities Fund | $50,000 | $- | $5,800 | $700 |
Fidelity International Value Fund | $48,000 | $- | $5,800 | $600 |
Fidelity Series Emerging Markets Fund | $42,000 | $- | $6,900 | $2,300 |
Fidelity Series International Small Cap Fund | $45,000 | $- | $5,800 | $1,200 |
Fidelity Series International Value Fund | $45,000 | $- | $5,800 | $3,300 |
Fidelity Total International Equity Fund | $57,000 | $- | $6,700 | $700 |
October 31, 2013 FeesA
| Audit Fees | Audit-Related Fees | Tax Fees | All Other Fees |
Fidelity Emerging Europe, Middle East, Africa (EMEA) Fund | $50,000 | $- | $6,000 | $500 |
Fidelity Global Equity Income Fund | $46,000 | $- | $5,900 | $500 |
Fidelity International Small Cap Fund | $125,000 | $- | $6,900 | $600 |
Fidelity International Small Cap Opportunities Fund | $51,000 | $- | $5,800 | $600 |
Fidelity International Value Fund | $49,000 | $- | $5,800 | $500 |
Fidelity Series Emerging Markets Fund | $42,000 | $- | $6,900 | $1,600 |
Fidelity Series International Small Cap Fund | $45,000 | $- | $5,800 | $900 |
Fidelity Series International Value Fund | $45,000 | $- | $5,800 | $2,300 |
Fidelity Total International Equity Fund | $58,000 | $- | $6,700 | $600 |
A Amounts may reflect rounding.
The following table presents fees billed by PricewaterhouseCoopers LLP ("PwC") in each of the last two fiscal years for services rendered to Fidelity Emerging Markets Discovery Fund, Fidelity Global Commodity Stock Fund, Fidelity International Discovery Fund, Fidelity International Growth Fund, Fidelity Series International Growth Fund, and Fidelity Total Emerging Markets Fund (the "Funds"):
Services Billed by PwC
October 31, 2014 FeesA
| Audit Fees | Audit-Related Fees | Tax Fees | All Other Fees |
Fidelity Emerging Markets Discovery Fund | $53,000 | $- | $5,300 | $1,700 |
Fidelity Global Commodity Stock Fund | $42,000 | $- | $3,000 | $1,800 |
Fidelity International Discovery Fund | $80,000 | $- | $11,300 | $5,600 |
Fidelity International Growth Fund | $56,000 | $- | $5,400 | $1,900 |
Fidelity Series International Growth Fund | $58,000 | $- | $10,000 | $6,100 |
Fidelity Total Emerging Markets Fund | $60,000 | $- | $4,500 | $1,700 |
October 31, 2013 FeesA
| Audit Fees | Audit-Related Fees | Tax Fees | All Other Fees |
Fidelity Emerging Markets Discovery Fund | $53,000 | $- | $5,200 | $1,500 |
Fidelity Global Commodity Stock Fund | $42,000 | $- | $2,700 | $1,700 |
Fidelity International Discovery Fund | $83,000 | $- | $11,000 | $5,000 |
Fidelity International Growth Fund | $59,000 | $- | $5,200 | $1,600 |
Fidelity Series International Growth Fund | $56,000 | $- | $5,900 | $5,100 |
Fidelity Total Emerging Markets Fund | $60,000 | $- | $4,400 | $1,500 |
A Amounts may reflect rounding.
The following table presents fees billed by PwC and Deloitte Entities that were required to be approved by the Audit Committee for services that relate directly to the operations and financial reporting of the Funds and that are rendered on behalf of Fidelity Management & Research Company ("FMR") and entities controlling, controlled by, or under common control with FMR (not including any sub-adviser whose role is primarily portfolio management and is subcontracted with or overseen by another investment adviser) that provide ongoing services to the Funds ("Fund Service Providers"):
Services Billed by Deloitte Entities
| October 31, 2014A | October 31, 2013A |
Audit-Related Fees | $150,000 | $1,010,000 |
Tax Fees | $- | $- |
All Other Fees | $590,000 | $800,000 |
A Amounts may reflect rounding.
Services Billed by PwC
| October 31, 2014A | October 31, 2013A |
Audit-Related Fees | $4,430,000 | $5,395,000 |
Tax Fees | $- | $- |
All Other Fees | $- | $50,000 |
A Amounts may reflect rounding.
"Audit-Related Fees" represent fees billed for assurance and related services that are reasonably related to the performance of the fund audit or the review of the fund's financial statements and that are not reported under Audit Fees.
"Tax Fees" represent fees billed for tax compliance, tax advice or tax planning that relate directly to the operations and financial reporting of the fund.
"All Other Fees" represent fees billed for services provided to the fund or Fund Service Provider, a significant portion of which are assurance related, that relate directly to the operations and financial reporting of the fund, excluding those services that are reported under Audit Fees, Audit-Related Fees or Tax Fees.
Assurance services must be performed by an independent public accountant.
* * *
The aggregate non-audit fees billed by PwC and Deloitte Entities for services rendered to the Funds, FMR (not including any sub-adviser whose role is primarily portfolio management and is subcontracted with or overseen by another investment adviser), and any Fund Service Provider for each of the last two fiscal years of the Funds are as follows:
Billed By | October 31, 2014 A | October 31, 2013 A |
PwC | $5,700,000 | $6,345,000 |
Deloitte Entities | $1,890,000 | $1,985,000 |
A Amounts may reflect rounding.
The trust's Audit Committee has considered non-audit services that were not pre-approved that were provided by PwC and Deloitte Entities to Fund Service Providers to be compatible with maintaining the independence of PwC and Deloitte Entities in their audits of the Funds, taking into account representations from PwC and Deloitte Entities, in accordance with Public Company Accounting Oversight Board rules, regarding their independence from the Funds and their related entities and FMR's review of the appropriateness and permissibility under applicable law of such non-audit services prior to their provision to the Fund Service Providers.
Audit Committee Pre-Approval Policies and Procedures
The trust's Audit Committee must pre-approve all audit and non-audit services provided by a fund's independent registered public accounting firm relating to the operations or financial reporting of the fund. Prior to the commencement of any audit or non-audit services to a fund, the Audit Committee reviews the services to determine whether they are appropriate and permissible under applicable law.
The Audit Committee has adopted policies and procedures to, among other purposes, provide a framework for the Committee's consideration of non-audit services by the audit firms that audit the Fidelity funds. The policies and procedures require that any non-audit service provided by a fund audit firm to a Fidelity fund and any non-audit service provided by a fund auditor to a Fund Service Provider that relates directly to the operations and financial reporting of a Fidelity fund ("Covered Service") are subject to approval by the Audit Committee before such service is provided.
All Covered Services must be approved in advance of provision of the service either: (i) by formal resolution of the Audit Committee, or (ii) by oral or written approval of the service by the Chair of the Audit Committee (or if the Chair is unavailable, such other member of the Audit Committee as may be designated by the Chair to act in the Chair's absence). The approval contemplated by (ii) above is permitted where the Treasurer determines that action on such an engagement is necessary before the next meeting of the Audit Committee.
Non-audit services provided by a fund audit firm to a Fund Service Provider that do not relate directly to the operations and financial reporting of a Fidelity fund are reported to the Audit Committee on a periodic basis.
Non-Audit Services Approved Pursuant to Rule 2-01(c)(7)(i)(C) and (ii) of Regulation S-X ("De Minimis Exception")
There were no non-audit services approved or required to be approved by the Audit Committee pursuant to the De Minimis Exception during the Funds' last two fiscal years relating to services provided to (i) the Funds or (ii) any Fund Service Provider that relate directly to the operations and financial reporting of the Funds.
Item 5. Audit Committee of Listed Registrants
Not applicable.
Item 6. Investments
(a) Not applicable.
(b) Not applicable
Item 7. Disclosure of Proxy Voting Policies and Procedures for Closed-End Management Investment Companies
Not applicable.
Item 8. Portfolio Managers of Closed-End Management Investment Companies
Not applicable.
Item 9. Purchase of Equity Securities by Closed-End Management Investment Company and Affiliated Purchasers
Not applicable.
Item 10. Submission of Matters to a Vote of Security Holders
There were no material changes to the procedures by which shareholders may recommend nominees to the trust's Board of Trustees.
Item 11. Controls and Procedures
(a)(i) The President and Treasurer and the Chief Financial Officer have concluded that the trust's disclosure controls and procedures (as defined in Rule 30a-3(c) under the Investment Company Act) provide reasonable assurances that material information relating to the trust is made known to them by the appropriate persons, based on their evaluation of these controls and procedures as of a date within 90 days of the filing date of this report.
(a)(ii) There was no change in the trust's internal control over financial reporting (as defined in Rule 30a-3(d) under the Investment Company Act) that occurred during the second fiscal quarter of the period covered by this report that has materially affected, or is reasonably likely to materially affect, the trust's internal control over financial reporting.
Item 12. Exhibits
(a) | (1) | Code of Ethics pursuant to Item 2 of Form N-CSR is filed and attached hereto as EX-99.CODE ETH. |
(a) | (2) | Certification pursuant to Rule 30a-2(a) under the Investment Company Act of 1940 (17 CFR 270.30a-2(a)) is filed and attached hereto as Exhibit 99.CERT. |
(a) | (3) | Not applicable. |
(b) | | Certification pursuant to Rule 30a-2(b) under the Investment Company Act of 1940 (17 CFR 270.30a-2(b)) is furnished and attached hereto as Exhibit 99.906CERT. |
SIGNATURES
Pursuant to the requirements of the Securities Exchange Act of 1934 and the Investment Company Act of 1940, the registrant has duly caused this report to be signed on its behalf by the undersigned, thereunto duly authorized.
Fidelity Investment Trust
By: | /s/Kenneth B. Robins |
| Kenneth B. Robins |
| President and Treasurer |
| |
Date: | December 26, 2014 |
Pursuant to the requirements of the Securities Exchange Act of 1934 and the Investment Company Act of 1940, this report has been signed below by the following persons on behalf of the registrant and in the capacities and on the dates indicated.
By: | /s/Kenneth B. Robins |
| Kenneth B. Robins |
| President and Treasurer |
| |
Date: | December 26, 2014 |
By: | /s/Howard J. Galligan III |
| Howard J. Galligan III |
| Chief Financial Officer |
| |
Date: | December 26, 2014 |