UNITED STATES
SECURITIES AND EXCHANGE COMMISSION
Washington, D.C. 20549
FORM N-CSR
CERTIFIED SHAREHOLDER REPORT OF REGISTERED
MANAGEMENT INVESTMENT COMPANIES
Investment Company Act file number 811-4008
Fidelity Investment Trust
(Exact name of registrant as specified in charter)
245 Summer St., Boston, Massachusetts 02210
(Address of principal executive offices) (Zip code)
Scott C. Goebel, Secretary
245 Summer St.
Boston, Massachusetts 02210
(Name and address of agent for service)
Registrant's telephone number, including area code: 617-563-7000
Date of fiscal year end: | October 31 |
| |
Date of reporting period: | October 31, 2013 |
This report on Form N-CSR relates solely to the Registrant's Fidelity Diversified International Fund, Fidelity International Capital Appreciation Fund, Fidelity Overseas Fund, and Fidelity Worldwide Fund (each, a "Fund" and collectively, the "Funds").
Item 1. Reports to Stockholders
Fidelity®
Overseas
Fund -
Class K
Annual Report
October 31, 2013
(Fidelity Cover Art)
Contents
Performance | (Click Here) | How the fund has done over time. |
Management's Discussion of Fund Performance | (Click Here) | The Portfolio Manager's review of fund performance and strategy. |
Shareholder Expense Example | (Click Here) | An example of shareholder expenses. |
Investment Changes | (Click Here) | A summary of major shifts in the fund's investments over the past six months. |
Investments | (Click Here) | A complete list of the fund's investments with their market values. |
Financial Statements | (Click Here) | Statements of assets and liabilities, operations, and changes in net assets, as well as financial highlights. |
Notes | (Click Here) | Notes to the financial statements. |
Report of Independent Registered Public Accounting Firm | (Click Here) | |
Trustees and Officers | (Click Here) | |
Distributions | (Click Here) | |
Board Approval of Investment Advisory Contracts and Management Fees | (Click Here) | |
To view a fund's proxy voting guidelines and proxy voting record for the 12-month period ended June 30, visit http://www.fidelity.com/proxyvotingresults or visit the Securities and Exchange Commission's (SEC) web site at http://www.sec.gov. You may also call 1-800-835-5092 to request a free copy of the proxy voting guidelines.
Standard & Poor's, S&P and S&P 500 are registered service marks of The McGraw-Hill Companies, Inc. and have been licensed for use by Fidelity Distributors Corporation.
Other third-party marks appearing herein are the property of their respective owners.
All other marks appearing herein are registered or unregistered trademarks or service marks of FMR LLC or an affiliated company. © 2013 FMR LLC. All rights reserved.
This report and the financial statements contained herein are submitted for the general information of the shareholders of the fund. This report is not authorized for distribution to prospective investors in the fund unless preceded or accompanied by an effective prospectus.
A fund files its complete schedule of portfolio holdings with the SEC for the first and third quarters of each fiscal year on Form N-Q. Forms N-Q are available on the SEC's web site at http://www.sec.gov. A fund's Forms N-Q may be reviewed and copied at the SEC's Public Reference Room in Washington, DC. Information regarding the operation of the SEC's Public Reference Room may be obtained by calling 1-800-SEC-0330. For a complete list of a fund's portfolio holdings, view the most recent holdings listing, semiannual report, or annual report on Fidelity's web site at http://www.fidelity.com, http://www.advisor.fidelity.com, or http://www.401k.com, as applicable.
NOT FDIC INSURED • MAY LOSE VALUE • NO BANK GUARANTEE
Neither the fund nor Fidelity Distributors Corporation is a bank.
Annual Report
Average annual total return reflects the change in the value of an investment, assuming reinvestment of the class' distributions from dividend income and capital gains (the profits earned upon the sale of securities that have grown in value, if any) and assuming a constant rate of performance each year. The $10,000 table and the fund's returns do not reflect the deduction of taxes that a shareholder would pay on fund distributions or the redemption of fund shares. During periods of reimbursement by Fidelity, a fund's total return will be greater than it would be had the reimbursement not occurred. How a fund did yesterday is no guarantee of how it will do tomorrow.
Average Annual Total Returns
Periods ended October 31, 2013 | Past 1
year | Past 5
years | Past 10
years |
Class K A | 28.37% | 11.49% | 6.95% |
A The initial offering of Class K shares took place on May 9, 2008. Returns prior to May 9, 2008, are those of Fidelity® Overseas Fund, the original class of the fund.
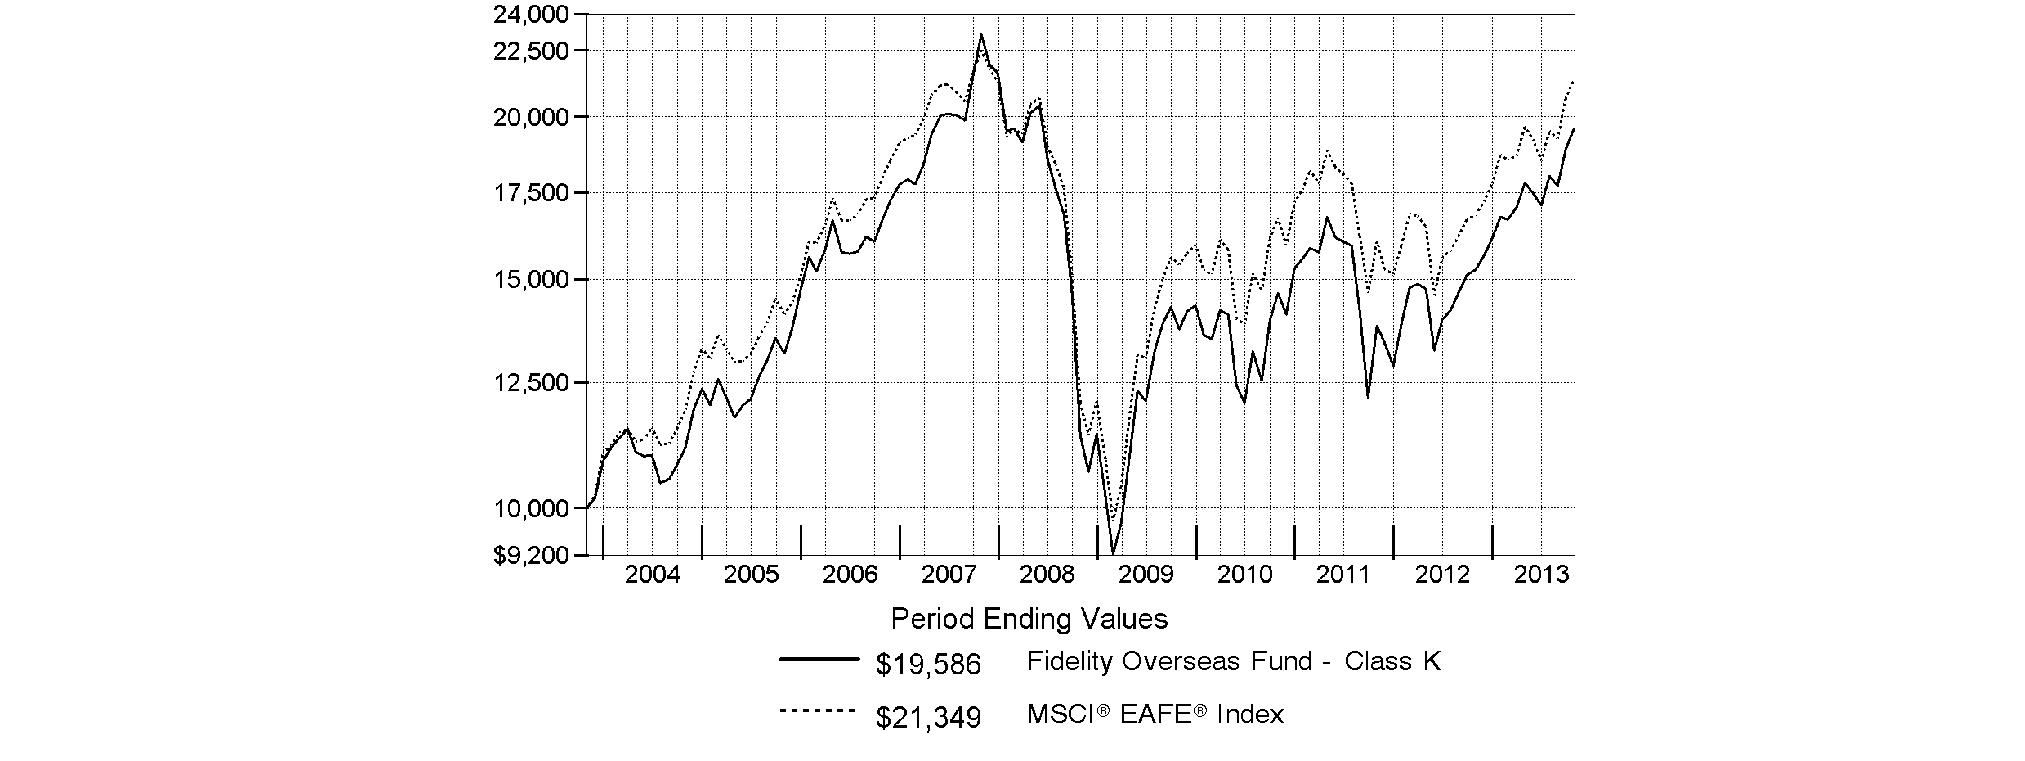
$10,000 Over 10 Years
Let's say hypothetically that $10,000 was invested in Fidelity® Overseas Fund - Class K on October 31, 2003. The chart shows how the value of your investment would have changed, and also shows how the MSCI® EAFE® Index performed over the same period. See footnote A above for additional information regarding the performance of Class K.
Annual Report
Market Recap: On balance, global equity markets remained upbeat for the 12-month period ending October 31, 2013. The MSCI® ACWI® (All Country World Index) Index gained 23.75% for the period, amid investor preference for higher-risk assets. The period was not without turbulence, however. In the spring and summer, central banks worldwide, especially in the U.S. and China, made clear their intentions to maintain accommodative monetary policies. That stance, combined with modest cyclical improvements around the globe and generally low valuations, underpinned the broad rally in equities. Europe (+32%) shone brightly, with most markets in the region - large and small - registering solid, index-beating gains. Another bright spot was Japan, which, despite a struggling yen and taking a second-half breather, posted a 34% result for the full year. The U.S. - by far the index's biggest constituent - also outperformed the global market with a roughly 28% advance. Meanwhile, Asia-Pacific ex Japan (+14%) lagged, hurt in part by a slowdown in Australia's mining industry as well as currency headwinds. Foreign-exchange and commodity weakness also curbed results in resource-heavy Canada and emerging markets (EM), both of which were up 7%. Country-level EM performance diverged meaningfully for the period, as evidenced by performance in Brazil (-1%), Russia (+12%), India (+1%) and China (+8%).
Comments from Vincent Montemaggiore, Portfolio Manager of Fidelity® Overseas Fund: For the year, the fund's Class K shares returned 28.37%, topping the 27.02% gain of the MSCI® EAFE® Index. Versus the index, the fund was particularly helped by stock picking in the United Kingdom and a sizable underweighting in the Asia-Pacific ex Japan region. At the stock level, a non-index stake in South African asset manager Coronation Fund Managers was the fund's top relative contributor. The company benefited from superior fund performance and rapid growth in its institutional, retail and international products. Also bolstering our result was an overweighting in Deutsche Post, a Germany-based logistics services provider. Conversely, the fund struggled somewhat on a relative basis because I underweighted Japan to varying degrees throughout the year. Not owning Japanese automaker Toyota Motor until May made it by far the fund's biggest relative detractor, as this stock was one beneficiary of a significantly weaker yen. Saipem, an Italy-based provider of onshore and offshore engineering, construction and drilling services for energy firms, significantly reduced its financial guidance, and I sold the stock in the first half of the period.
The views expressed above reflect those of the portfolio manager(s) only through the end of the period as stated on the cover of this report and do not necessarily represent the views of Fidelity or any other person in the Fidelity organization. Any such views are subject to change at any time based upon market or other conditions and Fidelity disclaims any responsibility to update such views. These views may not be relied on as investment advice and, because investment decisions for a Fidelity fund are based on numerous factors, may not be relied on as an indication of trading intent on behalf of any Fidelity fund.
Annual Report
Fidelity Overseas Fund
As a shareholder of the Fund, you incur two types of costs: (1) transaction costs, including redemption fees and (2) ongoing costs, including management fees and other Fund expenses. This Example is intended to help you understand your ongoing costs (in dollars) of investing in the Fund and to compare these costs with the ongoing costs of investing in other mutual funds.
The Example is based on an investment of $1,000 invested at the beginning of the period and held for the entire period (May 1, 2013 to October 31, 2013).
Actual Expenses
The first line of the accompanying table for each class of the Fund provides information about actual account values and actual expenses. You may use the information in this line, together with the amount you invested, to estimate the expenses that you paid over the period. Simply divide your account value by $1,000.00 (for example, an $8,600 account value divided by $1,000.00 = 8.6), then multiply the result by the number in the first line for a class of the Fund under the heading entitled "Expenses Paid During Period" to estimate the expenses you paid on your account during this period. A small balance maintenance fee of $12.00 that is charged once a year may apply for certain accounts with a value of less than $2,000. This fee is not included in the table below. If it was, the estimate of expenses you paid during the period would be higher, and your ending account value lower, by this amount. In addition, the Fund, as a shareholder in the underlying Fidelity Central Funds, will indirectly bear its pro-rata share of the fees and expenses incurred by the underlying Fidelity Central Funds. These fees and expenses are not included in the Fund's annualized expense ratio used to calculate the expense estimate in the table below.
Hypothetical Example for Comparison Purposes
The second line of the accompanying table for each class of the Fund provides information about hypothetical account values and hypothetical expenses based on a Class' actual expense ratio and an assumed rate of return of 5% per year before expenses, which is not the Class' actual return. The hypothetical account values and expenses may not be used to estimate the actual ending account balance or expenses you paid for the period. You may use this information to compare the ongoing costs of investing in the Fund and other funds. To do so, compare this 5% hypothetical example with the 5% hypothetical examples that appear in the shareholder reports of the other funds. A small balance maintenance fee of $12.00 that is charged once a year may apply for certain accounts with a value of less than $2,000. This fee is not included in the table below. If it was, the estimate of expenses you paid during the period would be higher, and your ending account value lower, by this amount. In addition, the Fund, as a shareholder in the underlying Fidelity Central Funds, will indirectly bear its pro-rata share of the fees and expenses incurred by the underlying Fidelity Central Funds. These fees and expenses are not included in the Fund's annualized expense ratio used to calculate the expense estimate in the table below.
Please note that the expenses shown in the table are meant to highlight your ongoing costs only and do not reflect any transaction costs. Therefore, the second line of the table is useful in comparing ongoing costs only, and will not help you determine the relative total costs of owning different funds. In addition, if these transactional costs were included, your costs would have been higher.
| Annualized
Expense Ratio B | Beginning
Account Value
May 1, 2013 | Ending
Account Value
October 31, 2013 | Expenses Paid
During Period*
May 1, 2013
to October 31, 2013 |
Overseas | 1.16% | | | |
Actual | | $ 1,000.00 | $ 1,099.50 | $ 6.14 |
Hypothetical A | | $ 1,000.00 | $ 1,019.36 | $ 5.90 |
Class K | .98% | | | |
Actual | | $ 1,000.00 | $ 1,100.30 | $ 5.19 |
Hypothetical A | | $ 1,000.00 | $ 1,020.27 | $ 4.99 |
A 5% return per year before expenses
B Annualized expense ratio reflects expenses net of applicable fee waivers.
* Expenses are equal to each Class' annualized expense ratio, multiplied by the average account value over the period, multiplied by 184/365 (to reflect the one-half year period).
Annual Report
Fidelity Overseas Fund
Investment Changes (Unaudited)
Geographic Diversification (% of fund's net assets) |
As of October 31, 2013 |
 | United Kingdom | 23.6% | |
 | Japan | 18.8% | |
 | Germany | 11.2% | |
 | Switzerland | 9.2% | |
 | France | 7.8% | |
 | United States of America* | 5.3% | |
 | Sweden | 3.3% | |
 | Spain | 2.6% | |
 | Bailiwick of Jersey | 2.5% | |
 | Other | 15.7% | |

* Includes Short-Term Investments and Net Other Assets (Liabilities). |
Percentages are based on country or territory of incorporation and are adjusted for the effect of futures contracts, if applicable. |
As of April 30, 2013 |
| United Kingdom | 24.0% | |
| Japan | 17.6% | |
| Germany | 12.8% | |
| Switzerland | 9.7% | |
| France | 7.1% | |
| United States of America* | 5.1% | |
| Sweden | 4.1% | |
| Australia | 3.0% | |
| Bailiwick of Jersey | 2.1% | |
| Other | 14.5% | |

* Includes Short-Term Investments and Net Other Assets (Liabilities). |
Percentages are based on country or territory of incorporation and are adjusted for the effect of futures contracts, if applicable. |
Asset Allocation as of October 31, 2013 |
| % of fund's
net assets | % of fund's net assets
6 months ago |
Stocks | 99.3 | 99.2 |
Short-Term Investments and Net Other Assets (Liabilities) | 0.7 | 0.8 |
Top Ten Stocks as of October 31, 2013 |
| % of fund's
net assets | % of fund's net assets
6 months ago |
Nestle SA (Switzerland, Food Products) | 2.4 | 2.6 |
Roche Holding AG (participation certificate) (Switzerland, Pharmaceuticals) | 2.3 | 2.2 |
Sanofi SA (France, Pharmaceuticals) | 1.7 | 1.8 |
Bayer AG (Germany, Pharmaceuticals) | 1.6 | 1.4 |
British American Tobacco PLC (United Kingdom) (United Kingdom, Tobacco) | 1.3 | 1.5 |
Vodafone Group PLC (United Kingdom, Wireless Telecommunication Services) | 1.3 | 1.6 |
Anheuser-Busch InBev SA NV (Belgium, Beverages) | 1.3 | 1.3 |
Royal Dutch Shell PLC Class A (United Kingdom) (United Kingdom, Oil, Gas & Consumable Fuels) | 1.3 | 2.0 |
Australia & New Zealand Banking Group Ltd. (Australia, Commercial Banks) | 1.3 | 1.5 |
Diageo PLC (United Kingdom, Beverages) | 1.2 | 1.3 |
| 15.7 | |
Market Sectors as of October 31, 2013 |
| % of fund's
net assets | % of fund's net assets
6 months ago |
Financials | 19.7 | 18.1 |
Consumer Discretionary | 17.3 | 15.3 |
Industrials | 14.4 | 14.1 |
Consumer Staples | 12.6 | 15.4 |
Health Care | 11.9 | 12.9 |
Information Technology | 9.4 | 9.2 |
Materials | 7.9 | 8.5 |
Telecommunication Services | 3.9 | 2.1 |
Energy | 2.2 | 3.6 |
Annual Report
Fidelity Overseas Fund
Investments October 31, 2013
Showing Percentage of Net Assets
Common Stocks - 97.2% |
| Shares | | Value |
Australia - 2.5% |
Ansell Ltd. | 467,835 | | $ 8,617,976 |
Australia & New Zealand Banking Group Ltd. | 985,010 | | 31,504,438 |
BHP Billiton Ltd. | 578,726 | | 20,459,930 |
TOTAL AUSTRALIA | | 60,582,344 |
Austria - 0.5% |
Andritz AG | 191,400 | | 11,790,454 |
Bailiwick of Jersey - 2.5% |
Experian PLC | 919,600 | | 18,725,980 |
Informa PLC | 1,166,691 | | 10,466,412 |
Regus PLC | 2,269,770 | | 7,464,305 |
WPP PLC | 1,159,933 | | 24,642,835 |
TOTAL BAILIWICK OF JERSEY | | 61,299,532 |
Belgium - 2.1% |
Anheuser-Busch InBev SA NV | 304,612 | | 31,577,218 |
KBC Groupe SA | 343,211 | | 18,709,689 |
TOTAL BELGIUM | | 50,286,907 |
Bermuda - 0.4% |
Signet Jewelers Ltd. | 124,700 | | 9,310,102 |
Brazil - 0.2% |
Qualicorp SA (a) | 546,300 | | 5,116,228 |
Canada - 0.5% |
Constellation Software, Inc. | 60,900 | | 11,094,179 |
Cayman Islands - 0.8% |
Lifestyle International Holdings Ltd. | 2,950,000 | | 6,430,414 |
Lifestyle Property Development Ltd. | 135,675 | | 27,474 |
Shenzhou International Group Holdings Ltd. | 3,620,000 | | 12,466,658 |
TOTAL CAYMAN ISLANDS | | 18,924,546 |
Denmark - 0.9% |
Novo Nordisk A/S Series B | 134,100 | | 22,334,709 |
Finland - 0.4% |
Nokian Tyres PLC | 181,900 | | 9,204,748 |
France - 7.8% |
ALTEN | 176,200 | | 7,983,290 |
AXA SA | 785,900 | | 19,633,825 |
BIC SA | 85,500 | | 10,685,866 |
BNP Paribas SA | 288,971 | | 21,398,790 |
Christian Dior SA | 106,997 | | 20,338,525 |
Dassault Systemes SA | 90,700 | | 11,022,971 |
Groupe FNAC SA (a) | 11,262 | | 314,994 |
Ipsos SA | 290,357 | | 12,246,824 |
Kering SA | 88,200 | | 20,040,757 |
Rexel SA | 443,700 | | 11,114,901 |
Sanofi SA | 387,756 | | 41,343,799 |
Sodexo SA | 136,700 | | 13,268,860 |
TOTAL FRANCE | | 189,393,402 |
|
| Shares | | Value |
Germany - 9.1% |
adidas AG | 197,700 | | $ 22,569,357 |
BASF AG | 274,372 | | 28,546,865 |
Bayer AG | 308,797 | | 38,379,896 |
Brenntag AG | 114,700 | | 19,435,594 |
Continental AG | 70,100 | | 12,844,308 |
Deutsche Boerse AG | 186,092 | | 14,010,353 |
Deutsche Post AG | 706,487 | | 23,908,876 |
Fresenius SE & Co. KGaA | 156,500 | | 20,341,464 |
GEA Group AG | 333,606 | | 14,517,161 |
Gerry Weber International AG (Bearer) | 172,900 | | 7,177,633 |
Linde AG | 69,707 | | 13,245,523 |
Pfeiffer Vacuum Technology AG | 62,789 | | 7,323,979 |
TOTAL GERMANY | | 222,301,009 |
Greece - 0.2% |
Metka SA | 223,183 | | 4,196,920 |
Hong Kong - 0.1% |
City Telecom (HK) Ltd. (CTI) | 7,403,000 | | 2,425,335 |
Ireland - 2.1% |
Accenture PLC Class A | 120,800 | | 8,878,800 |
DCC PLC (United Kingdom) | 353,500 | | 15,864,785 |
Greencore Group PLC | 3,639,500 | | 10,509,869 |
Kerry Group PLC Class A | 254,264 | | 16,282,629 |
TOTAL IRELAND | | 51,536,083 |
Israel - 0.4% |
Check Point Software Technologies Ltd. (a) | 168,800 | | 9,793,776 |
Italy - 1.0% |
Pirelli & C SpA | 880,000 | | 12,402,232 |
World Duty Free SpA (a) | 1,178,242 | | 13,054,026 |
TOTAL ITALY | | 25,456,258 |
Japan - 18.8% |
AEON Financial Service Co. Ltd. (d) | 363,200 | | 11,153,965 |
Air Water, Inc. | 670,000 | | 9,577,164 |
Aozora Bank Ltd. | 4,326,000 | | 12,575,832 |
ARNEST ONE Corp. (d) | 305,500 | | 8,376,162 |
Astellas Pharma, Inc. | 275,200 | | 15,341,404 |
Credit Saison Co. Ltd. | 328,300 | | 8,985,709 |
Daikin Industries Ltd. | 179,500 | | 10,327,244 |
Don Quijote Co. Ltd. | 235,100 | | 15,649,781 |
GMO Internet, Inc. | 1,024,400 | | 11,645,454 |
H.I.S. Co. Ltd. | 165,100 | | 8,904,614 |
Honda Motor Co. Ltd. sponsored ADR | 640,800 | | 25,606,368 |
Horiba Ltd. | 209,200 | | 7,644,262 |
Hoya Corp. | 519,300 | | 12,452,486 |
Japan Tobacco, Inc. | 681,300 | | 24,651,944 |
Kansai Paint Co. Ltd. | 679,000 | | 9,123,644 |
Keyence Corp. | 59,990 | | 25,711,115 |
Leopalace21 Corp. (a) | 1,253,900 | | 8,705,212 |
Makita Corp. | 167,200 | | 8,455,198 |
Common Stocks - continued |
| Shares | | Value |
Japan - continued |
Meitec Corp. | 280,200 | | $ 7,469,201 |
Miraca Holdings, Inc. | 214,300 | | 9,655,936 |
Misumi Group, Inc. | 248,600 | | 7,277,604 |
Nakanishi, Inc. | 35,300 | | 5,019,276 |
Nihon Nohyaku Co. Ltd. | 488,000 | | 5,849,257 |
Nitori Holdings Co. Ltd. | 73,500 | | 6,894,721 |
Obic Co. Ltd. | 349,900 | | 10,987,798 |
Omron Corp. | 422,500 | | 16,123,117 |
ORIX Corp. | 1,555,800 | | 26,948,147 |
Seven Bank Ltd. | 2,981,900 | | 10,553,707 |
Shinsei Bank Ltd. | 6,220,000 | | 14,562,926 |
Ship Healthcare Holdings, Inc. | 259,400 | | 10,644,315 |
SMC Corp. | 61,400 | | 14,295,040 |
SoftBank Corp. | 301,300 | | 22,500,755 |
Software Service, Inc. | 60,100 | | 2,259,661 |
Toyota Motor Corp. | 441,100 | | 28,600,126 |
Tsuruha Holdings, Inc. | 104,000 | | 9,442,039 |
USS Co. Ltd. | 1,055,200 | | 15,452,873 |
TOTAL JAPAN | | 459,424,057 |
Luxembourg - 0.5% |
Eurofins Scientific SA | 48,700 | | 13,353,424 |
Netherlands - 0.5% |
AEGON NV | 1,692,552 | | 13,467,439 |
Norway - 1.4% |
DNB ASA | 1,187,600 | | 21,046,657 |
Telenor ASA | 522,800 | | 12,558,336 |
TOTAL NORWAY | | 33,604,993 |
South Africa - 1.2% |
Coronation Fund Managers Ltd. | 1,597,200 | | 13,030,575 |
EOH Holdings Ltd. | 471,700 | | 3,820,118 |
Nampak Ltd. | 2,343,900 | | 7,751,710 |
Pinnacle Technology Holdings Ltd. | 2,051,500 | | 5,019,035 |
TOTAL SOUTH AFRICA | | 29,621,438 |
Spain - 2.6% |
Amadeus IT Holding SA Class A | 578,700 | | 21,489,714 |
Banco Bilbao Vizcaya Argentaria SA | 2,246,400 | | 26,253,523 |
Criteria CaixaCorp SA (d) | 1,201,300 | | 6,245,348 |
Grifols SA ADR | 336,000 | | 10,133,760 |
TOTAL SPAIN | | 64,122,345 |
Sweden - 3.3% |
ASSA ABLOY AB (B Shares) | 301,600 | | 14,972,835 |
Nordea Bank AB | 1,882,600 | | 24,113,363 |
Svenska Cellulosa AB (SCA) (B Shares) | 485,600 | | 13,788,536 |
Svenska Handelsbanken AB (A Shares) | 305,400 | | 13,837,153 |
Swedbank AB (A Shares) | 493,300 | | 12,865,287 |
TOTAL SWEDEN | | 79,577,174 |
|
| Shares | | Value |
Switzerland - 9.2% |
Aryzta AG | 257,811 | | $ 19,264,436 |
Credit Suisse Group | 577,220 | | 17,956,141 |
Nestle SA | 813,056 | | 58,689,599 |
Roche Holding AG (participation certificate) | 198,309 | | 54,901,880 |
Schindler Holding AG (participation certificate) | 82,005 | | 11,631,723 |
SGS SA (Reg.) | 7,690 | | 18,018,339 |
Syngenta AG (Switzerland) | 54,143 | | 21,853,019 |
UBS AG | 1,149,464 | | 22,231,864 |
TOTAL SWITZERLAND | | 224,547,001 |
United Kingdom - 23.6% |
Aberdeen Asset Management PLC | 1,785,800 | | 12,681,785 |
AMEC PLC | 695,914 | | 13,133,302 |
Babcock International Group PLC | 720,700 | | 14,733,522 |
Barclays PLC | 5,000,712 | | 21,040,325 |
BHP Billiton PLC | 796,578 | | 24,581,201 |
British American Tobacco PLC (United Kingdom) | 583,200 | | 32,176,476 |
BT Group PLC | 3,614,000 | | 21,866,990 |
Bunzl PLC | 554,807 | | 12,249,483 |
Croda International PLC | 286,200 | | 11,178,635 |
Dechra Pharmaceuticals PLC | 438,095 | | 4,846,847 |
Devro PLC | 1,332,113 | | 6,755,883 |
Diageo PLC | 945,333 | | 30,134,833 |
Diploma PLC | 1,205,671 | | 13,396,888 |
Domino Printing Sciences PLC | 956,214 | | 10,602,033 |
Elementis PLC | 2,658,200 | | 11,043,251 |
Hilton Food Group PLC | 1,073,900 | | 7,369,695 |
IMI PLC | 701,300 | | 17,080,615 |
ITV PLC | 4,300,400 | | 13,163,054 |
Jazztel PLC (a) | 647,200 | | 7,100,185 |
Johnson Matthey PLC | 285,400 | | 13,746,615 |
Kingfisher PLC | 2,265,361 | | 13,711,856 |
London Stock Exchange Group PLC | 475,000 | | 12,505,718 |
Meggitt PLC | 2,154,200 | | 19,774,404 |
Next PLC | 260,500 | | 22,742,986 |
Prudential PLC | 1,123,522 | | 22,976,884 |
Reckitt Benckiser Group PLC | 340,600 | | 26,475,803 |
Rolls-Royce Group PLC | 1,039,806 | | 19,173,087 |
Royal Dutch Shell PLC Class A (United Kingdom) | 946,679 | | 31,528,986 |
Royal Mail PLC | 172,500 | | 1,548,884 |
Senior Engineering Group PLC | 1,817,000 | | 8,676,039 |
Serco Group PLC | 1,048,109 | | 9,360,597 |
Spectris PLC | 293,300 | | 10,872,809 |
Spirax-Sarco Engineering PLC | 226,007 | | 10,574,237 |
Standard Chartered PLC (United Kingdom) | 1,036,613 | | 24,923,269 |
The Restaurant Group PLC | 1,082,600 | | 9,998,443 |
Vodafone Group PLC | 8,709,459 | | 31,900,682 |
TOTAL UNITED KINGDOM | | 575,626,302 |
Common Stocks - continued |
| Shares | | Value |
United States of America - 4.6% |
Brinker International, Inc. | 208,003 | | $ 9,239,493 |
Coach, Inc. | 151,000 | | 7,652,680 |
CST Brands, Inc. | 339,300 | | 10,939,032 |
Fidelity National Information Services, Inc. | 226,600 | | 11,046,750 |
FMC Corp. | 189,400 | | 13,780,744 |
Global Payments, Inc. | 201,100 | | 11,961,428 |
JPMorgan Chase & Co. | 86,900 | | 4,478,826 |
McGraw-Hill Companies, Inc. | 185,300 | | 12,911,704 |
Mylan, Inc. (a) | 269,300 | | 10,198,391 |
National Oilwell Varco, Inc. | 127,500 | | 10,350,450 |
Varian Medical Systems, Inc. (a) | 119,176 | | 8,649,794 |
TOTAL UNITED STATES OF AMERICA | | 111,209,292 |
TOTAL COMMON STOCKS (Cost $1,873,403,908) |
2,369,599,997
|
Nonconvertible Preferred Stocks - 2.1% |
| | | |
Germany - 2.1% |
Henkel AG & Co. KGaA | 188,900 | | 20,441,374 |
Sartorius AG (non-vtg.) | 90,100 | | 9,505,296 |
Volkswagen AG | 85,568 | | 21,748,887 |
TOTAL GERMANY | | 51,695,557 |
United Kingdom - 0.0% |
Rolls-Royce Group PLC: | | | |
(C Shares) (a) | 116,204,214 | | 186,322 |
Series C | 89,423,316 | | 143,381 |
TOTAL UNITED KINGDOM | | 329,703 |
TOTAL NONCONVERTIBLE PREFERRED STOCKS (Cost $35,907,853) |
52,025,260
|
Money Market Funds - 0.8% |
| Shares | | Value |
Fidelity Cash Central Fund, 0.09% (b) | 14,911,136 | | $ 14,911,136 |
Fidelity Securities Lending Cash Central Fund, 0.09% (b)(c) | 4,269,172 | | 4,269,172 |
TOTAL MONEY MARKET FUNDS (Cost $19,180,308) |
19,180,308
|
TOTAL INVESTMENT PORTFOLIO - 100.1% (Cost $1,928,492,069) | | 2,440,805,565 |
NET OTHER ASSETS (LIABILITIES) - (0.1)% | | (3,393,733) |
NET ASSETS - 100% | $ 2,437,411,832 |
Legend |
(a) Non-income producing |
(b) Affiliated fund that is generally available only to investment companies and other accounts managed by Fidelity Investments. The rate quoted is the annualized seven-day yield of the fund at period end. A complete unaudited listing of the fund's holdings as of its most recent quarter end is available upon request. In addition, each Fidelity Central Fund's financial statements, which are not covered by the Fund's Report of Independent Registered Public Accounting Firm, are available on the SEC's website or upon request. |
(c) Investment made with cash collateral received from securities on loan. |
(d) Security or a portion of the security is on loan at period end. |
Affiliated Central Funds |
Information regarding fiscal year to date income earned by the Fund from investments in Fidelity Central Funds is as follows: |
Fund | Income earned |
Fidelity Cash Central Fund | $ 20,302 |
Fidelity Securities Lending Cash Central Fund | 949,322 |
Total | $ 969,624 |
Other Information |
Categorizations in the Schedule of Investments are based on country or territory of incorporation. |
The following is a summary of the inputs used, as of October 31, 2013, involving the Fund's assets and liabilities carried at fair value. The inputs or methodology used for valuing securities may not be an indication of the risk associated with investing in those securities. For more information on valuation inputs, and their aggregation into the levels used in the tables below, please refer to the Investment Valuation section at the end of this listing. |
Valuation Inputs at Reporting Date: |
Description | Total | Level 1 | Level 2 | Level 3 |
Investments in Securities: | | | | |
Equities: | | | | |
Consumer Discretionary | $ 427,885,096 | $ 344,006,819 | $ 75,502,115 | $ 8,376,162 |
Consumer Staples | 307,560,334 | 120,888,225 | 186,672,109 | - |
Energy | 55,012,738 | 23,483,752 | 31,528,986 | - |
Financials | 481,335,928 | 263,924,254 | 217,411,674 | - |
Health Care | 290,644,056 | 184,044,956 | 106,599,100 | - |
Industrials | 350,976,576 | 303,152,289 | 47,824,287 | - |
Information Technology | 221,546,023 | 136,981,791 | 84,564,232 | - |
Materials | 190,737,558 | 99,293,343 | 91,444,215 | - |
Telecommunication Services | 95,926,948 | 19,658,521 | 76,268,427 | - |
Money Market Funds | 19,180,308 | 19,180,308 | - | - |
Total Investments in Securities: | $ 2,440,805,565 | $ 1,514,614,258 | $ 917,815,145 | $ 8,376,162 |
The following is a summary of transfers between Level 1 and Level 2 for the period ended October 31, 2013. Transfers are assumed to have occurred at the beginning of the period, and are primarily attributable to the valuation techniques used for foreign equity securities, as discussed in the accompanying Notes to Financial Statements: |
Transfers | Total |
Level 1 to Level 2 | $ 215,402,110 |
Level 2 to Level 1 | $ 1,666,537 |
See accompanying notes which are an integral part of the financial statements.
Annual Report
Fidelity Overseas Fund
Statement of Assets and Liabilities
| October 31, 2013 |
| | |
Assets | | |
Investment in securities, at value (including securities loaned of $4,035,445) - See accompanying schedule: Unaffiliated issuers (cost $1,909,311,761) | $ 2,421,625,257 | |
Fidelity Central Funds (cost $19,180,308) | 19,180,308 | |
Total Investments (cost $1,928,492,069) | | $ 2,440,805,565 |
Receivable for fund shares sold | | 973,288 |
Dividends receivable | | 5,408,768 |
Distributions receivable from Fidelity Central Funds | | 2,742 |
Prepaid expenses | | 7,908 |
Other receivables | | 293,865 |
Total assets | | 2,447,492,136 |
| | |
Liabilities | | |
Payable for investments purchased | $ 2,286,630 | |
Payable for fund shares redeemed | 1,091,066 | |
Accrued management fee | 1,651,391 | |
Other affiliated payables | 423,517 | |
Other payables and accrued expenses | 358,528 | |
Collateral on securities loaned, at value | 4,269,172 | |
Total liabilities | | 10,080,304 |
| | |
Net Assets | | $ 2,437,411,832 |
Net Assets consist of: | | |
Paid in capital | | $ 3,383,324,848 |
Undistributed net investment income | | 30,599,916 |
Accumulated undistributed net realized gain (loss) on investments and foreign currency transactions | | (1,488,880,086) |
Net unrealized appreciation (depreciation) on investments and assets and liabilities in foreign currencies | | 512,367,154 |
Net Assets | | $ 2,437,411,832 |
| | |
Overseas:
Net Asset Value, offering price and redemption price per share ($1,874,922,018 ÷ 47,809,233 shares) | | $ 39.22 |
| | |
Class K:
Net Asset Value, offering price and redemption price per share ($562,489,814 ÷ 14,361,557 shares) | | $ 39.17 |
Statement of Operations
| Year ended October 31, 2013 |
| | |
Investment Income | | |
Dividends | | $ 59,031,347 |
Interest | | 49 |
Income from Fidelity Central Funds | | 969,624 |
Income before foreign taxes withheld | | 60,001,020 |
Less foreign taxes withheld | | (4,314,545) |
Total income | | 55,686,475 |
| | |
Expenses | | |
Management fee
Basic fee | $ 15,027,623 | |
Performance adjustment | 2,318,736 | |
Transfer agent fees | 3,927,907 | |
Accounting and security lending fees | 944,974 | |
Custodian fees and expenses | 205,593 | |
Independent trustees' compensation | 12,307 | |
Appreciation in deferred trustee compensation account | 427 | |
Registration fees | 67,337 | |
Audit | 82,238 | |
Legal | 64,454 | |
Interest | 608 | |
Miscellaneous | 14,059 | |
Total expenses before reductions | 22,666,263 | |
Expense reductions | (583,162) | 22,083,101 |
Net investment income (loss) | | 33,603,374 |
Realized and Unrealized Gain (Loss) Net realized gain (loss) on: | | |
Investment securities: | | |
Unaffiliated issuers | 100,337,526 | |
Foreign currency transactions | (197,100) | |
Total net realized gain (loss) | | 100,140,426 |
Change in net unrealized appreciation (depreciation) on: Investment securities | 397,641,259 | |
Assets and liabilities in foreign currencies | 120,050 | |
Total change in net unrealized appreciation (depreciation) | | 397,761,309 |
Net gain (loss) | | 497,901,735 |
Net increase (decrease) in net assets resulting from operations | | $ 531,505,109 |
See accompanying notes which are an integral part of the financial statements.
Annual Report
Statement of Changes in Net Assets
| Year ended
October 31,
2013 | Year ended
October 31,
2012 |
Increase (Decrease) in Net Assets | | |
Operations | | |
Net investment income (loss) | $ 33,603,374 | $ 50,043,397 |
Net realized gain (loss) | 100,140,426 | (141,989,458) |
Change in net unrealized appreciation (depreciation) | 397,761,309 | 260,173,491 |
Net increase (decrease) in net assets resulting from operations | 531,505,109 | 168,227,430 |
Distributions to shareholders from net investment income | (46,883,539) | (70,077,891) |
Distributions to shareholders from net realized gain | - | (1,661,965) |
Total distributions | (46,883,539) | (71,739,856) |
Share transactions - net increase (decrease) | 47,557,637 | (857,000,541) |
Redemption fees | 23,366 | 66,899 |
Total increase (decrease) in net assets | 532,202,573 | (760,446,068) |
| | |
Net Assets | | |
Beginning of period | 1,905,209,259 | 2,665,655,327 |
End of period (including undistributed net investment income of $30,599,916 and undistributed net investment income of $43,880,081, respectively) | $ 2,437,411,832 | $ 1,905,209,259 |
Financial Highlights - Overseas
Years ended October 31, | 2013 | 2012 | 2011 | 2010 | 2009 |
Selected Per-Share Data | | | | | |
Net asset value, beginning of period | $ 31.35 | $ 29.28 | $ 31.56 | $ 30.13 | $ 25.43 |
Income from Investment Operations | | | | | |
Net investment income (loss) B | .54 | .73 | .47 | .42 | .52 |
Net realized and unrealized gain (loss) | 8.10 | 2.19 | (2.27) | 1.49 | 4.55 |
Total from investment operations | 8.64 | 2.92 | (1.80) | 1.91 | 5.07 |
Distributions from net investment income | (.77) | (.83) | (.48) | (.47) | (.37) |
Distributions from net realized gain | - | (.02) | - | (.01) | - |
Total distributions | (.77) | (.85) | (.48) | (.48) | (.37) |
Redemption fees added to paid in capital B, F | - | - | - | - | - |
Net asset value, end of period | $ 39.22 | $ 31.35 | $ 29.28 | $ 31.56 | $ 30.13 |
Total Return A | 28.17% | 10.37% | (5.83)% | 6.33% | 20.44% |
Ratios to Average Net Assets C, E | | | | | |
Expenses before reductions | 1.09% | .69% | .73% | .89% | 1.02% |
Expenses net of fee waivers, if any | 1.09% | .69% | .73% | .89% | 1.02% |
Expenses net of all reductions | 1.06% | .67% | .67% | .85% | .98% |
Net investment income (loss) | 1.54% | 2.52% | 1.44% | 1.41% | 2.01% |
Supplemental Data | | | | | |
Net assets, end of period (000 omitted) | $ 1,874,922 | $ 1,639,725 | $ 2,215,717 | $ 5,548,689 | $ 6,602,017 |
Portfolio turnover rate D | 42% | 90% | 77% | 111% | 115% |
A Total returns would have been lower if certain expenses had not been reduced during the applicable periods shown.
B Calculated based on average shares outstanding during the period.
C Fees and expenses of any underlying Fidelity Central Funds are not included in the Fund's expense ratio. The Fund indirectly bears its proportionate share of the expenses of any underlying Fidelity Central Funds.
D Amount does not include the portfolio activity of any underlying Fidelity Central Funds.
E Expense ratios reflect operating expenses of the class. Expenses before reductions do not reflect amounts reimbursed by the investment adviser or reductions from brokerage service arrangements or reductions from other expense offset arrangements and do not represent the amount paid by the class during periods when reimbursements or reductions occur. Expenses net of fee waivers reflect expenses after reimbursement by the investment adviser but prior to reductions from brokerage service arrangements or other expense offset arrangements. Expenses net of all reductions represent the net expenses paid by the class.
F Amount represents less than $.01 per share.
See accompanying notes which are an integral part of the financial statements.
Annual Report
Financial Highlights - Class K
Years ended October 31, | 2013 | 2012 | 2011 | 2010 | 2009 |
Selected Per-Share Data | | | | | |
Net asset value, beginning of period | $ 31.32 | $ 29.29 | $ 31.59 | $ 30.16 | $ 25.45 |
Income from Investment Operations | | | | | |
Net investment income (loss) B | .60 | .79 | .52 | .47 | .59 |
Net realized and unrealized gain (loss) | 8.08 | 2.18 | (2.27) | 1.50 | 4.54 |
Total from investment operations | 8.68 | 2.97 | (1.75) | 1.97 | 5.13 |
Distributions from net investment income | (.83) | (.92) | (.55) | (.53) | (.42) |
Distributions from net realized gain | - | (.02) | - | (.01) | - |
Total distributions | (.83) | (.94) | (.55) | (.54) | (.42) |
Redemption fees added to paid in capital B, F | - | - | - | - | - |
Net asset value, end of period | $ 39.17 | $ 31.32 | $ 29.29 | $ 31.59 | $ 30.16 |
Total Return A | 28.37% | 10.59% | (5.67)% | 6.55% | 20.73% |
Ratios to Average Net Assets C, E | | | | | |
Expenses before reductions | .93% | .51% | .56% | .69% | .78% |
Expenses net of fee waivers, if any | .92% | .51% | .55% | .69% | .78% |
Expenses net of all reductions | .90% | .48% | .50% | .66% | .74% |
Net investment income (loss) | 1.71% | 2.70% | 1.61% | 1.60% | 2.25% |
Supplemental Data | | | | | |
Net assets, end of period (000 omitted) | $ 562,490 | $ 265,484 | $ 291,323 | $ 368,004 | $ 383,048 |
Portfolio turnover rate D | 42% | 90% | 77% | 111% | 115% |
A Total returns would have been lower if certain expenses had not been reduced during the applicable periods shown.
B Calculated based on average shares outstanding during the period.
C Fees and expenses of any underlying Fidelity Central Funds are not included in the Fund's expense ratio. The Fund indirectly bears its proportionate share of the expenses of any underlying Fidelity Central Funds.
D Amount does not include the portfolio activity of any underlying Fidelity Central Funds.
E Expense ratios reflect operating expenses of the class. Expenses before reductions do not reflect amounts reimbursed by the investment adviser or reductions from brokerage service arrangements or reductions from other expense offset arrangements and do not represent the amount paid by the class during periods when reimbursements or reductions occur. Expenses net of fee waivers reflect expenses after reimbursement by the investment adviser but prior to reductions from brokerage service arrangements or other expense offset arrangements. Expenses net of all reductions represent the net expenses paid by the class.
F Amount represents less than $.01 per share.
See accompanying notes which are an integral part of the financial statements.
Annual Report
Fidelity Overseas Fund
Notes to Financial Statements
For the period ended October 31, 2013
1. Organization.
Fidelity Overseas Fund (the Fund) is a fund of Fidelity Investment Trust (the Trust) and is authorized to issue an unlimited number of shares. The Trust is registered under the Investment Company Act of 1940, as amended (the 1940 Act), as an open-end management investment company organized as a Massachusetts business trust. The Fund offers Overseas and Class K shares, each of which has equal rights as to assets and voting privileges. The Fund offered Class F shares during the period June 26, 2009 through December 16, 2011, and all outstanding shares were redeemed by December 16, 2011. Each class has exclusive voting rights with respect to matters that affect that class.
2. Investments in Fidelity Central Funds.
The Fund invests in Fidelity Central Funds, which are open-end investment companies generally available only to other investment companies and accounts managed by Fidelity Management & Research Company (FMR)and its affiliates. The Fund's Schedule of Investments lists each of the Fidelity Central Funds held as of period end, if any, as an investment of the Fund, but does not include the underlying holdings of each Fidelity Central Fund. As an Investing Fund, the Fund indirectly bears its proportionate share of the expenses of the underlying Fidelity Central Funds.
The Money Market Central Funds seek preservation of capital and current income and are managed by Fidelity Investments Money Management, Inc. (FIMM), an affiliate of FMR.
A complete unaudited list of holdings for each Fidelity Central Fund is available upon request or at the Securities and Exchange Commission (the SEC) website at www.sec.gov. In addition, the financial statements of the Fidelity Central Funds, which are not covered by the Fund's Report of Independent Registered Public Accounting Firm, are available on the SEC website or upon request.
3. Significant Accounting Policies.
The financial statements have been prepared in conformity with accounting principles generally accepted in the United States of America (GAAP), which require management to make certain estimates and assumptions at the date of the financial statements. Actual results could differ from those estimates. Subsequent events, if any, through the date that the financial statements were issued have been evaluated in the preparation of the financial statements. The following summarizes the significant accounting policies of the Fund:
Investment Valuation. Investments are valued as of 4:00 p.m. Eastern time on the last calendar day of the period. In accordance with valuation policies and procedures approved by the Board of Trustees (the Board), the Fund attempts to obtain prices from one or more third party pricing vendors or brokers to value its investments. When current market prices, quotations or currency exchange rates are not readily available or reliable, investments will be fair valued in good faith by the FMR Fair Value Committee (the Committee), in accordance with procedures adopted by the Board. Factors used in determining fair value vary by investment type and may include market or investment specific events. The frequency with which these procedures are used cannot be predicted and they may be utilized to a significant extent. The Committee oversees the Fund's valuation policies and procedures and is responsible for approving and reporting to the Board all fair value determinations.
The Fund categorizes the inputs to valuation techniques used to value its investments into a disclosure hierarchy consisting of three levels as shown below:
Level 1 - quoted prices in active markets for identical investments
Level 2 - other significant observable inputs (including quoted prices for similar investments, interest rates, prepayment speeds, etc.)
Level 3 - unobservable inputs (including the Fund's own assumptions based on the best information available)
Valuation techniques used to value the Fund's investments by major category are as follows:
Equity securities, including restricted securities, for which market quotations are readily available, are valued at the last reported sale price or official closing price as reported by a third party pricing vendor on the primary market or exchange on which they are traded and are categorized as Level 1 in the hierarchy. In the event there were no sales during the day or closing prices are not available, securities are valued at the last quoted bid price or may be valued using the last available price and are generally categorized as Level 2 in the hierarchy. For foreign equity securities, when market or security specific events arise, comparisons to the valuation of American Depositary Receipts (ADRs), futures contracts, Exchange-Traded Funds (ETFs) and certain indexes as well as quoted prices for similar securities may be used and would be categorized as Level 2 in the hierarchy. Utilizing these techniques may result in transfers between Level 1 and Level 2. For equity securities, including restricted securities, where observable inputs are limited, assumptions about market activity and risk are used and these securities may be categorized as Level 3 in the hierarchy.
Investments in open-end mutual funds, including the Fidelity Central Funds, are valued at their closing net asset value (NAV) each business day and are categorized as Level 1 in the hierarchy.
Annual Report
3. Significant Accounting Policies - continued
Investment Valuation - continued
Changes in valuation techniques may result in transfers in or out of an assigned level within the disclosure hierarchy. The aggregate value of investments by input level, as of October 31, 2013, including information on transfers between Levels 1 and 2 is included at the end of the Fund's Schedule of Investments.
Foreign Currency. The Fund may use foreign currency contracts to facilitate transactions in foreign-denominated securities. Gains and losses from these transactions may arise from changes in the value of the foreign currency or if the counterparties do not perform under the contracts' terms.
Foreign-denominated assets, including investment securities, and liabilities are translated into U.S. dollars at the exchange rates at period end. Purchases and sales of investment securities, income and dividends received and expenses denominated in foreign currencies are translated into U.S. dollars at the exchange rate in effect on the transaction date.
The effects of exchange rate fluctuations on investments are included with the net realized and unrealized gain (loss) on investment securities. Other foreign currency transactions resulting in realized and unrealized gain (loss) are disclosed separately.
Investment Transactions and Income. For financial reporting purposes, the Fund's investment holdings and NAV include trades executed through the end of the last business day of the period. The NAV per share for processing shareholder transactions is calculated as of the close of business of the New York Stock Exchange (NYSE), normally 4:00 p.m. Eastern time and includes trades executed through the end of the prior business day. Gains and losses on securities sold are determined on the basis of identified cost and may include proceeds received from litigation. Dividend income is recorded on the ex-dividend date, except for certain dividends from foreign securities where the ex-dividend date may have passed, which are recorded as soon as the Fund is informed of the ex-dividend date. Non-cash dividends included in dividend income, if any, are recorded at the fair market value of the securities received. Distributions received on securities that represent a return of capital or capital gain are recorded as a reduction of cost of investments and/or as a realized gain. Subsequent to ex-dividend date the Fund determines the components of these distributions, based upon receipt of tax filings or other correspondence relating to the underlying investment. Interest income and distributions from the Fidelity Central Funds are accrued as earned. Interest income includes coupon interest and amortization of premium and accretion of discount on debt securities. Investment income is recorded net of foreign taxes withheld where recovery of such taxes is uncertain.
Class Allocations and Expenses. Investment income, realized and unrealized capital gains and losses, common expenses of the Fund, and certain fund-level expense reductions, if any, are allocated daily on a pro-rata basis to each class based on the relative net assets of each class to the total net assets of the Fund. Each class differs with respect to transfer agent fees incurred. Certain expense reductions may also differ by class. For the reporting period, the allocated portion of income and expenses to each class as a percent of its average net assets may vary due to the timing of recording these transactions in relation to fluctuating net assets of the classes. Expenses directly attributable to a fund are charged to that fund. Expenses attributable to more than one fund are allocated among the respective funds on the basis of relative net assets or other appropriate methods. Expense estimates are accrued in the period to which they relate and adjustments are made when actual amounts are known.
Deferred Trustee Compensation. Under a Deferred Compensation Plan (the Plan), independent Trustees may elect to defer receipt of a portion of their annual compensation. Deferred amounts are invested in a cross-section of Fidelity funds, are marked-to-market and remain in the Fund until distributed in accordance with the Plan. The investment of deferred amounts and the offsetting payable to the Trustees are included in the accompanying Statement of Assets and Liabilities.
Income Tax Information and Distributions to Shareholders. Each year, the Fund intends to qualify as a regulated investment company under Subchapter M of the Internal Revenue Code, including distributing substantially all of its taxable income and realized gains. As a result, no provision for U.S. Federal income taxes is required. As of October 31, 2013, the Fund did not have any unrecognized tax benefits in the financial statements; nor is the Fund aware of any tax positions for which it is reasonably possible that the total amounts of unrecognized tax benefits will significantly change in the next twelve months. The Fund files a U.S. federal tax return, in addition to state and local tax returns as required. The Fund's federal income tax returns are subject to examination by the Internal Revenue Service (IRS) for a period of three fiscal years after they are filed. State and local tax returns may be subject to examination for an additional fiscal year depending on the jurisdiction. Foreign taxes are provided for based on the Fund's understanding of the tax rules and rates that exist in the foreign markets in which it invests.
Distributions are declared and recorded on the ex-dividend date. Income dividends and capital gain distributions are declared separately for each class. Income and capital gain distributions are determined in accordance with income tax regulations, which may differ from GAAP.
Capital accounts within the financial statements are adjusted for permanent book-tax differences. These adjustments have no impact on net assets or the results of operations. Temporary book-tax differences will reverse in a subsequent period.
Book-tax differences are primarily due to foreign currency transactions, passive foreign investment companies (PFIC), deferred trustees compensation, capital loss carryforwards and losses deferred due to wash sales.
Annual Report
Fidelity Overseas Fund
Notes to Financial Statements - continued
3. Significant Accounting Policies - continued
Income Tax Information and Distributions to Shareholders - continued
The federal tax cost of investment securities and unrealized appreciation (depreciation) as of period end were as follows:
Gross unrealized appreciation | $ 525,982,074 |
Gross unrealized depreciation | (35,353,921) |
Net unrealized appreciation (depreciation) on securities and other investments | $ 490,628,153 |
| |
Tax Cost | $ 1,950,177,412 |
The tax-based components of distributable earnings as of period end were as follows:
Undistributed ordinary income | $ 41,518,916 |
Capital loss carryforward | $ (1,477,884,149) |
Net unrealized appreciation (depreciation) | $ 490,681,811 |
Capital loss carryforwards are only available to offset future capital gains of the Fund to the extent provided by regulations and may be limited. Under the Regulated Investment Company Modernization Act of 2010 (the Act), the Fund is permitted to carry forward capital losses incurred in taxable years beginning after December 22, 2010 for an unlimited period and such capital losses are required to be used prior to any losses that expire. The capital loss carryforward information presented below, including any applicable limitation, is estimated as of fiscal period end and is subject to adjustment.
Fiscal year of expiration | |
2016 | $ (464,379,963) |
2017 | (939,719,765) |
Total with expiration | (1,404,099,728) |
No expiration | |
Short-term | (23,395,688) |
Long-term | (50,388,733) |
Total no expiration | (73,784,421) |
Total capital loss carryforward | $ (1,477,884,149) |
The tax character of distributions paid was as follows:
| October 31, 2013 | October 31, 2012 |
Ordinary Income | $ 46,883,539 | $ 71,739,856 |
Short-Term Trading (Redemption) Fees. Shares held by investors in the Fund less than 30 days may have been subject to a redemption fee equal to 1.00% of the net asset value of shares redeemed. All redemption fees, which reduce the proceeds of the shareholder redemption, are retained by the Fund and accounted for as an addition to paid in capital.
4. Purchases and Sales of Investments.
Purchases and sales of securities, other than short-term securities, aggregated $950,815,017 and $889,516,361, respectively.
5. Fees and Other Transactions with Affiliates.
Management Fee. FMR and its affiliates provide the Fund with investment management related services for which the Fund pays a monthly management fee. The management fee is the sum of an individual fund fee rate that is based on an annual rate of .45% of the Fund's average net assets and an annualized group fee rate that averaged .25% during the period. The group fee rate is based upon the average net assets of all the mutual funds advised by FMR, including any mutual funds previously advised by FMR that are currently advised by Fidelity SelectCo, LLC, an affiliate of FMR. The group fee rate decreases as assets under management increase and increases as assets under management decrease. In addition, the management fee is subject to a performance adjustment (up to a maximum of ± .20% of the Fund's average net assets over a 36 month performance period). The upward or downward adjustment to the management fee is based on the relative investment performance of Overseas as compared to an appropriate benchmark index over the same 36 month performance period. For the reporting period, the total annual management fee rate, including the performance adjustment, was .81% of the Fund's average net assets. The performance adjustment included in the management fee rate may be higher or lower than the maximum performance adjustment rate due to the difference between the average net assets for the reporting and performance periods.
Annual Report
5. Fees and Other Transactions with Affiliates - continued
Transfer Agent Fees. Fidelity Investments Institutional Operations Company, Inc., (FIIOC), an affiliate of FMR, is the transfer, dividend disbursing and shareholder servicing agent for each class of the Fund. FIIOC receives account fees and asset-based fees that vary according to the account size and type of account of the shareholders of Overseas. FIIOC receives an asset-based fee of Class K's average net assets. FIIOC pays for typesetting, printing and mailing of shareholder reports, except proxy statements.
For the period, transfer agent fees for each class were as follows:
| Amount | % of
Average
Net Assets |
Overseas | $ 3,737,229 | .21 |
Class K | 190,678 | .05 |
| $ 3,927,907 | |
Accounting and Security Lending Fees. Fidelity Service Company, Inc. (FSC), an affiliate of FMR, maintains the Fund's accounting records. The accounting fee is based on the level of average net assets for each month. Under a separate contract, FSC administers the security lending program. The security lending fee is based on the number and duration of lending transactions.
Brokerage Commissions. The Fund placed a portion of its portfolio transactions with brokerage firms which are affiliates of the investment adviser. Brokerage commissions are included in net realized gain (loss) and change in net unrealized appreciation (depreciation) in the Statement of Operations. The commissions paid to these affiliated firms were $1,212 for the period.
Interfund Lending Program. Pursuant to an Exemptive Order issued by the SEC, the Fund, along with other registered investment companies having management contracts with FMR, may participate in an interfund lending program. This program provides an alternative credit facility allowing the funds to borrow from, or lend money to, other participating affiliated funds. At period end, there were no interfund loans outstanding. The Fund's activity in this program during the period for which loans were outstanding was as follows:
Borrower or Lender | Average Loan
Balance | Weighted Average Interest Rate | Interest
Expense |
Borrower | $ 11,892,000 | .31% | $ 608 |
6. Committed Line of Credit.
The Fund participates with other funds managed by FMR or an affiliate in a $4.25 billion credit facility (the "line of credit") to be utilized for temporary or emergency purposes to fund shareholder redemptions or for other short-term liquidity purposes. The Fund has agreed to pay commitment fees on its pro-rata portion of the line of credit, which amounted to $4,522 and is reflected in Miscellaneous expenses on the Statement of Operations. During the period, there were no borrowings on this line of credit.
7. Security Lending.
The Fund lends portfolio securities through a lending agent from time to time in order to earn additional income. For equity securities, a lending agent is used and may loan securities to certain qualified borrowers, including Fidelity Capital Markets (FCM), a broker-dealer affiliated with the Fund. On the settlement date of the loan, the Fund receives collateral (in the form of U.S. Treasury obligations, letters of credit and/or cash) against the loaned securities and maintains collateral in an amount not less than 100% of the market value of the loaned securities during the period of the loan. The market value of the loaned securities is determined at the close of business of the Fund and any additional required collateral is delivered to the Fund on the next business day. If the borrower defaults on its obligation to return the securities loaned because of insolvency or other reasons, the Fund may apply collateral received from the borrower against the obligation. The Fund may experience delays and costs in recovering the securities loaned. Any cash collateral received is invested in the Fidelity Securities Lending Cash Central Fund. The value of loaned securities and cash collateral at period end are disclosed on the Fund's Statement of Assets and Liabilities. Security lending income represents the income earned on investing cash collateral, less rebates paid to borrowers and any lending agent fees associated with the loan, plus any premium payments received for lending certain types of securities. Security lending income is presented in the Statement of Operations as a component of income from Fidelity Central Funds. Total security lending income during the period amounted to $949,322. During the period, there were no securities loaned to FCM.
8. Expense Reductions.
Commissions paid to certain brokers with whom FMR, or its affiliates, places trades on behalf of the Fund include an amount in addition to trade execution, which may be rebated back to the Fund to offset certain expenses. This amount totaled $559,838 for the period.
In addition, FMR reimbursed a portion of the Fund's operating expenses during the period in the amount of $23,324.
Annual Report
Fidelity Overseas Fund
Notes to Financial Statements - continued
9. Distributions to Shareholders.
Distributions to shareholders of each class were as follows:
Years ended October 31, | 2013 | 2012A |
From net investment income | | |
Overseas | $ 39,514,173 | $ 56,962,859 |
Class K | 7,369,366 | 9,516,308 |
Class F | - | 3,598,724 |
Total | $ 46,883,539 | $ 70,077,891 |
From net realized gain | | |
Overseas | $ - | $ 1,377,579 |
Class K | - | 207,326 |
Class F | - | 77,060 |
Total | $ - | $ 1,661,965 |
A All Class F shares were redeemed on December 16, 2011.
10. Share Transactions.
Transactions for each class of shares were as follows:
| Shares | Dollars |
Years ended October 31, | 2013 | 2012A | 2013 | 2012A |
Overseas | | | | |
Shares sold | 4,856,702 | 5,513,981 | $ 167,166,517 | $ 159,997,895 |
Reinvestment of distributions | 1,224,483 | 2,082,243 | 38,681,419 | 57,282,489 |
Shares redeemed | (10,572,300) | (30,970,724) | (364,332,964) | (876,498,461) |
Net increase (decrease) | (4,491,115) | (23,374,500) | $ (158,485,028) | $ (659,218,077) |
Class K | | | | |
Shares sold | 8,204,154 | 5,090,211 | $ 286,897,852 | $ 145,041,228 |
Reinvestment of distributions | 233,874 | 354,489 | 7,369,366 | 9,723,634 |
Shares redeemed | (2,553,449) | (6,913,669) | (88,224,553) | (205,273,028) |
Net increase (decrease) | 5,884,579 | (1,468,969) | $ 206,042,665 | $ (50,508,166) |
Class F | | | | |
Shares sold | - | 373,582 | $ - | $ 10,277,470 |
Reinvestment of distributions | - | 134,104 | - | 3,675,784 |
Shares redeemed | - | (5,923,991) | - | (161,227,552) |
Net increase (decrease) | - | (5,416,305) | $ - | $ (147,274,298) |
A All Class F shares were redeemed on December 16, 2011.
11. Other.
The Fund's organizational documents provide former and current trustees and officers with a limited indemnification against liabilities arising in connection with the performance of their duties to the Fund. In the normal course of business, the Fund may also enter into contracts that provide general indemnifications. The Fund's maximum exposure under these arrangements is unknown as this would be dependent on future claims that may be made against the Fund. The risk of material loss from such claims is considered remote.
Annual Report
Report of Independent Registered Public Accounting Firm
To the Trustees of Fidelity Investment Trust and the Shareholders of Fidelity Overseas Fund:
In our opinion, the accompanying statement of assets and liabilities, including the schedule of investments, and the related statements of operations and of changes in net assets and the financial highlights present fairly, in all material respects, the financial position of Fidelity Overseas Fund (a fund of Fidelity Investment Trust) at October 31, 2013, the results of its operations for the year then ended, the changes in its net assets for each of the two years in the period then ended and the financial highlights for each of the five years in the period then ended, in conformity with accounting principles generally accepted in the United States of America. These financial statements and financial highlights (hereafter referred to as "financial statements") are the responsibility of the Fidelity Overseas Fund's management. Our responsibility is to express an opinion on these financial statements based on our audits. We conducted our audits of these financial statements in accordance with the standards of the Public Company Accounting Oversight Board (United States). Those standards require that we plan and perform the audit to obtain reasonable assurance about whether the financial statements are free of material misstatement. An audit includes examining, on a test basis, evidence supporting the amounts and disclosures in the financial statements, assessing the accounting principles used and significant estimates made by management, and evaluating the overall financial statement presentation. We believe that our audits, which included confirmation of securities at October 31, 2013 by correspondence with the custodian and brokers, provide a reasonable basis for our opinion.
PricewaterhouseCoopers LLP
Boston, Massachusetts
December 13, 2013
Annual Report
The Trustees, Member of the Advisory Board, and executive officers of the trust and fund, as applicable, are listed below. The Board of Trustees governs the fund and is responsible for protecting the interests of shareholders. The Trustees are experienced executives who meet periodically throughout the year to oversee the fund's activities, review contractual arrangements with companies that provide services to the fund, oversee management of the risks associated with such activities and contractual arrangements, and review the fund's performance. Except for James C. Curvey, Ned C. Lautenbach, Ronald P. O'Hanley, and William S. Stavropoulos, each of the Trustees oversees 171 funds. Mr. Curvey oversees 394 funds. Mr. Lautenbach, Mr. O'Hanley, and Mr. Stavropoulos each oversees 245 funds.
The Trustees hold office without limit in time except that (a) any Trustee may resign; (b) any Trustee may be removed by written instrument, signed by at least two-thirds of the number of Trustees prior to such removal; (c) any Trustee who requests to be retired or who has become incapacitated by illness or injury may be retired by written instrument signed by a majority of the other Trustees; and (d) any Trustee may be removed at any special meeting of shareholders by a two-thirds vote of the outstanding voting securities of the trust. Each Trustee who is not an interested person of the trust and the fund (as defined in the 1940 Act) (Independent Trustee), shall retire not later than the last day of the calendar year in which his or her 75th birthday occurs. The Independent Trustees may waive this mandatory retirement age policy with respect to individual Trustees. The executive officers and Advisory Board Member hold office without limit in time, except that any officer and Advisory Board Member may resign or may be removed by a vote of a majority of the Trustees at any regular meeting or any special meeting of the Trustees. Except as indicated, each individual has held the office shown or other offices in the same company for the past five years.
Experience, Skills, Attributes, and Qualifications of the Fund's Trustees. The Governance and Nominating Committee has adopted a statement of policy that describes the experience, qualifications, attributes, and skills that are necessary and desirable for potential Independent Trustee candidates (Statement of Policy). The Board believes that each Trustee satisfied at the time he or she was initially elected or appointed a Trustee, and continues to satisfy, the standards contemplated by the Statement of Policy. The Governance and Nominating Committee also engages professional search firms to help identify potential Independent Trustee candidates who have the experience, qualifications, attributes, and skills consistent with the Statement of Policy. From time to time, additional criteria based on the composition and skills of the current Independent Trustees, as well as experience or skills that may be appropriate in light of future changes to board composition, business conditions, and regulatory or other developments, have also been considered by the professional search firms and the Governance and Nominating Committee. In addition, the Board takes into account the Trustees' commitment and participation in Board and committee meetings, as well as their leadership of standing and ad hoc committees throughout their tenure.
In determining that a particular Trustee was and continues to be qualified to serve as a Trustee, the Board has considered a variety of criteria, none of which, in isolation, was controlling. The Board believes that, collectively, the Trustees have balanced and diverse experience, qualifications, attributes, and skills, which allow the Board to operate effectively in governing the fund and protecting the interests of shareholders. Information about the specific experience, skills, attributes, and qualifications of each Trustee, which in each case led to the Board's conclusion that the Trustee should serve (or continue to serve) as a trustee of the fund, is provided below.
Board Structure and Oversight Function. James C. Curvey is an interested person (as defined in the 1940 Act) and currently serves as Chairman. The Trustees have determined that an interested Chairman is appropriate and benefits shareholders because an interested Chairman has a personal and professional stake in the quality and continuity of services provided to the fund. Independent Trustees exercise their informed business judgment to appoint an individual of their choosing to serve as Chairman, regardless of whether the Trustee happens to be independent or a member of management. The Independent Trustees have determined that they can act independently and effectively without having an Independent Trustee serve as Chairman and that a key structural component for assuring that they are in a position to do so is for the Independent Trustees to constitute a substantial majority for the Board. The Independent Trustees also regularly meet in executive session. Ned C. Lautenbach serves as Chairman of the Independent Trustees and as such (i) acts as a liaison between the Independent Trustees and management with respect to matters important to the Independent Trustees and (ii) with management prepares agendas for Board meetings.
Fidelity funds are overseen by different Boards of Trustees. The fund's Board oversees Fidelity's equity and high income funds and another Board oversees Fidelity's investment-grade bond, money market, and asset allocation funds. The asset allocation funds may invest in Fidelity funds overseen by the fund's Board. The use of separate Boards, each with its own committee structure, allows the Trustees of each group of Fidelity funds to focus on the unique issues of the funds they oversee, including common research, investment, and operational issues. On occasion, the separate Boards establish joint committees to address issues of overlapping consequences for the Fidelity funds overseen by each Board.
The Trustees operate using a system of committees to facilitate the timely and efficient consideration of all matters of importance to the Trustees, the fund, and fund shareholders and to facilitate compliance with legal and regulatory requirements and oversight of the fund's activities and associated risks. The Board, acting through its committees, has charged FMR and its affiliates with (i) identifying events or circumstances the occurrence of which could have demonstrably adverse effects on the fund's business and/or reputation; (ii) implementing processes and controls to lessen the possibility that such events or circumstances occur or to mitigate the effects of such events or circumstances if they do occur; and (iii) creating and maintaining a system designed to evaluate continuously business and market conditions in order to facilitate the identification and implementation processes described in (i) and (ii) above. Because the day-to-day operations and activities of the fund are carried out by or through FMR, its affiliates and other service providers, the fund's exposure to risks is mitigated but not eliminated by the processes overseen by the Trustees. While each of the Board's committees has responsibility for overseeing different aspects of the fund's activities, oversight is exercised primarily through the Operations, Audit, and Compliance Committees. In addition, the Independent Trustees have worked with FMR to enhance the Board's oversight of investment and financial risks, legal and regulatory risks, technology risks, and operational risks, including the development of additional risk reporting to the Board. For example, a working group comprised of Independent Trustees and FMR has worked and continues to work to review the Fidelity funds' valuation-related activities, reporting and risk management. Appropriate personnel, including but not limited to the fund's Chief Compliance Officer (CCO), FMR's internal auditor, the independent accountants, the fund's Treasurer and portfolio management personnel, make periodic reports to the Board's committees, as appropriate, including an annual review of FMR's risk management program for the Fidelity funds. The responsibilities of each standing committee, including their oversight responsibilities, are described further under "Standing Committees of the Fund's Trustees."
Annual Report
The fund's Statement of Additional Information (SAI) includes more information about the Trustees. To request a free copy, call Fidelity at 1-800-835-5092.
Interested Trustees*:
Correspondence intended for each Trustee who is an interested person may be sent to Fidelity Investments, 245 Summer Street, Boston, Massachusetts 02210.
Name, Year of Birth; Principal Occupations and Other Relevant Experience+ |
James C. Curvey (1935) |
Year of Election or Appointment: 2007 Trustee Chairman of the Board of Trustees |
| Mr. Curvey also serves as Trustee of other Fidelity funds. Mr. Curvey is a Director of Fidelity Investments Money Management, Inc. (2009-present), Director of Fidelity Research & Analysis Co. (2009-present) and Director of FMR and FMR Co., Inc. (2007-present). Mr. Curvey is also Vice Chairman (2007-present) and Director of FMR LLC. In addition, Mr. Curvey serves as an Overseer for the Boston Symphony Orchestra and a member of the Trustees of Villanova University. Previously, Mr. Curvey was the Vice Chairman (2006-2007) and Director (2000-2007) of FMR Corp. |
Ronald P. O'Hanley (1957) |
Year of Election or Appointment: 2011 Trustee |
| Mr. O'Hanley also serves as Trustee of other Fidelity funds. He is Director of Fidelity SelectCo, LLC (2013-present), FMR Co., Inc. (2010-present), Director of Fidelity Investments Money Management, Inc. (2010-present), Director of Fidelity Research & Analysis Company (2010-present), President of Fidelity Asset Management and Corporate Services and a Member of Fidelity's Executive Committee (2010-present). Previously, Mr. O'Hanley served as President and Chief Executive Officer of BNY Mellon Asset Management (2007-2010). Mr. O'Hanley also served as Vice Chairman of Bank New York Mellon Corp. and a member of that firm's Executive Committee. Prior to the 2007 merger of The Bank of New York and Mellon Financial Corporation, he was Vice Chairman of Mellon Financial Corporation and President and Chief Executive Officer of Mellon Asset Management. He joined Mellon in February 1997. Mr. O'Hanley currently serves as Chairman of the Boston Public Library Foundation Board of Directors and sits on the Board of Directors of Beth Israel Deaconess Medical Center, the Board of Trustees of the Marine Biological Laboratory and the Advisory Board of the Maxwell School of Citizenship and Public Administration at Syracuse University. Mr. O'Hanley also chairs the Council on Asset Management for the Financial Services Roundtable and is a member of the Board of Directors of Institutional Investor's U.S. Institute. |
* Trustees have been determined to be "Interested Trustees" by virtue of, among other things, their affiliation with the trust or various entities under common control with FMR.
+ The information above includes each Trustee's principal occupation during the last five years and other information relating to the experience, attributes, and skills relevant to each Trustee's qualifications to serve as a Trustee, which led to the conclusion that each Trustee should serve as a Trustee for the fund.
Annual Report
Trustees and Officers - continued
Independent Trustees:
Correspondence intended for each Independent Trustee (that is, the Trustees other than the Interested Trustees) may be sent to Fidelity Investments, P.O. Box 55235, Boston, Massachusetts 02205-5235.
Name, Year of Birth; Principal Occupations and Other Relevant Experience+ |
Dennis J. Dirks (1948) |
Year of Election or Appointment: 2005 Trustee |
| Mr. Dirks also serves as Trustee of other Fidelity funds. Prior to his retirement in May 2003, Mr. Dirks was Chief Operating Officer and a member of the Board of The Depository Trust & Clearing Corporation (DTCC). He also served as President, Chief Operating Officer, and Board member of The Depository Trust Company (DTC) and President and Board member of the National Securities Clearing Corporation (NSCC). In addition, Mr. Dirks served as Chief Executive Officer and Board member of the Government Securities Clearing Corporation, Chief Executive Officer and Board member of the Mortgage-Backed Securities Clearing Corporation, as a Trustee and a member of the Finance Committee of Manhattan College (2005-2008), and as a Trustee and a member of the Finance Committee of AHRC of Nassau County (2006-2008). Mr. Dirks is a member of the Independent Directors Council (IDC) Governing Council (2010-present) and Board of Directors for The Brookville Center for Children's Services, Inc. (2009-present). |
Alan J. Lacy (1953) |
Year of Election or Appointment: 2008 Trustee |
| Mr. Lacy also serves as Trustee of other Fidelity funds. Mr. Lacy serves as Senior Adviser (2007-present) of Oak Hill Capital Partners, L.P. (private equity). Mr. Lacy also served as Chief Executive Officer (2000-2005) and Vice Chairman (2005-2006) of Sears Holdings Corporation and Sears, Roebuck and Co. (retail). In addition, Mr. Lacy serves as a member of the Board of Directors of Dave & Buster's Entertainment, Inc. (restaurant and entertainment complexes, 2010-present), Earth Fare, Inc. (retail grocery, 2012-present), The Hillman Companies, Inc. (hardware wholesalers, 2010-present), and Bristol-Myers Squibb Company (global pharmaceuticals, 2008-present). Mr. Lacy is a member of the Board of Trustees of The National Parks Conservation Association (2006-present). Previously, Mr. Lacy served as Chairman of the Board of Trustees of the National Parks Conservation Association (2008-2011) and as a member of the Board of Directors for the Western Union Company (global money transfer, 2006-2011). |
Ned C. Lautenbach (1944) |
Year of Election or Appointment: 2000 Trustee Chairman of the Independent Trustees |
| Mr. Lautenbach also serves as Trustee of other Fidelity funds. Mr. Lautenbach currently serves as the Lead Director of the Eaton Corporation Board of Directors (diversified industrial, 1997-present). Mr. Lautenbach is Chairman of the Board of Directors of the Philharmonic Center for the Arts in Naples, Florida (2012-present) and a member of the Council on Foreign Relations (1994-present). Previously, Mr. Lautenbach was a Partner/Advisory Partner at Clayton, Dubilier & Rice, LLC (private equity investment, 1998-2010), as well as a Director of Sony Corporation (2006-2007). |
Joseph Mauriello (1944) |
Year of Election or Appointment: 2008 Trustee |
| Mr. Mauriello also serves as Trustee of other Fidelity funds. Prior to his retirement in January 2006, Mr. Mauriello served in numerous senior management positions including Deputy Chairman and Chief Operating Officer (2004-2005), and Vice Chairman of Financial Services (2002-2004) of KPMG LLP US (professional services, 1965-2005). Mr. Mauriello currently serves as a member of the Board of Directors of XL Group plc. (global insurance and re-insurance, 2006-present). Previously, Mr. Mauriello served as a Director of the Hamilton Funds of the Bank of New York (2006-2007) and of Arcadia Resources Inc. (health care services and products, 2007-2012). |
Robert W. Selander (1950) |
Year of Election or Appointment: 2011 Trustee |
| Mr. Selander also serves as Trustee of other Fidelity funds. Previously, Mr. Selander served as a Member of the Advisory Board of other Fidelity funds (2011), and Executive Vice Chairman (2010), Chief Executive Officer (2009-2010), and President and Chief Executive Officer (1997-2009) of Mastercard, Inc. |
Cornelia M. Small (1944) |
Year of Election or Appointment: 2005 Trustee |
| Ms. Small also serves as Trustee of other Fidelity funds. Ms. Small is a member of the Board of Directors (2009-present) and Chair of the Investment Committee (2010-present) of the Teagle Foundation. Ms. Small also serves on the Investment Committee of the Berkshire Taconic Community Foundation (2008-present). Previously, Ms. Small served as Chairperson (2002-2008) and a member of the Investment Committee and Chairperson (2008-2012) and a member of the Board of Trustees of Smith College. In addition, Ms. Small served as Chief Investment Officer, Director of Global Equity Investments, and a member of the Board of Directors of Scudder, Stevens & Clark and Scudder Kemper Investments. |
William S. Stavropoulos (1939) |
Year of Election or Appointment: 2001 Trustee Vice Chairman of the Independent Trustees |
| Mr. Stavropoulos also serves as Trustee of other Fidelity funds. Mr. Stavropoulos serves as President and Founder of the Michigan Baseball Foundation, the Great Lakes Loons (2007-present). Mr. Stavropoulos is Chairman Emeritus of the Board of Directors of The Dow Chemical Company, where he previously served in numerous senior management positions, including President, CEO (1995-2000; 2002-2004), Chairman of the Executive Committee (2000-2006), and as a member of the Board of Directors (1990-2006). Currently, Mr. Stavropoulos is Chairman of the Board of Directors of Univar Inc. (global distributor of commodity and specialty chemicals), a Director of Teradata Corporation (data warehousing and technology solutions), and Maersk Inc. (industrial conglomerate), and a member of the Advisory Board for Metalmark Capital LLC (private equity investment, 2005-present). Mr. Stavropoulos is an operating advisor to Clayton, Dubilier & Rice, LLC (private equity investment). In addition, Mr. Stavropoulos is a member of the University of Notre Dame Advisory Council for the College of Science, a Trustee of the Rollin L. Gerstacker Foundation, and a Director of the Naples Philharmonic Center for the Arts. Previously, Mr. Stavropoulos served as a Director of Chemical Financial Corporation (bank holding company, 1993-2012) and Tyco International, Ltd. (multinational manufacturing and services, 2007-2012). |
David M. Thomas (1949) |
Year of Election or Appointment: 2008 Trustee |
| Mr. Thomas also serves as Trustee of other Fidelity funds. Mr. Thomas serves as Non-Executive Chairman of the Board of Directors of Fortune Brands Home and Security (home and security products, 2011-present), and as a member of the Board of Directors of Interpublic Group of Companies, Inc. (marketing communication, 2004-present). Previously, Mr. Thomas served as Executive Chairman (2005-2006) and Chairman and Chief Executive Officer (2000-2005) of IMS Health, Inc. (pharmaceutical and healthcare information solutions), and a Director of Fortune Brands, Inc. (consumer products, 2000-2011). |
+ The information above includes each Trustee's principal occupation during the last five years and other information relating to the experience, attributes, and skills relevant to each Trustee's qualifications to serve as a Trustee, which led to the conclusion that each Trustee should serve as a Trustee for the fund.
Advisory Board Member and Executive Officers:
Correspondence intended for each executive officer and Peter S. Lynch may be sent to Fidelity Investments, 245 Summer Street, Boston, Massachusetts 02210. Executive officers appear below in alphabetical order.
Name, Year of Birth; Principal Occupation |
Peter S. Lynch (1944) |
Year of Election or Appointment: 2003 Member of the Advisory Board |
| Mr. Lynch also serves as Member of the Advisory Board of other Fidelity funds. Mr. Lynch is Vice Chairman and a Director of FMR and FMR Co., Inc. In addition, Mr. Lynch serves as a Trustee of Boston College and as the Chairman of the Inner-City Scholarship Fund. Previously, Mr. Lynch served on the Special Olympics International Board of Directors (1997-2006). |
Elizabeth Paige Baumann (1968) |
Year of Election or Appointment: 2012 Anti-Money Laundering (AML) Officer |
| Ms. Baumann also serves as AML Officer of other funds. She is Chief AML Officer of FMR LLC (2012-present) and is an employee of Fidelity Investments. Previously, Ms. Baumann served as Vice President and Deputy Anti-Money Laundering Officer (2007-2012). |
William C. Coffey (1969) |
Year of Election or Appointment: 2009 Assistant Secretary |
| Mr. Coffey also serves as Assistant Secretary of other funds. He is Senior Vice President and Deputy General Counsel of FMR LLC (2010-present), and is an employee of Fidelity Investments. Previously, Mr. Coffey served as Vice President and Associate General Counsel of FMR LLC (2005-2009). |
Jonathan Davis (1968) |
Year of Election or Appointment: 2010 Assistant Treasurer |
| Mr. Davis also serves as Assistant Treasurer of other funds. Mr. Davis is an employee of Fidelity Investments. Previously, Mr. Davis served as Vice President and Associate General Counsel of FMR LLC (2003-2010). |
Adrien E. Deberghes (1967) |
Year of Election or Appointment: 2008 Deputy Treasurer |
| Mr. Deberghes also serves as an officer of other funds. He is an employee of Fidelity Investments (2008-present). Prior to joining Fidelity Investments, Mr. Deberghes was Senior Vice President of Mutual Fund Administration at State Street Corporation (2007-2008), Senior Director of Mutual Fund Administration at Investors Bank & Trust (2005-2007), and Director of Finance for Dunkin' Brands (2000-2005). |
Stephanie J. Dorsey (1969) |
Year of Election or Appointment: 2010 Assistant Treasurer |
| Ms. Dorsey also serves as an officer of other funds. She is an employee of Fidelity Investments (2008-present) and has served in other fund officer roles. Prior to joining Fidelity Investments, Ms. Dorsey served as Treasurer (2004-2008) of the JPMorgan Mutual Funds and Vice President (2004-2008) of JPMorgan Chase Bank. |
Scott C. Goebel (1968) |
Year of Election or Appointment: 2008 Secretary and Chief Legal Officer (CLO) |
| Mr. Goebel serves as Secretary and CLO of other funds. Mr. Goebel also serves as Secretary of Fidelity Investments Money Management, Inc. (FIMM) (2010-present) and Fidelity Research and Analysis Company (FRAC) (2010-present); General Counsel, Secretary, and Senior Vice President of FMR (2008-present) and FMR Co., Inc. (2008-present); Chief Legal Officer of Fidelity Management & Research (Hong Kong) Limited (2008-present) and Assistant Secretary of Fidelity Management & Research (Japan) Inc. (2008-present), and Fidelity Management & Research (U.K.) Inc. (2008-present). Previously, Mr. Goebel served as Secretary and CLO of other Fidelity funds (2008-2013), Assistant Secretary of FIMM (2008-2010), FRAC (2008-2010), and certain funds (2007-2008); and as Vice President and Secretary of Fidelity Distributors Corporation (FDC) (2005-2007). Mr. Goebel has been employed by FMR LLC or an affiliate since 2001. |
Joseph A. Hanlon (1968) |
Year of Election or Appointment: 2012 Chief Compliance Officer |
| Mr. Hanlon also serves as Chief Compliance Officer of other funds. Mr. Hanlon serves as Compliance Officer of FMR, FMR Co., Inc., Fidelity Investments Money Management, Inc. (FIMM), Fidelity Research and Analysis Company (FRAC), and Fidelity Management & Research (Hong Kong) (2009-present), as Senior Vice President of the Fidelity Asset Management Division (2009-present), and is an employee of Fidelity Investments. Previously, Mr. Hanlon served as Compliance Officer of Fidelity Management & Research (Japan) Inc. (2009-2013), Strategic Advisers, Inc. (2009-2013), and Fidelity Management & Research (U.K.) Inc. (2009-2013). |
Bruce T. Herring (1965) |
Year of Election or Appointment: 2006 Vice President of certain Equity Funds |
| Mr. Herring also serves as Vice President of other funds. He serves as Chief Investment Officer of Fidelity Global Asset Allocation (GAA) (2013-present), Chief Investment Officer and Director of Fidelity Management & Research (U.K.) Inc. (2010-present), Group Chief Investment Officer of FMR, and President of Fidelity Research & Analysis Company (2010-present). Previously, Mr. Herring served as Vice President (2005-2006) and Senior Vice President (2006-2007) of Fidelity Management & Research Company, Vice President of FMR Co., Inc. (2001-2007), and as a portfolio manager for Fidelity U.S. Equity Funds. |
Brian B. Hogan (1964) |
Year of Election or Appointment: 2009 Vice President |
| Mr. Hogan also serves as Vice President of other funds. Mr. Hogan serves as President of FMR's Equity Division (2009-present). Previously, Mr. Hogan served as Senior Vice President, Equity Research of FMR (2006-2009) and as a portfolio manager. |
Chris Maher (1972) |
Year of Election or Appointment: 2013 Assistant Treasurer |
| Mr. Maher serves as Assistant Treasurer of other funds. Mr. Maher is Vice President of Valuation Oversight and is an employee of Fidelity Investments. Previously, Mr. Maher served as Vice President of Asset Management Compliance (2013), Vice President of FMR's Program Management Group (2010-2013), and Vice President of Valuation Oversight (2008-2010). |
Christine Reynolds (1958) |
Year of Election or Appointment: 2008 Chief Financial Officer |
| Ms. Reynolds also serves as Chief Financial Officer of other funds. Ms. Reynolds became President of Fidelity Pricing and Cash Management Services (FPCMS) in August 2008. Ms. Reynolds served as Chief Operating Officer of FPCMS (2007-2008). Previously, Ms. Reynolds served as President, Treasurer, and Anti-Money Laundering officer of the Fidelity funds (2004-2007). |
Kenneth B. Robins (1969) |
Year of Election or Appointment: 2008 President and Treasurer |
| Mr. Robins also serves as an officer of other funds. Mr. Robins serves as Executive Vice President of Fidelity Investments Money Management, Inc. (FIMM) (2013-present) and is an employee of Fidelity Investments (2004-present). Previously, Mr. Robins served in other fund officer roles. |
Gary W. Ryan (1958) |
Year of Election or Appointment: 2005 Assistant Treasurer |
| Mr. Ryan also serves as Assistant Treasurer of other funds. Mr. Ryan is an employee of Fidelity Investments and has served in other fund officer roles. Previously, Mr. Ryan served as Vice President of Fund Reporting in Fidelity Pricing and Cash Management Services (FPCMS) (1999-2005). |
Stephen Sadoski (1971) |
Year of Election or Appointment: 2012 Deputy Treasurer |
| Mr. Sadoski also serves as Deputy Treasurer of other funds. He is an employee of Fidelity Investments (2012-present) and has served in another fund officer role. Prior to joining Fidelity Investments, Mr. Sadoski served as an assistant chief accountant in the Division of Investment Management of the Securities and Exchange Commission (SEC) (2009-2012) and as a senior manager at Deloitte & Touche LLP (1997-2009). |
Stacie M. Smith (1974) |
Year of Election or Appointment: 2013 Deputy Treasurer |
| Ms. Smith also serves as an officer of other funds. She is an employee of Fidelity Investments (2009-present) and has served in other fund officer roles. Prior to joining Fidelity Investments, Ms. Smith served as Senior Audit Manager of Ernst & Young LLP (1996-2009). |
Renee Stagnone (1975) |
Year of Election or Appointment: 2013 Deputy Treasurer |
| Ms. Stagnone also serves as Deputy Treasurer of other funds. Ms. Stagnone is an employee of Fidelity Investments. |
Joseph F. Zambello (1957) |
Year of Election or Appointment: 2011 Deputy Treasurer |
| Mr. Zambello also serves as Deputy Treasurer of other funds. Mr. Zambello is an employee of Fidelity Investments. Previously, Mr. Zambello served as Vice President of FMR's Program Management Group (2009-2011) and Vice President of the Transfer Agent Oversight Group (2005-2009). |
Annual Report
The Board of Trustees of Fidelity Overseas Fund voted to pay to shareholders of record at the opening of business on record date, the following distributions per share derived from capital gains realized from sales of portfolio securities and dividends derived from net investment income:
| Pay Date | Record Date | Dividends | Capital Gains |
Class K | 12/09/13 | 12/06/13 | $0.575 | $0.177 |
Class K designates 2% of the dividends distributed during the fiscal year as qualifying for the dividends-received deduction for corporate shareholders.
Class K designates 100% of dividends distributed during the fiscal year as amounts which may be taken into account as a dividend for purposes of the maximum rate under section 1(h)(11) of the Internal Revenue Code.
The amounts per share which represent income derived from sources within, and taxes paid to, foreign countries or possessions of the United States are as follows:
| Pay Date | Income | Taxes |
Class K | 12/10/12 | $0.588 | $0.0621 |
The fund will notify shareholders in January 2014 of amounts for use in preparing 2013 income tax returns.
Annual Report
Board Approval of Investment Advisory Contracts and Management Fees
Fidelity Overseas Fund
Each year, the Board of Trustees, including the Independent Trustees (together, the Board), votes on the renewal of the management contract and sub-advisory agreements (together, the Advisory Contracts) for the fund. The Board, assisted by the advice of fund counsel and Independent Trustees' counsel, requests and considers a broad range of information relevant to the renewal of the Advisory Contracts throughout the year.
The Board meets regularly and, at each of its meetings, covers an extensive agenda of topics and materials and considers factors that are relevant to its annual consideration of the renewal of the fund's Advisory Contracts, including the services and support provided to the fund and its shareholders. The Board has established various standing committees, each composed of and chaired by Independent Trustees with varying backgrounds, to which the Board has assigned specific subject matter responsibilities in order to enhance effective decision-making by the Board. The Board, acting directly and through its Committees, requests and receives information concerning the annual consideration of the renewal of the fund's Advisory Contracts. The Board also meets as needed to consider matters specifically related to the Board's annual consideration of the renewal of Advisory Contracts. Members of the Board may also meet with trustees of other Fidelity funds through ad hoc joint committees to discuss certain matters relevant to the Fidelity funds.
At its July 2013 meeting, the Board, including the Independent Trustees, unanimously determined to renew the fund's Advisory Contracts. In reaching its determination, the Board considered all factors it believed relevant, including (i) the nature, extent, and quality of the services to be provided to the fund and its shareholders (including the investment performance of the fund); (ii) the competitiveness of the fund's management fee and total expense ratio relative to peer funds; (iii) the total costs of the services to be provided by and the profits to be realized by Fidelity from its relationship with the fund; (iv) the extent to which economies of scale exist and would be realized as the fund grows; and (v) whether fee levels reflect these economies of scale, if any, for the benefit of fund shareholders.
In considering whether to renew the Advisory Contracts for the fund, the Board reached a determination, with the assistance of fund counsel and Independent Trustees' counsel and through the exercise of its business judgment, that the renewal of the Advisory Contracts was in the best interests of the fund and its shareholders and that the compensation payable under the Advisory Contracts was fair and reasonable. The Board's decision to renew the Advisory Contracts was not based on any single factor, but rather was based on a comprehensive consideration of all the information provided to the Board at its meetings throughout the year. The Board, in reaching its determination to renew the Advisory Contracts, was aware that shareholders in the fund have a broad range of investment choices available to them, including a wide choice among mutual funds offered by Fidelity's competitors, and that the fund's shareholders, who have the opportunity to review and weigh the disclosure provided by the fund in its prospectus and other public disclosures, have chosen to invest in this fund, which is a part of the Fidelity family of funds.
Nature, Extent, and Quality of Services Provided. The Board considered the staffing within the investment adviser, Fidelity Management & Research Company (FMR), and the sub-advisers (together, the Investment Advisers) as it relates to the fund, including the backgrounds of the fund's investment personnel, and also considered the fund's investment objective, strategies, and related investment philosophy. The Independent Trustees also had discussions with senior management of Fidelity's investment operations and investment groups. The Board considered the structure of the portfolio manager compensation program and whether this structure provides appropriate incentives to act in the best interests of the fund.
Resources Dedicated to Investment Management and Support Services. The Board and the Fund Oversight and Research Committees reviewed the general qualifications and capabilities of the Investment Advisers' investment staff, including its size, education, experience, and resources, as well as the Investment Advisers' approach to recruiting, training, managing, and compensating investment personnel. The Board noted that FMR has continued to increase the resources devoted to non-U.S. offices, including expansion of Fidelity's global investment organization. The Board also noted that Fidelity's analysts have extensive resources, tools and capabilities that allow them to conduct sophisticated quantitative and fundamental analysis, as well as credit analysis of issuers, counterparties and guarantors. Further, the Board believes that Fidelity's investment professionals have sufficient access to global information and data so as to provide competitive investment results over time, and that those professionals also have access to sophisticated tools that permit them to assess portfolio construction and risk and performance attribution characteristics continuously, as well as to transmit new information and research conclusions rapidly around the world. Additionally, in its deliberations, the Board considered the Investment Advisers' trading and risk management capabilities and resources, which are an integral part of the investment management process.
Shareholder and Administrative Services. The Board considered (i) the nature, extent, quality, and cost of advisory, administrative, and shareholder services performed by the Investment Advisers and their affiliates under the Advisory Contracts and under separate agreements covering transfer agency, pricing and bookkeeping, and securities lending services for the fund; (ii) the nature and extent of the supervision of third party service providers, principally custodians and subcustodians; and (iii) the resources devoted to, and the record of compliance with, the fund's compliance policies and procedures. The Board also reviewed the allocation of fund brokerage, including allocations to brokers affiliated with the Investment Advisers, the use of brokerage commissions to pay fund expenses, and the use of "soft" commission dollars to pay for research services.
The Board noted that the growth of fund assets over time across the complex allows Fidelity to reinvest in the development of services designed to enhance the value or convenience of the Fidelity funds as investment vehicles. These services include 24-hour access to account information and market information through telephone representatives and over the Internet, investor education materials and asset allocation tools, and the expanded availability of Fidelity Investor Centers.
Annual Report
Investment in a Large Fund Family. The Board considered the benefits to shareholders of investing in a Fidelity fund, including the benefits of investing in a fund that is part of a large family of funds offering a variety of investment disciplines and providing a large variety of mutual fund investor services. The Board noted that Fidelity had taken, or had made recommendations that resulted in the Fidelity funds taking, a number of actions over the previous year that benefited particular funds, including (i) continuing to dedicate additional resources to investment research and to the support of the senior management team that oversees asset management; (ii) persisting in efforts to enhance Fidelity's global research capabilities; (iii) launching new funds and making other enhancements to meet client needs for global and income-oriented solutions; (iv) continuing to launch dedicated lower cost underlying funds to meet portfolio construction needs related to expanding underlying fund options for Fidelity funds of funds, specifically for the Freedom Fund product lines; (v) rationalizing product lines and gaining increased efficiencies through the mergers of several funds into other funds; (vi) strengthening Fidelity's index fund offerings by reducing investment minimums and adopting or lowering existing expense caps for certain funds and classes; (vii) enhancing Global Asset Allocation product offerings by launching new funds and strategies, including "open architecture" target date funds that utilize affiliated and unaffiliated sub-advisers; (viii) modifying the eligibility criteria for Institutional Class shares of Advisor funds to increase their marketability to a portion of the defined contribution plan market; (ix) creating a new low-cost retirement share class for certain Advisor funds to appeal to large retirement plans; (x) transitioning the management of certain Fidelity commodity funds to Geode Capital Management LLC, a registered commodity pool operator, while retaining administrative responsibilities for the funds; (xi) reorganizing a number of funds; and (xii) taking steps toward establishing a new Fidelity adviser to manage sector-based funds and products.
Investment Performance. The Board considered whether the fund has operated in accordance with its investment objective, as well as its record of compliance with its investment restrictions and its performance history. The Board noted that there was a portfolio management change for the fund in January 2012.
The Board took into account discussions with the Investment Advisers about fund investment performance that occur at Board meetings throughout the year. In this regard the Board noted that as part of regularly scheduled fund reviews and other reports to the Board on fund performance, the Board periodically considers annualized return information for the fund, for different time periods, measured against a securities market index ("benchmark index") and a peer group of mutual funds with similar objectives ("peer group"). In its evaluation of fund investment performance, the Board gave particular attention to information indicating changes in performance of certain Fidelity funds for specific time periods and the Investment Advisers' explanations for any overperformance or underperformance.
In addition to reviewing absolute and relative fund performance, the Independent Trustees periodically consider the appropriateness of fund performance metrics in evaluating the results achieved. In general, the Independent Trustees believe that fund performance should be evaluated based on net performance (after fees and expenses) of both the highest performing and lowest performing classes, where applicable, compared to appropriate benchmark indices, over appropriate time periods which may include full market cycles, and compared to peer groups, as applicable, over the same periods, taking into account relevant factors including the following: general market conditions; issuer-specific information; tactical opportunities for investment; and fund cash flows and other factors.
The Independent Trustees recognize that shareholders evaluate performance on a net basis over their own holding periods, for which one-, three-, and five-year periods are used as a proxy. For this reason, the performance information reviewed by the Board also included net cumulative calendar year total return information for the fund and an appropriate benchmark index and peer group for the most recent one-, three-, and five-year periods, as shown below. Returns are shown compared to the 25th percentile (top of box) and 75th percentile (bottom of box) of the peer universe.
Annual Report
Board Approval of Investment Advisory Contracts and Management Fees - continued
Fidelity Overseas Fund

The Board also considered that the fund's management fee is subject to upward or downward adjustment depending upon whether, and to what extent, the fund's investment performance for the performance period exceeds, or is exceeded by, a securities index, thus leading to a performance adjustment for the same period. The Board noted that the performance adjustment provides FMR with a strong economic incentive to seek to achieve superior performance for the fund's shareholders and helps to more closely align the interests of FMR and the fund's shareholders.
Based on its review, the Board concluded that the nature, extent, and quality of services provided to the fund under the Advisory Contracts should benefit the fund's shareholders.
Competitiveness of Management Fee and Total Expense Ratio. The Board considered the fund's management fee and total expense ratio compared to "mapped groups" of competitive funds and classes. Fidelity creates "mapped groups" by combining similar Lipper investment objective categories that have comparable management fee characteristics. Combining Lipper investment objective categories aids the Board's management fee and total expense ratio comparisons by broadening the competitive group used for comparison and by reducing the number of universes to which various Fidelity funds are compared.
Management Fee. The Board considered two proprietary management fee comparisons for the 12-month periods shown in the chart below. The group of Lipper funds used by the Board for management fee comparisons is referred to below as the "Total Mapped Group." The Total Mapped Group comparison focuses on a fund's standing in terms of gross management fees before expense reimbursements or caps, and without giving effect to the fund's performance adjustment, relative to the total universe of funds with comparable investment mandates, regardless of whether their management fee structures also are comparable. Funds with comparable investment mandates offer exposure to similar types of securities. Funds with comparable management fee structures have similar management fee contractual arrangements (e.g., flat rate charged for advisory services, all-inclusive fee rate, etc.). "TMG %" represents the percentage of funds in the Total Mapped Group that had management fees that were lower than the fund's. For example, a TMG % of 16% means that 84% of the funds in the Total Mapped Group had higher management fees than the fund. The "Asset-Size Peer Group" (ASPG) comparison focuses on a fund's standing relative to a subset of non-Fidelity funds within the Total Mapped Group that are similar in size and management fee structure. The ASPG represents at least 15% of the funds in the Total Mapped Group with comparable asset size and management fee structures, subject to a minimum of 50 funds (or all funds in the Total Mapped Group if fewer than 50). Additional information, such as the ASPG quartile in which the fund's management fee ranked and the impact of the fund's performance adjustment, is also included in the chart and considered by the Board.
Annual Report
Fidelity Overseas Fund

The Board noted that the fund's management fee ranked below the median of its Total Mapped Group and below the median of its ASPG for 2012. The Board also noted the effect of the fund's negative performance adjustment on the fund's management fee ranking.
Based on its review, the Board concluded that the fund's management fee is fair and reasonable in light of the services that the fund receives and the other factors considered.
Total Expense Ratio. In its review of each class's total expense ratio, the Board considered the fund's management fee as well as other fund or class expenses, as applicable, such as transfer agent fees, pricing and bookkeeping fees, and custodial, legal, and audit fees. The Board also noted the effects of any waivers and reimbursements on fees and expenses, as well as the impact of the fund's performance adjustment. As part of its review, the Board also considered the current and historical total expense ratios of each class of the fund compared to competitive fund median expenses. Each class of the fund is compared to those funds and classes in the Total Mapped Group (used by the Board for management fee comparisons) that have a similar sales load structure.
The Board noted that the total expense ratio of each class ranked below its competitive median for 2012.
Fees Charged to Other Fidelity Clients. The Board also considered Fidelity fee structures and other information with respect to clients of FMR and its affiliates, such as other mutual funds advised or subadvised by FMR or its affiliates, pension plan clients, and other institutional clients. The Board noted the findings of the 2013 ad hoc joint committee (created with the board of other Fidelity funds), which reviewed and compared Fidelity's institutional investment advisory business with its business of providing services to the Fidelity funds, including the differences in services provided, fees charged, and costs incurred, as well as competition in their respective marketplaces.
Based on its review of total expense ratios and fees charged to other Fidelity clients, the Board concluded that the total expense ratio of each class of the fund was reasonable in light of the services that the fund and its shareholders receive and the other factors considered.
Costs of the Services and Profitability. The Board considered the revenues earned and the expenses incurred by Fidelity in conducting the business of developing, marketing, distributing, managing, administering and servicing the fund and servicing the fund's shareholders. The Board also considered the level of Fidelity's profits in respect of all the Fidelity funds.
On an annual basis, FMR presents to the Board Fidelity's profitability for the fund. Fidelity calculates the profitability for each fund, as well as aggregate profitability for groups of Fidelity funds and all Fidelity funds, using a series of detailed revenue and cost allocation methodologies which originate with the books and records of Fidelity on which Fidelity's audited financial statements are based. The Audit Committee of the Board reviews any significant changes from the prior year's methodologies.
PricewaterhouseCoopers LLP (PwC), independent registered public accounting firm and auditor to Fidelity and certain Fidelity funds, has been engaged annually by the Board as part of the Board's assessment of Fidelity's profitability analysis. PwC's engagement includes the review and assessment of the methodologies used by Fidelity in determining the revenues and expenses attributable to Fidelity's mutual fund business, and completion of agreed-upon procedures surrounding the mathematical accuracy of fund profitability and its conformity to allocation methodologies. After considering PwC's reports issued under the engagement and information provided by Fidelity, the Board concluded that while other allocation methods may also be reasonable, Fidelity's profitability methodologies are reasonable in all material respects.
Annual Report
Board Approval of Investment Advisory Contracts and Management Fees - continued
The Board also reviewed Fidelity's non-fund businesses and fall-out benefits related to the mutual fund business as well as cases where Fidelity's affiliates may benefit from or be related to the fund's business.
The Board considered the costs of the services provided by and the profits realized by Fidelity in connection with the operation of the fund and was satisfied that the profitability was not excessive in the circumstances.
Economies of Scale. The Board considered whether there have been economies of scale in respect of the management of the Fidelity funds, whether the Fidelity funds (including the fund) have appropriately benefited from any such economies of scale, and whether there is potential for realization of any further economies of scale. The Board considered the extent to which the fund will benefit from economies of scale through increased services to the fund, through waivers or reimbursements, or through fee or expense reductions. The Board also noted that in 2009, it and the board of other Fidelity funds created an ad hoc committee (the Economies of Scale Committee) to analyze whether FMR attains economies of scale in respect of the management and servicing of the Fidelity funds, whether the Fidelity funds have appropriately benefited from such economies of scale, and whether there is potential for realization of any further economies of scale.
The Board recognized that the fund's management contract incorporates a "group fee" structure, which provides for lower group fee rates as total fund assets under FMR's management increase, and for higher group fee rates as total fund assets under FMR's management decrease. FMR calculates the group fee rates based on a tiered asset "breakpoint" schedule that varies based on asset class. The Board considered that the group fee is designed to deliver the benefits of economies of scale to fund shareholders when total Fidelity fund assets increase, even if assets of any particular fund are unchanged or have declined, because some portion of Fidelity's costs are attributable to services provided to all Fidelity funds, and all funds benefit if those costs can be allocated among more assets. The Board concluded that, given the group fee structure, fund shareholders will benefit from lower management fees as assets under FMR's management increase at the fund complex level, regardless of whether Fidelity achieves any such economies of scale.
The Board concluded, taking into account the analysis of the Economies of Scale Committee, that economies of scale, if any, are being appropriately shared between fund shareholders and Fidelity.
Amendment to Description of Group Fee Rate. At its July 2013 meeting, the Board voted to approve an amendment to the fund's management contract to modify the description of the "group fee rate" effective August 1, 2013. The Board noted that under the prior description in the contract, the group fee rate was based on the average net assets of all registered investment companies with which FMR has management contracts. Under the contract's tiered asset breakpoint schedule, the group fee rate is lower as total fund assets under FMR's management increase, and higher as total fund assets under FMR's management decrease. The Board considered that the prior description would have excluded the assets of 64 Fidelity sector funds from the group fee rate calculation once Fidelity SelectCo, LLC, an affiliate of FMR, assumed management responsibilities for those funds. The Board noted that modifying the description of the group fee rate to continue to include the assets of those 64 funds for purposes of determining group fee rate breakpoints would avoid an immediate adverse impact on the group fee rate for any fund.
Additional Information Requested by the Board. In order to develop fully the factual basis for consideration of the Fidelity funds' Advisory Contracts, the Board requested and received additional information on certain topics, including: (i) fund performance trends and Fidelity's long-term strategies for certain funds; (ii) the potential to further rationalize the Fidelity fund lineup with the possibility of achieving savings for the funds and Fidelity; (iii) the methodology with respect to competitive fund data and peer group classifications; (iv) the arrangements with, and performance of, certain sub-advisers on behalf of the Fidelity funds, as well as certain proposed participating affiliate arrangements; (v) the realization of fall-out benefits in certain Fidelity business units; (vi) Fidelity's group fee structures, including the rationale for the individual fee rates of certain categories of funds and the definition of group assets; (vii) trends regarding industry use of performance fee structures and the performance adjustment methodologies applicable to the Fidelity funds; (viii) additional competitive analysis regarding the total expenses for certain classes; and (ix) fund profitability methodology, including Fidelity's cost allocation methodology, and the impact of certain factors on fund profitability results.
Based on its evaluation of all of the conclusions noted above, and after considering all factors it believed relevant, the Board ultimately concluded that the advisory fee structures are fair and reasonable, and that the fund's Advisory Contracts should be renewed.
Annual Report
Investment Adviser
Fidelity Management & Research Company
Boston, MA
Investment Sub-Advisers
FMR Co., Inc.
Fidelity Management & Research (U.K.) Inc.
Fidelity Management & Research
(Hong Kong) Limited
Fidelity Management & Research
(Japan) Inc.
FIL Investment Advisors
FIL Investment Advisors (UK) Limited
FIL Investments (Japan) Limited
General Distributor
Fidelity Distributors Corporation
Smithfield, RI
Transfer and Service Agents
Fidelity Investments Institutional
Operations Company, Inc.
Boston, MA
Fidelity Service Company, Inc.
Boston, MA
Custodian
JPMorgan Chase Bank
New York, NY
(Fidelity Investment logo)(registered trademark)
Corporate Headquarters
245 Summer St., Boston, MA 02210
www.fidelity.com
OVE-K-UANN-1213
1.863317.105
(Fidelity Investment logo)(registered trademark)
Fidelity Advisor®
Worldwide Fund
Class A, Class T, Class B, and Class C
Annual Report
October 31, 2013
(Fidelity Cover Art)
Class A, Class T, Class B, and Class C are
classes of Fidelity® Worldwide Fund
(Fidelity Cover Art)
Contents
Performance | (Click Here) | How the fund has done over time. |
Management's Discussion of Fund Performance | (Click Here) | The Portfolio Managers' review of fund performance and strategy. |
Shareholder Expense Example | (Click Here) | An example of shareholder expenses. |
Investment Changes | (Click Here) | A summary of major shifts in the fund's investments over the past six months. |
Investments | (Click Here) | A complete list of the fund's investments with their market values. |
Financial Statements | (Click Here) | Statements of assets and liabilities, operations, and changes in net assets, as well as financial highlights. |
Notes | (Click Here) | Notes to the financial statements. |
Report of Independent Registered Public Accounting Firm | (Click Here) | |
Trustees and Officers | (Click Here) | |
Distributions | (Click Here) | |
Board Approval of Investment Advisory Contracts and Management Fees | (Click Here) | |
To view a fund's proxy voting guidelines and proxy voting record for the 12-month period ended June 30, visit http://www.fidelity.com/proxyvotingresults or visit the Securities and Exchange Commission's (SEC) web site at http://www.sec.gov. You may also call 1-877-208-0098 to request a free copy of the proxy voting guidelines.
Standard & Poor's, S&P and S&P 500 are registered service marks of The McGraw-Hill Companies, Inc. and have been licensed for use by Fidelity Distributors Corporation.
Other third-party marks appearing herein are the property of their respective owners.
All other marks appearing herein are registered or unregistered trademarks or service marks of FMR LLC or an affiliated company. © 2013 FMR LLC. All rights reserved.
This report and the financial statements contained herein are submitted for the general information of the shareholders of the fund. This report is not authorized for distribution to prospective investors in the fund unless preceded or accompanied by an effective prospectus.
A fund files its complete schedule of portfolio holdings with the SEC for the first and third quarters of each fiscal year on Form N-Q. Forms N-Q are available on the SEC's web site at http://www.sec.gov. A fund's Forms N-Q may be reviewed and copied at the SEC's Public Reference Room in Washington, DC. Information regarding the operation of the SEC's Public Reference Room may be obtained by calling 1-800-SEC-0330. For a complete list of a fund's portfolio holdings, view the most recent holdings listing, semiannual report, or annual report on Fidelity's web site at http://www.fidelity.com, http://www.advisor.fidelity.com, or http://www.401k.com, as applicable.
NOT FDIC INSURED • MAY LOSE VALUE • NO BANK GUARANTEE
Neither the fund nor Fidelity Distributors Corporation is a bank.
Annual Report
Performance: The Bottom Line
Average annual total return reflects the change in the value of an investment, assuming reinvestment of the class' distributions from dividend income and capital gains (the profits earned upon the sale of securities that have grown in value, if any) and assuming a constant rate of performance each year. The $10,000 table and the fund's returns do not reflect the deduction of taxes that a shareholder would pay on fund distributions or the redemption of fund shares. During periods of reimbursement by Fidelity, a fund's total return will be greater than it would be had the reimbursement not occurred. How a fund did yesterday is no guarantee of how it will do tomorrow.
Average Annual Total Returns
Periods ended October 31, 2013 | Past 1
year | Past 5
years | Past 10 years |
Class A (incl. 5.75% sales charge) A | 21.67% | 12.99% | 8.21% |
Class T (incl. 3.50% sales charge) B | 24.23% | 13.25% | 8.34% |
Class B (incl. contingent deferred sales charge) C | 23.13% | 13.31% | 8.48% |
Class C (incl. contingent deferred sales charge) D | 27.12% | 13.55% | 8.48% |
A Class A shares bear a 0.25% 12b-1 fee. The initial offering of Class A took place on February 19, 2009. Returns prior to February 19, 2009 are those of Fidelity® Worldwide Fund, the original class of the fund, which does not bear a 12b-1 fee. Had Class A shares' 12b-1 fee been reflected, returns prior to February 19, 2009 would have been lower.
B Class T shares bear a 0.50% 12b-1 fee. The initial offering of Class T took place on February 19, 2009. Returns prior to February 19, 2009 are those of Fidelity Worldwide Fund, the original class of the fund, which does not bear a 12b-1 fee. Had Class T shares' 12b-1 fee been reflected, returns prior to February 19, 2009 would have been lower.
C Class B shares bear a 1.00% 12b-1 fee. The initial offering of Class B took place on February 19, 2009. Returns prior to February 19, 2009 are those of Fidelity Worldwide Fund, the original class of the fund, which does not bear a 12b-1 fee. Had Class B shares' 12b-1 fee been reflected, returns prior to February 19, 2009 would have been lower. Class B shares' contingent deferred sales charges included in the past one year, past five years, and past ten years total return figures are 5%, 2%, and 0%, respectively.
D Class C shares bear a 1.00% 12b-1 fee. The initial offering of Class C took place on February 19, 2009. Returns prior to February 19, 2009 are those of Fidelity Worldwide Fund, the original class of the fund, which does not bear a 12b-1 fee. Had Class C shares' 12b-1 fee been reflected, returns prior to February 19, 2009 would have been lower. Class C shares' contingent deferred sales charges included in the past one year, past five years, and past ten years total return figures are 1%, 0%, and 0%, respectively.
$10,000 Over 10 Years
Let's say hypothetically that $10,000 was invested in Fidelity Advisor® Worldwide Fund - Class A, on October 31, 2003, and the current 5.75% sales charge was paid. The chart shows how the value of your investment would have changed, and also shows how the MSCI® World Index performed over the same period. See footnote A above for additional information regarding the performance of Class A.
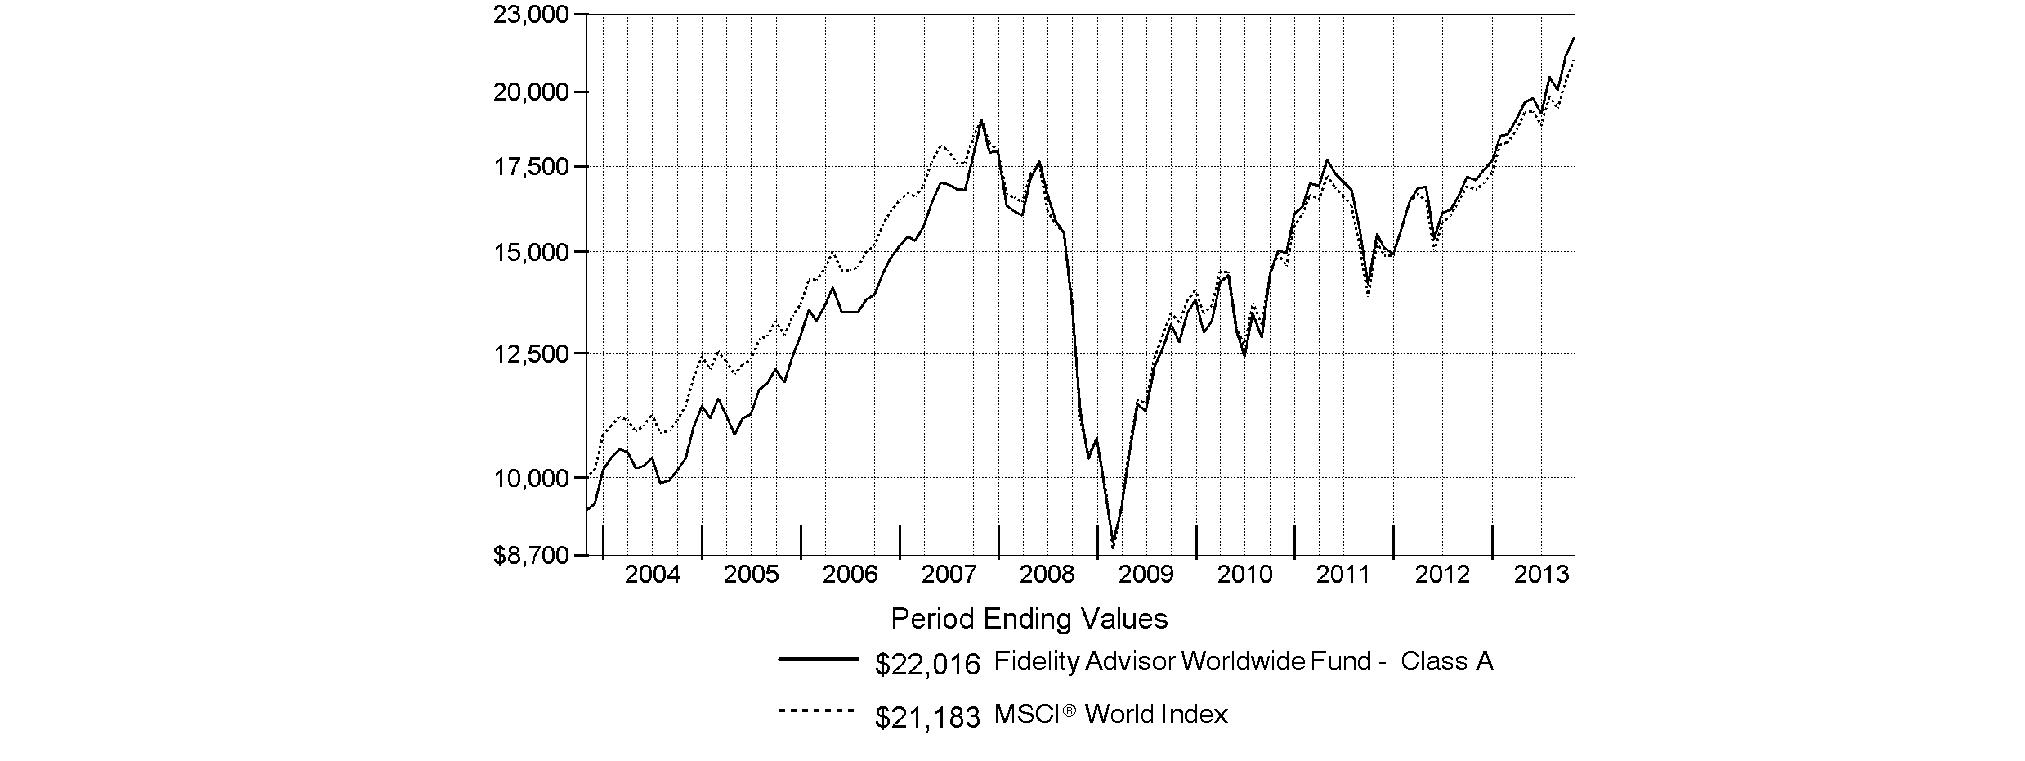
Annual Report
Market Recap: On balance, global equity markets remained upbeat for the 12-month period ending October 31, 2013. The MSCI® ACWI® (All Country World Index) Index gained 23.75% for the period, amid investor preference for higher-risk assets. The period was not without turbulence, however. In the spring and summer, central banks worldwide, especially in the U.S. and China, made clear their intentions to maintain accommodative monetary policies. That stance, combined with modest cyclical improvements around the globe and generally low valuations, underpinned the broad rally in equities. Europe (+32%) shone brightly, with most markets in the region - large and small - registering solid, index-beating gains. Another bright spot was Japan, which, despite a struggling yen and taking a second-half breather, posted a 34% result for the full year. The U.S. - by far the index's biggest constituent - also outperformed the global market with a roughly 28% advance. Meanwhile, Asia-Pacific ex Japan (+14%) lagged, hurt in part by a slowdown in Australia's mining industry as well as currency headwinds. Foreign-exchange and commodity weakness also curbed results in resource-heavy Canada and emerging markets (EM), both of which were up 7%. Country-level EM performance diverged meaningfully for the period, as evidenced by performance in Brazil (-1%), Russia (+12%), India (+1%) and China (+8%).
Comments from William Kennedy, Lead Portfolio Manager of Fidelity Advisor® Worldwide Fund and manager of its non-U.S. equity subportfolio, and Co-Portfolio Manager Stephen DuFour, who manages the fund's U.S. equity subportfolio: For the year, the fund's Class A, Class T, Class B and Class C shares returned 29.10%, 28.73%, 28.13% and 28.12%, respectively (excluding sales charges), versus 26.29% for the MSCI® World Index. Security selection that focused on companies with above-average earnings growth, good balance sheets and reasonable share prices drove the fund's performance relative to the index. Regionally, investment choices in the U.S. helped the most, while among sectors, energy and information technology stood out. Winners included U.S. natural gas exploration & production company Pioneer Natural Resources, whose huge share-price gain was fueled by the company's expanded oil production and rising oil prices. The fund's number one contributor was U.S. biotechnology company Gilead Sciences, whose stock soared as the company neared approval for its promising new hepatitis C treatment. In the information technology sector, an investment in electronic-payment processor MasterCard took off, thanks to higher transaction volumes that were the result of increasing numbers of consumers worldwide shopping online and choosing to pay with debit and credit instead of cash or checks. By contrast, investments in the consumer discretionary sector detracted, as did a small stake in emerging markets, positioning in core European countries and a modest cash position. Individual disappointments included cellular-tower operator American Tower, which saw slowing growth prospects in the U.S. pressure its return. We sold the position before period end. Untimely ownership of biotechnology leader Amgen also hurt. We exited soon after the company announced an acquisition that we thought would take some time to pay off, but the stock continued to rise.
The views expressed above reflect those of the portfolio manager(s) only through the end of the period as stated on the cover of this report and do not necessarily represent the views of Fidelity or any other person in the Fidelity organization. Any such views are subject to change at any time based upon market or other conditions and Fidelity disclaims any responsibility to update such views. These views may not be relied on as investment advice and, because investment decisions for a Fidelity fund are based on numerous factors, may not be relied on as an indication of trading intent on behalf of any Fidelity fund.
Annual Report
Fidelity Worldwide Fund
As a shareholder of the Fund, you incur two types of costs: (1) transaction costs, including sales charges (loads) on purchase payments or redemption proceeds, redemption fees and (2) ongoing costs, including management fees, distribution and/or service (12b-1) fees and other Fund expenses. This Example is intended to help you understand your ongoing costs (in dollars) of investing in the Fund and to compare these costs with the ongoing costs of investing in other mutual funds.
The Example is based on an investment of $1,000 invested at the beginning of the period and held for the entire period (May 1, 2013 to October 31, 2013).
Actual Expenses
The first line of the accompanying table for each class of the Fund provides information about actual account values and actual expenses. You may use the information in this line, together with the amount you invested, to estimate the expenses that you paid over the period. Simply divide your account value by $1,000.00 (for example, an $8,600 account value divided by $1,000.00 = 8.6), then multiply the result by the number in the first line for a class of the Fund under the heading entitled "Expenses Paid During Period" to estimate the expenses you paid on your account during this period. A small balance maintenance fee of $12.00 that is charged once a year may apply for certain accounts with a value of less than $2,000. This fee is not included in the table below. If it was, the estimate of expenses you paid during the period would be higher, and your ending account value lower, by this amount. In addition, the Fund, as a shareholder in the underlying Fidelity Central Funds, will indirectly bear its pro-rata share of the fees and expenses incurred by the underlying Fidelity Central Funds. These fees and expenses are not included in the Fund's annualized expense ratio used to calculate the expense estimate in the table below.
Hypothetical Example for Comparison Purposes
The second line of the accompanying table for each class of the Fund provides information about hypothetical account values and hypothetical expenses based on a Class' actual expense ratio and an assumed rate of return of 5% per year before expenses, which is not the Class' actual return. The hypothetical account values and expenses may not be used to estimate the actual ending account balance or expenses you paid for the period. You may use this information to compare the ongoing costs of investing in the Fund and other funds. To do so, compare this 5% hypothetical example with the 5% hypothetical examples that appear in the shareholder reports of the other funds. A small balance maintenance fee of $12.00 that is charged once a year may apply for certain accounts with a value of less than $2,000. This fee is not included in the table below. If it was, the estimate of expenses you paid during the period would be higher, and your ending account value lower, by this amount. In addition, the Fund, as a shareholder in the underlying Fidelity Central Funds, will indirectly bear its pro-rata share of the fees and expenses incurred by the underlying Fidelity Central Funds. These fees and expenses are not included in the Fund's annualized expense ratio used to calculate the expense estimate in the table below.
Please note that the expenses shown in the table are meant to highlight your ongoing costs only and do not reflect any transaction costs. Therefore, the second line of the table is useful in comparing ongoing costs only, and will not help you determine the relative total costs of owning different funds. In addition, if these transactional costs were included, your costs would have been higher.
| Annualized
Expense Ratio B | Beginning
Account Value
May 1, 2013 | Ending
Account Value
October 31, 2013 | Expenses Paid
During Period*
May 1, 2013
to October 31, 2013 |
Class A | 1.44% | | | |
Actual | | $ 1,000.00 | $ 1,123.10 | $ 7.71 |
Hypothetical A | | $ 1,000.00 | $ 1,017.95 | $ 7.32 |
Class T | 1.71% | | | |
Actual | | $ 1,000.00 | $ 1,121.80 | $ 9.15 |
Hypothetical A | | $ 1,000.00 | $ 1,016.59 | $ 8.69 |
Class B | 2.20% | | | |
Actual | | $ 1,000.00 | $ 1,119.00 | $ 11.75 |
Hypothetical A | | $ 1,000.00 | $ 1,014.12 | $ 11.17 |
Class C | 2.18% | | | |
Actual | | $ 1,000.00 | $ 1,119.20 | $ 11.64 |
Hypothetical A | | $ 1,000.00 | $ 1,014.22 | $ 11.07 |
Worldwide | 1.10% | | | |
Actual | | $ 1,000.00 | $ 1,125.30 | $ 5.89 |
Hypothetical A | | $ 1,000.00 | $ 1,019.66 | $ 5.60 |
Institutional Class | 1.16% | | | |
Actual | | $ 1,000.00 | $ 1,124.90 | $ 6.21 |
Hypothetical A | | $ 1,000.00 | $ 1,019.36 | $ 5.90 |
A 5% return per year before expenses
B Annualized expense ratio reflects expenses net of applicable fee waivers.
* Expenses are equal to each Class' annualized expense ratio, multiplied by the average account value over the period, multiplied by 184/365 (to reflect the one-half year period).
Annual Report
Fidelity Worldwide Fund
Investment Changes (Unaudited)
Geographic Diversification (% of fund's net assets) |
As of October 31, 2013 |
 | United States of America* | 52.6% | |
 | Japan | 8.4% | |
 | United Kingdom | 7.2% | |
 | France | 4.9% | |
 | Germany | 4.0% | |
 | Ireland | 3.3% | |
 | Switzerland | 3.1% | |
 | Sweden | 1.9% | |
 | Spain | 1.7% | |
 | Other | 12.9% | |

* Includes Short-Term Investments and Net Other Assets (Liabilities). |
Percentages are based on country or territory of incorporation and are adjusted for the effect of futures contracts, if applicable. |
As of April 30, 2013 |
| United States of America* | 50.3% | |
| Japan | 10.1% | |
| United Kingdom | 7.6% | |
| France | 4.4% | |
| Germany | 3.7% | |
| Switzerland | 3.0% | |
| Ireland | 2.9% | |
| Canada | 2.1% | |
| Australia | 1.8% | |
| Other | 14.1% | |

* Includes Short-Term Investments and Net Other Assets (Liabilities). |
Percentages are based on country or territory of incorporation and are adjusted for the effect of futures contracts, if applicable. |
Asset Allocation as of October 31, 2013 |
| % of fund's
net assets | % of fund's net assets
6 months ago |
Stocks and Equity Futures | 97.2 | 97.3 |
Bonds | 0.1 | 0.1 |
Short-Term Investments and Net Other Assets (Liabilities) | 2.7 | 2.6 |
Top Ten Stocks as of October 31, 2013 |
| % of fund's
net assets | % of fund's net assets
6 months ago |
MasterCard, Inc. Class A (United States of America, IT Services) | 2.8 | 2.6 |
Cabot Oil & Gas Corp. (United States of America, Oil, Gas & Consumable Fuels) | 2.3 | 2.2 |
McGraw-Hill Companies, Inc. (United States of America, Diversified Financial Services) | 2.2 | 0.0 |
Bank of America Corp. (United States of America, Diversified Financial Services) | 2.2 | 1.4 |
Google, Inc. Class A (United States of America, Internet Software & Services) | 2.0 | 2.5 |
Pioneer Natural Resources Co. (United States of America, Oil, Gas & Consumable Fuels) | 2.0 | 1.0 |
Visa, Inc. Class A (United States of America, IT Services) | 1.9 | 0.7 |
Cummins, Inc. (United States of America, Machinery) | 1.9 | 0.1 |
Gilead Sciences, Inc. (United States of America, Biotechnology) | 1.8 | 1.3 |
Actavis PLC (Ireland, Pharmaceuticals) | 1.6 | 0.2 |
| 20.7 | |
Market Sectors as of October 31, 2013 |
| % of fund's
net assets | % of fund's net assets
6 months ago |
Financials | 19.6 | 20.0 |
Information Technology | 15.6 | 12.5 |
Health Care | 14.1 | 13.1 |
Consumer Discretionary | 12.6 | 15.0 |
Industrials | 12.2 | 10.5 |
Energy | 8.9 | 5.7 |
Consumer Staples | 6.3 | 10.2 |
Materials | 5.4 | 6.1 |
Telecommunication Services | 2.0 | 2.1 |
Utilities | 0.2 | 1.1 |
Annual Report
Fidelity Worldwide Fund
Investments October 31, 2013
Showing Percentage of Net Assets
Common Stocks - 96.1% |
| Shares | | Value |
Australia - 1.5% |
Ansell Ltd. | 142,537 | | $ 2,625,670 |
Australia & New Zealand Banking Group Ltd. | 392,333 | | 12,548,330 |
Ramsay Health Care Ltd. | 105,887 | | 3,883,069 |
Woodside Petroleum Ltd. | 89,610 | | 3,287,856 |
TOTAL AUSTRALIA | | 22,344,925 |
Austria - 0.1% |
Andritz AG | 28,200 | | 1,737,152 |
Bailiwick of Jersey - 1.2% |
Experian PLC | 368,600 | | 7,505,868 |
Wolseley PLC | 90,926 | | 4,900,027 |
WPP PLC | 245,700 | | 5,219,909 |
TOTAL BAILIWICK OF JERSEY | | 17,625,804 |
Belgium - 1.0% |
Anheuser-Busch InBev SA NV | 71,611 | | 7,423,464 |
KBC Groupe SA | 141,183 | | 7,696,402 |
TOTAL BELGIUM | | 15,119,866 |
Bermuda - 0.1% |
Cheung Kong Infrastructure Holdings Ltd. | 310,000 | | 2,157,165 |
Brazil - 0.1% |
Arezzo Industria e Comercio SA | 63,900 | | 955,562 |
British Virgin Islands - 0.3% |
Luxoft Holding, Inc. | 57,700 | | 1,685,994 |
Mail.Ru Group Ltd. GDR (Reg. S) | 73,000 | | 2,692,240 |
Michael Kors Holdings Ltd. (a) | 11,000 | | 846,450 |
TOTAL BRITISH VIRGIN ISLANDS | | 5,224,684 |
Canada - 0.5% |
Canadian Pacific Railway Ltd. | 3,000 | | 428,830 |
Constellation Software, Inc. | 9,700 | | 1,767,053 |
InterOil Corp. (a)(d) | 10,500 | | 729,225 |
Suncor Energy, Inc. | 123,400 | | 4,484,368 |
TOTAL CANADA | | 7,409,476 |
Cayman Islands - 0.7% |
58.com, Inc. ADR | 4,000 | | 96,480 |
Baidu.com, Inc. sponsored ADR (a) | 20,300 | | 3,266,270 |
Cimc Enric Holdings Ltd. | 1,020,000 | | 1,436,657 |
ENN Energy Holdings Ltd. | 314,000 | | 1,860,996 |
Eurasia Drilling Co. Ltd. GDR (Reg. S) | 43,500 | | 1,842,225 |
Greatview Aseptic Pack Co. Ltd. | 1,799,000 | | 1,132,351 |
Sands China Ltd. | 90,400 | | 642,466 |
Youku Tudou, Inc. ADR (a)(d) | 27,400 | | 746,376 |
TOTAL CAYMAN ISLANDS | | 11,023,821 |
Cyprus - 0.0% |
SPDI Secure Property Development & Investment PLC (a) | 31,822 | | 35,844 |
|
| Shares | | Value |
Denmark - 0.2% |
Novo Nordisk A/S Series B | 22,916 | | $ 3,816,720 |
Finland - 0.4% |
Raisio Group PLC (V Shares) | 139,000 | | 809,640 |
Sampo Oyj (A Shares) | 107,000 | | 5,068,793 |
TOTAL FINLAND | | 5,878,433 |
France - 4.9% |
Arkema SA | 29,430 | | 3,341,337 |
Atos Origin SA | 24,326 | | 2,076,840 |
AXA SA | 327,500 | | 8,181,802 |
BNP Paribas SA | 93,030 | | 6,889,028 |
Bureau Veritas SA | 86,700 | | 2,618,024 |
Danone SA | 56,400 | | 4,182,641 |
Edenred SA | 73,500 | | 2,497,361 |
Havas SA | 344,900 | | 2,873,415 |
Iliad SA | 12,793 | | 2,925,057 |
Kering SA | 22,350 | | 5,078,355 |
Lafarge SA (Bearer) | 37,800 | | 2,616,444 |
LVMH Moet Hennessy - Louis Vuitton SA | 33,006 | | 6,354,611 |
Sanofi SA | 53,719 | | 5,727,694 |
Schneider Electric SA | 84,600 | | 7,127,414 |
Technip SA | 11,800 | | 1,236,055 |
Total SA | 173,600 | | 10,650,877 |
TOTAL FRANCE | | 74,376,955 |
Germany - 3.3% |
Aareal Bank AG (a) | 63,891 | | 2,457,137 |
adidas AG | 33,400 | | 3,812,931 |
BASF AG | 77,939 | | 8,109,115 |
Bayer AG | 91,200 | | 11,335,105 |
Brenntag AG | 27,600 | | 4,676,743 |
GEA Group AG | 75,747 | | 3,296,198 |
GSW Immobilien AG | 28,483 | | 1,324,543 |
HeidelbergCement Finance AG | 53,600 | | 4,225,340 |
KION Group AG (a) | 45,449 | | 1,851,251 |
LEG Immobilien AG | 19,100 | | 1,089,187 |
Siemens AG | 68,079 | | 8,699,973 |
TOTAL GERMANY | | 50,877,523 |
Hong Kong - 0.8% |
AIA Group Ltd. | 1,263,600 | | 6,413,345 |
Techtronic Industries Co. Ltd. | 2,334,000 | | 5,870,373 |
TOTAL HONG KONG | | 12,283,718 |
India - 0.3% |
Housing Development Finance Corp. Ltd. | 256,407 | | 3,557,718 |
United Spirits Ltd. | 27,317 | | 1,141,082 |
TOTAL INDIA | | 4,698,800 |
Indonesia - 0.0% |
PT Tower Bersama Infrastructure Tbk | 990,500 | | 500,849 |
Ireland - 3.3% |
Actavis PLC (a) | 153,200 | | 23,681,656 |
Common Stocks - continued |
| Shares | | Value |
Ireland - continued |
Alkermes PLC (a) | 84,000 | | $ 2,955,960 |
Bank of Ireland (a) | 8,957,800 | | 3,260,264 |
Eaton Corp. PLC | 96,000 | | 6,773,760 |
Greencore Group PLC | 509,900 | | 1,472,450 |
James Hardie Industries PLC CDI | 365,087 | | 3,771,527 |
Kerry Group PLC Class A | 58,400 | | 3,739,835 |
Trinity Biotech PLC sponsored ADR | 193,741 | | 4,843,525 |
TOTAL IRELAND | | 50,498,977 |
Italy - 0.5% |
De Longhi SpA | 141,700 | | 2,193,282 |
Moleskine SpA | 397,400 | | 971,226 |
Tod's SpA | 7,333 | | 1,221,648 |
UniCredit SpA | 225,700 | | 1,697,701 |
World Duty Free SpA (a) | 159,397 | | 1,765,998 |
TOTAL ITALY | | 7,849,855 |
Japan - 8.0% |
ABC-MART, Inc. | 48,600 | | 2,430,533 |
Aozora Bank Ltd. | 983,000 | | 2,857,615 |
ARNEST ONE Corp. | 41,000 | | 1,124,133 |
Astellas Pharma, Inc. | 47,400 | | 2,642,379 |
Cosmos Pharmaceutical Corp. | 12,200 | | 1,486,333 |
Daikin Industries Ltd. | 67,300 | | 3,871,997 |
Don Quijote Co. Ltd. | 109,500 | | 7,289,030 |
Hajime Construction Co. Ltd. | 4,500 | | 310,282 |
Harmonic Drive Systems, Inc. | 64,400 | | 1,386,409 |
Hitachi Ltd. | 313,000 | | 2,189,469 |
Japan Exchange Group, Inc. | 159,500 | | 3,708,080 |
Japan Tobacco, Inc. | 273,400 | | 9,892,619 |
Kakaku.com, Inc. | 123,200 | | 2,382,853 |
KDDI Corp. | 129,000 | | 6,986,187 |
Keyence Corp. | 18,460 | | 7,911,772 |
Leopalace21 Corp. (a) | 421,900 | | 2,929,044 |
Miraca Holdings, Inc. | 12,400 | | 558,720 |
Mitsubishi UFJ Financial Group, Inc. | 1,099,300 | | 7,000,636 |
Nomura Real Estate Holdings, Inc. | 35,200 | | 890,610 |
Omron Corp. | 75,500 | | 2,881,172 |
ORIX Corp. | 554,600 | | 9,606,275 |
Park24 Co. Ltd. | 83,900 | | 1,638,111 |
Rakuten, Inc. | 316,000 | | 4,117,366 |
Santen Pharmaceutical Co. Ltd. | 71,900 | | 3,650,056 |
Seven & i Holdings Co., Ltd. | 134,700 | | 4,985,063 |
Shinsei Bank Ltd. | 1,543,000 | | 3,612,636 |
Ship Healthcare Holdings, Inc. | 67,000 | | 2,749,303 |
SoftBank Corp. | 129,700 | | 9,685,854 |
Toyota Motor Corp. | 173,400 | | 11,242,942 |
USS Co. Ltd. | 28,800 | | 421,762 |
TOTAL JAPAN | | 122,439,241 |
Kenya - 0.1% |
Safaricom Ltd. | 18,905,500 | | 2,093,228 |
|
| Shares | | Value |
Korea (South) - 0.4% |
Hyundai Motor Co. | 12,766 | | $ 3,043,303 |
NHN Corp. | 4,224 | | 2,376,118 |
Orion Corp. | 742 | | 723,626 |
TOTAL KOREA (SOUTH) | | 6,143,047 |
Luxembourg - 0.2% |
Brait SA | 363,375 | | 1,770,045 |
Eurofins Scientific SA | 3,000 | | 822,593 |
TOTAL LUXEMBOURG | | 2,592,638 |
Mexico - 0.1% |
Alsea S.A.B. de CV | 519,500 | | 1,615,767 |
Netherlands - 1.6% |
AEGON NV | 292,700 | | 2,328,980 |
ASML Holding NV | 45,507 | | 4,306,782 |
European Aeronautic Defence and Space Co. (EADS) NV | 24,000 | | 1,649,177 |
Exact Holdings NV | 10,177 | | 269,517 |
Koninklijke Ahold NV | 149,342 | | 2,842,823 |
Koninklijke Philips Electronics NV | 155,100 | | 5,481,348 |
Randstad Holding NV | 44,718 | | 2,759,840 |
Royal DSM NV | 32,700 | | 2,476,988 |
Yandex NV (a) | 54,300 | | 2,001,498 |
TOTAL NETHERLANDS | | 24,116,953 |
New Zealand - 0.2% |
Ryman Healthcare Group Ltd. | 459,616 | | 2,866,303 |
Norway - 0.4% |
DNB ASA | 365,200 | | 6,472,077 |
Philippines - 0.1% |
Alliance Global Group, Inc. | 1,671,800 | | 1,019,367 |
Russia - 0.2% |
Mobile TeleSystems OJSC sponsored ADR | 143,200 | | 3,264,960 |
Singapore - 1.0% |
Avago Technologies Ltd. | 278,000 | | 12,629,540 |
Global Logistic Properties Ltd. | 1,015,000 | | 2,524,835 |
TOTAL SINGAPORE | | 15,154,375 |
South Africa - 0.6% |
Distell Group Ltd. | 126,410 | | 1,693,652 |
Naspers Ltd. Class N | 80,100 | | 7,492,357 |
TOTAL SOUTH AFRICA | | 9,186,009 |
Spain - 1.7% |
Amadeus IT Holding SA Class A | 82,100 | | 3,048,739 |
Antena 3 de Television SA | 93,500 | | 1,567,828 |
Banco Bilbao Vizcaya Argentaria SA | 799,331 | | 9,341,727 |
Criteria CaixaCorp SA (d) | 259,900 | | 1,351,175 |
Distribuidora Internacional de Alimentacion SA | 352,600 | | 3,223,374 |
Common Stocks - continued |
| Shares | | Value |
Spain - continued |
Grifols SA ADR | 75,442 | | $ 2,275,331 |
Inditex SA | 28,781 | | 4,728,366 |
TOTAL SPAIN | | 25,536,540 |
Sweden - 1.9% |
ASSA ABLOY AB (B Shares) | 110,600 | | 5,490,701 |
Intrum Justitia AB | 115,000 | | 3,061,319 |
Investment AB Kinnevik (B Shares) | 145,500 | | 5,361,903 |
Nordea Bank AB | 374,200 | | 4,792,957 |
Svenska Cellulosa AB (SCA) (B Shares) | 222,500 | | 6,317,852 |
Svenska Handelsbanken AB (A Shares) | 77,300 | | 3,502,331 |
TOTAL SWEDEN | | 28,527,063 |
Switzerland - 3.1% |
Actelion Ltd. | 13,000 | | 1,006,502 |
Credit Suisse Group | 63,657 | | 1,980,240 |
Lonza Group AG | 47,211 | | 4,219,774 |
Partners Group Holding AG | 13,818 | | 3,580,329 |
Roche Holding AG (participation certificate) | 49,858 | | 13,803,196 |
Schindler Holding AG (participation certificate) | 15,402 | | 2,184,645 |
SGS SA (Reg.) | 490 | | 1,148,113 |
Swatch Group AG (Bearer) | 2,200 | | 1,407,505 |
Syngenta AG (Switzerland) | 11,110 | | 4,484,181 |
UBS AG | 506,231 | | 9,791,049 |
Zurich Insurance Group AG | 10,593 | | 2,929,171 |
TOTAL SWITZERLAND | | 46,534,705 |
Taiwan - 0.3% |
ECLAT Textile Co. Ltd. | 149,940 | | 1,647,888 |
Taiwan Semiconductor Manufacturing Co. Ltd. | 706,000 | | 2,597,103 |
TOTAL TAIWAN | | 4,244,991 |
United Kingdom - 7.2% |
Aberdeen Asset Management PLC | 355,842 | | 2,526,997 |
Alabama Noor Hospitals Group PLC (a) | 169,000 | | 2,303,284 |
Associated British Foods PLC | 96,800 | | 3,518,591 |
Barclays PLC | 1,419,228 | | 5,971,353 |
BG Group PLC | 240,300 | | 4,906,758 |
BHP Billiton PLC | 154,101 | | 4,755,325 |
British American Tobacco PLC (United Kingdom) | 49,900 | | 2,753,097 |
Croda International PLC | 38,600 | | 1,507,671 |
Diageo PLC | 264,983 | | 8,446,990 |
Foxtons Group PLC | 134,300 | | 686,385 |
Hikma Pharmaceuticals PLC | 239,015 | | 4,602,672 |
Hilton Food Group PLC | 262,800 | | 1,803,479 |
HSBC Holdings PLC (United Kingdom) | 756,850 | | 8,296,094 |
Intertek Group PLC | 55,600 | | 2,970,446 |
ITV PLC | 907,700 | | 2,778,370 |
Jazztel PLC (a) | 284,917 | | 3,125,716 |
Legal & General Group PLC | 1,589,267 | | 5,511,823 |
|
| Shares | | Value |
Liberty Global PLC Class A (a) | 37,000 | | $ 2,899,690 |
London Stock Exchange Group PLC | 107,700 | | 2,835,507 |
Meggitt PLC | 419,676 | | 3,852,401 |
Next PLC | 57,000 | | 4,976,392 |
Ocado Group PLC (a) | 511,100 | | 3,556,620 |
Persimmon PLC | 129,000 | | 2,616,508 |
Reckitt Benckiser Group PLC | 48,500 | | 3,770,042 |
Rolls-Royce Group PLC | 271,600 | | 5,008,060 |
Rotork PLC | 44,510 | | 2,043,247 |
Royal Mail PLC | 106,500 | | 956,268 |
SABMiller PLC | 92,100 | | 4,805,284 |
Taylor Wimpey PLC | 1,155,900 | | 2,042,414 |
The Restaurant Group PLC | 123,700 | | 1,142,442 |
Ultra Electronics Holdings PLC | 36,900 | | 1,144,260 |
Vodafone Group PLC | 420,400 | | 1,539,825 |
TOTAL UNITED KINGDOM | | 109,654,011 |
United States of America - 49.8% |
A.O. Smith Corp. | 21,000 | | 1,084,650 |
Accuray, Inc. (a) | 235,000 | | 1,586,250 |
Adobe Systems, Inc. (a) | 289,000 | | 15,663,800 |
Agios Pharmaceuticals, Inc. (d) | 20,000 | | 463,200 |
Alexion Pharmaceuticals, Inc. (a) | 44,000 | | 5,409,800 |
Alliance Data Systems Corp. (a) | 6,000 | | 1,422,360 |
Amazon.com, Inc. (a) | 23,000 | | 8,372,690 |
American International Group, Inc. | 145,000 | | 7,489,250 |
Ameriprise Financial, Inc. | 175,400 | | 17,634,716 |
Amphenol Corp. Class A | 15,000 | | 1,204,350 |
Applied Micro Circuits Corp. (a) | 104,000 | | 1,212,640 |
Bank of America Corp. | 2,436,400 | | 34,012,144 |
Beam, Inc. | 23,900 | | 1,608,470 |
Biogen Idec, Inc. (a) | 66,000 | | 16,116,540 |
Bluebird Bio, Inc. (d) | 27,100 | | 575,875 |
Boston Scientific Corp. (a) | 275,300 | | 3,218,257 |
Bristol-Myers Squibb Co. | 87,000 | | 4,569,240 |
Cabot Oil & Gas Corp. | 1,002,000 | | 35,390,640 |
CalAmp Corp. (a) | 14,000 | | 329,420 |
Callidus Software, Inc. (a) | 50,000 | | 517,500 |
CBS Corp. Class B | 171,000 | | 10,112,940 |
Celldex Therapeutics, Inc. (a) | 89,100 | | 2,041,281 |
Citigroup, Inc. | 204,000 | | 9,951,120 |
Criteo SA sponsored ADR | 1,823 | | 64,370 |
Cummins, Inc. | 223,000 | | 28,325,460 |
Discovery Communications, Inc. Class A (a) | 42,000 | | 3,734,640 |
Eastman Chemical Co. | 292,500 | | 23,046,075 |
Ecolab, Inc. | 168,000 | | 17,808,000 |
EOG Resources, Inc. | 97,000 | | 17,304,800 |
EQT Corp. | 138,000 | | 11,814,180 |
Estee Lauder Companies, Inc. Class A | 12,800 | | 908,288 |
Facebook, Inc. Class A (a) | 78,000 | | 3,920,280 |
FedEx Corp. | 134,000 | | 17,554,000 |
Gilead Sciences, Inc. (a) | 382,000 | | 27,118,180 |
Google, Inc. Class A (a) | 30,200 | | 31,123,516 |
Common Stocks - continued |
| Shares | | Value |
United States of America - continued |
Guidewire Software, Inc. (a) | 53,000 | | $ 2,688,160 |
H&R Block, Inc. | 56,000 | | 1,592,640 |
Halozyme Therapeutics, Inc. (a)(d) | 236,000 | | 2,749,400 |
HealthStream, Inc. (a) | 12,000 | | 428,640 |
Illumina, Inc. (a) | 174,500 | | 16,317,495 |
inContact, Inc. (a) | 102,506 | | 778,021 |
Intercept Pharmaceuticals, Inc. | 47,667 | | 2,585,458 |
Johnson Controls, Inc. | 66,000 | | 3,045,900 |
KAR Auction Services, Inc. | 7,000 | | 208,040 |
KKR & Co. LP | 157,000 | | 3,446,150 |
Kroger Co. | 414,300 | | 17,748,612 |
MasterCard, Inc. Class A | 60,400 | | 43,312,839 |
McGraw-Hill Companies, Inc. | 491,200 | | 34,226,816 |
McKesson Corp. | 23,000 | | 3,595,820 |
Medivation, Inc. (a) | 59,800 | | 3,579,628 |
Monster Beverage Corp. (a) | 3,000 | | 171,690 |
Morgan Stanley | 405,000 | | 11,635,650 |
Netflix, Inc. (a) | 28,000 | | 9,029,440 |
Noble Energy, Inc. | 156,000 | | 11,689,080 |
Norfolk Southern Corp. | 161,000 | | 13,849,220 |
Pharmacyclics, Inc. (a) | 14,300 | | 1,696,552 |
Phillips 66 Partners LP | 49,875 | | 1,675,800 |
Pioneer Natural Resources Co. | 151,900 | | 31,106,082 |
priceline.com, Inc. (a) | 7,700 | | 8,114,491 |
Proto Labs, Inc. (a) | 33,000 | | 2,767,380 |
PVH Corp. | 53,000 | | 6,602,210 |
Regeneron Pharmaceuticals, Inc. (a) | 11,231 | | 3,230,036 |
Rock-Tenn Co. Class A | 11,000 | | 1,177,110 |
salesforce.com, Inc. (a) | 48,900 | | 2,609,304 |
ServiceNow, Inc. (a) | 226,000 | | 12,341,860 |
Sirius XM Radio, Inc. | 607,000 | | 2,288,390 |
Sohu.com, Inc. (a) | 19,300 | | 1,292,328 |
Spirit Airlines, Inc. (a) | 59,900 | | 2,584,685 |
SS&C Technologies Holdings, Inc. (a) | 82,900 | | 3,257,970 |
Synageva BioPharma Corp. (a) | 15,100 | | 767,080 |
Teledyne Technologies, Inc. (a) | 16,000 | | 1,421,120 |
The Blackstone Group LP | 421,000 | | 11,063,880 |
The Boeing Co. | 56,000 | | 7,308,000 |
The Cooper Companies, Inc. | 109,800 | | 14,187,258 |
TJX Companies, Inc. | 227,900 | | 13,854,041 |
TripAdvisor, Inc. (a) | 71,000 | | 5,872,410 |
Twenty-First Century Fox, Inc. Class A | 212,000 | | 7,224,960 |
United Therapeutics Corp. (a) | 35,000 | | 3,098,200 |
Visa, Inc. Class A | 149,900 | | 29,480,833 |
W.R. Grace & Co. (a) | 18,000 | | 1,649,880 |
Web.com Group, Inc. (a) | 137,100 | | 3,694,845 |
WhiteWave Foods Co. | 40,000 | | 800,400 |
Workday, Inc. Class A | 218,300 | | 16,344,121 |
Xylem, Inc. | 88,000 | | 3,036,000 |
Yahoo!, Inc. (a) | 399,000 | | 13,139,070 |
TOTAL UNITED STATES OF AMERICA | | 759,073,917 |
|
| Shares | | Value |
US Virgin Islands - 0.0% |
Altisource Residential Corp. Class B | 25,000 | | $ 664,250 |
TOTAL COMMON STOCKS (Cost $1,165,169,491) |
1,465,615,571
|
Nonconvertible Preferred Stocks - 0.7% |
| | | |
Germany - 0.7% |
Volkswagen AG | 39,200 | | 9,963,495 |
United Kingdom - 0.0% |
Rolls-Royce Group PLC Series C | 23,357,600 | | 37,452 |
TOTAL NONCONVERTIBLE PREFERRED STOCKS (Cost $7,496,985) |
10,000,947
|
Convertible Bonds - 0.1% |
| Principal Amount | | |
United States of America - 0.1% |
MGIC Investment Corp. 2% 4/1/20 | | $ 700,000 | | 954,310 |
Radian Group, Inc. 2.25% 3/1/19 | | 620,000 | | 935,394 |
TOTAL CONVERTIBLE BONDS (Cost $1,320,000) |
1,889,704
|
Government Obligations - 0.0% |
|
United States of America - 0.0% |
U.S. Treasury Bills, yield at date of purchase 0.02% 1/2/14 (e)
(Cost $414,989) | | 415,000 | |
414,982
|
Money Market Funds - 3.3% |
| Shares | | |
Fidelity Cash Central Fund, 0.09% (b) | 45,067,881 | | 45,067,881 |
Fidelity Securities Lending Cash Central Fund, 0.09% (b)(c) | 4,680,338 | | 4,680,338 |
TOTAL MONEY MARKET FUNDS (Cost $49,748,219) |
49,748,219
|
TOTAL INVESTMENT PORTFOLIO - 100.2% (Cost $1,224,149,684) | | 1,527,669,423 |
NET OTHER ASSETS (LIABILITIES) - (0.2)% | | (2,644,309) |
NET ASSETS - 100% | $ 1,525,025,114 |
Futures Contracts |
| Expiration Date | | Underlying Face Amount at Value | | Unrealized Appreciation/(Depreciation) |
Purchased |
Equity Index Contracts |
92 Nikkei 225 Index Contracts (Japan) | Dec. 2013 | | $ 6,653,900 | | $ 248,032 |
|
The face value of futures purchased as a percentage of net assets is 0.4% |
Legend |
(a) Non-income producing |
(b) Affiliated fund that is generally available only to investment companies and other accounts managed by Fidelity Investments. The rate quoted is the annualized seven-day yield of the fund at period end. A complete unaudited listing of the fund's holdings as of its most recent quarter end is available upon request. In addition, each Fidelity Central Fund's financial statements, which are not covered by the Fund's Report of Independent Registered Public Accounting Firm, are available on the SEC's website or upon request. |
(c) Investment made with cash collateral received from securities on loan. |
(d) Security or a portion of the security is on loan at period end. |
(e) Security or a portion of the security was pledged to cover margin requirements for futures contracts. At period end, the value of securities pledged amounted to $414,982. |
Affiliated Central Funds |
Information regarding fiscal year to date income earned by the Fund from investments in Fidelity Central Funds is as follows: |
Fund | Income earned |
Fidelity Cash Central Fund | $ 50,995 |
Fidelity Securities Lending Cash Central Fund | 356,949 |
Total | $ 407,944 |
Other Information |
Categorizations in the Schedule of Investments are based on country or territory of incorporation. |
The following is a summary of the inputs used, as of October 31, 2013, involving the Fund's assets and liabilities carried at fair value. The inputs or methodology used for valuing securities may not be an indication of the risk associated with investing in those securities. For more information on valuation inputs, and their aggregation into the levels used in the tables below, please refer to the Investment Valuation section in the accompanying Notes to Financial Statements. |
Valuation Inputs at Reporting Date: |
Description | Total | Level 1 | Level 2 | Level 3 |
Investments in Securities: | | | | |
Equities: | | | | |
Consumer Discretionary | $ 195,094,745 | $ 168,158,697 | $ 25,501,633 | $ 1,434,415 |
Consumer Staples | 96,269,397 | 61,281,831 | 34,987,566 | - |
Energy | 136,117,946 | 125,467,069 | 10,650,877 | - |
Financials | 302,503,944 | 230,929,341 | 71,574,603 | - |
Health Care | 213,703,702 | 194,558,830 | 19,144,872 | - |
Industrials | 178,362,200 | 157,284,362 | 21,077,838 | - |
Information Technology | 238,545,382 | 220,583,013 | 17,962,369 | - |
Materials | 80,101,344 | 70,861,838 | 9,239,506 | - |
Telecommunication Services | 30,899,697 | 12,687,831 | 18,211,866 | - |
Utilities | 4,018,161 | 4,018,161 | - | - |
Corporate Bonds | 1,889,704 | - | 1,889,704 | - |
Government Obligations | 414,982 | - | 414,982 | - |
Money Market Funds | 49,748,219 | 49,748,219 | - | - |
Total Investments in Securities: | $ 1,527,669,423 | $ 1,295,579,192 | $ 230,655,816 | $ 1,434,415 |
Derivative Instruments: | | | | |
Assets | | | | |
Futures Contracts | $ 248,032 | $ 248,032 | $ - | $ - |
The following is a summary of transfers between Level 1 and Level 2 for the period ended October 31, 2013. Transfers are assumed to have occurred at the beginning of the period, and are primarily attributable to the valuation techniques used for foreign equity securities, as discussed in the accompanying Notes to Financial Statements: |
Transfers | Total |
Level 1 to Level 2 | $ 43,000,101 |
Level 2 to Level 1 | $ 0 |
Value of Derivative Instruments |
The following table is a summary of the Fund's value of derivative instruments by primary risk exposure as of October 31, 2013. For additional information on derivative instruments, please refer to the Derivative Instruments section in the accompanying Notes to Financial Statements. |
Primary Risk Exposure /
Derivative Type | Value |
| Asset | Liability |
Equity Risk | | |
Futures Contracts (a) | $ 248,032 | $ - |
Total Value of Derivatives | $ 248,032 | $ - |
(a) Reflects gross cumulative appreciation (depreciation) on futures contracts as presented in the Schedule of Investments. Only the period end receivable or payable for daily variation margin and net unrealized appreciation (depreciation) are presented in the Statement of Assets and Liabilities. |
See accompanying notes which are an integral part of the financial statements.
Annual Report
Fidelity Worldwide Fund
Statement of Assets and Liabilities
| October 31, 2013 |
| | |
Assets | | |
Investment in securities, at value (including securities loaned of $4,617,353) - See accompanying schedule: Unaffiliated issuers (cost $1,174,401,466) | $ 1,477,921,205 | |
Fidelity Central Funds (cost $49,748,218) | 49,748,218 | |
Total Investments (cost $1,224,149,684) | | $ 1,527,669,423 |
Cash | | 46,236 |
Foreign currency held at value (cost $145) | | 145 |
Receivable for investments sold | | 52,033,895 |
Receivable for fund shares sold | | 1,918,441 |
Dividends receivable | | 1,641,222 |
Interest receivable | | 3,492 |
Distributions receivable from Fidelity Central Funds | | 12,107 |
Prepaid expenses | | 4,783 |
Other receivables | | 265,654 |
Total assets | | 1,583,595,398 |
| | |
Liabilities | | |
Payable for investments purchased | $ 51,567,924 | |
Payable for fund shares redeemed | 859,404 | |
Accrued management fee | 988,981 | |
Distribution and service plan fees payable | 18,778 | |
Payable for daily variation margin for derivative instruments | 57,500 | |
Other affiliated payables | 294,730 | |
Other payables and accrued expenses | 102,629 | |
Collateral on securities loaned, at value | 4,680,338 | |
Total liabilities | | 58,570,284 |
| | |
Net Assets | | $ 1,525,025,114 |
Net Assets consist of: | | |
Paid in capital | | $ 1,104,816,841 |
Undistributed net investment income | | 5,154,082 |
Accumulated undistributed net realized gain (loss) on investments and foreign currency transactions | | 111,364,032 |
Net unrealized appreciation (depreciation) on investments and assets and liabilities in foreign currencies | | 303,690,159 |
Net Assets | | $ 1,525,025,114 |
Statement of Assets and Liabilities - continued
| October 31, 2013 |
| | |
Calculation of Maximum Offering Price Class A:
Net Asset Value and redemption price per share ($28,661,272 ÷ 1,138,130 shares) | | $ 25.18 |
| | |
Maximum offering price per share (100/94.25 of $25.18) | | $ 26.72 |
Class T:
Net Asset Value and redemption price per share ($9,822,410 ÷ 392,095 shares) | | $ 25.05 |
| | |
Maximum offering price per share (100/96.50 of $25.05) | | $ 25.96 |
Class B:
Net Asset Value and offering price per share ($709,889 ÷ 28,601 shares)A | | $ 24.82 |
| | |
Class C:
Net Asset Value and offering price per share ($10,777,727 ÷ 434,922 shares)A | | $ 24.78 |
| | |
Worldwide:
Net Asset Value, offering price and redemption price per share ($1,464,415,231 ÷ 57,635,498 shares) | | $ 25.41 |
| | |
Institutional Class:
Net Asset Value, offering price and redemption price per share ($10,638,585 ÷ 420,307 shares) | | $ 25.31 |
A Redemption price per share is equal to net asset value less any applicable contingent deferred sales charge.
See accompanying notes which are an integral part of the financial statements.
Annual Report
Fidelity Worldwide Fund
Financial Statements - continued
Statement of Operations
| Year ended October 31, 2013 |
Investment Income | | |
Dividends | | $ 20,251,766 |
Interest | | 18,336 |
Income from Fidelity Central Funds | | 407,944 |
Income before foreign taxes withheld | | 20,678,046 |
Less foreign taxes withheld | | (1,095,825) |
Total income | | 19,582,221 |
| | |
Expenses | | |
Management fee
Basic fee | $ 9,069,757 | |
Performance adjustment | 1,622,176 | |
Transfer agent fees | 2,711,063 | |
Distribution and service plan fees | 156,379 | |
Accounting and security lending fees | 588,006 | |
Custodian fees and expenses | 172,916 | |
Independent trustees' compensation | 7,367 | |
Registration fees | 94,174 | |
Audit | 74,846 | |
Legal | 4,009 | |
Miscellaneous | 10,331 | |
Total expenses before reductions | 14,511,024 | |
Expense reductions | (321,971) | 14,189,053 |
Net investment income (loss) | | 5,393,168 |
Realized and Unrealized Gain (Loss) Net realized gain (loss) on: | | |
Investment securities: | | |
Unaffiliated issuers | 124,060,205 | |
Foreign currency transactions | (172,714) | |
Futures contracts | 3,571,502 | |
Total net realized gain (loss) | | 127,458,993 |
Change in net unrealized appreciation (depreciation) on: Investment securities | 200,652,376 | |
Assets and liabilities in foreign currencies | (4,939) | |
Futures contracts | 248,032 | |
Total change in net unrealized appreciation (depreciation) | | 200,895,469 |
Net gain (loss) | | 328,354,462 |
Net increase (decrease) in net assets resulting from operations | | $ 333,747,630 |
Statement of Changes in Net Assets
| Year ended
October 31,
2013 | Year ended
October 31,
2012 |
Increase (Decrease) in Net Assets | | |
Operations | | |
Net investment income (loss) | $ 5,393,168 | $ 9,012,042 |
Net realized gain (loss) | 127,458,993 | 52,879,353 |
Change in net unrealized appreciation (depreciation) | 200,895,469 | 45,589,333 |
Net increase (decrease) in net assets resulting from operations | 333,747,630 | 107,480,728 |
Distributions to shareholders from net investment income | (8,778,977) | (4,089,511) |
Distributions to shareholders from net realized gain | (4,461,887) | - |
Total distributions | (13,240,864) | (4,089,511) |
Share transactions - net increase (decrease) | 92,658,787 | (126,253,328) |
Redemption fees | 24,982 | 23,898 |
Total increase (decrease) in net assets | 413,190,535 | (22,838,213) |
| | |
Net Assets | | |
Beginning of period | 1,111,834,579 | 1,134,672,792 |
End of period (including undistributed net investment income of $5,154,082 and undistributed net investment income of $7,478,979, respectively) | $ 1,525,025,114 | $ 1,111,834,579 |
See accompanying notes which are an integral part of the financial statements.
Annual Report
Financial Highlights - Class A
Years ended October 31, | 2013 | 2012 | 2011 | 2010 | 2009 H |
Selected Per-Share Data | | | | | |
Net asset value, beginning of period | $ 19.69 | $ 17.89 | $ 17.50 | $ 14.96 | $ 10.88 |
Income from Investment Operations | | | | | |
Net investment income (loss) E | .02 | .10 | .05 | .03 | (.01) |
Net realized and unrealized gain (loss) | 5.66 | 1.72 | .47 | 2.63 | 4.09 |
Total from investment operations | 5.68 | 1.82 | .52 | 2.66 | 4.08 |
Distributions from net investment income | (.11) | (.02) | (.08) | (.10) | - |
Distributions from net realized gain | (.08) | - | (.05) | (.02) | - |
Total distributions | (.19) | (.02) | (.13) | (.12) | - |
Redemption fees added to paid in capital E, J | - | - | - | - | - |
Net asset value, end of period | $ 25.18 | $ 19.69 | $ 17.89 | $ 17.50 | $ 14.96 |
Total Return B, C, D | 29.10% | 10.20% | 2.94% | 17.85% | 37.50% |
Ratios to Average Net Assets F, I | | | | | |
Expenses before reductions | 1.45% | 1.43% | 1.41% | 1.43% | 1.52% A |
Expenses net of fee waivers, if any | 1.45% | 1.43% | 1.40% | 1.43% | 1.52% A |
Expenses net of all reductions | 1.42% | 1.41% | 1.38% | 1.41% | 1.49% A |
Net investment income (loss) | .09% | .52% | .28% | .21% | (.06)% A |
Supplemental Data | | | | | |
Net assets, end of period (000 omitted) | $ 28,661 | $ 18,723 | $ 13,153 | $ 7,530 | $ 993 |
Portfolio turnover rate G | 161% | 186% | 203% | 166% | 224% |
A Annualized
B Total returns for periods of less than one year are not annualized.
C Total returns would have been lower if certain expenses had not been reduced during the applicable periods shown.
D Total returns do not include the effect of the sales charges.
E Calculated based on average shares outstanding during the period.
F Fees and expenses of any underlying Fidelity Central Funds are not included in the Fund's expense ratio. The Fund indirectly bears its proportionate share of the expenses of any underlying Fidelity Central Funds.
G Amount does not include the portfolio activity of any underlying Fidelity Central Funds.
H For the period February 19, 2009 (commencement of sale of shares) to October 31, 2009.
I Expense ratios reflect operating expenses of the class. Expenses before reductions do not reflect amounts reimbursed by the investment adviser or reductions from brokerage service arrangements or reductions from other expense offset arrangements and do not represent the amount paid by the class during periods when reimbursements or reductions occur. Expense ratios before reductions for start-up periods may not be representative of longer-term operating periods. Expenses net of fee waivers reflect expenses after reimbursement by the investment adviser but prior to reductions from brokerage service arrangements or other expense offset arrangements. Expenses net of all reductions represent the net expenses paid by the class.
J Amount represents less than $.01 per share.
Financial Highlights - Class T
Years ended October 31, | 2013 | 2012 | 2011 | 2010 | 2009 H |
Selected Per-Share Data | | | | | |
Net asset value, beginning of period | $ 19.61 | $ 17.83 | $ 17.46 | $ 14.94 | $ 10.88 |
Income from Investment Operations | | | | | |
Net investment income (loss) E | (.04) | .05 | .01 | (.01) | (.01) |
Net realized and unrealized gain (loss) | 5.63 | 1.73 | .45 | 2.62 | 4.07 |
Total from investment operations | 5.59 | 1.78 | .46 | 2.61 | 4.06 |
Distributions from net investment income | (.07) | - | (.04) | (.08) | - |
Distributions from net realized gain | (.08) | - | (.05) | (.02) | - |
Total distributions | (.15) | - | (.09) | (.09) K | - |
Redemption fees added to paid in capital E, J | - | - | - | - | - |
Net asset value, end of period | $ 25.05 | $ 19.61 | $ 17.83 | $ 17.46 | $ 14.94 |
Total Return B, C, D | 28.73% | 9.98% | 2.61% | 17.53% | 37.32% |
Ratios to Average Net Assets F, I | | | | | |
Expenses before reductions | 1.71% | 1.68% | 1.66% | 1.70% | 1.73% A |
Expenses net of fee waivers, if any | 1.70% | 1.68% | 1.65% | 1.70% | 1.73% A |
Expenses net of all reductions | 1.68% | 1.66% | 1.63% | 1.68% | 1.70% A |
Net investment income (loss) | (.16)% | .26% | .03% | (.05)% | (.08)% A |
Supplemental Data | | | | | |
Net assets, end of period (000 omitted) | $ 9,822 | $ 5,550 | $ 2,187 | $ 1,120 | $ 458 |
Portfolio turnover rate G | 161% | 186% | 203% | 166% | 224% |
A Annualized
B Total returns for periods of less than one year are not annualized.
C Total returns would have been lower if certain expenses had not been reduced during the applicable periods shown.
D Total returns do not include the effect of the sales charges.
E Calculated based on average shares outstanding during the period.
F Fees and expenses of any underlying Fidelity Central Funds are not included in the Fund's expense ratio. The Fund indirectly bears its proportionate share of the expenses of any underlying Fidelity Central Funds.
G Amount does not include the portfolio activity of any underlying Fidelity Central Funds.
H For the period February 19, 2009 (commencement of sale of shares) to October 31, 2009.
I Expense ratios reflect operating expenses of the class. Expenses before reductions do not reflect amounts reimbursed by the investment adviser or reductions from brokerage service arrangements or reductions from other expense offset arrangements and do not represent the amount paid by the class during periods when reimbursements or reductions occur. Expense ratios before reductions for start-up periods may not be representative of longer-term operating periods. Expenses net of fee waivers reflect expenses after reimbursement by the investment adviser but prior to reductions from brokerage service arrangements or other expense offset arrangements. Expenses net of all reductions represent the net expenses paid by the class.
J Amount represents less than $.01 per share.
K Total distributions of $.09 per share is comprised of distributions from net investment income of $.075 and distributions from net realized gain of $.015 per share.
See accompanying notes which are an integral part of the financial statements.
Annual Report
Financial Highlights - Class B
Years ended October 31, | 2013 | 2012 | 2011 | 2010 | 2009 H |
Selected Per-Share Data | | | | | |
Net asset value, beginning of period | $ 19.44 | $ 17.77 | $ 17.39 | $ 14.89 | $ 10.88 |
Income from Investment Operations | | | | | |
Net investment income (loss) E | (.14) | (.04) | (.09) | (.09) | (.03) |
Net realized and unrealized gain (loss) | 5.59 | 1.71 | .47 | 2.61 | 4.04 |
Total from investment operations | 5.45 | 1.67 | .38 | 2.52 | 4.01 |
Distributions from net investment income | - | - | - | (.01) | - |
Distributions from net realized gain | (.07) | - | - | (.01) | - |
Total distributions | (.07) | - | - | (.02) | - |
Redemption fees added to paid in capital E, J | - | - | - | - | - |
Net asset value, end of period | $ 24.82 | $ 19.44 | $ 17.77 | $ 17.39 | $ 14.89 |
Total Return B, C, D | 28.13% | 9.40% | 2.19% | 16.92% | 36.86% |
Ratios to Average Net Assets F, I | | | | | |
Expenses before reductions | 2.19% | 2.18% | 2.16% | 2.19% | 2.20% A |
Expenses net of fee waivers, if any | 2.19% | 2.18% | 2.16% | 2.19% | 2.20% A |
Expenses net of all reductions | 2.17% | 2.16% | 2.13% | 2.17% | 2.17% A |
Net investment income (loss) | (.65)% | (.23)% | (.47)% | (.55)% | (.30)% A |
Supplemental Data | | | | | |
Net assets, end of period (000 omitted) | $ 710 | $ 304 | $ 256 | $ 305 | $ 224 |
Portfolio turnover rate G | 161% | 186% | 203% | 166% | 224% |
A Annualized
B Total returns for periods of less than one year are not annualized.
C Total returns would have been lower if certain expenses had not been reduced during the applicable periods shown.
D Total returns do not include the effect of the contingent deferred sales charge.
E Calculated based on average shares outstanding during the period.
F Fees and expenses of any underlying Fidelity Central Funds are not included in the Fund's expense ratio. The Fund indirectly bears its proportionate share of the expenses of any underlying Fidelity Central Funds.
G Amount does not include the portfolio activity of any underlying Fidelity Central Funds.
H For the period February 19, 2009 (commencement of sale of shares) to October 31, 2009.
I Expense ratios reflect operating expenses of the class. Expenses before reductions do not reflect amounts reimbursed by the investment adviser or reductions from brokerage service arrangements or reductions from other expense offset arrangements and do not represent the amount paid by the class during periods when reimbursements or reductions occur. Expense ratios before reductions for start-up periods may not be representative of longer-term operating periods. Expenses net of fee waivers reflect expenses after reimbursement by the investment adviser but prior to reductions from brokerage service arrangements or other expense offset arrangements. Expenses net of all reductions represent the net expenses paid by the class.
J Amount represents less than $.01 per share.
Financial Highlights - Class C
Years ended October 31, | 2013 | 2012 | 2011 | 2010 | 2009 H |
Selected Per-Share Data | | | | | |
Net asset value, beginning of period | $ 19.41 | $ 17.74 | $ 17.36 | $ 14.89 | $ 10.88 |
Income from Investment Operations | | | | | |
Net investment income (loss) E | (.14) | (.04) | (.09) | (.09) | (.04) |
Net realized and unrealized gain (loss) | 5.58 | 1.71 | .47 | 2.61 | 4.05 |
Total from investment operations | 5.44 | 1.67 | .38 | 2.52 | 4.01 |
Distributions from net investment income | - | - | - | (.03) | - |
Distributions from net realized gain | (.07) | - | - | (.02) | - |
Total distributions | (.07) | - | - | (.05) | - |
Redemption fees added to paid in capital E, J | - | - | - | - | - |
Net asset value, end of period | $ 24.78 | $ 19.41 | $ 17.74 | $ 17.36 | $ 14.89 |
Total Return B, C, D | 28.12% | 9.41% | 2.19% | 16.94% | 36.86% |
Ratios to Average Net Assets F, I | | | | | |
Expenses before reductions | 2.15% | 2.18% | 2.16% | 2.19% | 2.18% A |
Expenses net of fee waivers, if any | 2.14% | 2.18% | 2.15% | 2.19% | 2.18% A |
Expenses net of all reductions | 2.12% | 2.16% | 2.13% | 2.16% | 2.15% A |
Net investment income (loss) | (.60)% | (.23)% | (.47)% | (.54)% | (.39)% A |
Supplemental Data | | | | | |
Net assets, end of period (000 omitted) | $ 10,778 | $ 1,726 | $ 1,297 | $ 710 | $ 335 |
Portfolio turnover rate G | 161% | 186% | 203% | 166% | 224% |
A Annualized
B Total returns for periods of less than one year are not annualized.
C Total returns would have been lower if certain expenses had not been reduced during the applicable periods shown.
D Total returns do not include the effect of the contingent deferred sales charge.
E Calculated based on average shares outstanding during the period.
F Fees and expenses of any underlying Fidelity Central Funds are not included in the Fund's expense ratio. The Fund indirectly bears its proportionate share of the expenses of any underlying Fidelity Central Funds.
G Amount does not include the portfolio activity of any underlying Fidelity Central Funds.
H For the period February 19, 2009 (commencement of sale of shares) to October 31, 2009.
I Expense ratios reflect operating expenses of the class. Expenses before reductions do not reflect amounts reimbursed by the investment adviser or reductions from brokerage service arrangements or reductions from other expense offset arrangements and do not represent the amount paid by the class during periods when reimbursements or reductions occur. Expense ratios before reductions for start-up periods may not be representative of longer-term operating periods. Expenses net of fee waivers reflect expenses after reimbursement by the investment adviser but prior to reductions from brokerage service arrangements or other expense offset arrangements. Expenses net of all reductions represent the net expenses paid by the class.
J Amount represents less than $.01 per share.
See accompanying notes which are an integral part of the financial statements.
Annual Report
Financial Highlights - Worldwide
Years ended October 31, | 2013 | 2012 | 2011 | 2010 | 2009 |
Selected Per-Share Data | | | | | |
Net asset value, beginning of period | $ 19.85 | $ 18.02 | $ 17.58 | $ 14.98 | $ 13.40 |
Income from Investment Operations | | | | | |
Net investment income (loss) B | .10 | .16 | .11 | .08 | .12 |
Net realized and unrealized gain (loss) | 5.70 | 1.74 | .48 | 2.63 | 1.63 |
Total from investment operations | 5.80 | 1.90 | .59 | 2.71 | 1.75 |
Distributions from net investment income | (.16) | (.07) | (.10) | (.10) | (.17) |
Distributions from net realized gain | (.08) | - | (.05) | (.02) | - |
Total distributions | (.24) | (.07) | (.15) | (.11) G | (.17) |
Redemption fees added to paid in capital B, F | - | - | - | - | - |
Net asset value, end of period | $ 25.41 | $ 19.85 | $ 18.02 | $ 17.58 | $ 14.98 |
Total Return A | 29.54% | 10.56% | 3.32% | 18.18% | 13.39% |
Ratios to Average Net Assets C, E | | | | | |
Expenses before reductions | 1.11% | 1.11% | 1.08% | 1.15% | 1.27% |
Expenses net of fee waivers, if any | 1.11% | 1.11% | 1.08% | 1.15% | 1.27% |
Expenses net of all reductions | 1.08% | 1.09% | 1.05% | 1.12% | 1.24% |
Net investment income (loss) | .43% | .84% | .60% | .50% | .92% |
Supplemental Data | | | | | |
Net assets, end of period (000 omitted) | $ 1,464,415 | $ 1,081,240 | $ 1,114,694 | $ 1,087,928 | $ 991,996 |
Portfolio turnover rate D | 161% | 186% | 203% | 166% | 224% |
A Total returns would have been lower if certain expenses had not been reduced during the applicable periods shown.
B Calculated based on average shares outstanding during the period.
C Fees and expenses of any underlying Fidelity Central Funds are not included in the Fund's expense ratio. The Fund indirectly bears its proportionate share of the expenses of any underlying Fidelity Central Funds.
D Amount does not include the portfolio activity of any underlying Fidelity Central Funds.
E Expense ratios reflect operating expenses of the class. Expenses before reductions do not reflect amounts reimbursed by the investment adviser or reductions from brokerage service arrangements or reductions from other expense offset arrangements and do not represent the amount paid by the class during periods when reimbursements or reductions occur. Expenses net of fee waivers reflect expenses after reimbursement by the investment adviser but prior to reductions from brokerage service arrangements or other expense offset arrangements. Expenses net of all reductions represent the net expenses paid by the class.
F Amount represents less than $.01 per share.
G Total distributions of $.11 per share is comprised of distributions from net investment income of $.097 and distributions from net realized gain of $.015 per share.
Financial Highlights - Institutional Class
Years ended October 31, | 2013 | 2012 | 2011 | 2010 | 2009 G |
Selected Per-Share Data | | | | | |
Net asset value, beginning of period | $ 19.78 | $ 17.98 | $ 17.57 | $ 15.00 | $ 10.88 |
Income from Investment Operations | | | | | |
Net investment income (loss) D | .08 | .14 | .10 | .07 | .06 |
Net realized and unrealized gain (loss) | 5.68 | 1.74 | .47 | 2.63 | 4.06 |
Total from investment operations | 5.76 | 1.88 | .57 | 2.70 | 4.12 |
Distributions from net investment income | (.15) | (.08) | (.11) | (.11) | - |
Distributions from net realized gain | (.08) | - | (.05) | (.02) | - |
Total distributions | (.23) | (.08) | (.16) | (.13) | - |
Redemption fees added to paid in capital D, I | - | - | - | - | - |
Net asset value, end of period | $ 25.31 | $ 19.78 | $ 17.98 | $ 17.57 | $ 15.00 |
Total Return B, C | 29.44% | 10.49% | 3.23% | 18.08% | 37.87% |
Ratios to Average Net Assets E, H | | | | | |
Expenses before reductions | 1.17% | 1.18% | 1.13% | 1.21% | 1.17% A |
Expenses net of fee waivers, if any | 1.17% | 1.18% | 1.13% | 1.21% | 1.17% A |
Expenses net of all reductions | 1.14% | 1.16% | 1.10% | 1.19% | 1.15% A |
Net investment income (loss) | .37% | .77% | .56% | .44% | .62% A |
Supplemental Data | | | | | |
Net assets, end of period (000 omitted) | $ 10,639 | $ 4,291 | $ 3,086 | $ 335 | $ 290 |
Portfolio turnover rate F | 161% | 186% | 203% | 166% | 224% |
A Annualized
B Total returns for periods of less than one year are not annualized.
C Total returns would have been lower if certain expenses had not been reduced during the applicable periods shown.
D Calculated based on average shares outstanding during the period.
E Fees and expenses of any underlying Fidelity Central Funds are not included in the Fund's expense ratio. The Fund indirectly bears its proportionate share of the expenses of any underlying Fidelity Central Funds.
F Amount does not include the portfolio activity of any underlying Fidelity Central Funds.
G For the period February 19, 2009 (commencement of sale of shares) to October 31, 2009.
H Expense ratios reflect operating expenses of the class. Expenses before reductions do not reflect amounts reimbursed by the investment adviser or reductions from brokerage service arrangements or reductions from other expense offset arrangements and do not represent the amount paid by the class during periods when reimbursements or reductions occur. Expense ratios before reductions for start-up periods may not be representative of longer-term operating periods. Expenses net of fee waivers reflect expenses after reimbursement by the investment adviser but prior to reductions from brokerage service arrangements or other expense offset arrangements. Expenses net of all reductions represent the net expenses paid by the class.
I Amount represents less than $.01 per share.
See accompanying notes which are an integral part of the financial statements.
Annual Report
Fidelity Worldwide Fund
Notes to Financial Statements
For the period ended October 31, 2013
1. Organization.
Fidelity Worldwide Fund (the Fund) is a fund of Fidelity Investment Trust (the Trust) and is authorized to issue an unlimited number of shares. The Trust is registered under the Investment Company Act of 1940, as amended (the 1940 Act), as an open-end management investment company organized as a Massachusetts business trust. The Fund offers Class A, Class T, Class C, Worldwide and Institutional Class shares, each of which, along with Class B shares, has equal rights as to assets and voting privileges. Class B shares are closed to new accounts and additional purchases, except for exchanges and reinvestments. Each class has exclusive voting rights with respect to matters that affect that class. Class B shares will automatically convert to Class A shares after a holding period of seven years from the initial date of purchase.
2. Investments in Fidelity Central Funds.
The Fund invests in Fidelity Central Funds, which are open-end investment companies generally available only to other investment companies and accounts managed by Fidelity Management & Research Company (FMR) and its affiliates. The Fund's Schedule of Investments lists each of the Fidelity Central Funds held as of period end, if any, as an investment of the Fund, but does not include the underlying holdings of each Fidelity Central Fund. As an Investing Fund, the Fund indirectly bears its proportionate share of the expenses of the underlying Fidelity Central Funds.
The Money Market Central Funds seek preservation of capital and current income and are managed by Fidelity Investments Money Management, Inc. (FIMM), an affiliate of FMR.
A complete unaudited list of holdings for each Fidelity Central Fund is available upon request or at the Securities and Exchange Commission (the SEC) website at www.sec.gov. In addition, the financial statements of the Fidelity Central Funds, which are not covered by the Fund's Report of Independent Registered Public Accounting Firm, are available on the SEC website or upon request.
3. Significant Accounting Policies.
The financial statements have been prepared in conformity with accounting principles generally accepted in the United States of America (GAAP), which require management to make certain estimates and assumptions at the date of the financial statements. Actual results could differ from those estimates. Subsequent events, if any, through the date that the financial statements were issued have been evaluated in the preparation of the financial statements. The following summarizes the significant accounting policies of the Fund:
Investment Valuation. Investments are valued as of 4:00 p.m. Eastern time on the last calendar day of the period. In accordance with valuation policies and procedures approved by the Board of Trustees (the Board), the Fund attempts to obtain prices from one or more third party pricing vendors or brokers to value its investments. When current market prices, quotations or currency exchange rates are not readily available or reliable, investments will be fair valued in good faith by the FMR Fair Value Committee (the Committee), in accordance with procedures adopted by the Board. Factors used in determining fair value vary by investment type and may include market or investment specific events, changes in interest rates and credit quality. The frequency with which these procedures are used cannot be predicted and they may be utilized to a significant extent. The Committee oversees the Fund's valuation policies and procedures and is responsible for approving and reporting to the Board all fair value determinations.
The Fund categorizes the inputs to valuation techniques used to value its investments into a disclosure hierarchy consisting of three levels as shown below:
Level 1 - quoted prices in active markets for identical investments
Level 2 - other significant observable inputs (including quoted prices for similar investments, interest rates, prepayment speeds, etc.)
Level 3 - unobservable inputs (including the Fund's own assumptions based on the best information available)
Valuation techniques used to value the Fund's investments by major category are as follows:
Equity securities, including restricted securities, for which market quotations are readily available, are valued at the last reported sale price or official closing price as reported by a third party pricing vendor on the primary market or exchange on which they are traded and are categorized as Level 1 in the hierarchy. In the event there were no sales during the day or closing prices are not available, securities are valued at the last quoted bid price or may be valued using the last available price and are generally categorized as Level 2 in the hierarchy. For foreign equity securities, when market or security specific events arise, comparisons to the valuation of American Depositary Receipts (ADRs), futures contracts, Exchange-Traded Funds (ETFs) and certain indexes as well as quoted prices for similar securities may be used and would be categorized as Level 2 in the hierarchy. Utilizing these techniques may result in transfers between Level 1 and Level 2. For equity securities, including restricted securities, where observable inputs are limited, assumptions about market activity and risk are used and these securities may be categorized as Level 3 in the hierarchy.
Debt securities, including restricted securities, are valued based on evaluated prices received from third party pricing vendors or from brokers who make markets in such securities. For corporate bonds and U.S. government and government agency obligations, pricing vendors utilize matrix pricing which considers yield or price of bonds of comparable quality, coupon, maturity and type as well as broker-supplied prices. When independent prices
Annual Report
Fidelity Worldwide Fund
Notes to Financial Statements - continued
3. Significant Accounting Policies - continued
Investment Valuation - continued
are unavailable or unreliable, debt securities may be valued utilizing pricing methodologies which consider similar factors that would be used by third party pricing vendors. Debt securities are generally categorized as Level 2 in the hierarchy but may be Level 3 depending on the circumstances.
Futures contracts are valued at the settlement price established each day by the board of trade or exchange on which they are traded and are categorized as Level 1 in the hierarchy. Investments in open-end mutual funds, including the Fidelity Central Funds, are valued at their closing net asset value (NAV) each business day and are categorized as Level 1 in the hierarchy.
Changes in valuation techniques may result in transfers in or out of an assigned level within the disclosure hierarchy. The aggregate value of investments by input level, as of October 31, 2013, including information on transfers between Levels 1 and 2, is included at the end of the Fund's Schedule of Investments.
Foreign Currency. The Fund may use foreign currency contracts to facilitate transactions in foreign-denominated securities. Gains and losses from these transactions may arise from changes in the value of the foreign currency or if the counterparties do not perform under the contracts' terms.
Foreign-denominated assets, including investment securities, and liabilities are translated into U.S. dollars at the exchange rates at period end. Purchases and sales of investment securities, income and dividends received and expenses denominated in foreign currencies are translated into U.S. dollars at the exchange rate in effect on the transaction date.
The effects of exchange rate fluctuations on investments are included with the net realized and unrealized gain (loss) on investment securities. Other foreign currency transactions resulting in realized and unrealized gain (loss) are disclosed separately.
Investment Transactions and Income. For financial reporting purposes, the Fund's investment holdings and NAV include trades executed through the end of the last business day of the period. The NAV per share for processing shareholder transactions is calculated as of the close of business of the New York Stock Exchange (NYSE), normally 4:00 p.m. Eastern time and includes trades executed through the end of the prior business day. Gains and losses on securities sold are determined on the basis of identified cost and may include proceeds received from litigation. Dividend income is recorded on the ex-dividend date, except for certain dividends from foreign securities where the ex-dividend date may have passed, which are recorded as soon as the Fund is informed of the ex-dividend date. Non-cash dividends included in dividend income, if any, are recorded at the fair market value of the securities received. Distributions received on securities that represent a return of capital or capital gain are recorded as a reduction of cost of investments and/or as a realized gain. Subsequent to ex-dividend date the Fund determines the components of these distributions, based upon receipt of tax filings or other correspondence relating to the underlying investment. Interest income and distributions from the Fidelity Central Funds are accrued as earned. Interest income includes coupon interest and amortization of premium and accretion of discount on debt securities. Investment income is recorded net of foreign taxes withheld where recovery of such taxes is uncertain.
Class Allocations and Expenses. Investment income, realized and unrealized capital gains and losses, common expenses of the Fund, and certain fund-level expense reductions, if any, are allocated daily on a pro-rata basis to each class based on the relative net assets of each class to the total net assets of the Fund. Each class differs with respect to transfer agent and distribution and service plan fees incurred. Certain expense reductions may also differ by class. For the reporting period, the allocated portion of income and expenses to each class as a percent of its average net assets may vary due to the timing of recording these transactions in relation to fluctuating net assets of the classes. Expenses directly attributable to a fund are charged to that fund. Expenses attributable to more than one fund are allocated among the respective funds on the basis of relative net assets or other appropriate methods. Expense estimates are accrued in the period to which they relate and adjustments are made when actual amounts are known.
Income Tax Information and Distributions to Shareholders. Each year, the Fund intends to qualify as a regulated investment company under Subchapter M of the Internal Revenue Code, including distributing substantially all of its taxable income and realized gains. As a result, no provision for U.S. Federal income taxes is required. As of October 31, 2013, the Fund did not have any unrecognized tax benefits in the financial statements; nor is the Fund aware of any tax positions for which it is reasonably possible that the total amounts of unrecognized tax benefits will significantly change in the next twelve months. The Fund files a U.S. federal tax return, in addition to state and local tax returns as required. The Fund's federal income tax returns are subject to examination by the Internal Revenue Service (IRS) for a period of three fiscal years after they are filed. State and local tax returns may be subject to examination for an additional fiscal year depending on the jurisdiction. Foreign taxes are provided for based on the Fund's understanding of the tax rules and rates that exist in the foreign markets in which it invests.
Distributions are declared and recorded on the ex-dividend date. Income dividends and capital gain distributions are declared separately for each class. Income and capital gain distributions are determined in accordance with income tax regulations, which may differ from GAAP. In addition, the Fund claimed a portion of the payment made to redeeming shareholders as a distribution for income tax purposes.
Capital accounts within the financial statements are adjusted for permanent book-tax differences. These adjustments have no impact on net assets or the results of operations. Temporary book-tax differences will reverse in a subsequent period.
Annual Report
3. Significant Accounting Policies - continued
Income Tax Information and Distributions to Shareholders - continued
Book-tax differences are primarily due to futures contracts, foreign currency transactions, passive foreign investment companies (PFIC), partnerships, deferred trustees compensation, and losses deferred due to wash sales.
The federal tax cost of investment securities and unrealized appreciation (depreciation) as of period end were as follows:
Gross unrealized appreciation | $ 303,709,710 |
Gross unrealized depreciation | (8,652,395) |
Net unrealized appreciation (depreciation) on securities and other investments | $ 295,057,315 |
| |
Tax Cost | $ 1,232,612,108 |
The tax-based components of distributable earnings as of period end were as follows:
Undistributed ordinary income | $ 60,493,370 |
Undistributed long-term capital gain | $ 64,735,706 |
Net unrealized appreciation (depreciation) | $ 294,979,703 |
The tax character of distributions paid was as follows:
| October 31, 2013 | October 31, 2012 |
Ordinary Income | $ 9,335,754 | $ 4,089,511 |
Long-term Capital Gain | 3,905,110 | - |
Total | $ 13,240,864 | $ 4,089,511 |
Short-Term Trading (Redemption) Fees. Shares held by investors in the Fund less than 30 days may have been subject to a redemption fee equal to 1.00% of the net asset value of shares redeemed. All redemption fees, which reduce the proceeds of the shareholder redemption, are retained by the Fund and accounted for as an addition to paid in capital.
New Accounting Pronouncement. The Financial Accounting Standards Board issued in December 2011, Accounting Standard Update No. 2011-11, Disclosures about Offsetting Assets and Liabilities, and in January 2013, Accounting Standards Update No. 2013-1 Clarifying the Scope of Disclosures about Offsetting Assets and Liabilities. These updates create new disclosure requirements requiring entities to disclose both gross and net information for derivatives and other financial instruments that are either offset in the Statement of Assets and Liabilities or subject to an enforceable master netting arrangement or similar agreement. The disclosure requirements are effective for annual reporting periods beginning on or after January 1, 2013, and interim periods within those annual periods. Management expects that the impact of the updates' adoption will be limited to additional financial statement disclosures as applicable.
4. Derivative Instruments.
Risk Exposures and the Use of Derivative Instruments. The Fund's investment objective allows the Fund to enter into various types of derivative contracts, including futures contracts. Derivatives are investments whose value is primarily derived from underlying assets, indices or reference rates and may be transacted on an exchange or over-the-counter (OTC). Derivatives may involve a future commitment to buy or sell a specified asset based on specified terms, to exchange future cash flows at periodic intervals based on a notional principal amount, or for one party to make one or more payments upon the occurrence of specified events in exchange for periodic payments from the other party.
The Fund used derivatives to increase returns and to manage exposure to certain risks as defined below. The success of any strategy involving derivatives depends on analysis of numerous economic factors, and if the strategies for investment do not work as intended, the Fund may not achieve its objectives.
The Fund's use of derivatives increased or decreased its exposure to the following risk:
Equity Risk | Equity risk relates to the fluctuations in the value of financial instruments as a result of changes in market prices (other than those arising from interest rate risk or foreign exchange risk), whether caused by factors specific to an individual investment, its issuer, or all factors affecting all instruments traded in a market or market segment. |
Annual Report
Fidelity Worldwide Fund
Notes to Financial Statements - continued
4. Derivative Instruments - continued
Risk Exposures and the Use of Derivative Instruments - continued
The Fund is also exposed to additional risks from investing in derivatives, such as liquidity risk and counterparty credit risk. Liquidity risk is the risk that the Fund will be unable to close out the derivative in the open market in a timely manner. Counterparty credit risk is the risk that the counterparty will not be able to fulfill its obligation to the Fund. Counterparty credit risk related to exchange-traded futures contracts may be mitigated by the protection provided by the exchange on which they trade.
Investing in derivatives may involve greater risks than investing in the underlying assets directly and, to varying degrees, may involve risk of loss in excess of any initial investment and collateral received and amounts recognized in the Statement of Assets and Liabilities. In addition, there may be the risk that the change in value of the derivative contract does not correspond to the change in value of the underlying instrument.
Futures Contracts. A futures contract is an agreement between two parties to buy or sell a specified underlying instrument for a fixed price at a specified future date. The Fund used futures contracts to manage its exposure to the stock market and to fluctuations in currency values.
Upon entering into a futures contract, a fund is required to deposit either cash or securities (initial margin) with a clearing broker in an amount equal to a certain percentage of the face value of the contract. Futures contracts are marked-to-market daily and subsequent daily payments (variation margin) are made or received by a fund depending on the daily fluctuations in the value of the futures contracts and are recorded as unrealized appreciation or (depreciation). This receivable and/or payable, if any, is included in daily variation margin for derivative instruments in the Statement of Assets and Liabilities. Realized gain or (loss) is recorded upon the expiration or closing of a futures contract.
Any open futures contracts at period end are presented in the Schedule of Investments under the caption "Futures Contracts." The underlying face amount at value reflects each contract's exposure to the underlying instrument or index at period end and is representative of activity for the period. Securities deposited to meet initial margin requirements are identified in the Schedule of Investments.
During the period the Fund recognized net realized gain (loss) of $3,571,502 and a change in net unrealized appreciation (depreciation) of $248,032 related to its investment in futures contracts. These amounts are included in the Statement of Operations.
5. Purchases and Sales of Investments.
Purchases and sales of securities, other than short-term securities, aggregated $2,101,815,224 and $2,010,981,925, respectively.
6. Fees and Other Transactions with Affiliates.
Management Fee. FMR and its affiliates provide the Fund with investment management related services for which the Fund pays a monthly management fee. The management fee is the sum of an individual fund fee rate that is based on an annual rate of .45% of the Fund's average net assets and an annualized group fee rate that averaged .25% during the period. The group fee rate is based upon the average net assets of all the mutual funds advised by FMR, including any mutual funds previously advised by FMR that are currently advised by Fidelity SelectCo, LLC, an affiliate of FMR. The group fee rate decreases as assets under management increase and increases as assets under management decrease. In addition, the management fee is subject to a performance adjustment (up to a maximum of ± .20% of the Fund's average net assets over a 36 month performance period). The upward or downward adjustment to the management fee is based on the relative investment performance of Worldwide as compared to an appropriate benchmark index over the same 36 month performance period. For the reporting period, the total annual management fee rate, including the performance adjustment, was .83% of the Fund's average net assets. The performance adjustment included in the management fee rate may be higher or lower than the maximum performance adjustment rate due to the difference between the average net assets for the reporting and performance periods.
Distribution and Service Plan Fees. In accordance with Rule 12b-1 of the 1940 Act, the Fund has adopted separate Distribution and Service Plans for each class of shares. Certain classes pay Fidelity Distributors Corporation (FDC), an affiliate of FMR, separate Distribution and Service Fees, each of which is based on an annual percentage of each class' average net assets. In addition, FDC may pay financial intermediaries for selling shares of the Fund and providing shareholder support services. For the period, the Distribution and Service Fee rates, total fees and amounts retained by FDC were as follows:
| Distribution
Fee | Service
Fee | Total Fees | Retained
by FDC |
Class A | -% | .25% | $ 56,465 | $ 3,136 |
Class T | .25% | .25% | 36,494 | - |
Class B | .75% | .25% | 5,173 | 3,899 |
Class C | .75% | .25% | 58,247 | 12,257 |
| | | $ 156,379 | $ 19,292 |
Annual Report
6. Fees and Other Transactions with Affiliates - continued
Sales Load. FDC may receive a front-end sales charge of up to 5.75% for selling Class A shares and 3.50% for selling Class T shares, some of which is paid to financial intermediaries for selling shares of the Fund. Depending on the holding period, FDC may receive contingent deferred sales charges levied on Class A, Class T, Class B, and Class C redemptions. The deferred sales charges range from 5.00% to 1.00% for Class B shares, 1.00% for Class C shares, 1.00% for certain purchases of Class A shares and .25% for certain purchases of Class T shares.
For the period, sales charge amounts retained by FDC were as follows:
| Retained
by FDC |
Class A | $ 14,423 |
Class T | 2,887 |
Class B* | 453 |
Class C* | 1,575 |
| $ 19,338 |
* When Class B and Class C shares are initially sold, FDC pays commissions from its own resources to financial intermediaries through which the sales are made.
Transfer Agent Fees. Fidelity Investments Institutional Operations Company, Inc., (FIIOC), an affiliate of FMR, is the transfer, dividend disbursing and shareholder servicing agent for each class of the Fund. FIIOC receives account fees and asset-based fees that vary according to the account size and type of account of the shareholders of the respective classes of the Fund. FIIOC pays for typesetting, printing and mailing of shareholder reports, except proxy statements.
For the period, transfer agent fees for each class were as follows:
| Amount | % of
Average
Net Assets |
Class A | $ 67,227 | .30 |
Class T | 22,437 | .31 |
Class B | 1,543 | .30 |
Class C | 15,419 | .26 |
Worldwide | 2,587,472 | .21 |
Institutional Class | 16,965 | .27 |
| $ 2,711,063 | |
Accounting and Security Lending Fees. Fidelity Service Company, Inc. (FSC), an affiliate of FMR, maintains the Fund's accounting records. The accounting fee is based on the level of average net assets for each month. Under a separate contract, FSC administers the security lending program. The security lending fee is based on the number and duration of lending transactions.
Brokerage Commissions. The Fund placed a portion of its portfolio transactions with brokerage firms which are affiliates of the investment adviser. Brokerage commissions are included in net realized gain (loss) and change in net unrealized appreciation (depreciation) in the Statement of Operations. The commissions paid to these affiliated firms were $41,416 for the period.
7. Committed Line of Credit.
The Fund participates with other funds managed by FMR or an affiliate in a $4.25 billion credit facility (the "line of credit") to be utilized for temporary or emergency purposes to fund shareholder redemptions or for other short-term liquidity purposes. The Fund has agreed to pay commitment fees on its pro-rata portion of the line of credit, which amounted to $2,710 and is reflected in Miscellaneous expenses on the Statement of Operations. During the period, there were no borrowings on this line of credit.
8. Security Lending.
The Fund lends portfolio securities through a lending agent from time to time in order to earn additional income. For equity securities, a lending agent is used and may loan securities to certain qualified borrowers, including Fidelity Capital Markets (FCM), a broker-dealer affiliated with the Fund. On the settlement date of the loan, the Fund receives collateral (in the form of U.S. Treasury obligations, letters of credit and/or cash) against the loaned securities and maintains collateral in an amount not less than 100% of the market value of the loaned securities during the period of the loan. The market value of the loaned securities is determined at the close of business of the Fund and any additional required collateral is delivered to the Fund on the next business day. If the borrower defaults on its obligation to return the securities loaned because of insolvency or other reasons, the Fund may apply collateral received from the borrower against the obligation. The Fund may experience delays and costs in recovering the securities loaned. Any
Annual Report
Fidelity Worldwide Fund
Notes to Financial Statements - continued
8. Security Lending - continued
cash collateral received is invested in the Fidelity Securities Lending Cash Central Fund. The value of loaned securities and cash collateral at period end are disclosed on the Fund's Statement of Assets and Liabilities. At period end, there were no security loans outstanding with FCM. Security lending income represents the income earned on investing cash collateral, less rebates paid to borrowers and any lending agent fees associated with the loan, plus any premium payments received for lending certain types of securities. Security lending income is presented in the Statement of Operations as a component of income from Fidelity Central Funds. Total security lending income during the period amounted to $356,949, including $3,404 from securities loaned to FCM.
9. Expense Reductions.
Commissions paid to certain brokers with whom FMR, or its affiliates, places trades on behalf of the Fund include an amount in addition to trade execution, which may be rebated back to the Fund to offset certain expenses. This amount totaled $307,457 for the period.
In addition, through arrangements with the Fund's custodian, credits realized as a result of uninvested cash balances were used to reduce the Fund's expenses. During the period, these credits reduced the Fund's custody expenses by $92.
In addition, FMR reimbursed a portion of the Fund's operating expenses during the period in the amount of $14,422.
10. Distributions to Shareholders.
Distributions to shareholders of each class were as follows:
Years ended October 31, | 2013 | 2012 |
From net investment income | | |
Class A | $ 102,433 | $ 16,598 |
Class T | 21,836 | - |
Class B | - | - |
Class C | - | - |
Worldwide | 8,622,428 | 4,059,519 |
Institutional Class | 32,280 | 13,394 |
Total | $ 8,778,977 | $ 4,089,511 |
From net realized gain | | |
Class A | $ 75,180 | $ - |
Class T | 23,606 | - |
Class B | 1,126 | - |
Class C | 6,545 | - |
Worldwide | 4,338,328 | - |
Institutional Class | 17,102 | - |
Total | $ 4,461,887 | $ - |
11. Share Transactions.
Transactions for each class of shares were as follows:
| Shares | Dollars |
Years ended October 31, | 2013 | 2012 | 2013 | 2012 |
Class A | | | | |
Shares sold | 491,761 | 433,206 | $ 11,054,215 | $ 8,109,308 |
Reinvestment of distributions | 6,945 | 720 | 138,266 | 12,524 |
Shares redeemed | (311,295) | (218,566) | (6,852,432) | (4,053,305) |
Net increase (decrease) | 187,411 | 215,360 | $ 4,340,049 | $ 4,068,527 |
Class T | | | | |
Shares sold | 169,111 | 202,603 | $ 3,777,852 | $ 3,780,147 |
Reinvestment of distributions | 2,272 | - | 45,089 | - |
Shares redeemed | (62,341) | (42,181) | (1,376,268) | (800,428) |
Net increase (decrease) | 109,042 | 160,422 | $ 2,446,673 | $ 2,979,719 |
Class B | | | | |
Shares sold | 20,337 | 4,060 | $ 444,905 | $ 73,532 |
Reinvestment of distributions | 53 | - | 1,043 | - |
Shares redeemed | (7,424) | (2,808) | (167,624) | (51,407) |
Net increase (decrease) | 12,966 | 1,252 | $ 278,324 | $ 22,125 |
Annual Report
11. Share Transactions - continued
| Shares | Dollars |
Years ended October 31, | 2013 | 2012 | 2013 | 2012 |
Class C | | | | |
Shares sold | 396,584 | 38,075 | $ 8,655,233 | $ 696,495 |
Reinvestment of distributions | 325 | - | 6,404 | - |
Shares redeemed | (50,941) | (22,245) | (1,138,699) | (407,626) |
Net increase (decrease) | 345,968 | 15,830 | $ 7,522,938 | $ 288,869 |
Worldwide | | | | |
Shares sold | 11,150,143 | 8,155,382 | $ 252,015,125 | $ 150,136,706 |
Reinvestment of distributions | 628,809 | 226,349 | 12,588,791 | 3,956,581 |
Shares redeemed | (8,612,327) | (15,784,478) | (191,232,967) | (288,554,381) |
Net increase (decrease) | 3,166,625 | (7,402,747) | $ 73,370,949 | $ (134,461,094) |
Institutional Class | | | | |
Shares sold | 275,603 | 111,552 | $ 6,347,280 | $ 2,100,045 |
Reinvestment of distributions | 2,425 | 745 | 48,393 | 12,982 |
Shares redeemed | (74,630) | (67,062) | (1,695,819) | (1,264,501) |
Net increase (decrease) | 203,398 | 45,235 | $ 4,699,854 | $ 848,526 |
12. Other.
The Fund's organizational documents provide former and current trustees and officers with a limited indemnification against liabilities arising in connection with the performance of their duties to the Fund. In the normal course of business, the Fund may also enter into contracts that provide general indemnifications. The Fund's maximum exposure under these arrangements is unknown as this would be dependent on future claims that may be made against the Fund. The risk of material loss from such claims is considered remote.
Annual Report
Report of Independent Registered Public Accounting Firm
To the Trustees of Fidelity Investment Trust and Shareholders of Fidelity Worldwide Fund:
We have audited the accompanying statement of assets and liabilities of Fidelity Worldwide Fund (the Fund), a fund of Fidelity Investment Trust, including the schedule of investments, as of October 31, 2013, and the related statement of operations for the year then ended, the statement of changes in net assets for each of the two years in the period then ended, and the financial highlights for each of the five years in the period then ended. These financial statements and financial highlights are the responsibility of the Fund's management. Our responsibility is to express an opinion on these financial statements and financial highlights based on our audits.
We conducted our audits in accordance with the standards of the Public Company Accounting Oversight Board (United States). Those standards require that we plan and perform the audit to obtain reasonable assurance about whether the financial statements and financial highlights are free of material misstatement. The Fund is not required to have, nor were we engaged to perform, an audit of its internal control over financial reporting. Our audits included consideration of internal control over financial reporting as a basis for designing audit procedures that are appropriate in the circumstances, but not for the purpose of expressing an opinion on the effectiveness of the Fund's internal control over financial reporting. Accordingly, we express no such opinion. An audit also includes examining, on a test basis, evidence supporting the amounts and disclosures in the financial statements, assessing the accounting principles used and significant estimates made by management, as well as evaluating the overall financial statement presentation. Our procedures included confirmation of securities owned as of October 31, 2013, by correspondence with the custodians and brokers; where replies were not received from brokers, we performed other auditing procedures. We believe that our audits provide a reasonable basis for our opinion.
In our opinion, the financial statements and financial highlights referred to above present fairly, in all material respects, the financial position of Fidelity Worldwide Fund as of October 31, 2013, the results of its operations for the year then ended, the changes in its net assets for each of the two years in the period then ended, and the financial highlights for each of the five years in the period then ended, in conformity with accounting principles generally accepted in the United States of America.
DELOITTE & TOUCHE LLP
Boston, Massachusetts
December 13, 2013
Annual Report
The Trustees, Member of the Advisory Board, and executive officers of the trust and fund, as applicable, are listed below. The Board of Trustees governs the fund and is responsible for protecting the interests of shareholders. The Trustees are experienced executives who meet periodically throughout the year to oversee the fund's activities, review contractual arrangements with companies that provide services to the fund, oversee management of the risks associated with such activities and contractual arrangements, and review the fund's performance. Except for James C. Curvey, Ned C. Lautenbach, Ronald P. O'Hanley, and William S. Stavropoulos, each of the Trustees oversees 171 funds. Mr. Curvey oversees 394 funds. Mr. Lautenbach, Mr. O'Hanley, and Mr. Stavropoulos each oversees 245 funds.
The Trustees hold office without limit in time except that (a) any Trustee may resign; (b) any Trustee may be removed by written instrument, signed by at least two-thirds of the number of Trustees prior to such removal; (c) any Trustee who requests to be retired or who has become incapacitated by illness or injury may be retired by written instrument signed by a majority of the other Trustees; and (d) any Trustee may be removed at any special meeting of shareholders by a two-thirds vote of the outstanding voting securities of the trust. Each Trustee who is not an interested person of the trust and the fund (as defined in the 1940 Act) (Independent Trustee), shall retire not later than the last day of the calendar year in which his or her 75th birthday occurs. The Independent Trustees may waive this mandatory retirement age policy with respect to individual Trustees. The executive officers and Advisory Board Member hold office without limit in time, except that any officer and Advisory Board Member may resign or may be removed by a vote of a majority of the Trustees at any regular meeting or any special meeting of the Trustees. Except as indicated, each individual has held the office shown or other offices in the same company for the past five years.
Experience, Skills, Attributes, and Qualifications of the Fund's Trustees. The Governance and Nominating Committee has adopted a statement of policy that describes the experience, qualifications, attributes, and skills that are necessary and desirable for potential Independent Trustee candidates (Statement of Policy). The Board believes that each Trustee satisfied at the time he or she was initially elected or appointed a Trustee, and continues to satisfy, the standards contemplated by the Statement of Policy. The Governance and Nominating Committee also engages professional search firms to help identify potential Independent Trustee candidates who have the experience, qualifications, attributes, and skills consistent with the Statement of Policy. From time to time, additional criteria based on the composition and skills of the current Independent Trustees, as well as experience or skills that may be appropriate in light of future changes to board composition, business conditions, and regulatory or other developments, have also been considered by the professional search firms and the Governance and Nominating Committee. In addition, the Board takes into account the Trustees' commitment and participation in Board and committee meetings, as well as their leadership of standing and ad hoc committees throughout their tenure.
In determining that a particular Trustee was and continues to be qualified to serve as a Trustee, the Board has considered a variety of criteria, none of which, in isolation, was controlling. The Board believes that, collectively, the Trustees have balanced and diverse experience, qualifications, attributes, and skills, which allow the Board to operate effectively in governing the fund and protecting the interests of shareholders. Information about the specific experience, skills, attributes, and qualifications of each Trustee, which in each case led to the Board's conclusion that the Trustee should serve (or continue to serve) as a trustee of the fund, is provided below.
Board Structure and Oversight Function. James C. Curvey is an interested person (as defined in the 1940 Act) and currently serves as Chairman. The Trustees have determined that an interested Chairman is appropriate and benefits shareholders because an interested Chairman has a personal and professional stake in the quality and continuity of services provided to the fund. Independent Trustees exercise their informed business judgment to appoint an individual of their choosing to serve as Chairman, regardless of whether the Trustee happens to be independent or a member of management. The Independent Trustees have determined that they can act independently and effectively without having an Independent Trustee serve as Chairman and that a key structural component for assuring that they are in a position to do so is for the Independent Trustees to constitute a substantial majority for the Board. The Independent Trustees also regularly meet in executive session. Ned C. Lautenbach serves as Chairman of the Independent Trustees and as such (i) acts as a liaison between the Independent Trustees and management with respect to matters important to the Independent Trustees and (ii) with management prepares agendas for Board meetings.
Fidelity funds are overseen by different Boards of Trustees. The fund's Board oversees Fidelity's equity and high income funds and another Board oversees Fidelity's investment-grade bond, money market, and asset allocation funds. The asset allocation funds may invest in Fidelity funds overseen by the fund's Board. The use of separate Boards, each with its own committee structure, allows the Trustees of each group of Fidelity funds to focus on the unique issues of the funds they oversee, including common research, investment, and operational issues. On occasion, the separate Boards establish joint committees to address issues of overlapping consequences for the Fidelity funds overseen by each Board.
The Trustees operate using a system of committees to facilitate the timely and efficient consideration of all matters of importance to the Trustees, the fund, and fund shareholders and to facilitate compliance with legal and regulatory requirements and oversight of the fund's activities and associated risks. The Board, acting through its committees, has charged FMR and its affiliates with (i) identifying events or circumstances the occurrence of which could have demonstrably adverse effects on the funds business and/or reputation; (ii) implementing processes and controls to lessen the possibility that such events or circumstances occur or to mitigate the effects of such events or circumstances if they do occur; and (iii) creating and maintaining a system designed to evaluate continuously business and market conditions in order to facilitate the identification and implementation processes described in (i) and (ii) above. Because the day-to-day operations and activities of the fund are carried out by or through FMR, its affiliates and other service providers, the fund's exposure to risks is mitigated but not eliminated by the processes overseen by the Trustees. While each of the Board's committees has responsibility for overseeing different aspects of the fund's activities, oversight is exercised primarily through the Operations, Audit, and Compliance Committees. In addition, the Independent Trustees have worked with FMR to enhance the Board's oversight of investment and financial risks, legal and regulatory risks, technology risks, and operational risks, including the development of additional risk reporting to the Board. For example, a working group comprised of Independent Trustees and FMR has worked and continues to work to review the Fidelity funds' valuation-related activities, reporting and risk management. Appropriate personnel, including but not limited to the fund's Chief Compliance Officer (CCO), FMR's internal auditor, the independent accountants, the fund's Treasurer and portfolio management personnel, make periodic reports to the Board's committees, as appropriate, including an annual review of FMR's risk management program for the Fidelity funds. The responsibilities of each standing committee, including their oversight responsibilities, are described further under "Standing Committees of the Fund's Trustees."
Annual Report
Trustees and Officers - continued
The fund's Statement of Additional Information (SAI) includes more information about the Trustees. To request a free copy, call Fidelity at 1-877-208-0098.
Interested Trustees*:
Correspondence intended for each Trustee who is an interested person may be sent to Fidelity Investments, 245 Summer Street, Boston, Massachusetts 02210.
Name, Year of Birth; Principal Occupations and Other Relevant Experience+ |
James C. Curvey (1935) |
Year of Election or Appointment: 2007 Trustee Chairman of the Board of Trustees |
| Mr. Curvey also serves as Trustee of other Fidelity funds. Mr. Curvey is a Director of Fidelity Investments Money Management, Inc. (2009-present), Director of Fidelity Research & Analysis Co. (2009-present) and Director of FMR and FMR Co., Inc. (2007-present). Mr. Curvey is also Vice Chairman (2007-present) and Director of FMR LLC. In addition, Mr. Curvey serves as an Overseer for the Boston Symphony Orchestra and a member of the Trustees of Villanova University. Previously, Mr. Curvey was the Vice Chairman (2006-2007) and Director (2000-2007) of FMR Corp. |
Ronald P. O'Hanley (1957) |
Year of Election or Appointment: 2011 Trustee |
| Mr. O'Hanley also serves as Trustee of other Fidelity funds. He is Director of Fidelity SelectCo, LLC (2013-present), FMR Co., Inc. (2010-present), Director of Fidelity Investments Money Management, Inc. (2010-present), Director of Fidelity Research & Analysis Company (2010-present), President of Fidelity Asset Management and Corporate Services and a Member of Fidelity's Executive Committee (2010-present). Previously, Mr. O'Hanley served as President and Chief Executive Officer of BNY Mellon Asset Management (2007-2010). Mr. O'Hanley also served as Vice Chairman of Bank New York Mellon Corp. and a member of that firm's Executive Committee. Prior to the 2007 merger of The Bank of New York and Mellon Financial Corporation, he was Vice Chairman of Mellon Financial Corporation and President and Chief Executive Officer of Mellon Asset Management. He joined Mellon in February 1997. Mr. O'Hanley currently serves as Chairman of the Boston Public Library Foundation Board of Directors and sits on the Board of Directors of Beth Israel Deaconess Medical Center, the Board of Trustees of the Marine Biological Laboratory and the Advisory Board of the Maxwell School of Citizenship and Public Administration at Syracuse University. Mr. O'Hanley also chairs the Council on Asset Management for the Financial Services Roundtable and is a member of the Board of Directors of Institutional Investor's U.S. Institute. |
* Trustees have been determined to be "Interested Trustees" by virtue of, among other things, their affiliation with the trust or various entities under common control with FMR.
+ The information above includes each Trustee's principal occupation during the last five years and other information relating to the experience, attributes, and skills relevant to each Trustee's qualifications to serve as a Trustee, which led to the conclusion that each Trustee should serve as a Trustee for the fund.
Annual Report
Independent Trustees:
Correspondence intended for each Independent Trustee (that is, the Trustees other than the Interested Trustees) may be sent to Fidelity Investments, P.O. Box 55235, Boston, Massachusetts 02205-5235.
Name, Year of Birth; Principal Occupations and Other Relevant Experience+ |
Dennis J. Dirks (1948) |
Year of Election or Appointment: 2005 Trustee |
| Mr. Dirks also serves as Trustee of other Fidelity funds. Prior to his retirement in May 2003, Mr. Dirks was Chief Operating Officer and a member of the Board of The Depository Trust & Clearing Corporation (DTCC). He also served as President, Chief Operating Officer, and Board member of The Depository Trust Company (DTC) and President and Board member of the National Securities Clearing Corporation (NSCC). In addition, Mr. Dirks served as Chief Executive Officer and Board member of the Government Securities Clearing Corporation, Chief Executive Officer and Board member of the Mortgage-Backed Securities Clearing Corporation, as a Trustee and a member of the Finance Committee of Manhattan College (2005-2008), and as a Trustee and a member of the Finance Committee of AHRC of Nassau County (2006-2008). Mr. Dirks is a member of the Independent Directors Council (IDC) Governing Council (2010-present) and Board of Directors for The Brookville Center for Children's Services, Inc. (2009-present). |
Alan J. Lacy (1953) |
Year of Election or Appointment: 2008 Trustee |
| Mr. Lacy also serves as Trustee of other Fidelity funds. Mr. Lacy serves as Senior Adviser (2007-present) of Oak Hill Capital Partners, L.P. (private equity). Mr. Lacy also served as Chief Executive Officer (2000-2005) and Vice Chairman (2005-2006) of Sears Holdings Corporation and Sears, Roebuck and Co. (retail). In addition, Mr. Lacy serves as a member of the Board of Directors of Dave & Buster's Entertainment, Inc. (restaurant and entertainment complexes, 2010-present), Earth Fare, Inc. (retail grocery, 2012-present), The Hillman Companies, Inc. (hardware wholesalers, 2010-present), and Bristol-Myers Squibb Company (global pharmaceuticals, 2008-present). Mr. Lacy is a member of the Board of Trustees of The National Parks Conservation Association (2006-present). Previously, Mr. Lacy served as Chairman of the Board of Trustees of the National Parks Conservation Association (2008-2011) and as a member of the Board of Directors for the Western Union Company (global money transfer, 2006-2011). |
Ned C. Lautenbach (1944) |
Year of Election or Appointment: 2000 Trustee Chairman of the Independent Trustees |
| Mr. Lautenbach also serves as Trustee of other Fidelity funds. Mr. Lautenbach currently serves as the Lead Director of the Eaton Corporation Board of Directors (diversified industrial, 1997-present). Mr. Lautenbach is Chairman of the Board of Directors of the Philharmonic Center for the Arts in Naples, Florida (2012-present) and a member of the Council on Foreign Relations (1994-present). Previously, Mr. Lautenbach was a Partner/Advisory Partner at Clayton, Dubilier & Rice, LLC (private equity investment, 1998-2010), as well as a Director of Sony Corporation (2006-2007). |
Joseph Mauriello (1944) |
Year of Election or Appointment: 2008 Trustee |
| Mr. Mauriello also serves as Trustee of other Fidelity funds. Prior to his retirement in January 2006, Mr. Mauriello served in numerous senior management positions including Deputy Chairman and Chief Operating Officer (2004-2005), and Vice Chairman of Financial Services (2002-2004) of KPMG LLP US (professional services, 1965-2005). Mr. Mauriello currently serves as a member of the Board of Directors of XL Group plc. (global insurance and re-insurance, 2006-present). Previously, Mr. Mauriello served as a Director of the Hamilton Funds of the Bank of New York (2006-2007) and of Arcadia Resources Inc. (health care services and products, 2007-2012). |
Robert W. Selander (1950) |
Year of Election or Appointment: 2011 Trustee |
| Mr. Selander also serves as Trustee of other Fidelity funds. Previously, Mr. Selander served as a Member of the Advisory Board of other Fidelity funds (2011), and Executive Vice Chairman (2010), Chief Executive Officer (2009-2010), and President and Chief Executive Officer (1997-2009) of Mastercard, Inc. |
Cornelia M. Small (1944) |
Year of Election or Appointment: 2005 Trustee |
| Ms. Small also serves as Trustee of other Fidelity funds. Ms. Small is a member of the Board of Directors (2009-present) and Chair of the Investment Committee (2010-present) of the Teagle Foundation. Ms. Small also serves on the Investment Committee of the Berkshire Taconic Community Foundation (2008-present). Previously, Ms. Small served as Chairperson (2002-2008) and a member of the Investment Committee and Chairperson (2008-2012) and a member of the Board of Trustees of Smith College. In addition, Ms. Small served as Chief Investment Officer, Director of Global Equity Investments, and a member of the Board of Directors of Scudder, Stevens & Clark and Scudder Kemper Investments. |
William S. Stavropoulos (1939) |
Year of Election or Appointment: 2001 Trustee Vice Chairman of the Independent Trustees |
| Mr. Stavropoulos also serves as Trustee of other Fidelity funds. Mr. Stavropoulos serves as President and Founder of the Michigan Baseball Foundation, the Great Lakes Loons (2007-present). Mr. Stavropoulos is Chairman Emeritus of the Board of Directors of The Dow Chemical Company, where he previously served in numerous senior management positions, including President, CEO (1995-2000; 2002-2004), Chairman of the Executive Committee (2000-2006), and as a member of the Board of Directors (1990-2006). Currently, Mr. Stavropoulos is Chairman of the Board of Directors of Univar Inc. (global distributor of commodity and specialty chemicals), a Director of Teradata Corporation (data warehousing and technology solutions), and Maersk Inc. (industrial conglomerate), and a member of the Advisory Board for Metalmark Capital LLC (private equity investment, 2005-present). Mr. Stavropoulos is an operating advisor to Clayton, Dubilier & Rice, LLC (private equity investment). In addition, Mr. Stavropoulos is a member of the University of Notre Dame Advisory Council for the College of Science, a Trustee of the Rollin L. Gerstacker Foundation, and a Director of the Naples Philharmonic Center for the Arts. Previously, Mr. Stavropoulos served as a Director of Chemical Financial Corporation (bank holding company, 1993-2012) and Tyco International, Ltd. (multinational manufacturing and services, 2007-2012). |
David M. Thomas (1949) |
Year of Election or Appointment: 2008 Trustee |
| Mr. Thomas also serves as Trustee of other Fidelity funds. Mr. Thomas serves as Non-Executive Chairman of the Board of Directors of Fortune Brands Home and Security (home and security products, 2011-present), and as a member of the Board of Directors of Interpublic Group of Companies, Inc. (marketing communication, 2004-present). Previously, Mr. Thomas served as Executive Chairman (2005-2006) and Chairman and Chief Executive Officer (2000-2005) of IMS Health, Inc. (pharmaceutical and healthcare information solutions), and a Director of Fortune Brands, Inc. (consumer products, 2000-2011). |
+ The information above includes each Trustee's principal occupation during the last five years and other information relating to the experience, attributes, and skills relevant to each Trustee's qualifications to serve as a Trustee, which led to the conclusion that each Trustee should serve as a Trustee for the fund.
Advisory Board Member and Executive Officers:
Correspondence intended for each executive officer and Peter S. Lynch may be sent to Fidelity Investments, 245 Summer Street, Boston, Massachusetts 02210. Executive officers appear below in alphabetical order.
Name, Year of Birth; Principal Occupation |
Peter S. Lynch (1944) |
Year of Election or Appointment: 2003 Member of the Advisory Board |
| Mr. Lynch also serves as Member of the Advisory Board of other Fidelity funds. Mr. Lynch is Vice Chairman and a Director of FMR and FMR Co., Inc. In addition, Mr. Lynch serves as a Trustee of Boston College and as the Chairman of the Inner-City Scholarship Fund. Previously, Mr. Lynch served on the Special Olympics International Board of Directors (1997-2006). |
Elizabeth Paige Baumann (1968) |
Year of Election or Appointment: 2012 Anti-Money Laundering (AML) Officer |
| Ms. Baumann also serves as AML Officer of other funds. She is Chief AML Officer of FMR LLC (2012-present) and is an employee of Fidelity Investments. Previously, Ms. Baumann served as Vice President and Deputy Anti-Money Laundering Officer (2007-2012). |
William C. Coffey (1969) |
Year of Election or Appointment: 2009 Assistant Secretary |
| Mr. Coffey also serves as Assistant Secretary of other funds. He is Senior Vice President and Deputy General Counsel of FMR LLC (2010-present), and is an employee of Fidelity Investments. Previously, Mr. Coffey served as Vice President and Associate General Counsel of FMR LLC (2005-2009). |
Jonathan Davis (1968) |
Year of Election or Appointment: 2010 Assistant Treasurer |
| Mr. Davis also serves as Assistant Treasurer of other funds. Mr. Davis is an employee of Fidelity Investments. Previously, Mr. Davis served as Vice President and Associate General Counsel of FMR LLC (2003-2010). |
Adrien E. Deberghes (1967) |
Year of Election or Appointment: 2008 Deputy Treasurer |
| Mr. Deberghes also serves as an officer of other funds. He is an employee of Fidelity Investments (2008-present). Prior to joining Fidelity Investments, Mr. Deberghes was Senior Vice President of Mutual Fund Administration at State Street Corporation (2007-2008), Senior Director of Mutual Fund Administration at Investors Bank & Trust (2005-2007), and Director of Finance for Dunkin' Brands (2000-2005). |
Stephanie J. Dorsey (1969) |
Year of Election or Appointment: 2010 Assistant Treasurer |
| Ms. Dorsey also serves as an officer of other funds. She is an employee of Fidelity Investments (2008-present) and has served in other fund officer roles. Prior to joining Fidelity Investments, Ms. Dorsey served as Treasurer (2004-2008) of the JPMorgan Mutual Funds and Vice President (2004-2008) of JPMorgan Chase Bank. |
Scott C. Goebel (1968) |
Year of Election or Appointment: 2008 Secretary and Chief Legal Officer (CLO) |
| Mr. Goebel serves as Secretary and CLO of other funds. Mr. Goebel also serves as Secretary of Fidelity Investments Money Management, Inc. (FIMM) (2010-present) and Fidelity Research and Analysis Company (FRAC) (2010-present); General Counsel, Secretary, and Senior Vice President of FMR (2008-present) and FMR Co., Inc. (2008-present); Chief Legal Officer of Fidelity Management & Research (Hong Kong) Limited (2008-present) and Assistant Secretary of Fidelity Management & Research (Japan) Inc. (2008-present), and Fidelity Management & Research (U.K.) Inc. (2008-present). Previously, Mr. Goebel served as Secretary and CLO of other Fidelity funds (2008-2013), Assistant Secretary of FIMM (2008-2010), FRAC (2008-2010), and certain funds (2007-2008); and as Vice President and Secretary of Fidelity Distributors Corporation (FDC) (2005-2007). Mr. Goebel has been employed by FMR LLC or an affiliate since 2001. |
Joseph A. Hanlon (1968) |
Year of Election or Appointment: 2012 Chief Compliance Officer |
| Mr. Hanlon also serves as Chief Compliance Officer of other funds. Mr. Hanlon serves as Compliance Officer of FMR, FMR Co., Inc., Fidelity Investments Money Management, Inc. (FIMM), Fidelity Research and Analysis Company (FRAC), and Fidelity Management & Research (Hong Kong) (2009-present), as Senior Vice President of the Fidelity Asset Management Division (2009-present), and is an employee of Fidelity Investments. Previously, Mr. Hanlon served as Compliance Officer of Fidelity Management & Research (Japan) Inc. (2009-2013), Strategic Advisers, Inc. (2009-2013), and Fidelity Management & Research (U.K.) Inc. (2009-2013). |
Bruce T. Herring (1965) |
Year of Election or Appointment: 2006 Vice President of certain Equity Funds |
| Mr. Herring also serves as Vice President of other funds. He serves as Chief Investment Officer of Fidelity Global Asset Allocation (GAA) (2013-present), Chief Investment Officer and Director of Fidelity Management & Research (U.K.) Inc. (2010-present), Group Chief Investment Officer of FMR, and President of Fidelity Research & Analysis Company (2010-present). Previously, Mr. Herring served as Vice President (2005-2006) and Senior Vice President (2006-2007) of Fidelity Management & Research Company, Vice President of FMR Co., Inc. (2001-2007), and as a portfolio manager for Fidelity U.S. Equity Funds. |
Brian B. Hogan (1964) |
Year of Election or Appointment: 2009 Vice President |
| Mr. Hogan also serves as Vice President of other funds. Mr. Hogan serves as President of FMR's Equity Division (2009-present). Previously, Mr. Hogan served as Senior Vice President, Equity Research of FMR (2006-2009) and as a portfolio manager. |
Chris Maher (1972) |
Year of Election or Appointment: 2013 Assistant Treasurer |
| Mr. Maher serves as Assistant Treasurer of other funds. Mr. Maher is Vice President of Valuation Oversight and is an employee of Fidelity Investments. Previously, Mr. Maher served as Vice President of Asset Management Compliance (2013), Vice President of FMR's Program Management Group (2010-2013), and Vice President of Valuation Oversight (2008-2010). |
Christine Reynolds (1958) |
Year of Election or Appointment: 2008 Chief Financial Officer |
| Ms. Reynolds also serves as Chief Financial Officer of other funds. Ms. Reynolds became President of Fidelity Pricing and Cash Management Services (FPCMS) in August 2008. Ms. Reynolds served as Chief Operating Officer of FPCMS (2007-2008). Previously, Ms. Reynolds served as President, Treasurer, and Anti-Money Laundering officer of the Fidelity funds (2004-2007). |
Kenneth B. Robins (1969) |
Year of Election or Appointment: 2008 President and Treasurer |
| Mr. Robins also serves as an officer of other funds. Mr. Robins serves as Executive Vice President of Fidelity Investments Money Management, Inc. (FIMM) (2013-present) and is an employee of Fidelity Investments (2004-present). Previously, Mr. Robins served in other fund officer roles. |
Gary W. Ryan (1958) |
Year of Election or Appointment: 2005 Assistant Treasurer |
| Mr. Ryan also serves as Assistant Treasurer of other funds. Mr. Ryan is an employee of Fidelity Investments and has served in other fund officer roles. Previously, Mr. Ryan served as Vice President of Fund Reporting in Fidelity Pricing and Cash Management Services (FPCMS) (1999-2005). |
Stephen Sadoski (1971) |
Year of Election or Appointment: 2012 Deputy Treasurer |
| Mr. Sadoski also serves as Deputy Treasurer of other funds. He is an employee of Fidelity Investments (2012-present) and has served in another fund officer role. Prior to joining Fidelity Investments, Mr. Sadoski served as an assistant chief accountant in the Division of Investment Management of the Securities and Exchange Commission (SEC) (2009-2012) and as a senior manager at Deloitte & Touche LLP (1997-2009). |
Stacie M. Smith (1974) |
Year of Election or Appointment: 2013 Deputy Treasurer |
| Ms. Smith also serves as an officer of other funds. She is an employee of Fidelity Investments (2009-present) and has served in other fund officer roles. Prior to joining Fidelity Investments, Ms. Smith served as Senior Audit Manager of Ernst & Young LLP (1996-2009). |
Renee Stagnone (1975) |
Year of Election or Appointment: 2013 Deputy Treasurer |
| Ms. Stagnone also serves as Deputy Treasurer of other funds. Ms. Stagnone is an employee of Fidelity Investments. |
Joseph F. Zambello (1957) |
Year of Election or Appointment: 2011 Deputy Treasurer |
| Mr. Zambello also serves as Deputy Treasurer of other funds. Mr. Zambello is an employee of Fidelity Investments. Previously, Mr. Zambello served as Vice President of FMR's Program Management Group (2009-2011) and Vice President of the Transfer Agent Oversight Group (2005-2009). |
Annual Report
The Board of Trustees of Fidelity Worldwide voted to pay to shareholders of record at the opening of business on record date, the following distributions per share derived from capital gains realized from sales of portfolio securities, and dividends derived from net investment income:
| Pay Date | Record Date | Dividends | Capital Gains |
Class A | 12/9/13 | 12/6/13 | $0.044 | $1.979 |
Class T | 12/9/13 | 12/6/13 | $0.000 | $1.979 |
Class B | 12/9/13 | 12/6/13 | $0.000 | $1.891 |
Class C | 12/9/13 | 12/6/13 | $0.000 | $1.950 |
The fund hereby designates as a capital gain dividend with respect to the taxable year ended October 31, 2013, $66,159,543, or, if subsequently determined to be different, the net capital gain of such year.
Class A designates 92%, and Class T designates 100% of the dividends distributed during the fiscal year as qualifying for the dividends-received deduction for corporate shareholders.
Class A and Class T designate 100% of the dividends distributed during the fiscal year as amounts which may be taken into account as a dividend for purposes of the maximum rate under section 1(h)(11) of the Internal Revenue Code.
The funds will notify shareholders in January 2014 of amounts for use in preparing 2013 income tax returns.
Annual Report
Board Approval of Investment Advisory Contracts and Management Fees
Fidelity Worldwide Fund
Each year, the Board of Trustees, including the Independent Trustees (together, the Board), votes on the renewal of the management contract and sub-advisory agreements (together, the Advisory Contracts) for the fund. The Board, assisted by the advice of fund counsel and Independent Trustees' counsel, requests and considers a broad range of information relevant to the renewal of the Advisory Contracts throughout the year.
The Board meets regularly and, at each of its meetings, covers an extensive agenda of topics and materials and considers factors that are relevant to its annual consideration of the renewal of the fund's Advisory Contracts, including the services and support provided to the fund and its shareholders. The Board has established various standing committees, each composed of and chaired by Independent Trustees with varying backgrounds, to which the Board has assigned specific subject matter responsibilities in order to enhance effective decision-making by the Board. The Board, acting directly and through its Committees, requests and receives information concerning the annual consideration of the renewal of the fund's Advisory Contracts. The Board also meets as needed to consider matters specifically related to the Board's annual consideration of the renewal of Advisory Contracts. Members of the Board may also meet with trustees of other Fidelity funds through ad hoc joint committees to discuss certain matters relevant to the Fidelity funds.
At its July 2013 meeting, the Board, including the Independent Trustees, unanimously determined to renew the fund's Advisory Contracts. In reaching its determination, the Board considered all factors it believed relevant, including (i) the nature, extent, and quality of the services to be provided to the fund and its shareholders (including the investment performance of the fund); (ii) the competitiveness of the fund's management fee and total expense ratio relative to peer funds; (iii) the total costs of the services to be provided by and the profits to be realized by Fidelity from its relationship with the fund; (iv) the extent to which economies of scale exist and would be realized as the fund grows; and (v) whether fee levels reflect these economies of scale, if any, for the benefit of fund shareholders.
In considering whether to renew the Advisory Contracts for the fund, the Board reached a determination, with the assistance of fund counsel and Independent Trustees' counsel and through the exercise of its business judgment, that the renewal of the Advisory Contracts was in the best interests of the fund and its shareholders and that the compensation payable under the Advisory Contracts was fair and reasonable. The Board's decision to renew the Advisory Contracts was not based on any single factor, but rather was based on a comprehensive consideration of all the information provided to the Board at its meetings throughout the year. The Board, in reaching its determination to renew the Advisory Contracts, was aware that shareholders in the fund have a broad range of investment choices available to them, including a wide choice among mutual funds offered by Fidelity's competitors, and that the fund's shareholders, who have the opportunity to review and weigh the disclosure provided by the fund in its prospectus and other public disclosures, have chosen to invest in this fund, which is a part of the Fidelity family of funds.
Nature, Extent, and Quality of Services Provided. The Board considered the staffing within the investment adviser, Fidelity Management & Research Company (FMR), and the sub-advisers (together, the Investment Advisers) as it relates to the fund, including the backgrounds of the fund's investment personnel, and also considered the fund's investment objective, strategies, and related investment philosophy. The Independent Trustees also had discussions with senior management of Fidelity's investment operations and investment groups. The Board considered the structure of the portfolio manager compensation program and whether this structure provides appropriate incentives to act in the best interests of the fund.
Resources Dedicated to Investment Management and Support Services. The Board and the Fund Oversight and Research Committees reviewed the general qualifications and capabilities of the Investment Advisers' investment staff, including its size, education, experience, and resources, as well as the Investment Advisers' approach to recruiting, training, managing, and compensating investment personnel. The Board noted that FMR has continued to increase the resources devoted to non-U.S. offices, including expansion of Fidelity's global investment organization. The Board also noted that Fidelity's analysts have extensive resources, tools and capabilities that allow them to conduct sophisticated quantitative and fundamental analysis, as well as credit analysis of issuers, counterparties and guarantors. Further, the Board believes that Fidelity's investment professionals have sufficient access to global information and data so as to provide competitive investment results over time, and that those professionals also have access to sophisticated tools that permit them to assess portfolio construction and risk and performance attribution characteristics continuously, as well as to transmit new information and research conclusions rapidly around the world. Additionally, in its deliberations, the Board considered the Investment Advisers' trading and risk management capabilities and resources, which are an integral part of the investment management process.
Shareholder and Administrative Services. The Board considered (i) the nature, extent, quality, and cost of advisory, administrative, and shareholder services performed by the Investment Advisers and their affiliates under the Advisory Contracts and under separate agreements covering transfer agency, pricing and bookkeeping, and securities lending services for the fund; (ii) the nature and extent of the supervision of third party service providers, principally custodians and subcustodians; and (iii) the resources devoted to, and the record of compliance with, the fund's compliance policies and procedures. The Board also reviewed the allocation of fund brokerage, including allocations to brokers affiliated with the Investment Advisers, the use of brokerage commissions to pay fund expenses, and the use of "soft" commission dollars to pay for research services.
The Board noted that the growth of fund assets over time across the complex allows Fidelity to reinvest in the development of services designed to enhance the value or convenience of the Fidelity funds as investment vehicles. These services include 24-hour access to account information and market information through telephone representatives and over the Internet, investor education materials and asset allocation tools, and the expanded availability of Fidelity Investor Centers.
Annual Report
Board Approval of Investment Advisory Contracts and Management Fees - continued
Investment in a Large Fund Family. The Board considered the benefits to shareholders of investing in a Fidelity fund, including the benefits of investing in a fund that is part of a large family of funds offering a variety of investment disciplines and providing a large variety of mutual fund investor services. The Board noted that Fidelity had taken, or had made recommendations that resulted in the Fidelity funds taking, a number of actions over the previous year that benefited particular funds, including (i) continuing to dedicate additional resources to investment research and to the support of the senior management team that oversees asset management; (ii) persisting in efforts to enhance Fidelity's global research capabilities; (iii) launching new funds and making other enhancements to meet client needs for global and income-oriented solutions; (iv) continuing to launch dedicated lower cost underlying funds to meet portfolio construction needs related to expanding underlying fund options for Fidelity funds of funds, specifically for the Freedom Fund product lines; (v) rationalizing product lines and gaining increased efficiencies through the mergers of several funds into other funds; (vi) strengthening Fidelity's index fund offerings by reducing investment minimums and adopting or lowering existing expense caps for certain funds and classes; (vii) enhancing Global Asset Allocation product offerings by launching new funds and strategies, including "open architecture" target date funds that utilize affiliated and unaffiliated sub-advisers; (viii) modifying the eligibility criteria for Institutional Class shares of Advisor funds to increase their marketability to a portion of the defined contribution plan market; (ix) creating a new low-cost retirement share class for certain Advisor funds to appeal to large retirement plans; (x) transitioning the management of certain Fidelity commodity funds to Geode Capital Management LLC, a registered commodity pool operator, while retaining administrative responsibilities for the funds; (xi) reorganizing a number of funds; and (xii) taking steps toward establishing a new Fidelity adviser to manage sector-based funds and products.
Investment Performance. The Board considered whether the fund has operated in accordance with its investment objective, as well as its record of compliance with its investment restrictions and its performance history.
The Board took into account discussions with the Investment Advisers about fund investment performance that occur at Board meetings throughout the year. In this regard the Board noted that as part of regularly scheduled fund reviews and other reports to the Board on fund performance, the Board periodically considers annualized return information for the fund, for different time periods, measured against a securities market index ("benchmark index") and a peer group of mutual funds with similar objectives ("peer group"). In its evaluation of fund investment performance, the Board gave particular attention to information indicating changes in performance of certain Fidelity funds for specific time periods and the Investment Advisers' explanations for any overperformance or underperformance.
In addition to reviewing absolute and relative fund performance, the Independent Trustees periodically consider the appropriateness of fund performance metrics in evaluating the results achieved. In general, the Independent Trustees believe that fund performance should be evaluated based on net performance (after fees and expenses) of both the highest performing and lowest performing classes, where applicable, compared to appropriate benchmark indices, over appropriate time periods which may include full market cycles, and compared to peer groups, as applicable, over the same periods, taking into account relevant factors including the following: general market conditions; issuer-specific information; tactical opportunities for investment; and fund cash flows and other factors.
The Independent Trustees recognize that shareholders evaluate performance on a net basis over their own holding periods, for which one-, three-, and five-year periods are used as a proxy. For this reason, the performance information reviewed by the Board also included net cumulative calendar year total return information for the fund and an appropriate benchmark index and peer group for the most recent one-, three-, and five-year periods, as shown below. Returns are shown compared to the 25th percentile (top of box) and 75th percentile (bottom of box) of the peer universe. Returns of the benchmark index are "net MA," i.e., adjusted for tax withholding rates applicable to U.S.-based mutual funds organized as Massachusetts business trusts.
Annual Report
Fidelity Worldwide Fund
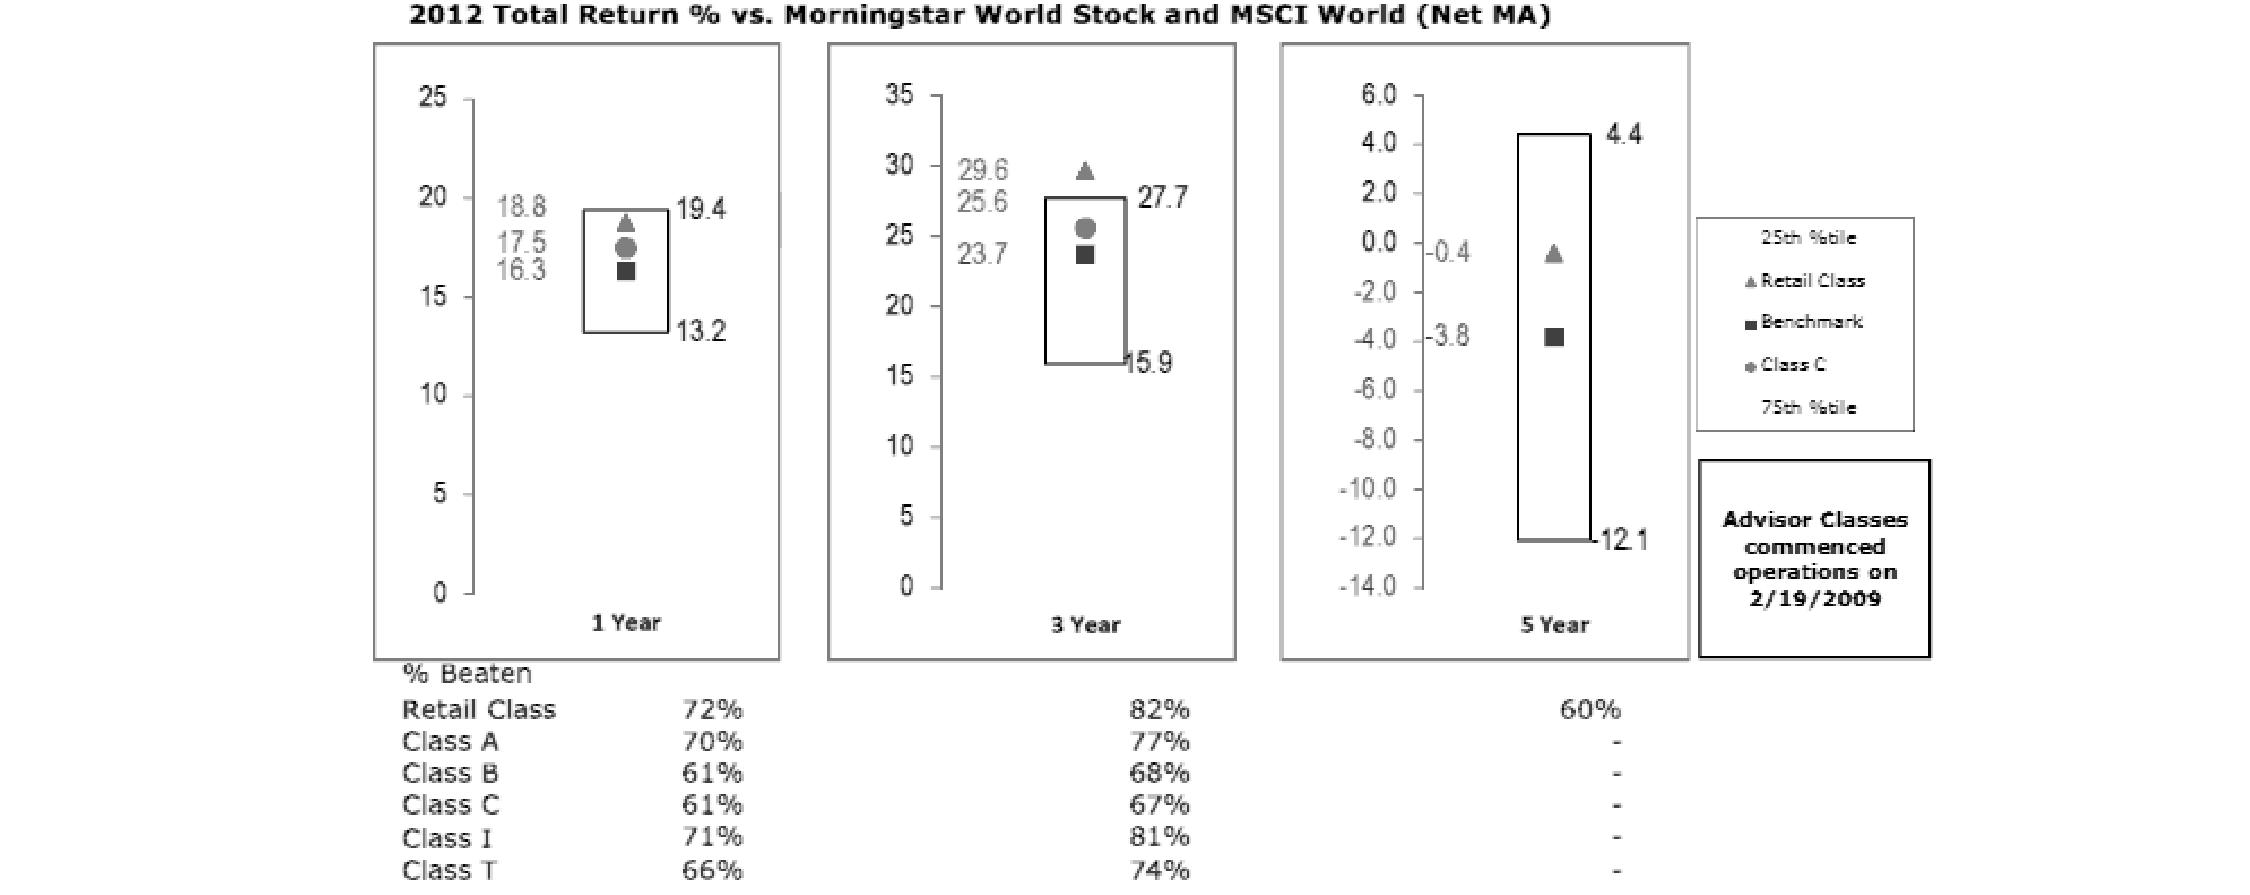
The Board also considered that the fund's management fee is subject to upward or downward adjustment depending upon whether, and to what extent, the fund's investment performance for the performance period exceeds, or is exceeded by, a securities index, thus leading to a performance adjustment for the same period. The Board noted that the performance adjustment provides FMR with a strong economic incentive to seek to achieve superior performance for the fund's shareholders and helps to more closely align the interests of FMR and the fund's shareholders.
Based on its review, the Board concluded that the nature, extent, and quality of services provided to the fund under the Advisory Contracts should benefit the fund's shareholders.
Competitiveness of Management Fee and Total Expense Ratio. The Board considered the fund's management fee and total expense ratio compared to "mapped groups" of competitive funds and classes. Fidelity creates "mapped groups" by combining similar Lipper investment objective categories that have comparable management fee characteristics. Combining Lipper investment objective categories aids the Board's management fee and total expense ratio comparisons by broadening the competitive group used for comparison and by reducing the number of universes to which various Fidelity funds are compared.
Management Fee. The Board considered two proprietary management fee comparisons for the 12-month periods shown in the chart below. The group of Lipper funds used by the Board for management fee comparisons is referred to below as the "Total Mapped Group." The Total Mapped Group comparison focuses on a fund's standing in terms of gross management fees before expense reimbursements or caps, and without giving effect to the fund's performance adjustment, relative to the total universe of funds with comparable investment mandates, regardless of whether their management fee structures also are comparable. Funds with comparable investment mandates offer exposure to similar types of securities. Funds with comparable management fee structures have similar management fee contractual arrangements (e.g., flat rate charged for advisory services, all-inclusive fee rate, etc.). "TMG %" represents the percentage of funds in the Total Mapped Group that had management fees that were lower than the fund's. For example, a TMG % of 16% means that 84% of the funds in the Total Mapped Group had higher management fees than the fund. The "Asset-Size Peer Group" (ASPG) comparison focuses on a fund's standing relative to a subset of non-Fidelity funds within the Total Mapped Group that are similar in size and management fee structure. The ASPG represents at least 15% of the funds in the Total Mapped Group with comparable asset size and management fee structures, subject to a minimum of 50 funds (or all funds in the Total Mapped Group if fewer than 50). Additional information, such as the ASPG quartile in which the fund's management fee ranked and the impact of the fund's performance adjustment, is also included in the chart and considered by the Board.
Annual Report
Board Approval of Investment Advisory Contracts and Management Fees - continued
Fidelity Worldwide Fund
The Board noted that the fund's management fee ranked below the median of its Total Mapped Group and below the median of its ASPG for 2012. The Board also noted the effect of the fund's positive performance adjustment on the fund's management fee ranking.
Based on its review, the Board concluded that the fund's management fee is fair and reasonable in light of the services that the fund receives and the other factors considered.
Total Expense Ratio. In its review of each class's total expense ratio, the Board considered the fund's management fee as well as other fund or class expenses, as applicable, such as transfer agent fees, pricing and bookkeeping fees, fund-paid 12b-1 fees, and custodial, legal, and audit fees. The Board also noted the effects of any waivers and reimbursements on fees and expenses, as well as the impact of the fund's performance adjustment. As part of its review, the Board also considered the current and historical total expense ratios of each class of the fund compared to competitive fund median expenses. Each class of the fund is compared to those funds and classes in the Total Mapped Group (used by the Board for management fee comparisons) that have a similar sales load structure.
The Board noted that the total expense ratio of each of Class A, Class B, and the retail class ranked below its competitive median for 2012 and the total expense ratio of each of Class T, Class C, and Institutional Class ranked above its competitive median for 2012. The Board considered that, in general, various factors can affect total expense ratios. The Board noted that the total expense ratio of Class T was above the competitive median primarily because of higher 12b-1 fees on Class T. Class T has a higher 12b-1 fee, but a lower front-end sales charge, than traditionally priced front-end sales charge classes. The Board considered that Class T is primarily sold load-waived in the retirement plan market where its 0.50% 12b-1 fee is comparable to competing no-load, higher 12b-1 fee classes designed specifically for retirement plans. The Board noted that the fund offers multiple classes, each of which has a different sales load and 12b-1 fee structure, and that the multiple structures are intended to offer a range of pricing options for the intermediary market. The Board also noted that the total expense ratios of the classes vary primarily by the level of their 12b-1 fees, although differences in transfer agent fees may also cause expenses to vary from class to class.
Fees Charged to Other Fidelity Clients. The Board also considered Fidelity fee structures and other information with respect to clients of FMR and its affiliates, such as other mutual funds advised or subadvised by FMR or its affiliates, pension plan clients, and other institutional clients. The Board noted the findings of the 2013 ad hoc joint committee (created with the board of other Fidelity funds), which reviewed and compared Fidelity's institutional investment advisory business with its business of providing services to the Fidelity funds, including the differences in services provided, fees charged, and costs incurred, as well as competition in their respective marketplaces.
Based on its review of total expense ratios and fees charged to other Fidelity clients, the Board concluded that the total expense ratio of each class of the fund was reasonable, although in some cases above the median of the universe presented for comparison, in light of the services that the fund and its shareholders receive and the other factors considered.
Costs of the Services and Profitability. The Board considered the revenues earned and the expenses incurred by Fidelity in conducting the business of developing, marketing, distributing, managing, administering and servicing the fund and servicing the fund's shareholders. The Board also considered the level of Fidelity's profits in respect of all the Fidelity funds.
Annual Report
On an annual basis, FMR presents to the Board Fidelity's profitability for the fund. Fidelity calculates the profitability for each fund, as well as aggregate profitability for groups of Fidelity funds and all Fidelity funds, using a series of detailed revenue and cost allocation methodologies which originate with the books and records of Fidelity on which Fidelity's audited financial statements are based. The Audit Committee of the Board reviews any significant changes from the prior year's methodologies.
PricewaterhouseCoopers LLP (PwC), independent registered public accounting firm and auditor to Fidelity and certain Fidelity funds, has been engaged annually by the Board as part of the Board's assessment of Fidelity's profitability analysis. PwC's engagement includes the review and assessment of the methodologies used by Fidelity in determining the revenues and expenses attributable to Fidelity's mutual fund business, and completion of agreed-upon procedures surrounding the mathematical accuracy of fund profitability and its conformity to allocation methodologies. After considering PwC's reports issued under the engagement and information provided by Fidelity, the Board concluded that while other allocation methods may also be reasonable, Fidelity's profitability methodologies are reasonable in all material respects.
The Board also reviewed Fidelity's non-fund businesses and fall-out benefits related to the mutual fund business as well as cases where Fidelity's affiliates may benefit from or be related to the fund's business.
The Board considered the costs of the services provided by and the profits realized by Fidelity in connection with the operation of the fund and was satisfied that the profitability was not excessive in the circumstances.
Economies of Scale. The Board considered whether there have been economies of scale in respect of the management of the Fidelity funds, whether the Fidelity funds (including the fund) have appropriately benefited from any such economies of scale, and whether there is potential for realization of any further economies of scale. The Board considered the extent to which the fund will benefit from economies of scale through increased services to the fund, through waivers or reimbursements, or through fee or expense reductions. The Board also noted that in 2009, it and the board of other Fidelity funds created an ad hoc committee (the Economies of Scale Committee) to analyze whether FMR attains economies of scale in respect of the management and servicing of the Fidelity funds, whether the Fidelity funds have appropriately benefited from such economies of scale, and whether there is potential for realization of any further economies of scale.
The Board recognized that the fund's management contract incorporates a "group fee" structure, which provides for lower group fee rates as total fund assets under FMR's management increase, and for higher group fee rates as total fund assets under FMR's management decrease. FMR calculates the group fee rates based on a tiered asset "breakpoint" schedule that varies based on asset class. The Board considered that the group fee is designed to deliver the benefits of economies of scale to fund shareholders when total Fidelity fund assets increase, even if assets of any particular fund are unchanged or have declined, because some portion of Fidelity's costs are attributable to services provided to all Fidelity funds, and all funds benefit if those costs can be allocated among more assets. The Board concluded that, given the group fee structure, fund shareholders will benefit from lower management fees as assets under FMR's management increase at the fund complex level, regardless of whether Fidelity achieves any such economies of scale.
The Board concluded, taking into account the analysis of the Economies of Scale Committee, that economies of scale, if any, are being appropriately shared between fund shareholders and Fidelity.
Amendment to Description of Group Fee Rate. At its July 2013 meeting, the Board voted to approve an amendment to the fund's management contract to modify the description of the "group fee rate" effective August 1, 2013. The Board noted that under the prior description in the contract, the group fee rate was based on the average net assets of all registered investment companies with which FMR has management contracts. Under the contract's tiered asset breakpoint schedule, the group fee rate is lower as total fund assets under FMR's management increase, and higher as total fund assets under FMR's management decrease. The Board considered that the prior description would have excluded the assets of 64 Fidelity sector funds from the group fee rate calculation once Fidelity SelectCo, LLC, an affiliate of FMR, assumed management responsibilities for those funds. The Board noted that modifying the description of the group fee rate to continue to include the assets of those 64 funds for purposes of determining group fee rate breakpoints would avoid an immediate adverse impact on the group fee rate for any fund.
Additional Information Requested by the Board. In order to develop fully the factual basis for consideration of the Fidelity funds' Advisory Contracts, the Board requested and received additional information on certain topics, including: (i) fund performance trends and Fidelity's long-term strategies for certain funds; (ii) the potential to further rationalize the Fidelity fund lineup with the possibility of achieving savings for the funds and Fidelity; (iii) the methodology with respect to competitive fund data and peer group classifications; (iv) the arrangements with, and performance of, certain sub-advisers on behalf of the Fidelity funds, as well as certain proposed participating affiliate arrangements; (v) the realization of fall-out benefits in certain Fidelity business units; (vi) Fidelity's group fee structures, including the rationale for the individual fee rates of certain categories of funds and the definition of group assets; (vii) trends regarding industry use of performance fee structures and the performance adjustment methodologies applicable to the Fidelity funds; (viii) additional competitive analysis regarding the total expenses for certain classes; and (ix) fund profitability methodology, including Fidelity's cost allocation methodology, and the impact of certain factors on fund profitability results.
Based on its evaluation of all of the conclusions noted above, and after considering all factors it believed relevant, the Board ultimately concluded that the advisory fee structures are fair and reasonable, and that the fund's Advisory Contracts should be renewed.
Annual Report
Investment Adviser
Fidelity Management & Research Company
Boston, MA
Investment Sub-Advisers
FMR Co., Inc.
Fidelity Management & Research
(U.K.) Inc.
FIL Investments (Japan) Limited
FIL Investment Advisors
FIL Investment Advisors
(UK) Limited
Fidelity Management & Research
(Hong Kong) Limited
Fidelity Management & Research
(Japan) Inc.
General Distributor
Fidelity Distributors Corporation
Smithfield, RI
Transfer and Service Agents
Fidelity Investments Institutional
Operations Company, Inc.
Boston, MA
Fidelity Service Company, Inc.
Boston, MA
Custodian
JPMorgan Chase Bank
New York, NY
(Fidelity Investment logo)(registered trademark)
Corporate Headquarters
245 Summer St., Boston, MA 02210
www.fidelity.com
AWLD-UANN-1213
1.883445.104
(Fidelity Investment logo)(registered trademark)
Fidelity Advisor®
Worldwide Fund
Institutional Class
Annual Report
October 31, 2013
(Fidelity Cover Art)
Institutional Class is a class of
Fidelity® Worldwide Fund
Contents
Performance | 3 | How the fund has done over time. |
Management's Discussion of Fund Performance | 80 | The Portfolio Managers' review of fund performance and strategy. |
Shareholder Expense Example | 81 | An example of shareholder expenses. |
Investment Changes | 81 | A summary of major shifts in the fund's investments over the past six months. |
Investments | 83 | A complete list of the fund's investments with their market values. |
Financial Statements | 93 | Statements of assets and liabilities, operations, and changes in net assets, as well as financial highlights. |
Notes | 103 | Notes to the financial statements. |
Report of Independent Registered Public Accounting Firm | 110 | |
Trustees and Officers | 110 | |
Distributions | 116 | |
Board Approval of Investment Advisory Contracts and Management Fees | 117 | |
To view a fund's proxy voting guidelines and proxy voting record for the 12-month period ended June 30, visit http://www.fidelity.com/proxyvotingresults or visit the Securities and Exchange Commission's (SEC) web site at http://www.sec.gov. You may also call 1-877-208-0098 to request a free copy of the proxy voting guidelines.
Standard & Poor's, S&P and S&P 500 are registered service marks of The McGraw-Hill Companies, Inc. and have been licensed for use by Fidelity Distributors Corporation.
Other third-party marks appearing herein are the property of their respective owners.
All other marks appearing herein are registered or unregistered trademarks or service marks of FMR LLC or an affiliated company. © 2013 FMR LLC. All rights reserved.
This report and the financial statements contained herein are submitted for the general information of the shareholders of the fund. This report is not authorized for distribution to prospective investors in the fund unless preceded or accompanied by an effective prospectus.
A fund files its complete schedule of portfolio holdings with the SEC for the first and third quarters of each fiscal year on Form N-Q. Forms N-Q are available on the SEC's web site at http://www.sec.gov. A fund's Forms N-Q may be reviewed and copied at the SEC's Public Reference Room in Washington, DC. Information regarding the operation of the SEC's Public Reference Room may be obtained by calling 1-800-SEC-0330. For a complete list of a fund's portfolio holdings, view the most recent holdings listing, semiannual report, or annual report on Fidelity's web site at http://www.fidelity.com, http://www.advisor.fidelity.com, or http://www.401k.com, as applicable.
NOT FDIC INSURED • MAY LOSE VALUE • NO BANK GUARANTEE
Neither the fund nor Fidelity Distributors Corporation is a bank.
Annual Report
Performance: The Bottom Line
Average annual total return reflects the change in the value of an investment, assuming reinvestment of the class' distributions from dividend income and capital gains (the profits earned upon the sale of securities that have grown in value, if any) and assuming a constant rate of performance each year. The $10,000 table and the fund's returns do not reflect the deduction of taxes that a shareholder would pay on fund distributions or the redemption of fund shares. During periods of reimbursement by Fidelity, a fund's total return will be greater than it would be had the reimbursement not occurred. How a fund did yesterday is no guarantee of how it will do tomorrow.
Average Annual Total Returns
Periods ended October 31, 2013 | Past 1
year | Past 5
years | Past 10
years |
Institutional Class A | 29.44% | 14.63% | 8.99% |
A The initial offering of Institutional Class took place on February 19, 2009. Returns prior to February 19, 2009 are those of Fidelity® Worldwide Fund, the original class of the fund.
$10,000 Over 10 Years
Let's say hypothetically that $10,000 was invested in Fidelity Advisor® Worldwide Fund - Institutional Class, on October 31, 2003. The chart shows how the value of your investment would have changed, and also shows how the MSCI® World Index performed over the same period. See footnote A above for additional information regarding the performance of Institutional Class.

Annual Report
Management's Discussion of Fund Performance
Market Recap: On balance, global equity markets remained upbeat for the 12-month period ending October 31, 2013. The MSCI® ACWI® (All Country World Index) Index gained 23.75% for the period, amid investor preference for higher-risk assets. The period was not without turbulence, however. In the spring and summer, central banks worldwide, especially in the U.S. and China, made clear their intentions to maintain accommodative monetary policies. That stance, combined with modest cyclical improvements around the globe and generally low valuations, underpinned the broad rally in equities. Europe (+32%) shone brightly, with most markets in the region - large and small - registering solid, index-beating gains. Another bright spot was Japan, which, despite a struggling yen and taking a second-half breather, posted a 34% result for the full year. The U.S. - by far the index's biggest constituent - also outperformed the global market with a roughly 28% advance. Meanwhile, Asia-Pacific ex Japan (+14%) lagged, hurt in part by a slowdown in Australia's mining industry as well as currency headwinds. Foreign-exchange and commodity weakness also curbed results in resource-heavy Canada and emerging markets (EM), both of which were up 7%. Country-level EM performance diverged meaningfully for the period, as evidenced by performance in Brazil (-1%), Russia (+12%), India (+1%) and China (+8%).
Comments from William Kennedy, Lead Portfolio Manager of Fidelity Advisor® Worldwide Fund and manager of its non-U.S. equity subportfolio, and Co-Portfolio Manager Stephen DuFour, who manages the fund's U.S. equity subportfolio: For the year, the fund's Institutional Class shares returned 29.44%, versus 26.29% for the MSCI® World Index. Security selection that focused on companies with above-average earnings growth, good balance sheets and reasonable share prices drove the fund's performance relative to the index. Regionally, investment choices in the U.S. helped the most, while among sectors, energy and information technology stood out. Winners included U.S. natural gas exploration & production company Pioneer Natural Resources, whose huge share-price gain was fueled by the company's expanded oil production and rising oil prices. The fund's number one contributor was U.S. biotechnology company Gilead Sciences, whose stock soared as the company neared approval for its promising new hepatitis C treatment. In the information technology sector, an investment in electronic-payment processor MasterCard took off, thanks to higher transaction volumes that were the result of increasing numbers of consumers worldwide shopping online and choosing to pay with debit and credit instead of cash or checks. By contrast, investments in the consumer discretionary sector detracted, as did a small stake in emerging markets, positioning in core European countries and a modest cash position. Individual disappointments included cellular-tower operator American Tower, which saw slowing growth prospects in the U.S. pressure its return. We sold the position before period end. Untimely ownership of biotechnology leader Amgen also hurt. We exited soon after the company announced an acquisition that we thought would take some time to pay off, but the stock continued to rise.
The views expressed above reflect those of the portfolio manager(s) only through the end of the period as stated on the cover of this report and do not necessarily represent the views of Fidelity or any other person in the Fidelity organization. Any such views are subject to change at any time based upon market or other conditions and Fidelity disclaims any responsibility to update such views. These views may not be relied on as investment advice and, because investment decisions for a Fidelity fund are based on numerous factors, may not be relied on as an indication of trading intent on behalf of any Fidelity fund.
Annual Report
Fidelity Worldwide Fund
Shareholder Expense Example
As a shareholder of the Fund, you incur two types of costs: (1) transaction costs, including sales charges (loads) on purchase payments or redemption proceeds, redemption fees and (2) ongoing costs, including management fees, distribution and/or service (12b-1) fees and other Fund expenses. This Example is intended to help you understand your ongoing costs (in dollars) of investing in the Fund and to compare these costs with the ongoing costs of investing in other mutual funds.
The Example is based on an investment of $1,000 invested at the beginning of the period and held for the entire period (May 1, 2013 to October 31, 2013).
Actual Expenses
The first line of the accompanying table for each class of the Fund provides information about actual account values and actual expenses. You may use the information in this line, together with the amount you invested, to estimate the expenses that you paid over the period. Simply divide your account value by $1,000.00 (for example, an $8,600 account value divided by $1,000.00 = 8.6), then multiply the result by the number in the first line for a class of the Fund under the heading entitled "Expenses Paid During Period" to estimate the expenses you paid on your account during this period. A small balance maintenance fee of $12.00 that is charged once a year may apply for certain accounts with a value of less than $2,000. This fee is not included in the table below. If it was, the estimate of expenses you paid during the period would be higher, and your ending account value lower, by this amount. In addition, the Fund, as a shareholder in the underlying Fidelity Central Funds, will indirectly bear its pro-rata share of the fees and expenses incurred by the underlying Fidelity Central Funds. These fees and expenses are not included in the Fund's annualized expense ratio used to calculate the expense estimate in the table below.
Hypothetical Example for Comparison Purposes
The second line of the accompanying table for each class of the Fund provides information about hypothetical account values and hypothetical expenses based on a Class' actual expense ratio and an assumed rate of return of 5% per year before expenses, which is not the Class' actual return. The hypothetical account values and expenses may not be used to estimate the actual ending account balance or expenses you paid for the period. You may use this information to compare the ongoing costs of investing in the Fund and other funds. To do so, compare this 5% hypothetical example with the 5% hypothetical examples that appear in the shareholder reports of the other funds. A small balance maintenance fee of $12.00 that is charged once a year may apply for certain accounts with a value of less than $2,000. This fee is not included in the table below. If it was, the estimate of expenses you paid during the period would be higher, and your ending account value lower, by this amount. In addition, the Fund, as a shareholder in the underlying Fidelity Central Funds, will indirectly bear its pro-rata share of the fees and expenses incurred by the underlying Fidelity Central Funds. These fees and expenses are not included in the Fund's annualized expense ratio used to calculate the expense estimate in the table below.
Please note that the expenses shown in the table are meant to highlight your ongoing costs only and do not reflect any transaction costs. Therefore, the second line of the table is useful in comparing ongoing costs only, and will not help you determine the relative total costs of owning different funds. In addition, if these transactional costs were included, your costs would have been higher.
| Annualized
Expense Ratio B | Beginning
Account Value
May 1, 2013 | Ending
Account Value
October 31, 2013 | Expenses Paid
During Period*
May 1, 2013
to October 31, 2013 |
Class A | 1.44% | | | |
Actual | | $ 1,000.00 | $ 1,123.10 | $ 7.71 |
Hypothetical A | | $ 1,000.00 | $ 1,017.95 | $ 7.32 |
Class T | 1.71% | | | |
Actual | | $ 1,000.00 | $ 1,121.80 | $ 9.15 |
Hypothetical A | | $ 1,000.00 | $ 1,016.59 | $ 8.69 |
Class B | 2.20% | | | |
Actual | | $ 1,000.00 | $ 1,119.00 | $ 11.75 |
Hypothetical A | | $ 1,000.00 | $ 1,014.12 | $ 11.17 |
Class C | 2.18% | | | |
Actual | | $ 1,000.00 | $ 1,119.20 | $ 11.64 |
Hypothetical A | | $ 1,000.00 | $ 1,014.22 | $ 11.07 |
Worldwide | 1.10% | | | |
Actual | | $ 1,000.00 | $ 1,125.30 | $ 5.89 |
Hypothetical A | | $ 1,000.00 | $ 1,019.66 | $ 5.60 |
Institutional Class | 1.16% | | | |
Actual | | $ 1,000.00 | $ 1,124.90 | $ 6.21 |
Hypothetical A | | $ 1,000.00 | $ 1,019.36 | $ 5.90 |
A 5% return per year before expenses
B Annualized expense ratio reflects expenses net of applicable fee waivers.
* Expenses are equal to each Class' annualized expense ratio, multiplied by the average account value over the period, multiplied by 184/365 (to reflect the one-half year period).
Annual Report
Fidelity Worldwide Fund
Investment Changes (Unaudited)
Geographic Diversification (% of fund's net assets) |
As of October 31, 2013 |
| United States of America* | 52.6% | |
| Japan | 8.4% | |
| United Kingdom | 7.2% | |
| France | 4.9% | |
| Germany | 4.0% | |
| Ireland | 3.3% | |
| Switzerland | 3.1% | |
| Sweden | 1.9% | |
| Spain | 1.7% | |
| Other | 12.9% | |

* Includes Short-Term Investments and Net Other Assets (Liabilities). |
Percentages are based on country or territory of incorporation and are adjusted for the effect of futures contracts, if applicable. |
As of April 30, 2013 |
| United States of America* | 50.3% | |
| Japan | 10.1% | |
| United Kingdom | 7.6% | |
| France | 4.4% | |
| Germany | 3.7% | |
| Switzerland | 3.0% | |
| Ireland | 2.9% | |
| Canada | 2.1% | |
| Australia | 1.8% | |
| Other | 14.1% | |

* Includes Short-Term Investments and Net Other Assets (Liabilities). |
Percentages are based on country or territory of incorporation and are adjusted for the effect of futures contracts, if applicable. |
Asset Allocation as of October 31, 2013 |
| % of fund's
net assets | % of fund's net assets
6 months ago |
Stocks and Equity Futures | 97.2 | 97.3 |
Bonds | 0.1 | 0.1 |
Short-Term Investments and Net Other Assets (Liabilities) | 2.7 | 2.6 |
Top Ten Stocks as of October 31, 2013 |
| % of fund's
net assets | % of fund's net assets
6 months ago |
MasterCard, Inc. Class A (United States of America, IT Services) | 2.8 | 2.6 |
Cabot Oil & Gas Corp. (United States of America, Oil, Gas & Consumable Fuels) | 2.3 | 2.2 |
McGraw-Hill Companies, Inc. (United States of America, Diversified Financial Services) | 2.2 | 0.0 |
Bank of America Corp. (United States of America, Diversified Financial Services) | 2.2 | 1.4 |
Google, Inc. Class A (United States of America, Internet Software & Services) | 2.0 | 2.5 |
Pioneer Natural Resources Co. (United States of America, Oil, Gas & Consumable Fuels) | 2.0 | 1.0 |
Visa, Inc. Class A (United States of America, IT Services) | 1.9 | 0.7 |
Cummins, Inc. (United States of America, Machinery) | 1.9 | 0.1 |
Gilead Sciences, Inc. (United States of America, Biotechnology) | 1.8 | 1.3 |
Actavis PLC (Ireland, Pharmaceuticals) | 1.6 | 0.2 |
| 20.7 | |
Market Sectors as of October 31, 2013 |
| % of fund's
net assets | % of fund's net assets
6 months ago |
Financials | 19.6 | 20.0 |
Information Technology | 15.6 | 12.5 |
Health Care | 14.1 | 13.1 |
Consumer Discretionary | 12.6 | 15.0 |
Industrials | 12.2 | 10.5 |
Energy | 8.9 | 5.7 |
Consumer Staples | 6.3 | 10.2 |
Materials | 5.4 | 6.1 |
Telecommunication Services | 2.0 | 2.1 |
Utilities | 0.2 | 1.1 |
Annual Report
Fidelity Worldwide Fund
Investments October 31, 2013
Showing Percentage of Net Assets
Common Stocks - 96.1% |
| Shares | | Value |
Australia - 1.5% |
Ansell Ltd. | 142,537 | | $ 2,625,670 |
Australia & New Zealand Banking Group Ltd. | 392,333 | | 12,548,330 |
Ramsay Health Care Ltd. | 105,887 | | 3,883,069 |
Woodside Petroleum Ltd. | 89,610 | | 3,287,856 |
TOTAL AUSTRALIA | | 22,344,925 |
Austria - 0.1% |
Andritz AG | 28,200 | | 1,737,152 |
Bailiwick of Jersey - 1.2% |
Experian PLC | 368,600 | | 7,505,868 |
Wolseley PLC | 90,926 | | 4,900,027 |
WPP PLC | 245,700 | | 5,219,909 |
TOTAL BAILIWICK OF JERSEY | | 17,625,804 |
Belgium - 1.0% |
Anheuser-Busch InBev SA NV | 71,611 | | 7,423,464 |
KBC Groupe SA | 141,183 | | 7,696,402 |
TOTAL BELGIUM | | 15,119,866 |
Bermuda - 0.1% |
Cheung Kong Infrastructure Holdings Ltd. | 310,000 | | 2,157,165 |
Brazil - 0.1% |
Arezzo Industria e Comercio SA | 63,900 | | 955,562 |
British Virgin Islands - 0.3% |
Luxoft Holding, Inc. | 57,700 | | 1,685,994 |
Mail.Ru Group Ltd. GDR (Reg. S) | 73,000 | | 2,692,240 |
Michael Kors Holdings Ltd. (a) | 11,000 | | 846,450 |
TOTAL BRITISH VIRGIN ISLANDS | | 5,224,684 |
Canada - 0.5% |
Canadian Pacific Railway Ltd. | 3,000 | | 428,830 |
Constellation Software, Inc. | 9,700 | | 1,767,053 |
InterOil Corp. (a)(d) | 10,500 | | 729,225 |
Suncor Energy, Inc. | 123,400 | | 4,484,368 |
TOTAL CANADA | | 7,409,476 |
Cayman Islands - 0.7% |
58.com, Inc. ADR | 4,000 | | 96,480 |
Baidu.com, Inc. sponsored ADR (a) | 20,300 | | 3,266,270 |
Cimc Enric Holdings Ltd. | 1,020,000 | | 1,436,657 |
ENN Energy Holdings Ltd. | 314,000 | | 1,860,996 |
Eurasia Drilling Co. Ltd. GDR (Reg. S) | 43,500 | | 1,842,225 |
Greatview Aseptic Pack Co. Ltd. | 1,799,000 | | 1,132,351 |
Sands China Ltd. | 90,400 | | 642,466 |
Youku Tudou, Inc. ADR (a)(d) | 27,400 | | 746,376 |
TOTAL CAYMAN ISLANDS | | 11,023,821 |
Cyprus - 0.0% |
SPDI Secure Property Development & Investment PLC (a) | 31,822 | | 35,844 |
|
| Shares | | Value |
Denmark - 0.2% |
Novo Nordisk A/S Series B | 22,916 | | $ 3,816,720 |
Finland - 0.4% |
Raisio Group PLC (V Shares) | 139,000 | | 809,640 |
Sampo Oyj (A Shares) | 107,000 | | 5,068,793 |
TOTAL FINLAND | | 5,878,433 |
France - 4.9% |
Arkema SA | 29,430 | | 3,341,337 |
Atos Origin SA | 24,326 | | 2,076,840 |
AXA SA | 327,500 | | 8,181,802 |
BNP Paribas SA | 93,030 | | 6,889,028 |
Bureau Veritas SA | 86,700 | | 2,618,024 |
Danone SA | 56,400 | | 4,182,641 |
Edenred SA | 73,500 | | 2,497,361 |
Havas SA | 344,900 | | 2,873,415 |
Iliad SA | 12,793 | | 2,925,057 |
Kering SA | 22,350 | | 5,078,355 |
Lafarge SA (Bearer) | 37,800 | | 2,616,444 |
LVMH Moet Hennessy - Louis Vuitton SA | 33,006 | | 6,354,611 |
Sanofi SA | 53,719 | | 5,727,694 |
Schneider Electric SA | 84,600 | | 7,127,414 |
Technip SA | 11,800 | | 1,236,055 |
Total SA | 173,600 | | 10,650,877 |
TOTAL FRANCE | | 74,376,955 |
Germany - 3.3% |
Aareal Bank AG (a) | 63,891 | | 2,457,137 |
adidas AG | 33,400 | | 3,812,931 |
BASF AG | 77,939 | | 8,109,115 |
Bayer AG | 91,200 | | 11,335,105 |
Brenntag AG | 27,600 | | 4,676,743 |
GEA Group AG | 75,747 | | 3,296,198 |
GSW Immobilien AG | 28,483 | | 1,324,543 |
HeidelbergCement Finance AG | 53,600 | | 4,225,340 |
KION Group AG (a) | 45,449 | | 1,851,251 |
LEG Immobilien AG | 19,100 | | 1,089,187 |
Siemens AG | 68,079 | | 8,699,973 |
TOTAL GERMANY | | 50,877,523 |
Hong Kong - 0.8% |
AIA Group Ltd. | 1,263,600 | | 6,413,345 |
Techtronic Industries Co. Ltd. | 2,334,000 | | 5,870,373 |
TOTAL HONG KONG | | 12,283,718 |
India - 0.3% |
Housing Development Finance Corp. Ltd. | 256,407 | | 3,557,718 |
United Spirits Ltd. | 27,317 | | 1,141,082 |
TOTAL INDIA | | 4,698,800 |
Indonesia - 0.0% |
PT Tower Bersama Infrastructure Tbk | 990,500 | | 500,849 |
Ireland - 3.3% |
Actavis PLC (a) | 153,200 | | 23,681,656 |
Common Stocks - continued |
| Shares | | Value |
Ireland - continued |
Alkermes PLC (a) | 84,000 | | $ 2,955,960 |
Bank of Ireland (a) | 8,957,800 | | 3,260,264 |
Eaton Corp. PLC | 96,000 | | 6,773,760 |
Greencore Group PLC | 509,900 | | 1,472,450 |
James Hardie Industries PLC CDI | 365,087 | | 3,771,527 |
Kerry Group PLC Class A | 58,400 | | 3,739,835 |
Trinity Biotech PLC sponsored ADR | 193,741 | | 4,843,525 |
TOTAL IRELAND | | 50,498,977 |
Italy - 0.5% |
De Longhi SpA | 141,700 | | 2,193,282 |
Moleskine SpA | 397,400 | | 971,226 |
Tod's SpA | 7,333 | | 1,221,648 |
UniCredit SpA | 225,700 | | 1,697,701 |
World Duty Free SpA (a) | 159,397 | | 1,765,998 |
TOTAL ITALY | | 7,849,855 |
Japan - 8.0% |
ABC-MART, Inc. | 48,600 | | 2,430,533 |
Aozora Bank Ltd. | 983,000 | | 2,857,615 |
ARNEST ONE Corp. | 41,000 | | 1,124,133 |
Astellas Pharma, Inc. | 47,400 | | 2,642,379 |
Cosmos Pharmaceutical Corp. | 12,200 | | 1,486,333 |
Daikin Industries Ltd. | 67,300 | | 3,871,997 |
Don Quijote Co. Ltd. | 109,500 | | 7,289,030 |
Hajime Construction Co. Ltd. | 4,500 | | 310,282 |
Harmonic Drive Systems, Inc. | 64,400 | | 1,386,409 |
Hitachi Ltd. | 313,000 | | 2,189,469 |
Japan Exchange Group, Inc. | 159,500 | | 3,708,080 |
Japan Tobacco, Inc. | 273,400 | | 9,892,619 |
Kakaku.com, Inc. | 123,200 | | 2,382,853 |
KDDI Corp. | 129,000 | | 6,986,187 |
Keyence Corp. | 18,460 | | 7,911,772 |
Leopalace21 Corp. (a) | 421,900 | | 2,929,044 |
Miraca Holdings, Inc. | 12,400 | | 558,720 |
Mitsubishi UFJ Financial Group, Inc. | 1,099,300 | | 7,000,636 |
Nomura Real Estate Holdings, Inc. | 35,200 | | 890,610 |
Omron Corp. | 75,500 | | 2,881,172 |
ORIX Corp. | 554,600 | | 9,606,275 |
Park24 Co. Ltd. | 83,900 | | 1,638,111 |
Rakuten, Inc. | 316,000 | | 4,117,366 |
Santen Pharmaceutical Co. Ltd. | 71,900 | | 3,650,056 |
Seven & i Holdings Co., Ltd. | 134,700 | | 4,985,063 |
Shinsei Bank Ltd. | 1,543,000 | | 3,612,636 |
Ship Healthcare Holdings, Inc. | 67,000 | | 2,749,303 |
SoftBank Corp. | 129,700 | | 9,685,854 |
Toyota Motor Corp. | 173,400 | | 11,242,942 |
USS Co. Ltd. | 28,800 | | 421,762 |
TOTAL JAPAN | | 122,439,241 |
Kenya - 0.1% |
Safaricom Ltd. | 18,905,500 | | 2,093,228 |
|
| Shares | | Value |
Korea (South) - 0.4% |
Hyundai Motor Co. | 12,766 | | $ 3,043,303 |
NHN Corp. | 4,224 | | 2,376,118 |
Orion Corp. | 742 | | 723,626 |
TOTAL KOREA (SOUTH) | | 6,143,047 |
Luxembourg - 0.2% |
Brait SA | 363,375 | | 1,770,045 |
Eurofins Scientific SA | 3,000 | | 822,593 |
TOTAL LUXEMBOURG | | 2,592,638 |
Mexico - 0.1% |
Alsea S.A.B. de CV | 519,500 | | 1,615,767 |
Netherlands - 1.6% |
AEGON NV | 292,700 | | 2,328,980 |
ASML Holding NV | 45,507 | | 4,306,782 |
European Aeronautic Defence and Space Co. (EADS) NV | 24,000 | | 1,649,177 |
Exact Holdings NV | 10,177 | | 269,517 |
Koninklijke Ahold NV | 149,342 | | 2,842,823 |
Koninklijke Philips Electronics NV | 155,100 | | 5,481,348 |
Randstad Holding NV | 44,718 | | 2,759,840 |
Royal DSM NV | 32,700 | | 2,476,988 |
Yandex NV (a) | 54,300 | | 2,001,498 |
TOTAL NETHERLANDS | | 24,116,953 |
New Zealand - 0.2% |
Ryman Healthcare Group Ltd. | 459,616 | | 2,866,303 |
Norway - 0.4% |
DNB ASA | 365,200 | | 6,472,077 |
Philippines - 0.1% |
Alliance Global Group, Inc. | 1,671,800 | | 1,019,367 |
Russia - 0.2% |
Mobile TeleSystems OJSC sponsored ADR | 143,200 | | 3,264,960 |
Singapore - 1.0% |
Avago Technologies Ltd. | 278,000 | | 12,629,540 |
Global Logistic Properties Ltd. | 1,015,000 | | 2,524,835 |
TOTAL SINGAPORE | | 15,154,375 |
South Africa - 0.6% |
Distell Group Ltd. | 126,410 | | 1,693,652 |
Naspers Ltd. Class N | 80,100 | | 7,492,357 |
TOTAL SOUTH AFRICA | | 9,186,009 |
Spain - 1.7% |
Amadeus IT Holding SA Class A | 82,100 | | 3,048,739 |
Antena 3 de Television SA | 93,500 | | 1,567,828 |
Banco Bilbao Vizcaya Argentaria SA | 799,331 | | 9,341,727 |
Criteria CaixaCorp SA (d) | 259,900 | | 1,351,175 |
Distribuidora Internacional de Alimentacion SA | 352,600 | | 3,223,374 |
Common Stocks - continued |
| Shares | | Value |
Spain - continued |
Grifols SA ADR | 75,442 | | $ 2,275,331 |
Inditex SA | 28,781 | | 4,728,366 |
TOTAL SPAIN | | 25,536,540 |
Sweden - 1.9% |
ASSA ABLOY AB (B Shares) | 110,600 | | 5,490,701 |
Intrum Justitia AB | 115,000 | | 3,061,319 |
Investment AB Kinnevik (B Shares) | 145,500 | | 5,361,903 |
Nordea Bank AB | 374,200 | | 4,792,957 |
Svenska Cellulosa AB (SCA) (B Shares) | 222,500 | | 6,317,852 |
Svenska Handelsbanken AB (A Shares) | 77,300 | | 3,502,331 |
TOTAL SWEDEN | | 28,527,063 |
Switzerland - 3.1% |
Actelion Ltd. | 13,000 | | 1,006,502 |
Credit Suisse Group | 63,657 | | 1,980,240 |
Lonza Group AG | 47,211 | | 4,219,774 |
Partners Group Holding AG | 13,818 | | 3,580,329 |
Roche Holding AG (participation certificate) | 49,858 | | 13,803,196 |
Schindler Holding AG (participation certificate) | 15,402 | | 2,184,645 |
SGS SA (Reg.) | 490 | | 1,148,113 |
Swatch Group AG (Bearer) | 2,200 | | 1,407,505 |
Syngenta AG (Switzerland) | 11,110 | | 4,484,181 |
UBS AG | 506,231 | | 9,791,049 |
Zurich Insurance Group AG | 10,593 | | 2,929,171 |
TOTAL SWITZERLAND | | 46,534,705 |
Taiwan - 0.3% |
ECLAT Textile Co. Ltd. | 149,940 | | 1,647,888 |
Taiwan Semiconductor Manufacturing Co. Ltd. | 706,000 | | 2,597,103 |
TOTAL TAIWAN | | 4,244,991 |
United Kingdom - 7.2% |
Aberdeen Asset Management PLC | 355,842 | | 2,526,997 |
Alabama Noor Hospitals Group PLC (a) | 169,000 | | 2,303,284 |
Associated British Foods PLC | 96,800 | | 3,518,591 |
Barclays PLC | 1,419,228 | | 5,971,353 |
BG Group PLC | 240,300 | | 4,906,758 |
BHP Billiton PLC | 154,101 | | 4,755,325 |
British American Tobacco PLC (United Kingdom) | 49,900 | | 2,753,097 |
Croda International PLC | 38,600 | | 1,507,671 |
Diageo PLC | 264,983 | | 8,446,990 |
Foxtons Group PLC | 134,300 | | 686,385 |
Hikma Pharmaceuticals PLC | 239,015 | | 4,602,672 |
Hilton Food Group PLC | 262,800 | | 1,803,479 |
HSBC Holdings PLC (United Kingdom) | 756,850 | | 8,296,094 |
Intertek Group PLC | 55,600 | | 2,970,446 |
ITV PLC | 907,700 | | 2,778,370 |
Jazztel PLC (a) | 284,917 | | 3,125,716 |
Legal & General Group PLC | 1,589,267 | | 5,511,823 |
|
| Shares | | Value |
Liberty Global PLC Class A (a) | 37,000 | | $ 2,899,690 |
London Stock Exchange Group PLC | 107,700 | | 2,835,507 |
Meggitt PLC | 419,676 | | 3,852,401 |
Next PLC | 57,000 | | 4,976,392 |
Ocado Group PLC (a) | 511,100 | | 3,556,620 |
Persimmon PLC | 129,000 | | 2,616,508 |
Reckitt Benckiser Group PLC | 48,500 | | 3,770,042 |
Rolls-Royce Group PLC | 271,600 | | 5,008,060 |
Rotork PLC | 44,510 | | 2,043,247 |
Royal Mail PLC | 106,500 | | 956,268 |
SABMiller PLC | 92,100 | | 4,805,284 |
Taylor Wimpey PLC | 1,155,900 | | 2,042,414 |
The Restaurant Group PLC | 123,700 | | 1,142,442 |
Ultra Electronics Holdings PLC | 36,900 | | 1,144,260 |
Vodafone Group PLC | 420,400 | | 1,539,825 |
TOTAL UNITED KINGDOM | | 109,654,011 |
United States of America - 49.8% |
A.O. Smith Corp. | 21,000 | | 1,084,650 |
Accuray, Inc. (a) | 235,000 | | 1,586,250 |
Adobe Systems, Inc. (a) | 289,000 | | 15,663,800 |
Agios Pharmaceuticals, Inc. (d) | 20,000 | | 463,200 |
Alexion Pharmaceuticals, Inc. (a) | 44,000 | | 5,409,800 |
Alliance Data Systems Corp. (a) | 6,000 | | 1,422,360 |
Amazon.com, Inc. (a) | 23,000 | | 8,372,690 |
American International Group, Inc. | 145,000 | | 7,489,250 |
Ameriprise Financial, Inc. | 175,400 | | 17,634,716 |
Amphenol Corp. Class A | 15,000 | | 1,204,350 |
Applied Micro Circuits Corp. (a) | 104,000 | | 1,212,640 |
Bank of America Corp. | 2,436,400 | | 34,012,144 |
Beam, Inc. | 23,900 | | 1,608,470 |
Biogen Idec, Inc. (a) | 66,000 | | 16,116,540 |
Bluebird Bio, Inc. (d) | 27,100 | | 575,875 |
Boston Scientific Corp. (a) | 275,300 | | 3,218,257 |
Bristol-Myers Squibb Co. | 87,000 | | 4,569,240 |
Cabot Oil & Gas Corp. | 1,002,000 | | 35,390,640 |
CalAmp Corp. (a) | 14,000 | | 329,420 |
Callidus Software, Inc. (a) | 50,000 | | 517,500 |
CBS Corp. Class B | 171,000 | | 10,112,940 |
Celldex Therapeutics, Inc. (a) | 89,100 | | 2,041,281 |
Citigroup, Inc. | 204,000 | | 9,951,120 |
Criteo SA sponsored ADR | 1,823 | | 64,370 |
Cummins, Inc. | 223,000 | | 28,325,460 |
Discovery Communications, Inc. Class A (a) | 42,000 | | 3,734,640 |
Eastman Chemical Co. | 292,500 | | 23,046,075 |
Ecolab, Inc. | 168,000 | | 17,808,000 |
EOG Resources, Inc. | 97,000 | | 17,304,800 |
EQT Corp. | 138,000 | | 11,814,180 |
Estee Lauder Companies, Inc. Class A | 12,800 | | 908,288 |
Facebook, Inc. Class A (a) | 78,000 | | 3,920,280 |
FedEx Corp. | 134,000 | | 17,554,000 |
Gilead Sciences, Inc. (a) | 382,000 | | 27,118,180 |
Google, Inc. Class A (a) | 30,200 | | 31,123,516 |
Common Stocks - continued |
| Shares | | Value |
United States of America - continued |
Guidewire Software, Inc. (a) | 53,000 | | $ 2,688,160 |
H&R Block, Inc. | 56,000 | | 1,592,640 |
Halozyme Therapeutics, Inc. (a)(d) | 236,000 | | 2,749,400 |
HealthStream, Inc. (a) | 12,000 | | 428,640 |
Illumina, Inc. (a) | 174,500 | | 16,317,495 |
inContact, Inc. (a) | 102,506 | | 778,021 |
Intercept Pharmaceuticals, Inc. | 47,667 | | 2,585,458 |
Johnson Controls, Inc. | 66,000 | | 3,045,900 |
KAR Auction Services, Inc. | 7,000 | | 208,040 |
KKR & Co. LP | 157,000 | | 3,446,150 |
Kroger Co. | 414,300 | | 17,748,612 |
MasterCard, Inc. Class A | 60,400 | | 43,312,839 |
McGraw-Hill Companies, Inc. | 491,200 | | 34,226,816 |
McKesson Corp. | 23,000 | | 3,595,820 |
Medivation, Inc. (a) | 59,800 | | 3,579,628 |
Monster Beverage Corp. (a) | 3,000 | | 171,690 |
Morgan Stanley | 405,000 | | 11,635,650 |
Netflix, Inc. (a) | 28,000 | | 9,029,440 |
Noble Energy, Inc. | 156,000 | | 11,689,080 |
Norfolk Southern Corp. | 161,000 | | 13,849,220 |
Pharmacyclics, Inc. (a) | 14,300 | | 1,696,552 |
Phillips 66 Partners LP | 49,875 | | 1,675,800 |
Pioneer Natural Resources Co. | 151,900 | | 31,106,082 |
priceline.com, Inc. (a) | 7,700 | | 8,114,491 |
Proto Labs, Inc. (a) | 33,000 | | 2,767,380 |
PVH Corp. | 53,000 | | 6,602,210 |
Regeneron Pharmaceuticals, Inc. (a) | 11,231 | | 3,230,036 |
Rock-Tenn Co. Class A | 11,000 | | 1,177,110 |
salesforce.com, Inc. (a) | 48,900 | | 2,609,304 |
ServiceNow, Inc. (a) | 226,000 | | 12,341,860 |
Sirius XM Radio, Inc. | 607,000 | | 2,288,390 |
Sohu.com, Inc. (a) | 19,300 | | 1,292,328 |
Spirit Airlines, Inc. (a) | 59,900 | | 2,584,685 |
SS&C Technologies Holdings, Inc. (a) | 82,900 | | 3,257,970 |
Synageva BioPharma Corp. (a) | 15,100 | | 767,080 |
Teledyne Technologies, Inc. (a) | 16,000 | | 1,421,120 |
The Blackstone Group LP | 421,000 | | 11,063,880 |
The Boeing Co. | 56,000 | | 7,308,000 |
The Cooper Companies, Inc. | 109,800 | | 14,187,258 |
TJX Companies, Inc. | 227,900 | | 13,854,041 |
TripAdvisor, Inc. (a) | 71,000 | | 5,872,410 |
Twenty-First Century Fox, Inc. Class A | 212,000 | | 7,224,960 |
United Therapeutics Corp. (a) | 35,000 | | 3,098,200 |
Visa, Inc. Class A | 149,900 | | 29,480,833 |
W.R. Grace & Co. (a) | 18,000 | | 1,649,880 |
Web.com Group, Inc. (a) | 137,100 | | 3,694,845 |
WhiteWave Foods Co. | 40,000 | | 800,400 |
Workday, Inc. Class A | 218,300 | | 16,344,121 |
Xylem, Inc. | 88,000 | | 3,036,000 |
Yahoo!, Inc. (a) | 399,000 | | 13,139,070 |
TOTAL UNITED STATES OF AMERICA | | 759,073,917 |
|
| Shares | | Value |
US Virgin Islands - 0.0% |
Altisource Residential Corp. Class B | 25,000 | | $ 664,250 |
TOTAL COMMON STOCKS (Cost $1,165,169,491) |
1,465,615,571
|
Nonconvertible Preferred Stocks - 0.7% |
| | | |
Germany - 0.7% |
Volkswagen AG | 39,200 | | 9,963,495 |
United Kingdom - 0.0% |
Rolls-Royce Group PLC Series C | 23,357,600 | | 37,452 |
TOTAL NONCONVERTIBLE PREFERRED STOCKS (Cost $7,496,985) |
10,000,947
|
Convertible Bonds - 0.1% |
| Principal Amount | | |
United States of America - 0.1% |
MGIC Investment Corp. 2% 4/1/20 | | $ 700,000 | | 954,310 |
Radian Group, Inc. 2.25% 3/1/19 | | 620,000 | | 935,394 |
TOTAL CONVERTIBLE BONDS (Cost $1,320,000) |
1,889,704
|
Government Obligations - 0.0% |
|
United States of America - 0.0% |
U.S. Treasury Bills, yield at date of purchase 0.02% 1/2/14 (e)
(Cost $414,989) | | 415,000 | |
414,982
|
Money Market Funds - 3.3% |
| Shares | | |
Fidelity Cash Central Fund, 0.09% (b) | 45,067,881 | | 45,067,881 |
Fidelity Securities Lending Cash Central Fund, 0.09% (b)(c) | 4,680,338 | | 4,680,338 |
TOTAL MONEY MARKET FUNDS (Cost $49,748,219) |
49,748,219
|
TOTAL INVESTMENT PORTFOLIO - 100.2% (Cost $1,224,149,684) | | 1,527,669,423 |
NET OTHER ASSETS (LIABILITIES) - (0.2)% | | (2,644,309) |
NET ASSETS - 100% | $ 1,525,025,114 |
Futures Contracts |
| Expiration Date | | Underlying Face Amount at Value | | Unrealized Appreciation/(Depreciation) |
Purchased |
Equity Index Contracts |
92 Nikkei 225 Index Contracts (Japan) | Dec. 2013 | | $ 6,653,900 | | $ 248,032 |
|
The face value of futures purchased as a percentage of net assets is 0.4% |
Legend |
(a) Non-income producing |
(b) Affiliated fund that is generally available only to investment companies and other accounts managed by Fidelity Investments. The rate quoted is the annualized seven-day yield of the fund at period end. A complete unaudited listing of the fund's holdings as of its most recent quarter end is available upon request. In addition, each Fidelity Central Fund's financial statements, which are not covered by the Fund's Report of Independent Registered Public Accounting Firm, are available on the SEC's website or upon request. |
(c) Investment made with cash collateral received from securities on loan. |
(d) Security or a portion of the security is on loan at period end. |
(e) Security or a portion of the security was pledged to cover margin requirements for futures contracts. At period end, the value of securities pledged amounted to $414,982. |
Affiliated Central Funds |
Information regarding fiscal year to date income earned by the Fund from investments in Fidelity Central Funds is as follows: |
Fund | Income earned |
Fidelity Cash Central Fund | $ 50,995 |
Fidelity Securities Lending Cash Central Fund | 356,949 |
Total | $ 407,944 |
Other Information |
Categorizations in the Schedule of Investments are based on country or territory of incorporation. |
The following is a summary of the inputs used, as of October 31, 2013, involving the Fund's assets and liabilities carried at fair value. The inputs or methodology used for valuing securities may not be an indication of the risk associated with investing in those securities. For more information on valuation inputs, and their aggregation into the levels used in the tables below, please refer to the Investment Valuation section in the accompanying Notes to Financial Statements. |
Valuation Inputs at Reporting Date: |
Description | Total | Level 1 | Level 2 | Level 3 |
Investments in Securities: | | | | |
Equities: | | | | |
Consumer Discretionary | $ 195,094,745 | $ 168,158,697 | $ 25,501,633 | $ 1,434,415 |
Consumer Staples | 96,269,397 | 61,281,831 | 34,987,566 | - |
Energy | 136,117,946 | 125,467,069 | 10,650,877 | - |
Financials | 302,503,944 | 230,929,341 | 71,574,603 | - |
Health Care | 213,703,702 | 194,558,830 | 19,144,872 | - |
Industrials | 178,362,200 | 157,284,362 | 21,077,838 | - |
Information Technology | 238,545,382 | 220,583,013 | 17,962,369 | - |
Materials | 80,101,344 | 70,861,838 | 9,239,506 | - |
Telecommunication Services | 30,899,697 | 12,687,831 | 18,211,866 | - |
Utilities | 4,018,161 | 4,018,161 | - | - |
Corporate Bonds | 1,889,704 | - | 1,889,704 | - |
Government Obligations | 414,982 | - | 414,982 | - |
Money Market Funds | 49,748,219 | 49,748,219 | - | - |
Total Investments in Securities: | $ 1,527,669,423 | $ 1,295,579,192 | $ 230,655,816 | $ 1,434,415 |
Derivative Instruments: | | | | |
Assets | | | | |
Futures Contracts | $ 248,032 | $ 248,032 | $ - | $ - |
The following is a summary of transfers between Level 1 and Level 2 for the period ended October 31, 2013. Transfers are assumed to have occurred at the beginning of the period, and are primarily attributable to the valuation techniques used for foreign equity securities, as discussed in the accompanying Notes to Financial Statements: |
Transfers | Total |
Level 1 to Level 2 | $ 43,000,101 |
Level 2 to Level 1 | $ 0 |
Value of Derivative Instruments |
The following table is a summary of the Fund's value of derivative instruments by primary risk exposure as of October 31, 2013. For additional information on derivative instruments, please refer to the Derivative Instruments section in the accompanying Notes to Financial Statements. |
Primary Risk Exposure /
Derivative Type | Value |
| Asset | Liability |
Equity Risk | | |
Futures Contracts (a) | $ 248,032 | $ - |
Total Value of Derivatives | $ 248,032 | $ - |
(a) Reflects gross cumulative appreciation (depreciation) on futures contracts as presented in the Schedule of Investments. Only the period end receivable or payable for daily variation margin and net unrealized appreciation (depreciation) are presented in the Statement of Assets and Liabilities. |
See accompanying notes which are an integral part of the financial statements.
Annual Report
Fidelity Worldwide Fund
Financial Statements
Statement of Assets and Liabilities
| October 31, 2013 |
| | |
Assets | | |
Investment in securities, at value (including securities loaned of $4,617,353) - See accompanying schedule: Unaffiliated issuers (cost $1,174,401,466) | $ 1,477,921,205 | |
Fidelity Central Funds (cost $49,748,218) | 49,748,218 | |
Total Investments (cost $1,224,149,684) | | $ 1,527,669,423 |
Cash | | 46,236 |
Foreign currency held at value (cost $145) | | 145 |
Receivable for investments sold | | 52,033,895 |
Receivable for fund shares sold | | 1,918,441 |
Dividends receivable | | 1,641,222 |
Interest receivable | | 3,492 |
Distributions receivable from Fidelity Central Funds | | 12,107 |
Prepaid expenses | | 4,783 |
Other receivables | | 265,654 |
Total assets | | 1,583,595,398 |
| | |
Liabilities | | |
Payable for investments purchased | $ 51,567,924 | |
Payable for fund shares redeemed | 859,404 | |
Accrued management fee | 988,981 | |
Distribution and service plan fees payable | 18,778 | |
Payable for daily variation margin for derivative instruments | 57,500 | |
Other affiliated payables | 294,730 | |
Other payables and accrued expenses | 102,629 | |
Collateral on securities loaned, at value | 4,680,338 | |
Total liabilities | | 58,570,284 |
| | |
Net Assets | | $ 1,525,025,114 |
Net Assets consist of: | | |
Paid in capital | | $ 1,104,816,841 |
Undistributed net investment income | | 5,154,082 |
Accumulated undistributed net realized gain (loss) on investments and foreign currency transactions | | 111,364,032 |
Net unrealized appreciation (depreciation) on investments and assets and liabilities in foreign currencies | | 303,690,159 |
Net Assets | | $ 1,525,025,114 |
Statement of Assets and Liabilities - continued
| October 31, 2013 |
| | |
Calculation of Maximum Offering Price Class A:
Net Asset Value and redemption price per share ($28,661,272 ÷ 1,138,130 shares) | | $ 25.18 |
| | |
Maximum offering price per share (100/94.25 of $25.18) | | $ 26.72 |
Class T:
Net Asset Value and redemption price per share ($9,822,410 ÷ 392,095 shares) | | $ 25.05 |
| | |
Maximum offering price per share (100/96.50 of $25.05) | | $ 25.96 |
Class B:
Net Asset Value and offering price per share ($709,889 ÷ 28,601 shares)A | | $ 24.82 |
| | |
Class C:
Net Asset Value and offering price per share ($10,777,727 ÷ 434,922 shares)A | | $ 24.78 |
| | |
Worldwide:
Net Asset Value, offering price and redemption price per share ($1,464,415,231 ÷ 57,635,498 shares) | | $ 25.41 |
| | |
Institutional Class:
Net Asset Value, offering price and redemption price per share ($10,638,585 ÷ 420,307 shares) | | $ 25.31 |
A Redemption price per share is equal to net asset value less any applicable contingent deferred sales charge.
See accompanying notes which are an integral part of the financial statements.
Annual Report
Fidelity Worldwide Fund
Financial Statements - continued
Statement of Operations
| Year ended October 31, 2013 |
Investment Income | | |
Dividends | | $ 20,251,766 |
Interest | | 18,336 |
Income from Fidelity Central Funds | | 407,944 |
Income before foreign taxes withheld | | 20,678,046 |
Less foreign taxes withheld | | (1,095,825) |
Total income | | 19,582,221 |
| | |
Expenses | | |
Management fee
Basic fee | $ 9,069,757 | |
Performance adjustment | 1,622,176 | |
Transfer agent fees | 2,711,063 | |
Distribution and service plan fees | 156,379 | |
Accounting and security lending fees | 588,006 | |
Custodian fees and expenses | 172,916 | |
Independent trustees' compensation | 7,367 | |
Registration fees | 94,174 | |
Audit | 74,846 | |
Legal | 4,009 | |
Miscellaneous | 10,331 | |
Total expenses before reductions | 14,511,024 | |
Expense reductions | (321,971) | 14,189,053 |
Net investment income (loss) | | 5,393,168 |
Realized and Unrealized Gain (Loss) Net realized gain (loss) on: | | |
Investment securities: | | |
Unaffiliated issuers | 124,060,205 | |
Foreign currency transactions | (172,714) | |
Futures contracts | 3,571,502 | |
Total net realized gain (loss) | | 127,458,993 |
Change in net unrealized appreciation (depreciation) on: Investment securities | 200,652,376 | |
Assets and liabilities in foreign currencies | (4,939) | |
Futures contracts | 248,032 | |
Total change in net unrealized appreciation (depreciation) | | 200,895,469 |
Net gain (loss) | | 328,354,462 |
Net increase (decrease) in net assets resulting from operations | | $ 333,747,630 |
Statement of Changes in Net Assets
| Year ended
October 31,
2013 | Year ended
October 31,
2012 |
Increase (Decrease) in Net Assets | | |
Operations | | |
Net investment income (loss) | $ 5,393,168 | $ 9,012,042 |
Net realized gain (loss) | 127,458,993 | 52,879,353 |
Change in net unrealized appreciation (depreciation) | 200,895,469 | 45,589,333 |
Net increase (decrease) in net assets resulting from operations | 333,747,630 | 107,480,728 |
Distributions to shareholders from net investment income | (8,778,977) | (4,089,511) |
Distributions to shareholders from net realized gain | (4,461,887) | - |
Total distributions | (13,240,864) | (4,089,511) |
Share transactions - net increase (decrease) | 92,658,787 | (126,253,328) |
Redemption fees | 24,982 | 23,898 |
Total increase (decrease) in net assets | 413,190,535 | (22,838,213) |
| | |
Net Assets | | |
Beginning of period | 1,111,834,579 | 1,134,672,792 |
End of period (including undistributed net investment income of $5,154,082 and undistributed net investment income of $7,478,979, respectively) | $ 1,525,025,114 | $ 1,111,834,579 |
See accompanying notes which are an integral part of the financial statements.
Annual Report
Financial Highlights - Class A
Years ended October 31, | 2013 | 2012 | 2011 | 2010 | 2009 H |
Selected Per-Share Data | | | | | |
Net asset value, beginning of period | $ 19.69 | $ 17.89 | $ 17.50 | $ 14.96 | $ 10.88 |
Income from Investment Operations | | | | | |
Net investment income (loss) E | .02 | .10 | .05 | .03 | (.01) |
Net realized and unrealized gain (loss) | 5.66 | 1.72 | .47 | 2.63 | 4.09 |
Total from investment operations | 5.68 | 1.82 | .52 | 2.66 | 4.08 |
Distributions from net investment income | (.11) | (.02) | (.08) | (.10) | - |
Distributions from net realized gain | (.08) | - | (.05) | (.02) | - |
Total distributions | (.19) | (.02) | (.13) | (.12) | - |
Redemption fees added to paid in capital E, J | - | - | - | - | - |
Net asset value, end of period | $ 25.18 | $ 19.69 | $ 17.89 | $ 17.50 | $ 14.96 |
Total Return B, C, D | 29.10% | 10.20% | 2.94% | 17.85% | 37.50% |
Ratios to Average Net Assets F, I | | | | | |
Expenses before reductions | 1.45% | 1.43% | 1.41% | 1.43% | 1.52% A |
Expenses net of fee waivers, if any | 1.45% | 1.43% | 1.40% | 1.43% | 1.52% A |
Expenses net of all reductions | 1.42% | 1.41% | 1.38% | 1.41% | 1.49% A |
Net investment income (loss) | .09% | .52% | .28% | .21% | (.06)% A |
Supplemental Data | | | | | |
Net assets, end of period (000 omitted) | $ 28,661 | $ 18,723 | $ 13,153 | $ 7,530 | $ 993 |
Portfolio turnover rate G | 161% | 186% | 203% | 166% | 224% |
A Annualized
B Total returns for periods of less than one year are not annualized.
C Total returns would have been lower if certain expenses had not been reduced during the applicable periods shown.
D Total returns do not include the effect of the sales charges.
E Calculated based on average shares outstanding during the period.
F Fees and expenses of any underlying Fidelity Central Funds are not included in the Fund's expense ratio. The Fund indirectly bears its proportionate share of the expenses of any underlying Fidelity Central Funds.
G Amount does not include the portfolio activity of any underlying Fidelity Central Funds.
H For the period February 19, 2009 (commencement of sale of shares) to October 31, 2009.
I Expense ratios reflect operating expenses of the class. Expenses before reductions do not reflect amounts reimbursed by the investment adviser or reductions from brokerage service arrangements or reductions from other expense offset arrangements and do not represent the amount paid by the class during periods when reimbursements or reductions occur. Expense ratios before reductions for start-up periods may not be representative of longer-term operating periods. Expenses net of fee waivers reflect expenses after reimbursement by the investment adviser but prior to reductions from brokerage service arrangements or other expense offset arrangements. Expenses net of all reductions represent the net expenses paid by the class.
J Amount represents less than $.01 per share.
Financial Highlights - Class T
Years ended October 31, | 2013 | 2012 | 2011 | 2010 | 2009 H |
Selected Per-Share Data | | | | | |
Net asset value, beginning of period | $ 19.61 | $ 17.83 | $ 17.46 | $ 14.94 | $ 10.88 |
Income from Investment Operations | | | | | |
Net investment income (loss) E | (.04) | .05 | .01 | (.01) | (.01) |
Net realized and unrealized gain (loss) | 5.63 | 1.73 | .45 | 2.62 | 4.07 |
Total from investment operations | 5.59 | 1.78 | .46 | 2.61 | 4.06 |
Distributions from net investment income | (.07) | - | (.04) | (.08) | - |
Distributions from net realized gain | (.08) | - | (.05) | (.02) | - |
Total distributions | (.15) | - | (.09) | (.09) K | - |
Redemption fees added to paid in capital E, J | - | - | - | - | - |
Net asset value, end of period | $ 25.05 | $ 19.61 | $ 17.83 | $ 17.46 | $ 14.94 |
Total Return B, C, D | 28.73% | 9.98% | 2.61% | 17.53% | 37.32% |
Ratios to Average Net Assets F, I | | | | | |
Expenses before reductions | 1.71% | 1.68% | 1.66% | 1.70% | 1.73% A |
Expenses net of fee waivers, if any | 1.70% | 1.68% | 1.65% | 1.70% | 1.73% A |
Expenses net of all reductions | 1.68% | 1.66% | 1.63% | 1.68% | 1.70% A |
Net investment income (loss) | (.16)% | .26% | .03% | (.05)% | (.08)% A |
Supplemental Data | | | | | |
Net assets, end of period (000 omitted) | $ 9,822 | $ 5,550 | $ 2,187 | $ 1,120 | $ 458 |
Portfolio turnover rate G | 161% | 186% | 203% | 166% | 224% |
A Annualized
B Total returns for periods of less than one year are not annualized.
C Total returns would have been lower if certain expenses had not been reduced during the applicable periods shown.
D Total returns do not include the effect of the sales charges.
E Calculated based on average shares outstanding during the period.
F Fees and expenses of any underlying Fidelity Central Funds are not included in the Fund's expense ratio. The Fund indirectly bears its proportionate share of the expenses of any underlying Fidelity Central Funds.
G Amount does not include the portfolio activity of any underlying Fidelity Central Funds.
H For the period February 19, 2009 (commencement of sale of shares) to October 31, 2009.
I Expense ratios reflect operating expenses of the class. Expenses before reductions do not reflect amounts reimbursed by the investment adviser or reductions from brokerage service arrangements or reductions from other expense offset arrangements and do not represent the amount paid by the class during periods when reimbursements or reductions occur. Expense ratios before reductions for start-up periods may not be representative of longer-term operating periods. Expenses net of fee waivers reflect expenses after reimbursement by the investment adviser but prior to reductions from brokerage service arrangements or other expense offset arrangements. Expenses net of all reductions represent the net expenses paid by the class.
J Amount represents less than $.01 per share.
K Total distributions of $.09 per share is comprised of distributions from net investment income of $.075 and distributions from net realized gain of $.015 per share.
See accompanying notes which are an integral part of the financial statements.
Annual Report
Financial Highlights - Class B
Years ended October 31, | 2013 | 2012 | 2011 | 2010 | 2009 H |
Selected Per-Share Data | | | | | |
Net asset value, beginning of period | $ 19.44 | $ 17.77 | $ 17.39 | $ 14.89 | $ 10.88 |
Income from Investment Operations | | | | | |
Net investment income (loss) E | (.14) | (.04) | (.09) | (.09) | (.03) |
Net realized and unrealized gain (loss) | 5.59 | 1.71 | .47 | 2.61 | 4.04 |
Total from investment operations | 5.45 | 1.67 | .38 | 2.52 | 4.01 |
Distributions from net investment income | - | - | - | (.01) | - |
Distributions from net realized gain | (.07) | - | - | (.01) | - |
Total distributions | (.07) | - | - | (.02) | - |
Redemption fees added to paid in capital E, J | - | - | - | - | - |
Net asset value, end of period | $ 24.82 | $ 19.44 | $ 17.77 | $ 17.39 | $ 14.89 |
Total Return B, C, D | 28.13% | 9.40% | 2.19% | 16.92% | 36.86% |
Ratios to Average Net Assets F, I | | | | | |
Expenses before reductions | 2.19% | 2.18% | 2.16% | 2.19% | 2.20% A |
Expenses net of fee waivers, if any | 2.19% | 2.18% | 2.16% | 2.19% | 2.20% A |
Expenses net of all reductions | 2.17% | 2.16% | 2.13% | 2.17% | 2.17% A |
Net investment income (loss) | (.65)% | (.23)% | (.47)% | (.55)% | (.30)% A |
Supplemental Data | | | | | |
Net assets, end of period (000 omitted) | $ 710 | $ 304 | $ 256 | $ 305 | $ 224 |
Portfolio turnover rate G | 161% | 186% | 203% | 166% | 224% |
A Annualized
B Total returns for periods of less than one year are not annualized.
C Total returns would have been lower if certain expenses had not been reduced during the applicable periods shown.
D Total returns do not include the effect of the contingent deferred sales charge.
E Calculated based on average shares outstanding during the period.
F Fees and expenses of any underlying Fidelity Central Funds are not included in the Fund's expense ratio. The Fund indirectly bears its proportionate share of the expenses of any underlying Fidelity Central Funds.
G Amount does not include the portfolio activity of any underlying Fidelity Central Funds.
H For the period February 19, 2009 (commencement of sale of shares) to October 31, 2009.
I Expense ratios reflect operating expenses of the class. Expenses before reductions do not reflect amounts reimbursed by the investment adviser or reductions from brokerage service arrangements or reductions from other expense offset arrangements and do not represent the amount paid by the class during periods when reimbursements or reductions occur. Expense ratios before reductions for start-up periods may not be representative of longer-term operating periods. Expenses net of fee waivers reflect expenses after reimbursement by the investment adviser but prior to reductions from brokerage service arrangements or other expense offset arrangements. Expenses net of all reductions represent the net expenses paid by the class.
J Amount represents less than $.01 per share.
Financial Highlights - Class C
Years ended October 31, | 2013 | 2012 | 2011 | 2010 | 2009 H |
Selected Per-Share Data | | | | | |
Net asset value, beginning of period | $ 19.41 | $ 17.74 | $ 17.36 | $ 14.89 | $ 10.88 |
Income from Investment Operations | | | | | |
Net investment income (loss) E | (.14) | (.04) | (.09) | (.09) | (.04) |
Net realized and unrealized gain (loss) | 5.58 | 1.71 | .47 | 2.61 | 4.05 |
Total from investment operations | 5.44 | 1.67 | .38 | 2.52 | 4.01 |
Distributions from net investment income | - | - | - | (.03) | - |
Distributions from net realized gain | (.07) | - | - | (.02) | - |
Total distributions | (.07) | - | - | (.05) | - |
Redemption fees added to paid in capital E, J | - | - | - | - | - |
Net asset value, end of period | $ 24.78 | $ 19.41 | $ 17.74 | $ 17.36 | $ 14.89 |
Total Return B, C, D | 28.12% | 9.41% | 2.19% | 16.94% | 36.86% |
Ratios to Average Net Assets F, I | | | | | |
Expenses before reductions | 2.15% | 2.18% | 2.16% | 2.19% | 2.18% A |
Expenses net of fee waivers, if any | 2.14% | 2.18% | 2.15% | 2.19% | 2.18% A |
Expenses net of all reductions | 2.12% | 2.16% | 2.13% | 2.16% | 2.15% A |
Net investment income (loss) | (.60)% | (.23)% | (.47)% | (.54)% | (.39)% A |
Supplemental Data | | | | | |
Net assets, end of period (000 omitted) | $ 10,778 | $ 1,726 | $ 1,297 | $ 710 | $ 335 |
Portfolio turnover rate G | 161% | 186% | 203% | 166% | 224% |
A Annualized
B Total returns for periods of less than one year are not annualized.
C Total returns would have been lower if certain expenses had not been reduced during the applicable periods shown.
D Total returns do not include the effect of the contingent deferred sales charge.
E Calculated based on average shares outstanding during the period.
F Fees and expenses of any underlying Fidelity Central Funds are not included in the Fund's expense ratio. The Fund indirectly bears its proportionate share of the expenses of any underlying Fidelity Central Funds.
G Amount does not include the portfolio activity of any underlying Fidelity Central Funds.
H For the period February 19, 2009 (commencement of sale of shares) to October 31, 2009.
I Expense ratios reflect operating expenses of the class. Expenses before reductions do not reflect amounts reimbursed by the investment adviser or reductions from brokerage service arrangements or reductions from other expense offset arrangements and do not represent the amount paid by the class during periods when reimbursements or reductions occur. Expense ratios before reductions for start-up periods may not be representative of longer-term operating periods. Expenses net of fee waivers reflect expenses after reimbursement by the investment adviser but prior to reductions from brokerage service arrangements or other expense offset arrangements. Expenses net of all reductions represent the net expenses paid by the class.
J Amount represents less than $.01 per share.
See accompanying notes which are an integral part of the financial statements.
Annual Report
Financial Highlights - Worldwide
Years ended October 31, | 2013 | 2012 | 2011 | 2010 | 2009 |
Selected Per-Share Data | | | | | |
Net asset value, beginning of period | $ 19.85 | $ 18.02 | $ 17.58 | $ 14.98 | $ 13.40 |
Income from Investment Operations | | | | | |
Net investment income (loss) B | .10 | .16 | .11 | .08 | .12 |
Net realized and unrealized gain (loss) | 5.70 | 1.74 | .48 | 2.63 | 1.63 |
Total from investment operations | 5.80 | 1.90 | .59 | 2.71 | 1.75 |
Distributions from net investment income | (.16) | (.07) | (.10) | (.10) | (.17) |
Distributions from net realized gain | (.08) | - | (.05) | (.02) | - |
Total distributions | (.24) | (.07) | (.15) | (.11) G | (.17) |
Redemption fees added to paid in capital B, F | - | - | - | - | - |
Net asset value, end of period | $ 25.41 | $ 19.85 | $ 18.02 | $ 17.58 | $ 14.98 |
Total Return A | 29.54% | 10.56% | 3.32% | 18.18% | 13.39% |
Ratios to Average Net Assets C, E | | | | | |
Expenses before reductions | 1.11% | 1.11% | 1.08% | 1.15% | 1.27% |
Expenses net of fee waivers, if any | 1.11% | 1.11% | 1.08% | 1.15% | 1.27% |
Expenses net of all reductions | 1.08% | 1.09% | 1.05% | 1.12% | 1.24% |
Net investment income (loss) | .43% | .84% | .60% | .50% | .92% |
Supplemental Data | | | | | |
Net assets, end of period (000 omitted) | $ 1,464,415 | $ 1,081,240 | $ 1,114,694 | $ 1,087,928 | $ 991,996 |
Portfolio turnover rate D | 161% | 186% | 203% | 166% | 224% |
A Total returns would have been lower if certain expenses had not been reduced during the applicable periods shown.
B Calculated based on average shares outstanding during the period.
C Fees and expenses of any underlying Fidelity Central Funds are not included in the Fund's expense ratio. The Fund indirectly bears its proportionate share of the expenses of any underlying Fidelity Central Funds.
D Amount does not include the portfolio activity of any underlying Fidelity Central Funds.
E Expense ratios reflect operating expenses of the class. Expenses before reductions do not reflect amounts reimbursed by the investment adviser or reductions from brokerage service arrangements or reductions from other expense offset arrangements and do not represent the amount paid by the class during periods when reimbursements or reductions occur. Expenses net of fee waivers reflect expenses after reimbursement by the investment adviser but prior to reductions from brokerage service arrangements or other expense offset arrangements. Expenses net of all reductions represent the net expenses paid by the class.
F Amount represents less than $.01 per share.
G Total distributions of $.11 per share is comprised of distributions from net investment income of $.097 and distributions from net realized gain of $.015 per share.
Financial Highlights - Institutional Class
Years ended October 31, | 2013 | 2012 | 2011 | 2010 | 2009 G |
Selected Per-Share Data | | | | | |
Net asset value, beginning of period | $ 19.78 | $ 17.98 | $ 17.57 | $ 15.00 | $ 10.88 |
Income from Investment Operations | | | | | |
Net investment income (loss) D | .08 | .14 | .10 | .07 | .06 |
Net realized and unrealized gain (loss) | 5.68 | 1.74 | .47 | 2.63 | 4.06 |
Total from investment operations | 5.76 | 1.88 | .57 | 2.70 | 4.12 |
Distributions from net investment income | (.15) | (.08) | (.11) | (.11) | - |
Distributions from net realized gain | (.08) | - | (.05) | (.02) | - |
Total distributions | (.23) | (.08) | (.16) | (.13) | - |
Redemption fees added to paid in capital D, I | - | - | - | - | - |
Net asset value, end of period | $ 25.31 | $ 19.78 | $ 17.98 | $ 17.57 | $ 15.00 |
Total Return B, C | 29.44% | 10.49% | 3.23% | 18.08% | 37.87% |
Ratios to Average Net Assets E, H | | | | | |
Expenses before reductions | 1.17% | 1.18% | 1.13% | 1.21% | 1.17% A |
Expenses net of fee waivers, if any | 1.17% | 1.18% | 1.13% | 1.21% | 1.17% A |
Expenses net of all reductions | 1.14% | 1.16% | 1.10% | 1.19% | 1.15% A |
Net investment income (loss) | .37% | .77% | .56% | .44% | .62% A |
Supplemental Data | | | | | |
Net assets, end of period (000 omitted) | $ 10,639 | $ 4,291 | $ 3,086 | $ 335 | $ 290 |
Portfolio turnover rate F | 161% | 186% | 203% | 166% | 224% |
A Annualized
B Total returns for periods of less than one year are not annualized.
C Total returns would have been lower if certain expenses had not been reduced during the applicable periods shown.
D Calculated based on average shares outstanding during the period.
E Fees and expenses of any underlying Fidelity Central Funds are not included in the Fund's expense ratio. The Fund indirectly bears its proportionate share of the expenses of any underlying Fidelity Central Funds.
F Amount does not include the portfolio activity of any underlying Fidelity Central Funds.
G For the period February 19, 2009 (commencement of sale of shares) to October 31, 2009.
H Expense ratios reflect operating expenses of the class. Expenses before reductions do not reflect amounts reimbursed by the investment adviser or reductions from brokerage service arrangements or reductions from other expense offset arrangements and do not represent the amount paid by the class during periods when reimbursements or reductions occur. Expense ratios before reductions for start-up periods may not be representative of longer-term operating periods. Expenses net of fee waivers reflect expenses after reimbursement by the investment adviser but prior to reductions from brokerage service arrangements or other expense offset arrangements. Expenses net of all reductions represent the net expenses paid by the class.
I Amount represents less than $.01 per share.
See accompanying notes which are an integral part of the financial statements.
Annual Report
Fidelity Worldwide Fund
Notes to Financial Statements
For the period ended October 31, 2013
1. Organization.
Fidelity Worldwide Fund (the Fund) is a fund of Fidelity Investment Trust (the Trust) and is authorized to issue an unlimited number of shares. The Trust is registered under the Investment Company Act of 1940, as amended (the 1940 Act), as an open-end management investment company organized as a Massachusetts business trust. The Fund offers Class A, Class T, Class C, Worldwide and Institutional Class shares, each of which, along with Class B shares, has equal rights as to assets and voting privileges. Class B shares are closed to new accounts and additional purchases, except for exchanges and reinvestments. Each class has exclusive voting rights with respect to matters that affect that class. Class B shares will automatically convert to Class A shares after a holding period of seven years from the initial date of purchase.
2. Investments in Fidelity Central Funds.
The Fund invests in Fidelity Central Funds, which are open-end investment companies generally available only to other investment companies and accounts managed by Fidelity Management & Research Company (FMR) and its affiliates. The Fund's Schedule of Investments lists each of the Fidelity Central Funds held as of period end, if any, as an investment of the Fund, but does not include the underlying holdings of each Fidelity Central Fund. As an Investing Fund, the Fund indirectly bears its proportionate share of the expenses of the underlying Fidelity Central Funds.
The Money Market Central Funds seek preservation of capital and current income and are managed by Fidelity Investments Money Management, Inc. (FIMM), an affiliate of FMR.
A complete unaudited list of holdings for each Fidelity Central Fund is available upon request or at the Securities and Exchange Commission (the SEC) website at www.sec.gov. In addition, the financial statements of the Fidelity Central Funds, which are not covered by the Fund's Report of Independent Registered Public Accounting Firm, are available on the SEC website or upon request.
3. Significant Accounting Policies.
The financial statements have been prepared in conformity with accounting principles generally accepted in the United States of America (GAAP), which require management to make certain estimates and assumptions at the date of the financial statements. Actual results could differ from those estimates. Subsequent events, if any, through the date that the financial statements were issued have been evaluated in the preparation of the financial statements. The following summarizes the significant accounting policies of the Fund:
Investment Valuation. Investments are valued as of 4:00 p.m. Eastern time on the last calendar day of the period. In accordance with valuation policies and procedures approved by the Board of Trustees (the Board), the Fund attempts to obtain prices from one or more third party pricing vendors or brokers to value its investments. When current market prices, quotations or currency exchange rates are not readily available or reliable, investments will be fair valued in good faith by the FMR Fair Value Committee (the Committee), in accordance with procedures adopted by the Board. Factors used in determining fair value vary by investment type and may include market or investment specific events, changes in interest rates and credit quality. The frequency with which these procedures are used cannot be predicted and they may be utilized to a significant extent. The Committee oversees the Fund's valuation policies and procedures and is responsible for approving and reporting to the Board all fair value determinations.
The Fund categorizes the inputs to valuation techniques used to value its investments into a disclosure hierarchy consisting of three levels as shown below:
Level 1 - quoted prices in active markets for identical investments
Level 2 - other significant observable inputs (including quoted prices for similar investments, interest rates, prepayment speeds, etc.)
Level 3 - unobservable inputs (including the Fund's own assumptions based on the best information available)
Valuation techniques used to value the Fund's investments by major category are as follows:
Equity securities, including restricted securities, for which market quotations are readily available, are valued at the last reported sale price or official closing price as reported by a third party pricing vendor on the primary market or exchange on which they are traded and are categorized as Level 1 in the hierarchy. In the event there were no sales during the day or closing prices are not available, securities are valued at the last quoted bid price or may be valued using the last available price and are generally categorized as Level 2 in the hierarchy. For foreign equity securities, when market or security specific events arise, comparisons to the valuation of American Depositary Receipts (ADRs), futures contracts, Exchange-Traded Funds (ETFs) and certain indexes as well as quoted prices for similar securities may be used and would be categorized as Level 2 in the hierarchy. Utilizing these techniques may result in transfers between Level 1 and Level 2. For equity securities, including restricted securities, where observable inputs are limited, assumptions about market activity and risk are used and these securities may be categorized as Level 3 in the hierarchy.
Debt securities, including restricted securities, are valued based on evaluated prices received from third party pricing vendors or from brokers who make markets in such securities. For corporate bonds and U.S. government and government agency obligations, pricing vendors utilize matrix pricing which considers yield or price of bonds of comparable quality, coupon, maturity and type as well as broker-supplied prices. When independent prices
Annual Report
Fidelity Worldwide Fund
Notes to Financial Statements - continued
3. Significant Accounting Policies - continued
Investment Valuation - continued
are unavailable or unreliable, debt securities may be valued utilizing pricing methodologies which consider similar factors that would be used by third party pricing vendors. Debt securities are generally categorized as Level 2 in the hierarchy but may be Level 3 depending on the circumstances.
Futures contracts are valued at the settlement price established each day by the board of trade or exchange on which they are traded and are categorized as Level 1 in the hierarchy. Investments in open-end mutual funds, including the Fidelity Central Funds, are valued at their closing net asset value (NAV) each business day and are categorized as Level 1 in the hierarchy.
Changes in valuation techniques may result in transfers in or out of an assigned level within the disclosure hierarchy. The aggregate value of investments by input level, as of October 31, 2013, including information on transfers between Levels 1 and 2, is included at the end of the Fund's Schedule of Investments.
Foreign Currency. The Fund may use foreign currency contracts to facilitate transactions in foreign-denominated securities. Gains and losses from these transactions may arise from changes in the value of the foreign currency or if the counterparties do not perform under the contracts' terms.
Foreign-denominated assets, including investment securities, and liabilities are translated into U.S. dollars at the exchange rates at period end. Purchases and sales of investment securities, income and dividends received and expenses denominated in foreign currencies are translated into U.S. dollars at the exchange rate in effect on the transaction date.
The effects of exchange rate fluctuations on investments are included with the net realized and unrealized gain (loss) on investment securities. Other foreign currency transactions resulting in realized and unrealized gain (loss) are disclosed separately.
Investment Transactions and Income. For financial reporting purposes, the Fund's investment holdings and NAV include trades executed through the end of the last business day of the period. The NAV per share for processing shareholder transactions is calculated as of the close of business of the New York Stock Exchange (NYSE), normally 4:00 p.m. Eastern time and includes trades executed through the end of the prior business day. Gains and losses on securities sold are determined on the basis of identified cost and may include proceeds received from litigation. Dividend income is recorded on the ex-dividend date, except for certain dividends from foreign securities where the ex-dividend date may have passed, which are recorded as soon as the Fund is informed of the ex-dividend date. Non-cash dividends included in dividend income, if any, are recorded at the fair market value of the securities received. Distributions received on securities that represent a return of capital or capital gain are recorded as a reduction of cost of investments and/or as a realized gain. Subsequent to ex-dividend date the Fund determines the components of these distributions, based upon receipt of tax filings or other correspondence relating to the underlying investment. Interest income and distributions from the Fidelity Central Funds are accrued as earned. Interest income includes coupon interest and amortization of premium and accretion of discount on debt securities. Investment income is recorded net of foreign taxes withheld where recovery of such taxes is uncertain.
Class Allocations and Expenses. Investment income, realized and unrealized capital gains and losses, common expenses of the Fund, and certain fund-level expense reductions, if any, are allocated daily on a pro-rata basis to each class based on the relative net assets of each class to the total net assets of the Fund. Each class differs with respect to transfer agent and distribution and service plan fees incurred. Certain expense reductions may also differ by class. For the reporting period, the allocated portion of income and expenses to each class as a percent of its average net assets may vary due to the timing of recording these transactions in relation to fluctuating net assets of the classes. Expenses directly attributable to a fund are charged to that fund. Expenses attributable to more than one fund are allocated among the respective funds on the basis of relative net assets or other appropriate methods. Expense estimates are accrued in the period to which they relate and adjustments are made when actual amounts are known.
Income Tax Information and Distributions to Shareholders. Each year, the Fund intends to qualify as a regulated investment company under Subchapter M of the Internal Revenue Code, including distributing substantially all of its taxable income and realized gains. As a result, no provision for U.S. Federal income taxes is required. As of October 31, 2013, the Fund did not have any unrecognized tax benefits in the financial statements; nor is the Fund aware of any tax positions for which it is reasonably possible that the total amounts of unrecognized tax benefits will significantly change in the next twelve months. The Fund files a U.S. federal tax return, in addition to state and local tax returns as required. The Fund's federal income tax returns are subject to examination by the Internal Revenue Service (IRS) for a period of three fiscal years after they are filed. State and local tax returns may be subject to examination for an additional fiscal year depending on the jurisdiction. Foreign taxes are provided for based on the Fund's understanding of the tax rules and rates that exist in the foreign markets in which it invests.
Distributions are declared and recorded on the ex-dividend date. Income dividends and capital gain distributions are declared separately for each class. Income and capital gain distributions are determined in accordance with income tax regulations, which may differ from GAAP. In addition, the Fund claimed a portion of the payment made to redeeming shareholders as a distribution for income tax purposes.
Capital accounts within the financial statements are adjusted for permanent book-tax differences. These adjustments have no impact on net assets or the results of operations. Temporary book-tax differences will reverse in a subsequent period.
Annual Report
3. Significant Accounting Policies - continued
Income Tax Information and Distributions to Shareholders - continued
Book-tax differences are primarily due to futures contracts, foreign currency transactions, passive foreign investment companies (PFIC), partnerships, deferred trustees compensation, and losses deferred due to wash sales.
The federal tax cost of investment securities and unrealized appreciation (depreciation) as of period end were as follows:
Gross unrealized appreciation | $ 303,709,710 |
Gross unrealized depreciation | (8,652,395) |
Net unrealized appreciation (depreciation) on securities and other investments | $ 295,057,315 |
| |
Tax Cost | $ 1,232,612,108 |
The tax-based components of distributable earnings as of period end were as follows:
Undistributed ordinary income | $ 60,493,370 |
Undistributed long-term capital gain | $ 64,735,706 |
Net unrealized appreciation (depreciation) | $ 294,979,703 |
The tax character of distributions paid was as follows:
| October 31, 2013 | October 31, 2012 |
Ordinary Income | $ 9,335,754 | $ 4,089,511 |
Long-term Capital Gain | 3,905,110 | - |
Total | $ 13,240,864 | $ 4,089,511 |
Short-Term Trading (Redemption) Fees. Shares held by investors in the Fund less than 30 days may have been subject to a redemption fee equal to 1.00% of the net asset value of shares redeemed. All redemption fees, which reduce the proceeds of the shareholder redemption, are retained by the Fund and accounted for as an addition to paid in capital.
New Accounting Pronouncement. The Financial Accounting Standards Board issued in December 2011, Accounting Standard Update No. 2011-11, Disclosures about Offsetting Assets and Liabilities, and in January 2013, Accounting Standards Update No. 2013-1 Clarifying the Scope of Disclosures about Offsetting Assets and Liabilities. These updates create new disclosure requirements requiring entities to disclose both gross and net information for derivatives and other financial instruments that are either offset in the Statement of Assets and Liabilities or subject to an enforceable master netting arrangement or similar agreement. The disclosure requirements are effective for annual reporting periods beginning on or after January 1, 2013, and interim periods within those annual periods. Management expects that the impact of the updates' adoption will be limited to additional financial statement disclosures as applicable.
4. Derivative Instruments.
Risk Exposures and the Use of Derivative Instruments. The Fund's investment objective allows the Fund to enter into various types of derivative contracts, including futures contracts. Derivatives are investments whose value is primarily derived from underlying assets, indices or reference rates and may be transacted on an exchange or over-the-counter (OTC). Derivatives may involve a future commitment to buy or sell a specified asset based on specified terms, to exchange future cash flows at periodic intervals based on a notional principal amount, or for one party to make one or more payments upon the occurrence of specified events in exchange for periodic payments from the other party.
The Fund used derivatives to increase returns and to manage exposure to certain risks as defined below. The success of any strategy involving derivatives depends on analysis of numerous economic factors, and if the strategies for investment do not work as intended, the Fund may not achieve its objectives.
The Fund's use of derivatives increased or decreased its exposure to the following risk:
Equity Risk | Equity risk relates to the fluctuations in the value of financial instruments as a result of changes in market prices (other than those arising from interest rate risk or foreign exchange risk), whether caused by factors specific to an individual investment, its issuer, or all factors affecting all instruments traded in a market or market segment. |
Annual Report
Fidelity Worldwide Fund
Notes to Financial Statements - continued
4. Derivative Instruments - continued
Risk Exposures and the Use of Derivative Instruments - continued
The Fund is also exposed to additional risks from investing in derivatives, such as liquidity risk and counterparty credit risk. Liquidity risk is the risk that the Fund will be unable to close out the derivative in the open market in a timely manner. Counterparty credit risk is the risk that the counterparty will not be able to fulfill its obligation to the Fund. Counterparty credit risk related to exchange-traded futures contracts may be mitigated by the protection provided by the exchange on which they trade.
Investing in derivatives may involve greater risks than investing in the underlying assets directly and, to varying degrees, may involve risk of loss in excess of any initial investment and collateral received and amounts recognized in the Statement of Assets and Liabilities. In addition, there may be the risk that the change in value of the derivative contract does not correspond to the change in value of the underlying instrument.
Futures Contracts. A futures contract is an agreement between two parties to buy or sell a specified underlying instrument for a fixed price at a specified future date. The Fund used futures contracts to manage its exposure to the stock market and to fluctuations in currency values.
Upon entering into a futures contract, a fund is required to deposit either cash or securities (initial margin) with a clearing broker in an amount equal to a certain percentage of the face value of the contract. Futures contracts are marked-to-market daily and subsequent daily payments (variation margin) are made or received by a fund depending on the daily fluctuations in the value of the futures contracts and are recorded as unrealized appreciation or (depreciation). This receivable and/or payable, if any, is included in daily variation margin for derivative instruments in the Statement of Assets and Liabilities. Realized gain or (loss) is recorded upon the expiration or closing of a futures contract.
Any open futures contracts at period end are presented in the Schedule of Investments under the caption "Futures Contracts." The underlying face amount at value reflects each contract's exposure to the underlying instrument or index at period end and is representative of activity for the period. Securities deposited to meet initial margin requirements are identified in the Schedule of Investments.
During the period the Fund recognized net realized gain (loss) of $3,571,502 and a change in net unrealized appreciation (depreciation) of $248,032 related to its investment in futures contracts. These amounts are included in the Statement of Operations.
5. Purchases and Sales of Investments.
Purchases and sales of securities, other than short-term securities, aggregated $2,101,815,224 and $2,010,981,925, respectively.
6. Fees and Other Transactions with Affiliates.
Management Fee. FMR and its affiliates provide the Fund with investment management related services for which the Fund pays a monthly management fee. The management fee is the sum of an individual fund fee rate that is based on an annual rate of .45% of the Fund's average net assets and an annualized group fee rate that averaged .25% during the period. The group fee rate is based upon the average net assets of all the mutual funds advised by FMR, including any mutual funds previously advised by FMR that are currently advised by Fidelity SelectCo, LLC, an affiliate of FMR. The group fee rate decreases as assets under management increase and increases as assets under management decrease. In addition, the management fee is subject to a performance adjustment (up to a maximum of ± .20% of the Fund's average net assets over a 36 month performance period). The upward or downward adjustment to the management fee is based on the relative investment performance of Worldwide as compared to an appropriate benchmark index over the same 36 month performance period. For the reporting period, the total annual management fee rate, including the performance adjustment, was .83% of the Fund's average net assets. The performance adjustment included in the management fee rate may be higher or lower than the maximum performance adjustment rate due to the difference between the average net assets for the reporting and performance periods.
Distribution and Service Plan Fees. In accordance with Rule 12b-1 of the 1940 Act, the Fund has adopted separate Distribution and Service Plans for each class of shares. Certain classes pay Fidelity Distributors Corporation (FDC), an affiliate of FMR, separate Distribution and Service Fees, each of which is based on an annual percentage of each class' average net assets. In addition, FDC may pay financial intermediaries for selling shares of the Fund and providing shareholder support services. For the period, the Distribution and Service Fee rates, total fees and amounts retained by FDC were as follows:
| Distribution
Fee | Service
Fee | Total Fees | Retained
by FDC |
Class A | -% | .25% | $ 56,465 | $ 3,136 |
Class T | .25% | .25% | 36,494 | - |
Class B | .75% | .25% | 5,173 | 3,899 |
Class C | .75% | .25% | 58,247 | 12,257 |
| | | $ 156,379 | $ 19,292 |
Annual Report
6. Fees and Other Transactions with Affiliates - continued
Sales Load. FDC may receive a front-end sales charge of up to 5.75% for selling Class A shares and 3.50% for selling Class T shares, some of which is paid to financial intermediaries for selling shares of the Fund. Depending on the holding period, FDC may receive contingent deferred sales charges levied on Class A, Class T, Class B, and Class C redemptions. The deferred sales charges range from 5.00% to 1.00% for Class B shares, 1.00% for Class C shares, 1.00% for certain purchases of Class A shares and .25% for certain purchases of Class T shares.
For the period, sales charge amounts retained by FDC were as follows:
| Retained
by FDC |
Class A | $ 14,423 |
Class T | 2,887 |
Class B* | 453 |
Class C* | 1,575 |
| $ 19,338 |
* When Class B and Class C shares are initially sold, FDC pays commissions from its own resources to financial intermediaries through which the sales are made.
Transfer Agent Fees. Fidelity Investments Institutional Operations Company, Inc., (FIIOC), an affiliate of FMR, is the transfer, dividend disbursing and shareholder servicing agent for each class of the Fund. FIIOC receives account fees and asset-based fees that vary according to the account size and type of account of the shareholders of the respective classes of the Fund. FIIOC pays for typesetting, printing and mailing of shareholder reports, except proxy statements.
For the period, transfer agent fees for each class were as follows:
| Amount | % of
Average
Net Assets |
Class A | $ 67,227 | .30 |
Class T | 22,437 | .31 |
Class B | 1,543 | .30 |
Class C | 15,419 | .26 |
Worldwide | 2,587,472 | .21 |
Institutional Class | 16,965 | .27 |
| $ 2,711,063 | |
Accounting and Security Lending Fees. Fidelity Service Company, Inc. (FSC), an affiliate of FMR, maintains the Fund's accounting records. The accounting fee is based on the level of average net assets for each month. Under a separate contract, FSC administers the security lending program. The security lending fee is based on the number and duration of lending transactions.
Brokerage Commissions. The Fund placed a portion of its portfolio transactions with brokerage firms which are affiliates of the investment adviser. Brokerage commissions are included in net realized gain (loss) and change in net unrealized appreciation (depreciation) in the Statement of Operations. The commissions paid to these affiliated firms were $41,416 for the period.
7. Committed Line of Credit.
The Fund participates with other funds managed by FMR or an affiliate in a $4.25 billion credit facility (the "line of credit") to be utilized for temporary or emergency purposes to fund shareholder redemptions or for other short-term liquidity purposes. The Fund has agreed to pay commitment fees on its pro-rata portion of the line of credit, which amounted to $2,710 and is reflected in Miscellaneous expenses on the Statement of Operations. During the period, there were no borrowings on this line of credit.
8. Security Lending.
The Fund lends portfolio securities through a lending agent from time to time in order to earn additional income. For equity securities, a lending agent is used and may loan securities to certain qualified borrowers, including Fidelity Capital Markets (FCM), a broker-dealer affiliated with the Fund. On the settlement date of the loan, the Fund receives collateral (in the form of U.S. Treasury obligations, letters of credit and/or cash) against the loaned securities and maintains collateral in an amount not less than 100% of the market value of the loaned securities during the period of the loan. The market value of the loaned securities is determined at the close of business of the Fund and any additional required collateral is delivered to the Fund on the next business day. If the borrower defaults on its obligation to return the securities loaned because of insolvency or other reasons, the Fund may apply collateral received from the borrower against the obligation. The Fund may experience delays and costs in recovering the securities loaned. Any
Annual Report
Fidelity Worldwide Fund
Notes to Financial Statements - continued
8. Security Lending - continued
cash collateral received is invested in the Fidelity Securities Lending Cash Central Fund. The value of loaned securities and cash collateral at period end are disclosed on the Fund's Statement of Assets and Liabilities. At period end, there were no security loans outstanding with FCM. Security lending income represents the income earned on investing cash collateral, less rebates paid to borrowers and any lending agent fees associated with the loan, plus any premium payments received for lending certain types of securities. Security lending income is presented in the Statement of Operations as a component of income from Fidelity Central Funds. Total security lending income during the period amounted to $356,949, including $3,404 from securities loaned to FCM.
9. Expense Reductions.
Commissions paid to certain brokers with whom FMR, or its affiliates, places trades on behalf of the Fund include an amount in addition to trade execution, which may be rebated back to the Fund to offset certain expenses. This amount totaled $307,457 for the period.
In addition, through arrangements with the Fund's custodian, credits realized as a result of uninvested cash balances were used to reduce the Fund's expenses. During the period, these credits reduced the Fund's custody expenses by $92.
In addition, FMR reimbursed a portion of the Fund's operating expenses during the period in the amount of $14,422.
10. Distributions to Shareholders.
Distributions to shareholders of each class were as follows:
Years ended October 31, | 2013 | 2012 |
From net investment income | | |
Class A | $ 102,433 | $ 16,598 |
Class T | 21,836 | - |
Class B | - | - |
Class C | - | - |
Worldwide | 8,622,428 | 4,059,519 |
Institutional Class | 32,280 | 13,394 |
Total | $ 8,778,977 | $ 4,089,511 |
From net realized gain | | |
Class A | $ 75,180 | $ - |
Class T | 23,606 | - |
Class B | 1,126 | - |
Class C | 6,545 | - |
Worldwide | 4,338,328 | - |
Institutional Class | 17,102 | - |
Total | $ 4,461,887 | $ - |
11. Share Transactions.
Transactions for each class of shares were as follows:
| Shares | Dollars |
Years ended October 31, | 2013 | 2012 | 2013 | 2012 |
Class A | | | | |
Shares sold | 491,761 | 433,206 | $ 11,054,215 | $ 8,109,308 |
Reinvestment of distributions | 6,945 | 720 | 138,266 | 12,524 |
Shares redeemed | (311,295) | (218,566) | (6,852,432) | (4,053,305) |
Net increase (decrease) | 187,411 | 215,360 | $ 4,340,049 | $ 4,068,527 |
Class T | | | | |
Shares sold | 169,111 | 202,603 | $ 3,777,852 | $ 3,780,147 |
Reinvestment of distributions | 2,272 | - | 45,089 | - |
Shares redeemed | (62,341) | (42,181) | (1,376,268) | (800,428) |
Net increase (decrease) | 109,042 | 160,422 | $ 2,446,673 | $ 2,979,719 |
Class B | | | | |
Shares sold | 20,337 | 4,060 | $ 444,905 | $ 73,532 |
Reinvestment of distributions | 53 | - | 1,043 | - |
Shares redeemed | (7,424) | (2,808) | (167,624) | (51,407) |
Net increase (decrease) | 12,966 | 1,252 | $ 278,324 | $ 22,125 |
Annual Report
11. Share Transactions - continued
| Shares | Dollars |
Years ended October 31, | 2013 | 2012 | 2013 | 2012 |
Class C | | | | |
Shares sold | 396,584 | 38,075 | $ 8,655,233 | $ 696,495 |
Reinvestment of distributions | 325 | - | 6,404 | - |
Shares redeemed | (50,941) | (22,245) | (1,138,699) | (407,626) |
Net increase (decrease) | 345,968 | 15,830 | $ 7,522,938 | $ 288,869 |
Worldwide | | | | |
Shares sold | 11,150,143 | 8,155,382 | $ 252,015,125 | $ 150,136,706 |
Reinvestment of distributions | 628,809 | 226,349 | 12,588,791 | 3,956,581 |
Shares redeemed | (8,612,327) | (15,784,478) | (191,232,967) | (288,554,381) |
Net increase (decrease) | 3,166,625 | (7,402,747) | $ 73,370,949 | $ (134,461,094) |
Institutional Class | | | | |
Shares sold | 275,603 | 111,552 | $ 6,347,280 | $ 2,100,045 |
Reinvestment of distributions | 2,425 | 745 | 48,393 | 12,982 |
Shares redeemed | (74,630) | (67,062) | (1,695,819) | (1,264,501) |
Net increase (decrease) | 203,398 | 45,235 | $ 4,699,854 | $ 848,526 |
12. Other.
The Fund's organizational documents provide former and current trustees and officers with a limited indemnification against liabilities arising in connection with the performance of their duties to the Fund. In the normal course of business, the Fund may also enter into contracts that provide general indemnifications. The Fund's maximum exposure under these arrangements is unknown as this would be dependent on future claims that may be made against the Fund. The risk of material loss from such claims is considered remote.
Annual Report
Report of Independent Registered Public Accounting Firm
To the Trustees of Fidelity Investment Trust and Shareholders of Fidelity Worldwide Fund:
We have audited the accompanying statement of assets and liabilities of Fidelity Worldwide Fund (the Fund), a fund of Fidelity Investment Trust, including the schedule of investments, as of October 31, 2013, and the related statement of operations for the year then ended, the statement of changes in net assets for each of the two years in the period then ended, and the financial highlights for each of the five years in the period then ended. These financial statements and financial highlights are the responsibility of the Fund's management. Our responsibility is to express an opinion on these financial statements and financial highlights based on our audits.
We conducted our audits in accordance with the standards of the Public Company Accounting Oversight Board (United States). Those standards require that we plan and perform the audit to obtain reasonable assurance about whether the financial statements and financial highlights are free of material misstatement. The Fund is not required to have, nor were we engaged to perform, an audit of its internal control over financial reporting. Our audits included consideration of internal control over financial reporting as a basis for designing audit procedures that are appropriate in the circumstances, but not for the purpose of expressing an opinion on the effectiveness of the Fund's internal control over financial reporting. Accordingly, we express no such opinion. An audit also includes examining, on a test basis, evidence supporting the amounts and disclosures in the financial statements, assessing the accounting principles used and significant estimates made by management, as well as evaluating the overall financial statement presentation. Our procedures included confirmation of securities owned as of October 31, 2013, by correspondence with the custodians and brokers; where replies were not received from brokers, we performed other auditing procedures. We believe that our audits provide a reasonable basis for our opinion.
In our opinion, the financial statements and financial highlights referred to above present fairly, in all material respects, the financial position of Fidelity Worldwide Fund as of October 31, 2013, the results of its operations for the year then ended, the changes in its net assets for each of the two years in the period then ended, and the financial highlights for each of the five years in the period then ended, in conformity with accounting principles generally accepted in the United States of America.
DELOITTE & TOUCHE LLP
Boston, Massachusetts
December 13, 2013
Annual Report
Trustees and Officers
The Trustees, Member of the Advisory Board, and executive officers of the trust and fund, as applicable, are listed below. The Board of Trustees governs the fund and is responsible for protecting the interests of shareholders. The Trustees are experienced executives who meet periodically throughout the year to oversee the fund's activities, review contractual arrangements with companies that provide services to the fund, oversee management of the risks associated with such activities and contractual arrangements, and review the fund's performance. Except for James C. Curvey, Ned C. Lautenbach, Ronald P. O'Hanley, and William S. Stavropoulos, each of the Trustees oversees 171 funds. Mr. Curvey oversees 394 funds. Mr. Lautenbach, Mr. O'Hanley, and Mr. Stavropoulos each oversees 245 funds.
The Trustees hold office without limit in time except that (a) any Trustee may resign; (b) any Trustee may be removed by written instrument, signed by at least two-thirds of the number of Trustees prior to such removal; (c) any Trustee who requests to be retired or who has become incapacitated by illness or injury may be retired by written instrument signed by a majority of the other Trustees; and (d) any Trustee may be removed at any special meeting of shareholders by a two-thirds vote of the outstanding voting securities of the trust. Each Trustee who is not an interested person of the trust and the fund (as defined in the 1940 Act) (Independent Trustee), shall retire not later than the last day of the calendar year in which his or her 75th birthday occurs. The Independent Trustees may waive this mandatory retirement age policy with respect to individual Trustees. The executive officers and Advisory Board Member hold office without limit in time, except that any officer and Advisory Board Member may resign or may be removed by a vote of a majority of the Trustees at any regular meeting or any special meeting of the Trustees. Except as indicated, each individual has held the office shown or other offices in the same company for the past five years.
Experience, Skills, Attributes, and Qualifications of the Fund's Trustees. The Governance and Nominating Committee has adopted a statement of policy that describes the experience, qualifications, attributes, and skills that are necessary and desirable for potential Independent Trustee candidates (Statement of Policy). The Board believes that each Trustee satisfied at the time he or she was initially elected or appointed a Trustee, and continues to satisfy, the standards contemplated by the Statement of Policy. The Governance and Nominating Committee also engages professional search firms to help identify potential Independent Trustee candidates who have the experience, qualifications, attributes, and skills consistent with the Statement of Policy. From time to time, additional criteria based on the composition and skills of the current Independent Trustees, as well as experience or skills that may be appropriate in light of future changes to board composition, business conditions, and regulatory or other developments, have also been considered by the professional search firms and the Governance and Nominating Committee. In addition, the Board takes into account the Trustees' commitment and participation in Board and committee meetings, as well as their leadership of standing and ad hoc committees throughout their tenure.
In determining that a particular Trustee was and continues to be qualified to serve as a Trustee, the Board has considered a variety of criteria, none of which, in isolation, was controlling. The Board believes that, collectively, the Trustees have balanced and diverse experience, qualifications, attributes, and skills, which allow the Board to operate effectively in governing the fund and protecting the interests of shareholders. Information about the specific experience, skills, attributes, and qualifications of each Trustee, which in each case led to the Board's conclusion that the Trustee should serve (or continue to serve) as a trustee of the fund, is provided below.
Board Structure and Oversight Function. James C. Curvey is an interested person (as defined in the 1940 Act) and currently serves as Chairman. The Trustees have determined that an interested Chairman is appropriate and benefits shareholders because an interested Chairman has a personal and professional stake in the quality and continuity of services provided to the fund. Independent Trustees exercise their informed business judgment to appoint an individual of their choosing to serve as Chairman, regardless of whether the Trustee happens to be independent or a member of management. The Independent Trustees have determined that they can act independently and effectively without having an Independent Trustee serve as Chairman and that a key structural component for assuring that they are in a position to do so is for the Independent Trustees to constitute a substantial majority for the Board. The Independent Trustees also regularly meet in executive session. Ned C. Lautenbach serves as Chairman of the Independent Trustees and as such (i) acts as a liaison between the Independent Trustees and management with respect to matters important to the Independent Trustees and (ii) with management prepares agendas for Board meetings.
Fidelity funds are overseen by different Boards of Trustees. The fund's Board oversees Fidelity's equity and high income funds and another Board oversees Fidelity's investment-grade bond, money market, and asset allocation funds. The asset allocation funds may invest in Fidelity funds overseen by the fund's Board. The use of separate Boards, each with its own committee structure, allows the Trustees of each group of Fidelity funds to focus on the unique issues of the funds they oversee, including common research, investment, and operational issues. On occasion, the separate Boards establish joint committees to address issues of overlapping consequences for the Fidelity funds overseen by each Board.
The Trustees operate using a system of committees to facilitate the timely and efficient consideration of all matters of importance to the Trustees, the fund, and fund shareholders and to facilitate compliance with legal and regulatory requirements and oversight of the fund's activities and associated risks. The Board, acting through its committees, has charged FMR and its affiliates with (i) identifying events or circumstances the occurrence of which could have demonstrably adverse effects on the funds business and/or reputation; (ii) implementing processes and controls to lessen the possibility that such events or circumstances occur or to mitigate the effects of such events or circumstances if they do occur; and (iii) creating and maintaining a system designed to evaluate continuously business and market conditions in order to facilitate the identification and implementation processes described in (i) and (ii) above. Because the day-to-day operations and activities of the fund are carried out by or through FMR, its affiliates and other service providers, the fund's exposure to risks is mitigated but not eliminated by the processes overseen by the Trustees. While each of the Board's committees has responsibility for overseeing different aspects of the fund's activities, oversight is exercised primarily through the Operations, Audit, and Compliance Committees. In addition, the Independent Trustees have worked with FMR to enhance the Board's oversight of investment and financial risks, legal and regulatory risks, technology risks, and operational risks, including the development of additional risk reporting to the Board. For example, a working group comprised of Independent Trustees and FMR has worked and continues to work to review the Fidelity funds' valuation-related activities, reporting and risk management. Appropriate personnel, including but not limited to the fund's Chief Compliance Officer (CCO), FMR's internal auditor, the independent accountants, the fund's Treasurer and portfolio management personnel, make periodic reports to the Board's committees, as appropriate, including an annual review of FMR's risk management program for the Fidelity funds. The responsibilities of each standing committee, including their oversight responsibilities, are described further under "Standing Committees of the Fund's Trustees."
Annual Report
Trustees and Officers - continued
The fund's Statement of Additional Information (SAI) includes more information about the Trustees. To request a free copy, call Fidelity at 1-877-208-0098.
Interested Trustees*:
Correspondence intended for each Trustee who is an interested person may be sent to Fidelity Investments, 245 Summer Street, Boston, Massachusetts 02210.
Name, Year of Birth; Principal Occupations and Other Relevant Experience+ |
James C. Curvey (1935) |
Year of Election or Appointment: 2007 Trustee Chairman of the Board of Trustees |
| Mr. Curvey also serves as Trustee of other Fidelity funds. Mr. Curvey is a Director of Fidelity Investments Money Management, Inc. (2009-present), Director of Fidelity Research & Analysis Co. (2009-present) and Director of FMR and FMR Co., Inc. (2007-present). Mr. Curvey is also Vice Chairman (2007-present) and Director of FMR LLC. In addition, Mr. Curvey serves as an Overseer for the Boston Symphony Orchestra and a member of the Trustees of Villanova University. Previously, Mr. Curvey was the Vice Chairman (2006-2007) and Director (2000-2007) of FMR Corp. |
Ronald P. O'Hanley (1957) |
Year of Election or Appointment: 2011 Trustee |
| Mr. O'Hanley also serves as Trustee of other Fidelity funds. He is Director of Fidelity SelectCo, LLC (2013-present), FMR Co., Inc. (2010-present), Director of Fidelity Investments Money Management, Inc. (2010-present), Director of Fidelity Research & Analysis Company (2010-present), President of Fidelity Asset Management and Corporate Services and a Member of Fidelity's Executive Committee (2010-present). Previously, Mr. O'Hanley served as President and Chief Executive Officer of BNY Mellon Asset Management (2007-2010). Mr. O'Hanley also served as Vice Chairman of Bank New York Mellon Corp. and a member of that firm's Executive Committee. Prior to the 2007 merger of The Bank of New York and Mellon Financial Corporation, he was Vice Chairman of Mellon Financial Corporation and President and Chief Executive Officer of Mellon Asset Management. He joined Mellon in February 1997. Mr. O'Hanley currently serves as Chairman of the Boston Public Library Foundation Board of Directors and sits on the Board of Directors of Beth Israel Deaconess Medical Center, the Board of Trustees of the Marine Biological Laboratory and the Advisory Board of the Maxwell School of Citizenship and Public Administration at Syracuse University. Mr. O'Hanley also chairs the Council on Asset Management for the Financial Services Roundtable and is a member of the Board of Directors of Institutional Investor's U.S. Institute. |
* Trustees have been determined to be "Interested Trustees" by virtue of, among other things, their affiliation with the trust or various entities under common control with FMR.
+ The information above includes each Trustee's principal occupation during the last five years and other information relating to the experience, attributes, and skills relevant to each Trustee's qualifications to serve as a Trustee, which led to the conclusion that each Trustee should serve as a Trustee for the fund.
Annual Report
Independent Trustees:
Correspondence intended for each Independent Trustee (that is, the Trustees other than the Interested Trustees) may be sent to Fidelity Investments, P.O. Box 55235, Boston, Massachusetts 02205-5235.
Name, Year of Birth; Principal Occupations and Other Relevant Experience+ |
Dennis J. Dirks (1948) |
Year of Election or Appointment: 2005 Trustee |
| Mr. Dirks also serves as Trustee of other Fidelity funds. Prior to his retirement in May 2003, Mr. Dirks was Chief Operating Officer and a member of the Board of The Depository Trust & Clearing Corporation (DTCC). He also served as President, Chief Operating Officer, and Board member of The Depository Trust Company (DTC) and President and Board member of the National Securities Clearing Corporation (NSCC). In addition, Mr. Dirks served as Chief Executive Officer and Board member of the Government Securities Clearing Corporation, Chief Executive Officer and Board member of the Mortgage-Backed Securities Clearing Corporation, as a Trustee and a member of the Finance Committee of Manhattan College (2005-2008), and as a Trustee and a member of the Finance Committee of AHRC of Nassau County (2006-2008). Mr. Dirks is a member of the Independent Directors Council (IDC) Governing Council (2010-present) and Board of Directors for The Brookville Center for Children's Services, Inc. (2009-present). |
Alan J. Lacy (1953) |
Year of Election or Appointment: 2008 Trustee |
| Mr. Lacy also serves as Trustee of other Fidelity funds. Mr. Lacy serves as Senior Adviser (2007-present) of Oak Hill Capital Partners, L.P. (private equity). Mr. Lacy also served as Chief Executive Officer (2000-2005) and Vice Chairman (2005-2006) of Sears Holdings Corporation and Sears, Roebuck and Co. (retail). In addition, Mr. Lacy serves as a member of the Board of Directors of Dave & Buster's Entertainment, Inc. (restaurant and entertainment complexes, 2010-present), Earth Fare, Inc. (retail grocery, 2012-present), The Hillman Companies, Inc. (hardware wholesalers, 2010-present), and Bristol-Myers Squibb Company (global pharmaceuticals, 2008-present). Mr. Lacy is a member of the Board of Trustees of The National Parks Conservation Association (2006-present). Previously, Mr. Lacy served as Chairman of the Board of Trustees of the National Parks Conservation Association (2008-2011) and as a member of the Board of Directors for the Western Union Company (global money transfer, 2006-2011). |
Ned C. Lautenbach (1944) |
Year of Election or Appointment: 2000 Trustee Chairman of the Independent Trustees |
| Mr. Lautenbach also serves as Trustee of other Fidelity funds. Mr. Lautenbach currently serves as the Lead Director of the Eaton Corporation Board of Directors (diversified industrial, 1997-present). Mr. Lautenbach is Chairman of the Board of Directors of the Philharmonic Center for the Arts in Naples, Florida (2012-present) and a member of the Council on Foreign Relations (1994-present). Previously, Mr. Lautenbach was a Partner/Advisory Partner at Clayton, Dubilier & Rice, LLC (private equity investment, 1998-2010), as well as a Director of Sony Corporation (2006-2007). |
Joseph Mauriello (1944) |
Year of Election or Appointment: 2008 Trustee |
| Mr. Mauriello also serves as Trustee of other Fidelity funds. Prior to his retirement in January 2006, Mr. Mauriello served in numerous senior management positions including Deputy Chairman and Chief Operating Officer (2004-2005), and Vice Chairman of Financial Services (2002-2004) of KPMG LLP US (professional services, 1965-2005). Mr. Mauriello currently serves as a member of the Board of Directors of XL Group plc. (global insurance and re-insurance, 2006-present). Previously, Mr. Mauriello served as a Director of the Hamilton Funds of the Bank of New York (2006-2007) and of Arcadia Resources Inc. (health care services and products, 2007-2012). |
Robert W. Selander (1950) |
Year of Election or Appointment: 2011 Trustee |
| Mr. Selander also serves as Trustee of other Fidelity funds. Previously, Mr. Selander served as a Member of the Advisory Board of other Fidelity funds (2011), and Executive Vice Chairman (2010), Chief Executive Officer (2009-2010), and President and Chief Executive Officer (1997-2009) of Mastercard, Inc. |
Cornelia M. Small (1944) |
Year of Election or Appointment: 2005 Trustee |
| Ms. Small also serves as Trustee of other Fidelity funds. Ms. Small is a member of the Board of Directors (2009-present) and Chair of the Investment Committee (2010-present) of the Teagle Foundation. Ms. Small also serves on the Investment Committee of the Berkshire Taconic Community Foundation (2008-present). Previously, Ms. Small served as Chairperson (2002-2008) and a member of the Investment Committee and Chairperson (2008-2012) and a member of the Board of Trustees of Smith College. In addition, Ms. Small served as Chief Investment Officer, Director of Global Equity Investments, and a member of the Board of Directors of Scudder, Stevens & Clark and Scudder Kemper Investments. |
William S. Stavropoulos (1939) |
Year of Election or Appointment: 2001 Trustee Vice Chairman of the Independent Trustees |
| Mr. Stavropoulos also serves as Trustee of other Fidelity funds. Mr. Stavropoulos serves as President and Founder of the Michigan Baseball Foundation, the Great Lakes Loons (2007-present). Mr. Stavropoulos is Chairman Emeritus of the Board of Directors of The Dow Chemical Company, where he previously served in numerous senior management positions, including President, CEO (1995-2000; 2002-2004), Chairman of the Executive Committee (2000-2006), and as a member of the Board of Directors (1990-2006). Currently, Mr. Stavropoulos is Chairman of the Board of Directors of Univar Inc. (global distributor of commodity and specialty chemicals), a Director of Teradata Corporation (data warehousing and technology solutions), and Maersk Inc. (industrial conglomerate), and a member of the Advisory Board for Metalmark Capital LLC (private equity investment, 2005-present). Mr. Stavropoulos is an operating advisor to Clayton, Dubilier & Rice, LLC (private equity investment). In addition, Mr. Stavropoulos is a member of the University of Notre Dame Advisory Council for the College of Science, a Trustee of the Rollin L. Gerstacker Foundation, and a Director of the Naples Philharmonic Center for the Arts. Previously, Mr. Stavropoulos served as a Director of Chemical Financial Corporation (bank holding company, 1993-2012) and Tyco International, Ltd. (multinational manufacturing and services, 2007-2012). |
David M. Thomas (1949) |
Year of Election or Appointment: 2008 Trustee |
| Mr. Thomas also serves as Trustee of other Fidelity funds. Mr. Thomas serves as Non-Executive Chairman of the Board of Directors of Fortune Brands Home and Security (home and security products, 2011-present), and as a member of the Board of Directors of Interpublic Group of Companies, Inc. (marketing communication, 2004-present). Previously, Mr. Thomas served as Executive Chairman (2005-2006) and Chairman and Chief Executive Officer (2000-2005) of IMS Health, Inc. (pharmaceutical and healthcare information solutions), and a Director of Fortune Brands, Inc. (consumer products, 2000-2011). |
+ The information above includes each Trustee's principal occupation during the last five years and other information relating to the experience, attributes, and skills relevant to each Trustee's qualifications to serve as a Trustee, which led to the conclusion that each Trustee should serve as a Trustee for the fund.
Advisory Board Member and Executive Officers:
Correspondence intended for each executive officer and Peter S. Lynch may be sent to Fidelity Investments, 245 Summer Street, Boston, Massachusetts 02210. Executive officers appear below in alphabetical order.
Name, Year of Birth; Principal Occupation |
Peter S. Lynch (1944) |
Year of Election or Appointment: 2003 Member of the Advisory Board |
| Mr. Lynch also serves as Member of the Advisory Board of other Fidelity funds. Mr. Lynch is Vice Chairman and a Director of FMR and FMR Co., Inc. In addition, Mr. Lynch serves as a Trustee of Boston College and as the Chairman of the Inner-City Scholarship Fund. Previously, Mr. Lynch served on the Special Olympics International Board of Directors (1997-2006). |
Elizabeth Paige Baumann (1968) |
Year of Election or Appointment: 2012 Anti-Money Laundering (AML) Officer |
| Ms. Baumann also serves as AML Officer of other funds. She is Chief AML Officer of FMR LLC (2012-present) and is an employee of Fidelity Investments. Previously, Ms. Baumann served as Vice President and Deputy Anti-Money Laundering Officer (2007-2012). |
William C. Coffey (1969) |
Year of Election or Appointment: 2009 Assistant Secretary |
| Mr. Coffey also serves as Assistant Secretary of other funds. He is Senior Vice President and Deputy General Counsel of FMR LLC (2010-present), and is an employee of Fidelity Investments. Previously, Mr. Coffey served as Vice President and Associate General Counsel of FMR LLC (2005-2009). |
Jonathan Davis (1968) |
Year of Election or Appointment: 2010 Assistant Treasurer |
| Mr. Davis also serves as Assistant Treasurer of other funds. Mr. Davis is an employee of Fidelity Investments. Previously, Mr. Davis served as Vice President and Associate General Counsel of FMR LLC (2003-2010). |
Adrien E. Deberghes (1967) |
Year of Election or Appointment: 2008 Deputy Treasurer |
| Mr. Deberghes also serves as an officer of other funds. He is an employee of Fidelity Investments (2008-present). Prior to joining Fidelity Investments, Mr. Deberghes was Senior Vice President of Mutual Fund Administration at State Street Corporation (2007-2008), Senior Director of Mutual Fund Administration at Investors Bank & Trust (2005-2007), and Director of Finance for Dunkin' Brands (2000-2005). |
Stephanie J. Dorsey (1969) |
Year of Election or Appointment: 2010 Assistant Treasurer |
| Ms. Dorsey also serves as an officer of other funds. She is an employee of Fidelity Investments (2008-present) and has served in other fund officer roles. Prior to joining Fidelity Investments, Ms. Dorsey served as Treasurer (2004-2008) of the JPMorgan Mutual Funds and Vice President (2004-2008) of JPMorgan Chase Bank. |
Scott C. Goebel (1968) |
Year of Election or Appointment: 2008 Secretary and Chief Legal Officer (CLO) |
| Mr. Goebel serves as Secretary and CLO of other funds. Mr. Goebel also serves as Secretary of Fidelity Investments Money Management, Inc. (FIMM) (2010-present) and Fidelity Research and Analysis Company (FRAC) (2010-present); General Counsel, Secretary, and Senior Vice President of FMR (2008-present) and FMR Co., Inc. (2008-present); Chief Legal Officer of Fidelity Management & Research (Hong Kong) Limited (2008-present) and Assistant Secretary of Fidelity Management & Research (Japan) Inc. (2008-present), and Fidelity Management & Research (U.K.) Inc. (2008-present). Previously, Mr. Goebel served as Secretary and CLO of other Fidelity funds (2008-2013), Assistant Secretary of FIMM (2008-2010), FRAC (2008-2010), and certain funds (2007-2008); and as Vice President and Secretary of Fidelity Distributors Corporation (FDC) (2005-2007). Mr. Goebel has been employed by FMR LLC or an affiliate since 2001. |
Joseph A. Hanlon (1968) |
Year of Election or Appointment: 2012 Chief Compliance Officer |
| Mr. Hanlon also serves as Chief Compliance Officer of other funds. Mr. Hanlon serves as Compliance Officer of FMR, FMR Co., Inc., Fidelity Investments Money Management, Inc. (FIMM), Fidelity Research and Analysis Company (FRAC), and Fidelity Management & Research (Hong Kong) (2009-present), as Senior Vice President of the Fidelity Asset Management Division (2009-present), and is an employee of Fidelity Investments. Previously, Mr. Hanlon served as Compliance Officer of Fidelity Management & Research (Japan) Inc. (2009-2013), Strategic Advisers, Inc. (2009-2013), and Fidelity Management & Research (U.K.) Inc. (2009-2013). |
Bruce T. Herring (1965) |
Year of Election or Appointment: 2006 Vice President of certain Equity Funds |
| Mr. Herring also serves as Vice President of other funds. He serves as Chief Investment Officer of Fidelity Global Asset Allocation (GAA) (2013-present), Chief Investment Officer and Director of Fidelity Management & Research (U.K.) Inc. (2010-present), Group Chief Investment Officer of FMR, and President of Fidelity Research & Analysis Company (2010-present). Previously, Mr. Herring served as Vice President (2005-2006) and Senior Vice President (2006-2007) of Fidelity Management & Research Company, Vice President of FMR Co., Inc. (2001-2007), and as a portfolio manager for Fidelity U.S. Equity Funds. |
Brian B. Hogan (1964) |
Year of Election or Appointment: 2009 Vice President |
| Mr. Hogan also serves as Vice President of other funds. Mr. Hogan serves as President of FMR's Equity Division (2009-present). Previously, Mr. Hogan served as Senior Vice President, Equity Research of FMR (2006-2009) and as a portfolio manager. |
Chris Maher (1972) |
Year of Election or Appointment: 2013 Assistant Treasurer |
| Mr. Maher serves as Assistant Treasurer of other funds. Mr. Maher is Vice President of Valuation Oversight and is an employee of Fidelity Investments. Previously, Mr. Maher served as Vice President of Asset Management Compliance (2013), Vice President of FMR's Program Management Group (2010-2013), and Vice President of Valuation Oversight (2008-2010). |
Christine Reynolds (1958) |
Year of Election or Appointment: 2008 Chief Financial Officer |
| Ms. Reynolds also serves as Chief Financial Officer of other funds. Ms. Reynolds became President of Fidelity Pricing and Cash Management Services (FPCMS) in August 2008. Ms. Reynolds served as Chief Operating Officer of FPCMS (2007-2008). Previously, Ms. Reynolds served as President, Treasurer, and Anti-Money Laundering officer of the Fidelity funds (2004-2007). |
Kenneth B. Robins (1969) |
Year of Election or Appointment: 2008 President and Treasurer |
| Mr. Robins also serves as an officer of other funds. Mr. Robins serves as Executive Vice President of Fidelity Investments Money Management, Inc. (FIMM) (2013-present) and is an employee of Fidelity Investments (2004-present). Previously, Mr. Robins served in other fund officer roles. |
Gary W. Ryan (1958) |
Year of Election or Appointment: 2005 Assistant Treasurer |
| Mr. Ryan also serves as Assistant Treasurer of other funds. Mr. Ryan is an employee of Fidelity Investments and has served in other fund officer roles. Previously, Mr. Ryan served as Vice President of Fund Reporting in Fidelity Pricing and Cash Management Services (FPCMS) (1999-2005). |
Stephen Sadoski (1971) |
Year of Election or Appointment: 2012 Deputy Treasurer |
| Mr. Sadoski also serves as Deputy Treasurer of other funds. He is an employee of Fidelity Investments (2012-present) and has served in another fund officer role. Prior to joining Fidelity Investments, Mr. Sadoski served as an assistant chief accountant in the Division of Investment Management of the Securities and Exchange Commission (SEC) (2009-2012) and as a senior manager at Deloitte & Touche LLP (1997-2009). |
Stacie M. Smith (1974) |
Year of Election or Appointment: 2013 Deputy Treasurer |
| Ms. Smith also serves as an officer of other funds. She is an employee of Fidelity Investments (2009-present) and has served in other fund officer roles. Prior to joining Fidelity Investments, Ms. Smith served as Senior Audit Manager of Ernst & Young LLP (1996-2009). |
Renee Stagnone (1975) |
Year of Election or Appointment: 2013 Deputy Treasurer |
| Ms. Stagnone also serves as Deputy Treasurer of other funds. Ms. Stagnone is an employee of Fidelity Investments. |
Joseph F. Zambello (1957) |
Year of Election or Appointment: 2011 Deputy Treasurer |
| Mr. Zambello also serves as Deputy Treasurer of other funds. Mr. Zambello is an employee of Fidelity Investments. Previously, Mr. Zambello served as Vice President of FMR's Program Management Group (2009-2011) and Vice President of the Transfer Agent Oversight Group (2005-2009). |
Annual Report
Distributions (Unaudited)
The Board of Trustees of Fidelity Worldwide voted to pay to shareholders of record at the opening of business on record date, the following distributions per share derived from capital gains realized from sales of portfolio securities, and dividends derived from net investment income:
| Pay Date | Record Date | Dividends | Capital Gains |
Class I | 12/9/13 | 12/6/13 | $0.088 | $1.979 |
The fund hereby designates as a capital gain dividend with respect to the taxable year ended October 31, 2013, $66,159,543, or, if subsequently determined to be different, the net capital gain of such year.
Class I designates 68% of the dividends distributed in during the fiscal year as qualifying for the dividends-received deduction for corporate shareholders.
Class I designates 100% of the dividends distributed during the fiscal year as amounts which may be taken into account as a dividend for the purposes of the maximum rate under section 1(h)(11) of the Internal Revenue Code.
The fund will notify shareholders in January 2014 of amounts for use in preparing 2013 income tax returns.
Annual Report
Board Approval of Investment Advisory Contracts and Management Fees
Fidelity Worldwide Fund
Each year, the Board of Trustees, including the Independent Trustees (together, the Board), votes on the renewal of the management contract and sub-advisory agreements (together, the Advisory Contracts) for the fund. The Board, assisted by the advice of fund counsel and Independent Trustees' counsel, requests and considers a broad range of information relevant to the renewal of the Advisory Contracts throughout the year.
The Board meets regularly and, at each of its meetings, covers an extensive agenda of topics and materials and considers factors that are relevant to its annual consideration of the renewal of the fund's Advisory Contracts, including the services and support provided to the fund and its shareholders. The Board has established various standing committees, each composed of and chaired by Independent Trustees with varying backgrounds, to which the Board has assigned specific subject matter responsibilities in order to enhance effective decision-making by the Board. The Board, acting directly and through its Committees, requests and receives information concerning the annual consideration of the renewal of the fund's Advisory Contracts. The Board also meets as needed to consider matters specifically related to the Board's annual consideration of the renewal of Advisory Contracts. Members of the Board may also meet with trustees of other Fidelity funds through ad hoc joint committees to discuss certain matters relevant to the Fidelity funds.
At its July 2013 meeting, the Board, including the Independent Trustees, unanimously determined to renew the fund's Advisory Contracts. In reaching its determination, the Board considered all factors it believed relevant, including (i) the nature, extent, and quality of the services to be provided to the fund and its shareholders (including the investment performance of the fund); (ii) the competitiveness of the fund's management fee and total expense ratio relative to peer funds; (iii) the total costs of the services to be provided by and the profits to be realized by Fidelity from its relationship with the fund; (iv) the extent to which economies of scale exist and would be realized as the fund grows; and (v) whether fee levels reflect these economies of scale, if any, for the benefit of fund shareholders.
In considering whether to renew the Advisory Contracts for the fund, the Board reached a determination, with the assistance of fund counsel and Independent Trustees' counsel and through the exercise of its business judgment, that the renewal of the Advisory Contracts was in the best interests of the fund and its shareholders and that the compensation payable under the Advisory Contracts was fair and reasonable. The Board's decision to renew the Advisory Contracts was not based on any single factor, but rather was based on a comprehensive consideration of all the information provided to the Board at its meetings throughout the year. The Board, in reaching its determination to renew the Advisory Contracts, was aware that shareholders in the fund have a broad range of investment choices available to them, including a wide choice among mutual funds offered by Fidelity's competitors, and that the fund's shareholders, who have the opportunity to review and weigh the disclosure provided by the fund in its prospectus and other public disclosures, have chosen to invest in this fund, which is a part of the Fidelity family of funds.
Nature, Extent, and Quality of Services Provided. The Board considered the staffing within the investment adviser, Fidelity Management & Research Company (FMR), and the sub-advisers (together, the Investment Advisers) as it relates to the fund, including the backgrounds of the fund's investment personnel, and also considered the fund's investment objective, strategies, and related investment philosophy. The Independent Trustees also had discussions with senior management of Fidelity's investment operations and investment groups. The Board considered the structure of the portfolio manager compensation program and whether this structure provides appropriate incentives to act in the best interests of the fund.
Resources Dedicated to Investment Management and Support Services. The Board and the Fund Oversight and Research Committees reviewed the general qualifications and capabilities of the Investment Advisers' investment staff, including its size, education, experience, and resources, as well as the Investment Advisers' approach to recruiting, training, managing, and compensating investment personnel. The Board noted that FMR has continued to increase the resources devoted to non-U.S. offices, including expansion of Fidelity's global investment organization. The Board also noted that Fidelity's analysts have extensive resources, tools and capabilities that allow them to conduct sophisticated quantitative and fundamental analysis, as well as credit analysis of issuers, counterparties and guarantors. Further, the Board believes that Fidelity's investment professionals have sufficient access to global information and data so as to provide competitive investment results over time, and that those professionals also have access to sophisticated tools that permit them to assess portfolio construction and risk and performance attribution characteristics continuously, as well as to transmit new information and research conclusions rapidly around the world. Additionally, in its deliberations, the Board considered the Investment Advisers' trading and risk management capabilities and resources, which are an integral part of the investment management process.
Shareholder and Administrative Services. The Board considered (i) the nature, extent, quality, and cost of advisory, administrative, and shareholder services performed by the Investment Advisers and their affiliates under the Advisory Contracts and under separate agreements covering transfer agency, pricing and bookkeeping, and securities lending services for the fund; (ii) the nature and extent of the supervision of third party service providers, principally custodians and subcustodians; and (iii) the resources devoted to, and the record of compliance with, the fund's compliance policies and procedures. The Board also reviewed the allocation of fund brokerage, including allocations to brokers affiliated with the Investment Advisers, the use of brokerage commissions to pay fund expenses, and the use of "soft" commission dollars to pay for research services.
The Board noted that the growth of fund assets over time across the complex allows Fidelity to reinvest in the development of services designed to enhance the value or convenience of the Fidelity funds as investment vehicles. These services include 24-hour access to account information and market information through telephone representatives and over the Internet, investor education materials and asset allocation tools, and the expanded availability of Fidelity Investor Centers.
Annual Report
Board Approval of Investment Advisory Contracts and Management Fees - continued
Investment in a Large Fund Family. The Board considered the benefits to shareholders of investing in a Fidelity fund, including the benefits of investing in a fund that is part of a large family of funds offering a variety of investment disciplines and providing a large variety of mutual fund investor services. The Board noted that Fidelity had taken, or had made recommendations that resulted in the Fidelity funds taking, a number of actions over the previous year that benefited particular funds, including (i) continuing to dedicate additional resources to investment research and to the support of the senior management team that oversees asset management; (ii) persisting in efforts to enhance Fidelity's global research capabilities; (iii) launching new funds and making other enhancements to meet client needs for global and income-oriented solutions; (iv) continuing to launch dedicated lower cost underlying funds to meet portfolio construction needs related to expanding underlying fund options for Fidelity funds of funds, specifically for the Freedom Fund product lines; (v) rationalizing product lines and gaining increased efficiencies through the mergers of several funds into other funds; (vi) strengthening Fidelity's index fund offerings by reducing investment minimums and adopting or lowering existing expense caps for certain funds and classes; (vii) enhancing Global Asset Allocation product offerings by launching new funds and strategies, including "open architecture" target date funds that utilize affiliated and unaffiliated sub-advisers; (viii) modifying the eligibility criteria for Institutional Class shares of Advisor funds to increase their marketability to a portion of the defined contribution plan market; (ix) creating a new low-cost retirement share class for certain Advisor funds to appeal to large retirement plans; (x) transitioning the management of certain Fidelity commodity funds to Geode Capital Management LLC, a registered commodity pool operator, while retaining administrative responsibilities for the funds; (xi) reorganizing a number of funds; and (xii) taking steps toward establishing a new Fidelity adviser to manage sector-based funds and products.
Investment Performance. The Board considered whether the fund has operated in accordance with its investment objective, as well as its record of compliance with its investment restrictions and its performance history.
The Board took into account discussions with the Investment Advisers about fund investment performance that occur at Board meetings throughout the year. In this regard the Board noted that as part of regularly scheduled fund reviews and other reports to the Board on fund performance, the Board periodically considers annualized return information for the fund, for different time periods, measured against a securities market index ("benchmark index") and a peer group of mutual funds with similar objectives ("peer group"). In its evaluation of fund investment performance, the Board gave particular attention to information indicating changes in performance of certain Fidelity funds for specific time periods and the Investment Advisers' explanations for any overperformance or underperformance.
In addition to reviewing absolute and relative fund performance, the Independent Trustees periodically consider the appropriateness of fund performance metrics in evaluating the results achieved. In general, the Independent Trustees believe that fund performance should be evaluated based on net performance (after fees and expenses) of both the highest performing and lowest performing classes, where applicable, compared to appropriate benchmark indices, over appropriate time periods which may include full market cycles, and compared to peer groups, as applicable, over the same periods, taking into account relevant factors including the following: general market conditions; issuer-specific information; tactical opportunities for investment; and fund cash flows and other factors.
The Independent Trustees recognize that shareholders evaluate performance on a net basis over their own holding periods, for which one-, three-, and five-year periods are used as a proxy. For this reason, the performance information reviewed by the Board also included net cumulative calendar year total return information for the fund and an appropriate benchmark index and peer group for the most recent one-, three-, and five-year periods, as shown below. Returns are shown compared to the 25th percentile (top of box) and 75th percentile (bottom of box) of the peer universe. Returns of the benchmark index are "net MA," i.e., adjusted for tax withholding rates applicable to U.S.-based mutual funds organized as Massachusetts business trusts.
Annual Report
Fidelity Worldwide Fund

The Board also considered that the fund's management fee is subject to upward or downward adjustment depending upon whether, and to what extent, the fund's investment performance for the performance period exceeds, or is exceeded by, a securities index, thus leading to a performance adjustment for the same period. The Board noted that the performance adjustment provides FMR with a strong economic incentive to seek to achieve superior performance for the fund's shareholders and helps to more closely align the interests of FMR and the fund's shareholders.
Based on its review, the Board concluded that the nature, extent, and quality of services provided to the fund under the Advisory Contracts should benefit the fund's shareholders.
Competitiveness of Management Fee and Total Expense Ratio. The Board considered the fund's management fee and total expense ratio compared to "mapped groups" of competitive funds and classes. Fidelity creates "mapped groups" by combining similar Lipper investment objective categories that have comparable management fee characteristics. Combining Lipper investment objective categories aids the Board's management fee and total expense ratio comparisons by broadening the competitive group used for comparison and by reducing the number of universes to which various Fidelity funds are compared.
Management Fee. The Board considered two proprietary management fee comparisons for the 12-month periods shown in the chart below. The group of Lipper funds used by the Board for management fee comparisons is referred to below as the "Total Mapped Group." The Total Mapped Group comparison focuses on a fund's standing in terms of gross management fees before expense reimbursements or caps, and without giving effect to the fund's performance adjustment, relative to the total universe of funds with comparable investment mandates, regardless of whether their management fee structures also are comparable. Funds with comparable investment mandates offer exposure to similar types of securities. Funds with comparable management fee structures have similar management fee contractual arrangements (e.g., flat rate charged for advisory services, all-inclusive fee rate, etc.). "TMG %" represents the percentage of funds in the Total Mapped Group that had management fees that were lower than the fund's. For example, a TMG % of 16% means that 84% of the funds in the Total Mapped Group had higher management fees than the fund. The "Asset-Size Peer Group" (ASPG) comparison focuses on a fund's standing relative to a subset of non-Fidelity funds within the Total Mapped Group that are similar in size and management fee structure. The ASPG represents at least 15% of the funds in the Total Mapped Group with comparable asset size and management fee structures, subject to a minimum of 50 funds (or all funds in the Total Mapped Group if fewer than 50). Additional information, such as the ASPG quartile in which the fund's management fee ranked and the impact of the fund's performance adjustment, is also included in the chart and considered by the Board.
Annual Report
Board Approval of Investment Advisory Contracts and Management Fees - continued
Fidelity Worldwide Fund

The Board noted that the fund's management fee ranked below the median of its Total Mapped Group and below the median of its ASPG for 2012. The Board also noted the effect of the fund's positive performance adjustment on the fund's management fee ranking.
Based on its review, the Board concluded that the fund's management fee is fair and reasonable in light of the services that the fund receives and the other factors considered.
Total Expense Ratio. In its review of each class's total expense ratio, the Board considered the fund's management fee as well as other fund or class expenses, as applicable, such as transfer agent fees, pricing and bookkeeping fees, fund-paid 12b-1 fees, and custodial, legal, and audit fees. The Board also noted the effects of any waivers and reimbursements on fees and expenses, as well as the impact of the fund's performance adjustment. As part of its review, the Board also considered the current and historical total expense ratios of each class of the fund compared to competitive fund median expenses. Each class of the fund is compared to those funds and classes in the Total Mapped Group (used by the Board for management fee comparisons) that have a similar sales load structure.
The Board noted that the total expense ratio of each of Class A, Class B, and the retail class ranked below its competitive median for 2012 and the total expense ratio of each of Class T, Class C, and Institutional Class ranked above its competitive median for 2012. The Board considered that, in general, various factors can affect total expense ratios. The Board noted that the total expense ratio of Class T was above the competitive median primarily because of higher 12b-1 fees on Class T. Class T has a higher 12b-1 fee, but a lower front-end sales charge, than traditionally priced front-end sales charge classes. The Board considered that Class T is primarily sold load-waived in the retirement plan market where its 0.50% 12b-1 fee is comparable to competing no-load, higher 12b-1 fee classes designed specifically for retirement plans. The Board noted that the fund offers multiple classes, each of which has a different sales load and 12b-1 fee structure, and that the multiple structures are intended to offer a range of pricing options for the intermediary market. The Board also noted that the total expense ratios of the classes vary primarily by the level of their 12b-1 fees, although differences in transfer agent fees may also cause expenses to vary from class to class.
Fees Charged to Other Fidelity Clients. The Board also considered Fidelity fee structures and other information with respect to clients of FMR and its affiliates, such as other mutual funds advised or subadvised by FMR or its affiliates, pension plan clients, and other institutional clients. The Board noted the findings of the 2013 ad hoc joint committee (created with the board of other Fidelity funds), which reviewed and compared Fidelity's institutional investment advisory business with its business of providing services to the Fidelity funds, including the differences in services provided, fees charged, and costs incurred, as well as competition in their respective marketplaces.
Based on its review of total expense ratios and fees charged to other Fidelity clients, the Board concluded that the total expense ratio of each class of the fund was reasonable, although in some cases above the median of the universe presented for comparison, in light of the services that the fund and its shareholders receive and the other factors considered.
Costs of the Services and Profitability. The Board considered the revenues earned and the expenses incurred by Fidelity in conducting the business of developing, marketing, distributing, managing, administering and servicing the fund and servicing the fund's shareholders. The Board also considered the level of Fidelity's profits in respect of all the Fidelity funds.
Annual Report
On an annual basis, FMR presents to the Board Fidelity's profitability for the fund. Fidelity calculates the profitability for each fund, as well as aggregate profitability for groups of Fidelity funds and all Fidelity funds, using a series of detailed revenue and cost allocation methodologies which originate with the books and records of Fidelity on which Fidelity's audited financial statements are based. The Audit Committee of the Board reviews any significant changes from the prior year's methodologies.
PricewaterhouseCoopers LLP (PwC), independent registered public accounting firm and auditor to Fidelity and certain Fidelity funds, has been engaged annually by the Board as part of the Board's assessment of Fidelity's profitability analysis. PwC's engagement includes the review and assessment of the methodologies used by Fidelity in determining the revenues and expenses attributable to Fidelity's mutual fund business, and completion of agreed-upon procedures surrounding the mathematical accuracy of fund profitability and its conformity to allocation methodologies. After considering PwC's reports issued under the engagement and information provided by Fidelity, the Board concluded that while other allocation methods may also be reasonable, Fidelity's profitability methodologies are reasonable in all material respects.
The Board also reviewed Fidelity's non-fund businesses and fall-out benefits related to the mutual fund business as well as cases where Fidelity's affiliates may benefit from or be related to the fund's business.
The Board considered the costs of the services provided by and the profits realized by Fidelity in connection with the operation of the fund and was satisfied that the profitability was not excessive in the circumstances.
Economies of Scale. The Board considered whether there have been economies of scale in respect of the management of the Fidelity funds, whether the Fidelity funds (including the fund) have appropriately benefited from any such economies of scale, and whether there is potential for realization of any further economies of scale. The Board considered the extent to which the fund will benefit from economies of scale through increased services to the fund, through waivers or reimbursements, or through fee or expense reductions. The Board also noted that in 2009, it and the board of other Fidelity funds created an ad hoc committee (the Economies of Scale Committee) to analyze whether FMR attains economies of scale in respect of the management and servicing of the Fidelity funds, whether the Fidelity funds have appropriately benefited from such economies of scale, and whether there is potential for realization of any further economies of scale.
The Board recognized that the fund's management contract incorporates a "group fee" structure, which provides for lower group fee rates as total fund assets under FMR's management increase, and for higher group fee rates as total fund assets under FMR's management decrease. FMR calculates the group fee rates based on a tiered asset "breakpoint" schedule that varies based on asset class. The Board considered that the group fee is designed to deliver the benefits of economies of scale to fund shareholders when total Fidelity fund assets increase, even if assets of any particular fund are unchanged or have declined, because some portion of Fidelity's costs are attributable to services provided to all Fidelity funds, and all funds benefit if those costs can be allocated among more assets. The Board concluded that, given the group fee structure, fund shareholders will benefit from lower management fees as assets under FMR's management increase at the fund complex level, regardless of whether Fidelity achieves any such economies of scale.
The Board concluded, taking into account the analysis of the Economies of Scale Committee, that economies of scale, if any, are being appropriately shared between fund shareholders and Fidelity.
Amendment to Description of Group Fee Rate. At its July 2013 meeting, the Board voted to approve an amendment to the fund's management contract to modify the description of the "group fee rate" effective August 1, 2013. The Board noted that under the prior description in the contract, the group fee rate was based on the average net assets of all registered investment companies with which FMR has management contracts. Under the contract's tiered asset breakpoint schedule, the group fee rate is lower as total fund assets under FMR's management increase, and higher as total fund assets under FMR's management decrease. The Board considered that the prior description would have excluded the assets of 64 Fidelity sector funds from the group fee rate calculation once Fidelity SelectCo, LLC, an affiliate of FMR, assumed management responsibilities for those funds. The Board noted that modifying the description of the group fee rate to continue to include the assets of those 64 funds for purposes of determining group fee rate breakpoints would avoid an immediate adverse impact on the group fee rate for any fund.
Additional Information Requested by the Board. In order to develop fully the factual basis for consideration of the Fidelity funds' Advisory Contracts, the Board requested and received additional information on certain topics, including: (i) fund performance trends and Fidelity's long-term strategies for certain funds; (ii) the potential to further rationalize the Fidelity fund lineup with the possibility of achieving savings for the funds and Fidelity; (iii) the methodology with respect to competitive fund data and peer group classifications; (iv) the arrangements with, and performance of, certain sub-advisers on behalf of the Fidelity funds, as well as certain proposed participating affiliate arrangements; (v) the realization of fall-out benefits in certain Fidelity business units; (vi) Fidelity's group fee structures, including the rationale for the individual fee rates of certain categories of funds and the definition of group assets; (vii) trends regarding industry use of performance fee structures and the performance adjustment methodologies applicable to the Fidelity funds; (viii) additional competitive analysis regarding the total expenses for certain classes; and (ix) fund profitability methodology, including Fidelity's cost allocation methodology, and the impact of certain factors on fund profitability results.
Based on its evaluation of all of the conclusions noted above, and after considering all factors it believed relevant, the Board ultimately concluded that the advisory fee structures are fair and reasonable, and that the fund's Advisory Contracts should be renewed.
Annual Report
Investment Adviser
Fidelity Management & Research Company
Boston, MA
Investment Sub-Advisers
FMR Co., Inc.
Fidelity Management & Research
(U.K.) Inc.
FIL Investments (Japan) Limited
FIL Investment Advisors
FIL Investment Advisors
(UK) Limited
Fidelity Management & Research
(Hong Kong) Limited
Fidelity Management & Research
(Japan) Inc.
General Distributor
Fidelity Distributors Corporation
Smithfield, RI
Transfer and Service Agents
Fidelity Investments Institutional
Operations Company, Inc.
Boston, MA
Fidelity Service Company, Inc.
Boston, MA
Custodian
JPMorgan Chase Bank
New York, NY
(Fidelity Investment logo)(registered trademark)
Corporate Headquarters
245 Summer St., Boston, MA 02210
www.fidelity.com
AWLDI-UANN-1213
1.883436.104
Fidelity's
Broadly Diversified International Equity
Funds
Fidelity® Diversified International Fund
Fidelity International Capital Appreciation Fund
Fidelity Overseas Fund
Fidelity Worldwide Fund
Annual Report
October 31, 2013
(Fidelity Cover Art)
Contents
Annual Report
To view a fund's proxy voting guidelines and proxy voting record for the 12-month period ended June 30, visit http://www.fidelity.com/proxyvotingresults or visit the Securities and Exchange Commission's (SEC) web site at http://www.sec.gov. You may also call 1-800-544-8544 to request a free copy of the proxy voting guidelines.
Standard & Poor's, S&P and S&P 500 are registered service marks of The McGraw-Hill Companies, Inc. and have been licensed for use by Fidelity Distributors Corporation.
Other third-party marks appearing herein are the property of their respective owners.
All other marks appearing herein are registered or unregistered trademarks or service marks of FMR LLC or an affiliated company. © 2013 FMR LLC. All rights reserved.
This report and the financial statements contained herein are submitted for the general information of the shareholders of the funds. This report is not authorized for distribution to prospective investors in the funds unless preceded or accompanied by an effective prospectus.
A fund files its complete schedule of portfolio holdings with the SEC for the first and third quarters of each fiscal year on Form N-Q. Forms N-Q are available on the SEC's web site at http://www.sec.gov. A fund's Forms N-Q may be reviewed and copied at the SEC's Public Reference Room in Washington, DC. Information regarding the operation of the SEC's Public Reference Room may be obtained by calling 1-800-SEC-0330. For a complete list of a fund's portfolio holdings, view the most recent holdings listing, semiannual report, or annual report on Fidelity's web site at http://www.fidelity.com, http://www.advisor.fidelity.com, or http://www.401k.com, as applicable.
NOT FDIC INSURED • MAY LOSE VALUE • NO BANK GUARANTEE
Neither the funds nor Fidelity Distributors Corporation is a bank.
Annual Report
Fidelity Diversified International Fund
As a shareholder of the Fund, you incur two types of costs: (1) transaction costs, including redemption fees and (2) ongoing costs, including management fees and other Fund expenses. This Example is intended to help you understand your ongoing costs (in dollars) of investing in the Fund and to compare these costs with the ongoing costs of investing in other mutual funds.
The Example is based on an investment of $1,000 invested at the beginning of the period and held for the entire period (May 1, 2013 to October 31, 2013).
Actual Expenses
The first line of the accompanying table for each class of the Fund provides information about actual account values and actual expenses. You may use the information in this line, together with the amount you invested, to estimate the expenses that you paid over the period. Simply divide your account value by $1,000.00 (for example, an $8,600 account value divided by $1,000.00 = 8.6), then multiply the result by the number in the first line for a class of the Fund under the heading entitled "Expenses Paid During Period" to estimate the expenses you paid on your account during this period. A small balance maintenance fee of $12.00 that is charged once a year may apply for certain accounts with a value of less than $2,000. This fee is not included in the table below. If it was, the estimate of expenses you paid during the period would be higher, and your ending account value lower, by this amount. In addition, the Fund, as a shareholder in the underlying Fidelity Central Funds, will indirectly bear its pro-rata share of the fees and expenses incurred by the underlying Fidelity Central Funds. These fees and expenses are not included in the Fund's annualized expense ratio used to calculate the expense estimate in the table below.
Hypothetical Example for Comparison Purposes
The second line of the accompanying table for each class of the Fund provides information about hypothetical account values and hypothetical expenses based on a Class' actual expense ratio and an assumed rate of return of 5% per year before expenses, which is not the Class' actual return. The hypothetical account values and expenses may not be used to estimate the actual ending account balance or expenses you paid for the period. You may use this information to compare the ongoing costs of investing in the Fund and other funds. To do so, compare this 5% hypothetical example with the 5% hypothetical examples that appear in the shareholder reports of the other funds. A small balance maintenance fee of $12.00 that is charged once a year may apply for certain accounts with a value of less than $2,000. This fee is not included in the table below. If it was, the estimate of expenses you paid during the period would be higher, and your ending account value lower, by this amount. In addition, the Fund, as a shareholder in the underlying Fidelity Central Funds, will indirectly bear its pro-rata share of the fees and expenses incurred by the underlying Fidelity Central Funds. These fees and expenses are not included in the Fund's annualized expense ratio used to calculate the expense estimate in the table below.
Please note that the expenses shown in the table are meant to highlight your ongoing costs only and do not reflect any transaction costs. Therefore, the second line of the table is useful in comparing ongoing costs only, and will not help you determine the relative total costs of owning different funds. In addition, if these transactional costs were included, your costs would have been higher.
| Annualized
Expense RatioB | Beginning
Account Value
May 1, 2013 | Ending
Account Value
October 31, 2013 | Expenses Paid
During Period*
May 1, 2013
to October 31, 2013 |
Diversified International | .94% | | | |
Actual | | $ 1,000.00 | $ 1,096.20 | $ 4.97 |
HypotheticalA | | $ 1,000.00 | $ 1,020.47 | $ 4.79 |
Class K | .81% | | | |
Actual | | $ 1,000.00 | $ 1,097.30 | $ 4.28 |
HypotheticalA | | $ 1,000.00 | $ 1,021.12 | $ 4.13 |
A 5% return per year before expenses
B Annualized expense ratio reflects expenses net of applicable fee waivers.
* Expenses are equal to each Class' annualized expense ratio, multiplied by the average account value over the period, multiplied by 184/365 (to reflect the one-half year period).
Annual Report
Fidelity® Diversified International Fund
Performance: The Bottom Line
Average annual total return reflects the change in the value of an investment, assuming reinvestment of the class' distributions from dividend income and capital gains (the profits earned upon the sale of securities that have grown in value, if any) and assuming a constant rate of performance each year. The $10,000 table and the fund's returns do not reflect the deduction of taxes that a shareholder would pay on fund distributions or the redemption of fund shares. During periods of reimbursement by Fidelity, a fund's total return will be greater than it would be had the reimbursement not occurred. How a fund did yesterday is no guarantee of how it will do tomorrow.
Average Annual Total Returns
Periods ended October 31, 2013 | Past 1
year | Past 5
years | Past 10
years |
Fidelity Diversified International Fund | 25.66% | 12.17% | 7.85% |
$10,000 Over 10 Years
Let's say hypothetically that $10,000 was invested in Fidelity Diversified International Fund, a class of the fund, on October 31, 2003. The chart shows how the value of your investment would have changed, and also shows how the MSCI® EAFE ® Index performed over the same period.
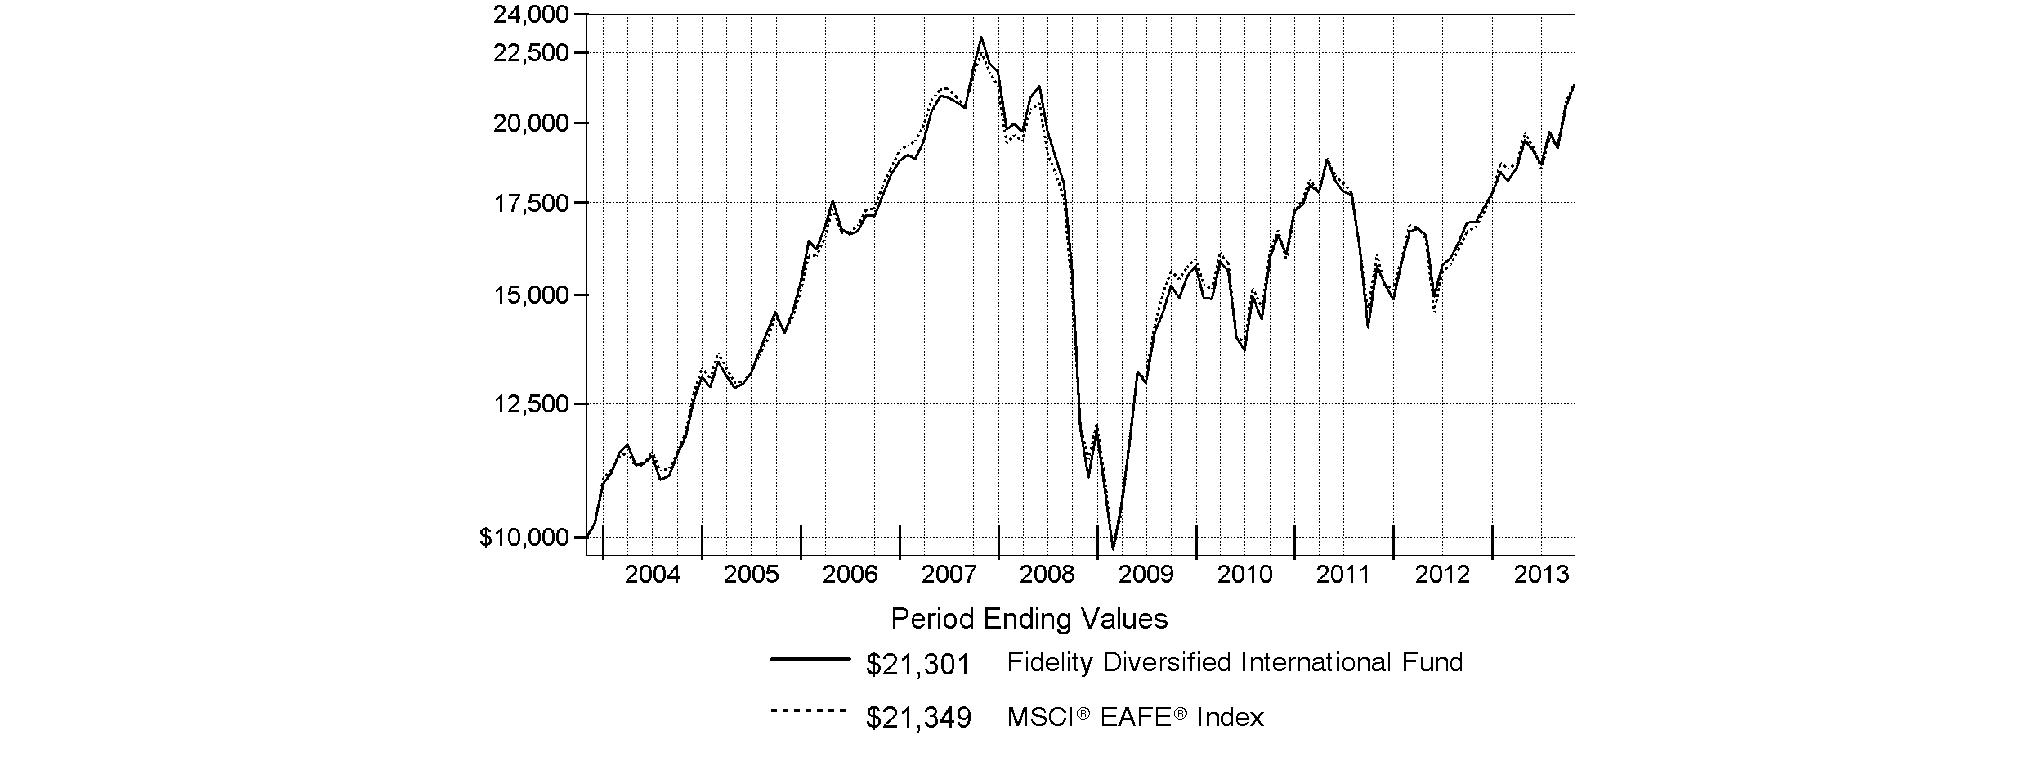
Annual Report
Fidelity Diversified International Fund
Market Recap: On balance, global equity markets remained upbeat for the 12-month period ending October 31, 2013. The MSCI® ACWI® (All Country World Index) Index gained 23.75% for the period, amid investor preference for higher-risk assets. The period was not without turbulence, however. In the spring and summer, central banks worldwide, especially in the U.S. and China, made clear their intentions to maintain accommodative monetary policies. That stance, combined with modest cyclical improvements around the globe and generally low valuations, underpinned the broad rally in equities. Europe (+32%) shone brightly, with most markets in the region - large and small - registering solid, index-beating gains. Another bright spot was Japan, which, despite a struggling yen and taking a second-half breather, posted a 34% result for the full year. The U.S. - by far the index's biggest constituent - also outperformed the global market with a roughly 28% advance. Meanwhile, Asia-Pacific ex Japan (+14%) lagged, hurt in part by a slowdown in Australia's mining industry as well as currency headwinds. Foreign-exchange and commodity weakness also curbed results in resource-heavy Canada and emerging markets (EM), both of which were up 7%. Country-level EM performance diverged meaningfully for the period, as evidenced by performance in Brazil (-1%), Russia (+12%), India (+1%) and China (+8%).
Comments from William Bower, Portfolio Manager of Fidelity® Diversified International Fund: For the year, the fund's Retail Class shares gained 25.66%, lagging the 27.02% return of the MSCI® EAFE® Index. Security selection in Europe and among banks and automotive-related stocks hurt the fund the most versus the index, followed by exposure to weak-performing emerging markets and a modest cash position, held for liquidity purposes. Conversely, some good picks in the U.K. and Japan and among gaming and Internet-related stocks helped narrow the performance gap. Among specific fund positions, underweighting Toyota Motor and Daimler detracted, while overweighting ORIX and SoftBank, both based in Japan, helped. I favored Honda over Toyota because of its motorcycles business and its finance facility, and because I thought the recovery in margins looked a little better for Honda. I was wrong: Toyota recovered quite sharply. I avoided Daimler because I think it has not executed as well as Volkswagen. VW is the biggest carmaker in China that is not locally owned, and China accounts for a good part of VW's earnings. I maintained the fund's automotive positioning through period end.
The views expressed above reflect those of the portfolio manager(s) only through the end of the period as stated on the cover of this report and do not necessarily represent the views of Fidelity or any other person in the Fidelity organization. Any such views are subject to change at any time based upon market or other conditions and Fidelity disclaims any responsibility to update such views. These views may not be relied on as investment advice and, because investment decisions for a Fidelity fund are based on numerous factors, may not be relied on as an indication of trading intent on behalf of any Fidelity fund.
Annual Report
Fidelity Diversified International Fund
Investment Changes (Unaudited)
Geographic Diversification (% of fund's net assets) |
As of October 31, 2013 |
 | Japan | 17.2% | |
 | United Kingdom | 16.9% | |
 | United States of America* | 9.1% | |
 | Germany | 9.1% | |
 | France | 8.7% | |
 | Switzerland | 6.1% | |
 | Australia | 3.4% | |
 | Canada | 2.9% | |
 | Spain | 2.8% | |
 | Other | 23.8% | |

* Includes Short-Term Investments and Net Other Assets (Liabilities). |
Percentages are based on country or territory of incorporation and are adjusted for the effect of futures contracts, if applicable. |
As of April 30, 2013 |
| United Kingdom | 17.0% | |
| Japan | 15.6% | |
| United States of America* | 10.3% | |
| Germany | 9.6% | |
| France | 7.6% | |
| Switzerland | 5.5% | |
| Australia | 4.0% | |
| Canada | 3.1% | |
| Netherlands | 3.0% | |
| Other | 24.3% | |

* Includes Short-Term Investments and Net Other Assets (Liabilities). |
Percentages are based on country or territory of incorporation and are adjusted for the effect of futures contracts, if applicable. |
Asset Allocation as of October 31, 2013 |
| % of fund's
net assets | % of fund's net assets
6 months ago |
Stocks and Equity Futures | 97.8 | 95.3 |
Investment Companies | 0.3 | 0.5 |
Short-Term Investments and Net Other Assets (Liabilities) | 1.9 | 4.2 |
Top Ten Stocks as of October 31, 2013 |
| % of fund's
net assets | % of fund's net assets
6 months ago |
Sanofi SA (France, Pharmaceuticals) | 2.5 | 2.7 |
ORIX Corp. (Japan, Diversified Financial Services) | 2.1 | 1.9 |
HSBC Holdings PLC sponsored ADR (United Kingdom, Commercial Banks) | 1.8 | 2.0 |
Bayer AG (Germany, Pharmaceuticals) | 1.7 | 1.4 |
Anheuser-Busch InBev SA NV (Belgium, Beverages) | 1.6 | 1.6 |
SoftBank Corp. (Japan, Wireless Telecommunication Services) | 1.5 | 0.8 |
Japan Tobacco, Inc. (Japan, Tobacco) | 1.5 | 1.6 |
Novo Nordisk A/S Series B (Denmark, Pharmaceuticals) | 1.5 | 2.0 |
UBS AG (Switzerland, Capital Markets) | 1.3 | 1.1 |
Nestle SA (Switzerland, Food Products) | 1.3 | 1.8 |
| 16.8 | |
Market Sectors as of October 31, 2013 |
| % of fund's
net assets | % of fund's net assets
6 months ago |
Financials | 24.0 | 20.3 |
Consumer Discretionary | 17.6 | 15.2 |
Health Care | 12.9 | 13.5 |
Consumer Staples | 12.0 | 15.1 |
Information Technology | 8.5 | 8.5 |
Industrials | 7.3 | 6.9 |
Materials | 6.3 | 6.9 |
Telecommunication Services | 4.9 | 3.8 |
Energy | 3.4 | 4.2 |
Utilities | 0.3 | 0.0 |
Annual Report
Fidelity Diversified International Fund
Investments October 31, 2013
Showing Percentage of Net Assets
Common Stocks - 95.5% |
| Shares | | Value |
Australia - 3.4% |
Ansell Ltd. | 2,715,502 | | $ 50,022,190 |
Australia & New Zealand Banking Group Ltd. | 8,056,553 | | 257,679,791 |
BHP Billiton Ltd. sponsored ADR (d) | 4,306,764 | | 304,445,147 |
CSL Ltd. | 2,093,966 | | 137,548,281 |
Telstra Corp. Ltd. | 8,177,319 | | 40,035,148 |
Westfield Group unit | 8,390,026 | | 85,800,794 |
TOTAL AUSTRALIA | | 875,531,351 |
Austria - 0.2% |
Andritz AG | 675,900 | | 41,636,195 |
Bailiwick of Guernsey - 0.6% |
Resolution Ltd. | 29,452,783 | | 168,780,693 |
Bailiwick of Jersey - 1.8% |
Experian PLC | 9,868,172 | | 200,947,363 |
Shire PLC | 1,224,700 | | 54,303,735 |
Wolseley PLC | 1,424,607 | | 76,772,462 |
WPP PLC | 6,745,809 | | 143,315,049 |
TOTAL BAILIWICK OF JERSEY | | 475,338,609 |
Belgium - 2.7% |
Anheuser-Busch InBev SA NV | 4,048,330 | | 419,665,009 |
Anheuser-Busch InBev SA NV (strip VVPR) (a) | 5,250,900 | | 7,129 |
KBC Groupe SA | 4,332,813 | | 236,197,506 |
UCB SA | 698,200 | | 45,901,243 |
TOTAL BELGIUM | | 701,770,887 |
Bermuda - 0.1% |
Bunge Ltd. | 478,600 | | 39,307,418 |
Brazil - 0.3% |
Petroleo Brasileiro SA - Petrobras sponsored ADR | 1,594,800 | | 27,797,364 |
TIM Participacoes SA sponsored ADR | 1,924,200 | | 48,913,164 |
TOTAL BRAZIL | | 76,710,528 |
Canada - 2.9% |
Alimentation Couche-Tard, Inc. Class B (sub. vtg.) | 2,173,627 | | 147,222,499 |
Canadian Natural Resources Ltd. | 2,431,200 | | 77,157,635 |
CGI Group, Inc. Class A (sub. vtg.) (a) | 4,261,200 | | 142,959,551 |
Painted Pony Petroleum Ltd. (a)(e) | 3,912,270 | | 25,702,824 |
Painted Pony Petroleum Ltd. (a)(e)(f) | 1,460,500 | | 9,595,190 |
Potash Corp. of Saskatchewan, Inc. | 2,013,200 | | 62,559,517 |
Suncor Energy, Inc. | 3,362,300 | | 122,186,301 |
Tourmaline Oil Corp. (a) | 1,111,900 | | 43,115,252 |
TransForce, Inc. | 1,194,200 | | 26,446,150 |
Valeant Pharmaceuticals International, Inc. (Canada) (a) | 978,800 | | 103,404,613 |
TOTAL CANADA | | 760,349,532 |
Cayman Islands - 1.5% |
Baidu.com, Inc. sponsored ADR (a) | 868,884 | | 139,803,436 |
|
| Shares | | Value |
Sands China Ltd. | 22,466,000 | | $ 159,664,207 |
SINA Corp. (a) | 614,300 | | 51,330,908 |
Tencent Holdings Ltd. | 947,600 | | 51,725,051 |
TOTAL CAYMAN ISLANDS | | 402,523,602 |
Denmark - 1.6% |
Genmab A/S (a) | 883,200 | | 38,345,825 |
Novo Nordisk A/S Series B | 2,288,739 | | 381,195,520 |
TOTAL DENMARK | | 419,541,345 |
Finland - 0.3% |
Sampo Oyj (A Shares) | 1,449,300 | | 68,656,091 |
France - 8.7% |
Air Liquide SA | 449,100 | | 61,159,482 |
Arkema SA | 619,900 | | 70,380,381 |
AXA SA | 5,244,800 | | 131,028,741 |
BNP Paribas SA | 2,882,076 | | 213,422,585 |
Bureau Veritas SA | 2,881,000 | | 86,995,713 |
Cap Gemini SA | 1,263,800 | | 83,136,540 |
Dassault Aviation SA | 29,665 | | 36,374,749 |
Edenred SA | 1,576,290 | | 53,558,699 |
Essilor International SA | 491,319 | | 52,766,690 |
Kering SA | 1,059,500 | | 240,739,021 |
LVMH Moet Hennessy - Louis Vuitton SA | 706,617 | | 136,044,230 |
Publicis Groupe SA | 2,067,100 | | 172,409,747 |
Renault SA | 577,300 | | 50,564,814 |
Sanofi SA | 5,938,932 | | 633,228,146 |
Schneider Electric SA | 1,231,600 | | 103,760,314 |
Total SA sponsored ADR (d) | 2,073,300 | | 126,844,494 |
TOTAL FRANCE | | 2,252,414,346 |
Germany - 7.4% |
adidas AG | 1,594,180 | | 181,990,984 |
Allianz SE | 633,091 | | 106,501,876 |
BASF AG | 2,644,947 | | 275,191,878 |
Bayer AG | 3,517,662 | | 437,204,706 |
Brenntag AG | 356,900 | | 60,475,706 |
Continental AG | 305,000 | | 55,884,651 |
Deutsche Post AG | 1,736,779 | | 58,775,934 |
Fresenius SE & Co. KGaA | 1,044,700 | | 135,787,398 |
GFK AG | 910,553 | | 53,222,859 |
Linde AG | 653,429 | | 124,162,692 |
OSRAM Licht AG (a) | 502,125 | | 26,019,379 |
ProSiebenSat.1 Media AG | 1,156,290 | | 55,073,943 |
SAP AG | 3,664,328 | | 286,741,846 |
Siemens AG | 522,740 | | 66,802,152 |
TOTAL GERMANY | | 1,923,836,004 |
Common Stocks - continued |
| Shares | | Value |
Hong Kong - 1.7% |
AIA Group Ltd. | 54,168,400 | | $ 274,929,257 |
Galaxy Entertainment Group Ltd. (a) | 21,838,000 | | 162,947,026 |
TOTAL HONG KONG | | 437,876,283 |
India - 1.5% |
Apollo Hospitals Enterprise Ltd. | 2,493,661 | | 36,777,292 |
HDFC Bank Ltd. | 10,072,492 | | 111,857,894 |
Housing Development Finance Corp. Ltd. | 7,279,660 | | 101,007,292 |
ITC Ltd. | 13,515,862 | | 73,474,844 |
Mahindra & Mahindra Financial Services Ltd. | 2,048,126 | | 9,387,466 |
United Spirits Ltd. | 1,242,152 | | 51,887,018 |
TOTAL INDIA | | 384,391,806 |
Indonesia - 0.1% |
PT Bank Rakyat Indonesia Tbk | 26,967,000 | | 18,898,929 |
Ireland - 1.0% |
Accenture PLC Class A | 319,077 | | 23,452,160 |
Actavis PLC (a) | 367,500 | | 56,808,150 |
DCC PLC (United Kingdom) | 885,900 | | 39,758,453 |
Greencore Group PLC | 8,322,078 | | 24,031,859 |
Ryanair Holdings PLC sponsored ADR | 2,169,700 | | 108,940,637 |
TOTAL IRELAND | | 252,991,259 |
Israel - 0.0% |
Teva Pharmaceutical Industries Ltd. sponsored ADR | 126,600 | | 4,695,594 |
Italy - 0.8% |
Prada SpA | 1,772,000 | | 17,278,886 |
UniCredit SpA | 16,317,500 | | 122,739,175 |
World Duty Free SpA (a) | 5,258,489 | | 58,260,062 |
TOTAL ITALY | | 198,278,123 |
Japan - 16.6% |
ACOM Co. Ltd. (a) | 9,138,500 | | 35,783,364 |
AEON Financial Service Co. Ltd. (d) | 1,270,200 | | 39,008,167 |
Aozora Bank Ltd. | 23,073,000 | | 67,074,012 |
Coca-Cola Central Japan Co. Ltd. | 57,800 | | 1,023,675 |
Cosmos Pharmaceutical Corp. | 126,800 | | 15,448,121 |
Credit Saison Co. Ltd. | 3,809,500 | | 104,267,615 |
Don Quijote Co. Ltd. | 3,103,000 | | 206,555,807 |
Fuji Heavy Industries Ltd. | 1,789,300 | | 48,922,208 |
GMO Internet, Inc. | 2,425,200 | | 27,569,852 |
Honda Motor Co. Ltd. | 6,944,600 | | 277,318,124 |
Hoya Corp. | 5,859,600 | | 140,509,511 |
Japan Exchange Group, Inc. | 2,942,400 | | 68,405,350 |
Japan Tobacco, Inc. | 10,607,400 | | 383,814,806 |
JSR Corp. | 4,330,900 | | 82,495,066 |
KDDI Corp. | 3,114,600 | | 168,675,805 |
Keyence Corp. | 718,410 | | 307,903,357 |
Miraca Holdings, Inc. | 485,300 | | 21,866,662 |
Mitsubishi UFJ Financial Group, Inc. | 41,692,200 | | 265,507,054 |
|
| Shares | | Value |
Monex Group, Inc. | 4,779,100 | | $ 17,434,888 |
Nitori Holdings Co. Ltd. | 431,600 | | 40,486,551 |
Nitto Denko Corp. | 275,400 | | 14,442,240 |
Nomura Holdings, Inc. | 12,178,900 | | 89,965,950 |
Omron Corp. | 1,373,500 | | 52,414,441 |
ORIX Corp. | 30,992,500 | | 536,823,790 |
Rakuten, Inc. | 17,945,600 | | 233,824,717 |
Santen Pharmaceutical Co. Ltd. | 757,800 | | 38,470,270 |
Seven & i Holdings Co., Ltd. | 3,531,700 | | 130,703,401 |
SHIMANO, Inc. | 822,300 | | 71,971,077 |
Shinsei Bank Ltd. | 35,450,000 | | 82,999,311 |
Ship Healthcare Holdings, Inc. | 403,400 | | 16,553,263 |
SMC Corp. | 49,600 | | 11,547,785 |
SoftBank Corp. | 5,397,900 | | 403,109,283 |
Sumitomo Mitsui Financial Group, Inc. | 2,768,900 | | 133,837,255 |
Toyota Motor Corp. sponsored ADR | 694,500 | | 89,882,190 |
Tsuruha Holdings, Inc. | 477,100 | | 43,315,355 |
Yahoo! Japan Corp. | 8,937,000 | | 41,697,517 |
TOTAL JAPAN | | 4,311,627,840 |
Korea (South) - 1.0% |
NHN Corp. | 291,699 | | 164,088,863 |
Orion Corp. | 99,063 | | 96,609,906 |
TOTAL KOREA (SOUTH) | | 260,698,769 |
Luxembourg - 0.1% |
Eurofins Scientific SA | 141,300 | | 38,744,123 |
Mexico - 0.5% |
America Movil S.A.B. de CV Series L sponsored ADR | 3,650,500 | | 78,157,205 |
Fomento Economico Mexicano S.A.B. de CV sponsored ADR | 286,216 | | 26,703,953 |
Grupo Mexico SA de CV Series B | 7,247,844 | | 22,892,460 |
TOTAL MEXICO | | 127,753,618 |
Netherlands - 2.3% |
AEGON NV | 26,661,800 | | 212,144,835 |
Koninklijke Philips Electronics NV (depositary receipt) (NY Reg.) | 1,599,100 | | 56,624,131 |
Royal DSM NV | 733,100 | | 55,531,499 |
Unilever NV (Certificaten Van Aandelen) (Bearer) | 6,715,657 | | 266,245,433 |
TOTAL NETHERLANDS | | 590,545,898 |
Norway - 1.0% |
DNB ASA | 7,184,109 | | 127,316,838 |
Telenor ASA | 5,886,800 | | 141,408,589 |
TOTAL NORWAY | | 268,725,427 |
Russia - 0.2% |
Sberbank (Savings Bank of the Russian Federation) | 17,144,700 | | 54,955,844 |
Singapore - 0.6% |
Global Logistic Properties Ltd. | 27,354,000 | | 68,043,681 |
Common Stocks - continued |
| Shares | | Value |
Singapore - continued |
Super Group Ltd. Singapore | 1,786,000 | | $ 6,053,019 |
United Overseas Bank Ltd. | 4,164,000 | | 69,858,123 |
TOTAL SINGAPORE | | 143,954,823 |
South Africa - 1.0% |
Nampak Ltd. | 16,922,830 | | 55,966,924 |
Naspers Ltd. Class N | 2,175,499 | | 203,490,830 |
TOTAL SOUTH AFRICA | | 259,457,754 |
Spain - 2.8% |
Amadeus IT Holding SA Class A (d) | 2,823,700 | | 104,856,582 |
Antena 3 de Television SA | 1,667,355 | | 27,958,563 |
Banco Bilbao Vizcaya Argentaria SA | 4,493,774 | | 52,518,429 |
Grifols SA ADR | 2,518,972 | | 75,972,196 |
Iberdrola SA | 11,191,411 | | 70,323,100 |
Inditex SA | 1,890,816 | | 310,637,907 |
Prosegur Compania de Seguridad SA (Reg.) | 12,418,795 | | 73,853,891 |
TOTAL SPAIN | | 716,120,668 |
Sweden - 2.4% |
ASSA ABLOY AB (B Shares) | 1,252,200 | | 62,165,067 |
Atlas Copco AB (A Shares) | 2,213,000 | | 61,403,446 |
Investment AB Kinnevik (B Shares) | 1,458,600 | | 53,751,696 |
Nordea Bank AB | 10,400,400 | | 133,213,972 |
Svenska Cellulosa AB (SCA) (B Shares) | 6,422,000 | | 182,351,679 |
Svenska Handelsbanken AB (A Shares) | 2,716,400 | | 123,075,445 |
TOTAL SWEDEN | | 615,961,305 |
Switzerland - 6.1% |
Actelion Ltd. | 233,154 | | 18,051,544 |
Compagnie Financiere Richemont SA Series A | 1,379,631 | | 141,483,071 |
Credit Suisse Group | 6,601,990 | | 205,374,485 |
Nestle SA | 4,785,521 | | 345,437,855 |
Roche Holding AG (participation certificate) | 632,260 | | 175,041,287 |
Schindler Holding AG (Reg.) | 353,535 | | 50,262,870 |
SGS SA (Reg.) | 18,860 | | 44,190,621 |
Syngenta AG (Switzerland) | 644,364 | | 260,076,067 |
UBS AG | 18,330,345 | | 354,528,485 |
TOTAL SWITZERLAND | | 1,594,446,285 |
Taiwan - 0.5% |
Taiwan Semiconductor Manufacturing Co. Ltd. sponsored ADR | 6,905,200 | | 127,124,732 |
United Kingdom - 16.9% |
Alabama Noor Hospitals Group PLC (a) | 2,676,300 | | 36,475,025 |
Associated British Foods PLC | 2,026,200 | | 73,650,502 |
Barclays PLC | 40,385,772 | | 169,921,759 |
Barratt Developments PLC | 4,998,800 | | 26,858,519 |
BG Group PLC | 8,681,479 | | 177,269,716 |
|
| Shares | | Value |
British American Tobacco PLC sponsored ADR | 1,999,000 | | $ 220,869,510 |
BT Group PLC | 20,845,600 | | 126,129,090 |
Bunzl PLC | 929,270 | | 20,517,183 |
Capita Group PLC | 3,167,600 | | 50,078,248 |
Compass Group PLC | 5,541,800 | | 79,704,928 |
Diageo PLC | 1,645,474 | | 52,453,563 |
Domino's Pizza UK & IRL PLC | 4,563,900 | | 42,882,058 |
easyJet PLC | 2,478,300 | | 52,015,815 |
Filtrona PLC | 8,980,312 | | 112,816,418 |
GlaxoSmithKline PLC | 4,672,200 | | 123,170,301 |
Hikma Pharmaceuticals PLC | 3,052,187 | | 58,775,458 |
HSBC Holdings PLC sponsored ADR (d) | 8,309,757 | | 457,369,025 |
IMI PLC | 1,597,100 | | 38,898,402 |
InterContinental Hotel Group PLC | 2,038,600 | | 59,398,208 |
ITV PLC | 8,565,800 | | 26,218,977 |
Jazztel PLC (a) | 2,482,100 | | 27,230,176 |
Johnson Matthey PLC | 1,428,782 | | 68,818,908 |
Kingfisher PLC | 26,551,331 | | 160,710,826 |
Lloyds Banking Group PLC (a) | 111,498,600 | | 137,901,387 |
Meggitt PLC | 6,294,751 | | 57,782,447 |
Next PLC | 3,058,300 | | 267,005,280 |
Prudential PLC | 13,357,675 | | 273,174,663 |
Reckitt Benckiser Group PLC | 2,078,087 | | 161,535,588 |
Reed Elsevier PLC | 2,213,400 | | 31,017,959 |
Rolls-Royce Group PLC | 9,405,600 | | 173,430,799 |
Royal Dutch Shell PLC Class B sponsored ADR | 1,225,437 | | 85,192,380 |
SABMiller PLC | 2,010,000 | | 104,871,019 |
Serco Group PLC | 6,453,683 | | 57,637,443 |
Spectris PLC | 1,050,200 | | 38,931,553 |
Standard Chartered PLC (United Kingdom) | 8,814,556 | | 211,928,220 |
Taylor Wimpey PLC | 53,579,800 | | 94,672,656 |
Travis Perkins PLC | 2,801,680 | | 83,375,487 |
Vodafone Group PLC sponsored ADR | 7,366,000 | | 271,216,120 |
Whitbread PLC | 1,512,063 | | 83,231,088 |
TOTAL UNITED KINGDOM | | 4,395,136,704 |
United States of America - 6.9% |
AbbVie, Inc. | 2,850,600 | | 138,111,570 |
Alexion Pharmaceuticals, Inc. (a) | 421,700 | | 51,848,015 |
Amgen, Inc. | 219,400 | | 25,450,400 |
Anadarko Petroleum Corp. | 438,300 | | 41,765,607 |
BioMarin Pharmaceutical, Inc. (a) | 571,200 | | 35,882,784 |
Boston Scientific Corp. (a) | 2,135,700 | | 24,966,333 |
Celldex Therapeutics, Inc. (a) | 501,313 | | 11,485,081 |
D.R. Horton, Inc. | 2,016,200 | | 38,206,990 |
Fidelity National Information Services, Inc. | 809,600 | | 39,468,000 |
Gilead Sciences, Inc. (a) | 2,435,500 | | 172,896,145 |
Google, Inc. Class A (a) | 65,805 | | 67,817,317 |
Las Vegas Sands Corp. | 2,375,400 | | 166,800,588 |
Common Stocks - continued |
| Shares | | Value |
United States of America - continued |
MasterCard, Inc. Class A | 222,260 | | $ 159,382,646 |
McGraw-Hill Companies, Inc. | 1,723,800 | | 120,114,384 |
Monsanto Co. | 558,300 | | 58,554,504 |
Noble Energy, Inc. | 1,574,656 | | 117,988,974 |
Perrigo Co. | 584,500 | | 80,596,705 |
PriceSmart, Inc. | 274,700 | | 31,258,113 |
The Blackstone Group LP | 1,890,400 | | 49,679,712 |
Time Warner, Inc. | 813,800 | | 55,940,612 |
Twenty-First Century Fox, Inc. Class B | 1,847,200 | | 62,804,800 |
ViroPharma, Inc. (a) | 1,457,884 | | 56,595,057 |
Visa, Inc. Class A | 753,700 | | 148,230,179 |
Yum! Brands, Inc. | 583,100 | | 39,429,222 |
TOTAL UNITED STATES OF AMERICA | | 1,795,273,738 |
TOTAL COMMON STOCKS (Cost $18,367,711,252) |
24,804,056,123
|
Preferred Stocks - 1.7% |
| | | |
Convertible Preferred Stocks - 0.0% |
United States of America - 0.0% |
NJOY, Inc. Series C (h) | 770,400 | | 6,224,832 |
Nonconvertible Preferred Stocks - 1.7% |
Germany - 1.7% |
Henkel AG & Co. KGaA | 1,693,200 | | 183,225,702 |
Volkswagen AG | 978,626 | | 248,738,154 |
TOTAL GERMANY | | 431,963,856 |
United Kingdom - 0.0% |
Rolls-Royce Group PLC Series C | 808,881,600 | | 1,296,961 |
TOTAL NONCONVERTIBLE PREFERRED STOCKS | | 433,260,817 |
TOTAL PREFERRED STOCKS (Cost $272,467,335) |
439,485,649
|
Investment Companies - 0.3% |
| | | |
United States of America - 0.3% |
WisdomTree Japan Hedged Equity ETF
(Cost $67,418,863) | 1,335,900 | |
63,695,712
|
Government Obligations - 0.0% |
| Principal Amount | | Value |
United States of America - 0.0% |
U.S. Treasury Bills, yield at date of purchase 0.02% to 0.05% 11/7/13 to 1/2/14 (g)
(Cost $10,299,799) | | $ 10,300,000 | | $ 10,299,786 |
Money Market Funds - 3.1% |
| Shares | | |
Fidelity Cash Central Fund, 0.09% (b) | 532,429,162 | | 532,429,162 |
Fidelity Securities Lending Cash Central Fund, 0.09% (b)(c) | 271,682,888 | | 271,682,888 |
TOTAL MONEY MARKET FUNDS (Cost $804,112,050) |
804,112,050
|
TOTAL INVESTMENT PORTFOLIO - 100.6% (Cost $19,522,009,299) | | 26,121,649,320 |
NET OTHER ASSETS (LIABILITIES) - (0.6)% | | (147,464,399) |
NET ASSETS - 100% | $ 25,974,184,921 |
Futures Contracts |
| Expiration
Date | | Underlying
Face Amount
at Value | | Unrealized
Appreciation/
(Depreciation) |
Purchased |
Equity Index Contracts |
2,328 Nikkei 225 Index Contracts (Japan) | Dec. 2013 | | $ 168,372,600 | | $ 6,276,288 |
|
The face value of futures purchased as a percentage of net assets is 0.6% |
Security Type Abbreviations |
ETF | - | Exchange-Traded Fund |
Legend |
(a) Non-income producing |
(b) Affiliated fund that is generally available only to investment companies and other accounts managed by Fidelity Investments. The rate quoted is the annualized seven-day yield of the fund at period end. A complete unaudited listing of the fund's holdings as of its most recent quarter end is available upon request. In addition, each Fidelity Central Fund's financial statements, which are not covered by the Fund's Report of Independent Registered Public Accounting Firm, are available on the SEC's website or upon request. |
(c) Investment made with cash collateral received from securities on loan. |
(d) Security or a portion of the security is on loan at period end. |
(e) Affiliated company |
(f) Security exempt from registration under Rule 144A of the Securities Act of 1933. These securities may be resold in transactions exempt from registration, normally to qualified institutional buyers. At the end of the period, the value of these securities amounted to $9,595,190 or 0.0% of net assets. |
(g) Security or a portion of the security was pledged to cover margin requirements for futures contracts. At period end, the value of securities pledged amounted to $10,299,786. |
(h) Restricted securities - Investment in securities not registered under the Securities Act of 1933 (excluding 144A issues). At the end of the period, the value of restricted securities (excluding 144A issues) amounted to $6,224,832 or 0.0% of net assets. |
Additional information on each restricted holding is as follows: |
Security | Acquisition Date | Acquisition Cost |
NJOY, Inc. Series C | 6/7/13 | $ 6,227,143 |
Affiliated Central Funds |
Information regarding fiscal year to date income earned by the Fund from investments in Fidelity Central Funds is as follows: |
Fund | Income earned |
Fidelity Cash Central Fund | $ 1,410,943 |
Fidelity Securities Lending Cash Central Fund | 13,567,672 |
Total | $ 14,978,615 |
Other Affiliated Issuers |
An affiliated company is a company in which the Fund has ownership of at least 5% of the voting securities. Fiscal year to date transactions with companies which are or were affiliates are as follows: |
Affiliate | Value,
beginning of
period | Purchases | Sales
Proceeds | Dividend
Income | Value,
end of
period |
3Legs Resources PLC | $ 4,046,188 | $ - | $ 2,553,704 | $ - | $ - |
Pactera Technology International Ltd. ADR (formerly HiSoft Technology International Ltd. ADR) | 17,640,142 | - | 15,572,364 | - | - |
Painted Pony Petroleum Ltd. (144A) | 26,878,078 | - | 9,015,534 | - | 9,595,190 |
Painted Pony Petroleum Ltd. | 43,070,995 | - | 589,323 | - | 25,702,824 |
Total | $ 91,635,403 | $ - | $ 27,730,925 | $ - | $ 35,298,014 |
Other Information |
Categorizations in the Schedule of Investments are based on country or territory of incorporation. |
The following is a summary of the inputs used, as of October 31, 2013, involving the Fund's assets and liabilities carried at fair value. The inputs or methodology used for valuing securities may not be an indication of the risk associated with investing in those securities. For more information on valuation inputs, and their aggregation into the levels used in the tables below, please refer to the Investment Valuation section in the accompanying Notes to Financial Statements. |
Valuation Inputs at Reporting Date: |
Description | Total | Level 1 | Level 2 | Level 3 |
Investments in Securities: | | | | |
Equities: | | | | |
Consumer Discretionary | $ 4,629,772,221 | $ 3,685,070,697 | $ 938,476,692 | $ 6,224,832 |
Consumer Staples | 3,081,166,976 | 1,423,052,629 | 1,658,107,218 | 7,129 |
Energy | 854,615,737 | 854,615,737 | - | - |
Financials | 6,222,865,829 | 3,264,337,136 | 2,958,528,693 | - |
Health Care | 3,368,941,602 | 2,100,153,705 | 1,268,787,897 | - |
Industrials | 1,882,344,502 | 1,803,994,565 | 78,349,937 | - |
Information Technology | 2,199,144,042 | 1,342,307,518 | 856,836,524 | - |
Materials | 1,629,493,183 | 1,272,479,810 | 357,013,373 | - |
Telecommunication Services | 1,304,874,580 | 606,960,402 | 697,914,178 | - |
Utilities | 70,323,100 | 70,323,100 | - | - |
Investment Companies | 63,695,712 | 63,695,712 | - | - |
Government Obligations | 10,299,786 | - | 10,299,786 | - |
Money Market Funds | 804,112,050 | 804,112,050 | - | - |
Total Investments in Securities: | $ 26,121,649,320 | $ 17,291,103,061 | $ 8,824,314,298 | $ 6,231,961 |
Derivative Instruments: | | | | |
Assets | | | | |
Futures Contracts | $ 6,276,288 | $ 6,276,288 | $ - | $ - |
The following is a summary of transfers between Level 1 and Level 2 for the period ended October 31, 2013. Transfers are assumed to have occurred at the beginning of the period, and are primarily attributable to the valuation techniques used for foreign equity securities, as discussed in the accompanying Notes to Financial Statements: |
Transfers | Total |
Level 1 to Level 2 | $ 2,421,885,219 |
Level 2 to Level 1 | $ 0 |
Value of Derivative Instruments |
The following table is a summary of the Fund's value of derivative instruments by primary risk exposure as of October 31, 2013. For additional information on derivative instruments, please refer to the Derivative Instruments section in the accompanying Notes to Financial Statements. |
Primary Risk Exposure /
Derivative Type | Value |
| Asset | Liability |
Equity Risk | | |
Futures Contracts (a) | $ 6,276,288 | $ - |
Total Value of Derivatives | $ 6,276,288 | $ - |
(a) Reflects gross cumulative appreciation (depreciation) on futures contracts as presented in the Schedule of Investments. Only the period end receivable or payable for daily variation margin and net unrealized appreciation (depreciation) are presented in the Statement of Assets and Liabilities. |
See accompanying notes which are an integral part of the financial statements.
Annual Report
Fidelity Diversified International Fund
Statement of Assets and Liabilities
| October 31, 2013 |
| | |
Assets | | |
Investment in securities, at value (including securities loaned of $264,158,421) - See accompanying schedule: Unaffiliated issuers (cost $18,676,066,715) | $ 25,282,239,256 | |
Fidelity Central Funds (cost $804,112,050) | 804,112,050 | |
Other affiliated issuers (cost $41,830,534) | 35,298,014 | |
Total Investments (cost $19,522,009,299) | | $ 26,121,649,320 |
Receivable for investments sold | | 134,527,377 |
Receivable for fund shares sold | | 14,496,298 |
Dividends receivable | | 69,280,792 |
Distributions receivable from Fidelity Central Funds | | 133,099 |
Prepaid expenses | | 79,941 |
Other receivables | | 1,917,110 |
Total assets | | 26,342,083,937 |
| | |
Liabilities | | |
Payable for investments purchased | $ 61,287,679 | |
Payable for fund shares redeemed | 13,520,941 | |
Accrued management fee | 15,156,326 | |
Payable for daily variation margin for derivative instruments | 1,455,000 | |
Other affiliated payables | 2,800,113 | |
Other payables and accrued expenses | 1,996,069 | |
Collateral on securities loaned, at value | 271,682,888 | |
Total liabilities | | 367,899,016 |
| | |
Net Assets | | $ 25,974,184,921 |
Net Assets consist of: | | |
Paid in capital | | $ 20,330,411,409 |
Undistributed net investment income | | 238,578,397 |
Accumulated undistributed net realized gain (loss) on investments and foreign currency transactions | | (1,203,391,143) |
Net unrealized appreciation (depreciation) on investments and assets and liabilities in foreign currencies | | 6,608,586,258 |
Net Assets | | $ 25,974,184,921 |
| | |
Diversified International:
Net Asset Value, offering price and redemption price per share ($14,432,586,233 ÷ 402,095,782 shares) | | $ 35.89 |
| | |
Class K:
Net Asset Value, offering price and redemption price per share ($11,541,598,688 ÷ 321,748,785 shares) | | $ 35.87 |
Statement of Operations
| Year ended October 31, 2013 |
| | |
Investment Income | | |
Dividends | | $ 577,013,483 |
Interest | | 102,685 |
Income from Fidelity Central Funds | | 14,978,615 |
Income before foreign taxes withheld | | 592,094,783 |
Less foreign taxes withheld | | (43,282,775) |
Total income | | 548,812,008 |
| | |
Expenses | | |
Management fee
Basic fee | $ 167,562,560 | |
Performance adjustment | 5,795,026 | |
Transfer agent fees | 30,945,968 | |
Accounting and security lending fees | 2,433,181 | |
Custodian fees and expenses | 2,627,354 | |
Independent trustees' compensation | 136,354 | |
Appreciation in deferred trustee compensation account | 51 | |
Registration fees | 181,611 | |
Audit | 192,812 | |
Legal | 95,751 | |
Miscellaneous | 198,274 | |
Total expenses before reductions | 210,168,942 | |
Expense reductions | (4,638,378) | 205,530,564 |
Net investment income (loss) | | 343,281,444 |
Realized and Unrealized Gain (Loss) Net realized gain (loss) on: | | |
Investment securities: | | |
Unaffiliated issuers | 1,946,572,950 | |
Other affiliated issuers | (42,988,742) | |
Foreign currency transactions | (1,688,743) | |
Futures contracts | 12,934,707 | |
Total net realized gain (loss) | | 1,914,830,172 |
Change in net unrealized appreciation (depreciation) on: Investment securities | 3,209,792,516 | |
Assets and liabilities in foreign currencies | 1,716,266 | |
Futures contracts | 6,276,288 | |
Total change in net unrealized appreciation (depreciation) | | 3,217,785,070 |
Net gain (loss) | | 5,132,615,242 |
Net increase (decrease) in net assets resulting from operations | | $ 5,475,896,686 |
See accompanying notes which are an integral part of the financial statements.
Annual Report
Statement of Changes in Net Assets
| Year ended
October 31,
2013 | Year ended
October 31,
2012 |
Increase (Decrease) in Net Assets | | |
Operations | | |
Net investment income (loss) | $ 343,281,444 | $ 362,378,873 |
Net realized gain (loss) | 1,914,830,172 | 522,680,347 |
Change in net unrealized appreciation (depreciation) | 3,217,785,070 | 777,447,571 |
Net increase (decrease) in net assets resulting from operations | 5,475,896,686 | 1,662,506,791 |
Distributions to shareholders from net investment income | (361,491,947) | (460,432,289) |
Distributions to shareholders from net realized gain | (51,508,245) | - |
Total distributions | (413,000,192) | (460,432,289) |
Share transactions - net increase (decrease) | (1,244,167,482) | (4,619,314,396) |
Redemption fees | 382,374 | 414,440 |
Total increase (decrease) in net assets | 3,819,111,386 | (3,416,825,454) |
| | |
Net Assets | | |
Beginning of period | 22,155,073,535 | 25,571,898,989 |
End of period (including undistributed net investment income of $238,578,397 and undistributed net investment income of $320,513,134, respectively) | $ 25,974,184,921 | $ 22,155,073,535 |
Financial Highlights - Diversified International
Years ended October 31, | 2013 | 2012 | 2011 | 2010 | 2009 |
Selected Per-Share Data | | | | | |
Net asset value, beginning of period | $ 29.07 | $ 27.49 | $ 29.49 | $ 26.86 | $ 21.96 |
Income from Investment Operations | | | | | |
Net investment income (loss) B | .44 | .42 | .53 E | .37 | .35 |
Net realized and unrealized gain (loss) | 6.90 | 1.65 | (1.99) | 2.61 | 4.86 |
Total from investment operations | 7.34 | 2.07 | (1.46) | 2.98 | 5.21 |
Distributions from net investment income | (.46) | (.49) | (.46) | (.35) | (.31) |
Distributions from net realized gain | (.07) | - | (.08) | - | - |
Total distributions | (.52) H | (.49) | (.54) | (.35) | (.31) |
Redemption fees added to paid in capital B, G | - | - | - | - | - |
Net asset value, end of period | $ 35.89 | $ 29.07 | $ 27.49 | $ 29.49 | $ 26.86 |
Total Return A | 25.66% | 7.72% | (5.07)% | 11.15% | 24.32% |
Ratios to Average Net Assets C, F | | | | | |
Expenses before reductions | .94% | 1.01% | .90% | .98% | 1.01% |
Expenses net of fee waivers, if any | .94% | 1.01% | .89% | .98% | 1.01% |
Expenses net of all reductions | .92% | .99% | .87% | .96% | .99% |
Net investment income (loss) | 1.38% | 1.53% | 1.78% E | 1.34% | 1.58% |
Supplemental Data | | | | | |
Net assets, end of period (000 omitted) | $ 14,432,586 | $ 13,269,769 | $ 17,285,369 | $ 26,527,229 | $ 30,998,270 |
Portfolio turnover rate D | 52% | 35% | 45% | 57% | 54% |
A Total returns would have been lower if certain expenses had not been reduced during the applicable periods shown.
B Calculated based on average shares outstanding during the period.
C Fees and expenses of any underlying Fidelity Central Funds are not included in the Fund's expense ratio. The Fund indirectly bears its proportionate share of the expenses of any underlying Fidelity Central Funds.
D Amount does not include the portfolio activity of any underlying Fidelity Central Funds.
E Investment income per share reflects a large, non-recurring dividend which amounted to $.10 per share. Excluding this non-recurring dividend, the ratio of net investment income (loss) to average net assets would have been 1.44%.
F Expense ratios reflect operating expenses of the class. Expenses before reductions do not reflect amounts reimbursed by the investment adviser or reductions from brokerage service arrangements or reductions from other expense offset arrangements and do not represent the amount paid by the class during periods when reimbursements or reductions occur. Expenses net of fee waivers reflect expenses after reimbursement by the investment adviser but prior to reductions from brokerage service arrangements or other expense offset arrangements. Expenses net of all reductions represent the net expenses paid by the class.
G Amount represents less than $.01 per share.
H Total distributions of $0.52 per share is comprised of distributions from net investment income of $0.456 and distributions from net realized gain of $0.068 per share.
See accompanying notes which are an integral part of the financial statements.
Annual Report
Financial Highlights - Class K
Years ended October 31, | 2013 | 2012 | 2011 | 2010 | 2009 |
Selected Per-Share Data | | | | | |
Net asset value, beginning of period | $ 29.06 | $ 27.51 | $ 29.51 | $ 26.89 | $ 21.98 |
Income from Investment Operations | | | | | |
Net investment income (loss) B | .49 | .47 | .58 E | .42 | .42 |
Net realized and unrealized gain (loss) | 6.90 | 1.63 | (1.97) | 2.61 | 4.85 |
Total from investment operations | 7.39 | 2.10 | (1.39) | 3.03 | 5.27 |
Distributions from net investment income | (.51) | (.55) | (.53) | (.41) | (.36) |
Distributions from net realized gain | (.07) | - | (.08) | - | - |
Total distributions | (.58) | (.55) | (.61) | (.41) | (.36) |
Redemption fees added to paid in capital B, G | - | - | - | - | - |
Net asset value, end of period | $ 35.87 | $ 29.06 | $ 27.51 | $ 29.51 | $ 26.89 |
Total Return A | 25.86% | 7.86% | (4.87)% | 11.33% | 24.64% |
Ratios to Average Net Assets C, F | | | | | |
Expenses before reductions | .80% | .84% | .73% | .79% | .77% |
Expenses net of fee waivers, if any | .80% | .84% | .72% | .79% | .77% |
Expenses net of all reductions | .78% | .83% | .70% | .77% | .76% |
Net investment income (loss) | 1.52% | 1.70% | 1.95% E | 1.54% | 1.81% |
Supplemental Data | | | | | |
Net assets, end of period (000 omitted) | $ 11,541,599 | $ 8,885,304 | $ 8,115,192 | $ 7,697,405 | $ 4,713,909 |
Portfolio turnover rate D | 52% | 35% | 45% | 57% | 54% |
A Total returns would have been lower if certain expenses had not been reduced during the applicable periods shown.
B Calculated based on average shares outstanding during the period.
C Fees and expenses of any underlying Fidelity Central Funds are not included in the Fund's expense ratio. The Fund indirectly bears its proportionate share of the expenses of any underlying Fidelity Central Funds.
D Amount does not include the portfolio activity of any underlying Fidelity Central Funds.
E Investment income per share reflects a large, non-recurring dividend which amounted to $.10 per share. Excluding this non-recurring dividend, the ratio of net investment income (loss) to average net assets would have been 1.61%.
F Expense ratios reflect operating expenses of the class. Expenses before reductions do not reflect amounts reimbursed by the investment adviser or reductions from brokerage service arrangements or reductions from other expense offset arrangements and do not represent the amount paid by the class during periods when reimbursements or reductions occur. Expenses net of fee waivers reflect expenses after reimbursement by the investment adviser but prior to reductions from brokerage service arrangements or other expense offset arrangements. Expenses net of all reductions represent the net expenses paid by the class.
G Amount represents less than $.01 per share.
See accompanying notes which are an integral part of the financial statements.
Annual Report
Fidelity Diversified International Fund
Notes to Financial Statements
For the period ended October 31, 2013
1. Organization.
Fidelity Diversified International Fund (the Fund) is a fund of Fidelity Investment Trust (the Trust) and is authorized to issue an unlimited number of shares. The Trust is registered under the Investment Company Act of 1940, as amended (the 1940 Act), as an open-end management investment company organized as a Massachusetts business trust. The Fund offers Diversified International and Class K shares, each of which has equal rights as to assets and voting privileges. The Fund offered Class F shares during the period June 26, 2009 through December 16, 2011, and all outstanding shares were redeemed by December 16, 2011. Each class has exclusive voting rights with respect to matters that affect that class.
2. Investments in Fidelity Central Funds.
The Fund invests in Fidelity Central Funds, which are open-end investment companies generally available only to other investment companies and accounts managed by Fidelity Management & Research Company (FMR) and its affiliates. The Fund's Schedule of Investments lists each of the Fidelity Central Funds held as of period end, if any, as an investment of the Fund, but does not include the underlying holdings of each Fidelity Central Fund. As an Investing Fund, the Fund indirectly bears its proportionate share of the expenses of the underlying Fidelity Central Funds.
The Money Market Central Funds seek preservation of capital and current income and are managed by Fidelity Investments Money Management, Inc. (FIMM), an affiliate of FMR.
A complete unaudited list of holdings for each Fidelity Central Fund is available upon request or at the Securities and Exchange Commission (the SEC) website at www.sec.gov. In addition, the financial statements of the Fidelity Central Funds, which are not covered by the Fund's Report of Independent Registered Public Accounting Firm, are available on the SEC website or upon request.
3. Significant Accounting Policies.
The financial statements have been prepared in conformity with accounting principles generally accepted in the United States of America (GAAP), which require management to make certain estimates and assumptions at the date of the financial statements. Actual results could differ from those estimates. Subsequent events, if any, through the date that the financial statements were issued have been evaluated in the preparation of the financial statements. The following summarizes the significant accounting policies of the Fund:
Investment Valuation. Investments are valued as of 4:00 p.m. Eastern time on the last calendar day of the period. In accordance with valuation policies and procedures approved by the Board of Trustees (the Board), the Fund attempts to obtain prices from one or more third party pricing vendors or brokers to value its investments. When current market prices, quotations or currency exchange rates are not readily available or reliable, investments will be fair valued in good faith by the FMR Fair Value Committee (the Committee), in accordance with procedures adopted by the Board. Factors used in determining fair value vary by investment type and may include market or investment specific events, changes in interest rates and credit quality. The frequency with which these procedures are used cannot be predicted and they may be utilized to a significant extent. The Committee oversees the Fund's valuation policies and procedures and is responsible for approving and reporting to the Board all fair value determinations.
The Fund categorizes the inputs to valuation techniques used to value its investments into a disclosure hierarchy consisting of three levels as shown below:
Level 1 - quoted prices in active markets for identical investments
Level 2 - other significant observable inputs (including quoted prices for similar investments, interest rates, prepayment speeds, etc.)
Level 3 - unobservable inputs (including the Fund's own assumptions based on the best information available)
Valuation techniques used to value the Fund's investments by major category are as follows:
Equity securities, including restricted securities, for which market quotations are readily available, are valued at the last reported sale price or official closing price as reported by a third party pricing vendor on the primary market or exchange on which they are traded and are categorized as Level 1 in the hierarchy. In the event there were no sales during the day or closing prices are not available, securities are valued at the last quoted bid price or may be valued using the last available price and are generally categorized as Level 2 in the hierarchy. For foreign equity securities, when market or security specific events arise, comparisons to the valuation of American Depositary Receipts (ADRs), futures contracts, Exchange-Traded Funds (ETFs) and certain indexes as well as quoted prices for similar securities may be used and would be categorized as Level 2 in the hierarchy. Utilizing these techniques may result in transfers between Level 1 and Level 2. For equity securities, including restricted securities, where observable inputs are limited, assumptions about market activity and risk are used and these securities may be categorized as Level 3 in the hierarchy.
Debt securities, including restricted securities, are valued based on evaluated prices received from third party pricing vendors or from brokers who make markets in such securities. For U.S. government and government agency obligations, pricing vendors utilize matrix pricing which considers yield or price of bonds of comparable quality, coupon, maturity and type as well as broker-supplied prices. When independent prices are unavailable or unreliable, debt securities may be valued utilizing pricing methodologies which consider similar factors that would be used by third party pricing
Annual Report
3. Significant Accounting Policies - continued
Investment Valuation - continued
vendors. Debt securities are generally categorized as Level 2 in the hierarchy but may be Level 3 depending on the circumstances. ETFs are valued at their last sale price or official closing price as reported by a third party pricing vendor on the primary market or exchange on which they are traded and are categorized as Level 1 in the hierarchy. In the event there were no sales during the day but the exchange reports a closing bid level, ETFs are valued at the closing bid and would be categorized as Level 1 in the hierarchy. In the event there was no closing bid, ETFs may be valued by another method that the Board believes reflects fair value in accordance with the Board's fair value pricing policies and may be categorized as Level 2 in the hierarchy.
Futures contracts are valued at the settlement price established each day by the board of trade or exchange on which they are traded and are categorized as Level 1 in the hierarchy. Investments in open-end mutual funds, including the Fidelity Central Funds, are valued at their closing net asset value (NAV) each business day and are categorized as Level 1 in the hierarchy.
Changes in valuation techniques may result in transfers in or out of an assigned level within the disclosure hierarchy. The aggregate value of investments by input level, as of October 31, 2013, including information on transfers between Levels 1 and 2, is included at the end of the Fund's Schedule of Investments.
Foreign Currency. The Fund may use foreign currency contracts to facilitate transactions in foreign-denominated securities. Gains and losses from these transactions may arise from changes in the value of the foreign currency or if the counterparties do not perform under the contracts' terms.
Foreign-denominated assets, including investment securities, and liabilities are translated into U.S. dollars at the exchange rates at period end. Purchases and sales of investment securities, income and dividends received and expenses denominated in foreign currencies are translated into U.S. dollars at the exchange rate in effect on the transaction date.
The effects of exchange rate fluctuations on investments are included with the net realized and unrealized gain (loss) on investment securities. Other foreign currency transactions resulting in realized and unrealized gain (loss) are disclosed separately.
Investment Transactions and Income. For financial reporting purposes, the Fund's investment holdings and NAV include trades executed through the end of the last business day of the period. The NAV per share for processing shareholder transactions is calculated as of the close of business of the New York Stock Exchange (NYSE), normally 4:00 p.m. Eastern time and includes trades executed through the end of the prior business day. Gains and losses on securities sold are determined on the basis of identified cost and may include proceeds received from litigation. Dividend income is recorded on the ex-dividend date, except for certain dividends from foreign securities where the ex-dividend date may have passed, which are recorded as soon as the Fund is informed of the ex-dividend date. Non-cash dividends included in dividend income, if any, are recorded at the fair market value of the securities received. Distributions received on securities that represent a return of capital or capital gain are recorded as a reduction of cost of investments and/or as a realized gain. Subsequent to ex-dividend date the Fund determines the components of these distributions, based upon receipt of tax filings or other correspondence relating to the underlying investment. Interest income and distributions from the Fidelity Central Funds are accrued as earned. Interest income includes coupon interest and amortization of premium and accretion of discount on debt securities. Investment income is recorded net of foreign taxes withheld where recovery of such taxes is uncertain.
Class Allocations and Expenses. Investment income, realized and unrealized capital gains and losses, common expenses of the Fund, and certain fund-level expense reductions, if any, are allocated daily on a pro-rata basis to each class based on the relative net assets of each class to the total net assets of the Fund. Each class differs with respect to transfer agent fees incurred. Certain expense reductions may also differ by class. For the reporting period, the allocated portion of income and expenses to each class as a percent of its average net assets may vary due to the timing of recording these transactions in relation to fluctuating net assets of the classes. Expenses directly attributable to a fund are charged to that fund. Expenses attributable to more than one fund are allocated among the respective funds on the basis of relative net assets or other appropriate methods. Expense estimates are accrued in the period to which they relate and adjustments are made when actual amounts are known.
Deferred Trustee Compensation. Under a Deferred Compensation Plan (the Plan), independent Trustees may elect to defer receipt of a portion of their annual compensation. Deferred amounts are invested in a cross-section of Fidelity funds, are marked-to-market and remain in the Fund until distributed in accordance with the Plan. The investment of deferred amounts and the offsetting payable to the Trustees are included in the accompanying Statement of Assets and Liabilities.
Income Tax Information and Distributions to Shareholders. Each year, the Fund intends to qualify as a regulated investment company under Subchapter M of the Internal Revenue Code, including distributing substantially all of its taxable income and realized gains. As a result, no provision for U.S. Federal income taxes is required. As of October 31, 2013, the Fund did not have any unrecognized tax benefits in the financial statements; nor is the Fund aware of any tax positions for which it is reasonably possible that the total amounts of unrecognized tax benefits will significantly change in the next twelve months. The Fund files a U.S. federal tax return, in addition to state and local tax returns as required. The Fund's federal income tax returns are subject to examination by the Internal Revenue Service (IRS) for a period of three fiscal years after they are filed. State and local tax
Annual Report
Fidelity Diversified International Fund
Notes to Financial Statements - continued
3. Significant Accounting Policies - continued
Income Tax Information and Distributions to Shareholders - continued
returns may be subject to examination for an additional fiscal year depending on the jurisdiction. Foreign taxes are provided for based on the Fund's understanding of the tax rules and rates that exist in the foreign markets in which it invests.
Distributions are declared and recorded on the ex-dividend date. Income dividends and capital gain distributions are declared separately for each class. Income and capital gain distributions are determined in accordance with income tax regulations, which may differ from GAAP. In addition, the Fund claimed a portion of the payment made to redeeming shareholders as a distribution for income tax purposes.
Capital accounts within the financial statements are adjusted for permanent book-tax differences. These adjustments have no impact on net assets or the results of operations. Temporary book-tax differences will reverse in a subsequent period.
Book-tax differences are primarily due to futures contracts, foreign currency transactions, passive foreign investment companies (PFIC), partnerships, deferred trustees compensation, capital loss carryforwards and losses deferred due to wash sales.
The federal tax cost of investment securities and unrealized appreciation (depreciation) as of period end were as follows:
Gross unrealized appreciation | $ 6,473,560,954 |
Gross unrealized depreciation | (199,424,466) |
Net unrealized appreciation (depreciation) on securities and other investments | $ 6,274,136,488 |
| |
Tax Cost | $ 19,847,512,832 |
The tax-based components of distributable earnings as of period end were as follows:
Undistributed ordinary income | $ 407,009,198 |
Capital loss carryforward | $ (1,038,927,073) |
Net unrealized appreciation (depreciation) | $ 6,276,806,437 |
Capital loss carryforwards are only available to offset future capital gains of the Fund to the extent provided by regulations and may be limited. Under the Regulated Investment Company Modernization Act of 2010 (the Act), the Fund is permitted to carry forward capital losses incurred in taxable years beginning after December 22, 2010 for an unlimited period and such capital losses are required to be used prior to any losses that expire. The capital loss carryforward information presented below, including any applicable limitation, is estimated as of fiscal period end and is subject to adjustment.
Fiscal year of expiration | |
| |
2017 | $ (419,355,221) |
2018 | (619,571,852) |
Total capital loss carryforward | $ (1,038,927,073) |
The tax character of distributions paid was as follows:
| October 31, 2013 | October 31, 2012 |
Ordinary Income | $ 413,000,192 | $ 460,432,289 |
Short-Term Trading (Redemption) Fees. Shares held by investors in the Fund less than 30 days may have been subject to a redemption fee equal to 1.00% of the net asset value of shares redeemed. All redemption fees, which reduce the proceeds of the shareholder redemption, are retained by the Fund and accounted for as an addition to paid in capital.
Restricted Securities. The Fund may invest in securities that are subject to legal or contractual restrictions on resale. These securities generally may be resold in transactions exempt from registration or to the public if the securities are registered. Disposal of these securities may involve time-consuming negotiations and expense, and prompt sale at an acceptable price may be difficult. Information regarding restricted securities is included at the end of the Fund's Schedule of Investments.
New Accounting Pronouncement. The Financial Accounting Standards Board issued in December 2011, Accounting Standard Update No. 2011-11, Disclosures about Offsetting Assets and Liabilities, and in January 2013, Accounting Standards Update No. 2013-1 Clarifying the Scope of Disclosures about Offsetting Assets and Liabilities. These updates create new disclosure requirements requiring entities to disclose both gross and net information
Annual Report
3. Significant Accounting Policies - continued
New Accounting Pronouncement - continued
for derivatives and other financial instruments that are either offset in the Statement of Assets and Liabilities or subject to an enforceable master netting arrangement or similar agreement. The disclosure requirements are effective for annual reporting periods beginning on or after January 1, 2013, and interim periods within those annual periods. Management expects that the impact of the updates' adoption will be limited to additional financial statement disclosures as applicable.
4. Derivative Instruments.
Risk Exposures and the Use of Derivative Instruments. The Fund's investment objective allows the Fund to enter into various types of derivative contracts, including futures contracts. Derivatives are investments whose value is primarily derived from underlying assets, indices or reference rates and may be transacted on an exchange or over-the-counter (OTC). Derivatives may involve a future commitment to buy or sell a specified asset based on specified terms, to exchange future cash flows at periodic intervals based on a notional principal amount, or for one party to make one or more payments upon the occurrence of specified events in exchange for periodic payments from the other party.
The Fund used derivatives to increase returns and to manage exposure to certain risks as defined below. The success of any strategy involving derivatives depends on analysis of numerous economic factors, and if the strategies for investment do not work as intended, the Fund may not achieve its objectives.
The Fund's use of derivatives increased or decreased its exposure to the following risk:
Equity Risk | Equity risk relates to the fluctuations in the value of financial instruments as a result of changes in market prices (other than those arising from interest rate risk or foreign exchange risk), whether caused by factors specific to an individual investment, its issuer, or all factors affecting all instruments traded in a market or market segment. |
The Fund is also exposed to additional risks from investing in derivatives, such as liquidity risk and counterparty credit risk. Liquidity risk is the risk that the Fund will be unable to close out the derivative in the open market in a timely manner. Counterparty credit risk is the risk that the counterparty will not be able to fulfill its obligation to the Fund. Counterparty credit risk related to exchange-traded futures contracts may be mitigated by the protection provided by the exchange on which they trade.
Investing in derivatives may involve greater risks than investing in the underlying assets directly and, to varying degrees, may involve risk of loss in excess of any initial investment and collateral received and amounts recognized in the Statement of Assets and Liabilities. In addition, there may be the risk that the change in value of the derivative contract does not correspond to the change in value of the underlying instrument.
Futures Contracts. A futures contract is an agreement between two parties to buy or sell a specified underlying instrument for a fixed price at a specified future date. The Fund used futures contracts to manage its exposure to the stock market and to fluctuations in currency values.
Upon entering into a futures contract, a fund is required to deposit either cash or securities (initial margin) with a clearing broker in an amount equal to a certain percentage of the face value of the contract. Futures contracts are marked-to-market daily and subsequent daily payments (variation margin) are made or received by a fund depending on the daily fluctuations in the value of the futures contracts and are recorded as unrealized appreciation or (depreciation). This receivable and/or payable, if any, is included in daily variation margin for derivative instruments in the Statement of Assets and Liabilities. Realized gain or (loss) is recorded upon the expiration or closing of a futures contract.
Any open futures contracts at period end are presented in the Schedule of Investments under the caption "Futures Contracts." The underlying face amount at value reflects each contract's exposure to the underlying instrument or index at period end and is representative of activity for the period. Securities deposited to meet initial margin requirements are identified in the Schedule of Investments.
During the period the Fund recognized net realized gain (loss) of $12,934,707 and a change in net unrealized appreciation (depreciation) of $6,276,288 related to its investment in futures contracts. These amounts are included in the Statement of Operations.
5. Purchases and Sales of Investments.
Purchases and sales of securities, other than short-term securities, aggregated $11,742,469,172 and $12,536,561,646, respectively.
Annual Report
Fidelity Diversified International Fund
Notes to Financial Statements - continued
6. Fees and Other Transactions with Affiliates.
Management Fee. FMR and its affiliates provide the Fund with investment management related services for which the Fund pays a monthly management fee. The management fee is the sum of an individual fund fee rate that is based on an annual rate of .45% of the Fund's average net assets and an annualized group fee rate that averaged .25% during the period. The group fee rate is based upon the average net assets of all the mutual funds advised by FMR, including any mutual funds previously advised by FMR that are currently advised by Fidelity SelectCo, LLC, an affiliate of FMR. The group fee rate decreases as assets under management increase and increases as assets under management decrease. In addition, the management fee is subject to a performance adjustment (up to a maximum of ± .20% of the Fund's average net assets over a 36 month performance period). The upward or downward adjustment to the management fee is based on the relative investment performance of Diversified International as compared to an appropriate benchmark index over the same 36 month performance period. For the reporting period, the total annual management fee rate, including the performance adjustment, was .73% of the Fund's average net assets. The performance adjustment included in the management fee rate may be higher or lower than the maximum performance adjustment rate due to the difference between the average net assets for the reporting and performance periods.
Transfer Agent Fees. Fidelity Investments Institutional Operations Company, Inc., (FIIOC), an affiliate of FMR, is the transfer, dividend disbursing and shareholder servicing agent for each class of the Fund. FIIOC receives account fees and asset-based fees that vary according to the account size and type of account of the shareholders of Diversified International. FIIOC receives an asset-based fee of Class K's average net assets. FIIOC pays for typesetting, printing and mailing of shareholder reports, except proxy statements.
For the period, transfer agent fees for each class were as follows:
| Amount | % of
Average
Net Assets |
Diversified International | $ 25,937,426 | .19 |
Class K | 5,008,542 | .05 |
| $ 30,945,968 | |
Accounting and Security Lending Fees. Fidelity Service Company, Inc. (FSC), an affiliate of FMR, maintains the Fund's accounting records. The accounting fee is based on the level of average net assets for each month. Under a separate contract, FSC administers the security lending program. The security lending fee is based on the number and duration of lending transactions.
Brokerage Commissions. The Fund placed a portion of its portfolio transactions with brokerage firms which are affiliates of the investment adviser. Brokerage commissions are included in net realized gain (loss) and change in net unrealized appreciation (depreciation) in the Statement of Operations. The commissions paid to these affiliated firms were $30,251 for the period.
7. Committed Line of Credit.
The Fund participates with other funds managed by FMR or an affiliate in a $4.25 billion credit facility (the "line of credit") to be utilized for temporary or emergency purposes to fund shareholder redemptions or for other short-term liquidity purposes. The Fund has agreed to pay commitment fees on its pro-rata portion of the line of credit, which amounted to $51,110 and is reflected in Miscellaneous expenses on the Statement of Operations. During the period, there were no borrowings on this line of credit.
8. Security Lending.
The Fund lends portfolio securities through a lending agent from time to time in order to earn additional income. For equity securities, a lending agent is used and may loan securities to certain qualified borrowers, including Fidelity Capital Markets (FCM), a broker-dealer affiliated with the Fund. On the settlement date of the loan, the Fund receives collateral (in the form of U.S. Treasury obligations, letters of credit and/or cash) against the loaned securities and maintains collateral in an amount not less than 100% of the market value of the loaned securities during the period of the loan. The market value of the loaned securities is determined at the close of business of the Fund and any additional required collateral is delivered to the Fund on the next business day. If the borrower defaults on its obligation to return the securities loaned because of insolvency or other reasons, the Fund may apply collateral received from the borrower against the obligation. The Fund may experience delays and costs in recovering the securities loaned. Any cash collateral received is invested in the Fidelity Securities Lending Cash Central Fund. The value of loaned securities and cash collateral at period end are disclosed on the Fund's Statement of Assets and Liabilities. At period end, there were no security loans outstanding with FCM. Security lending income represents the income earned on investing cash collateral, less rebates paid to borrowers and any lending agent fees associated with the loan, plus any premium payments received for lending certain types of securities. Security lending income is presented in the Statement of Operations as a component of income from Fidelity Central Funds. Total security lending income during the period amounted to $13,567,672, including $10,418 from securities loaned to FCM.
Annual Report
9. Expense Reductions.
Commissions paid to certain brokers with whom FMR, or its affiliates, places trades on behalf of the Fund include an amount in addition to trade execution, which may be rebated back to the Fund to offset certain expenses. This amount totaled $4,492,719 for the period.
In addition, FMR reimbursed a portion of the Fund's operating expenses during the period in the amount of $144,745.
In addition, through arrangements with the Fund's custodian, credits realized as a result of uninvested cash balances were used to reduce the Fund's expenses. During the period, these credits reduced the Fund's custody expenses by $914.
10. Distributions to Shareholders.
Distributions to shareholders of each class were as follows:
Years ended October 31, | 2013 | 2012A |
From net investment income | | |
Diversified International | $ 204,367,616 | $ 294,773,906 |
Class K | 157,124,331 | 163,061,175 |
Class F | - | 2,597,208 |
Total | $ 361,491,947 | $ 460,432,289 |
From net realized gain | | |
Diversified International | $ 30,475,866 | $ - |
Class K | 21,032,379 | - |
Class F | - | - |
Total | $ 51,508,245 | $ - |
A All Class F shares were redeemed on December 16, 2011.
11. Share Transactions.
Transactions for each class of shares were as follows:
| Shares | Dollars |
Years ended October 31, | 2013 | 2012A | 2013 | 2012A |
Diversified International | | | | |
Shares sold | 63,290,634 | 68,919,981 | $ 2,024,488,853 | $ 1,874,276,249 |
Reinvestment of distributions | 7,563,286 | 10,773,340 | 222,133,713 | 281,938,317 |
Shares redeemed | (125,225,694) | (251,932,423) | (3,964,590,272) | (6,875,660,945) |
Net increase (decrease) | (54,371,774) | (172,239,102) | $ (1,717,967,706) | $ (4,719,446,379) |
Class K | | | | |
Shares sold | 76,686,079 | 107,189,633 | $ 2,416,468,280 | $ 2,919,697,004 |
Reinvestment of distributions | 6,076,286 | 6,242,771 | 178,156,710 | 163,061,175 |
Shares redeemed | (66,739,141) | (102,745,898) | (2,120,824,766) | (2,820,922,083) |
Net increase (decrease) | 16,023,224 | 10,686,506 | $ 473,800,224 | $ 261,836,096 |
Class F | | | | |
Shares sold | - | 439,287 | $ - | $ 11,548,416 |
Reinvestment of distributions | - | 99,472 | - | 2,597,208 |
Shares redeemed | - | (6,767,017) | - | (175,849,737) |
Net increase (decrease) | - | (6,228,258) | $ - | $ (161,704,113) |
A All Class F shares were redeemed on December 16, 2011.
12. Other.
The Fund's organizational documents provide former and current trustees and officers with a limited indemnification against liabilities arising in connection with the performance of their duties to the Fund. In the normal course of business, the Fund may also enter into contracts that provide general indemnifications. The Fund's maximum exposure under these arrangements is unknown as this would be dependent on future claims that may be made against the Fund. The risk of material loss from such claims is considered remote.
Annual Report
Report of Independent Registered Public Accounting Firm
To the Trustees of Fidelity Investment Trust and Shareholders of Fidelity Diversified International Fund:
We have audited the accompanying statement of assets and liabilities of Fidelity Diversified International Fund (the Fund), a fund of Fidelity Investment Trust, including the schedule of investments, as of October 31, 2013, and the related statement of operations for the year then ended, the statement of changes in net assets for each of the two years in the period then ended, and the financial highlights for each of the five years in the period then ended. These financial statements and financial highlights are the responsibility of the Fund's management. Our responsibility is to express an opinion on these financial statements and financial highlights based on our audits.
We conducted our audits in accordance with the standards of the Public Company Accounting Oversight Board (United States). Those standards require that we plan and perform the audit to obtain reasonable assurance about whether the financial statements and financial highlights are free of material misstatement. The Fund is not required to have, nor were we engaged to perform, an audit of its internal control over financial reporting. Our audits included consideration of internal control over financial reporting as a basis for designing audit procedures that are appropriate in the circumstances, but not for the purpose of expressing an opinion on the effectiveness of the Fund's internal control over financial reporting. Accordingly, we express no such opinion. An audit also includes examining, on a test basis, evidence supporting the amounts and disclosures in the financial statements, assessing the accounting principles used and significant estimates made by management, as well as evaluating the overall financial statement presentation. Our procedures included confirmation of securities owned as of October 31, 2013, by correspondence with the custodians and brokers; where replies were not received from brokers, we performed other auditing procedures. We believe that our audits provide a reasonable basis for our opinion.
In our opinion, the financial statements and financial highlights referred to above present fairly, in all material respects, the financial position of Fidelity Diversified International Fund as of October 31, 2013, the results of its operations for the year then ended, the changes in its net assets for each of the two years in the period then ended, and the financial highlights for each of the five years in the period then ended, in conformity with accounting principles generally accepted in the United States of America.
DELOITTE & TOUCHE LLP
Boston, Massachusetts
December 13, 2013
Annual Report
Fidelity International Capital Appreciation Fund
As a shareholder of the Fund, you incur two types of costs: (1) transaction costs, including redemption fees and (2) ongoing costs, including management fees and other Fund expenses. This Example is intended to help you understand your ongoing costs (in dollars) of investing in the Fund and to compare these costs with the ongoing costs of investing in other mutual funds.
The Example is based on an investment of $1,000 invested at the beginning of the period and held for the entire period (May 1, 2013 to October 31, 2013).
Actual Expenses
The first line of the accompanying table provides information about actual account values and actual expenses. You may use the information in this line, together with the amount you invested, to estimate the expenses that you paid over the period. Simply divide your account value by $1,000.00 (for example, an $8,600 account value divided by $1,000.00 = 8.6), then multiply the result by the number in the first line under the heading entitled "Expenses Paid During Period" to estimate the expenses you paid on your account during this period. A small balance maintenance fee of $12.00 that is charged once a year may apply for certain accounts with a value of less than $2,000. This fee is not included in the table below. If it was, the estimate of expenses you paid during the period would be higher, and your ending account value lower, by this amount. In addition, the Fund, as a shareholder in the underlying Fidelity Central Funds, will indirectly bear its pro-rata share of the fees and expenses incurred by the underlying Fidelity Central Funds. These fees and expenses are not included in the Fund's annualized expense ratio used to calculate the expense estimate in the table below.
Hypothetical Example for Comparison Purposes
The second line of the accompanying table provides information about hypothetical account values and hypothetical expenses based on the Fund's actual expense ratio and an assumed rate of return of 5% per year before expenses, which is not the Fund's actual return. The hypothetical account values and expenses may not be used to estimate the actual ending account balance or expenses you paid for the period. You may use this information to compare the ongoing costs of investing in the Fund and other funds. To do so, compare this 5% hypothetical example with the 5% hypothetical examples that appear in the shareholder reports of the other funds. A small balance maintenance fee of $12.00 that is charged once a year may apply for certain accounts with a value of less than $2,000. This fee is not included in the table below. If it was, the estimate of expenses you paid during the period would be higher, and your ending account value lower, by this amount. In addition, the Fund, as a shareholder in the underlying Fidelity Central Funds, will indirectly bear its pro-rata share of the fees and expenses incurred by the underlying Fidelity Central Funds. These fees and expenses are not included in the Fund's annualized expense ratio used to calculate the expense estimate in the table below.
Please note that the expenses shown in the table are meant to highlight your ongoing costs only and do not reflect any transaction costs. Therefore, the second line of the table is useful in comparing ongoing costs only, and will not help you determine the relative total costs of owning different funds. In addition, if these transactional costs were included, your costs would have been higher.
| Annualized
Expense Ratio B | Beginning
Account Value
May 1, 2013 | Ending
Account Value
October 31, 2013 | Expenses Paid
During Period*
May 1, 2013
to October 31, 2013 |
Actual | 1.16% | $ 1,000.00 | $ 1,080.30 | $ 6.08 |
Hypothetical A | | $ 1,000.00 | $ 1,019.36 | $ 5.90 |
A 5% return per year before expenses
B Annualized expense ratio reflects expenses net of applicable fee waivers.
* Expenses are equal to the Fund's annualized expense ratio, multiplied by the average account value over the period, multiplied by 184/365 (to reflect the one-half year period).
Annual Report
Fidelity International Capital Appreciation Fund
Average annual total return reflects the change in the value of an investment, assuming reinvestment of the fund's distributions from dividend income and capital gains (the profits earned upon the sale of securities that have grown in value, if any) and assuming a constant rate of performance each year. The $10,000 table and the fund's returns do not reflect the deduction of taxes that a shareholder would pay on fund distributions or the redemption of fund shares. During periods of reimbursement by Fidelity, a fund's total return will be greater than it would be had the reimbursement not occurred. How a fund did yesterday is no guarantee of how it will do tomorrow.
Average Annual Total Returns
Periods ended October 31, 2013 | Past 1
year | Past 5
years | Past 10 years |
Fidelity International Capital Appreciation Fund | 25.24% | 18.45% | 6.40% |
$10,000 Over 10 Years
Let's say hypothetically that $10,000 was invested in Fidelity International Capital Appreciation Fund on October 31, 2003. The chart shows how the value of your investment would have changed, and also shows how the MSCI® ACWI® (All Country World Index) ex USA Index performed over the same period.
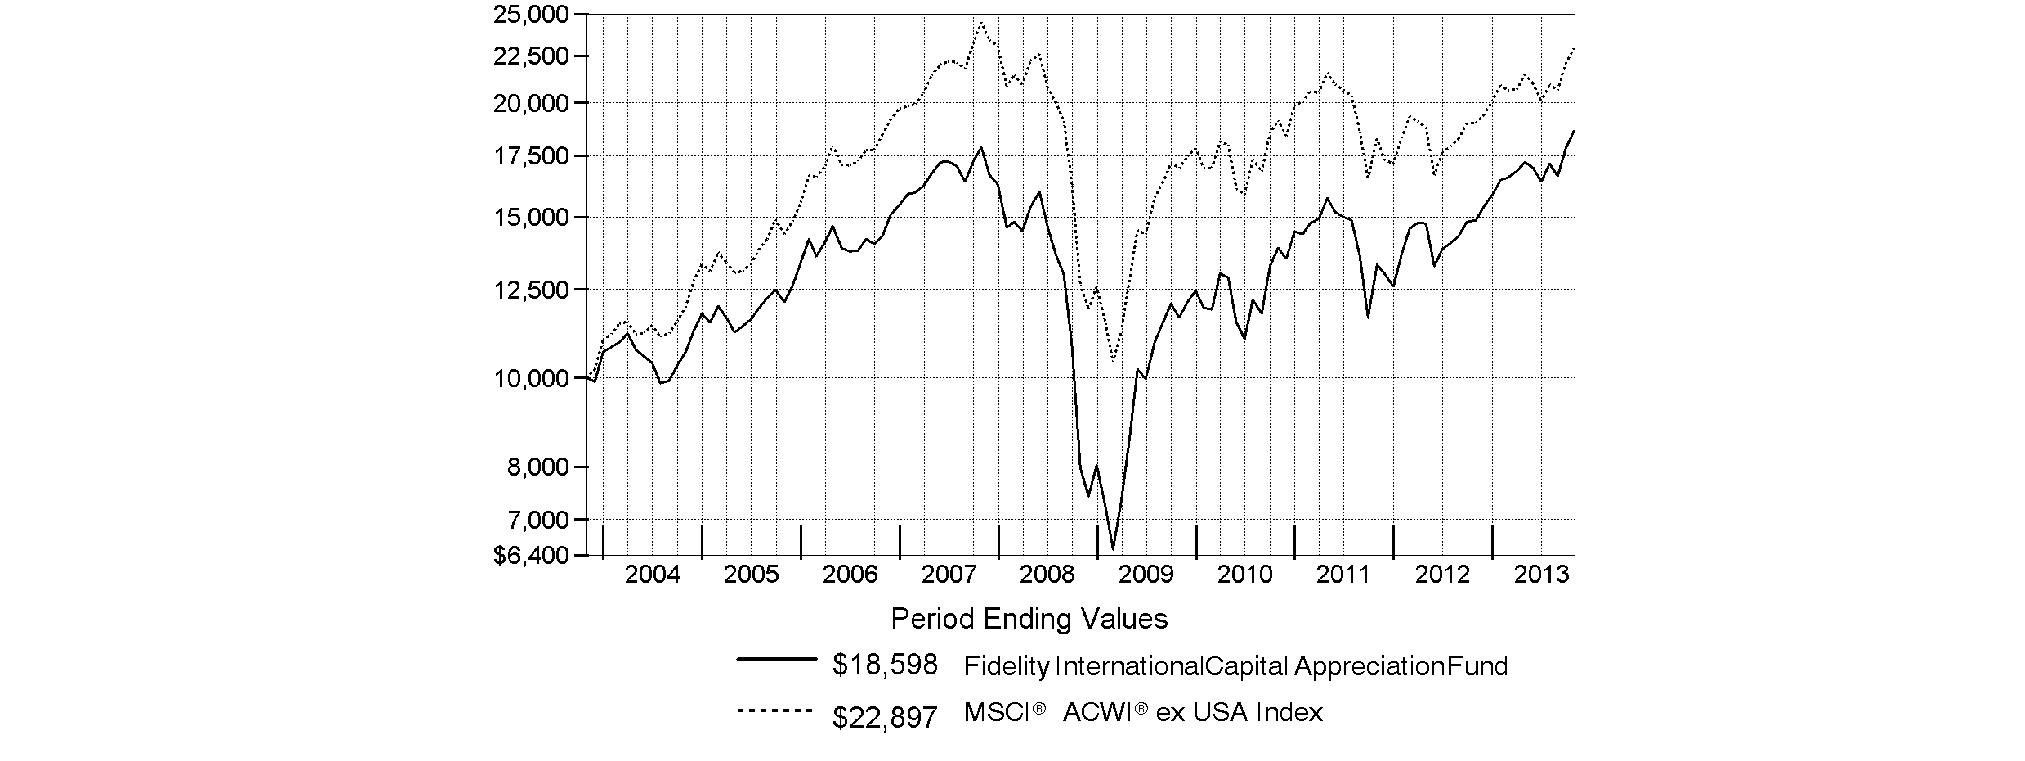
Annual Report
Fidelity International Capital Appreciation Fund
Market Recap: On balance, global equity markets remained upbeat for the 12-month period ending October 31, 2013. The MSCI® ACWI® (All Country World Index) Index gained 23.75% for the period, amid investor preference for higher-risk assets. The period was not without turbulence, however. In the spring and summer, central banks worldwide, especially in the U.S. and China, made clear their intentions to maintain accommodative monetary policies. That stance, combined with modest cyclical improvements around the globe and generally low valuations, underpinned the broad rally in equities. Europe (+32%) shone brightly, with most markets in the region - large and small - registering solid, index-beating gains. Another bright spot was Japan, which, despite a struggling yen and taking a second-half breather, posted a 34% result for the full year. The U.S. - by far the index's biggest constituent - also outperformed the global market with a roughly 28% advance. Meanwhile, Asia-Pacific ex Japan (+14%) lagged, hurt in part by a slowdown in Australia's mining industry as well as currency headwinds. Foreign-exchange and commodity weakness also curbed results in resource-heavy Canada and emerging markets (EM), both of which were up 7%. Country-level EM performance diverged meaningfully for the period, as evidenced by performance in Brazil (-1%), Russia (+12%), India (+1%) and China (+8%).
Comments from Sammy Simnegar, Portfolio Manager of Fidelity® International Capital Appreciation Fund: For the year, the fund returned 25.24%, topping the 20.42% gain of the MSCI® ACWI® (All Country World Index) ex USA Index. Versus the index, a lot of the fund's outperformance came from stock picking in emerging markets. An overweighting in media stocks also helped, along with positioning in consumer services, especially casino stocks Sands China and Hong Kong-based Galaxy Entertainment Group. Another positive was not owning some weak-performing benchmark components: Netherlands-based energy producer Royal Dutch Shell and several Canadian gold miners - notably, Barrick Gold. A non-index position in China-based real estate Internet portal SouFun Holdings also helped. Conversely, a large underweighting in Japan hurt, particularly not owning Japanese automaker and index stock Toyota Motor. I considerably lessened the fund's underweighting in Japan. Stock picking in the broader automobiles & components group also hampered relative performance, as did positioning in financials, a sector I meaningfully increased. Unrewarding timing in Australia-based miner BHP Billiton and not owning Swiss drug company and index constituent Roche Holding also detracted.
The views expressed above reflect those of the portfolio manager(s) only through the end of the period as stated on the cover of this report and do not necessarily represent the views of Fidelity or any other person in the Fidelity organization. Any such views are subject to change at any time based upon market or other conditions and Fidelity disclaims any responsibility to update such views. These views may not be relied on as investment advice and, because investment decisions for a Fidelity fund are based on numerous factors, may not be relied on as an indication of trading intent on behalf of any Fidelity fund.
Annual Report
Fidelity International Capital Appreciation Fund
Investment Changes (Unaudited)
Geographic Diversification (% of fund's net assets) |
As of October 31, 2013 |
| United Kingdom | 16.3% | |
| Japan | 13.4% | |
| United States of America* | 12.7% | |
| France | 7.1% | |
| Germany | 6.7% | |
| Switzerland | 4.9% | |
| India | 4.7% | |
| Brazil | 3.3% | |
| Indonesia | 2.5% | |
| Other | 28.4% | |

* Includes Short-Term Investments and Net Other Assets (Liabilities). |
Percentages are based on country or territory of incorporation and are adjusted for the effect of futures contracts, if applicable. |
As of April 30, 2013 |
| United States of America* | 14.5% | |
| United Kingdom | 14.4% | |
| Japan | 10.6% | |
| France | 7.5% | |
| Germany | 6.5% | |
| Switzerland | 4.2% | |
| Brazil | 4.1% | |
| India | 3.7% | |
| Indonesia | 3.5% | |
| Other | 31.0% | |

* Includes Short-Term Investments and Net Other Assets (Liabilities). |
Percentages are based on country or territory of incorporation and are adjusted for the effect of futures contracts, if applicable. |
Asset Allocation as of October 31, 2013 |
| % of fund's
net assets | % of fund's net assets
6 months ago |
Stocks | 99.6 | 100.0 |
Short-Term Investments and Net Other Assets (Liabilities) | 0.4 | 0.0 |
Top Ten Stocks as of October 31, 2013 |
| % of fund's
net assets | % of fund's net assets
6 months ago |
Nestle SA (Switzerland, Food Products) | 1.4 | 1.6 |
Sanofi SA (France, Pharmaceuticals) | 0.9 | 1.0 |
British American Tobacco PLC (United Kingdom) (United Kingdom, Tobacco) | 0.8 | 0.9 |
Unilever PLC (United Kingdom, Food Products) | 0.8 | 1.0 |
Bayer AG (Germany, Pharmaceuticals) | 0.8 | 0.8 |
BASF AG (Germany, Chemicals) | 0.7 | 0.8 |
Anheuser-Busch InBev SA NV (Belgium, Beverages) | 0.6 | 0.7 |
SAP AG sponsored ADR (Germany, Software) | 0.6 | 0.0 |
UBS AG (NY Shares) (Switzerland, Capital Markets) | 0.6 | 0.0 |
Diageo PLC sponsored ADR (United Kingdom, Beverages) | 0.6 | 0.8 |
| 7.8 | |
Market Sectors as of October 31, 2013 |
| % of fund's
net assets | % of fund's net assets
6 months ago |
Consumer Discretionary | 23.9 | 23.1 |
Industrials | 18.4 | 17.7 |
Financials | 17.2 | 15.8 |
Consumer Staples | 13.3 | 14.5 |
Information Technology | 9.6 | 10.7 |
Materials | 8.1 | 8.4 |
Health Care | 7.6 | 7.1 |
Telecommunication Services | 1.0 | 1.7 |
Energy | 0.5 | 1.0 |
Annual Report
Fidelity International Capital Appreciation Fund
Investments October 31, 2013
Showing Percentage of Net Assets
Common Stocks - 98.6% |
| Shares | | Value |
Australia - 1.2% |
Amcor Ltd. | 261,847 | | $ 2,682,734 |
Carsales.com Ltd. | 193,750 | | 1,922,790 |
CSL Ltd. | 58,486 | | 3,841,824 |
Fortescue Metals Group Ltd. | 595,935 | | 2,934,522 |
TOTAL AUSTRALIA | | 11,381,870 |
Austria - 0.3% |
Andritz AG | 45,000 | | 2,772,050 |
Bailiwick of Jersey - 1.7% |
Delphi Automotive PLC | 35,229 | | 2,015,099 |
Experian PLC | 177,168 | | 3,607,704 |
Shire PLC | 76,000 | | 3,369,873 |
Wolseley PLC | 63,283 | | 3,410,338 |
WPP PLC | 191,300 | | 4,063,390 |
TOTAL BAILIWICK OF JERSEY | | 16,466,404 |
Belgium - 0.6% |
Anheuser-Busch InBev SA NV | 57,459 | | 5,956,415 |
Bermuda - 1.1% |
Credicorp Ltd. | 22,960 | | 3,136,336 |
Invesco Ltd. | 80,023 | | 2,700,776 |
Jardine Matheson Holdings Ltd. | 44,000 | | 2,397,560 |
Signet Jewelers Ltd. | 31,429 | | 2,346,489 |
TOTAL BERMUDA | | 10,581,161 |
Brazil - 2.9% |
BB Seguridade Participacoes SA | 208,700 | | 2,279,658 |
BR Malls Participacoes SA | 303,500 | | 2,939,894 |
CCR SA | 310,800 | | 2,584,682 |
Cetip SA - Mercados Organizado | 193,700 | | 2,147,803 |
Cielo SA | 108,700 | | 3,299,527 |
Companhia de Bebidas das Americas (AmBev) (PN) sponsored ADR | 96,000 | | 3,571,200 |
Iguatemi Empresa de Shopping Centers SA | 231,500 | | 2,660,979 |
Multiplan Empreendimentos Imobiliarios SA | 109,500 | | 2,570,576 |
Souza Cruz SA | 228,300 | | 2,469,292 |
Ultrapar Participacoes SA | 98,700 | | 2,630,296 |
TOTAL BRAZIL | | 27,153,907 |
Canada - 2.4% |
Alimentation Couche-Tard, Inc. Class B (sub. vtg.) | 48,500 | | 3,284,966 |
Canadian National Railway Co. | 40,500 | | 4,449,504 |
Canadian Pacific Railway Ltd. | 25,600 | | 3,659,353 |
CGI Group, Inc. Class A (sub. vtg.) (a) | 78,200 | | 2,623,542 |
Cineplex, Inc. (d) | 61,070 | | 2,460,020 |
Constellation Software, Inc. | 12,200 | | 2,222,479 |
Valeant Pharmaceuticals International, Inc. (Canada) (a) | 34,000 | | 3,591,905 |
TOTAL CANADA | | 22,291,769 |
|
| Shares | | Value |
Cayman Islands - 2.3% |
Baidu.com, Inc. sponsored ADR (a) | 14,600 | | $ 2,349,140 |
Baoxin Auto Group Ltd. | 2,253,500 | | 2,322,387 |
Bitauto Holdings Ltd. ADR (a) | 83,627 | | 2,049,698 |
Lifestyle International Holdings Ltd. | 1,004,500 | | 2,189,610 |
New Oriental Education & Technology Group, Inc. sponsored ADR | 81,238 | | 2,129,248 |
Sands China Ltd. | 453,200 | | 3,220,859 |
SouFun Holdings Ltd. ADR | 50,998 | | 2,714,624 |
Tencent Holdings Ltd. | 86,100 | | 4,699,796 |
TOTAL CAYMAN ISLANDS | | 21,675,362 |
China - 0.8% |
China Merchants Bank Co. Ltd. (H Shares) | 1,351,500 | | 2,684,522 |
China Minsheng Banking Corp. Ltd. (H Shares) | 2,092,000 | | 2,398,798 |
Travelsky Technology Ltd. (H Shares) | 2,892,000 | | 2,473,102 |
TOTAL CHINA | | 7,556,422 |
Denmark - 0.6% |
Novo Nordisk A/S Series B sponsored ADR | 33,340 | | 5,556,778 |
Finland - 0.7% |
Kone Oyj (B Shares) | 38,200 | | 3,368,700 |
Nokian Tyres PLC | 55,000 | | 2,783,184 |
TOTAL FINLAND | | 6,151,884 |
France - 7.1% |
Air Liquide SA | 32,010 | | 4,359,196 |
Atos Origin SA | 27,205 | | 2,322,636 |
AXA SA | 182,400 | | 4,556,826 |
Bureau Veritas SA | 92,000 | | 2,778,065 |
Christian Dior SA | 14,419 | | 2,740,836 |
Dassault Systemes SA | 22,400 | | 2,722,321 |
Essilor International SA | 30,116 | | 3,234,399 |
Kering SA | 14,000 | | 3,181,072 |
L'Oreal SA | 23,400 | | 4,007,956 |
LVMH Moet Hennessy - Louis Vuitton SA | 26,174 | | 5,039,253 |
Pernod Ricard SA | 32,100 | | 3,857,164 |
Publicis Groupe SA | 42,600 | | 3,553,120 |
Remy Cointreau SA | 22,900 | | 2,259,801 |
Safran SA | 52,100 | | 3,330,028 |
Sanofi SA | 81,943 | | 8,737,028 |
Schneider Electric SA | 52,794 | | 4,447,809 |
Sodexo SA | 32,300 | | 3,135,217 |
Zodiac Aerospace | 17,256 | | 2,764,661 |
TOTAL FRANCE | | 67,027,388 |
Germany - 6.1% |
adidas AG | 32,500 | | 3,710,188 |
BASF AG | 64,646 | | 6,726,053 |
Bayer AG | 58,200 | | 7,233,587 |
Bayerische Motoren Werke AG (BMW) | 40,614 | | 4,606,701 |
Brenntag AG | 17,800 | | 3,016,160 |
Common Stocks - continued |
| Shares | | Value |
Germany - continued |
Continental AG | 18,200 | | $ 3,334,756 |
CTS Eventim AG | 50,942 | | 2,486,536 |
Fresenius SE & Co. KGaA | 28,200 | | 3,665,363 |
GEA Group AG | 59,079 | | 2,570,875 |
Henkel AG & Co. KGaA | 47,589 | | 4,399,565 |
KUKA AG | 49,878 | | 2,272,745 |
Linde AG | 22,700 | | 4,313,388 |
ProSiebenSat.1 Media AG | 60,500 | | 2,881,607 |
SAP AG sponsored ADR (d) | 74,900 | | 5,868,415 |
TOTAL GERMANY | | 57,085,939 |
Hong Kong - 1.2% |
AIA Group Ltd. | 994,600 | | 5,048,047 |
Galaxy Entertainment Group Ltd. (a) | 437,000 | | 3,260,731 |
Techtronic Industries Co. Ltd. | 1,038,500 | | 2,611,989 |
TOTAL HONG KONG | | 10,920,767 |
India - 4.7% |
Amara Raja Batteries Ltd. | 508,095 | | 2,587,719 |
Axis Bank Ltd. | 148,871 | | 2,953,794 |
Bajaj Auto Ltd. | 81,879 | | 2,829,970 |
Bank of Baroda | 267,975 | | 2,795,682 |
Grasim Industries Ltd. | 54,448 | | 2,559,373 |
HCL Technologies Ltd. | 145,731 | | 2,590,329 |
HDFC Bank Ltd. | 361,309 | | 4,012,439 |
Housing Development Finance Corp. Ltd. | 305,913 | | 4,244,627 |
ITC Ltd. | 533,147 | | 2,898,290 |
Punjab National Bank | 273,316 | | 2,535,261 |
State Bank of India | 101,967 | | 2,973,017 |
Sun Pharmaceutical Industries Ltd. | 230,093 | | 2,273,150 |
Sun TV Ltd. | 382,852 | | 2,610,270 |
Tata Consultancy Services Ltd. | 93,623 | | 3,208,757 |
Titan Industries Ltd. | 691,124 | | 2,996,695 |
TOTAL INDIA | | 44,069,373 |
Indonesia - 2.5% |
PT Astra International Tbk | 5,199,500 | | 3,067,331 |
PT Bank Central Asia Tbk | 3,042,500 | | 2,820,489 |
PT Bank Rakyat Indonesia Tbk | 4,465,000 | | 3,129,147 |
PT Global Mediacom Tbk | 15,239,500 | | 2,582,151 |
PT Gudang Garam Tbk | 843,500 | | 2,761,143 |
PT Indocement Tunggal Prakarsa Tbk | 1,542,000 | | 2,858,960 |
PT Jasa Marga Tbk | 4,657,000 | | 2,168,917 |
PT Semen Gresik (Persero) Tbk | 2,085,000 | | 2,654,211 |
PT Surya Citra Media Tbk | 8,840,000 | | 1,842,882 |
TOTAL INDONESIA | | 23,885,231 |
Ireland - 1.0% |
Accenture PLC Class A | 33,008 | | 2,426,088 |
Actavis PLC (a) | 15,510 | | 2,397,536 |
|
| Shares | | Value |
Dragon Oil PLC | 208,800 | | $ 1,971,913 |
Kerry Group PLC Class A | 38,900 | | 2,491,089 |
TOTAL IRELAND | | 9,286,626 |
Italy - 1.3% |
Azimut Holding SpA | 101,200 | | 2,570,834 |
Luxottica Group SpA | 44,100 | | 2,388,959 |
Pirelli & C SpA | 162,500 | | 2,290,185 |
Prada SpA | 243,000 | | 2,369,509 |
World Duty Free SpA (a) | 245,876 | | 2,724,119 |
TOTAL ITALY | | 12,343,606 |
Japan - 13.4% |
Bridgestone Corp. | 110,400 | | 3,784,812 |
Chiyoda Corp. | 206,000 | | 2,612,337 |
Daihatsu Motor Co. Ltd. | 145,000 | | 2,815,349 |
Daikin Industries Ltd. | 60,000 | | 3,452,004 |
Daito Trust Construction Co. Ltd. | 30,300 | | 3,093,744 |
DENSO Corp. | 84,800 | | 4,076,202 |
East Japan Railway Co. | 40,000 | | 3,474,828 |
Fuji Heavy Industries Ltd. | 128,000 | | 3,499,716 |
Fuji Media Holdings, Inc. | 108,800 | | 2,168,967 |
Hino Motors Ltd. | 193,000 | | 2,727,006 |
Hoya Corp. | 110,200 | | 2,642,526 |
Isuzu Motors Ltd. | 475,000 | | 2,958,102 |
Japan Tobacco, Inc. | 137,300 | | 4,968,020 |
JGC Corp. | 73,000 | | 2,793,258 |
Kansai Paint Co. Ltd. | 220,000 | | 2,956,114 |
KDDI Corp. ADR | 280,600 | | 3,799,324 |
Keyence Corp. | 8,770 | | 3,758,734 |
Makita Corp. | 53,500 | | 2,705,461 |
Miraca Holdings, Inc. | 64,300 | | 2,897,231 |
Mitani Shoji Co. Ltd. | 6,800 | | 146,877 |
MS&AD Insurance Group Holdings, Inc. | 120,500 | | 3,115,811 |
Nabtesco Corp. | 88,100 | | 2,150,302 |
Nippon Television Network Corp. | 124,800 | | 2,286,167 |
Nomura Research Institute Ltd. | 66,300 | | 2,225,178 |
Obic Co. Ltd. | 79,600 | | 2,499,653 |
Omron Corp. | 77,100 | | 2,942,230 |
ORIX Corp. | 231,000 | | 4,001,171 |
Park24 Co. Ltd. | 124,900 | | 2,438,618 |
Rakuten, Inc. | 224,800 | | 2,929,063 |
Ship Healthcare Holdings, Inc. | 48,200 | | 1,977,856 |
SMC Corp. | 13,500 | | 3,143,046 |
SoftBank Corp. | 71,300 | | 5,324,606 |
Sumitomo Mitsui Financial Group, Inc. ADR (d) | 561,542 | | 5,446,957 |
Sumitomo Mitsui Trust Holdings, Inc. | 741,000 | | 3,659,865 |
Sumitomo Osaka Cement Co. Ltd. | 490,000 | | 1,977,044 |
Sumitomo Rubber Industries Ltd. | 201,400 | | 2,803,788 |
Suzuki Motor Corp. | 100,900 | | 2,537,168 |
Tokio Marine Holdings, Inc. | 110,000 | | 3,606,291 |
Toshiba Plant Systems & Services Corp. | 123,000 | | 2,170,256 |
Tsuruha Holdings, Inc. | 28,100 | | 2,551,166 |
Common Stocks - continued |
| Shares | | Value |
Japan - continued |
USS Co. Ltd. | 202,700 | | $ 2,968,439 |
Yahoo! Japan Corp. | 506,900 | | 2,365,052 |
TOTAL JAPAN | | 126,450,339 |
Kenya - 0.2% |
Equity Bank Ltd. | 4,925,500 | | 2,048,685 |
Korea (South) - 0.3% |
Hyundai Mobis | 11,312 | | 3,192,317 |
Luxembourg - 0.3% |
RTL Group | 23,896 | | 2,595,584 |
Mexico - 1.5% |
Fomento Economico Mexicano S.A.B. de CV sponsored ADR | 33,980 | | 3,170,334 |
Grupo Aeroportuario del Pacifico SA de CV Series B | 393,700 | | 2,048,275 |
Grupo Financiero Banorte S.A.B. de CV Series O | 463,700 | | 2,959,776 |
Grupo Mexico SA de CV Series B | 880,500 | | 2,781,077 |
Grupo Televisa SA de CV (CPO) sponsored ADR | 97,000 | | 2,952,680 |
TOTAL MEXICO | | 13,912,142 |
Netherlands - 0.5% |
European Aeronautic Defence and Space Co. (EADS) NV | 63,000 | | 4,329,091 |
Nigeria - 0.3% |
Guaranty Trust Bank PLC | 16,649,980 | | 2,652,673 |
Panama - 0.3% |
Copa Holdings SA Class A | 16,800 | | 2,512,272 |
Philippines - 1.5% |
Alliance Global Group, Inc. | 4,489,200 | | 2,737,254 |
LT Group, Inc. | 6,495,900 | | 2,498,250 |
Security Bank Corp. | 912,420 | | 2,934,777 |
SM Investments Corp. | 137,983 | | 2,733,159 |
SM Prime Holdings, Inc. | 6,216,425 | | 2,759,020 |
TOTAL PHILIPPINES | | 13,662,460 |
Poland - 0.0% |
Mostostal Export SA (a) | 1,481,760 | | 91,397 |
Russia - 1.1% |
Alrosa Co. Ltd. (a) | 2,081,600 | | 2,342,475 |
Magnit OJSC GDR (Reg. S) | 51,105 | | 3,283,496 |
Sberbank (Savings Bank of the Russian Federation) sponsored ADR | 363,000 | | 4,635,510 |
TOTAL RUSSIA | | 10,261,481 |
South Africa - 2.0% |
Aspen Pharmacare Holdings Ltd. | 83,200 | | 2,316,215 |
Discovery Holdings Ltd. | 253,600 | | 2,147,279 |
Life Healthcare Group Holdings Ltd. | 669,369 | | 2,733,819 |
Mr Price Group Ltd. | 173,500 | | 2,733,657 |
Nampak Ltd. | 623,800 | | 2,063,022 |
|
| Shares | | Value |
Naspers Ltd. Class N | 39,800 | | $ 3,722,794 |
Shoprite Holdings Ltd. | 159,920 | | 2,927,984 |
TOTAL SOUTH AFRICA | | 18,644,770 |
Spain - 1.0% |
Amadeus IT Holding SA Class A | 89,700 | | 3,330,961 |
Grifols SA ADR | 80,600 | | 2,430,896 |
Inditex SA | 25,144 | | 4,130,851 |
TOTAL SPAIN | | 9,892,708 |
Sweden - 1.9% |
ASSA ABLOY AB (B Shares) | 69,594 | | 3,454,972 |
Atlas Copco AB (A Shares) | 136,600 | | 3,790,199 |
Elekta AB (B Shares) | 158,600 | | 2,339,821 |
Hexagon AB (B Shares) | 88,900 | | 2,669,723 |
Investment AB Kinnevik (B Shares) | 73,900 | | 2,723,331 |
Svenska Cellulosa AB (SCA) (B Shares) | 118,000 | | 3,350,591 |
TOTAL SWEDEN | | 18,328,637 |
Switzerland - 4.9% |
Compagnie Financiere Richemont SA Series A | 45,595 | | 4,675,830 |
Nestle SA | 182,696 | | 13,187,730 |
Partners Group Holding AG | 12,190 | | 3,158,504 |
Schindler Holding AG (Reg.) | 21,590 | | 3,069,499 |
SGS SA (Reg.) | 1,369 | | 3,207,686 |
Sika AG (Bearer) | 878 | | 2,768,455 |
Swatch Group AG (Bearer) | 5,807 | | 3,715,174 |
Syngenta AG (Switzerland) | 10,744 | | 4,336,458 |
TE Connectivity Ltd. | 43,300 | | 2,229,517 |
UBS AG (NY Shares) | 301,900 | | 5,844,784 |
TOTAL SWITZERLAND | | 46,193,637 |
Thailand - 1.4% |
Airports of Thailand PCL (For. Reg.) | 396,700 | | 2,702,021 |
BEC World PCL (For. Reg.) | 1,288,500 | | 2,411,410 |
Kasikornbank PCL (For. Reg.) | 545,300 | | 3,398,818 |
Major Cineplex Group PCL (For. Reg.) | 3,068,000 | | 1,882,692 |
Thai Beverage PCL | 6,552,000 | | 2,874,610 |
TOTAL THAILAND | | 13,269,551 |
Turkey - 0.9% |
Coca-Cola Icecek A/S | 82,618 | | 2,369,383 |
Koc Holding A/S | 585,000 | | 2,871,885 |
Turkiye Garanti Bankasi A/S | 808,909 | | 3,257,923 |
TOTAL TURKEY | | 8,499,191 |
United Kingdom - 16.3% |
Aberdeen Asset Management PLC | 413,400 | | 2,935,743 |
Ashtead Group PLC | 236,860 | | 2,487,568 |
Associated British Foods PLC | 81,200 | | 2,951,545 |
Babcock International Group PLC | 115,600 | | 2,363,251 |
Berkeley Group Holdings PLC | 67,400 | | 2,528,818 |
British American Tobacco PLC (United Kingdom) | 138,207 | | 7,625,196 |
Common Stocks - continued |
| Shares | | Value |
United Kingdom - continued |
British Sky Broadcasting Group PLC | 189,400 | | $ 2,847,037 |
Bunzl PLC | 109,242 | | 2,411,934 |
Burberry Group PLC | 111,000 | | 2,731,953 |
Compass Group PLC | 275,800 | | 3,966,693 |
Crest Nicholson PLC (a) | 402,200 | | 2,495,715 |
Croda International PLC | 62,600 | | 2,445,082 |
Diageo PLC sponsored ADR | 45,400 | | 5,792,586 |
Diploma PLC | 187,367 | | 2,081,940 |
Elementis PLC | 561,225 | | 2,331,558 |
Filtrona PLC | 190,700 | | 2,395,695 |
Galiform PLC | 449,190 | | 2,324,186 |
GKN PLC | 426,373 | | 2,515,135 |
Halma PLC | 270,800 | | 2,381,591 |
IMI PLC | 102,800 | | 2,503,760 |
InterContinental Hotel Group PLC ADR | 96,040 | | 2,818,774 |
Intertek Group PLC | 56,770 | | 3,032,954 |
ITV PLC | 973,646 | | 2,980,224 |
Johnson Matthey PLC | 61,504 | | 2,962,410 |
Kingfisher PLC | 499,600 | | 3,023,996 |
Legal & General Group PLC | 912,807 | | 3,165,755 |
Meggitt PLC | 334,900 | | 3,074,203 |
Mondi PLC | 117,200 | | 2,093,412 |
Next PLC | 38,700 | | 3,378,709 |
Oxford Instruments PLC | 110,200 | | 2,297,031 |
Persimmon PLC | 134,900 | | 2,736,178 |
Prudential PLC | 240,421 | | 4,916,793 |
Reckitt Benckiser Group PLC | 64,100 | | 4,982,675 |
Rexam PLC | 362,190 | | 3,016,921 |
Rightmove PLC | 60,684 | | 2,580,415 |
Rolls-Royce Group PLC | 231,200 | | 4,263,120 |
Rotork PLC | 52,400 | | 2,405,440 |
Royal Mail PLC | 268,800 | | 2,413,566 |
SABMiller PLC | 88,800 | | 4,633,108 |
Schroders PLC | 66,400 | | 2,745,752 |
Senior Engineering Group PLC | 492,000 | | 2,349,263 |
Spectris PLC | 70,500 | | 2,613,478 |
Standard Chartered PLC (United Kingdom) | 226,412 | | 5,443,620 |
Taylor Wimpey PLC | 1,450,569 | | 2,563,078 |
The Weir Group PLC | 78,300 | | 2,831,067 |
Travis Perkins PLC | 105,400 | | 3,136,610 |
Unilever PLC | 187,200 | | 7,591,162 |
Whitbread PLC | 55,067 | | 3,031,148 |
TOTAL UNITED KINGDOM | | 153,197,848 |
United States of America - 12.3% |
AbbVie, Inc. | 46,120 | | 2,234,514 |
Affiliated Managers Group, Inc. (a) | 12,800 | | 2,527,232 |
AMETEK, Inc. | 50,900 | | 2,434,547 |
Amgen, Inc. | 20,200 | | 2,343,200 |
Amphenol Corp. Class A | 28,566 | | 2,293,564 |
BlackRock, Inc. Class A | 8,900 | | 2,677,209 |
|
| Shares | | Value |
BorgWarner, Inc. | 20,505 | | $ 2,114,681 |
Carlyle Group LP | 82,800 | | 2,560,176 |
CBS Corp. Class B | 43,425 | | 2,568,155 |
Colgate-Palmolive Co. | 40,700 | | 2,634,511 |
Comcast Corp. Class A | 44,200 | | 2,103,036 |
Cummins, Inc. | 18,418 | | 2,339,454 |
Danaher Corp. | 35,731 | | 2,575,848 |
DIRECTV (a) | 35,600 | | 2,224,644 |
Estee Lauder Companies, Inc. Class A | 30,716 | | 2,179,607 |
FMC Corp. | 34,099 | | 2,481,043 |
Google, Inc. Class A (a) | 2,480 | | 2,555,838 |
Home Depot, Inc. | 35,761 | | 2,785,424 |
Honeywell International, Inc. | 24,000 | | 2,081,520 |
KKR & Co. LP | 107,300 | | 2,355,235 |
Las Vegas Sands Corp. | 36,526 | | 2,564,856 |
Lorillard, Inc. | 45,800 | | 2,336,258 |
Lowe's Companies, Inc. | 49,200 | | 2,449,176 |
MasterCard, Inc. Class A | 3,740 | | 2,681,954 |
McGraw-Hill Companies, Inc. | 36,485 | | 2,542,275 |
Mead Johnson Nutrition Co. Class A | 30,358 | | 2,479,034 |
Mettler-Toledo International, Inc. (a) | 8,900 | | 2,202,394 |
Monsanto Co. | 21,200 | | 2,223,456 |
Moody's Corp. | 35,040 | | 2,475,926 |
Mylan, Inc. (a) | 56,281 | | 2,131,361 |
NIKE, Inc. Class B | 31,500 | | 2,386,440 |
Philip Morris International, Inc. | 30,158 | | 2,687,681 |
PPG Industries, Inc. | 14,803 | | 2,702,732 |
Precision Castparts Corp. | 10,000 | | 2,534,500 |
priceline.com, Inc. (a) | 2,260 | | 2,381,656 |
ResMed, Inc. (d) | 43,200 | | 2,235,168 |
Rockwell Automation, Inc. | 22,154 | | 2,446,023 |
Roper Industries, Inc. | 17,500 | | 2,219,175 |
Sherwin-Williams Co. | 13,260 | | 2,492,880 |
The Blackstone Group LP | 98,900 | | 2,599,092 |
The Walt Disney Co. | 37,067 | | 2,542,426 |
Thermo Fisher Scientific, Inc. | 22,900 | | 2,239,162 |
Time Warner, Inc. | 36,700 | | 2,522,758 |
Union Pacific Corp. | 14,500 | | 2,195,300 |
United Technologies Corp. | 23,008 | | 2,444,600 |
Visa, Inc. Class A | 12,440 | | 2,446,575 |
W.R. Grace & Co. (a) | 23,000 | | 2,108,180 |
Yahoo!, Inc. (a) | 60,600 | | 1,995,558 |
TOTAL UNITED STATES OF AMERICA | | 115,336,034 |
TOTAL COMMON STOCKS (Cost $773,260,655) |
927,233,769
|
Nonconvertible Preferred Stocks - 1.0% |
| | | |
Brazil - 0.4% |
Itausa-Investimentos Itau SA (PN) | 745,500 | | 3,211,354 |
Nonconvertible Preferred Stocks - continued |
| Shares | | Value |
Germany - 0.6% |
Porsche Automobil Holding SE (Germany) | 34,172 | | $ 3,200,931 |
Sartorius AG (non-vtg.) | 23,500 | | 2,479,184 |
TOTAL GERMANY | | 5,680,115 |
United Kingdom - 0.0% |
Rolls-Royce Group PLC Series C | 19,883,200 | | 31,881 |
TOTAL NONCONVERTIBLE PREFERRED STOCKS (Cost $7,979,680) |
8,923,350
|
Money Market Funds - 2.1% |
| | | |
Fidelity Cash Central Fund, 0.09% (b) | 8,087,351 | | 8,087,351 |
Fidelity Securities Lending Cash Central Fund, 0.09% (b)(c) | 11,742,600 | | 11,742,600 |
TOTAL MONEY MARKET FUNDS (Cost $19,829,951) |
19,829,951
|
TOTAL INVESTMENT PORTFOLIO - 101.7% (Cost $801,070,286) | | 955,987,070 |
NET OTHER ASSETS (LIABILITIES) - (1.7)% | | (16,041,892) |
NET ASSETS - 100% | $ 939,945,178 |
Legend |
(a) Non-income producing |
(b) Affiliated fund that is generally available only to investment companies and other accounts managed by Fidelity Investments. The rate quoted is the annualized seven-day yield of the fund at period end. A complete unaudited listing of the fund's holdings as of its most recent quarter end is available upon request. In addition, each Fidelity Central Fund's financial statements, which are not covered by the Fund's Report of Independent Registered Public Accounting Firm, are available on the SEC's website or upon request. |
(c) Investment made with cash collateral received from securities on loan. |
(d) Security or a portion of the security is on loan at period end. |
Affiliated Central Funds |
Information regarding fiscal year to date income earned by the Fund from investments in Fidelity Central Funds is as follows: |
Fund | Income earned |
Fidelity Cash Central Fund | $ 4,672 |
Fidelity Securities Lending Cash Central Fund | 285,981 |
Total | $ 290,653 |
Other Information |
Categorizations in the Schedule of Investments are based on country or territory of incorporation. |
The following is a summary of the inputs used, as of October 31, 2013, involving the Fund's assets and liabilities carried at fair value. The inputs or methodology used for valuing securities may not be an indication of the risk associated with investing in those securities. For more information on valuation inputs, and their aggregation into the levels used in the tables below, please refer to the Investment Valuation section in the accompanying Notes to Financial Statements. |
Valuation Inputs at Reporting Date: |
Description | Total | Level 1 | Level 2 | Level 3 |
Investments in Securities: | | | | |
Equities: | | | | |
Consumer Discretionary | $ 226,981,367 | $ 191,764,635 | $ 35,216,732 | $ - |
Consumer Staples | 125,031,808 | 83,152,119 | 41,879,689 | - |
Energy | 4,602,209 | 4,602,209 | - | - |
Financials | 162,760,586 | 133,819,211 | 28,941,375 | - |
Health Care | 74,462,264 | 57,480,276 | 16,981,988 | - |
Industrials | 168,124,157 | 140,310,164 | 27,813,993 | - |
Information Technology | 89,504,347 | 73,070,974 | 16,433,373 | - |
Materials | 75,566,451 | 63,737,462 | 11,828,989 | - |
Telecommunication Services | 9,123,930 | 3,799,324 | 5,324,606 | - |
Money Market Funds | 19,829,951 | 19,829,951 | - | - |
Total Investments in Securities: | $ 955,987,070 | $ 771,566,325 | $ 184,420,745 | $ - |
The following is a summary of transfers between Level 1 and Level 2 for the period ended October 31, 2013. Transfers are assumed to have occurred at the beginning of the period, and are primarily attributable to the valuation techniques used for foreign equity securities, as discussed in the accompanying Notes to Financial Statements: |
Transfers | Total |
Level 1 to Level 2 | $ 39,168,267 |
Level 2 to Level 1 | $ 0 |
See accompanying notes which are an integral part of the financial statements.
Annual Report
Fidelity International Capital Appreciation Fund
Statement of Assets and Liabilities
| October 31, 2013 |
| | |
Assets | | |
Investment in securities, at value (including securities loaned of $11,403,635) - See accompanying schedule: Unaffiliated issuers (cost $781,240,335) | $ 936,157,119 | |
Fidelity Central Funds (cost $19,829,951) | 19,829,951 | |
Total Investments (cost $801,070,286) | | $ 955,987,070 |
Foreign currency held at value (cost $127,109) | | 127,136 |
Receivable for investments sold | | 24,337,368 |
Receivable for fund shares sold | | 632,843 |
Dividends receivable | | 1,694,740 |
Distributions receivable from Fidelity Central Funds | | 6,287 |
Prepaid expenses | | 3,019 |
Other receivables | | 321,641 |
Total assets | | 983,110,104 |
| | |
Liabilities | | |
Payable for investments purchased | $ 29,078,875 | |
Payable for fund shares redeemed | 501,573 | |
Accrued management fee | 659,369 | |
Other affiliated payables | 189,703 | |
Other payables and accrued expenses | 992,806 | |
Collateral on securities loaned, at value | 11,742,600 | |
Total liabilities | | 43,164,926 |
| | |
Net Assets | | $ 939,945,178 |
Net Assets consist of: | | |
Paid in capital | | $ 809,553,957 |
Undistributed net investment income | | 6,652,288 |
Accumulated undistributed net realized gain (loss) on investments and foreign currency transactions | | (30,201,871) |
Net unrealized appreciation (depreciation) on investments and assets and liabilities in foreign currencies | | 153,940,804 |
Net Assets, for 57,747,061 shares outstanding | | $ 939,945,178 |
Net Asset Value, offering price and redemption price per share ($939,945,178 ÷ 57,747,061 shares) | | $ 16.28 |
Statement of Operations
| Year ended October 31, 2013 |
| | |
Investment Income | | |
Dividends | | $ 18,163,221 |
Interest | | 37 |
Income from Fidelity Central Funds | | 290,653 |
Income before foreign taxes withheld | | 18,453,911 |
Less foreign taxes withheld | | (1,337,662) |
Total income | | 17,116,249 |
| | |
Expenses | | |
Management fee
Basic fee | $ 6,048,183 | |
Performance adjustment | 1,325,222 | |
Transfer agent fees | 1,837,247 | |
Accounting and security lending fees | 410,147 | |
Custodian fees and expenses | 302,889 | |
Independent trustees' compensation | 4,895 | |
Registration fees | 40,939 | |
Audit | 82,792 | |
Legal | 2,266 | |
Interest | 2,416 | |
Miscellaneous | 7,101 | |
Total expenses before reductions | 10,064,097 | |
Expense reductions | (404,143) | 9,659,954 |
Net investment income (loss) | | 7,456,295 |
Realized and Unrealized Gain (Loss) Net realized gain (loss) on: | | |
Investment securities: | | |
Unaffiliated issuers (net of foreign taxes of $39,827) | 112,158,711 | |
Foreign currency transactions | (356,985) | |
Total net realized gain (loss) | | 111,801,726 |
Change in net unrealized appreciation (depreciation) on: Investment securities (net of increase in deferred foreign taxes of $589,497) | 70,548,268 | |
Assets and liabilities in foreign currencies | (60,794) | |
Total change in net unrealized appreciation (depreciation) | | 70,487,474 |
Net gain (loss) | | 182,289,200 |
Net increase (decrease) in net assets resulting from operations | | $ 189,745,495 |
See accompanying notes which are an integral part of the financial statements.
Annual Report
Statement of Changes in Net Assets
| Year ended
October 31,
2013 | Year ended
October 31,
2012 |
Increase (Decrease) in Net Assets | | |
Operations | | |
Net investment income (loss) | $ 7,456,295 | $ 6,707,733 |
Net realized gain (loss) | 111,801,726 | 2,157,172 |
Change in net unrealized appreciation (depreciation) | 70,487,474 | 62,856,713 |
Net increase (decrease) in net assets resulting from operations | 189,745,495 | 71,721,618 |
Distributions to shareholders from net investment income | (7,093,102) | (5,617,060) |
Distributions to shareholders from net realized gain | - | (424,819) |
Total distributions | (7,093,102) | (6,041,879) |
Share transactions
Proceeds from sales of shares | 194,490,297 | 234,885,779 |
Reinvestment of distributions | 5,286,278 | 4,397,051 |
Cost of shares redeemed | (173,012,679) | (130,029,260) |
Net increase (decrease) in net assets resulting from share transactions | 26,763,896 | 109,253,570 |
Redemption fees | 13,934 | 13,254 |
Total increase (decrease) in net assets | 209,430,223 | 174,946,563 |
| | |
Net Assets | | |
Beginning of period | 730,514,955 | 555,568,392 |
End of period (including undistributed net investment income of $6,652,288 and undistributed net investment income of $6,291,641, respectively) | $ 939,945,178 | $ 730,514,955 |
Other Information Shares | | |
Sold | 13,452,087 | 19,239,728 |
Issued in reinvestment of distributions | 389,022 | 382,352 |
Redeemed | (11,788,439) | (10,649,285) |
Net increase (decrease) | 2,052,670 | 8,972,795 |
Financial Highlights - International Capital Appreciation Fund
Years ended October 31, | 2013 | 2012 | 2011 | 2010 | 2009 |
Selected Per-Share Data | | | | | |
Net asset value, beginning of period | $ 13.12 | $ 11.89 | $ 12.63 | $ 10.78 | $ 7.42 |
Income from Investment Operations | | | | | |
Net investment income (loss) B | .13 | .12 | .13 E | .12 | .13 |
Net realized and unrealized gain (loss) | 3.16 | 1.24 | (.62) | 1.92 | 3.26 |
Total from investment operations | 3.29 | 1.36 | (.49) | 2.04 | 3.39 |
Distributions from net investment income | (.13) | (.12) | (.15) | (.07) | (.03) |
Distributions from net realized gain | - | (.01) | (.10) | (.12) | - |
Total distributions | (.13) | (.13) | (.25) | (.19) | (.03) |
Redemption fees added to paid in capital B, G | - | - | - | - | - |
Net asset value, end of period | $ 16.28 | $ 13.12 | $ 11.89 | $ 12.63 | $ 10.78 |
Total Return A | 25.24% | 11.57% | (4.03)% | 19.12% | 45.95% |
Ratios to Average Net Assets C, F | | | | | |
Expenses before reductions | 1.17% | 1.22% | 1.16% | 1.04% | .84% |
Expenses net of fee waivers, if any | 1.17% | 1.22% | 1.16% | 1.04% | .84% |
Expenses net of all reductions | 1.12% | 1.19% | 1.09% | .87% | .72% |
Net investment income (loss) | .87% | 1.01% | 1.02% E | 1.07% | 1.49% |
Supplemental Data | | | | | |
Net assets, end of period (000 omitted) | $ 939,945 | $ 730,515 | $ 555,568 | $ 627,129 | $ 456,330 |
Portfolio turnover rate D | 136% | 127% | 254% | 480% | 387% |
A Total returns would have been lower if certain expenses had not been reduced during the applicable periods shown.
B Calculated based on average shares outstanding during the period.
C Fees and expenses of any underlying Fidelity Central Funds are not included in the Fund's expense ratio. The Fund indirectly bears its proportionate share of the expenses of any underlying Fidelity Central Funds.
D Amount does not include the portfolio activity of any underlying Fidelity Central Funds.
E Investment income per share reflects a large, non-recurring dividend which amounted to $.03 per share. Excluding this non-recurring dividend, the ratio of net investment income (loss) to average net assets would have been .78%.
F Expense ratios reflect operating expenses of the Fund. Expenses before reductions do not reflect amounts reimbursed by the investment adviser or reductions from brokerage service arrangements or reductions from other expense offset arrangements and do not represent the amount paid by the Fund during periods when reimbursements or reductions occur. Expenses net of fee waivers reflect expenses after reimbursement by the investment adviser but prior to reductions from brokerage service arrangements or other expense offset arrangements. Expenses net of all reductions represent the net expenses paid by the Fund.
G Amount represents less than $.01 per share.
See accompanying notes which are an integral part of the financial statements.
Annual Report
Fidelity International Capital Appreciation Fund
Notes to Financial Statements
For the period ended October 31, 2013
1. Organization.
Fidelity International Capital Appreciation Fund (the Fund) is a fund of Fidelity Investment Trust (the Trust) and is authorized to issue an unlimited number of shares. The Trust is registered under the Investment Company Act of 1940, as amended (the 1940 Act), as an open-end management investment company organized as a Massachusetts business trust. The Fund's investments in emerging markets can be subject to social, economic, regulatory, and political uncertainties and can be extremely volatile.
2. Investments in Fidelity Central Funds.
The Fund invests in Fidelity Central Funds, which are open-end investment companies generally available only to other investment companies and accounts managed by Fidelity Management & Research Company (FMR) and its affiliates. The Fund's Schedule of Investments lists each of the Fidelity Central Funds held as of period end, if any, as an investment of the Fund, but does not include the underlying holdings of each Fidelity Central Fund. As an Investing Fund, the Fund indirectly bears its proportionate share of the expenses of the underlying Fidelity Central Funds.
The Money Market Central Funds seek preservation of capital and current income and are managed by Fidelity Investments Money Management, Inc. (FIMM), an affiliate of FMR.
A complete unaudited list of holdings for each Fidelity Central Fund is available upon request or at the Securities and Exchange Commission (the SEC) website at www.sec.gov. In addition, the financial statements of the Fidelity Central Funds, which are not covered by the Fund's Report of Independent Registered Public Accounting Firm, are available on the SEC website or upon request.
3. Significant Accounting Policies.
The financial statements have been prepared in conformity with accounting principles generally accepted in the United States of America (GAAP), which require management to make certain estimates and assumptions at the date of the financial statements. Actual results could differ from those estimates. Subsequent events, if any, through the date that the financial statements were issued have been evaluated in the preparation of the financial statements. The following summarizes the significant accounting policies of the Fund:
Investment Valuation. Investments are valued as of 4:00 p.m. Eastern time on the last calendar day of the period. In accordance with valuation policies and procedures approved by the Board of Trustees (the Board), the Fund attempts to obtain prices from one or more third party pricing vendors or brokers to value its investments. When current market prices, quotations or currency exchange rates are not readily available or reliable, investments will be fair valued in good faith by the FMR Fair Value Committee (the Committee), in accordance with procedures adopted by the Board. Factors used in determining fair value vary by investment type and may include market or investment specific events. The frequency with which these procedures are used cannot be predicted and they may be utilized to a significant extent. The Committee oversees the Fund's valuation policies and procedures and is responsible for approving and reporting to the Board all fair value determinations.
The Fund categorizes the inputs to valuation techniques used to value its investments into a disclosure hierarchy consisting of three levels as shown below:
Level 1 - quoted prices in active markets for identical investments
Level 2 - other significant observable inputs (including quoted prices for similar investments, interest rates, prepayment speeds, etc.)
Level 3 - unobservable inputs (including the Fund's own assumptions based on the best information available)
Valuation techniques used to value the Fund's investments by major category are as follows:
Equity securities, including restricted securities, for which market quotations are readily available, are valued at the last reported sale price or official closing price as reported by a third party pricing vendor on the primary market or exchange on which they are traded and are categorized as Level 1 in the hierarchy. In the event there were no sales during the day or closing prices are not available, securities are valued at the last quoted bid price or may be valued using the last available price and are generally categorized as Level 2 in the hierarchy. For foreign equity securities, when market or security specific events arise, comparisons to the valuation of American Depositary Receipts (ADRs), futures contracts, Exchange-Traded Funds (ETFs) and certain indexes as well as quoted prices for similar securities may be used and would be categorized as Level 2 in the hierarchy. Utilizing these techniques may result in transfers between Level 1 and Level 2. For equity securities, including restricted securities, where observable inputs are limited, assumptions about market activity and risk are used and these securities may be categorized as Level 3 in the hierarchy.
Investments in open-end mutual fund, including the Fidelity Central Funds, are valued at their closing net asset value (NAV) each business day and are categorized as Level 1 in the hierarchy.
Annual Report
3. Significant Accounting Policies - continued
Investment Valuation - continued
Changes in valuation techniques may result in transfers in or out of an assigned level within the disclosure hierarchy. The aggregate value of investments by input level, as of October 31, 2013, including information on transfers between Levels 1 and 2, is included at the end of the Fund's Schedule of Investments.
Foreign Currency. The Fund may use foreign currency contracts to facilitate transactions in foreign-denominated securities. Gains and losses from these transactions may arise from changes in the value of the foreign currency or if the counterparties do not perform under the contracts' terms.
Foreign-denominated assets, including investment securities, and liabilities are translated into U.S. dollars at the exchange rates at period end. Purchases and sales of investment securities, income and dividends received and expenses denominated in foreign currencies are translated into U.S. dollars at the exchange rate in effect on the transaction date.
The effects of exchange rate fluctuations on investments are included with the net realized and unrealized gain (loss) on investment securities. Other foreign currency transactions resulting in realized and unrealized gain (loss) are disclosed separately.
Investment Transactions and Income. For financial reporting purposes, the Fund's investment holdings and NAV include trades executed through the end of the last business day of the period. The NAV per share for processing shareholder transactions is calculated as of the close of business of the New York Stock Exchange (NYSE), normally 4:00 p.m. Eastern time and includes trades executed through the end of the prior business day. Gains and losses on securities sold are determined on the basis of identified cost and may include proceeds received from litigation. Dividend income is recorded on the ex-dividend date, except for certain dividends from foreign securities where the ex-dividend date may have passed, which are recorded as soon as the Fund is informed of the ex-dividend date. Non-cash dividends included in dividend income, if any, are recorded at the fair market value of the securities received. Distributions received on securities that represent a return of capital or capital gain are recorded as a reduction of cost of investments and/or as a realized gain. Subsequent to ex-dividend date the Fund determines the components of these distributions, based upon receipt of tax filings or other correspondence relating to the underlying investment. Interest income and distributions from the Fidelity Central Funds are accrued as earned. Interest income includes coupon interest and amortization of premium and accretion of discount on debt securities. Investment income is recorded net of foreign taxes withheld where recovery of such taxes is uncertain.
Expenses. Expenses directly attributable to a fund are charged to that fund. Expenses attributable to more than one fund are allocated among the respective funds on the basis of relative net assets or other appropriate methods. Expense estimates are accrued in the period to which they relate and adjustments are made when actual amounts are known.
Income Tax Information and Distributions to Shareholders. Each year, the Fund intends to qualify as a regulated investment company under Subchapter M of the Internal Revenue Code, including distributing substantially all of its taxable income and realized gains. As a result, no provision for U.S. Federal income taxes is required. As of October 31, 2013, the Fund did not have any unrecognized tax benefits in the financial statements; nor is the Fund aware of any tax positions for which it is reasonably possible that the total amounts of unrecognized tax benefits will significantly change in the next twelve months. The Fund files a U.S. federal tax return, in addition to state and local tax returns as required. The Fund's federal income tax returns are subject to examination by the Internal Revenue Service (IRS) for a period of three fiscal years after they are filed. State and local tax returns may be subject to examination for an additional fiscal year depending on the jurisdiction. Foreign taxes are provided for based on the Fund's understanding of the tax rules and rates that exist in the foreign markets in which it invests. The Fund is subject to a tax imposed on capital gains by certain countries in which it invests. An estimated deferred tax liability for net unrealized appreciation on the applicable securities is included in Other payables and accrued expenses on the Statement of Assets & Liabilities.
Distributions are declared and recorded on the ex-dividend date. Income and capital gain distributions are determined in accordance with income tax regulations, which may differ from GAAP. In addition, the Fund claimed a portion of the payment made to redeeming shareholders as a distribution for income tax purposes.
Capital accounts within the financial statements are adjusted for permanent book-tax differences. These adjustments have no impact on net assets or the results of operations. Temporary book-tax differences will reverse in a subsequent period.
Book-tax differences are primarily due to foreign currency transactions, certain foreign taxes, passive foreign investment companies (PFIC), partnerships, deferred trustees compensation, capital loss carryforwards and losses deferred due to wash sales.
The federal tax cost of investment securities and unrealized appreciation (depreciation) as of period end on an unconsolidated basis were as follows:
Gross unrealized appreciation | $ 159,767,893 |
Gross unrealized depreciation | (8,272,858) |
Net unrealized appreciation (depreciation) on securities and other investments | $ 151,495,035 |
| |
Tax Cost | $ 804,492,035 |
Annual Report
Fidelity International Capital Appreciation Fund
Notes to Financial Statements - continued
3. Significant Accounting Policies - continued
Income Tax Information and Distributions to Shareholders - continued
The tax-based components of distributable earnings as of period end were as follows:
Undistributed ordinary income | $ 6,802,893 |
Capital loss carryforward | $ (26,930,714) |
Net unrealized appreciation (depreciation) | $ 151,373,082 |
Capital loss carryforwards are only available to offset future capital gains of the Fund to the extent provided by regulations and may be limited. Under the Regulated Investment Company Modernization Act of 2010 (the Act), the Fund is permitted to carry forward capital losses incurred in taxable years beginning after December 22, 2010 for an unlimited period and such capital losses are required to be used prior to any losses that expire. The capital loss carryforward information presented below, including any applicable limitation, is estimated as of fiscal period end and is subject to adjustment.
Fiscal year of expiration | |
2017 | $ (26,930,714) |
The tax character of distributions paid was as follows:
| October 31, 2013 | October 31, 2012 |
Ordinary Income | $ 7,093,102 | $ 6,041,879 |
Short-Term Trading (Redemption) Fees. Shares held by investors in the Fund less than 30 days may have been subject to a redemption fee equal to 1.00% of the net asset value of shares redeemed. All redemption fees, which reduce the proceeds of the shareholder redemption, are retained by the Fund and accounted for as an addition to paid in capital.
4. Purchases and Sales of Investments.
Purchases and sales of securities, other than short-term securities, aggregated $1,181,982,335 and $1,158,357,165, respectively.
5. Fees and Other Transactions with Affiliates.
Management Fee. FMR and its affiliates provide the Fund with investment management related services for which the Fund pays a monthly management fee. The management fee is the sum of an individual fund fee rate that is based on an annual rate of .45% of the Fund's average net assets and an annualized group fee rate that averaged .25% during the period. The group fee rate is based upon the average net assets of all the mutual funds advised by FMR, including any mutual funds previously advised by FMR that are currently advised by Fidelity SelectCo, LLC, an affiliate of FMR. The group fee rate decreases as assets under management increase and increases as assets under management decrease. In addition, the management fee is subject to a performance adjustment (up to a maximum of ± .20% of the Fund's average net assets over a 36 month performance period). The upward or downward adjustment to the management fee is based on the Fund's relative investment performance as compared to an appropriate benchmark index over the same 36 month performance period. For the reporting period, the total annual management fee rate, including the performance adjustment, was .86% of the Fund's average net assets. The performance adjustment included in the management fee rate may be higher or lower than the maximum performance adjustment rate due to the difference between the average net assets for the reporting and performance periods.
Transfer Agent Fees. Fidelity Investments Institutional Operations Company, Inc. (FIIOC), an affiliate of FMR, is the Fund's transfer, dividend disbursing and shareholder servicing agent. FIIOC receives account fees and asset-based fees that vary according to account size and type of account. FIIOC pays for typesetting, printing and mailing of shareholder reports, except proxy statements. For the period, the transfer agent fees were equivalent to an annual rate of .21% of average net assets.
Accounting and Security Lending Fees. Fidelity Service Company, Inc. (FSC), an affiliate of FMR, maintains the Fund's accounting records. The accounting fee is based on the level of average net assets for each month. Under a separate contract, FSC administers the security lending program. The security lending fee is based on the number and duration of lending transactions.
Brokerage Commissions. The Fund placed a portion of its portfolio transactions with brokerage firms which are affiliates of the investment adviser. Brokerage commissions are included in net realized gain (loss) and change in net unrealized appreciation (depreciation) in the Statement of Operations. The commissions paid to these affiliated firms were $9,872 for the period.
Annual Report
5. Fees and Other Transactions with Affiliates - continued
Interfund Lending Program. Pursuant to an Exemptive Order issued by the SEC, the Fund, along with other registered investment companies having management contracts with FMR, may participate in an interfund lending program. This program provides an alternative credit facility allowing the funds to borrow from, or lend money to, other participating affiliated funds. At period end, there were no interfund loans outstanding. The Fund's activity in this program during the period for which loans were outstanding was as follows:
Borrower or Lender | Average Loan
Balance | Weighted Average
Interest Rate | Interest
Expense |
Borrower | $ 5,871,923 | .35% | $ 2,206 |
6. Committed Line of Credit.
The Fund participates with other funds managed by FMR or an affiliate in a $4.25 billion credit facility (the "line of credit") to be utilized for temporary or emergency purposes to fund shareholder redemptions or for other short-term liquidity purposes. The Fund has agreed to pay commitment fees on its pro-rata portion of the line of credit, which amounted to $1,824 and is reflected in Miscellaneous expenses on the Statement of Operations. During the period, there were no borrowings on this line of credit.
7. Security Lending.
The Fund lends portfolio securities through a lending agent from time to time in order to earn additional income. For equity securities, a lending agent is used and may loan securities to certain qualified borrowers, including Fidelity Capital Markets (FCM), a broker-dealer affiliated with the Fund. On the settlement date of the loan, the Fund receives collateral (in the form of U.S. Treasury obligations, letters of credit and/or cash) against the loaned securities and maintains collateral in an amount not less than 100% of the market value of the loaned securities during the period of the loan. The market value of the loaned securities is determined at the close of business of the Fund and any additional required collateral is delivered to the Fund on the next business day. If the borrower defaults on its obligation to return the securities loaned because of insolvency or other reasons, the Fund may apply collateral received from the borrower against the obligation. The Fund may experience delays and costs in recovering the securities loaned. Any cash collateral received is invested in the Fidelity Securities Lending Cash Central Fund. The value of loaned securities and cash collateral at period end are disclosed on the Fund's Statement of Assets and Liabilities. Security lending income represents the income earned on investing cash collateral, less rebates paid to borrowers and any lending agent fees associated with the loan, plus any premium payments received for lending certain types of securities. Security lending income is presented in the Statement of Operations as a component of income from Fidelity Central Funds. Total security lending income during the period amounted to $285,981. During the period, there were no securities loaned to FCM.
8. Bank Borrowings.
The Fund is permitted to have bank borrowings for temporary or emergency purposes to fund shareholder redemptions or for other short-term liquidity requirements. The Fund has established borrowing arrangements with certain banks. The interest rate on the borrowings is the bank's base rate, as revised from time to time. The average loan balance during the period for which loans were outstanding amounted to $2,097,667. The weighted average interest rate was .60%. The interest expense amounted to $210 under the bank borrowing program. At period end, there were no bank borrowings outstanding.
9. Expense Reductions.
Commissions paid to certain brokers with whom FMR, or its affiliates, places trades on behalf of the Fund include an amount to the Fund in addition to trade execution, which may be rebated back to the Fund to offset certain expenses. This amount totaled $396,066 for the period.
In addition, FMR reimbursed a portion of the Fund's operating expenses during the period in the amount of $8,077.
10. Other.
The Fund's organizational documents provide former and current trustees and officers with a limited indemnification against liabilities arising in connection with the performance of their duties to the Fund. In the normal course of business, the Fund may also enter into contracts that provide general indemnifications. The Fund's maximum exposure under these arrangements is unknown as this would be dependent on future claims that may be made against the Fund. The risk of material loss from such claims is considered remote.
At the end of the period, Strategic Advisers International II Fund was the owner of record of approximately 11% of the total outstanding shares of the Fund. Mutual funds managed by FMR or its affiliates were the owners of record, in the aggregate, of approximately 30% of the total outstanding shares of the Fund.
Annual Report
Report of Independent Registered Public Accounting Firm
To the Trustees of Fidelity Investment Trust and Shareholders of Fidelity International Capital Appreciation Fund:
We have audited the accompanying statement of assets and liabilities of Fidelity International Capital Appreciation Fund (the Fund), a fund of Fidelity Investment Trust, including the schedule of investments, as of October 31, 2013, and the related statement of operations for the year then ended, the statement of changes in net assets for each of the two years in the period then ended, and the financial highlights for each of the five years in the period then ended. These financial statements and financial highlights are the responsibility of the Fund's management. Our responsibility is to express an opinion on these financial statements and financial highlights based on our audits.
We conducted our audits in accordance with the standards of the Public Company Accounting Oversight Board (United States). Those standards require that we plan and perform the audit to obtain reasonable assurance about whether the financial statements and financial highlights are free of material misstatement. The Fund is not required to have, nor were we engaged to perform, an audit of its internal control over financial reporting. Our audits included consideration of internal control over financial reporting as a basis for designing audit procedures that are appropriate in the circumstances, but not for the purpose of expressing an opinion on the effectiveness of the Fund's internal control over financial reporting. Accordingly, we express no such opinion. An audit also includes examining, on a test basis, evidence supporting the amounts and disclosures in the financial statements, assessing the accounting principles used and significant estimates made by management, as well as evaluating the overall financial statement presentation. Our procedures included confirmation of securities owned as of October 31, 2013, by correspondence with the custodians and brokers; where replies were not received from brokers, we performed other auditing procedures. We believe that our audits provide a reasonable basis for our opinion.
In our opinion, the financial statements and financial highlights referred to above present fairly, in all material respects, the financial position of Fidelity International Capital Appreciation Fund as of October 31, 2013, the results of its operations for the year then ended, the changes in its net assets for each of the two years in the period then ended, and the financial highlights for each of the five years in the period then ended, in conformity with accounting principles generally accepted in the United States of America.
DELOITTE & TOUCHE LLP
Boston, Massachusetts
December 13, 2013
Annual Report
Fidelity Overseas Fund
As a shareholder of the Fund, you incur two types of costs: (1) transaction costs, including redemption fees and (2) ongoing costs, including management fees and other Fund expenses. This Example is intended to help you understand your ongoing costs (in dollars) of investing in the Fund and to compare these costs with the ongoing costs of investing in other mutual funds.
The Example is based on an investment of $1,000 invested at the beginning of the period and held for the entire period (May 1, 2013 to October 31, 2013).
Actual Expenses
The first line of the accompanying table for each class of the Fund provides information about actual account values and actual expenses. You may use the information in this line, together with the amount you invested, to estimate the expenses that you paid over the period. Simply divide your account value by $1,000.00 (for example, an $8,600 account value divided by $1,000.00 = 8.6), then multiply the result by the number in the first line for a class of the Fund under the heading entitled "Expenses Paid During Period" to estimate the expenses you paid on your account during this period. A small balance maintenance fee of $12.00 that is charged once a year may apply for certain accounts with a value of less than $2,000. This fee is not included in the table below. If it was, the estimate of expenses you paid during the period would be higher, and your ending account value lower, by this amount. In addition, the Fund, as a shareholder in the underlying Fidelity Central Funds, will indirectly bear its pro-rata share of the fees and expenses incurred by the underlying Fidelity Central Funds. These fees and expenses are not included in the Fund's annualized expense ratio used to calculate the expense estimate in the table below.
Hypothetical Example for Comparison Purposes
The second line of the accompanying table for each class of the Fund provides information about hypothetical account values and hypothetical expenses based on a Class' actual expense ratio and an assumed rate of return of 5% per year before expenses, which is not the Class' actual return. The hypothetical account values and expenses may not be used to estimate the actual ending account balance or expenses you paid for the period. You may use this information to compare the ongoing costs of investing in the Fund and other funds. To do so, compare this 5% hypothetical example with the 5% hypothetical examples that appear in the shareholder reports of the other funds. A small balance maintenance fee of $12.00 that is charged once a year may apply for certain accounts with a value of less than $2,000. This fee is not included in the table below. If it was, the estimate of expenses you paid during the period would be higher, and your ending account value lower, by this amount. In addition, the Fund, as a shareholder in the underlying Fidelity Central Funds, will indirectly bear its pro-rata share of the fees and expenses incurred by the underlying Fidelity Central Funds. These fees and expenses are not included in the Fund's annualized expense ratio used to calculate the expense estimate in the table below.
Please note that the expenses shown in the table are meant to highlight your ongoing costs only and do not reflect any transaction costs. Therefore, the second line of the table is useful in comparing ongoing costs only, and will not help you determine the relative total costs of owning different funds. In addition, if these transactional costs were included, your costs would have been higher.
| Annualized
Expense Ratio B | Beginning
Account Value
May 1, 2013 | Ending
Account Value
October 31, 2013 | Expenses Paid
During Period*
May 1, 2013
to October 31, 2013 |
Overseas | 1.16% | | | |
Actual | | $ 1,000.00 | $ 1,099.50 | $ 6.14 |
Hypothetical A | | $ 1,000.00 | $ 1,019.36 | $ 5.90 |
Class K | .98% | | | |
Actual | | $ 1,000.00 | $ 1,100.30 | $ 5.19 |
Hypothetical A | | $ 1,000.00 | $ 1,020.27 | $ 4.99 |
A 5% return per year before expenses
B Annualized expense ratio reflects expenses net of applicable fee waivers.
* Expenses are equal to each Class' annualized expense ratio, multiplied by the average account value over the period, multiplied by 184/365 (to reflect the one-half year period).
Annual Report
Fidelity Overseas Fund
Performance: The Bottom Line
Average annual total return reflects the change in the value of an investment, assuming reinvestment of the class' distributions from dividend income and capital gains (the profits earned upon the sale of securities that have grown in value, if any) and assuming a constant rate of performance each year. The $10,000 table and the fund's returns do not reflect the deduction of taxes that a shareholder would pay on fund distributions or the redemption of fund shares. During periods of reimbursement by Fidelity, a fund's total return will be greater than it would be had the reimbursement not occurred. How a fund did yesterday is no guarantee of how it will do tomorrow.
Average Annual Total Returns
Periods ended October 31, 2013 | Past 1
year | Past 5
years | Past 10
years |
Fidelity Overseas Fund | 28.17% | 11.27% | 6.84% |
$10,000 Over 10 Years
Let's say hypothetically that $10,000 was invested in Fidelity Overseas Fund, a class of the fund, on October 31, 2003. The chart shows how the value of your investment would have changed, and also shows how the MSCI EAFE Index performed over the same period.

Annual Report
Fidelity Overseas Fund
Market Recap: On balance, global equity markets remained upbeat for the 12-month period ending October 31, 2013. The MSCI® ACWI® (All Country World Index) Index gained 23.75% for the period, amid investor preference for higher-risk assets. The period was not without turbulence, however. In the spring and summer, central banks worldwide, especially in the U.S. and China, made clear their intentions to maintain accommodative monetary policies. That stance, combined with modest cyclical improvements around the globe and generally low valuations, underpinned the broad rally in equities. Europe (+32%) shone brightly, with most markets in the region - large and small - registering solid, index-beating gains. Another bright spot was Japan, which, despite a struggling yen and taking a second-half breather, posted a 34% result for the full year. The U.S. - by far the index's biggest constituent - also outperformed the global market with a roughly 28% advance. Meanwhile, Asia-Pacific ex Japan (+14%) lagged, hurt in part by a slowdown in Australia's mining industry as well as currency headwinds. Foreign-exchange and commodity weakness also curbed results in resource-heavy Canada and emerging markets (EM), both of which were up 7%. Country-level EM performance diverged meaningfully for the period, as evidenced by performance in Brazil (-1%), Russia (+12%), India (+1%) and China (+8%).
Comments from Vincent Montemaggiore, Portfolio Manager of Fidelity® Overseas Fund: For the year, the fund's Retail Class shares returned 28.17%, topping the 27.02% gain of the MSCI® EAFE® Index. Versus the index, the fund was particularly helped by stock picking in the United Kingdom and a sizable underweighting in the Asia-Pacific ex Japan region. At the stock level, a non-index stake in South African asset manager Coronation Fund Managers was the fund's top relative contributor. The company benefited from superior fund performance and rapid growth in its institutional, retail and international products. Also bolstering our result was an overweighting in Deutsche Post, a Germany-based logistics services provider. Conversely, the fund struggled somewhat on a relative basis because I underweighted Japan to varying degrees throughout the year. Not owning Japanese automaker Toyota Motor until May made it by far the fund's biggest relative detractor, as this stock was one beneficiary of a significantly weaker yen. Saipem, an Italy-based provider of onshore and offshore engineering, construction and drilling services for energy firms, significantly reduced its financial guidance, and I sold the stock in the first half of the period.
The views expressed above reflect those of the portfolio manager(s) only through the end of the period as stated on the cover of this report and do not necessarily represent the views of Fidelity or any other person in the Fidelity organization. Any such views are subject to change at any time based upon market or other conditions and Fidelity disclaims any responsibility to update such views. These views may not be relied on as investment advice and, because investment decisions for a Fidelity fund are based on numerous factors, may not be relied on as an indication of trading intent on behalf of any Fidelity fund.
Annual Report
Fidelity Overseas Fund
Investment Changes (Unaudited)
Geographic Diversification (% of fund's net assets) |
As of October 31, 2013 |
| United Kingdom | 23.6% | |
| Japan | 18.8% | |
| Germany | 11.2% | |
| Switzerland | 9.2% | |
| France | 7.8% | |
| United States of America* | 5.3% | |
| Sweden | 3.3% | |
| Spain | 2.6% | |
| Bailiwick of Jersey | 2.5% | |
| Other | 15.7% | |

* Includes Short-Term Investments and Net Other Assets (Liabilities). |
Percentages are based on country or territory of incorporation and are adjusted for the effect of futures contracts, if applicable. |
As of April 30, 2013 |
| United Kingdom | 24.0% | |
| Japan | 17.6% | |
| Germany | 12.8% | |
| Switzerland | 9.7% | |
| France | 7.1% | |
| United States of America* | 5.1% | |
| Sweden | 4.1% | |
| Australia | 3.0% | |
| Bailiwick of Jersey | 2.1% | |
| Other | 14.5% | |

* Includes Short-Term Investments and Net Other Assets (Liabilities). |
Percentages are based on country or territory of incorporation and are adjusted for the effect of futures contracts, if applicable. |
Asset Allocation as of October 31, 2013 |
| % of fund's
net assets | % of fund's net assets
6 months ago |
Stocks | 99.3 | 99.2 |
Short-Term Investments and Net Other Assets (Liabilities) | 0.7 | 0.8 |
Top Ten Stocks as of October 31, 2013 |
| % of fund's
net assets | % of fund's net assets
6 months ago |
Nestle SA (Switzerland, Food Products) | 2.4 | 2.6 |
Roche Holding AG (participation certificate) (Switzerland, Pharmaceuticals) | 2.3 | 2.2 |
Sanofi SA (France, Pharmaceuticals) | 1.7 | 1.8 |
Bayer AG (Germany, Pharmaceuticals) | 1.6 | 1.4 |
British American Tobacco PLC (United Kingdom) (United Kingdom, Tobacco) | 1.3 | 1.5 |
Vodafone Group PLC (United Kingdom, Wireless Telecommunication Services) | 1.3 | 1.6 |
Anheuser-Busch InBev SA NV (Belgium, Beverages) | 1.3 | 1.3 |
Royal Dutch Shell PLC Class A (United Kingdom) (United Kingdom, Oil, Gas & Consumable Fuels) | 1.3 | 2.0 |
Australia & New Zealand Banking Group Ltd. (Australia, Commercial Banks) | 1.3 | 1.5 |
Diageo PLC (United Kingdom, Beverages) | 1.2 | 1.3 |
| 15.7 | |
Market Sectors as of October 31, 2013 |
| % of fund's
net assets | % of fund's net assets
6 months ago |
Financials | 19.7 | 18.1 |
Consumer Discretionary | 17.3 | 15.3 |
Industrials | 14.4 | 14.1 |
Consumer Staples | 12.6 | 15.4 |
Health Care | 11.9 | 12.9 |
Information Technology | 9.4 | 9.2 |
Materials | 7.9 | 8.5 |
Telecommunication Services | 3.9 | 2.1 |
Energy | 2.2 | 3.6 |
Annual Report
Fidelity Overseas Fund
Investments October 31, 2013
Showing Percentage of Net Assets
Common Stocks - 97.2% |
| Shares | | Value |
Australia - 2.5% |
Ansell Ltd. | 467,835 | | $ 8,617,976 |
Australia & New Zealand Banking Group Ltd. | 985,010 | | 31,504,438 |
BHP Billiton Ltd. | 578,726 | | 20,459,930 |
TOTAL AUSTRALIA | | 60,582,344 |
Austria - 0.5% |
Andritz AG | 191,400 | | 11,790,454 |
Bailiwick of Jersey - 2.5% |
Experian PLC | 919,600 | | 18,725,980 |
Informa PLC | 1,166,691 | | 10,466,412 |
Regus PLC | 2,269,770 | | 7,464,305 |
WPP PLC | 1,159,933 | | 24,642,835 |
TOTAL BAILIWICK OF JERSEY | | 61,299,532 |
Belgium - 2.1% |
Anheuser-Busch InBev SA NV | 304,612 | | 31,577,218 |
KBC Groupe SA | 343,211 | | 18,709,689 |
TOTAL BELGIUM | | 50,286,907 |
Bermuda - 0.4% |
Signet Jewelers Ltd. | 124,700 | | 9,310,102 |
Brazil - 0.2% |
Qualicorp SA (a) | 546,300 | | 5,116,228 |
Canada - 0.5% |
Constellation Software, Inc. | 60,900 | | 11,094,179 |
Cayman Islands - 0.8% |
Lifestyle International Holdings Ltd. | 2,950,000 | | 6,430,414 |
Lifestyle Property Development Ltd. | 135,675 | | 27,474 |
Shenzhou International Group Holdings Ltd. | 3,620,000 | | 12,466,658 |
TOTAL CAYMAN ISLANDS | | 18,924,546 |
Denmark - 0.9% |
Novo Nordisk A/S Series B | 134,100 | | 22,334,709 |
Finland - 0.4% |
Nokian Tyres PLC | 181,900 | | 9,204,748 |
France - 7.8% |
ALTEN | 176,200 | | 7,983,290 |
AXA SA | 785,900 | | 19,633,825 |
BIC SA | 85,500 | | 10,685,866 |
BNP Paribas SA | 288,971 | | 21,398,790 |
Christian Dior SA | 106,997 | | 20,338,525 |
Dassault Systemes SA | 90,700 | | 11,022,971 |
Groupe FNAC SA (a) | 11,262 | | 314,994 |
Ipsos SA | 290,357 | | 12,246,824 |
Kering SA | 88,200 | | 20,040,757 |
Rexel SA | 443,700 | | 11,114,901 |
Sanofi SA | 387,756 | | 41,343,799 |
Sodexo SA | 136,700 | | 13,268,860 |
TOTAL FRANCE | | 189,393,402 |
|
| Shares | | Value |
Germany - 9.1% |
adidas AG | 197,700 | | $ 22,569,357 |
BASF AG | 274,372 | | 28,546,865 |
Bayer AG | 308,797 | | 38,379,896 |
Brenntag AG | 114,700 | | 19,435,594 |
Continental AG | 70,100 | | 12,844,308 |
Deutsche Boerse AG | 186,092 | | 14,010,353 |
Deutsche Post AG | 706,487 | | 23,908,876 |
Fresenius SE & Co. KGaA | 156,500 | | 20,341,464 |
GEA Group AG | 333,606 | | 14,517,161 |
Gerry Weber International AG (Bearer) | 172,900 | | 7,177,633 |
Linde AG | 69,707 | | 13,245,523 |
Pfeiffer Vacuum Technology AG | 62,789 | | 7,323,979 |
TOTAL GERMANY | | 222,301,009 |
Greece - 0.2% |
Metka SA | 223,183 | | 4,196,920 |
Hong Kong - 0.1% |
City Telecom (HK) Ltd. (CTI) | 7,403,000 | | 2,425,335 |
Ireland - 2.1% |
Accenture PLC Class A | 120,800 | | 8,878,800 |
DCC PLC (United Kingdom) | 353,500 | | 15,864,785 |
Greencore Group PLC | 3,639,500 | | 10,509,869 |
Kerry Group PLC Class A | 254,264 | | 16,282,629 |
TOTAL IRELAND | | 51,536,083 |
Israel - 0.4% |
Check Point Software Technologies Ltd. (a) | 168,800 | | 9,793,776 |
Italy - 1.0% |
Pirelli & C SpA | 880,000 | | 12,402,232 |
World Duty Free SpA (a) | 1,178,242 | | 13,054,026 |
TOTAL ITALY | | 25,456,258 |
Japan - 18.8% |
AEON Financial Service Co. Ltd. (d) | 363,200 | | 11,153,965 |
Air Water, Inc. | 670,000 | | 9,577,164 |
Aozora Bank Ltd. | 4,326,000 | | 12,575,832 |
ARNEST ONE Corp. (d) | 305,500 | | 8,376,162 |
Astellas Pharma, Inc. | 275,200 | | 15,341,404 |
Credit Saison Co. Ltd. | 328,300 | | 8,985,709 |
Daikin Industries Ltd. | 179,500 | | 10,327,244 |
Don Quijote Co. Ltd. | 235,100 | | 15,649,781 |
GMO Internet, Inc. | 1,024,400 | | 11,645,454 |
H.I.S. Co. Ltd. | 165,100 | | 8,904,614 |
Honda Motor Co. Ltd. sponsored ADR | 640,800 | | 25,606,368 |
Horiba Ltd. | 209,200 | | 7,644,262 |
Hoya Corp. | 519,300 | | 12,452,486 |
Japan Tobacco, Inc. | 681,300 | | 24,651,944 |
Kansai Paint Co. Ltd. | 679,000 | | 9,123,644 |
Keyence Corp. | 59,990 | | 25,711,115 |
Leopalace21 Corp. (a) | 1,253,900 | | 8,705,212 |
Makita Corp. | 167,200 | | 8,455,198 |
Common Stocks - continued |
| Shares | | Value |
Japan - continued |
Meitec Corp. | 280,200 | | $ 7,469,201 |
Miraca Holdings, Inc. | 214,300 | | 9,655,936 |
Misumi Group, Inc. | 248,600 | | 7,277,604 |
Nakanishi, Inc. | 35,300 | | 5,019,276 |
Nihon Nohyaku Co. Ltd. | 488,000 | | 5,849,257 |
Nitori Holdings Co. Ltd. | 73,500 | | 6,894,721 |
Obic Co. Ltd. | 349,900 | | 10,987,798 |
Omron Corp. | 422,500 | | 16,123,117 |
ORIX Corp. | 1,555,800 | | 26,948,147 |
Seven Bank Ltd. | 2,981,900 | | 10,553,707 |
Shinsei Bank Ltd. | 6,220,000 | | 14,562,926 |
Ship Healthcare Holdings, Inc. | 259,400 | | 10,644,315 |
SMC Corp. | 61,400 | | 14,295,040 |
SoftBank Corp. | 301,300 | | 22,500,755 |
Software Service, Inc. | 60,100 | | 2,259,661 |
Toyota Motor Corp. | 441,100 | | 28,600,126 |
Tsuruha Holdings, Inc. | 104,000 | | 9,442,039 |
USS Co. Ltd. | 1,055,200 | | 15,452,873 |
TOTAL JAPAN | | 459,424,057 |
Luxembourg - 0.5% |
Eurofins Scientific SA | 48,700 | | 13,353,424 |
Netherlands - 0.5% |
AEGON NV | 1,692,552 | | 13,467,439 |
Norway - 1.4% |
DNB ASA | 1,187,600 | | 21,046,657 |
Telenor ASA | 522,800 | | 12,558,336 |
TOTAL NORWAY | | 33,604,993 |
South Africa - 1.2% |
Coronation Fund Managers Ltd. | 1,597,200 | | 13,030,575 |
EOH Holdings Ltd. | 471,700 | | 3,820,118 |
Nampak Ltd. | 2,343,900 | | 7,751,710 |
Pinnacle Technology Holdings Ltd. | 2,051,500 | | 5,019,035 |
TOTAL SOUTH AFRICA | | 29,621,438 |
Spain - 2.6% |
Amadeus IT Holding SA Class A | 578,700 | | 21,489,714 |
Banco Bilbao Vizcaya Argentaria SA | 2,246,400 | | 26,253,523 |
Criteria CaixaCorp SA (d) | 1,201,300 | | 6,245,348 |
Grifols SA ADR | 336,000 | | 10,133,760 |
TOTAL SPAIN | | 64,122,345 |
Sweden - 3.3% |
ASSA ABLOY AB (B Shares) | 301,600 | | 14,972,835 |
Nordea Bank AB | 1,882,600 | | 24,113,363 |
Svenska Cellulosa AB (SCA) (B Shares) | 485,600 | | 13,788,536 |
Svenska Handelsbanken AB (A Shares) | 305,400 | | 13,837,153 |
Swedbank AB (A Shares) | 493,300 | | 12,865,287 |
TOTAL SWEDEN | | 79,577,174 |
|
| Shares | | Value |
Switzerland - 9.2% |
Aryzta AG | 257,811 | | $ 19,264,436 |
Credit Suisse Group | 577,220 | | 17,956,141 |
Nestle SA | 813,056 | | 58,689,599 |
Roche Holding AG (participation certificate) | 198,309 | | 54,901,880 |
Schindler Holding AG (participation certificate) | 82,005 | | 11,631,723 |
SGS SA (Reg.) | 7,690 | | 18,018,339 |
Syngenta AG (Switzerland) | 54,143 | | 21,853,019 |
UBS AG | 1,149,464 | | 22,231,864 |
TOTAL SWITZERLAND | | 224,547,001 |
United Kingdom - 23.6% |
Aberdeen Asset Management PLC | 1,785,800 | | 12,681,785 |
AMEC PLC | 695,914 | | 13,133,302 |
Babcock International Group PLC | 720,700 | | 14,733,522 |
Barclays PLC | 5,000,712 | | 21,040,325 |
BHP Billiton PLC | 796,578 | | 24,581,201 |
British American Tobacco PLC (United Kingdom) | 583,200 | | 32,176,476 |
BT Group PLC | 3,614,000 | | 21,866,990 |
Bunzl PLC | 554,807 | | 12,249,483 |
Croda International PLC | 286,200 | | 11,178,635 |
Dechra Pharmaceuticals PLC | 438,095 | | 4,846,847 |
Devro PLC | 1,332,113 | | 6,755,883 |
Diageo PLC | 945,333 | | 30,134,833 |
Diploma PLC | 1,205,671 | | 13,396,888 |
Domino Printing Sciences PLC | 956,214 | | 10,602,033 |
Elementis PLC | 2,658,200 | | 11,043,251 |
Hilton Food Group PLC | 1,073,900 | | 7,369,695 |
IMI PLC | 701,300 | | 17,080,615 |
ITV PLC | 4,300,400 | | 13,163,054 |
Jazztel PLC (a) | 647,200 | | 7,100,185 |
Johnson Matthey PLC | 285,400 | | 13,746,615 |
Kingfisher PLC | 2,265,361 | | 13,711,856 |
London Stock Exchange Group PLC | 475,000 | | 12,505,718 |
Meggitt PLC | 2,154,200 | | 19,774,404 |
Next PLC | 260,500 | | 22,742,986 |
Prudential PLC | 1,123,522 | | 22,976,884 |
Reckitt Benckiser Group PLC | 340,600 | | 26,475,803 |
Rolls-Royce Group PLC | 1,039,806 | | 19,173,087 |
Royal Dutch Shell PLC Class A (United Kingdom) | 946,679 | | 31,528,986 |
Royal Mail PLC | 172,500 | | 1,548,884 |
Senior Engineering Group PLC | 1,817,000 | | 8,676,039 |
Serco Group PLC | 1,048,109 | | 9,360,597 |
Spectris PLC | 293,300 | | 10,872,809 |
Spirax-Sarco Engineering PLC | 226,007 | | 10,574,237 |
Standard Chartered PLC (United Kingdom) | 1,036,613 | | 24,923,269 |
The Restaurant Group PLC | 1,082,600 | | 9,998,443 |
Vodafone Group PLC | 8,709,459 | | 31,900,682 |
TOTAL UNITED KINGDOM | | 575,626,302 |
Common Stocks - continued |
| Shares | | Value |
United States of America - 4.6% |
Brinker International, Inc. | 208,003 | | $ 9,239,493 |
Coach, Inc. | 151,000 | | 7,652,680 |
CST Brands, Inc. | 339,300 | | 10,939,032 |
Fidelity National Information Services, Inc. | 226,600 | | 11,046,750 |
FMC Corp. | 189,400 | | 13,780,744 |
Global Payments, Inc. | 201,100 | | 11,961,428 |
JPMorgan Chase & Co. | 86,900 | | 4,478,826 |
McGraw-Hill Companies, Inc. | 185,300 | | 12,911,704 |
Mylan, Inc. (a) | 269,300 | | 10,198,391 |
National Oilwell Varco, Inc. | 127,500 | | 10,350,450 |
Varian Medical Systems, Inc. (a) | 119,176 | | 8,649,794 |
TOTAL UNITED STATES OF AMERICA | | 111,209,292 |
TOTAL COMMON STOCKS (Cost $1,873,403,908) |
2,369,599,997
|
Nonconvertible Preferred Stocks - 2.1% |
| | | |
Germany - 2.1% |
Henkel AG & Co. KGaA | 188,900 | | 20,441,374 |
Sartorius AG (non-vtg.) | 90,100 | | 9,505,296 |
Volkswagen AG | 85,568 | | 21,748,887 |
TOTAL GERMANY | | 51,695,557 |
United Kingdom - 0.0% |
Rolls-Royce Group PLC: | | | |
(C Shares) (a) | 116,204,214 | | 186,322 |
Series C | 89,423,316 | | 143,381 |
TOTAL UNITED KINGDOM | | 329,703 |
TOTAL NONCONVERTIBLE PREFERRED STOCKS (Cost $35,907,853) |
52,025,260
|
Money Market Funds - 0.8% |
| Shares | | Value |
Fidelity Cash Central Fund, 0.09% (b) | 14,911,136 | | $ 14,911,136 |
Fidelity Securities Lending Cash Central Fund, 0.09% (b)(c) | 4,269,172 | | 4,269,172 |
TOTAL MONEY MARKET FUNDS (Cost $19,180,308) |
19,180,308
|
TOTAL INVESTMENT PORTFOLIO - 100.1% (Cost $1,928,492,069) | | 2,440,805,565 |
NET OTHER ASSETS (LIABILITIES) - (0.1)% | | (3,393,733) |
NET ASSETS - 100% | $ 2,437,411,832 |
Legend |
(a) Non-income producing |
(b) Affiliated fund that is generally available only to investment companies and other accounts managed by Fidelity Investments. The rate quoted is the annualized seven-day yield of the fund at period end. A complete unaudited listing of the fund's holdings as of its most recent quarter end is available upon request. In addition, each Fidelity Central Fund's financial statements, which are not covered by the Fund's Report of Independent Registered Public Accounting Firm, are available on the SEC's website or upon request. |
(c) Investment made with cash collateral received from securities on loan. |
(d) Security or a portion of the security is on loan at period end. |
Affiliated Central Funds |
Information regarding fiscal year to date income earned by the Fund from investments in Fidelity Central Funds is as follows: |
Fund | Income earned |
Fidelity Cash Central Fund | $ 20,302 |
Fidelity Securities Lending Cash Central Fund | 949,322 |
Total | $ 969,624 |
Other Information |
Categorizations in the Schedule of Investments are based on country or territory of incorporation. |
The following is a summary of the inputs used, as of October 31, 2013, involving the Fund's assets and liabilities carried at fair value. The inputs or methodology used for valuing securities may not be an indication of the risk associated with investing in those securities. For more information on valuation inputs, and their aggregation into the levels used in the tables below, please refer to the Investment Valuation section at the end of this listing. |
Valuation Inputs at Reporting Date: |
Description | Total | Level 1 | Level 2 | Level 3 |
Investments in Securities: | | | | |
Equities: | | | | |
Consumer Discretionary | $ 427,885,096 | $ 344,006,819 | $ 75,502,115 | $ 8,376,162 |
Consumer Staples | 307,560,334 | 120,888,225 | 186,672,109 | - |
Energy | 55,012,738 | 23,483,752 | 31,528,986 | - |
Financials | 481,335,928 | 263,924,254 | 217,411,674 | - |
Health Care | 290,644,056 | 184,044,956 | 106,599,100 | - |
Industrials | 350,976,576 | 303,152,289 | 47,824,287 | - |
Information Technology | 221,546,023 | 136,981,791 | 84,564,232 | - |
Materials | 190,737,558 | 99,293,343 | 91,444,215 | - |
Telecommunication Services | 95,926,948 | 19,658,521 | 76,268,427 | - |
Money Market Funds | 19,180,308 | 19,180,308 | - | - |
Total Investments in Securities: | $ 2,440,805,565 | $ 1,514,614,258 | $ 917,815,145 | $ 8,376,162 |
The following is a summary of transfers between Level 1 and Level 2 for the period ended October 31, 2013. Transfers are assumed to have occurred at the beginning of the period, and are primarily attributable to the valuation techniques used for foreign equity securities, as discussed in the accompanying Notes to Financial Statements: |
Transfers | Total |
Level 1 to Level 2 | $ 215,402,110 |
Level 2 to Level 1 | $ 1,666,537 |
See accompanying notes which are an integral part of the financial statements.
Annual Report
Fidelity Overseas Fund
Statement of Assets and Liabilities
| October 31, 2013 |
| | |
Assets | | |
Investment in securities, at value (including securities loaned of $4,035,445) - See accompanying schedule: Unaffiliated issuers (cost $1,909,311,761) | $ 2,421,625,257 | |
Fidelity Central Funds (cost $19,180,308) | 19,180,308 | |
Total Investments (cost $1,928,492,069) | | $ 2,440,805,565 |
Receivable for fund shares sold | | 973,288 |
Dividends receivable | | 5,408,768 |
Distributions receivable from Fidelity Central Funds | | 2,742 |
Prepaid expenses | | 7,908 |
Other receivables | | 293,865 |
Total assets | | 2,447,492,136 |
| | |
Liabilities | | |
Payable for investments purchased | $ 2,286,630 | |
Payable for fund shares redeemed | 1,091,066 | |
Accrued management fee | 1,651,391 | |
Other affiliated payables | 423,517 | |
Other payables and accrued expenses | 358,528 | |
Collateral on securities loaned, at value | 4,269,172 | |
Total liabilities | | 10,080,304 |
| | |
Net Assets | | $ 2,437,411,832 |
Net Assets consist of: | | |
Paid in capital | | $ 3,383,324,848 |
Undistributed net investment income | | 30,599,916 |
Accumulated undistributed net realized gain (loss) on investments and foreign currency transactions | | (1,488,880,086) |
Net unrealized appreciation (depreciation) on investments and assets and liabilities in foreign currencies | | 512,367,154 |
Net Assets | | $ 2,437,411,832 |
| | |
Overseas:
Net Asset Value, offering price and redemption price per share ($1,874,922,018 ÷ 47,809,233 shares) | | $ 39.22 |
| | |
Class K:
Net Asset Value, offering price and redemption price per share ($562,489,814 ÷ 14,361,557 shares) | | $ 39.17 |
Statement of Operations
| Year ended October 31, 2013 |
| | |
Investment Income | | |
Dividends | | $ 59,031,347 |
Interest | | 49 |
Income from Fidelity Central Funds | | 969,624 |
Income before foreign taxes withheld | | 60,001,020 |
Less foreign taxes withheld | | (4,314,545) |
Total income | | 55,686,475 |
| | |
Expenses | | |
Management fee
Basic fee | $ 15,027,623 | |
Performance adjustment | 2,318,736 | |
Transfer agent fees | 3,927,907 | |
Accounting and security lending fees | 944,974 | |
Custodian fees and expenses | 205,593 | |
Independent trustees' compensation | 12,307 | |
Appreciation in deferred trustee compensation account | 427 | |
Registration fees | 67,337 | |
Audit | 82,238 | |
Legal | 64,454 | |
Interest | 608 | |
Miscellaneous | 14,059 | |
Total expenses before reductions | 22,666,263 | |
Expense reductions | (583,162) | 22,083,101 |
Net investment income (loss) | | 33,603,374 |
Realized and Unrealized Gain (Loss) Net realized gain (loss) on: | | |
Investment securities: | | |
Unaffiliated issuers | 100,337,526 | |
Foreign currency transactions | (197,100) | |
Total net realized gain (loss) | | 100,140,426 |
Change in net unrealized appreciation (depreciation) on: Investment securities | 397,641,259 | |
Assets and liabilities in foreign currencies | 120,050 | |
Total change in net unrealized appreciation (depreciation) | | 397,761,309 |
Net gain (loss) | | 497,901,735 |
Net increase (decrease) in net assets resulting from operations | | $ 531,505,109 |
See accompanying notes which are an integral part of the financial statements.
Annual Report
Statement of Changes in Net Assets
| Year ended
October 31,
2013 | Year ended
October 31,
2012 |
Increase (Decrease) in Net Assets | | |
Operations | | |
Net investment income (loss) | $ 33,603,374 | $ 50,043,397 |
Net realized gain (loss) | 100,140,426 | (141,989,458) |
Change in net unrealized appreciation (depreciation) | 397,761,309 | 260,173,491 |
Net increase (decrease) in net assets resulting from operations | 531,505,109 | 168,227,430 |
Distributions to shareholders from net investment income | (46,883,539) | (70,077,891) |
Distributions to shareholders from net realized gain | - | (1,661,965) |
Total distributions | (46,883,539) | (71,739,856) |
Share transactions - net increase (decrease) | 47,557,637 | (857,000,541) |
Redemption fees | 23,366 | 66,899 |
Total increase (decrease) in net assets | 532,202,573 | (760,446,068) |
| | |
Net Assets | | |
Beginning of period | 1,905,209,259 | 2,665,655,327 |
End of period (including undistributed net investment income of $30,599,916 and undistributed net investment income of $43,880,081, respectively) | $ 2,437,411,832 | $ 1,905,209,259 |
Financial Highlights - Overseas
Years ended October 31, | 2013 | 2012 | 2011 | 2010 | 2009 |
Selected Per-Share Data | | | | �� | |
Net asset value, beginning of period | $ 31.35 | $ 29.28 | $ 31.56 | $ 30.13 | $ 25.43 |
Income from Investment Operations | | | | | |
Net investment income (loss) B | .54 | .73 | .47 | .42 | .52 |
Net realized and unrealized gain (loss) | 8.10 | 2.19 | (2.27) | 1.49 | 4.55 |
Total from investment operations | 8.64 | 2.92 | (1.80) | 1.91 | 5.07 |
Distributions from net investment income | (.77) | (.83) | (.48) | (.47) | (.37) |
Distributions from net realized gain | - | (.02) | - | (.01) | - |
Total distributions | (.77) | (.85) | (.48) | (.48) | (.37) |
Redemption fees added to paid in capital B, F | - | - | - | - | - |
Net asset value, end of period | $ 39.22 | $ 31.35 | $ 29.28 | $ 31.56 | $ 30.13 |
Total Return A | 28.17% | 10.37% | (5.83)% | 6.33% | 20.44% |
Ratios to Average Net Assets C, E | | | | | |
Expenses before reductions | 1.09% | .69% | .73% | .89% | 1.02% |
Expenses net of fee waivers, if any | 1.09% | .69% | .73% | .89% | 1.02% |
Expenses net of all reductions | 1.06% | .67% | .67% | .85% | .98% |
Net investment income (loss) | 1.54% | 2.52% | 1.44% | 1.41% | 2.01% |
Supplemental Data | | | | | |
Net assets, end of period (000 omitted) | $ 1,874,922 | $ 1,639,725 | $ 2,215,717 | $ 5,548,689 | $ 6,602,017 |
Portfolio turnover rate D | 42% | 90% | 77% | 111% | 115% |
A Total returns would have been lower if certain expenses had not been reduced during the applicable periods shown.
B Calculated based on average shares outstanding during the period.
C Fees and expenses of any underlying Fidelity Central Funds are not included in the Fund's expense ratio. The Fund indirectly bears its proportionate share of the expenses of any underlying Fidelity Central Funds.
D Amount does not include the portfolio activity of any underlying Fidelity Central Funds.
E Expense ratios reflect operating expenses of the class. Expenses before reductions do not reflect amounts reimbursed by the investment adviser or reductions from brokerage service arrangements or reductions from other expense offset arrangements and do not represent the amount paid by the class during periods when reimbursements or reductions occur. Expenses net of fee waivers reflect expenses after reimbursement by the investment adviser but prior to reductions from brokerage service arrangements or other expense offset arrangements. Expenses net of all reductions represent the net expenses paid by the class.
F Amount represents less than $.01 per share.
See accompanying notes which are an integral part of the financial statements.
Annual Report
Financial Highlights - Class K
Years ended October 31, | 2013 | 2012 | 2011 | 2010 | 2009 |
Selected Per-Share Data | | | | | |
Net asset value, beginning of period | $ 31.32 | $ 29.29 | $ 31.59 | $ 30.16 | $ 25.45 |
Income from Investment Operations | | | | | |
Net investment income (loss) B | .60 | .79 | .52 | .47 | .59 |
Net realized and unrealized gain (loss) | 8.08 | 2.18 | (2.27) | 1.50 | 4.54 |
Total from investment operations | 8.68 | 2.97 | (1.75) | 1.97 | 5.13 |
Distributions from net investment income | (.83) | (.92) | (.55) | (.53) | (.42) |
Distributions from net realized gain | - | (.02) | - | (.01) | - |
Total distributions | (.83) | (.94) | (.55) | (.54) | (.42) |
Redemption fees added to paid in capital B, F | - | - | - | - | - |
Net asset value, end of period | $ 39.17 | $ 31.32 | $ 29.29 | $ 31.59 | $ 30.16 |
Total Return A | 28.37% | 10.59% | (5.67)% | 6.55% | 20.73% |
Ratios to Average Net Assets C, E | | | | | |
Expenses before reductions | .93% | .51% | .56% | .69% | .78% |
Expenses net of fee waivers, if any | .92% | .51% | .55% | .69% | .78% |
Expenses net of all reductions | .90% | .48% | .50% | .66% | .74% |
Net investment income (loss) | 1.71% | 2.70% | 1.61% | 1.60% | 2.25% |
Supplemental Data | | | | | |
Net assets, end of period (000 omitted) | $ 562,490 | $ 265,484 | $ 291,323 | $ 368,004 | $ 383,048 |
Portfolio turnover rate D | 42% | 90% | 77% | 111% | 115% |
A Total returns would have been lower if certain expenses had not been reduced during the applicable periods shown.
B Calculated based on average shares outstanding during the period.
C Fees and expenses of any underlying Fidelity Central Funds are not included in the Fund's expense ratio. The Fund indirectly bears its proportionate share of the expenses of any underlying Fidelity Central Funds.
D Amount does not include the portfolio activity of any underlying Fidelity Central Funds.
E Expense ratios reflect operating expenses of the class. Expenses before reductions do not reflect amounts reimbursed by the investment adviser or reductions from brokerage service arrangements or reductions from other expense offset arrangements and do not represent the amount paid by the class during periods when reimbursements or reductions occur. Expenses net of fee waivers reflect expenses after reimbursement by the investment adviser but prior to reductions from brokerage service arrangements or other expense offset arrangements. Expenses net of all reductions represent the net expenses paid by the class.
F Amount represents less than $.01 per share.
See accompanying notes which are an integral part of the financial statements.
Annual Report
Fidelity Overseas Fund
Notes to Financial Statements
For the period ended October 31, 2013
1. Organization.
Fidelity Overseas Fund (the Fund) is a fund of Fidelity Investment Trust (the Trust) and is authorized to issue an unlimited number of shares. The Trust is registered under the Investment Company Act of 1940, as amended (the 1940 Act), as an open-end management investment company organized as a Massachusetts business trust. The Fund offers Overseas and Class K shares, each of which has equal rights as to assets and voting privileges. The Fund offered Class F shares during the period June 26, 2009 through December 16, 2011, and all outstanding shares were redeemed by December 16, 2011. Each class has exclusive voting rights with respect to matters that affect that class.
2. Investments in Fidelity Central Funds.
The Fund invests in Fidelity Central Funds, which are open-end investment companies generally available only to other investment companies and accounts managed by Fidelity Management & Research Company (FMR)and its affiliates. The Fund's Schedule of Investments lists each of the Fidelity Central Funds held as of period end, if any, as an investment of the Fund, but does not include the underlying holdings of each Fidelity Central Fund. As an Investing Fund, the Fund indirectly bears its proportionate share of the expenses of the underlying Fidelity Central Funds.
The Money Market Central Funds seek preservation of capital and current income and are managed by Fidelity Investments Money Management, Inc. (FIMM), an affiliate of FMR.
A complete unaudited list of holdings for each Fidelity Central Fund is available upon request or at the Securities and Exchange Commission (the SEC) website at www.sec.gov. In addition, the financial statements of the Fidelity Central Funds, which are not covered by the Fund's Report of Independent Registered Public Accounting Firm, are available on the SEC website or upon request.
3. Significant Accounting Policies.
The financial statements have been prepared in conformity with accounting principles generally accepted in the United States of America (GAAP), which require management to make certain estimates and assumptions at the date of the financial statements. Actual results could differ from those estimates. Subsequent events, if any, through the date that the financial statements were issued have been evaluated in the preparation of the financial statements. The following summarizes the significant accounting policies of the Fund:
Investment Valuation. Investments are valued as of 4:00 p.m. Eastern time on the last calendar day of the period. In accordance with valuation policies and procedures approved by the Board of Trustees (the Board), the Fund attempts to obtain prices from one or more third party pricing vendors or brokers to value its investments. When current market prices, quotations or currency exchange rates are not readily available or reliable, investments will be fair valued in good faith by the FMR Fair Value Committee (the Committee), in accordance with procedures adopted by the Board. Factors used in determining fair value vary by investment type and may include market or investment specific events. The frequency with which these procedures are used cannot be predicted and they may be utilized to a significant extent. The Committee oversees the Fund's valuation policies and procedures and is responsible for approving and reporting to the Board all fair value determinations.
The Fund categorizes the inputs to valuation techniques used to value its investments into a disclosure hierarchy consisting of three levels as shown below:
Level 1 - quoted prices in active markets for identical investments
Level 2 - other significant observable inputs (including quoted prices for similar investments, interest rates, prepayment speeds, etc.)
Level 3 - unobservable inputs (including the Fund's own assumptions based on the best information available)
Valuation techniques used to value the Fund's investments by major category are as follows:
Equity securities, including restricted securities, for which market quotations are readily available, are valued at the last reported sale price or official closing price as reported by a third party pricing vendor on the primary market or exchange on which they are traded and are categorized as Level 1 in the hierarchy. In the event there were no sales during the day or closing prices are not available, securities are valued at the last quoted bid price or may be valued using the last available price and are generally categorized as Level 2 in the hierarchy. For foreign equity securities, when market or security specific events arise, comparisons to the valuation of American Depositary Receipts (ADRs), futures contracts, Exchange-Traded Funds (ETFs) and certain indexes as well as quoted prices for similar securities may be used and would be categorized as Level 2 in the hierarchy. Utilizing these techniques may result in transfers between Level 1 and Level 2. For equity securities, including restricted securities, where observable inputs are limited, assumptions about market activity and risk are used and these securities may be categorized as Level 3 in the hierarchy.
Investments in open-end mutual funds, including the Fidelity Central Funds, are valued at their closing net asset value (NAV) each business day and are categorized as Level 1 in the hierarchy.
Annual Report
3. Significant Accounting Policies - continued
Investment Valuation - continued
Changes in valuation techniques may result in transfers in or out of an assigned level within the disclosure hierarchy. The aggregate value of investments by input level, as of October 31, 2013, including information on transfers between Levels 1 and 2 is included at the end of the Fund's Schedule of Investments.
Foreign Currency. The Fund may use foreign currency contracts to facilitate transactions in foreign-denominated securities. Gains and losses from these transactions may arise from changes in the value of the foreign currency or if the counterparties do not perform under the contracts' terms.
Foreign-denominated assets, including investment securities, and liabilities are translated into U.S. dollars at the exchange rates at period end. Purchases and sales of investment securities, income and dividends received and expenses denominated in foreign currencies are translated into U.S. dollars at the exchange rate in effect on the transaction date.
The effects of exchange rate fluctuations on investments are included with the net realized and unrealized gain (loss) on investment securities. Other foreign currency transactions resulting in realized and unrealized gain (loss) are disclosed separately.
Investment Transactions and Income. For financial reporting purposes, the Fund's investment holdings and NAV include trades executed through the end of the last business day of the period. The NAV per share for processing shareholder transactions is calculated as of the close of business of the New York Stock Exchange (NYSE), normally 4:00 p.m. Eastern time and includes trades executed through the end of the prior business day. Gains and losses on securities sold are determined on the basis of identified cost and may include proceeds received from litigation. Dividend income is recorded on the ex-dividend date, except for certain dividends from foreign securities where the ex-dividend date may have passed, which are recorded as soon as the Fund is informed of the ex-dividend date. Non-cash dividends included in dividend income, if any, are recorded at the fair market value of the securities received. Distributions received on securities that represent a return of capital or capital gain are recorded as a reduction of cost of investments and/or as a realized gain. Subsequent to ex-dividend date the Fund determines the components of these distributions, based upon receipt of tax filings or other correspondence relating to the underlying investment. Interest income and distributions from the Fidelity Central Funds are accrued as earned. Interest income includes coupon interest and amortization of premium and accretion of discount on debt securities. Investment income is recorded net of foreign taxes withheld where recovery of such taxes is uncertain.
Class Allocations and Expenses. Investment income, realized and unrealized capital gains and losses, common expenses of the Fund, and certain fund-level expense reductions, if any, are allocated daily on a pro-rata basis to each class based on the relative net assets of each class to the total net assets of the Fund. Each class differs with respect to transfer agent fees incurred. Certain expense reductions may also differ by class. For the reporting period, the allocated portion of income and expenses to each class as a percent of its average net assets may vary due to the timing of recording these transactions in relation to fluctuating net assets of the classes. Expenses directly attributable to a fund are charged to that fund. Expenses attributable to more than one fund are allocated among the respective funds on the basis of relative net assets or other appropriate methods. Expense estimates are accrued in the period to which they relate and adjustments are made when actual amounts are known.
Deferred Trustee Compensation. Under a Deferred Compensation Plan (the Plan), independent Trustees may elect to defer receipt of a portion of their annual compensation. Deferred amounts are invested in a cross-section of Fidelity funds, are marked-to-market and remain in the Fund until distributed in accordance with the Plan. The investment of deferred amounts and the offsetting payable to the Trustees are included in the accompanying Statement of Assets and Liabilities.
Income Tax Information and Distributions to Shareholders. Each year, the Fund intends to qualify as a regulated investment company under Subchapter M of the Internal Revenue Code, including distributing substantially all of its taxable income and realized gains. As a result, no provision for U.S. Federal income taxes is required. As of October 31, 2013, the Fund did not have any unrecognized tax benefits in the financial statements; nor is the Fund aware of any tax positions for which it is reasonably possible that the total amounts of unrecognized tax benefits will significantly change in the next twelve months. The Fund files a U.S. federal tax return, in addition to state and local tax returns as required. The Fund's federal income tax returns are subject to examination by the Internal Revenue Service (IRS) for a period of three fiscal years after they are filed. State and local tax returns may be subject to examination for an additional fiscal year depending on the jurisdiction. Foreign taxes are provided for based on the Fund's understanding of the tax rules and rates that exist in the foreign markets in which it invests.
Distributions are declared and recorded on the ex-dividend date. Income dividends and capital gain distributions are declared separately for each class. Income and capital gain distributions are determined in accordance with income tax regulations, which may differ from GAAP.
Capital accounts within the financial statements are adjusted for permanent book-tax differences. These adjustments have no impact on net assets or the results of operations. Temporary book-tax differences will reverse in a subsequent period.
Book-tax differences are primarily due to foreign currency transactions, passive foreign investment companies (PFIC), deferred trustees compensation, capital loss carryforwards and losses deferred due to wash sales.
Annual Report
Fidelity Overseas Fund
Notes to Financial Statements - continued
3. Significant Accounting Policies - continued
Income Tax Information and Distributions to Shareholders - continued
The federal tax cost of investment securities and unrealized appreciation (depreciation) as of period end were as follows:
Gross unrealized appreciation | $ 525,982,074 |
Gross unrealized depreciation | (35,353,921) |
Net unrealized appreciation (depreciation) on securities and other investments | $ 490,628,153 |
| |
Tax Cost | $ 1,950,177,412 |
The tax-based components of distributable earnings as of period end were as follows:
Undistributed ordinary income | $ 41,518,916 |
Capital loss carryforward | $ (1,477,884,149) |
Net unrealized appreciation (depreciation) | $ 490,681,811 |
Capital loss carryforwards are only available to offset future capital gains of the Fund to the extent provided by regulations and may be limited. Under the Regulated Investment Company Modernization Act of 2010 (the Act), the Fund is permitted to carry forward capital losses incurred in taxable years beginning after December 22, 2010 for an unlimited period and such capital losses are required to be used prior to any losses that expire. The capital loss carryforward information presented below, including any applicable limitation, is estimated as of fiscal period end and is subject to adjustment.
Fiscal year of expiration | |
2016 | $ (464,379,963) |
2017 | (939,719,765) |
Total with expiration | (1,404,099,728) |
No expiration | |
Short-term | (23,395,688) |
Long-term | (50,388,733) |
Total no expiration | (73,784,421) |
Total capital loss carryforward | $ (1,477,884,149) |
The tax character of distributions paid was as follows:
| October 31, 2013 | October 31, 2012 |
Ordinary Income | $ 46,883,539 | $ 71,739,856 |
Short-Term Trading (Redemption) Fees. Shares held by investors in the Fund less than 30 days may have been subject to a redemption fee equal to 1.00% of the net asset value of shares redeemed. All redemption fees, which reduce the proceeds of the shareholder redemption, are retained by the Fund and accounted for as an addition to paid in capital.
4. Purchases and Sales of Investments.
Purchases and sales of securities, other than short-term securities, aggregated $950,815,017 and $889,516,361, respectively.
5. Fees and Other Transactions with Affiliates.
Management Fee. FMR and its affiliates provide the Fund with investment management related services for which the Fund pays a monthly management fee. The management fee is the sum of an individual fund fee rate that is based on an annual rate of .45% of the Fund's average net assets and an annualized group fee rate that averaged .25% during the period. The group fee rate is based upon the average net assets of all the mutual funds advised by FMR, including any mutual funds previously advised by FMR that are currently advised by Fidelity SelectCo, LLC, an affiliate of FMR. The group fee rate decreases as assets under management increase and increases as assets under management decrease. In addition, the management fee is subject to a performance adjustment (up to a maximum of ± .20% of the Fund's average net assets over a 36 month performance period). The upward or downward adjustment to the management fee is based on the relative investment performance of Overseas as compared to an appropriate benchmark index over the same 36 month performance period. For the reporting period, the total annual management fee rate, including the performance adjustment, was .81% of the Fund's average net assets. The performance adjustment included in the management fee rate may be higher or lower than the maximum performance adjustment rate due to the difference between the average net assets for the reporting and performance periods.
Annual Report
5. Fees and Other Transactions with Affiliates - continued
Transfer Agent Fees. Fidelity Investments Institutional Operations Company, Inc., (FIIOC), an affiliate of FMR, is the transfer, dividend disbursing and shareholder servicing agent for each class of the Fund. FIIOC receives account fees and asset-based fees that vary according to the account size and type of account of the shareholders of Overseas. FIIOC receives an asset-based fee of Class K's average net assets. FIIOC pays for typesetting, printing and mailing of shareholder reports, except proxy statements.
For the period, transfer agent fees for each class were as follows:
| Amount | % of
Average
Net Assets |
Overseas | $ 3,737,229 | .21 |
Class K | 190,678 | .05 |
| $ 3,927,907 | |
Accounting and Security Lending Fees. Fidelity Service Company, Inc. (FSC), an affiliate of FMR, maintains the Fund's accounting records. The accounting fee is based on the level of average net assets for each month. Under a separate contract, FSC administers the security lending program. The security lending fee is based on the number and duration of lending transactions.
Brokerage Commissions. The Fund placed a portion of its portfolio transactions with brokerage firms which are affiliates of the investment adviser. Brokerage commissions are included in net realized gain (loss) and change in net unrealized appreciation (depreciation) in the Statement of Operations. The commissions paid to these affiliated firms were $1,212 for the period.
Interfund Lending Program. Pursuant to an Exemptive Order issued by the SEC, the Fund, along with other registered investment companies having management contracts with FMR, may participate in an interfund lending program. This program provides an alternative credit facility allowing the funds to borrow from, or lend money to, other participating affiliated funds. At period end, there were no interfund loans outstanding. The Fund's activity in this program during the period for which loans were outstanding was as follows:
Borrower or Lender | Average Loan
Balance | Weighted Average Interest Rate | Interest
Expense |
Borrower | $ 11,892,000 | .31% | $ 608 |
6. Committed Line of Credit.
The Fund participates with other funds managed by FMR or an affiliate in a $4.25 billion credit facility (the "line of credit") to be utilized for temporary or emergency purposes to fund shareholder redemptions or for other short-term liquidity purposes. The Fund has agreed to pay commitment fees on its pro-rata portion of the line of credit, which amounted to $4,522 and is reflected in Miscellaneous expenses on the Statement of Operations. During the period, there were no borrowings on this line of credit.
7. Security Lending.
The Fund lends portfolio securities through a lending agent from time to time in order to earn additional income. For equity securities, a lending agent is used and may loan securities to certain qualified borrowers, including Fidelity Capital Markets (FCM), a broker-dealer affiliated with the Fund. On the settlement date of the loan, the Fund receives collateral (in the form of U.S. Treasury obligations, letters of credit and/or cash) against the loaned securities and maintains collateral in an amount not less than 100% of the market value of the loaned securities during the period of the loan. The market value of the loaned securities is determined at the close of business of the Fund and any additional required collateral is delivered to the Fund on the next business day. If the borrower defaults on its obligation to return the securities loaned because of insolvency or other reasons, the Fund may apply collateral received from the borrower against the obligation. The Fund may experience delays and costs in recovering the securities loaned. Any cash collateral received is invested in the Fidelity Securities Lending Cash Central Fund. The value of loaned securities and cash collateral at period end are disclosed on the Fund's Statement of Assets and Liabilities. Security lending income represents the income earned on investing cash collateral, less rebates paid to borrowers and any lending agent fees associated with the loan, plus any premium payments received for lending certain types of securities. Security lending income is presented in the Statement of Operations as a component of income from Fidelity Central Funds. Total security lending income during the period amounted to $949,322. During the period, there were no securities loaned to FCM.
8. Expense Reductions.
Commissions paid to certain brokers with whom FMR, or its affiliates, places trades on behalf of the Fund include an amount in addition to trade execution, which may be rebated back to the Fund to offset certain expenses. This amount totaled $559,838 for the period.
In addition, FMR reimbursed a portion of the Fund's operating expenses during the period in the amount of $23,324.
Annual Report
Fidelity Overseas Fund
Notes to Financial Statements - continued
9. Distributions to Shareholders.
Distributions to shareholders of each class were as follows:
Years ended October 31, | 2013 | 2012A |
From net investment income | | |
Overseas | $ 39,514,173 | $ 56,962,859 |
Class K | 7,369,366 | 9,516,308 |
Class F | - | 3,598,724 |
Total | $ 46,883,539 | $ 70,077,891 |
From net realized gain | | |
Overseas | $ - | $ 1,377,579 |
Class K | - | 207,326 |
Class F | - | 77,060 |
Total | $ - | $ 1,661,965 |
A All Class F shares were redeemed on December 16, 2011.
10. Share Transactions.
Transactions for each class of shares were as follows:
| Shares | Dollars |
Years ended October 31, | 2013 | 2012A | 2013 | 2012A |
Overseas | | | | |
Shares sold | 4,856,702 | 5,513,981 | $ 167,166,517 | $ 159,997,895 |
Reinvestment of distributions | 1,224,483 | 2,082,243 | 38,681,419 | 57,282,489 |
Shares redeemed | (10,572,300) | (30,970,724) | (364,332,964) | (876,498,461) |
Net increase (decrease) | (4,491,115) | (23,374,500) | $ (158,485,028) | $ (659,218,077) |
Class K | | | | |
Shares sold | 8,204,154 | 5,090,211 | $ 286,897,852 | $ 145,041,228 |
Reinvestment of distributions | 233,874 | 354,489 | 7,369,366 | 9,723,634 |
Shares redeemed | (2,553,449) | (6,913,669) | (88,224,553) | (205,273,028) |
Net increase (decrease) | 5,884,579 | (1,468,969) | $ 206,042,665 | $ (50,508,166) |
Class F | | | | |
Shares sold | - | 373,582 | $ - | $ 10,277,470 |
Reinvestment of distributions | - | 134,104 | - | 3,675,784 |
Shares redeemed | - | (5,923,991) | - | (161,227,552) |
Net increase (decrease) | - | (5,416,305) | $ - | $ (147,274,298) |
A All Class F shares were redeemed on December 16, 2011.
11. Other.
The Fund's organizational documents provide former and current trustees and officers with a limited indemnification against liabilities arising in connection with the performance of their duties to the Fund. In the normal course of business, the Fund may also enter into contracts that provide general indemnifications. The Fund's maximum exposure under these arrangements is unknown as this would be dependent on future claims that may be made against the Fund. The risk of material loss from such claims is considered remote.
Annual Report
Report of Independent Registered Public Accounting Firm
To the Trustees of Fidelity Investment Trust and the Shareholders of Fidelity Overseas Fund:
In our opinion, the accompanying statement of assets and liabilities, including the schedule of investments, and the related statements of operations and of changes in net assets and the financial highlights present fairly, in all material respects, the financial position of Fidelity Overseas Fund (a fund of Fidelity Investment Trust) at October 31, 2013, the results of its operations for the year then ended, the changes in its net assets for each of the two years in the period then ended and the financial highlights for each of the five years in the period then ended, in conformity with accounting principles generally accepted in the United States of America. These financial statements and financial highlights (hereafter referred to as "financial statements") are the responsibility of the Fidelity Overseas Fund's management. Our responsibility is to express an opinion on these financial statements based on our audits. We conducted our audits of these financial statements in accordance with the standards of the Public Company Accounting Oversight Board (United States). Those standards require that we plan and perform the audit to obtain reasonable assurance about whether the financial statements are free of material misstatement. An audit includes examining, on a test basis, evidence supporting the amounts and disclosures in the financial statements, assessing the accounting principles used and significant estimates made by management, and evaluating the overall financial statement presentation. We believe that our audits, which included confirmation of securities at October 31, 2013 by correspondence with the custodian and brokers, provide a reasonable basis for our opinion.
PricewaterhouseCoopers LLP
Boston, Massachusetts
December 13, 2013
Annual Report
Fidelity Worldwide Fund
As a shareholder of the Fund, you incur two types of costs: (1) transaction costs, including sales charges (loads) on purchase payments or redemption proceeds, redemption fees and (2) ongoing costs, including management fees, distribution and/or service (12b-1) fees and other Fund expenses. This Example is intended to help you understand your ongoing costs (in dollars) of investing in the Fund and to compare these costs with the ongoing costs of investing in other mutual funds.
The Example is based on an investment of $1,000 invested at the beginning of the period and held for the entire period (May 1, 2013 to October 31, 2013).
Actual Expenses
The first line of the accompanying table for each class of the Fund provides information about actual account values and actual expenses. You may use the information in this line, together with the amount you invested, to estimate the expenses that you paid over the period. Simply divide your account value by $1,000.00 (for example, an $8,600 account value divided by $1,000.00 = 8.6), then multiply the result by the number in the first line for a class of the Fund under the heading entitled "Expenses Paid During Period" to estimate the expenses you paid on your account during this period. A small balance maintenance fee of $12.00 that is charged once a year may apply for certain accounts with a value of less than $2,000. This fee is not included in the table below. If it was, the estimate of expenses you paid during the period would be higher, and your ending account value lower, by this amount. In addition, the Fund, as a shareholder in the underlying Fidelity Central Funds, will indirectly bear its pro-rata share of the fees and expenses incurred by the underlying Fidelity Central Funds. These fees and expenses are not included in the Fund's annualized expense ratio used to calculate the expense estimate in the table below.
Hypothetical Example for Comparison Purposes
The second line of the accompanying table for each class of the Fund provides information about hypothetical account values and hypothetical expenses based on a Class' actual expense ratio and an assumed rate of return of 5% per year before expenses, which is not the Class' actual return. The hypothetical account values and expenses may not be used to estimate the actual ending account balance or expenses you paid for the period. You may use this information to compare the ongoing costs of investing in the Fund and other funds. To do so, compare this 5% hypothetical example with the 5% hypothetical examples that appear in the shareholder reports of the other funds. A small balance maintenance fee of $12.00 that is charged once a year may apply for certain accounts with a value of less than $2,000. This fee is not included in the table below. If it was, the estimate of expenses you paid during the period would be higher, and your ending account value lower, by this amount. In addition, the Fund, as a shareholder in the underlying Fidelity Central Funds, will indirectly bear its pro-rata share of the fees and expenses incurred by the underlying Fidelity Central Funds. These fees and expenses are not included in the Fund's annualized expense ratio used to calculate the expense estimate in the table below.
Please note that the expenses shown in the table are meant to highlight your ongoing costs only and do not reflect any transaction costs. Therefore, the second line of the table is useful in comparing ongoing costs only, and will not help you determine the relative total costs of owning different funds. In addition, if these transactional costs were included, your costs would have been higher.
| Annualized
Expense Ratio B | Beginning
Account Value
May 1, 2013 | Ending
Account Value
October 31, 2013 | Expenses Paid
During Period*
May 1, 2013
to October 31, 2013 |
Class A | 1.44% | | | |
Actual | | $ 1,000.00 | $ 1,123.10 | $ 7.71 |
Hypothetical A | | $ 1,000.00 | $ 1,017.95 | $ 7.32 |
Class T | 1.71% | | | |
Actual | | $ 1,000.00 | $ 1,121.80 | $ 9.15 |
Hypothetical A | | $ 1,000.00 | $ 1,016.59 | $ 8.69 |
Class B | 2.20% | | | |
Actual | | $ 1,000.00 | $ 1,119.00 | $ 11.75 |
Hypothetical A | | $ 1,000.00 | $ 1,014.12 | $ 11.17 |
Class C | 2.18% | | | |
Actual | | $ 1,000.00 | $ 1,119.20 | $ 11.64 |
Hypothetical A | | $ 1,000.00 | $ 1,014.22 | $ 11.07 |
Worldwide | 1.10% | | | |
Actual | | $ 1,000.00 | $ 1,125.30 | $ 5.89 |
Hypothetical A | | $ 1,000.00 | $ 1,019.66 | $ 5.60 |
Institutional Class | 1.16% | | | |
Actual | | $ 1,000.00 | $ 1,124.90 | $ 6.21 |
Hypothetical A | | $ 1,000.00 | $ 1,019.36 | $ 5.90 |
A 5% return per year before expenses
B Annualized expense ratio reflects expenses net of applicable fee waivers.
* Expenses are equal to each Class' annualized expense ratio, multiplied by the average account value over the period, multiplied by 184/365 (to reflect the one-half year period).
Annual Report
Fidelity Worldwide Fund
Average annual total return reflects the change in the value of an investment, assuming reinvestment of the class' distributions from dividend income and capital gains (the profits earned upon the sale of securities that have grown in value, if any) and assuming a constant rate of performance each year. The $10,000 table and the fund's returns do not reflect the deduction of taxes that a shareholder would pay on fund distributions or the redemption of fund shares. During periods of reimbursement by Fidelity, a fund's total return will be greater than it would be had the reimbursement not occurred. How a fund did yesterday is no guarantee of how it will do tomorrow.
Average Annual Total Returns
Periods ended October 31, 2013 | Past 1
year | Past 5
years | Past 10
years |
Fidelity Worldwide Fund | 29.54% | 14.67% | 9.01% |
$10,000 Over 10 Years
Let's say hypothetically that $10,000 was invested in Fidelity Worldwide Fund, a class of the fund, on October 31, 2003. The chart shows how the value of your investment would have changed, and also shows how the MSCI World Index performed over the same period.
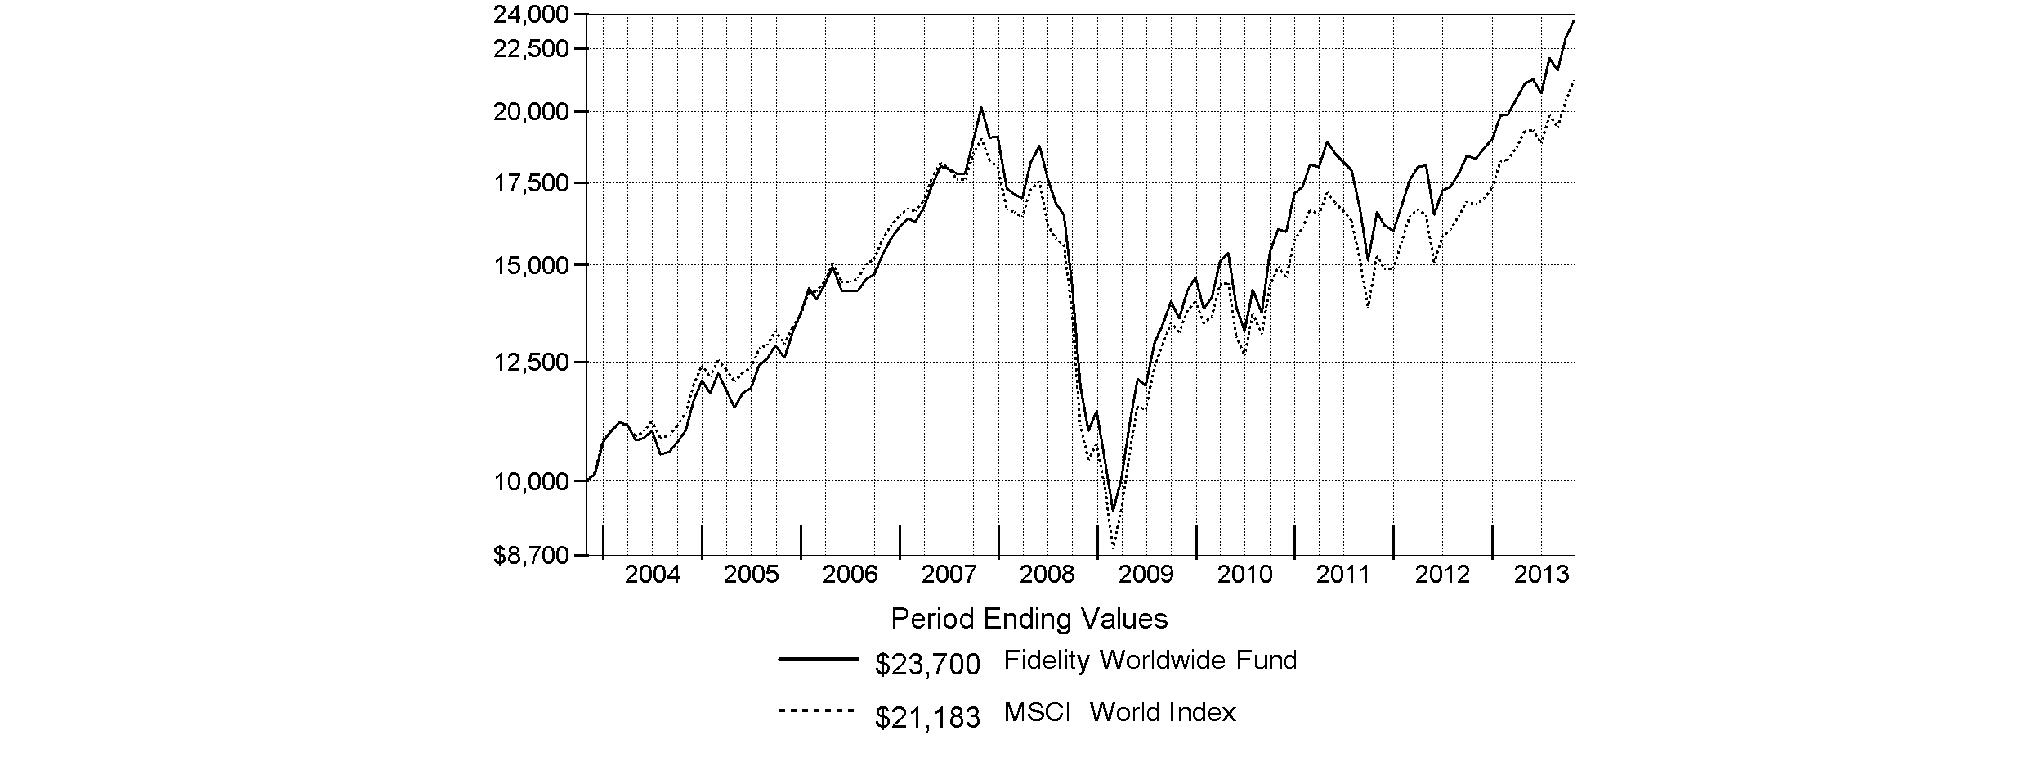
Annual Report
Fidelity Worldwide Fund
Market Recap: On balance, global equity markets remained upbeat for the 12-month period ending October 31, 2013. The MSCI® ACWI® (All Country World Index) Index gained 23.75% for the period, amid investor preference for higher-risk assets. The period was not without turbulence, however. In the spring and summer, central banks worldwide, especially in the U.S. and China, made clear their intentions to maintain accommodative monetary policies. That stance, combined with modest cyclical improvements around the globe and generally low valuations, underpinned the broad rally in equities. Europe (+32%) shone brightly, with most markets in the region - large and small - registering solid, index-beating gains. Another bright spot was Japan, which, despite a struggling yen and taking a second-half breather, posted a 34% result for the full year. The U.S. - by far the index's biggest constituent - also outperformed the global market with a roughly 28% advance. Meanwhile, Asia-Pacific ex Japan (+14%) lagged, hurt in part by a slowdown in Australia's mining industry as well as currency headwinds. Foreign-exchange and commodity weakness also curbed results in resource-heavy Canada and emerging markets (EM), both of which were up 7%. Country-level EM performance diverged meaningfully for the period, as evidenced by performance in Brazil (-1%), Russia (+12%), India (+1%) and China (+8%).
Comments from William Kennedy, Lead Portfolio Manager of Fidelity® Worldwide Fund and manager of its non-U.S. equity subportfolio, and Co-Portfolio Manager Stephen DuFour, who manages the fund's U.S. equity subportfolio: For the year, the fund's Retail Class shares returned 29.54%, versus 26.29% for the MSCI® World Index. Security selection that focused on companies with above-average earnings growth, good balance sheets and reasonable share prices drove the fund's performance relative to the index. Regionally, investment choices in the U.S. helped the most while among sectors, energy and information technology stood out. Winners included U.S. natural gas exploration & production company Pioneer Natural Resources, whose huge share-price gain was fueled by the company's expanded oil production and rising oil prices. The fund's number one contributor was U.S. biotechnology company Gilead Sciences, whose stock soared as the company neared approval for its promising new hepatitis C treatment. In the information technology sector, an investment in electronic-payment processor MasterCard took off, thanks to higher transaction volumes that were the result of increasing numbers of consumers worldwide shopping online and choosing to pay with debit and credit instead of cash or checks. By contrast, investments in the consumer discretionary sector detracted, as did a small stake in emerging markets, positioning in core European countries and a modest cash position. Individual disappointments included cellular-tower operator American Tower, which saw slowing growth prospects in the U.S. pressure its return. We sold the position before period end. Untimely ownership of biotechnology leader Amgen also hurt. We exited soon after the company announced an acquisition that we thought could take some time to pay off, but the stock continued to rise.
The views expressed above reflect those of the portfolio manager(s) only through the end of the period as stated on the cover of this report and do not necessarily represent the views of Fidelity or any other person in the Fidelity organization. Any such views are subject to change at any time based upon market or other conditions and Fidelity disclaims any responsibility to update such views. These views may not be relied on as investment advice and, because investment decisions for a Fidelity fund are based on numerous factors, may not be relied on as an indication of trading intent on behalf of any Fidelity fund.
Annual Report
Fidelity Worldwide Fund
Investment Changes (Unaudited)
Geographic Diversification (% of fund's net assets) |
As of October 31, 2013 |
| United States of America* | 52.6% | |
| Japan | 8.4% | |
| United Kingdom | 7.2% | |
| France | 4.9% | |
| Germany | 4.0% | |
| Ireland | 3.3% | |
| Switzerland | 3.1% | |
| Sweden | 1.9% | |
| Spain | 1.7% | |
| Other | 12.9% | |

* Includes Short-Term Investments and Net Other Assets (Liabilities). |
Percentages are based on country or territory of incorporation and are adjusted for the effect of futures contracts, if applicable. |
As of April 30, 2013 |
| United States of America* | 50.3% | |
| Japan | 10.1% | |
| United Kingdom | 7.6% | |
| France | 4.4% | |
| Germany | 3.7% | |
| Switzerland | 3.0% | |
| Ireland | 2.9% | |
| Canada | 2.1% | |
| Australia | 1.8% | |
| Other | 14.1% | |

* Includes Short-Term Investments and Net Other Assets (Liabilities). |
Percentages are based on country or territory of incorporation and are adjusted for the effect of futures contracts, if applicable. |
Asset Allocation as of October 31, 2013 |
| % of fund's
net assets | % of fund's net assets
6 months ago |
Stocks and Equity Futures | 97.2 | 97.3 |
Bonds | 0.1 | 0.1 |
Short-Term Investments and Net Other Assets (Liabilities) | 2.7 | 2.6 |
Top Ten Stocks as of October 31, 2013 |
| % of fund's
net assets | % of fund's net assets
6 months ago |
MasterCard, Inc. Class A (United States of America, IT Services) | 2.8 | 2.6 |
Cabot Oil & Gas Corp. (United States of America, Oil, Gas & Consumable Fuels) | 2.3 | 2.2 |
McGraw-Hill Companies, Inc. (United States of America, Diversified Financial Services) | 2.2 | 0.0 |
Bank of America Corp. (United States of America, Diversified Financial Services) | 2.2 | 1.4 |
Google, Inc. Class A (United States of America, Internet Software & Services) | 2.0 | 2.5 |
Pioneer Natural Resources Co. (United States of America, Oil, Gas & Consumable Fuels) | 2.0 | 1.0 |
Visa, Inc. Class A (United States of America, IT Services) | 1.9 | 0.7 |
Cummins, Inc. (United States of America, Machinery) | 1.9 | 0.1 |
Gilead Sciences, Inc. (United States of America, Biotechnology) | 1.8 | 1.3 |
Actavis PLC (Ireland, Pharmaceuticals) | 1.6 | 0.2 |
| 20.7 | |
Market Sectors as of October 31, 2013 |
| % of fund's
net assets | % of fund's net assets
6 months ago |
Financials | 19.6 | 20.0 |
Information Technology | 15.6 | 12.5 |
Health Care | 14.1 | 13.1 |
Consumer Discretionary | 12.6 | 15.0 |
Industrials | 12.2 | 10.5 |
Energy | 8.9 | 5.7 |
Consumer Staples | 6.3 | 10.2 |
Materials | 5.4 | 6.1 |
Telecommunication Services | 2.0 | 2.1 |
Utilities | 0.2 | 1.1 |
Annual Report
Fidelity Worldwide Fund
Investments October 31, 2013
Showing Percentage of Net Assets
Common Stocks - 96.1% |
| Shares | | Value |
Australia - 1.5% |
Ansell Ltd. | 142,537 | | $ 2,625,670 |
Australia & New Zealand Banking Group Ltd. | 392,333 | | 12,548,330 |
Ramsay Health Care Ltd. | 105,887 | | 3,883,069 |
Woodside Petroleum Ltd. | 89,610 | | 3,287,856 |
TOTAL AUSTRALIA | | 22,344,925 |
Austria - 0.1% |
Andritz AG | 28,200 | | 1,737,152 |
Bailiwick of Jersey - 1.2% |
Experian PLC | 368,600 | | 7,505,868 |
Wolseley PLC | 90,926 | | 4,900,027 |
WPP PLC | 245,700 | | 5,219,909 |
TOTAL BAILIWICK OF JERSEY | | 17,625,804 |
Belgium - 1.0% |
Anheuser-Busch InBev SA NV | 71,611 | | 7,423,464 |
KBC Groupe SA | 141,183 | | 7,696,402 |
TOTAL BELGIUM | | 15,119,866 |
Bermuda - 0.1% |
Cheung Kong Infrastructure Holdings Ltd. | 310,000 | | 2,157,165 |
Brazil - 0.1% |
Arezzo Industria e Comercio SA | 63,900 | | 955,562 |
British Virgin Islands - 0.3% |
Luxoft Holding, Inc. | 57,700 | | 1,685,994 |
Mail.Ru Group Ltd. GDR (Reg. S) | 73,000 | | 2,692,240 |
Michael Kors Holdings Ltd. (a) | 11,000 | | 846,450 |
TOTAL BRITISH VIRGIN ISLANDS | | 5,224,684 |
Canada - 0.5% |
Canadian Pacific Railway Ltd. | 3,000 | | 428,830 |
Constellation Software, Inc. | 9,700 | | 1,767,053 |
InterOil Corp. (a)(d) | 10,500 | | 729,225 |
Suncor Energy, Inc. | 123,400 | | 4,484,368 |
TOTAL CANADA | | 7,409,476 |
Cayman Islands - 0.7% |
58.com, Inc. ADR | 4,000 | | 96,480 |
Baidu.com, Inc. sponsored ADR (a) | 20,300 | | 3,266,270 |
Cimc Enric Holdings Ltd. | 1,020,000 | | 1,436,657 |
ENN Energy Holdings Ltd. | 314,000 | | 1,860,996 |
Eurasia Drilling Co. Ltd. GDR (Reg. S) | 43,500 | | 1,842,225 |
Greatview Aseptic Pack Co. Ltd. | 1,799,000 | | 1,132,351 |
Sands China Ltd. | 90,400 | | 642,466 |
Youku Tudou, Inc. ADR (a)(d) | 27,400 | | 746,376 |
TOTAL CAYMAN ISLANDS | | 11,023,821 |
Cyprus - 0.0% |
SPDI Secure Property Development & Investment PLC (a) | 31,822 | | 35,844 |
|
| Shares | | Value |
Denmark - 0.2% |
Novo Nordisk A/S Series B | 22,916 | | $ 3,816,720 |
Finland - 0.4% |
Raisio Group PLC (V Shares) | 139,000 | | 809,640 |
Sampo Oyj (A Shares) | 107,000 | | 5,068,793 |
TOTAL FINLAND | | 5,878,433 |
France - 4.9% |
Arkema SA | 29,430 | | 3,341,337 |
Atos Origin SA | 24,326 | | 2,076,840 |
AXA SA | 327,500 | | 8,181,802 |
BNP Paribas SA | 93,030 | | 6,889,028 |
Bureau Veritas SA | 86,700 | | 2,618,024 |
Danone SA | 56,400 | | 4,182,641 |
Edenred SA | 73,500 | | 2,497,361 |
Havas SA | 344,900 | | 2,873,415 |
Iliad SA | 12,793 | | 2,925,057 |
Kering SA | 22,350 | | 5,078,355 |
Lafarge SA (Bearer) | 37,800 | | 2,616,444 |
LVMH Moet Hennessy - Louis Vuitton SA | 33,006 | | 6,354,611 |
Sanofi SA | 53,719 | | 5,727,694 |
Schneider Electric SA | 84,600 | | 7,127,414 |
Technip SA | 11,800 | | 1,236,055 |
Total SA | 173,600 | | 10,650,877 |
TOTAL FRANCE | | 74,376,955 |
Germany - 3.3% |
Aareal Bank AG (a) | 63,891 | | 2,457,137 |
adidas AG | 33,400 | | 3,812,931 |
BASF AG | 77,939 | | 8,109,115 |
Bayer AG | 91,200 | | 11,335,105 |
Brenntag AG | 27,600 | | 4,676,743 |
GEA Group AG | 75,747 | | 3,296,198 |
GSW Immobilien AG | 28,483 | | 1,324,543 |
HeidelbergCement Finance AG | 53,600 | | 4,225,340 |
KION Group AG (a) | 45,449 | | 1,851,251 |
LEG Immobilien AG | 19,100 | | 1,089,187 |
Siemens AG | 68,079 | | 8,699,973 |
TOTAL GERMANY | | 50,877,523 |
Hong Kong - 0.8% |
AIA Group Ltd. | 1,263,600 | | 6,413,345 |
Techtronic Industries Co. Ltd. | 2,334,000 | | 5,870,373 |
TOTAL HONG KONG | | 12,283,718 |
India - 0.3% |
Housing Development Finance Corp. Ltd. | 256,407 | | 3,557,718 |
United Spirits Ltd. | 27,317 | | 1,141,082 |
TOTAL INDIA | | 4,698,800 |
Indonesia - 0.0% |
PT Tower Bersama Infrastructure Tbk | 990,500 | | 500,849 |
Ireland - 3.3% |
Actavis PLC (a) | 153,200 | | 23,681,656 |
Common Stocks - continued |
| Shares | | Value |
Ireland - continued |
Alkermes PLC (a) | 84,000 | | $ 2,955,960 |
Bank of Ireland (a) | 8,957,800 | | 3,260,264 |
Eaton Corp. PLC | 96,000 | | 6,773,760 |
Greencore Group PLC | 509,900 | | 1,472,450 |
James Hardie Industries PLC CDI | 365,087 | | 3,771,527 |
Kerry Group PLC Class A | 58,400 | | 3,739,835 |
Trinity Biotech PLC sponsored ADR | 193,741 | | 4,843,525 |
TOTAL IRELAND | | 50,498,977 |
Italy - 0.5% |
De Longhi SpA | 141,700 | | 2,193,282 |
Moleskine SpA | 397,400 | | 971,226 |
Tod's SpA | 7,333 | | 1,221,648 |
UniCredit SpA | 225,700 | | 1,697,701 |
World Duty Free SpA (a) | 159,397 | | 1,765,998 |
TOTAL ITALY | | 7,849,855 |
Japan - 8.0% |
ABC-MART, Inc. | 48,600 | | 2,430,533 |
Aozora Bank Ltd. | 983,000 | | 2,857,615 |
ARNEST ONE Corp. | 41,000 | | 1,124,133 |
Astellas Pharma, Inc. | 47,400 | | 2,642,379 |
Cosmos Pharmaceutical Corp. | 12,200 | | 1,486,333 |
Daikin Industries Ltd. | 67,300 | | 3,871,997 |
Don Quijote Co. Ltd. | 109,500 | | 7,289,030 |
Hajime Construction Co. Ltd. | 4,500 | | 310,282 |
Harmonic Drive Systems, Inc. | 64,400 | | 1,386,409 |
Hitachi Ltd. | 313,000 | | 2,189,469 |
Japan Exchange Group, Inc. | 159,500 | | 3,708,080 |
Japan Tobacco, Inc. | 273,400 | | 9,892,619 |
Kakaku.com, Inc. | 123,200 | | 2,382,853 |
KDDI Corp. | 129,000 | | 6,986,187 |
Keyence Corp. | 18,460 | | 7,911,772 |
Leopalace21 Corp. (a) | 421,900 | | 2,929,044 |
Miraca Holdings, Inc. | 12,400 | | 558,720 |
Mitsubishi UFJ Financial Group, Inc. | 1,099,300 | | 7,000,636 |
Nomura Real Estate Holdings, Inc. | 35,200 | | 890,610 |
Omron Corp. | 75,500 | | 2,881,172 |
ORIX Corp. | 554,600 | | 9,606,275 |
Park24 Co. Ltd. | 83,900 | | 1,638,111 |
Rakuten, Inc. | 316,000 | | 4,117,366 |
Santen Pharmaceutical Co. Ltd. | 71,900 | | 3,650,056 |
Seven & i Holdings Co., Ltd. | 134,700 | | 4,985,063 |
Shinsei Bank Ltd. | 1,543,000 | | 3,612,636 |
Ship Healthcare Holdings, Inc. | 67,000 | | 2,749,303 |
SoftBank Corp. | 129,700 | | 9,685,854 |
Toyota Motor Corp. | 173,400 | | 11,242,942 |
USS Co. Ltd. | 28,800 | | 421,762 |
TOTAL JAPAN | | 122,439,241 |
Kenya - 0.1% |
Safaricom Ltd. | 18,905,500 | | 2,093,228 |
|
| Shares | | Value |
Korea (South) - 0.4% |
Hyundai Motor Co. | 12,766 | | $ 3,043,303 |
NHN Corp. | 4,224 | | 2,376,118 |
Orion Corp. | 742 | | 723,626 |
TOTAL KOREA (SOUTH) | | 6,143,047 |
Luxembourg - 0.2% |
Brait SA | 363,375 | | 1,770,045 |
Eurofins Scientific SA | 3,000 | | 822,593 |
TOTAL LUXEMBOURG | | 2,592,638 |
Mexico - 0.1% |
Alsea S.A.B. de CV | 519,500 | | 1,615,767 |
Netherlands - 1.6% |
AEGON NV | 292,700 | | 2,328,980 |
ASML Holding NV | 45,507 | | 4,306,782 |
European Aeronautic Defence and Space Co. (EADS) NV | 24,000 | | 1,649,177 |
Exact Holdings NV | 10,177 | | 269,517 |
Koninklijke Ahold NV | 149,342 | | 2,842,823 |
Koninklijke Philips Electronics NV | 155,100 | | 5,481,348 |
Randstad Holding NV | 44,718 | | 2,759,840 |
Royal DSM NV | 32,700 | | 2,476,988 |
Yandex NV (a) | 54,300 | | 2,001,498 |
TOTAL NETHERLANDS | | 24,116,953 |
New Zealand - 0.2% |
Ryman Healthcare Group Ltd. | 459,616 | | 2,866,303 |
Norway - 0.4% |
DNB ASA | 365,200 | | 6,472,077 |
Philippines - 0.1% |
Alliance Global Group, Inc. | 1,671,800 | | 1,019,367 |
Russia - 0.2% |
Mobile TeleSystems OJSC sponsored ADR | 143,200 | | 3,264,960 |
Singapore - 1.0% |
Avago Technologies Ltd. | 278,000 | | 12,629,540 |
Global Logistic Properties Ltd. | 1,015,000 | | 2,524,835 |
TOTAL SINGAPORE | | 15,154,375 |
South Africa - 0.6% |
Distell Group Ltd. | 126,410 | | 1,693,652 |
Naspers Ltd. Class N | 80,100 | | 7,492,357 |
TOTAL SOUTH AFRICA | | 9,186,009 |
Spain - 1.7% |
Amadeus IT Holding SA Class A | 82,100 | | 3,048,739 |
Antena 3 de Television SA | 93,500 | | 1,567,828 |
Banco Bilbao Vizcaya Argentaria SA | 799,331 | | 9,341,727 |
Criteria CaixaCorp SA (d) | 259,900 | | 1,351,175 |
Distribuidora Internacional de Alimentacion SA | 352,600 | | 3,223,374 |
Common Stocks - continued |
| Shares | | Value |
Spain - continued |
Grifols SA ADR | 75,442 | | $ 2,275,331 |
Inditex SA | 28,781 | | 4,728,366 |
TOTAL SPAIN | | 25,536,540 |
Sweden - 1.9% |
ASSA ABLOY AB (B Shares) | 110,600 | | 5,490,701 |
Intrum Justitia AB | 115,000 | | 3,061,319 |
Investment AB Kinnevik (B Shares) | 145,500 | | 5,361,903 |
Nordea Bank AB | 374,200 | | 4,792,957 |
Svenska Cellulosa AB (SCA) (B Shares) | 222,500 | | 6,317,852 |
Svenska Handelsbanken AB (A Shares) | 77,300 | | 3,502,331 |
TOTAL SWEDEN | | 28,527,063 |
Switzerland - 3.1% |
Actelion Ltd. | 13,000 | | 1,006,502 |
Credit Suisse Group | 63,657 | | 1,980,240 |
Lonza Group AG | 47,211 | | 4,219,774 |
Partners Group Holding AG | 13,818 | | 3,580,329 |
Roche Holding AG (participation certificate) | 49,858 | | 13,803,196 |
Schindler Holding AG (participation certificate) | 15,402 | | 2,184,645 |
SGS SA (Reg.) | 490 | | 1,148,113 |
Swatch Group AG (Bearer) | 2,200 | | 1,407,505 |
Syngenta AG (Switzerland) | 11,110 | | 4,484,181 |
UBS AG | 506,231 | | 9,791,049 |
Zurich Insurance Group AG | 10,593 | | 2,929,171 |
TOTAL SWITZERLAND | | 46,534,705 |
Taiwan - 0.3% |
ECLAT Textile Co. Ltd. | 149,940 | | 1,647,888 |
Taiwan Semiconductor Manufacturing Co. Ltd. | 706,000 | | 2,597,103 |
TOTAL TAIWAN | | 4,244,991 |
United Kingdom - 7.2% |
Aberdeen Asset Management PLC | 355,842 | | 2,526,997 |
Alabama Noor Hospitals Group PLC (a) | 169,000 | | 2,303,284 |
Associated British Foods PLC | 96,800 | | 3,518,591 |
Barclays PLC | 1,419,228 | | 5,971,353 |
BG Group PLC | 240,300 | | 4,906,758 |
BHP Billiton PLC | 154,101 | | 4,755,325 |
British American Tobacco PLC (United Kingdom) | 49,900 | | 2,753,097 |
Croda International PLC | 38,600 | | 1,507,671 |
Diageo PLC | 264,983 | | 8,446,990 |
Foxtons Group PLC | 134,300 | | 686,385 |
Hikma Pharmaceuticals PLC | 239,015 | | 4,602,672 |
Hilton Food Group PLC | 262,800 | | 1,803,479 |
HSBC Holdings PLC (United Kingdom) | 756,850 | | 8,296,094 |
Intertek Group PLC | 55,600 | | 2,970,446 |
ITV PLC | 907,700 | | 2,778,370 |
Jazztel PLC (a) | 284,917 | | 3,125,716 |
Legal & General Group PLC | 1,589,267 | | 5,511,823 |
|
| Shares | | Value |
Liberty Global PLC Class A (a) | 37,000 | | $ 2,899,690 |
London Stock Exchange Group PLC | 107,700 | | 2,835,507 |
Meggitt PLC | 419,676 | | 3,852,401 |
Next PLC | 57,000 | | 4,976,392 |
Ocado Group PLC (a) | 511,100 | | 3,556,620 |
Persimmon PLC | 129,000 | | 2,616,508 |
Reckitt Benckiser Group PLC | 48,500 | | 3,770,042 |
Rolls-Royce Group PLC | 271,600 | | 5,008,060 |
Rotork PLC | 44,510 | | 2,043,247 |
Royal Mail PLC | 106,500 | | 956,268 |
SABMiller PLC | 92,100 | | 4,805,284 |
Taylor Wimpey PLC | 1,155,900 | | 2,042,414 |
The Restaurant Group PLC | 123,700 | | 1,142,442 |
Ultra Electronics Holdings PLC | 36,900 | | 1,144,260 |
Vodafone Group PLC | 420,400 | | 1,539,825 |
TOTAL UNITED KINGDOM | | 109,654,011 |
United States of America - 49.8% |
A.O. Smith Corp. | 21,000 | | 1,084,650 |
Accuray, Inc. (a) | 235,000 | | 1,586,250 |
Adobe Systems, Inc. (a) | 289,000 | | 15,663,800 |
Agios Pharmaceuticals, Inc. (d) | 20,000 | | 463,200 |
Alexion Pharmaceuticals, Inc. (a) | 44,000 | | 5,409,800 |
Alliance Data Systems Corp. (a) | 6,000 | | 1,422,360 |
Amazon.com, Inc. (a) | 23,000 | | 8,372,690 |
American International Group, Inc. | 145,000 | | 7,489,250 |
Ameriprise Financial, Inc. | 175,400 | | 17,634,716 |
Amphenol Corp. Class A | 15,000 | | 1,204,350 |
Applied Micro Circuits Corp. (a) | 104,000 | | 1,212,640 |
Bank of America Corp. | 2,436,400 | | 34,012,144 |
Beam, Inc. | 23,900 | | 1,608,470 |
Biogen Idec, Inc. (a) | 66,000 | | 16,116,540 |
Bluebird Bio, Inc. (d) | 27,100 | | 575,875 |
Boston Scientific Corp. (a) | 275,300 | | 3,218,257 |
Bristol-Myers Squibb Co. | 87,000 | | 4,569,240 |
Cabot Oil & Gas Corp. | 1,002,000 | | 35,390,640 |
CalAmp Corp. (a) | 14,000 | | 329,420 |
Callidus Software, Inc. (a) | 50,000 | | 517,500 |
CBS Corp. Class B | 171,000 | | 10,112,940 |
Celldex Therapeutics, Inc. (a) | 89,100 | | 2,041,281 |
Citigroup, Inc. | 204,000 | | 9,951,120 |
Criteo SA sponsored ADR | 1,823 | | 64,370 |
Cummins, Inc. | 223,000 | | 28,325,460 |
Discovery Communications, Inc. Class A (a) | 42,000 | | 3,734,640 |
Eastman Chemical Co. | 292,500 | | 23,046,075 |
Ecolab, Inc. | 168,000 | | 17,808,000 |
EOG Resources, Inc. | 97,000 | | 17,304,800 |
EQT Corp. | 138,000 | | 11,814,180 |
Estee Lauder Companies, Inc. Class A | 12,800 | | 908,288 |
Facebook, Inc. Class A (a) | 78,000 | | 3,920,280 |
FedEx Corp. | 134,000 | | 17,554,000 |
Gilead Sciences, Inc. (a) | 382,000 | | 27,118,180 |
Google, Inc. Class A (a) | 30,200 | | 31,123,516 |
Common Stocks - continued |
| Shares | | Value |
United States of America - continued |
Guidewire Software, Inc. (a) | 53,000 | | $ 2,688,160 |
H&R Block, Inc. | 56,000 | | 1,592,640 |
Halozyme Therapeutics, Inc. (a)(d) | 236,000 | | 2,749,400 |
HealthStream, Inc. (a) | 12,000 | | 428,640 |
Illumina, Inc. (a) | 174,500 | | 16,317,495 |
inContact, Inc. (a) | 102,506 | | 778,021 |
Intercept Pharmaceuticals, Inc. | 47,667 | | 2,585,458 |
Johnson Controls, Inc. | 66,000 | | 3,045,900 |
KAR Auction Services, Inc. | 7,000 | | 208,040 |
KKR & Co. LP | 157,000 | | 3,446,150 |
Kroger Co. | 414,300 | | 17,748,612 |
MasterCard, Inc. Class A | 60,400 | | 43,312,839 |
McGraw-Hill Companies, Inc. | 491,200 | | 34,226,816 |
McKesson Corp. | 23,000 | | 3,595,820 |
Medivation, Inc. (a) | 59,800 | | 3,579,628 |
Monster Beverage Corp. (a) | 3,000 | | 171,690 |
Morgan Stanley | 405,000 | | 11,635,650 |
Netflix, Inc. (a) | 28,000 | | 9,029,440 |
Noble Energy, Inc. | 156,000 | | 11,689,080 |
Norfolk Southern Corp. | 161,000 | | 13,849,220 |
Pharmacyclics, Inc. (a) | 14,300 | | 1,696,552 |
Phillips 66 Partners LP | 49,875 | | 1,675,800 |
Pioneer Natural Resources Co. | 151,900 | | 31,106,082 |
priceline.com, Inc. (a) | 7,700 | | 8,114,491 |
Proto Labs, Inc. (a) | 33,000 | | 2,767,380 |
PVH Corp. | 53,000 | | 6,602,210 |
Regeneron Pharmaceuticals, Inc. (a) | 11,231 | | 3,230,036 |
Rock-Tenn Co. Class A | 11,000 | | 1,177,110 |
salesforce.com, Inc. (a) | 48,900 | | 2,609,304 |
ServiceNow, Inc. (a) | 226,000 | | 12,341,860 |
Sirius XM Radio, Inc. | 607,000 | | 2,288,390 |
Sohu.com, Inc. (a) | 19,300 | | 1,292,328 |
Spirit Airlines, Inc. (a) | 59,900 | | 2,584,685 |
SS&C Technologies Holdings, Inc. (a) | 82,900 | | 3,257,970 |
Synageva BioPharma Corp. (a) | 15,100 | | 767,080 |
Teledyne Technologies, Inc. (a) | 16,000 | | 1,421,120 |
The Blackstone Group LP | 421,000 | | 11,063,880 |
The Boeing Co. | 56,000 | | 7,308,000 |
The Cooper Companies, Inc. | 109,800 | | 14,187,258 |
TJX Companies, Inc. | 227,900 | | 13,854,041 |
TripAdvisor, Inc. (a) | 71,000 | | 5,872,410 |
Twenty-First Century Fox, Inc. Class A | 212,000 | | 7,224,960 |
United Therapeutics Corp. (a) | 35,000 | | 3,098,200 |
Visa, Inc. Class A | 149,900 | | 29,480,833 |
W.R. Grace & Co. (a) | 18,000 | | 1,649,880 |
Web.com Group, Inc. (a) | 137,100 | | 3,694,845 |
WhiteWave Foods Co. | 40,000 | | 800,400 |
Workday, Inc. Class A | 218,300 | | 16,344,121 |
Xylem, Inc. | 88,000 | | 3,036,000 |
Yahoo!, Inc. (a) | 399,000 | | 13,139,070 |
TOTAL UNITED STATES OF AMERICA | | 759,073,917 |
|
| Shares | | Value |
US Virgin Islands - 0.0% |
Altisource Residential Corp. Class B | 25,000 | | $ 664,250 |
TOTAL COMMON STOCKS (Cost $1,165,169,491) |
1,465,615,571
|
Nonconvertible Preferred Stocks - 0.7% |
| | | |
Germany - 0.7% |
Volkswagen AG | 39,200 | | 9,963,495 |
United Kingdom - 0.0% |
Rolls-Royce Group PLC Series C | 23,357,600 | | 37,452 |
TOTAL NONCONVERTIBLE PREFERRED STOCKS (Cost $7,496,985) |
10,000,947
|
Convertible Bonds - 0.1% |
| Principal Amount | | |
United States of America - 0.1% |
MGIC Investment Corp. 2% 4/1/20 | | $ 700,000 | | 954,310 |
Radian Group, Inc. 2.25% 3/1/19 | | 620,000 | | 935,394 |
TOTAL CONVERTIBLE BONDS (Cost $1,320,000) |
1,889,704
|
Government Obligations - 0.0% |
|
United States of America - 0.0% |
U.S. Treasury Bills, yield at date of purchase 0.02% 1/2/14 (e)
(Cost $414,989) | | 415,000 | |
414,982
|
Money Market Funds - 3.3% |
| Shares | | |
Fidelity Cash Central Fund, 0.09% (b) | 45,067,881 | | 45,067,881 |
Fidelity Securities Lending Cash Central Fund, 0.09% (b)(c) | 4,680,338 | | 4,680,338 |
TOTAL MONEY MARKET FUNDS (Cost $49,748,219) |
49,748,219
|
TOTAL INVESTMENT PORTFOLIO - 100.2% (Cost $1,224,149,684) | | 1,527,669,423 |
NET OTHER ASSETS (LIABILITIES) - (0.2)% | | (2,644,309) |
NET ASSETS - 100% | $ 1,525,025,114 |
Futures Contracts |
| Expiration Date | | Underlying Face Amount at Value | | Unrealized Appreciation/(Depreciation) |
Purchased |
Equity Index Contracts |
92 Nikkei 225 Index Contracts (Japan) | Dec. 2013 | | $ 6,653,900 | | $ 248,032 |
|
The face value of futures purchased as a percentage of net assets is 0.4% |
Legend |
(a) Non-income producing |
(b) Affiliated fund that is generally available only to investment companies and other accounts managed by Fidelity Investments. The rate quoted is the annualized seven-day yield of the fund at period end. A complete unaudited listing of the fund's holdings as of its most recent quarter end is available upon request. In addition, each Fidelity Central Fund's financial statements, which are not covered by the Fund's Report of Independent Registered Public Accounting Firm, are available on the SEC's website or upon request. |
(c) Investment made with cash collateral received from securities on loan. |
(d) Security or a portion of the security is on loan at period end. |
(e) Security or a portion of the security was pledged to cover margin requirements for futures contracts. At period end, the value of securities pledged amounted to $414,982. |
Affiliated Central Funds |
Information regarding fiscal year to date income earned by the Fund from investments in Fidelity Central Funds is as follows: |
Fund | Income earned |
Fidelity Cash Central Fund | $ 50,995 |
Fidelity Securities Lending Cash Central Fund | 356,949 |
Total | $ 407,944 |
Other Information |
Categorizations in the Schedule of Investments are based on country or territory of incorporation. |
The following is a summary of the inputs used, as of October 31, 2013, involving the Fund's assets and liabilities carried at fair value. The inputs or methodology used for valuing securities may not be an indication of the risk associated with investing in those securities. For more information on valuation inputs, and their aggregation into the levels used in the tables below, please refer to the Investment Valuation section in the accompanying Notes to Financial Statements. |
Valuation Inputs at Reporting Date: |
Description | Total | Level 1 | Level 2 | Level 3 |
Investments in Securities: | | | | |
Equities: | | | | |
Consumer Discretionary | $ 195,094,745 | $ 168,158,697 | $ 25,501,633 | $ 1,434,415 |
Consumer Staples | 96,269,397 | 61,281,831 | 34,987,566 | - |
Energy | 136,117,946 | 125,467,069 | 10,650,877 | - |
Financials | 302,503,944 | 230,929,341 | 71,574,603 | - |
Health Care | 213,703,702 | 194,558,830 | 19,144,872 | - |
Industrials | 178,362,200 | 157,284,362 | 21,077,838 | - |
Information Technology | 238,545,382 | 220,583,013 | 17,962,369 | - |
Materials | 80,101,344 | 70,861,838 | 9,239,506 | - |
Telecommunication Services | 30,899,697 | 12,687,831 | 18,211,866 | - |
Utilities | 4,018,161 | 4,018,161 | - | - |
Corporate Bonds | 1,889,704 | - | 1,889,704 | - |
Government Obligations | 414,982 | - | 414,982 | - |
Money Market Funds | 49,748,219 | 49,748,219 | - | - |
Total Investments in Securities: | $ 1,527,669,423 | $ 1,295,579,192 | $ 230,655,816 | $ 1,434,415 |
Derivative Instruments: | | | | |
Assets | | | | |
Futures Contracts | $ 248,032 | $ 248,032 | $ - | $ - |
The following is a summary of transfers between Level 1 and Level 2 for the period ended October 31, 2013. Transfers are assumed to have occurred at the beginning of the period, and are primarily attributable to the valuation techniques used for foreign equity securities, as discussed in the accompanying Notes to Financial Statements: |
Transfers | Total |
Level 1 to Level 2 | $ 43,000,101 |
Level 2 to Level 1 | $ 0 |
Value of Derivative Instruments |
The following table is a summary of the Fund's value of derivative instruments by primary risk exposure as of October 31, 2013. For additional information on derivative instruments, please refer to the Derivative Instruments section in the accompanying Notes to Financial Statements. |
Primary Risk Exposure /
Derivative Type | Value |
| Asset | Liability |
Equity Risk | | |
Futures Contracts (a) | $ 248,032 | $ - |
Total Value of Derivatives | $ 248,032 | $ - |
(a) Reflects gross cumulative appreciation (depreciation) on futures contracts as presented in the Schedule of Investments. Only the period end receivable or payable for daily variation margin and net unrealized appreciation (depreciation) are presented in the Statement of Assets and Liabilities. |
See accompanying notes which are an integral part of the financial statements.
Annual Report
Fidelity Worldwide Fund
Statement of Assets and Liabilities
| October 31, 2013 |
| | |
Assets | | |
Investment in securities, at value (including securities loaned of $4,617,353) - See accompanying schedule: Unaffiliated issuers (cost $1,174,401,466) | $ 1,477,921,205 | |
Fidelity Central Funds (cost $49,748,218) | 49,748,218 | |
Total Investments (cost $1,224,149,684) | | $ 1,527,669,423 |
Cash | | 46,236 |
Foreign currency held at value (cost $145) | | 145 |
Receivable for investments sold | | 52,033,895 |
Receivable for fund shares sold | | 1,918,441 |
Dividends receivable | | 1,641,222 |
Interest receivable | | 3,492 |
Distributions receivable from Fidelity Central Funds | | 12,107 |
Prepaid expenses | | 4,783 |
Other receivables | | 265,654 |
Total assets | | 1,583,595,398 |
| | |
Liabilities | | |
Payable for investments purchased | $ 51,567,924 | |
Payable for fund shares redeemed | 859,404 | |
Accrued management fee | 988,981 | |
Distribution and service plan fees payable | 18,778 | |
Payable for daily variation margin for derivative instruments | 57,500 | |
Other affiliated payables | 294,730 | |
Other payables and accrued expenses | 102,629 | |
Collateral on securities loaned, at value | 4,680,338 | |
Total liabilities | | 58,570,284 |
| | |
Net Assets | | $ 1,525,025,114 |
Net Assets consist of: | | |
Paid in capital | | $ 1,104,816,841 |
Undistributed net investment income | | 5,154,082 |
Accumulated undistributed net realized gain (loss) on investments and foreign currency transactions | | 111,364,032 |
Net unrealized appreciation (depreciation) on investments and assets and liabilities in foreign currencies | | 303,690,159 |
Net Assets | | $ 1,525,025,114 |
Statement of Assets and Liabilities - continued
| October 31, 2013 |
| | |
Calculation of Maximum Offering Price Class A:
Net Asset Value and redemption price per share ($28,661,272 ÷ 1,138,130 shares) | | $ 25.18 |
| | |
Maximum offering price per share (100/94.25 of $25.18) | | $ 26.72 |
Class T:
Net Asset Value and redemption price per share ($9,822,410 ÷ 392,095 shares) | | $ 25.05 |
| | |
Maximum offering price per share (100/96.50 of $25.05) | | $ 25.96 |
Class B:
Net Asset Value and offering price per share ($709,889 ÷ 28,601 shares)A | | $ 24.82 |
| | |
Class C:
Net Asset Value and offering price per share ($10,777,727 ÷ 434,922 shares)A | | $ 24.78 |
| | |
Worldwide:
Net Asset Value, offering price and redemption price per share ($1,464,415,231 ÷ 57,635,498 shares) | | $ 25.41 |
| | |
Institutional Class:
Net Asset Value, offering price and redemption price per share ($10,638,585 ÷ 420,307 shares) | | $ 25.31 |
A Redemption price per share is equal to net asset value less any applicable contingent deferred sales charge.
See accompanying notes which are an integral part of the financial statements.
Annual Report
Statement of Operations
| Year ended October 31, 2013 |
Investment Income | | |
Dividends | | $ 20,251,766 |
Interest | | 18,336 |
Income from Fidelity Central Funds | | 407,944 |
Income before foreign taxes withheld | | 20,678,046 |
Less foreign taxes withheld | | (1,095,825) |
Total income | | 19,582,221 |
| | |
Expenses | | |
Management fee
Basic fee | $ 9,069,757 | |
Performance adjustment | 1,622,176 | |
Transfer agent fees | 2,711,063 | |
Distribution and service plan fees | 156,379 | |
Accounting and security lending fees | 588,006 | |
Custodian fees and expenses | 172,916 | |
Independent trustees' compensation | 7,367 | |
Registration fees | 94,174 | |
Audit | 74,846 | |
Legal | 4,009 | |
Miscellaneous | 10,331 | |
Total expenses before reductions | 14,511,024 | |
Expense reductions | (321,971) | 14,189,053 |
Net investment income (loss) | | 5,393,168 |
Realized and Unrealized Gain (Loss) Net realized gain (loss) on: | | |
Investment securities: | | |
Unaffiliated issuers | 124,060,205 | |
Foreign currency transactions | (172,714) | |
Futures contracts | 3,571,502 | |
Total net realized gain (loss) | | 127,458,993 |
Change in net unrealized appreciation (depreciation) on: Investment securities | 200,652,376 | |
Assets and liabilities in foreign currencies | (4,939) | |
Futures contracts | 248,032 | |
Total change in net unrealized appreciation (depreciation) | | 200,895,469 |
Net gain (loss) | | 328,354,462 |
Net increase (decrease) in net assets resulting from operations | | $ 333,747,630 |
Statement of Changes in Net Assets
| Year ended
October 31,
2013 | Year ended
October 31,
2012 |
Increase (Decrease) in Net Assets | | |
Operations | | |
Net investment income (loss) | $ 5,393,168 | $ 9,012,042 |
Net realized gain (loss) | 127,458,993 | 52,879,353 |
Change in net unrealized appreciation (depreciation) | 200,895,469 | 45,589,333 |
Net increase (decrease) in net assets resulting from operations | 333,747,630 | 107,480,728 |
Distributions to shareholders from net investment income | (8,778,977) | (4,089,511) |
Distributions to shareholders from net realized gain | (4,461,887) | - |
Total distributions | (13,240,864) | (4,089,511) |
Share transactions - net increase (decrease) | 92,658,787 | (126,253,328) |
Redemption fees | 24,982 | 23,898 |
Total increase (decrease) in net assets | 413,190,535 | (22,838,213) |
| | |
Net Assets | | |
Beginning of period | 1,111,834,579 | 1,134,672,792 |
End of period (including undistributed net investment income of $5,154,082 and undistributed net investment income of $7,478,979, respectively) | $ 1,525,025,114 | $ 1,111,834,579 |
See accompanying notes which are an integral part of the financial statements.
Annual Report
Financial Highlights - Class A
Years ended October 31, | 2013 | 2012 | 2011 | 2010 | 2009 H |
Selected Per-Share Data | | | | | |
Net asset value, beginning of period | $ 19.69 | $ 17.89 | $ 17.50 | $ 14.96 | $ 10.88 |
Income from Investment Operations | | | | | |
Net investment income (loss) E | .02 | .10 | .05 | .03 | (.01) |
Net realized and unrealized gain (loss) | 5.66 | 1.72 | .47 | 2.63 | 4.09 |
Total from investment operations | 5.68 | 1.82 | .52 | 2.66 | 4.08 |
Distributions from net investment income | (.11) | (.02) | (.08) | (.10) | - |
Distributions from net realized gain | (.08) | - | (.05) | (.02) | - |
Total distributions | (.19) | (.02) | (.13) | (.12) | - |
Redemption fees added to paid in capital E, J | - | - | - | - | - |
Net asset value, end of period | $ 25.18 | $ 19.69 | $ 17.89 | $ 17.50 | $ 14.96 |
Total Return B, C, D | 29.10% | 10.20% | 2.94% | 17.85% | 37.50% |
Ratios to Average Net Assets F, I | | | | | |
Expenses before reductions | 1.45% | 1.43% | 1.41% | 1.43% | 1.52% A |
Expenses net of fee waivers, if any | 1.45% | 1.43% | 1.40% | 1.43% | 1.52% A |
Expenses net of all reductions | 1.42% | 1.41% | 1.38% | 1.41% | 1.49% A |
Net investment income (loss) | .09% | .52% | .28% | .21% | (.06)% A |
Supplemental Data | | | | | |
Net assets, end of period (000 omitted) | $ 28,661 | $ 18,723 | $ 13,153 | $ 7,530 | $ 993 |
Portfolio turnover rate G | 161% | 186% | 203% | 166% | 224% |
A Annualized
B Total returns for periods of less than one year are not annualized.
C Total returns would have been lower if certain expenses had not been reduced during the applicable periods shown.
D Total returns do not include the effect of the sales charges.
E Calculated based on average shares outstanding during the period.
F Fees and expenses of any underlying Fidelity Central Funds are not included in the Fund's expense ratio. The Fund indirectly bears its proportionate share of the expenses of any underlying Fidelity Central Funds.
G Amount does not include the portfolio activity of any underlying Fidelity Central Funds.
H For the period February 19, 2009 (commencement of sale of shares) to October 31, 2009.
I Expense ratios reflect operating expenses of the class. Expenses before reductions do not reflect amounts reimbursed by the investment adviser or reductions from brokerage service arrangements or reductions from other expense offset arrangements and do not represent the amount paid by the class during periods when reimbursements or reductions occur. Expense ratios before reductions for start-up periods may not be representative of longer-term operating periods. Expenses net of fee waivers reflect expenses after reimbursement by the investment adviser but prior to reductions from brokerage service arrangements or other expense offset arrangements. Expenses net of all reductions represent the net expenses paid by the class.
J Amount represents less than $.01 per share.
Financial Highlights - Class T
Years ended October 31, | 2013 | 2012 | 2011 | 2010 | 2009 H |
Selected Per-Share Data | | | | | |
Net asset value, beginning of period | $ 19.61 | $ 17.83 | $ 17.46 | $ 14.94 | $ 10.88 |
Income from Investment Operations | | | | | |
Net investment income (loss) E | (.04) | .05 | .01 | (.01) | (.01) |
Net realized and unrealized gain (loss) | 5.63 | 1.73 | .45 | 2.62 | 4.07 |
Total from investment operations | 5.59 | 1.78 | .46 | 2.61 | 4.06 |
Distributions from net investment income | (.07) | - | (.04) | (.08) | - |
Distributions from net realized gain | (.08) | - | (.05) | (.02) | - |
Total distributions | (.15) | - | (.09) | (.09) K | - |
Redemption fees added to paid in capital E, J | - | - | - | - | - |
Net asset value, end of period | $ 25.05 | $ 19.61 | $ 17.83 | $ 17.46 | $ 14.94 |
Total Return B, C, D | 28.73% | 9.98% | 2.61% | 17.53% | 37.32% |
Ratios to Average Net Assets F, I | | | | | |
Expenses before reductions | 1.71% | 1.68% | 1.66% | 1.70% | 1.73% A |
Expenses net of fee waivers, if any | 1.70% | 1.68% | 1.65% | 1.70% | 1.73% A |
Expenses net of all reductions | 1.68% | 1.66% | 1.63% | 1.68% | 1.70% A |
Net investment income (loss) | (.16)% | .26% | .03% | (.05)% | (.08)% A |
Supplemental Data | | | | | |
Net assets, end of period (000 omitted) | $ 9,822 | $ 5,550 | $ 2,187 | $ 1,120 | $ 458 |
Portfolio turnover rate G | 161% | 186% | 203% | 166% | 224% |
A Annualized
B Total returns for periods of less than one year are not annualized.
C Total returns would have been lower if certain expenses had not been reduced during the applicable periods shown.
D Total returns do not include the effect of the sales charges.
E Calculated based on average shares outstanding during the period.
F Fees and expenses of any underlying Fidelity Central Funds are not included in the Fund's expense ratio. The Fund indirectly bears its proportionate share of the expenses of any underlying Fidelity Central Funds.
G Amount does not include the portfolio activity of any underlying Fidelity Central Funds.
H For the period February 19, 2009 (commencement of sale of shares) to October 31, 2009.
I Expense ratios reflect operating expenses of the class. Expenses before reductions do not reflect amounts reimbursed by the investment adviser or reductions from brokerage service arrangements or reductions from other expense offset arrangements and do not represent the amount paid by the class during periods when reimbursements or reductions occur. Expense ratios before reductions for start-up periods may not be representative of longer-term operating periods. Expenses net of fee waivers reflect expenses after reimbursement by the investment adviser but prior to reductions from brokerage service arrangements or other expense offset arrangements. Expenses net of all reductions represent the net expenses paid by the class.
J Amount represents less than $.01 per share.
K Total distributions of $.09 per share is comprised of distributions from net investment income of $.075 and distributions from net realized gain of $.015 per share.
See accompanying notes which are an integral part of the financial statements.
Annual Report
Financial Highlights - Class B
Years ended October 31, | 2013 | 2012 | 2011 | 2010 | 2009 H |
Selected Per-Share Data | | | | | |
Net asset value, beginning of period | $ 19.44 | $ 17.77 | $ 17.39 | $ 14.89 | $ 10.88 |
Income from Investment Operations | | | | | |
Net investment income (loss) E | (.14) | (.04) | (.09) | (.09) | (.03) |
Net realized and unrealized gain (loss) | 5.59 | 1.71 | .47 | 2.61 | 4.04 |
Total from investment operations | 5.45 | 1.67 | .38 | 2.52 | 4.01 |
Distributions from net investment income | - | - | - | (.01) | - |
Distributions from net realized gain | (.07) | - | - | (.01) | - |
Total distributions | (.07) | - | - | (.02) | - |
Redemption fees added to paid in capital E, J | - | - | - | - | - |
Net asset value, end of period | $ 24.82 | $ 19.44 | $ 17.77 | $ 17.39 | $ 14.89 |
Total Return B, C, D | 28.13% | 9.40% | 2.19% | 16.92% | 36.86% |
Ratios to Average Net Assets F, I | | | | | |
Expenses before reductions | 2.19% | 2.18% | 2.16% | 2.19% | 2.20% A |
Expenses net of fee waivers, if any | 2.19% | 2.18% | 2.16% | 2.19% | 2.20% A |
Expenses net of all reductions | 2.17% | 2.16% | 2.13% | 2.17% | 2.17% A |
Net investment income (loss) | (.65)% | (.23)% | (.47)% | (.55)% | (.30)% A |
Supplemental Data | | | | | |
Net assets, end of period (000 omitted) | $ 710 | $ 304 | $ 256 | $ 305 | $ 224 |
Portfolio turnover rate G | 161% | 186% | 203% | 166% | 224% |
A Annualized
B Total returns for periods of less than one year are not annualized.
C Total returns would have been lower if certain expenses had not been reduced during the applicable periods shown.
D Total returns do not include the effect of the contingent deferred sales charge.
E Calculated based on average shares outstanding during the period.
F Fees and expenses of any underlying Fidelity Central Funds are not included in the Fund's expense ratio. The Fund indirectly bears its proportionate share of the expenses of any underlying Fidelity Central Funds.
G Amount does not include the portfolio activity of any underlying Fidelity Central Funds.
H For the period February 19, 2009 (commencement of sale of shares) to October 31, 2009.
I Expense ratios reflect operating expenses of the class. Expenses before reductions do not reflect amounts reimbursed by the investment adviser or reductions from brokerage service arrangements or reductions from other expense offset arrangements and do not represent the amount paid by the class during periods when reimbursements or reductions occur. Expense ratios before reductions for start-up periods may not be representative of longer-term operating periods. Expenses net of fee waivers reflect expenses after reimbursement by the investment adviser but prior to reductions from brokerage service arrangements or other expense offset arrangements. Expenses net of all reductions represent the net expenses paid by the class.
J Amount represents less than $.01 per share.
Financial Highlights - Class C
Years ended October 31, | 2013 | 2012 | 2011 | 2010 | 2009 H |
Selected Per-Share Data | | | | | |
Net asset value, beginning of period | $ 19.41 | $ 17.74 | $ 17.36 | $ 14.89 | $ 10.88 |
Income from Investment Operations | | | | | |
Net investment income (loss) E | (.14) | (.04) | (.09) | (.09) | (.04) |
Net realized and unrealized gain (loss) | 5.58 | 1.71 | .47 | 2.61 | 4.05 |
Total from investment operations | 5.44 | 1.67 | .38 | 2.52 | 4.01 |
Distributions from net investment income | - | - | - | (.03) | - |
Distributions from net realized gain | (.07) | - | - | (.02) | - |
Total distributions | (.07) | - | - | (.05) | - |
Redemption fees added to paid in capital E, J | - | - | - | - | - |
Net asset value, end of period | $ 24.78 | $ 19.41 | $ 17.74 | $ 17.36 | $ 14.89 |
Total Return B, C, D | 28.12% | 9.41% | 2.19% | 16.94% | 36.86% |
Ratios to Average Net Assets F, I | | | | | |
Expenses before reductions | 2.15% | 2.18% | 2.16% | 2.19% | 2.18% A |
Expenses net of fee waivers, if any | 2.14% | 2.18% | 2.15% | 2.19% | 2.18% A |
Expenses net of all reductions | 2.12% | 2.16% | 2.13% | 2.16% | 2.15% A |
Net investment income (loss) | (.60)% | (.23)% | (.47)% | (.54)% | (.39)% A |
Supplemental Data | | | | | |
Net assets, end of period (000 omitted) | $ 10,778 | $ 1,726 | $ 1,297 | $ 710 | $ 335 |
Portfolio turnover rate G | 161% | 186% | 203% | 166% | 224% |
A Annualized
B Total returns for periods of less than one year are not annualized.
C Total returns would have been lower if certain expenses had not been reduced during the applicable periods shown.
D Total returns do not include the effect of the contingent deferred sales charge.
E Calculated based on average shares outstanding during the period.
F Fees and expenses of any underlying Fidelity Central Funds are not included in the Fund's expense ratio. The Fund indirectly bears its proportionate share of the expenses of any underlying Fidelity Central Funds.
G Amount does not include the portfolio activity of any underlying Fidelity Central Funds.
H For the period February 19, 2009 (commencement of sale of shares) to October 31, 2009.
I Expense ratios reflect operating expenses of the class. Expenses before reductions do not reflect amounts reimbursed by the investment adviser or reductions from brokerage service arrangements or reductions from other expense offset arrangements and do not represent the amount paid by the class during periods when reimbursements or reductions occur. Expense ratios before reductions for start-up periods may not be representative of longer-term operating periods. Expenses net of fee waivers reflect expenses after reimbursement by the investment adviser but prior to reductions from brokerage service arrangements or other expense offset arrangements. Expenses net of all reductions represent the net expenses paid by the class.
J Amount represents less than $.01 per share.
See accompanying notes which are an integral part of the financial statements.
Annual Report
Financial Highlights - Worldwide
Years ended October 31, | 2013 | 2012 | 2011 | 2010 | 2009 |
Selected Per-Share Data | | | | | |
Net asset value, beginning of period | $ 19.85 | $ 18.02 | $ 17.58 | $ 14.98 | $ 13.40 |
Income from Investment Operations | | | | | |
Net investment income (loss) B | .10 | .16 | .11 | .08 | .12 |
Net realized and unrealized gain (loss) | 5.70 | 1.74 | .48 | 2.63 | 1.63 |
Total from investment operations | 5.80 | 1.90 | .59 | 2.71 | 1.75 |
Distributions from net investment income | (.16) | (.07) | (.10) | (.10) | (.17) |
Distributions from net realized gain | (.08) | - | (.05) | (.02) | - |
Total distributions | (.24) | (.07) | (.15) | (.11) G | (.17) |
Redemption fees added to paid in capital B, F | - | - | - | - | - |
Net asset value, end of period | $ 25.41 | $ 19.85 | $ 18.02 | $ 17.58 | $ 14.98 |
Total Return A | 29.54% | 10.56% | 3.32% | 18.18% | 13.39% |
Ratios to Average Net Assets C, E | | | | | |
Expenses before reductions | 1.11% | 1.11% | 1.08% | 1.15% | 1.27% |
Expenses net of fee waivers, if any | 1.11% | 1.11% | 1.08% | 1.15% | 1.27% |
Expenses net of all reductions | 1.08% | 1.09% | 1.05% | 1.12% | 1.24% |
Net investment income (loss) | .43% | .84% | .60% | .50% | .92% |
Supplemental Data | | | | | |
Net assets, end of period (000 omitted) | $ 1,464,415 | $ 1,081,240 | $ 1,114,694 | $ 1,087,928 | $ 991,996 |
Portfolio turnover rate D | 161% | 186% | 203% | 166% | 224% |
A Total returns would have been lower if certain expenses had not been reduced during the applicable periods shown.
B Calculated based on average shares outstanding during the period.
C Fees and expenses of any underlying Fidelity Central Funds are not included in the Fund's expense ratio. The Fund indirectly bears its proportionate share of the expenses of any underlying Fidelity Central Funds.
D Amount does not include the portfolio activity of any underlying Fidelity Central Funds.
E Expense ratios reflect operating expenses of the class. Expenses before reductions do not reflect amounts reimbursed by the investment adviser or reductions from brokerage service arrangements or reductions from other expense offset arrangements and do not represent the amount paid by the class during periods when reimbursements or reductions occur. Expenses net of fee waivers reflect expenses after reimbursement by the investment adviser but prior to reductions from brokerage service arrangements or other expense offset arrangements. Expenses net of all reductions represent the net expenses paid by the class.
F Amount represents less than $.01 per share.
G Total distributions of $.11 per share is comprised of distributions from net investment income of $.097 and distributions from net realized gain of $.015 per share.
Financial Highlights - Institutional Class
Years ended October 31, | 2013 | 2012 | 2011 | 2010 | 2009 G |
Selected Per-Share Data | | | | | |
Net asset value, beginning of period | $ 19.78 | $ 17.98 | $ 17.57 | $ 15.00 | $ 10.88 |
Income from Investment Operations | | | | | |
Net investment income (loss) D | .08 | .14 | .10 | .07 | .06 |
Net realized and unrealized gain (loss) | 5.68 | 1.74 | .47 | 2.63 | 4.06 |
Total from investment operations | 5.76 | 1.88 | .57 | 2.70 | 4.12 |
Distributions from net investment income | (.15) | (.08) | (.11) | (.11) | - |
Distributions from net realized gain | (.08) | - | (.05) | (.02) | - |
Total distributions | (.23) | (.08) | (.16) | (.13) | - |
Redemption fees added to paid in capital D, I | - | - | - | - | - |
Net asset value, end of period | $ 25.31 | $ 19.78 | $ 17.98 | $ 17.57 | $ 15.00 |
Total Return B, C | 29.44% | 10.49% | 3.23% | 18.08% | 37.87% |
Ratios to Average Net Assets E, H | | | | | |
Expenses before reductions | 1.17% | 1.18% | 1.13% | 1.21% | 1.17% A |
Expenses net of fee waivers, if any | 1.17% | 1.18% | 1.13% | 1.21% | 1.17% A |
Expenses net of all reductions | 1.14% | 1.16% | 1.10% | 1.19% | 1.15% A |
Net investment income (loss) | .37% | .77% | .56% | .44% | .62% A |
Supplemental Data | | | | | |
Net assets, end of period (000 omitted) | $ 10,639 | $ 4,291 | $ 3,086 | $ 335 | $ 290 |
Portfolio turnover rate F | 161% | 186% | 203% | 166% | 224% |
A Annualized
B Total returns for periods of less than one year are not annualized.
C Total returns would have been lower if certain expenses had not been reduced during the applicable periods shown.
D Calculated based on average shares outstanding during the period.
E Fees and expenses of any underlying Fidelity Central Funds are not included in the Fund's expense ratio. The Fund indirectly bears its proportionate share of the expenses of any underlying Fidelity Central Funds.
F Amount does not include the portfolio activity of any underlying Fidelity Central Funds.
G For the period February 19, 2009 (commencement of sale of shares) to October 31, 2009.
H Expense ratios reflect operating expenses of the class. Expenses before reductions do not reflect amounts reimbursed by the investment adviser or reductions from brokerage service arrangements or reductions from other expense offset arrangements and do not represent the amount paid by the class during periods when reimbursements or reductions occur. Expense ratios before reductions for start-up periods may not be representative of longer-term operating periods. Expenses net of fee waivers reflect expenses after reimbursement by the investment adviser but prior to reductions from brokerage service arrangements or other expense offset arrangements. Expenses net of all reductions represent the net expenses paid by the class.
I Amount represents less than $.01 per share.
See accompanying notes which are an integral part of the financial statements.
Annual Report
Fidelity Worldwide Fund
Notes to Financial Statements
For the period ended October 31, 2013
1. Organization.
Fidelity Worldwide Fund (the Fund) is a fund of Fidelity Investment Trust (the Trust) and is authorized to issue an unlimited number of shares. The Trust is registered under the Investment Company Act of 1940, as amended (the 1940 Act), as an open-end management investment company organized as a Massachusetts business trust. The Fund offers Class A, Class T, Class C, Worldwide and Institutional Class shares, each of which, along with Class B shares, has equal rights as to assets and voting privileges. Class B shares are closed to new accounts and additional purchases, except for exchanges and reinvestments. Each class has exclusive voting rights with respect to matters that affect that class. Class B shares will automatically convert to Class A shares after a holding period of seven years from the initial date of purchase.
2. Investments in Fidelity Central Funds.
The Fund invests in Fidelity Central Funds, which are open-end investment companies generally available only to other investment companies and accounts managed by Fidelity Management & Research Company (FMR) and its affiliates. The Fund's Schedule of Investments lists each of the Fidelity Central Funds held as of period end, if any, as an investment of the Fund, but does not include the underlying holdings of each Fidelity Central Fund. As an Investing Fund, the Fund indirectly bears its proportionate share of the expenses of the underlying Fidelity Central Funds.
The Money Market Central Funds seek preservation of capital and current income and are managed by Fidelity Investments Money Management, Inc. (FIMM), an affiliate of FMR.
A complete unaudited list of holdings for each Fidelity Central Fund is available upon request or at the Securities and Exchange Commission (the SEC) website at www.sec.gov. In addition, the financial statements of the Fidelity Central Funds, which are not covered by the Fund's Report of Independent Registered Public Accounting Firm, are available on the SEC website or upon request.
3. Significant Accounting Policies.
The financial statements have been prepared in conformity with accounting principles generally accepted in the United States of America (GAAP), which require management to make certain estimates and assumptions at the date of the financial statements. Actual results could differ from those estimates. Subsequent events, if any, through the date that the financial statements were issued have been evaluated in the preparation of the financial statements. The following summarizes the significant accounting policies of the Fund:
Investment Valuation. Investments are valued as of 4:00 p.m. Eastern time on the last calendar day of the period. In accordance with valuation policies and procedures approved by the Board of Trustees (the Board), the Fund attempts to obtain prices from one or more third party pricing vendors or brokers to value its investments. When current market prices, quotations or currency exchange rates are not readily available or reliable, investments will be fair valued in good faith by the FMR Fair Value Committee (the Committee), in accordance with procedures adopted by the Board. Factors used in determining fair value vary by investment type and may include market or investment specific events, changes in interest rates and credit quality. The frequency with which these procedures are used cannot be predicted and they may be utilized to a significant extent. The Committee oversees the Fund's valuation policies and procedures and is responsible for approving and reporting to the Board all fair value determinations.
The Fund categorizes the inputs to valuation techniques used to value its investments into a disclosure hierarchy consisting of three levels as shown below:
Level 1 - quoted prices in active markets for identical investments
Level 2 - other significant observable inputs (including quoted prices for similar investments, interest rates, prepayment speeds, etc.)
Level 3 - unobservable inputs (including the Fund's own assumptions based on the best information available)
Valuation techniques used to value the Fund's investments by major category are as follows:
Equity securities, including restricted securities, for which market quotations are readily available, are valued at the last reported sale price or official closing price as reported by a third party pricing vendor on the primary market or exchange on which they are traded and are categorized as Level 1 in the hierarchy. In the event there were no sales during the day or closing prices are not available, securities are valued at the last quoted bid price or may be valued using the last available price and are generally categorized as Level 2 in the hierarchy. For foreign equity securities, when market or security specific events arise, comparisons to the valuation of American Depositary Receipts (ADRs), futures contracts, Exchange-Traded Funds (ETFs) and certain indexes as well as quoted prices for similar securities may be used and would be categorized as Level 2 in the hierarchy. Utilizing these techniques may result in transfers between Level 1 and Level 2. For equity securities, including restricted securities, where observable inputs are limited, assumptions about market activity and risk are used and these securities may be categorized as Level 3 in the hierarchy.
Debt securities, including restricted securities, are valued based on evaluated prices received from third party pricing vendors or from brokers who make markets in such securities. For corporate bonds and U.S. government and government agency obligations, pricing vendors utilize matrix pricing which considers yield or price of bonds of comparable quality, coupon, maturity and type as well as broker-supplied prices. When independent prices
Annual Report
Fidelity Worldwide Fund
Notes to Financial Statements - continued
3. Significant Accounting Policies - continued
Investment Valuation - continued
are unavailable or unreliable, debt securities may be valued utilizing pricing methodologies which consider similar factors that would be used by third party pricing vendors. Debt securities are generally categorized as Level 2 in the hierarchy but may be Level 3 depending on the circumstances.
Futures contracts are valued at the settlement price established each day by the board of trade or exchange on which they are traded and are categorized as Level 1 in the hierarchy. Investments in open-end mutual funds, including the Fidelity Central Funds, are valued at their closing net asset value (NAV) each business day and are categorized as Level 1 in the hierarchy.
Changes in valuation techniques may result in transfers in or out of an assigned level within the disclosure hierarchy. The aggregate value of investments by input level, as of October 31, 2013, including information on transfers between Levels 1 and 2, is included at the end of the Fund's Schedule of Investments.
Foreign Currency. The Fund may use foreign currency contracts to facilitate transactions in foreign-denominated securities. Gains and losses from these transactions may arise from changes in the value of the foreign currency or if the counterparties do not perform under the contracts' terms.
Foreign-denominated assets, including investment securities, and liabilities are translated into U.S. dollars at the exchange rates at period end. Purchases and sales of investment securities, income and dividends received and expenses denominated in foreign currencies are translated into U.S. dollars at the exchange rate in effect on the transaction date.
The effects of exchange rate fluctuations on investments are included with the net realized and unrealized gain (loss) on investment securities. Other foreign currency transactions resulting in realized and unrealized gain (loss) are disclosed separately.
Investment Transactions and Income. For financial reporting purposes, the Fund's investment holdings and NAV include trades executed through the end of the last business day of the period. The NAV per share for processing shareholder transactions is calculated as of the close of business of the New York Stock Exchange (NYSE), normally 4:00 p.m. Eastern time and includes trades executed through the end of the prior business day. Gains and losses on securities sold are determined on the basis of identified cost and may include proceeds received from litigation. Dividend income is recorded on the ex-dividend date, except for certain dividends from foreign securities where the ex-dividend date may have passed, which are recorded as soon as the Fund is informed of the ex-dividend date. Non-cash dividends included in dividend income, if any, are recorded at the fair market value of the securities received. Distributions received on securities that represent a return of capital or capital gain are recorded as a reduction of cost of investments and/or as a realized gain. Subsequent to ex-dividend date the Fund determines the components of these distributions, based upon receipt of tax filings or other correspondence relating to the underlying investment. Interest income and distributions from the Fidelity Central Funds are accrued as earned. Interest income includes coupon interest and amortization of premium and accretion of discount on debt securities. Investment income is recorded net of foreign taxes withheld where recovery of such taxes is uncertain.
Class Allocations and Expenses. Investment income, realized and unrealized capital gains and losses, common expenses of the Fund, and certain fund-level expense reductions, if any, are allocated daily on a pro-rata basis to each class based on the relative net assets of each class to the total net assets of the Fund. Each class differs with respect to transfer agent and distribution and service plan fees incurred. Certain expense reductions may also differ by class. For the reporting period, the allocated portion of income and expenses to each class as a percent of its average net assets may vary due to the timing of recording these transactions in relation to fluctuating net assets of the classes. Expenses directly attributable to a fund are charged to that fund. Expenses attributable to more than one fund are allocated among the respective funds on the basis of relative net assets or other appropriate methods. Expense estimates are accrued in the period to which they relate and adjustments are made when actual amounts are known.
Income Tax Information and Distributions to Shareholders. Each year, the Fund intends to qualify as a regulated investment company under Subchapter M of the Internal Revenue Code, including distributing substantially all of its taxable income and realized gains. As a result, no provision for U.S. Federal income taxes is required. As of October 31, 2013, the Fund did not have any unrecognized tax benefits in the financial statements; nor is the Fund aware of any tax positions for which it is reasonably possible that the total amounts of unrecognized tax benefits will significantly change in the next twelve months. The Fund files a U.S. federal tax return, in addition to state and local tax returns as required. The Fund's federal income tax returns are subject to examination by the Internal Revenue Service (IRS) for a period of three fiscal years after they are filed. State and local tax returns may be subject to examination for an additional fiscal year depending on the jurisdiction. Foreign taxes are provided for based on the Fund's understanding of the tax rules and rates that exist in the foreign markets in which it invests.
Distributions are declared and recorded on the ex-dividend date. Income dividends and capital gain distributions are declared separately for each class. Income and capital gain distributions are determined in accordance with income tax regulations, which may differ from GAAP. In addition, the Fund claimed a portion of the payment made to redeeming shareholders as a distribution for income tax purposes.
Capital accounts within the financial statements are adjusted for permanent book-tax differences. These adjustments have no impact on net assets or the results of operations. Temporary book-tax differences will reverse in a subsequent period.
Annual Report
3. Significant Accounting Policies - continued
Income Tax Information and Distributions to Shareholders - continued
Book-tax differences are primarily due to futures contracts, foreign currency transactions, passive foreign investment companies (PFIC), partnerships, deferred trustees compensation, and losses deferred due to wash sales.
The federal tax cost of investment securities and unrealized appreciation (depreciation) as of period end were as follows:
Gross unrealized appreciation | $ 303,709,710 |
Gross unrealized depreciation | (8,652,395) |
Net unrealized appreciation (depreciation) on securities and other investments | $ 295,057,315 |
| |
Tax Cost | $ 1,232,612,108 |
The tax-based components of distributable earnings as of period end were as follows:
Undistributed ordinary income | $ 60,493,370 |
Undistributed long-term capital gain | $ 64,735,706 |
Net unrealized appreciation (depreciation) | $ 294,979,703 |
The tax character of distributions paid was as follows:
| October 31, 2013 | October 31, 2012 |
Ordinary Income | $ 9,335,754 | $ 4,089,511 |
Long-term Capital Gain | 3,905,110 | - |
Total | $ 13,240,864 | $ 4,089,511 |
Short-Term Trading (Redemption) Fees. Shares held by investors in the Fund less than 30 days may have been subject to a redemption fee equal to 1.00% of the net asset value of shares redeemed. All redemption fees, which reduce the proceeds of the shareholder redemption, are retained by the Fund and accounted for as an addition to paid in capital.
New Accounting Pronouncement. The Financial Accounting Standards Board issued in December 2011, Accounting Standard Update No. 2011-11, Disclosures about Offsetting Assets and Liabilities, and in January 2013, Accounting Standards Update No. 2013-1 Clarifying the Scope of Disclosures about Offsetting Assets and Liabilities. These updates create new disclosure requirements requiring entities to disclose both gross and net information for derivatives and other financial instruments that are either offset in the Statement of Assets and Liabilities or subject to an enforceable master netting arrangement or similar agreement. The disclosure requirements are effective for annual reporting periods beginning on or after January 1, 2013, and interim periods within those annual periods. Management expects that the impact of the updates' adoption will be limited to additional financial statement disclosures as applicable.
4. Derivative Instruments.
Risk Exposures and the Use of Derivative Instruments. The Fund's investment objective allows the Fund to enter into various types of derivative contracts, including futures contracts. Derivatives are investments whose value is primarily derived from underlying assets, indices or reference rates and may be transacted on an exchange or over-the-counter (OTC). Derivatives may involve a future commitment to buy or sell a specified asset based on specified terms, to exchange future cash flows at periodic intervals based on a notional principal amount, or for one party to make one or more payments upon the occurrence of specified events in exchange for periodic payments from the other party.
The Fund used derivatives to increase returns and to manage exposure to certain risks as defined below. The success of any strategy involving derivatives depends on analysis of numerous economic factors, and if the strategies for investment do not work as intended, the Fund may not achieve its objectives.
The Fund's use of derivatives increased or decreased its exposure to the following risk:
Equity Risk | Equity risk relates to the fluctuations in the value of financial instruments as a result of changes in market prices (other than those arising from interest rate risk or foreign exchange risk), whether caused by factors specific to an individual investment, its issuer, or all factors affecting all instruments traded in a market or market segment. |
Annual Report
Fidelity Worldwide Fund
Notes to Financial Statements - continued
4. Derivative Instruments - continued
Risk Exposures and the Use of Derivative Instruments - continued
The Fund is also exposed to additional risks from investing in derivatives, such as liquidity risk and counterparty credit risk. Liquidity risk is the risk that the Fund will be unable to close out the derivative in the open market in a timely manner. Counterparty credit risk is the risk that the counterparty will not be able to fulfill its obligation to the Fund. Counterparty credit risk related to exchange-traded futures contracts may be mitigated by the protection provided by the exchange on which they trade.
Investing in derivatives may involve greater risks than investing in the underlying assets directly and, to varying degrees, may involve risk of loss in excess of any initial investment and collateral received and amounts recognized in the Statement of Assets and Liabilities. In addition, there may be the risk that the change in value of the derivative contract does not correspond to the change in value of the underlying instrument.
Futures Contracts. A futures contract is an agreement between two parties to buy or sell a specified underlying instrument for a fixed price at a specified future date. The Fund used futures contracts to manage its exposure to the stock market and to fluctuations in currency values.
Upon entering into a futures contract, a fund is required to deposit either cash or securities (initial margin) with a clearing broker in an amount equal to a certain percentage of the face value of the contract. Futures contracts are marked-to-market daily and subsequent daily payments (variation margin) are made or received by a fund depending on the daily fluctuations in the value of the futures contracts and are recorded as unrealized appreciation or (depreciation). This receivable and/or payable, if any, is included in daily variation margin for derivative instruments in the Statement of Assets and Liabilities. Realized gain or (loss) is recorded upon the expiration or closing of a futures contract.
Any open futures contracts at period end are presented in the Schedule of Investments under the caption "Futures Contracts." The underlying face amount at value reflects each contract's exposure to the underlying instrument or index at period end and is representative of activity for the period. Securities deposited to meet initial margin requirements are identified in the Schedule of Investments.
During the period the Fund recognized net realized gain (loss) of $3,571,502 and a change in net unrealized appreciation (depreciation) of $248,032 related to its investment in futures contracts. These amounts are included in the Statement of Operations.
5. Purchases and Sales of Investments.
Purchases and sales of securities, other than short-term securities, aggregated $2,101,815,224 and $2,010,981,925, respectively.
6. Fees and Other Transactions with Affiliates.
Management Fee. FMR and its affiliates provide the Fund with investment management related services for which the Fund pays a monthly management fee. The management fee is the sum of an individual fund fee rate that is based on an annual rate of .45% of the Fund's average net assets and an annualized group fee rate that averaged .25% during the period. The group fee rate is based upon the average net assets of all the mutual funds advised by FMR, including any mutual funds previously advised by FMR that are currently advised by Fidelity SelectCo, LLC, an affiliate of FMR. The group fee rate decreases as assets under management increase and increases as assets under management decrease. In addition, the management fee is subject to a performance adjustment (up to a maximum of ± .20% of the Fund's average net assets over a 36 month performance period). The upward or downward adjustment to the management fee is based on the relative investment performance of Worldwide as compared to an appropriate benchmark index over the same 36 month performance period. For the reporting period, the total annual management fee rate, including the performance adjustment, was .83% of the Fund's average net assets. The performance adjustment included in the management fee rate may be higher or lower than the maximum performance adjustment rate due to the difference between the average net assets for the reporting and performance periods.
Distribution and Service Plan Fees. In accordance with Rule 12b-1 of the 1940 Act, the Fund has adopted separate Distribution and Service Plans for each class of shares. Certain classes pay Fidelity Distributors Corporation (FDC), an affiliate of FMR, separate Distribution and Service Fees, each of which is based on an annual percentage of each class' average net assets. In addition, FDC may pay financial intermediaries for selling shares of the Fund and providing shareholder support services. For the period, the Distribution and Service Fee rates, total fees and amounts retained by FDC were as follows:
| Distribution
Fee | Service
Fee | Total Fees | Retained
by FDC |
Class A | -% | .25% | $ 56,465 | $ 3,136 |
Class T | .25% | .25% | 36,494 | - |
Class B | .75% | .25% | 5,173 | 3,899 |
Class C | .75% | .25% | 58,247 | 12,257 |
| | | $ 156,379 | $ 19,292 |
Annual Report
6. Fees and Other Transactions with Affiliates - continued
Sales Load. FDC may receive a front-end sales charge of up to 5.75% for selling Class A shares and 3.50% for selling Class T shares, some of which is paid to financial intermediaries for selling shares of the Fund. Depending on the holding period, FDC may receive contingent deferred sales charges levied on Class A, Class T, Class B, and Class C redemptions. The deferred sales charges range from 5.00% to 1.00% for Class B shares, 1.00% for Class C shares, 1.00% for certain purchases of Class A shares and .25% for certain purchases of Class T shares.
For the period, sales charge amounts retained by FDC were as follows:
| Retained
by FDC |
Class A | $ 14,423 |
Class T | 2,887 |
Class B* | 453 |
Class C* | 1,575 |
| $ 19,338 |
* When Class B and Class C shares are initially sold, FDC pays commissions from its own resources to financial intermediaries through which the sales are made.
Transfer Agent Fees. Fidelity Investments Institutional Operations Company, Inc., (FIIOC), an affiliate of FMR, is the transfer, dividend disbursing and shareholder servicing agent for each class of the Fund. FIIOC receives account fees and asset-based fees that vary according to the account size and type of account of the shareholders of the respective classes of the Fund. FIIOC pays for typesetting, printing and mailing of shareholder reports, except proxy statements.
For the period, transfer agent fees for each class were as follows:
| Amount | % of
Average
Net Assets |
Class A | $ 67,227 | .30 |
Class T | 22,437 | .31 |
Class B | 1,543 | .30 |
Class C | 15,419 | .26 |
Worldwide | 2,587,472 | .21 |
Institutional Class | 16,965 | .27 |
| $ 2,711,063 | |
Accounting and Security Lending Fees. Fidelity Service Company, Inc. (FSC), an affiliate of FMR, maintains the Fund's accounting records. The accounting fee is based on the level of average net assets for each month. Under a separate contract, FSC administers the security lending program. The security lending fee is based on the number and duration of lending transactions.
Brokerage Commissions. The Fund placed a portion of its portfolio transactions with brokerage firms which are affiliates of the investment adviser. Brokerage commissions are included in net realized gain (loss) and change in net unrealized appreciation (depreciation) in the Statement of Operations. The commissions paid to these affiliated firms were $41,416 for the period.
7. Committed Line of Credit.
The Fund participates with other funds managed by FMR or an affiliate in a $4.25 billion credit facility (the "line of credit") to be utilized for temporary or emergency purposes to fund shareholder redemptions or for other short-term liquidity purposes. The Fund has agreed to pay commitment fees on its pro-rata portion of the line of credit, which amounted to $2,710 and is reflected in Miscellaneous expenses on the Statement of Operations. During the period, there were no borrowings on this line of credit.
8. Security Lending.
The Fund lends portfolio securities through a lending agent from time to time in order to earn additional income. For equity securities, a lending agent is used and may loan securities to certain qualified borrowers, including Fidelity Capital Markets (FCM), a broker-dealer affiliated with the Fund. On the settlement date of the loan, the Fund receives collateral (in the form of U.S. Treasury obligations, letters of credit and/or cash) against the loaned securities and maintains collateral in an amount not less than 100% of the market value of the loaned securities during the period of the loan. The market value of the loaned securities is determined at the close of business of the Fund and any additional required collateral is delivered to the Fund on the next business day. If the borrower defaults on its obligation to return the securities loaned because of insolvency or other reasons, the Fund may apply collateral received from the borrower against the obligation. The Fund may experience delays and costs in recovering the securities loaned. Any
Annual Report
Fidelity Worldwide Fund
Notes to Financial Statements - continued
8. Security Lending - continued
cash collateral received is invested in the Fidelity Securities Lending Cash Central Fund. The value of loaned securities and cash collateral at period end are disclosed on the Fund's Statement of Assets and Liabilities. At period end, there were no security loans outstanding with FCM. Security lending income represents the income earned on investing cash collateral, less rebates paid to borrowers and any lending agent fees associated with the loan, plus any premium payments received for lending certain types of securities. Security lending income is presented in the Statement of Operations as a component of income from Fidelity Central Funds. Total security lending income during the period amounted to $356,949, including $3,404 from securities loaned to FCM.
9. Expense Reductions.
Commissions paid to certain brokers with whom FMR, or its affiliates, places trades on behalf of the Fund include an amount in addition to trade execution, which may be rebated back to the Fund to offset certain expenses. This amount totaled $307,457 for the period.
In addition, through arrangements with the Fund's custodian, credits realized as a result of uninvested cash balances were used to reduce the Fund's expenses. During the period, these credits reduced the Fund's custody expenses by $92.
In addition, FMR reimbursed a portion of the Fund's operating expenses during the period in the amount of $14,422.
10. Distributions to Shareholders.
Distributions to shareholders of each class were as follows:
Years ended October 31, | 2013 | 2012 |
From net investment income | | |
Class A | $ 102,433 | $ 16,598 |
Class T | 21,836 | - |
Class B | - | - |
Class C | - | - |
Worldwide | 8,622,428 | 4,059,519 |
Institutional Class | 32,280 | 13,394 |
Total | $ 8,778,977 | $ 4,089,511 |
From net realized gain | | |
Class A | $ 75,180 | $ - |
Class T | 23,606 | - |
Class B | 1,126 | - |
Class C | 6,545 | - |
Worldwide | 4,338,328 | - |
Institutional Class | 17,102 | - |
Total | $ 4,461,887 | $ - |
11. Share Transactions.
Transactions for each class of shares were as follows:
| Shares | Dollars |
Years ended October 31, | 2013 | 2012 | 2013 | 2012 |
Class A | | | | |
Shares sold | 491,761 | 433,206 | $ 11,054,215 | $ 8,109,308 |
Reinvestment of distributions | 6,945 | 720 | 138,266 | 12,524 |
Shares redeemed | (311,295) | (218,566) | (6,852,432) | (4,053,305) |
Net increase (decrease) | 187,411 | 215,360 | $ 4,340,049 | $ 4,068,527 |
Class T | | | | |
Shares sold | 169,111 | 202,603 | $ 3,777,852 | $ 3,780,147 |
Reinvestment of distributions | 2,272 | - | 45,089 | - |
Shares redeemed | (62,341) | (42,181) | (1,376,268) | (800,428) |
Net increase (decrease) | 109,042 | 160,422 | $ 2,446,673 | $ 2,979,719 |
Class B | | | | |
Shares sold | 20,337 | 4,060 | $ 444,905 | $ 73,532 |
Reinvestment of distributions | 53 | - | 1,043 | - |
Shares redeemed | (7,424) | (2,808) | (167,624) | (51,407) |
Net increase (decrease) | 12,966 | 1,252 | $ 278,324 | $ 22,125 |
Annual Report
11. Share Transactions - continued
| Shares | Dollars |
Years ended October 31, | 2013 | 2012 | 2013 | 2012 |
Class C | | | | |
Shares sold | 396,584 | 38,075 | $ 8,655,233 | $ 696,495 |
Reinvestment of distributions | 325 | - | 6,404 | - |
Shares redeemed | (50,941) | (22,245) | (1,138,699) | (407,626) |
Net increase (decrease) | 345,968 | 15,830 | $ 7,522,938 | $ 288,869 |
Worldwide | | | | |
Shares sold | 11,150,143 | 8,155,382 | $ 252,015,125 | $ 150,136,706 |
Reinvestment of distributions | 628,809 | 226,349 | 12,588,791 | 3,956,581 |
Shares redeemed | (8,612,327) | (15,784,478) | (191,232,967) | (288,554,381) |
Net increase (decrease) | 3,166,625 | (7,402,747) | $ 73,370,949 | $ (134,461,094) |
Institutional Class | | | | |
Shares sold | 275,603 | 111,552 | $ 6,347,280 | $ 2,100,045 |
Reinvestment of distributions | 2,425 | 745 | 48,393 | 12,982 |
Shares redeemed | (74,630) | (67,062) | (1,695,819) | (1,264,501) |
Net increase (decrease) | 203,398 | 45,235 | $ 4,699,854 | $ 848,526 |
12. Other.
The Fund's organizational documents provide former and current trustees and officers with a limited indemnification against liabilities arising in connection with the performance of their duties to the Fund. In the normal course of business, the Fund may also enter into contracts that provide general indemnifications. The Fund's maximum exposure under these arrangements is unknown as this would be dependent on future claims that may be made against the Fund. The risk of material loss from such claims is considered remote.
Annual Report
Report of Independent Registered Public Accounting Firm
To the Trustees of Fidelity Investment Trust and Shareholders of Fidelity Worldwide Fund:
We have audited the accompanying statement of assets and liabilities of Fidelity Worldwide Fund (the Fund), a fund of Fidelity Investment Trust, including the schedule of investments, as of October 31, 2013, and the related statement of operations for the year then ended, the statement of changes in net assets for each of the two years in the period then ended, and the financial highlights for each of the five years in the period then ended. These financial statements and financial highlights are the responsibility of the Fund's management. Our responsibility is to express an opinion on these financial statements and financial highlights based on our audits.
We conducted our audits in accordance with the standards of the Public Company Accounting Oversight Board (United States). Those standards require that we plan and perform the audit to obtain reasonable assurance about whether the financial statements and financial highlights are free of material misstatement. The Fund is not required to have, nor were we engaged to perform, an audit of its internal control over financial reporting. Our audits included consideration of internal control over financial reporting as a basis for designing audit procedures that are appropriate in the circumstances, but not for the purpose of expressing an opinion on the effectiveness of the Fund's internal control over financial reporting. Accordingly, we express no such opinion. An audit also includes examining, on a test basis, evidence supporting the amounts and disclosures in the financial statements, assessing the accounting principles used and significant estimates made by management, as well as evaluating the overall financial statement presentation. Our procedures included confirmation of securities owned as of October 31, 2013, by correspondence with the custodians and brokers; where replies were not received from brokers, we performed other auditing procedures. We believe that our audits provide a reasonable basis for our opinion.
In our opinion, the financial statements and financial highlights referred to above present fairly, in all material respects, the financial position of Fidelity Worldwide Fund as of October 31, 2013, the results of its operations for the year then ended, the changes in its net assets for each of the two years in the period then ended, and the financial highlights for each of the five years in the period then ended, in conformity with accounting principles generally accepted in the United States of America.
DELOITTE & TOUCHE LLP
Boston, Massachusetts
December 13, 2013
Annual Report
The Trustees, Member of the Advisory Board, and executive officers of the trust and funds, as applicable, are listed below. The Board of Trustees governs each fund and is responsible for protecting the interests of shareholders. The Trustees are experienced executives who meet periodically throughout the year to oversee each fund's activities, review contractual arrangements with companies that provide services to each fund, oversee management of the risks associated with such activities and contractual arrangements, and review each fund's performance. Except for James C. Curvey, Ned C. Lautenbach, Ronald P. O'Hanley, and William S. Stavropoulos, each of the Trustees oversees 171 funds. Mr. Curvey oversees 394 funds. Mr. Lautenbach, Mr. O'Hanley, and Mr. Stavropoulos each oversees 245 funds.
The Trustees hold office without limit in time except that (a) any Trustee may resign; (b) any Trustee may be removed by written instrument, signed by at least two-thirds of the number of Trustees prior to such removal; (c) any Trustee who requests to be retired or who has become incapacitated by illness or injury may be retired by written instrument signed by a majority of the other Trustees; and (d) any Trustee may be removed at any special meeting of shareholders by a two-thirds vote of the outstanding voting securities of the trust. Each Trustee who is not an interested person of the trust and the funds (as defined in the 1940 Act) (Independent Trustee), shall retire not later than the last day of the calendar year in which his or her 75th birthday occurs. The Independent Trustees may waive this mandatory retirement age policy with respect to individual Trustees. The executive officers and Advisory Board Member hold office without limit in time, except that any officer and Advisory Board Member may resign or may be removed by a vote of a majority of the Trustees at any regular meeting or any special meeting of the Trustees. Except as indicated, each individual has held the office shown or other offices in the same company for the past five years.
Experience, Skills, Attributes, and Qualifications of the Funds' Trustees. The Governance and Nominating Committee has adopted a statement of policy that describes the experience, qualifications, attributes, and skills that are necessary and desirable for potential Independent Trustee candidates (Statement of Policy). The Board believes that each Trustee satisfied at the time he or she was initially elected or appointed a Trustee, and continues to satisfy, the standards contemplated by the Statement of Policy. The Governance and Nominating Committee also engages professional search firms to help identify potential Independent Trustee candidates who have the experience, qualifications, attributes, and skills consistent with the Statement of Policy. From time to time, additional criteria based on the composition and skills of the current Independent Trustees, as well as experience or skills that may be appropriate in light of future changes to board composition, business conditions, and regulatory or other developments, have also been considered by the professional search firms and the Governance and Nominating Committee. In addition, the Board takes into account the Trustees' commitment and participation in Board and committee meetings, as well as their leadership of standing and ad hoc committees throughout their tenure.
In determining that a particular Trustee was and continues to be qualified to serve as a Trustee, the Board has considered a variety of criteria, none of which, in isolation, was controlling. The Board believes that, collectively, the Trustees have balanced and diverse experience, qualifications, attributes, and skills, which allow the Board to operate effectively in governing each fund and protecting the interests of shareholders. Information about the specific experience, skills, attributes, and qualifications of each Trustee, which in each case led to the Board's conclusion that the Trustee should serve (or continue to serve) as a trustee of the funds, is provided below.
Board Structure and Oversight Function. James C. Curvey is an interested person (as defined in the 1940 Act) and currently serves as Chairman. The Trustees have determined that an interested Chairman is appropriate and benefits shareholders because an interested Chairman has a personal and professional stake in the quality and continuity of services provided to the funds. Independent Trustees exercise their informed business judgment to appoint an individual of their choosing to serve as Chairman, regardless of whether the Trustee happens to be independent or a member of management. The Independent Trustees have determined that they can act independently and effectively without having an Independent Trustee serve as Chairman and that a key structural component for assuring that they are in a position to do so is for the Independent Trustees to constitute a substantial majority for the Board. The Independent Trustees also regularly meet in executive session. Ned C. Lautenbach serves as Chairman of the Independent Trustees and as such (i) acts as a liaison between the Independent Trustees and management with respect to matters important to the Independent Trustees and (ii) with management prepares agendas for Board meetings.
Fidelity funds are overseen by different Boards of Trustees. The funds' Board oversees Fidelity's equity and high income funds and another Board oversees Fidelity's investment-grade bond, money market, and asset allocation funds. The asset allocation funds may invest in Fidelity funds overseen by the funds' Board. The use of separate Boards, each with its own committee structure, allows the Trustees of each group of Fidelity funds to focus on the unique issues of the funds they oversee, including common research, investment, and operational issues. On occasion, the separate Boards establish joint committees to address issues of overlapping consequences for the Fidelity funds overseen by each Board.
The Trustees operate using a system of committees to facilitate the timely and efficient consideration of all matters of importance to the Trustees, each fund, and fund shareholders and to facilitate compliance with legal and regulatory requirements and oversight of the funds' activities and associated risks. The Board, acting through its committees, has charged FMR and its affiliates with (i) identifying events or circumstances the occurrence of which could have demonstrably adverse effects on the funds' business and/or reputation; (ii) implementing processes and controls to lessen the possibility that such events or circumstances occur or to mitigate the effects of such events or circumstances if they do occur; and (iii) creating and maintaining a system designed to evaluate continuously business and market conditions in order to facilitate the identification and implementation processes described in (i) and (ii) above. Because the day-to-day operations and activities of the funds are carried out by or through FMR, its affiliates and other service providers, the funds' exposure to risks is mitigated but not eliminated by the processes overseen by the Trustees. While each of the Board's committees has responsibility for overseeing different aspects of the funds' activities, oversight is exercised primarily through the Operations, Audit, and Compliance Committees. In addition, the Independent Trustees have worked with FMR to enhance the Board's oversight of investment and financial risks, legal and regulatory risks, technology risks, and operational risks, including the development of additional risk reporting to the Board. For example, a working group comprised of Independent Trustees and FMR has worked and continues to work to review the Fidelity funds' valuation-related activities, reporting and risk management. Appropriate personnel, including but not limited to the funds' Chief Compliance Officer (CCO), FMR's internal auditor, the independent accountants, the funds' Treasurer and portfolio management personnel, make periodic reports to the Board's committees, as appropriate, including an annual review of FMR's risk management program for the Fidelity funds. The responsibilities of each standing committee, including their oversight responsibilities, are described further under "Standing Committees of the Funds' Trustees."
Annual Report
Trustees and Officers - continued
The fund's Statement of Additional Information (SAI) includes more information about the Trustees. To request a free copy, call Fidelity at 1-800-544-8544.
Interested Trustees*:
Correspondence intended for each Trustee who is an interested person may be sent to Fidelity Investments, 245 Summer Street, Boston, Massachusetts 02210.
Name, Year of Birth; Principal Occupations and Other Relevant Experience+ |
James C. Curvey (1935) |
Year of Election or Appointment: 2007 Trustee Chairman of the Board of Trustees |
| Mr. Curvey also serves as Trustee of other Fidelity funds. Mr. Curvey is a Director of Fidelity Investments Money Management, Inc. (2009-present), Director of Fidelity Research & Analysis Co. (2009-present) and Director of FMR and FMR Co., Inc. (2007-present). Mr. Curvey is also Vice Chairman (2007-present) and Director of FMR LLC. In addition, Mr. Curvey serves as an Overseer for the Boston Symphony Orchestra and a member of the Trustees of Villanova University. Previously, Mr. Curvey was the Vice Chairman (2006-2007) and Director (2000-2007) of FMR Corp. |
Ronald P. O'Hanley (1957) |
Year of Election or Appointment: 2011 Trustee |
| Mr. O'Hanley also serves as Trustee of other Fidelity funds. He is Director of Fidelity SelectCo, LLC (2013-present), FMR Co., Inc. (2010-present), Director of Fidelity Investments Money Management, Inc. (2010-present), Director of Fidelity Research & Analysis Company (2010-present), President of Fidelity Asset Management and Corporate Services and a Member of Fidelity's Executive Committee (2010-present). Previously, Mr. O'Hanley served as President and Chief Executive Officer of BNY Mellon Asset Management (2007-2010). Mr. O'Hanley also served as Vice Chairman of Bank New York Mellon Corp. and a member of that firm's Executive Committee. Prior to the 2007 merger of The Bank of New York and Mellon Financial Corporation, he was Vice Chairman of Mellon Financial Corporation and President and Chief Executive Officer of Mellon Asset Management. He joined Mellon in February 1997. Mr. O'Hanley currently serves as Chairman of the Boston Public Library Foundation Board of Directors and sits on the Board of Directors of Beth Israel Deaconess Medical Center, the Board of Trustees of the Marine Biological Laboratory and the Advisory Board of the Maxwell School of Citizenship and Public Administration at Syracuse University. Mr. O'Hanley also chairs the Council on Asset Management for the Financial Services Roundtable and is a member of the Board of Directors of Institutional Investor's U.S. Institute. |
* Trustees have been determined to be "Interested Trustees" by virtue of, among other things, their affiliation with the trust or various entities under common control with FMR.
+ The information above includes each Trustee's principal occupation during the last five years and other information relating to the experience, attributes, and skills relevant to each Trustee's qualifications to serve as a Trustee, which led to the conclusion that each Trustee should serve as a Trustee for each fund.
Annual Report
Independent Trustees:
Correspondence intended for each Independent Trustee (that is, the Trustees other than the Interested Trustees) may be sent to Fidelity Investments, P.O. Box 55235, Boston, Massachusetts 02205-5235.
Name, Year of Birth; Principal Occupations and Other Relevant Experience+ |
Dennis J. Dirks (1948) |
Year of Election or Appointment: 2005 Trustee |
| Mr. Dirks also serves as Trustee of other Fidelity funds. Prior to his retirement in May 2003, Mr. Dirks was Chief Operating Officer and a member of the Board of The Depository Trust & Clearing Corporation (DTCC). He also served as President, Chief Operating Officer, and Board member of The Depository Trust Company (DTC) and President and Board member of the National Securities Clearing Corporation (NSCC). In addition, Mr. Dirks served as Chief Executive Officer and Board member of the Government Securities Clearing Corporation, Chief Executive Officer and Board member of the Mortgage-Backed Securities Clearing Corporation, as a Trustee and a member of the Finance Committee of Manhattan College (2005-2008), and as a Trustee and a member of the Finance Committee of AHRC of Nassau County (2006-2008). Mr. Dirks is a member of the Independent Directors Council (IDC) Governing Council (2010-present) and Board of Directors for The Brookville Center for Children's Services, Inc. (2009-present). |
Alan J. Lacy (1953) |
Year of Election or Appointment: 2008 Trustee |
| Mr. Lacy also serves as Trustee of other Fidelity funds. Mr. Lacy serves as Senior Adviser (2007-present) of Oak Hill Capital Partners, L.P. (private equity). Mr. Lacy also served as Chief Executive Officer (2000-2005) and Vice Chairman (2005-2006) of Sears Holdings Corporation and Sears, Roebuck and Co. (retail). In addition, Mr. Lacy serves as a member of the Board of Directors of Dave & Buster's Entertainment, Inc. (restaurant and entertainment complexes, 2010-present), Earth Fare, Inc. (retail grocery, 2012-present), The Hillman Companies, Inc. (hardware wholesalers, 2010-present), and Bristol-Myers Squibb Company (global pharmaceuticals, 2008-present). Mr. Lacy is a member of the Board of Trustees of The National Parks Conservation Association (2006-present). Previously, Mr. Lacy served as Chairman of the Board of Trustees of the National Parks Conservation Association (2008-2011) and as a member of the Board of Directors for the Western Union Company (global money transfer, 2006-2011). |
Ned C. Lautenbach (1944) |
Year of Election or Appointment: 2000 Trustee Chairman of the Independent Trustees |
| Mr. Lautenbach also serves as Trustee of other Fidelity funds. Mr. Lautenbach currently serves as the Lead Director of the Eaton Corporation Board of Directors (diversified industrial, 1997-present). Mr. Lautenbach is Chairman of the Board of Directors of the Philharmonic Center for the Arts in Naples, Florida (2012-present) and a member of the Council on Foreign Relations (1994-present). Previously, Mr. Lautenbach was a Partner/Advisory Partner at Clayton, Dubilier & Rice, LLC (private equity investment, 1998-2010), as well as a Director of Sony Corporation (2006-2007). |
Joseph Mauriello (1944) |
Year of Election or Appointment: 2008 Trustee |
| Mr. Mauriello also serves as Trustee of other Fidelity funds. Prior to his retirement in January 2006, Mr. Mauriello served in numerous senior management positions including Deputy Chairman and Chief Operating Officer (2004-2005), and Vice Chairman of Financial Services (2002-2004) of KPMG LLP US (professional services, 1965-2005). Mr. Mauriello currently serves as a member of the Board of Directors of XL Group plc. (global insurance and re-insurance, 2006-present). Previously, Mr. Mauriello served as a Director of the Hamilton Funds of the Bank of New York (2006-2007) and of Arcadia Resources Inc. (health care services and products, 2007-2012). |
Robert W. Selander (1950) |
Year of Election or Appointment: 2011 Trustee |
| Mr. Selander also serves as Trustee of other Fidelity funds. Previously, Mr. Selander served as a Member of the Advisory Board of other Fidelity funds (2011), and Executive Vice Chairman (2010), Chief Executive Officer (2009-2010), and President and Chief Executive Officer (1997-2009) of Mastercard, Inc. |
Cornelia M. Small (1944) |
Year of Election or Appointment: 2005 Trustee |
| Ms. Small also serves as Trustee of other Fidelity funds. Ms. Small is a member of the Board of Directors (2009-present) and Chair of the Investment Committee (2010-present) of the Teagle Foundation. Ms. Small also serves on the Investment Committee of the Berkshire Taconic Community Foundation (2008-present). Previously, Ms. Small served as Chairperson (2002-2008) and a member of the Investment Committee and Chairperson (2008-2012) and a member of the Board of Trustees of Smith College. In addition, Ms. Small served as Chief Investment Officer, Director of Global Equity Investments, and a member of the Board of Directors of Scudder, Stevens & Clark and Scudder Kemper Investments. |
William S. Stavropoulos (1939) |
Year of Election or Appointment: 2001 Trustee Vice Chairman of the Independent Trustees |
| Mr. Stavropoulos also serves as Trustee of other Fidelity funds. Mr. Stavropoulos serves as President and Founder of the Michigan Baseball Foundation, the Great Lakes Loons (2007-present). Mr. Stavropoulos is Chairman Emeritus of the Board of Directors of The Dow Chemical Company, where he previously served in numerous senior management positions, including President, CEO (1995-2000; 2002-2004), Chairman of the Executive Committee (2000-2006), and as a member of the Board of Directors (1990-2006). Currently, Mr. Stavropoulos is Chairman of the Board of Directors of Univar Inc. (global distributor of commodity and specialty chemicals), a Director of Teradata Corporation (data warehousing and technology solutions), and Maersk Inc. (industrial conglomerate), and a member of the Advisory Board for Metalmark Capital LLC (private equity investment, 2005-present). Mr. Stavropoulos is an operating advisor to Clayton, Dubilier & Rice, LLC (private equity investment). In addition, Mr. Stavropoulos is a member of the University of Notre Dame Advisory Council for the College of Science, a Trustee of the Rollin L. Gerstacker Foundation, and a Director of the Naples Philharmonic Center for the Arts. Previously, Mr. Stavropoulos served as a Director of Chemical Financial Corporation (bank holding company, 1993-2012) and Tyco International, Ltd. (multinational manufacturing and services, 2007-2012). |
David M. Thomas (1949) |
Year of Election or Appointment: 2008 Trustee |
| Mr. Thomas also serves as Trustee of other Fidelity funds. Mr. Thomas serves as Non-Executive Chairman of the Board of Directors of Fortune Brands Home and Security (home and security products, 2011-present), and as a member of the Board of Directors of Interpublic Group of Companies, Inc. (marketing communication, 2004-present). Previously, Mr. Thomas served as Executive Chairman (2005-2006) and Chairman and Chief Executive Officer (2000-2005) of IMS Health, Inc. (pharmaceutical and healthcare information solutions), and a Director of Fortune Brands, Inc. (consumer products, 2000-2011). |
+ The information above includes each Trustee's principal occupation during the last five years and other information relating to the experience, attributes, and skills relevant to each Trustee's qualifications to serve as a Trustee, which led to the conclusion that each Trustee should serve as a Trustee for each fund.
Advisory Board Member and Executive Officers:
Correspondence intended for each executive officer and Peter S. Lynch may be sent to Fidelity Investments, 245 Summer Street, Boston, Massachusetts 02210. Executive officers appear below in alphabetical order.
Name, Year of Birth; Principal Occupation |
Peter S. Lynch (1944) |
Year of Election or Appointment: 2003 Member of the Advisory Board |
| Mr. Lynch also serves as Member of the Advisory Board of other Fidelity funds. Mr. Lynch is Vice Chairman and a Director of FMR and FMR Co., Inc. In addition, Mr. Lynch serves as a Trustee of Boston College and as the Chairman of the Inner-City Scholarship Fund. Previously, Mr. Lynch served on the Special Olympics International Board of Directors (1997-2006). |
Elizabeth Paige Baumann (1968) |
Year of Election or Appointment: 2012 Anti-Money Laundering (AML) Officer |
| Ms. Baumann also serves as AML Officer of other funds. She is Chief AML Officer of FMR LLC (2012-present) and is an employee of Fidelity Investments. Previously, Ms. Baumann served as Vice President and Deputy Anti-Money Laundering Officer (2007-2012). |
William C. Coffey (1969) |
Year of Election or Appointment: 2009 Assistant Secretary |
| Mr. Coffey also serves as Assistant Secretary of other funds. He is Senior Vice President and Deputy General Counsel of FMR LLC (2010-present), and is an employee of Fidelity Investments. Previously, Mr. Coffey served as Vice President and Associate General Counsel of FMR LLC (2005-2009). |
Jonathan Davis (1968) |
Year of Election or Appointment: 2010 Assistant Treasurer |
| Mr. Davis also serves as Assistant Treasurer of other funds. Mr. Davis is an employee of Fidelity Investments. Previously, Mr. Davis served as Vice President and Associate General Counsel of FMR LLC (2003-2010). |
Adrien E. Deberghes (1967) |
Year of Election or Appointment: 2008 Deputy Treasurer |
| Mr. Deberghes also serves as an officer of other funds. He is an employee of Fidelity Investments (2008-present). Prior to joining Fidelity Investments, Mr. Deberghes was Senior Vice President of Mutual Fund Administration at State Street Corporation (2007-2008), Senior Director of Mutual Fund Administration at Investors Bank & Trust (2005-2007), and Director of Finance for Dunkin' Brands (2000-2005). |
Stephanie J. Dorsey (1969) |
Year of Election or Appointment: 2010 Assistant Treasurer |
| Ms. Dorsey also serves as an officer of other funds. She is an employee of Fidelity Investments (2008-present) and has served in other fund officer roles. Prior to joining Fidelity Investments, Ms. Dorsey served as Treasurer (2004-2008) of the JPMorgan Mutual Funds and Vice President (2004-2008) of JPMorgan Chase Bank. |
Scott C. Goebel (1968) |
Year of Election or Appointment: 2008 Secretary and Chief Legal Officer (CLO) |
| Mr. Goebel serves as Secretary and CLO of other funds. Mr. Goebel also serves as Secretary of Fidelity Investments Money Management, Inc. (FIMM) (2010-present) and Fidelity Research and Analysis Company (FRAC) (2010-present); General Counsel, Secretary, and Senior Vice President of FMR (2008-present) and FMR Co., Inc. (2008-present); Chief Legal Officer of Fidelity Management & Research (Hong Kong) Limited (2008-present) and Assistant Secretary of Fidelity Management & Research (Japan) Inc. (2008-present), and Fidelity Management & Research (U.K.) Inc. (2008-present). Previously, Mr. Goebel served as Secretary and CLO of other Fidelity funds (2008-2013), Assistant Secretary of FIMM (2008-2010), FRAC (2008-2010), and certain funds (2007-2008); and as Vice President and Secretary of Fidelity Distributors Corporation (FDC) (2005-2007). Mr. Goebel has been employed by FMR LLC or an affiliate since 2001. |
Joseph A. Hanlon (1968) |
Year of Election or Appointment: 2012 Chief Compliance Officer |
| Mr. Hanlon also serves as Chief Compliance Officer of other funds. Mr. Hanlon serves as Compliance Officer of FMR, FMR Co., Inc., Fidelity Investments Money Management, Inc. (FIMM), Fidelity Research and Analysis Company (FRAC), and Fidelity Management & Research (Hong Kong) (2009-present), as Senior Vice President of the Fidelity Asset Management Division (2009-present), and is an employee of Fidelity Investments. Previously, Mr. Hanlon served as Compliance Officer of Fidelity Management & Research (Japan) Inc. (2009-2013), Strategic Advisers, Inc. (2009-2013), and Fidelity Management & Research (U.K.) Inc. (2009-2013). |
Bruce T. Herring (1965) |
Year of Election or Appointment: 2006 Vice President of certain Equity Funds |
| Mr. Herring also serves as Vice President of other funds. He serves as Chief Investment Officer of Fidelity Global Asset Allocation (GAA) (2013-present), Chief Investment Officer and Director of Fidelity Management & Research (U.K.) Inc. (2010-present), Group Chief Investment Officer of FMR, and President of Fidelity Research & Analysis Company (2010-present). Previously, Mr. Herring served as Vice President (2005-2006) and Senior Vice President (2006-2007) of Fidelity Management & Research Company, Vice President of FMR Co., Inc. (2001-2007), and as a portfolio manager for Fidelity U.S. Equity Funds. |
Brian B. Hogan (1964) |
Year of Election or Appointment: 2009 Vice President |
| Mr. Hogan also serves as Vice President of other funds. Mr. Hogan serves as President of FMR's Equity Division (2009-present). Previously, Mr. Hogan served as Senior Vice President, Equity Research of FMR (2006-2009) and as a portfolio manager. |
Chris Maher (1972) |
Year of Election or Appointment: 2013 Assistant Treasurer |
| Mr. Maher serves as Assistant Treasurer of other funds. Mr. Maher is Vice President of Valuation Oversight and is an employee of Fidelity Investments. Previously, Mr. Maher served as Vice President of Asset Management Compliance (2013), Vice President of FMR's Program Management Group (2010-2013), and Vice President of Valuation Oversight (2008-2010). |
Christine Reynolds (1958) |
Year of Election or Appointment: 2008 Chief Financial Officer |
| Ms. Reynolds also serves as Chief Financial Officer of other funds. Ms. Reynolds became President of Fidelity Pricing and Cash Management Services (FPCMS) in August 2008. Ms. Reynolds served as Chief Operating Officer of FPCMS (2007-2008). Previously, Ms. Reynolds served as President, Treasurer, and Anti-Money Laundering officer of the Fidelity funds (2004-2007). |
Kenneth B. Robins (1969) |
Year of Election or Appointment: 2008 President and Treasurer |
| Mr. Robins also serves as an officer of other funds. Mr. Robins serves as Executive Vice President of Fidelity Investments Money Management, Inc. (FIMM) (2013-present) and is an employee of Fidelity Investments (2004-present). Previously, Mr. Robins served in other fund officer roles. |
Gary W. Ryan (1958) |
Year of Election or Appointment: 2005 Assistant Treasurer |
| Mr. Ryan also serves as Assistant Treasurer of other funds. Mr. Ryan is an employee of Fidelity Investments and has served in other fund officer roles. Previously, Mr. Ryan served as Vice President of Fund Reporting in Fidelity Pricing and Cash Management Services (FPCMS) (1999-2005). |
Stephen Sadoski (1971) |
Year of Election or Appointment: 2012 Deputy Treasurer |
| Mr. Sadoski also serves as Deputy Treasurer of other funds. He is an employee of Fidelity Investments (2012-present) and has served in another fund officer role. Prior to joining Fidelity Investments, Mr. Sadoski served as an assistant chief accountant in the Division of Investment Management of the Securities and Exchange Commission (SEC) (2009-2012) and as a senior manager at Deloitte & Touche LLP (1997-2009). |
Stacie M. Smith (1974) |
Year of Election or Appointment: 2013 Deputy Treasurer |
| Ms. Smith also serves as an officer of other funds. She is an employee of Fidelity Investments (2009-present) and has served in other fund officer roles. Prior to joining Fidelity Investments, Ms. Smith served as Senior Audit Manager of Ernst & Young LLP (1996-2009). |
Renee Stagnone (1975) |
Year of Election or Appointment: 2013 Deputy Treasurer |
| Ms. Stagnone also serves as Deputy Treasurer of other funds. Ms. Stagnone is an employee of Fidelity Investments. |
Joseph F. Zambello (1957) |
Year of Election or Appointment: 2011 Deputy Treasurer |
| Mr. Zambello also serves as Deputy Treasurer of other funds. Mr. Zambello is an employee of Fidelity Investments. Previously, Mr. Zambello served as Vice President of FMR's Program Management Group (2009-2011) and Vice President of the Transfer Agent Oversight Group (2005-2009). |
Annual Report
The Board of Trustees of each fund voted to pay to shareholders of record at the opening of business on record date the following distributions per share derived from capital gains realized from sales of portfolio securities and dividends derived from net investment income:
| Pay Date | Record Date | Dividends | Capital Gains |
Fidelity Diversified International Fund | 12/09/13 | 12/06/13 | $0.318 | $0.234 |
Fidelity International Capital Appreciation Fund | 12/09/13 | 12/06/13 | $0.119 | $0.000 |
Fidelity Overseas Fund | 12/09/13 | 12/06/13 | $0.512 | $0.177 |
Fidelity Worldwide Fund | 12/09/13 | 12/06/13 | $0.087 | $1.979 |
The funds hereby designate as capital gain dividend the amounts noted below for the taxable year ended October 31, 2013, or, if subsequently determined to be different, the net capital gain of such year.
Fidelity Worldwide Fund | $66,159,543 |
A percentage of the dividends distributed during the fiscal year for the following funds may be taken into account as a dividend for purposes of the maximum rate under section 1(h) (11) of the Internal Revenue Code:
Fidelity Diversified International Fund | 92% |
Fidelity International Capital Appreciation Fund | 100% |
Fidelity Overseas Fund | 100% |
Fidelity Worldwide Fund | 100% |
A percentage of the dividends distributed during the fiscal year for the following funds qualifies for the dividends-received deduction for corporate shareholders:
| 12/07/12 | 12/27/12 |
Fidelity Diversified International Fund | 4% | 0.0% |
Fidelity International Capital Appreciation Fund | 21% | 62% |
Fidelity Overseas Fund | 2% | 0.0% |
Fidelity Worldwide Fund | 65% | 0.0% |
The amounts per share which represent income derived from sources within, and taxes paid to, foreign countries or possessions of the United States are as follows:
| Pay Date | Income | Taxes |
Fidelity Diversified International Fund | 12/10/12 | $0.441 | $0.0230 |
Fidelity International Capital Appreciation Fund | 12/10/12 | $0.117 | $0.0143 |
| 12/28/12 | $0.005 | $0.0000 |
Fidelity Overseas Fund | 12/10/12 | $0.550 | $0.0621 |
Fidelity Worldwide Fund | 12/10/12 | $0.000 | $0.0000 |
The funds will notify shareholders in January 2014 of amounts for use in preparing 2013 income tax returns.
Annual Report
Board Approval of Investment Advisory Contracts and Management Fees
Broadly Diversified International Equity Funds
Each year, the Board of Trustees, including the Independent Trustees (together, the Board), votes on the renewal of the management contract and sub-advisory agreements (together, the Advisory Contracts) for each fund. The Board, assisted by the advice of fund counsel and Independent Trustees' counsel, requests and considers a broad range of information relevant to the renewal of the Advisory Contracts throughout the year.
The Board meets regularly and, at each of its meetings, covers an extensive agenda of topics and materials and considers factors that are relevant to its annual consideration of the renewal of each fund's Advisory Contracts, including the services and support provided to each fund and its shareholders. The Board has established various standing committees, each composed of and chaired by Independent Trustees with varying backgrounds, to which the Board has assigned specific subject matter responsibilities in order to enhance effective decision-making by the Board. The Board, acting directly and through its Committees, requests and receives information concerning the annual consideration of the renewal of each fund's Advisory Contracts. The Board also meets as needed to consider matters specifically related to the Board's annual consideration of the renewal of Advisory Contracts. Members of the Board may also meet with trustees of other Fidelity funds through ad hoc joint committees to discuss certain matters relevant to the Fidelity funds.
At its July 2013 meeting, the Board, including the Independent Trustees, unanimously determined to renew each fund's Advisory Contracts. In reaching its determination, the Board considered all factors it believed relevant, including (i) the nature, extent, and quality of the services to be provided to each fund and its shareholders (including the investment performance of each fund); (ii) the competitiveness of each fund's management fee and total expense ratio relative to peer funds; (iii) the total costs of the services to be provided by and the profits to be realized by Fidelity from its relationship with each fund; (iv) the extent to which economies of scale exist and would be realized as each fund grows; and (v) whether fee levels reflect these economies of scale, if any, for the benefit of fund shareholders.
In considering whether to renew the Advisory Contracts for each fund, the Board reached a determination, with the assistance of fund counsel and Independent Trustees' counsel and through the exercise of its business judgment, that the renewal of the Advisory Contracts was in the best interests of each fund and its shareholders and that the compensation payable under the Advisory Contracts was fair and reasonable. The Board's decision to renew the Advisory Contracts was not based on any single factor, but rather was based on a comprehensive consideration of all the information provided to the Board at its meetings throughout the year. The Board, in reaching its determination to renew the Advisory Contracts, was aware that shareholders in each fund have a broad range of investment choices available to them, including a wide choice among mutual funds offered by Fidelity's competitors, and that each fund's shareholders, who have the opportunity to review and weigh the disclosure provided by the fund in its prospectus and other public disclosures, have chosen to invest in that fund, which is a part of the Fidelity family of funds.
Nature, Extent, and Quality of Services Provided. The Board considered the staffing within the investment adviser, Fidelity Management & Research Company (FMR), and the sub-advisers (together, the Investment Advisers) as it relates to the funds, including the backgrounds of the funds' investment personnel, and also considered the funds' investment objectives, strategies, and related investment philosophies. The Independent Trustees also had discussions with senior management of Fidelity's investment operations and investment groups. The Board considered the structure of the portfolio manager compensation program and whether this structure provides appropriate incentives to act in the best interests of each fund.
Resources Dedicated to Investment Management and Support Services. The Board and the Fund Oversight and Research Committees reviewed the general qualifications and capabilities of the Investment Advisers' investment staff, including its size, education, experience, and resources, as well as the Investment Advisers' approach to recruiting, training, managing, and compensating investment personnel. The Board noted that FMR has continued to increase the resources devoted to non-U.S. offices, including expansion of Fidelity's global investment organization. The Board also noted that Fidelity's analysts have extensive resources, tools and capabilities that allow them to conduct sophisticated quantitative and fundamental analysis, as well as credit analysis of issuers, counterparties and guarantors. Further, the Board believes that Fidelity's investment professionals have sufficient access to global information and data so as to provide competitive investment results over time, and that those professionals also have access to sophisticated tools that permit them to assess portfolio construction and risk and performance attribution characteristics continuously, as well as to transmit new information and research conclusions rapidly around the world. Additionally, in its deliberations, the Board considered the Investment Advisers' trading and risk management capabilities and resources, which are an integral part of the investment management process.
Shareholder and Administrative Services. The Board considered (i) the nature, extent, quality, and cost of advisory, administrative, and shareholder services performed by the Investment Advisers and their affiliates under the Advisory Contracts and under separate agreements covering transfer agency, pricing and bookkeeping, and securities lending services for each fund; (ii) the nature and extent of the supervision of third party service providers, principally custodians and subcustodians; and (iii) the resources devoted to, and the record of compliance with, each fund's compliance policies and procedures. The Board also reviewed the allocation of fund brokerage, including allocations to brokers affiliated with the Investment Advisers, the use of brokerage commissions to pay fund expenses, and the use of "soft" commission dollars to pay for research services.
The Board noted that the growth of fund assets over time across the complex allows Fidelity to reinvest in the development of services designed to enhance the value or convenience of the Fidelity funds as investment vehicles. These services include 24-hour access to account information and market information through telephone representatives and over the Internet, investor education materials and asset allocation tools, and the expanded availability of Fidelity Investor Centers.
Annual Report
Board Approval of Investment Advisory Contracts and Management Fees - continued
Investment in a Large Fund Family. The Board considered the benefits to shareholders of investing in a Fidelity fund, including the benefits of investing in a fund that is part of a large family of funds offering a variety of investment disciplines and providing a large variety of mutual fund investor services. The Board noted that Fidelity had taken, or had made recommendations that resulted in the Fidelity funds taking, a number of actions over the previous year that benefited particular funds, including (i) continuing to dedicate additional resources to investment research and to the support of the senior management team that oversees asset management; (ii) persisting in efforts to enhance Fidelity's global research capabilities; (iii) launching new funds and making other enhancements to meet client needs for global and income-oriented solutions; (iv) continuing to launch dedicated lower cost underlying funds to meet portfolio construction needs related to expanding underlying fund options for Fidelity funds of funds, specifically for the Freedom Fund product lines; (v) rationalizing product lines and gaining increased efficiencies through the mergers of several funds into other funds; (vi) strengthening Fidelity's index fund offerings by reducing investment minimums and adopting or lowering existing expense caps for certain funds and classes; (vii) enhancing Global Asset Allocation product offerings by launching new funds and strategies, including "open architecture" target date funds that utilize affiliated and unaffiliated sub-advisers; (viii) modifying the eligibility criteria for Institutional Class shares of Advisor funds to increase their marketability to a portion of the defined contribution plan market; (ix) creating a new low-cost retirement share class for certain Advisor funds to appeal to large retirement plans; (x) transitioning the management of certain Fidelity commodity funds to Geode Capital Management LLC, a registered commodity pool operator, while retaining administrative responsibilities for the funds; (xi) reorganizing a number of funds; and (xii) taking steps toward establishing a new Fidelity adviser to manage sector-based funds and products.
Investment Performance. The Board considered whether each fund has operated in accordance with its investment objective, as well as its record of compliance with its investment restrictions and its performance history. The Board noted that there was a portfolio management change for Fidelity Overseas Fund in January 2012.
The Board took into account discussions with the Investment Advisers about fund investment performance that occur at Board meetings throughout the year. In this regard the Board noted that as part of regularly scheduled fund reviews and other reports to the Board on fund performance, the Board periodically considers annualized return information for each fund, for different time periods, measured against a securities market index ("benchmark index") and a peer group of mutual funds with similar objectives ("peer group"). In its evaluation of fund investment performance, the Board gave particular attention to information indicating changes in performance of certain Fidelity funds for specific time periods and the Investment Advisers' explanations for any overperformance or underperformance.
In addition to reviewing absolute and relative fund performance, the Independent Trustees periodically consider the appropriateness of fund performance metrics in evaluating the results achieved. In general, the Independent Trustees believe that fund performance should be evaluated based on net performance (after fees and expenses) of both the highest performing and lowest performing classes, where applicable, compared to appropriate benchmark indices, over appropriate time periods which may include full market cycles, and compared to peer groups, as applicable, over the same periods, taking into account relevant factors including the following: general market conditions; issuer-specific information; tactical opportunities for investment; and fund cash flows and other factors.
The Independent Trustees recognize that shareholders evaluate performance on a net basis over their own holding periods, for which one-, three-, and five-year periods are used as a proxy. For this reason, the performance information reviewed by the Board also included net cumulative calendar year total return information for each fund and an appropriate benchmark index and peer group for the most recent one-, three-, and five-year periods, as shown below. Returns are shown compared to the 25th percentile (top of box) and 75th percentile (bottom of box) of the peer universe. Returns of the benchmark index are "net MA," i.e., adjusted for tax withholding rates applicable to U.S.-based mutual funds organized as Massachusetts business trusts.
Annual Report
Fidelity Diversified International Fund

Fidelity International Capital Appreciation Fund
Annual Report
Board Approval of Investment Advisory Contracts and Management Fees - continued
Fidelity Overseas Fund
Fidelity Worldwide Fund

The Board also considered that each fund's management fee is subject to upward or downward adjustment depending upon whether, and to what extent, the fund's investment performance for the performance period exceeds, or is exceeded by, a securities index, thus leading to a performance adjustment for the same period. The Board noted that the performance adjustment provides FMR with a strong economic incentive to seek to achieve superior performance for each fund's shareholders and helps to more closely align the interests of FMR and each fund's shareholders.
Based on its review, the Board concluded that the nature, extent, and quality of services provided to each fund under the Advisory Contracts should benefit each fund's shareholders.
Competitiveness of Management Fee and Total Expense Ratio. The Board considered each fund's management fee and total expense ratio compared to "mapped groups" of competitive funds and classes. Fidelity creates "mapped groups" by combining similar Lipper investment objective categories that have comparable management fee characteristics. Combining Lipper investment objective categories aids the Board's management fee and total expense ratio comparisons by broadening the competitive group used for comparison and by reducing the number of universes to which various Fidelity funds are compared.
Management Fee. The Board considered two proprietary management fee comparisons for the 12-month periods shown in the charts below. The group of Lipper funds used by the Board for management fee comparisons is referred to below as the "Total Mapped Group." The Total Mapped Group comparison focuses on a fund's standing in terms of gross management fees before expense reimbursements or caps, and without giving effect to the fund's performance adjustment, relative to the total universe of funds with comparable investment mandates, regardless of whether their management fee structures also are comparable. Funds with comparable investment mandates offer exposure to similar types of securities. Funds with comparable management fee structures have similar management fee contractual arrangements (e.g., flat rate charged for advisory services, all-inclusive fee rate, etc.). "TMG %" represents the percentage of funds in the Total Mapped Group that had management fees that were lower than a fund's. For example, a TMG % of 16% means that 84% of the funds in the Total Mapped Group had higher management fees than a fund. The "Asset-Size Peer Group" (ASPG) comparison focuses on a fund's standing relative to a subset of non-Fidelity funds within the Total Mapped Group that are similar in size and management fee structure. The ASPG represents at least 15% of the funds in the Total Mapped Group with comparable asset size and management fee structures, subject to a minimum of 50 funds (or all funds in the Total Mapped Group if fewer than 50). Additional information, such as the ASPG quartile in which a fund's management fee ranked and the impact of a fund's performance adjustment, is also included in the charts and considered by the Board.
Annual Report
Fidelity Diversified International Fund

Fidelity International Capital Appreciation Fund
Annual Report
Board Approval of Investment Advisory Contracts and Management Fees - continued
Fidelity Overseas Fund
Fidelity Worldwide Fund

The Board noted that each fund's management fee ranked below the median of its Total Mapped Group and below the median of its ASPG for 2012. The Board also noted the effect of each of Fidelity Diversified International Fund's, Fidelity International Capital Appreciation Fund's, and Fidelity Worldwide Fund's positive performance adjustment and Fidelity Overseas Fund's negative performance adjustment on the fund's management fee ranking.
Based on its review, the Board concluded that each fund's management fee is fair and reasonable in light of the services that the fund receives and the other factors considered.
Total Expense Ratio. In its review of Fidelity International Capital Appreciation Fund's total expense ratio, the Board considered the fund's management fee as well as other fund expenses, such as transfer agent fees, pricing and bookkeeping fees, and custodial, legal, and audit fees. The Board also noted the effects of any waivers and reimbursements on fees and expenses, as well as the impact of the fund's performance adjustment. As part of its review, the Board also considered the current and historical total expense ratios of the fund compared to competitive fund median expenses. The fund is compared to those funds and classes in the Total Mapped Group (used by the Board for management fee comparisons) that have a similar sales load structure.
In its review of the total expense ratio of each class of each of Fidelity Diversified International Fund, Fidelity Overseas Fund, and Fidelity Worldwide Fund, the Board considered the fund's management fee as well as other fund or class expenses, as applicable, such as transfer agent fees, pricing and bookkeeping fees, fund-paid 12b-1 fees (in the case of Fidelity Worldwide Fund), and custodial, legal, and audit fees. The Board also noted the effects of any waivers and reimbursements on fees and expenses, as well as the impact of each fund's performance adjustment. As part of its review, the Board also considered the current and historical total expense ratios of each class of each fund compared to competitive fund median expenses. Each class of each fund is compared to those funds and classes in the Total Mapped Group (used by the Board for management fee comparisons) that have a similar sales load structure.
Annual Report
The Board noted that the total expense ratio of Fidelity International Capital Appreciation Fund and each class of each of Fidelity Diversified International Fund and Fidelity Overseas Fund ranked below its competitive median for 2012.
The Board noted that the total expense ratio of each of Class A, Class B, and the retail class of Fidelity Worldwide Fund ranked below its competitive median for 2012 and the total expense ratio of each of Class T, Class C, and Institutional Class ranked above its competitive median for 2012. The Board considered that, in general, various factors can affect total expense ratios. The Board noted that the total expense ratio of Class T was above the competitive median primarily because of higher 12b-1 fees on Class T. Class T has a higher 12b-1 fee, but a lower front-end sales charge, than traditionally priced front-end sales charge classes. The Board considered that Class T is primarily sold load-waived in the retirement plan market where its 0.50% 12b-1 fee is comparable to competing no-load, higher 12b-1 fee classes designed specifically for retirement plans. The Board noted that the fund offers multiple classes, each of which has a different sales load and 12b-1 fee structure, and that the multiple structures are intended to offer a range of pricing options for the intermediary market. The Board also noted that the total expense ratios of the classes vary primarily by the level of their 12b-1 fees, although differences in transfer agent fees may also cause expenses to vary from class to class.
Fees Charged to Other Fidelity Clients. The Board also considered Fidelity fee structures and other information with respect to clients of FMR and its affiliates, such as other mutual funds advised or subadvised by FMR or its affiliates, pension plan clients, and other institutional clients. The Board noted the findings of the 2013 ad hoc joint committee (created with the board of other Fidelity funds), which reviewed and compared Fidelity's institutional investment advisory business with its business of providing services to the Fidelity funds, including the differences in services provided, fees charged, and costs incurred, as well as competition in their respective marketplaces.
Based on its review of total expense ratios and fees charged to other Fidelity clients, the Board concluded that the total expense ratio of Fidelity International Capital Appreciation Fund and the total expense ratio of each class of Fidelity Diversified International Fund, Fidelity Overseas Fund, and Fidelity Worldwide Fund were reasonable, although in some cases above the median of the universe presented for comparison, in light of the services that each fund and its shareholders receive and the other factors considered.
Costs of the Services and Profitability. The Board considered the revenues earned and the expenses incurred by Fidelity in conducting the business of developing, marketing, distributing, managing, administering and servicing each fund and servicing each fund's shareholders. The Board also considered the level of Fidelity's profits in respect of all the Fidelity funds.
On an annual basis, FMR presents to the Board Fidelity's profitability for each fund. Fidelity calculates the profitability for each fund, as well as aggregate profitability for groups of Fidelity funds and all Fidelity funds, using a series of detailed revenue and cost allocation methodologies which originate with the books and records of Fidelity on which Fidelity's audited financial statements are based. The Audit Committee of the Board reviews any significant changes from the prior year's methodologies.
PricewaterhouseCoopers LLP (PwC), independent registered public accounting firm and auditor to Fidelity and certain Fidelity funds, has been engaged annually by the Board as part of the Board's assessment of Fidelity's profitability analysis. PwC's engagement includes the review and assessment of the methodologies used by Fidelity in determining the revenues and expenses attributable to Fidelity's mutual fund business, and completion of agreed-upon procedures surrounding the mathematical accuracy of fund profitability and its conformity to allocation methodologies. After considering PwC's reports issued under the engagement and information provided by Fidelity, the Board concluded that while other allocation methods may also be reasonable, Fidelity's profitability methodologies are reasonable in all material respects.
The Board also reviewed Fidelity's non-fund businesses and fall-out benefits related to the mutual fund business as well as cases where Fidelity's affiliates may benefit from or be related to the funds' business.
The Board considered the costs of the services provided by and the profits realized by Fidelity in connection with the operation of each fund and was satisfied that the profitability was not excessive in the circumstances.
Economies of Scale. The Board considered whether there have been economies of scale in respect of the management of the Fidelity funds, whether the Fidelity funds (including each fund) have appropriately benefited from any such economies of scale, and whether there is potential for realization of any further economies of scale. The Board considered the extent to which each fund will benefit from economies of scale through increased services to the fund, through waivers or reimbursements, or through fee or expense reductions. The Board also noted that in 2009, it and the board of other Fidelity funds created an ad hoc committee (the Economies of Scale Committee) to analyze whether FMR attains economies of scale in respect of the management and servicing of the Fidelity funds, whether the Fidelity funds have appropriately benefited from such economies of scale, and whether there is potential for realization of any further economies of scale.
Annual Report
Board Approval of Investment Advisory Contracts and Management Fees - continued
The Board recognized that each fund's management contract incorporates a "group fee" structure, which provides for lower group fee rates as total fund assets under FMR's management increase, and for higher group fee rates as total fund assets under FMR's management decrease. FMR calculates the group fee rates based on a tiered asset "breakpoint" schedule that varies based on asset class. The Board considered that the group fee is designed to deliver the benefits of economies of scale to fund shareholders when total Fidelity fund assets increase, even if assets of any particular fund are unchanged or have declined, because some portion of Fidelity's costs are attributable to services provided to all Fidelity funds, and all funds benefit if those costs can be allocated among more assets. The Board concluded that, given the group fee structure, fund shareholders will benefit from lower management fees as assets under FMR's management increase at the fund complex level, regardless of whether Fidelity achieves any such economies of scale.
The Board concluded, taking into account the analysis of the Economies of Scale Committee, that economies of scale, if any, are being appropriately shared between fund shareholders and Fidelity.
Amendment to Description of Group Fee Rate. At its July 2013 meeting, the Board voted to approve an amendment to each fund's management contract to modify the description of the "group fee rate" effective August 1, 2013. The Board noted that under the prior description in the contract, the group fee rate was based on the average net assets of all registered investment companies with which FMR has management contracts. Under the contract's tiered asset breakpoint schedule, the group fee rate is lower as total fund assets under FMR's management increase, and higher as total fund assets under FMR's management decrease. The Board considered that the prior description would have excluded the assets of 64 Fidelity sector funds from the group fee rate calculation once Fidelity SelectCo, LLC, an affiliate of FMR, assumed management responsibilities for those funds. The Board noted that modifying the description of the group fee rate to continue to include the assets of those 64 funds for purposes of determining group fee rate breakpoints would avoid an immediate adverse impact on the group fee rate for any fund.
Additional Information Requested by the Board. In order to develop fully the factual basis for consideration of the Fidelity funds' Advisory Contracts, the Board requested and received additional information on certain topics, including: (i) fund performance trends and Fidelity's long-term strategies for certain funds; (ii) the potential to further rationalize the Fidelity fund lineup with the possibility of achieving savings for the funds and Fidelity; (iii) the methodology with respect to competitive fund data and peer group classifications; (iv) the arrangements with, and performance of, certain sub-advisers on behalf of the Fidelity funds, as well as certain proposed participating affiliate arrangements; (v) the realization of fall-out benefits in certain Fidelity business units; (vi) Fidelity's group fee structures, including the rationale for the individual fee rates of certain categories of funds and the definition of group assets; (vii) trends regarding industry use of performance fee structures and the performance adjustment methodologies applicable to the Fidelity funds; (viii) additional competitive analysis regarding the total expenses for certain classes; and (ix) fund profitability methodology, including Fidelity's cost allocation methodology, and the impact of certain factors on fund profitability results.
Based on its evaluation of all of the conclusions noted above, and after considering all factors it believed relevant, the Board ultimately concluded that the advisory fee structures are fair and reasonable, and that each fund's Advisory Contracts should be renewed.
Annual Report
Investment Adviser
Fidelity Management & Research Company
Boston, MA
Investment Sub-Advisers
FMR Co., Inc.
Fidelity Management & Research
(U.K.) Inc.
Fidelity Management & Research
(Hong Kong) Limited
Fidelity Management & Research
(Japan) Inc.
FIL Investments (Japan) Limited
FIL Investment Advisors
FIL Investment Advisors
(UK) Limited
General Distributor
Fidelity Distributors Corporation
Smithfield, RI
Transfer and Service Agents
Fidelity Investments Institutional
Operations Company, Inc.
Boston, MA
Fidelity Service Company, Inc.
Boston, MA
Custodians
JPMorgan Chase Bank
New York, NY
Fidelity Diversified International Fund, Fidelity Overseas Fund, and Fidelity Worldwide Fund
The Northern Trust Company
Chicago, IL
Fidelity International Capital Appreciation Fund
Corporate Headquarters
245 Summer Street
Boston, MA 02210
www.fidelity.com
The Fidelity Telephone Connection
Mutual Fund 24-Hour Service
Exchanges/Redemptions
and Account Assistance 1-800-544-6666
Product Information 1-800-544-6666
Retirement Accounts 1-800-544-4774
(8 a.m. - 9 p.m.)
TDD Service 1-800-544-0118
for the deaf and hearing impaired
(9 a.m. - 9 p.m. Eastern time)
Fidelity Automated Service
Telephone (FAST®)
1-800-544-5555
Automated line for quickest service
IBD-UANNPRO-1213
1.784774.110
Fidelity®
Diversified International
Fund -
Class K
Annual Report
October 31, 2013
(Fidelity Cover Art)
Contents
Performance | (Click Here) | How the fund has done over time. |
Management's Discussion of Fund Performance | (Click Here) | The Portfolio Manager's review of fund performance and strategy. |
Shareholder Expense Example | (Click Here) | An example of shareholder expenses. |
Investment Changes | (Click Here) | A summary of major shifts in the fund's investments over the past six months. |
Investments | (Click Here) | A complete list of the fund's investments with their market values. |
Financial Statements | (Click Here) | Statements of assets and liabilities, operations, and changes in net assets, as well as financial highlights. |
Notes | (Click Here) | Notes to the financial statements. |
Report of Independent Registered Public Accounting Firm | (Click Here) | |
Trustees and Officers | (Click Here) | |
Distributions | (Click Here) | |
Board Approval of Investment Advisory Contracts and Management Fees | (Click Here) | |
To view a fund's proxy voting guidelines and proxy voting record for the 12-month period ended June 30, visit http://www.fidelity.com/proxyvotingresults or visit the Securities and Exchange Commission's (SEC) web site at http://www.sec.gov. You may also call 1-800-835-5092 to request a free copy of the proxy voting guidelines.
Standard & Poor's, S&P and S&P 500 are registered service marks of The McGraw-Hill Companies, Inc. and have been licensed for use by Fidelity Distributors Corporation.
Other third-party marks appearing herein are the property of their respective owners.
All other marks appearing herein are registered or unregistered trademarks or service marks of FMR LLC or an affiliated company. © 2013 FMR LLC. All rights reserved.
This report and the financial statements contained herein are submitted for the general information of the shareholders of the fund. This report is not authorized for distribution to prospective investors in the fund unless preceded or accompanied by an effective prospectus.
A fund files its complete schedule of portfolio holdings with the SEC for the first and third quarters of each fiscal year on Form N-Q. Forms N-Q are available on the SEC's web site at http://www.sec.gov. A fund's Forms N-Q may be reviewed and copied at the SEC's Public Reference Room in Washington, DC. Information regarding the operation of the SEC's Public Reference Room may be obtained by calling 1-800-SEC-0330. For a complete list of a fund's portfolio holdings, view the most recent holdings listing, semiannual report, or annual report on Fidelity's web site at http://www.fidelity.com, http://www.advisor.fidelity.com, or http://www.401k.com, as applicable.
NOT FDIC INSURED • MAY LOSE VALUE • NO BANK GUARANTEE
Neither the fund nor Fidelity Distributors Corporation is a bank.
Annual Report
Average annual total return reflects the change in the value of an investment, assuming reinvestment of the class' distributions from dividend income and capital gains (the profits earned upon the sale of securities that have grown in value, if any) and assuming a constant rate of performance each year. The $10,000 table and the fund's returns do not reflect the deduction of taxes that a shareholder would pay on fund distributions or the redemption of fund shares. During periods of reimbursement by Fidelity, a fund's total return will be greater than it would be had the reimbursement not occurred. How a fund did yesterday is no guarantee of how it will do tomorrow.
Average Annual Total Returns
Periods ended October 31, 2013 | Past 1
year | Past 5
years | Past 10
years |
Class K A | 25.86% | 12.38% | 7.96% |
A The initial offering of Class K shares took place on May 9, 2008. Returns prior to May 9, 2008, are those of Fidelity® Diversified International Fund, the original class of the fund.
$10,000 Over 10 Years
Let's say hypothetically that $10,000 was invested in Fidelity® Diversified International Fund - Class K on October 31, 2003. The chart shows how the value of your investment would have changed, and also shows how the MSCI® EAFE® Index performed over the same period. See footnote A above for additional information regarding the performance of Class K.
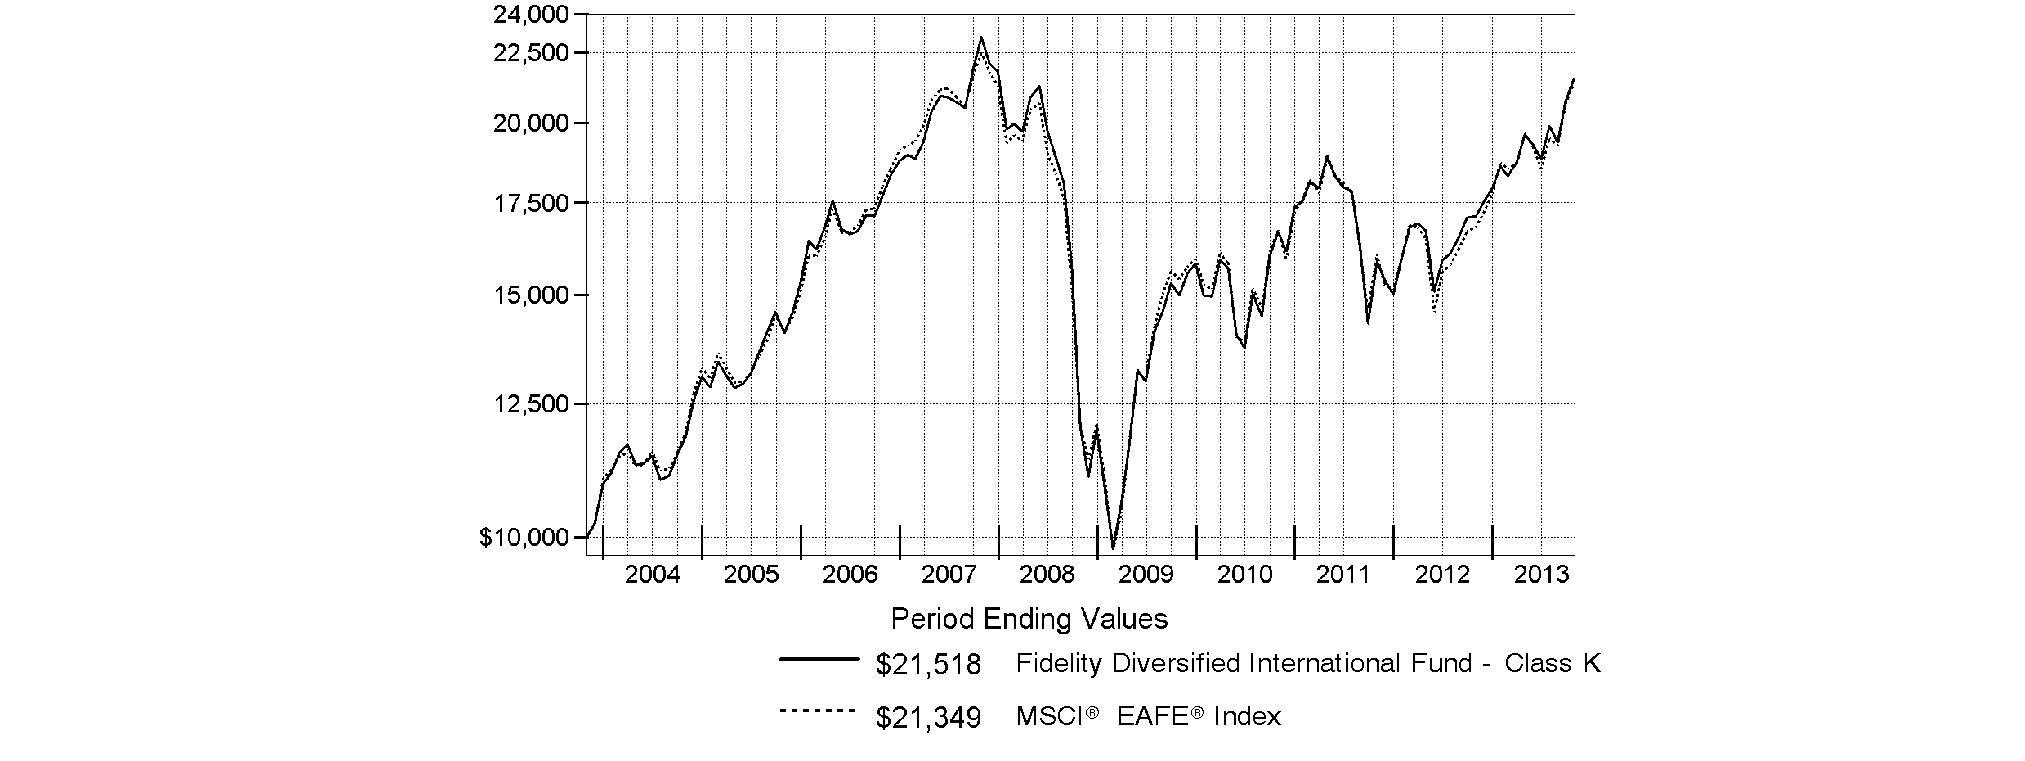
Annual Report
Market Recap: On balance, global equity markets remained upbeat for the 12-month period ending October 31, 2013. The MSCI® ACWI® (All Country World Index) Index gained 23.75% for the period, amid investor preference for higher-risk assets. The period was not without turbulence, however. In the spring and summer, central banks worldwide, especially in the U.S. and China, made clear their intentions to maintain accommodative monetary policies. That stance, combined with modest cyclical improvements around the globe and generally low valuations, underpinned the broad rally in equities. Europe (+32%) shone brightly, with most markets in the region - large and small - registering solid, index-beating gains. Another bright spot was Japan, which, despite a struggling yen and taking a second-half breather, posted a 34% result for the full year. The U.S. - by far the index's biggest constituent - also outperformed the global market with a roughly 28% advance. Meanwhile, Asia-Pacific ex Japan (+14%) lagged, hurt in part by a slowdown in Australia's mining industry as well as currency headwinds. Foreign-exchange and commodity weakness also curbed results in resource-heavy Canada and emerging markets (EM), both of which were up 7%. Country-level EM performance diverged meaningfully for the period, as evidenced by performance in Brazil (-1%), Russia (+12%), India (+1%) and China (+8%).
Comments from William Bower, Portfolio Manager of Fidelity® Diversified International Fund: For the year, the fund's Class K shares gained 25.86%, lagging the 27.02% return of the MSCI® EAFE® Index. Security selection in Europe and among banks and automotive-related stocks hurt the fund the most versus the index, followed by exposure to weak-performing emerging markets and a modest cash position, held for liquidity purposes. Conversely, some good picks in the U.K. and Japan and among gaming and Internet-related stocks helped narrow the performance gap. Among specific fund positions, underweighting Toyota Motor and Daimler detracted, while overweighting ORIX and SoftBank, both based in Japan, helped. I favored Honda over Toyota because of its motorcycles business and its finance facility, and because I thought the recovery in margins looked a little better for Honda. I was wrong: Toyota recovered quite sharply. I avoided Daimler because I think it has not executed as well as Volkswagen. VW is the biggest carmaker in China that is not locally owned, and China accounts for a good part of VW's earnings. I maintained the fund's automotive positioning through period end.
The views expressed above reflect those of the portfolio manager(s) only through the end of the period as stated on the cover of this report and do not necessarily represent the views of Fidelity or any other person in the Fidelity organization. Any such views are subject to change at any time based upon market or other conditions and Fidelity disclaims any responsibility to update such views. These views may not be relied on as investment advice and, because investment decisions for a Fidelity fund are based on numerous factors, may not be relied on as an indication of trading intent on behalf of any Fidelity fund.
Annual Report
Fidelity Diversified International Fund
As a shareholder of the Fund, you incur two types of costs: (1) transaction costs, including redemption fees and (2) ongoing costs, including management fees and other Fund expenses. This Example is intended to help you understand your ongoing costs (in dollars) of investing in the Fund and to compare these costs with the ongoing costs of investing in other mutual funds.
The Example is based on an investment of $1,000 invested at the beginning of the period and held for the entire period (May 1, 2013 to October 31, 2013).
Actual Expenses
The first line of the accompanying table for each class of the Fund provides information about actual account values and actual expenses. You may use the information in this line, together with the amount you invested, to estimate the expenses that you paid over the period. Simply divide your account value by $1,000.00 (for example, an $8,600 account value divided by $1,000.00 = 8.6), then multiply the result by the number in the first line for a class of the Fund under the heading entitled "Expenses Paid During Period" to estimate the expenses you paid on your account during this period. A small balance maintenance fee of $12.00 that is charged once a year may apply for certain accounts with a value of less than $2,000. This fee is not included in the table below. If it was, the estimate of expenses you paid during the period would be higher, and your ending account value lower, by this amount. In addition, the Fund, as a shareholder in the underlying Fidelity Central Funds, will indirectly bear its pro-rata share of the fees and expenses incurred by the underlying Fidelity Central Funds. These fees and expenses are not included in the Fund's annualized expense ratio used to calculate the expense estimate in the table below.
Hypothetical Example for Comparison Purposes
The second line of the accompanying table for each class of the Fund provides information about hypothetical account values and hypothetical expenses based on a Class' actual expense ratio and an assumed rate of return of 5% per year before expenses, which is not the Class' actual return. The hypothetical account values and expenses may not be used to estimate the actual ending account balance or expenses you paid for the period. You may use this information to compare the ongoing costs of investing in the Fund and other funds. To do so, compare this 5% hypothetical example with the 5% hypothetical examples that appear in the shareholder reports of the other funds. A small balance maintenance fee of $12.00 that is charged once a year may apply for certain accounts with a value of less than $2,000. This fee is not included in the table below. If it was, the estimate of expenses you paid during the period would be higher, and your ending account value lower, by this amount. In addition, the Fund, as a shareholder in the underlying Fidelity Central Funds, will indirectly bear its pro-rata share of the fees and expenses incurred by the underlying Fidelity Central Funds. These fees and expenses are not included in the Fund's annualized expense ratio used to calculate the expense estimate in the table below.
Please note that the expenses shown in the table are meant to highlight your ongoing costs only and do not reflect any transaction costs. Therefore, the second line of the table is useful in comparing ongoing costs only, and will not help you determine the relative total costs of owning different funds. In addition, if these transactional costs were included, your costs would have been higher.
| Annualized
Expense RatioB | Beginning
Account Value
May 1, 2013 | Ending
Account Value
October 31, 2013 | Expenses Paid
During Period*
May 1, 2013
to October 31, 2013 |
Diversified International | .94% | | | |
Actual | | $ 1,000.00 | $ 1,096.20 | $ 4.97 |
HypotheticalA | | $ 1,000.00 | $ 1,020.47 | $ 4.79 |
Class K | .81% | | | |
Actual | | $ 1,000.00 | $ 1,097.30 | $ 4.28 |
HypotheticalA | | $ 1,000.00 | $ 1,021.12 | $ 4.13 |
A 5% return per year before expenses
B Annualized expense ratio reflects expenses net of applicable fee waivers.
* Expenses are equal to each Class' annualized expense ratio, multiplied by the average account value over the period, multiplied by 184/365 (to reflect the one-half year period).
Annual Report
Fidelity Diversified International Fund
Investment Changes (Unaudited)
Geographic Diversification (% of fund's net assets) |
As of October 31, 2013 |
 | Japan | 17.2% | |
 | United Kingdom | 16.9% | |
 | United States of America* | 9.1% | |
 | Germany | 9.1% | |
 | France | 8.7% | |
 | Switzerland | 6.1% | |
 | Australia | 3.4% | |
 | Canada | 2.9% | |
 | Spain | 2.8% | |
 | Other | 23.8% | |

* Includes Short-Term Investments and Net Other Assets (Liabilities). |
Percentages are based on country or territory of incorporation and are adjusted for the effect of futures contracts, if applicable. |
As of April 30, 2013 |
| United Kingdom | 17.0% | |
| Japan | 15.6% | |
| United States of America* | 10.3% | |
| Germany | 9.6% | |
| France | 7.6% | |
| Switzerland | 5.5% | |
| Australia | 4.0% | |
| Canada | 3.1% | |
| Netherlands | 3.0% | |
| Other | 24.3% | |

* Includes Short-Term Investments and Net Other Assets (Liabilities). |
Percentages are based on country or territory of incorporation and are adjusted for the effect of futures contracts, if applicable. |
Asset Allocation as of October 31, 2013 |
| % of fund's
net assets | % of fund's net assets
6 months ago |
Stocks and Equity Futures | 97.8 | 95.3 |
Investment Companies | 0.3 | 0.5 |
Short-Term Investments and Net Other Assets (Liabilities) | 1.9 | 4.2 |
Top Ten Stocks as of October 31, 2013 |
| % of fund's
net assets | % of fund's net assets
6 months ago |
Sanofi SA (France, Pharmaceuticals) | 2.5 | 2.7 |
ORIX Corp. (Japan, Diversified Financial Services) | 2.1 | 1.9 |
HSBC Holdings PLC sponsored ADR (United Kingdom, Commercial Banks) | 1.8 | 2.0 |
Bayer AG (Germany, Pharmaceuticals) | 1.7 | 1.4 |
Anheuser-Busch InBev SA NV (Belgium, Beverages) | 1.6 | 1.6 |
SoftBank Corp. (Japan, Wireless Telecommunication Services) | 1.5 | 0.8 |
Japan Tobacco, Inc. (Japan, Tobacco) | 1.5 | 1.6 |
Novo Nordisk A/S Series B (Denmark, Pharmaceuticals) | 1.5 | 2.0 |
UBS AG (Switzerland, Capital Markets) | 1.3 | 1.1 |
Nestle SA (Switzerland, Food Products) | 1.3 | 1.8 |
| 16.8 | |
Market Sectors as of October 31, 2013 |
| % of fund's
net assets | % of fund's net assets
6 months ago |
Financials | 24.0 | 20.3 |
Consumer Discretionary | 17.6 | 15.2 |
Health Care | 12.9 | 13.5 |
Consumer Staples | 12.0 | 15.1 |
Information Technology | 8.5 | 8.5 |
Industrials | 7.3 | 6.9 |
Materials | 6.3 | 6.9 |
Telecommunication Services | 4.9 | 3.8 |
Energy | 3.4 | 4.2 |
Utilities | 0.3 | 0.0 |
Annual Report
Fidelity Diversified International Fund
Investments October 31, 2013
Showing Percentage of Net Assets
Common Stocks - 95.5% |
| Shares | | Value |
Australia - 3.4% |
Ansell Ltd. | 2,715,502 | | $ 50,022,190 |
Australia & New Zealand Banking Group Ltd. | 8,056,553 | | 257,679,791 |
BHP Billiton Ltd. sponsored ADR (d) | 4,306,764 | | 304,445,147 |
CSL Ltd. | 2,093,966 | | 137,548,281 |
Telstra Corp. Ltd. | 8,177,319 | | 40,035,148 |
Westfield Group unit | 8,390,026 | | 85,800,794 |
TOTAL AUSTRALIA | | 875,531,351 |
Austria - 0.2% |
Andritz AG | 675,900 | | 41,636,195 |
Bailiwick of Guernsey - 0.6% |
Resolution Ltd. | 29,452,783 | | 168,780,693 |
Bailiwick of Jersey - 1.8% |
Experian PLC | 9,868,172 | | 200,947,363 |
Shire PLC | 1,224,700 | | 54,303,735 |
Wolseley PLC | 1,424,607 | | 76,772,462 |
WPP PLC | 6,745,809 | | 143,315,049 |
TOTAL BAILIWICK OF JERSEY | | 475,338,609 |
Belgium - 2.7% |
Anheuser-Busch InBev SA NV | 4,048,330 | | 419,665,009 |
Anheuser-Busch InBev SA NV (strip VVPR) (a) | 5,250,900 | | 7,129 |
KBC Groupe SA | 4,332,813 | | 236,197,506 |
UCB SA | 698,200 | | 45,901,243 |
TOTAL BELGIUM | | 701,770,887 |
Bermuda - 0.1% |
Bunge Ltd. | 478,600 | | 39,307,418 |
Brazil - 0.3% |
Petroleo Brasileiro SA - Petrobras sponsored ADR | 1,594,800 | | 27,797,364 |
TIM Participacoes SA sponsored ADR | 1,924,200 | | 48,913,164 |
TOTAL BRAZIL | | 76,710,528 |
Canada - 2.9% |
Alimentation Couche-Tard, Inc. Class B (sub. vtg.) | 2,173,627 | | 147,222,499 |
Canadian Natural Resources Ltd. | 2,431,200 | | 77,157,635 |
CGI Group, Inc. Class A (sub. vtg.) (a) | 4,261,200 | | 142,959,551 |
Painted Pony Petroleum Ltd. (a)(e) | 3,912,270 | | 25,702,824 |
Painted Pony Petroleum Ltd. (a)(e)(f) | 1,460,500 | | 9,595,190 |
Potash Corp. of Saskatchewan, Inc. | 2,013,200 | | 62,559,517 |
Suncor Energy, Inc. | 3,362,300 | | 122,186,301 |
Tourmaline Oil Corp. (a) | 1,111,900 | | 43,115,252 |
TransForce, Inc. | 1,194,200 | | 26,446,150 |
Valeant Pharmaceuticals International, Inc. (Canada) (a) | 978,800 | | 103,404,613 |
TOTAL CANADA | | 760,349,532 |
Cayman Islands - 1.5% |
Baidu.com, Inc. sponsored ADR (a) | 868,884 | | 139,803,436 |
|
| Shares | | Value |
Sands China Ltd. | 22,466,000 | | $ 159,664,207 |
SINA Corp. (a) | 614,300 | | 51,330,908 |
Tencent Holdings Ltd. | 947,600 | | 51,725,051 |
TOTAL CAYMAN ISLANDS | | 402,523,602 |
Denmark - 1.6% |
Genmab A/S (a) | 883,200 | | 38,345,825 |
Novo Nordisk A/S Series B | 2,288,739 | | 381,195,520 |
TOTAL DENMARK | | 419,541,345 |
Finland - 0.3% |
Sampo Oyj (A Shares) | 1,449,300 | | 68,656,091 |
France - 8.7% |
Air Liquide SA | 449,100 | | 61,159,482 |
Arkema SA | 619,900 | | 70,380,381 |
AXA SA | 5,244,800 | | 131,028,741 |
BNP Paribas SA | 2,882,076 | | 213,422,585 |
Bureau Veritas SA | 2,881,000 | | 86,995,713 |
Cap Gemini SA | 1,263,800 | | 83,136,540 |
Dassault Aviation SA | 29,665 | | 36,374,749 |
Edenred SA | 1,576,290 | | 53,558,699 |
Essilor International SA | 491,319 | | 52,766,690 |
Kering SA | 1,059,500 | | 240,739,021 |
LVMH Moet Hennessy - Louis Vuitton SA | 706,617 | | 136,044,230 |
Publicis Groupe SA | 2,067,100 | | 172,409,747 |
Renault SA | 577,300 | | 50,564,814 |
Sanofi SA | 5,938,932 | | 633,228,146 |
Schneider Electric SA | 1,231,600 | | 103,760,314 |
Total SA sponsored ADR (d) | 2,073,300 | | 126,844,494 |
TOTAL FRANCE | | 2,252,414,346 |
Germany - 7.4% |
adidas AG | 1,594,180 | | 181,990,984 |
Allianz SE | 633,091 | | 106,501,876 |
BASF AG | 2,644,947 | | 275,191,878 |
Bayer AG | 3,517,662 | | 437,204,706 |
Brenntag AG | 356,900 | | 60,475,706 |
Continental AG | 305,000 | | 55,884,651 |
Deutsche Post AG | 1,736,779 | | 58,775,934 |
Fresenius SE & Co. KGaA | 1,044,700 | | 135,787,398 |
GFK AG | 910,553 | | 53,222,859 |
Linde AG | 653,429 | | 124,162,692 |
OSRAM Licht AG (a) | 502,125 | | 26,019,379 |
ProSiebenSat.1 Media AG | 1,156,290 | | 55,073,943 |
SAP AG | 3,664,328 | | 286,741,846 |
Siemens AG | 522,740 | | 66,802,152 |
TOTAL GERMANY | | 1,923,836,004 |
Common Stocks - continued |
| Shares | | Value |
Hong Kong - 1.7% |
AIA Group Ltd. | 54,168,400 | | $ 274,929,257 |
Galaxy Entertainment Group Ltd. (a) | 21,838,000 | | 162,947,026 |
TOTAL HONG KONG | | 437,876,283 |
India - 1.5% |
Apollo Hospitals Enterprise Ltd. | 2,493,661 | | 36,777,292 |
HDFC Bank Ltd. | 10,072,492 | | 111,857,894 |
Housing Development Finance Corp. Ltd. | 7,279,660 | | 101,007,292 |
ITC Ltd. | 13,515,862 | | 73,474,844 |
Mahindra & Mahindra Financial Services Ltd. | 2,048,126 | | 9,387,466 |
United Spirits Ltd. | 1,242,152 | | 51,887,018 |
TOTAL INDIA | | 384,391,806 |
Indonesia - 0.1% |
PT Bank Rakyat Indonesia Tbk | 26,967,000 | | 18,898,929 |
Ireland - 1.0% |
Accenture PLC Class A | 319,077 | | 23,452,160 |
Actavis PLC (a) | 367,500 | | 56,808,150 |
DCC PLC (United Kingdom) | 885,900 | | 39,758,453 |
Greencore Group PLC | 8,322,078 | | 24,031,859 |
Ryanair Holdings PLC sponsored ADR | 2,169,700 | | 108,940,637 |
TOTAL IRELAND | | 252,991,259 |
Israel - 0.0% |
Teva Pharmaceutical Industries Ltd. sponsored ADR | 126,600 | | 4,695,594 |
Italy - 0.8% |
Prada SpA | 1,772,000 | | 17,278,886 |
UniCredit SpA | 16,317,500 | | 122,739,175 |
World Duty Free SpA (a) | 5,258,489 | | 58,260,062 |
TOTAL ITALY | | 198,278,123 |
Japan - 16.6% |
ACOM Co. Ltd. (a) | 9,138,500 | | 35,783,364 |
AEON Financial Service Co. Ltd. (d) | 1,270,200 | | 39,008,167 |
Aozora Bank Ltd. | 23,073,000 | | 67,074,012 |
Coca-Cola Central Japan Co. Ltd. | 57,800 | | 1,023,675 |
Cosmos Pharmaceutical Corp. | 126,800 | | 15,448,121 |
Credit Saison Co. Ltd. | 3,809,500 | | 104,267,615 |
Don Quijote Co. Ltd. | 3,103,000 | | 206,555,807 |
Fuji Heavy Industries Ltd. | 1,789,300 | | 48,922,208 |
GMO Internet, Inc. | 2,425,200 | | 27,569,852 |
Honda Motor Co. Ltd. | 6,944,600 | | 277,318,124 |
Hoya Corp. | 5,859,600 | | 140,509,511 |
Japan Exchange Group, Inc. | 2,942,400 | | 68,405,350 |
Japan Tobacco, Inc. | 10,607,400 | | 383,814,806 |
JSR Corp. | 4,330,900 | | 82,495,066 |
KDDI Corp. | 3,114,600 | | 168,675,805 |
Keyence Corp. | 718,410 | | 307,903,357 |
Miraca Holdings, Inc. | 485,300 | | 21,866,662 |
Mitsubishi UFJ Financial Group, Inc. | 41,692,200 | | 265,507,054 |
|
| Shares | | Value |
Monex Group, Inc. | 4,779,100 | | $ 17,434,888 |
Nitori Holdings Co. Ltd. | 431,600 | | 40,486,551 |
Nitto Denko Corp. | 275,400 | | 14,442,240 |
Nomura Holdings, Inc. | 12,178,900 | | 89,965,950 |
Omron Corp. | 1,373,500 | | 52,414,441 |
ORIX Corp. | 30,992,500 | | 536,823,790 |
Rakuten, Inc. | 17,945,600 | | 233,824,717 |
Santen Pharmaceutical Co. Ltd. | 757,800 | | 38,470,270 |
Seven & i Holdings Co., Ltd. | 3,531,700 | | 130,703,401 |
SHIMANO, Inc. | 822,300 | | 71,971,077 |
Shinsei Bank Ltd. | 35,450,000 | | 82,999,311 |
Ship Healthcare Holdings, Inc. | 403,400 | | 16,553,263 |
SMC Corp. | 49,600 | | 11,547,785 |
SoftBank Corp. | 5,397,900 | | 403,109,283 |
Sumitomo Mitsui Financial Group, Inc. | 2,768,900 | | 133,837,255 |
Toyota Motor Corp. sponsored ADR | 694,500 | | 89,882,190 |
Tsuruha Holdings, Inc. | 477,100 | | 43,315,355 |
Yahoo! Japan Corp. | 8,937,000 | | 41,697,517 |
TOTAL JAPAN | | 4,311,627,840 |
Korea (South) - 1.0% |
NHN Corp. | 291,699 | | 164,088,863 |
Orion Corp. | 99,063 | | 96,609,906 |
TOTAL KOREA (SOUTH) | | 260,698,769 |
Luxembourg - 0.1% |
Eurofins Scientific SA | 141,300 | | 38,744,123 |
Mexico - 0.5% |
America Movil S.A.B. de CV Series L sponsored ADR | 3,650,500 | | 78,157,205 |
Fomento Economico Mexicano S.A.B. de CV sponsored ADR | 286,216 | | 26,703,953 |
Grupo Mexico SA de CV Series B | 7,247,844 | | 22,892,460 |
TOTAL MEXICO | | 127,753,618 |
Netherlands - 2.3% |
AEGON NV | 26,661,800 | | 212,144,835 |
Koninklijke Philips Electronics NV (depositary receipt) (NY Reg.) | 1,599,100 | | 56,624,131 |
Royal DSM NV | 733,100 | | 55,531,499 |
Unilever NV (Certificaten Van Aandelen) (Bearer) | 6,715,657 | | 266,245,433 |
TOTAL NETHERLANDS | | 590,545,898 |
Norway - 1.0% |
DNB ASA | 7,184,109 | | 127,316,838 |
Telenor ASA | 5,886,800 | | 141,408,589 |
TOTAL NORWAY | | 268,725,427 |
Russia - 0.2% |
Sberbank (Savings Bank of the Russian Federation) | 17,144,700 | | 54,955,844 |
Singapore - 0.6% |
Global Logistic Properties Ltd. | 27,354,000 | | 68,043,681 |
Common Stocks - continued |
| Shares | | Value |
Singapore - continued |
Super Group Ltd. Singapore | 1,786,000 | | $ 6,053,019 |
United Overseas Bank Ltd. | 4,164,000 | | 69,858,123 |
TOTAL SINGAPORE | | 143,954,823 |
South Africa - 1.0% |
Nampak Ltd. | 16,922,830 | | 55,966,924 |
Naspers Ltd. Class N | 2,175,499 | | 203,490,830 |
TOTAL SOUTH AFRICA | | 259,457,754 |
Spain - 2.8% |
Amadeus IT Holding SA Class A (d) | 2,823,700 | | 104,856,582 |
Antena 3 de Television SA | 1,667,355 | | 27,958,563 |
Banco Bilbao Vizcaya Argentaria SA | 4,493,774 | | 52,518,429 |
Grifols SA ADR | 2,518,972 | | 75,972,196 |
Iberdrola SA | 11,191,411 | | 70,323,100 |
Inditex SA | 1,890,816 | | 310,637,907 |
Prosegur Compania de Seguridad SA (Reg.) | 12,418,795 | | 73,853,891 |
TOTAL SPAIN | | 716,120,668 |
Sweden - 2.4% |
ASSA ABLOY AB (B Shares) | 1,252,200 | | 62,165,067 |
Atlas Copco AB (A Shares) | 2,213,000 | | 61,403,446 |
Investment AB Kinnevik (B Shares) | 1,458,600 | | 53,751,696 |
Nordea Bank AB | 10,400,400 | | 133,213,972 |
Svenska Cellulosa AB (SCA) (B Shares) | 6,422,000 | | 182,351,679 |
Svenska Handelsbanken AB (A Shares) | 2,716,400 | | 123,075,445 |
TOTAL SWEDEN | | 615,961,305 |
Switzerland - 6.1% |
Actelion Ltd. | 233,154 | | 18,051,544 |
Compagnie Financiere Richemont SA Series A | 1,379,631 | | 141,483,071 |
Credit Suisse Group | 6,601,990 | | 205,374,485 |
Nestle SA | 4,785,521 | | 345,437,855 |
Roche Holding AG (participation certificate) | 632,260 | | 175,041,287 |
Schindler Holding AG (Reg.) | 353,535 | | 50,262,870 |
SGS SA (Reg.) | 18,860 | | 44,190,621 |
Syngenta AG (Switzerland) | 644,364 | | 260,076,067 |
UBS AG | 18,330,345 | | 354,528,485 |
TOTAL SWITZERLAND | | 1,594,446,285 |
Taiwan - 0.5% |
Taiwan Semiconductor Manufacturing Co. Ltd. sponsored ADR | 6,905,200 | | 127,124,732 |
United Kingdom - 16.9% |
Alabama Noor Hospitals Group PLC (a) | 2,676,300 | | 36,475,025 |
Associated British Foods PLC | 2,026,200 | | 73,650,502 |
Barclays PLC | 40,385,772 | | 169,921,759 |
Barratt Developments PLC | 4,998,800 | | 26,858,519 |
BG Group PLC | 8,681,479 | | 177,269,716 |
|
| Shares | | Value |
British American Tobacco PLC sponsored ADR | 1,999,000 | | $ 220,869,510 |
BT Group PLC | 20,845,600 | | 126,129,090 |
Bunzl PLC | 929,270 | | 20,517,183 |
Capita Group PLC | 3,167,600 | | 50,078,248 |
Compass Group PLC | 5,541,800 | | 79,704,928 |
Diageo PLC | 1,645,474 | | 52,453,563 |
Domino's Pizza UK & IRL PLC | 4,563,900 | | 42,882,058 |
easyJet PLC | 2,478,300 | | 52,015,815 |
Filtrona PLC | 8,980,312 | | 112,816,418 |
GlaxoSmithKline PLC | 4,672,200 | | 123,170,301 |
Hikma Pharmaceuticals PLC | 3,052,187 | | 58,775,458 |
HSBC Holdings PLC sponsored ADR (d) | 8,309,757 | | 457,369,025 |
IMI PLC | 1,597,100 | | 38,898,402 |
InterContinental Hotel Group PLC | 2,038,600 | | 59,398,208 |
ITV PLC | 8,565,800 | | 26,218,977 |
Jazztel PLC (a) | 2,482,100 | | 27,230,176 |
Johnson Matthey PLC | 1,428,782 | | 68,818,908 |
Kingfisher PLC | 26,551,331 | | 160,710,826 |
Lloyds Banking Group PLC (a) | 111,498,600 | | 137,901,387 |
Meggitt PLC | 6,294,751 | | 57,782,447 |
Next PLC | 3,058,300 | | 267,005,280 |
Prudential PLC | 13,357,675 | | 273,174,663 |
Reckitt Benckiser Group PLC | 2,078,087 | | 161,535,588 |
Reed Elsevier PLC | 2,213,400 | | 31,017,959 |
Rolls-Royce Group PLC | 9,405,600 | | 173,430,799 |
Royal Dutch Shell PLC Class B sponsored ADR | 1,225,437 | | 85,192,380 |
SABMiller PLC | 2,010,000 | | 104,871,019 |
Serco Group PLC | 6,453,683 | | 57,637,443 |
Spectris PLC | 1,050,200 | | 38,931,553 |
Standard Chartered PLC (United Kingdom) | 8,814,556 | | 211,928,220 |
Taylor Wimpey PLC | 53,579,800 | | 94,672,656 |
Travis Perkins PLC | 2,801,680 | | 83,375,487 |
Vodafone Group PLC sponsored ADR | 7,366,000 | | 271,216,120 |
Whitbread PLC | 1,512,063 | | 83,231,088 |
TOTAL UNITED KINGDOM | | 4,395,136,704 |
United States of America - 6.9% |
AbbVie, Inc. | 2,850,600 | | 138,111,570 |
Alexion Pharmaceuticals, Inc. (a) | 421,700 | | 51,848,015 |
Amgen, Inc. | 219,400 | | 25,450,400 |
Anadarko Petroleum Corp. | 438,300 | | 41,765,607 |
BioMarin Pharmaceutical, Inc. (a) | 571,200 | | 35,882,784 |
Boston Scientific Corp. (a) | 2,135,700 | | 24,966,333 |
Celldex Therapeutics, Inc. (a) | 501,313 | | 11,485,081 |
D.R. Horton, Inc. | 2,016,200 | | 38,206,990 |
Fidelity National Information Services, Inc. | 809,600 | | 39,468,000 |
Gilead Sciences, Inc. (a) | 2,435,500 | | 172,896,145 |
Google, Inc. Class A (a) | 65,805 | | 67,817,317 |
Las Vegas Sands Corp. | 2,375,400 | | 166,800,588 |
Common Stocks - continued |
| Shares | | Value |
United States of America - continued |
MasterCard, Inc. Class A | 222,260 | | $ 159,382,646 |
McGraw-Hill Companies, Inc. | 1,723,800 | | 120,114,384 |
Monsanto Co. | 558,300 | | 58,554,504 |
Noble Energy, Inc. | 1,574,656 | | 117,988,974 |
Perrigo Co. | 584,500 | | 80,596,705 |
PriceSmart, Inc. | 274,700 | | 31,258,113 |
The Blackstone Group LP | 1,890,400 | | 49,679,712 |
Time Warner, Inc. | 813,800 | | 55,940,612 |
Twenty-First Century Fox, Inc. Class B | 1,847,200 | | 62,804,800 |
ViroPharma, Inc. (a) | 1,457,884 | | 56,595,057 |
Visa, Inc. Class A | 753,700 | | 148,230,179 |
Yum! Brands, Inc. | 583,100 | | 39,429,222 |
TOTAL UNITED STATES OF AMERICA | | 1,795,273,738 |
TOTAL COMMON STOCKS (Cost $18,367,711,252) |
24,804,056,123
|
Preferred Stocks - 1.7% |
| | | |
Convertible Preferred Stocks - 0.0% |
United States of America - 0.0% |
NJOY, Inc. Series C (h) | 770,400 | | 6,224,832 |
Nonconvertible Preferred Stocks - 1.7% |
Germany - 1.7% |
Henkel AG & Co. KGaA | 1,693,200 | | 183,225,702 |
Volkswagen AG | 978,626 | | 248,738,154 |
TOTAL GERMANY | | 431,963,856 |
United Kingdom - 0.0% |
Rolls-Royce Group PLC Series C | 808,881,600 | | 1,296,961 |
TOTAL NONCONVERTIBLE PREFERRED STOCKS | | 433,260,817 |
TOTAL PREFERRED STOCKS (Cost $272,467,335) |
439,485,649
|
Investment Companies - 0.3% |
| | | |
United States of America - 0.3% |
WisdomTree Japan Hedged Equity ETF
(Cost $67,418,863) | 1,335,900 | |
63,695,712
|
Government Obligations - 0.0% |
| Principal Amount | | Value |
United States of America - 0.0% |
U.S. Treasury Bills, yield at date of purchase 0.02% to 0.05% 11/7/13 to 1/2/14 (g)
(Cost $10,299,799) | | $ 10,300,000 | | $ 10,299,786 |
Money Market Funds - 3.1% |
| Shares | | |
Fidelity Cash Central Fund, 0.09% (b) | 532,429,162 | | 532,429,162 |
Fidelity Securities Lending Cash Central Fund, 0.09% (b)(c) | 271,682,888 | | 271,682,888 |
TOTAL MONEY MARKET FUNDS (Cost $804,112,050) |
804,112,050
|
TOTAL INVESTMENT PORTFOLIO - 100.6% (Cost $19,522,009,299) | | 26,121,649,320 |
NET OTHER ASSETS (LIABILITIES) - (0.6)% | | (147,464,399) |
NET ASSETS - 100% | $ 25,974,184,921 |
Futures Contracts |
| Expiration
Date | | Underlying
Face Amount
at Value | | Unrealized
Appreciation/
(Depreciation) |
Purchased |
Equity Index Contracts |
2,328 Nikkei 225 Index Contracts (Japan) | Dec. 2013 | | $ 168,372,600 | | $ 6,276,288 |
|
The face value of futures purchased as a percentage of net assets is 0.6% |
Security Type Abbreviations |
ETF | - | Exchange-Traded Fund |
Legend |
(a) Non-income producing |
(b) Affiliated fund that is generally available only to investment companies and other accounts managed by Fidelity Investments. The rate quoted is the annualized seven-day yield of the fund at period end. A complete unaudited listing of the fund's holdings as of its most recent quarter end is available upon request. In addition, each Fidelity Central Fund's financial statements, which are not covered by the Fund's Report of Independent Registered Public Accounting Firm, are available on the SEC's website or upon request. |
(c) Investment made with cash collateral received from securities on loan. |
(d) Security or a portion of the security is on loan at period end. |
(e) Affiliated company |
(f) Security exempt from registration under Rule 144A of the Securities Act of 1933. These securities may be resold in transactions exempt from registration, normally to qualified institutional buyers. At the end of the period, the value of these securities amounted to $9,595,190 or 0.0% of net assets. |
(g) Security or a portion of the security was pledged to cover margin requirements for futures contracts. At period end, the value of securities pledged amounted to $10,299,786. |
(h) Restricted securities - Investment in securities not registered under the Securities Act of 1933 (excluding 144A issues). At the end of the period, the value of restricted securities (excluding 144A issues) amounted to $6,224,832 or 0.0% of net assets. |
Additional information on each restricted holding is as follows: |
Security | Acquisition Date | Acquisition Cost |
NJOY, Inc. Series C | 6/7/13 | $ 6,227,143 |
Affiliated Central Funds |
Information regarding fiscal year to date income earned by the Fund from investments in Fidelity Central Funds is as follows: |
Fund | Income earned |
Fidelity Cash Central Fund | $ 1,410,943 |
Fidelity Securities Lending Cash Central Fund | 13,567,672 |
Total | $ 14,978,615 |
Other Affiliated Issuers |
An affiliated company is a company in which the Fund has ownership of at least 5% of the voting securities. Fiscal year to date transactions with companies which are or were affiliates are as follows: |
Affiliate | Value,
beginning of
period | Purchases | Sales
Proceeds | Dividend
Income | Value,
end of
period |
3Legs Resources PLC | $ 4,046,188 | $ - | $ 2,553,704 | $ - | $ - |
Pactera Technology International Ltd. ADR (formerly HiSoft Technology International Ltd. ADR) | 17,640,142 | - | 15,572,364 | - | - |
Painted Pony Petroleum Ltd. (144A) | 26,878,078 | - | 9,015,534 | - | 9,595,190 |
Painted Pony Petroleum Ltd. | 43,070,995 | - | 589,323 | - | 25,702,824 |
Total | $ 91,635,403 | $ - | $ 27,730,925 | $ - | $ 35,298,014 |
Other Information |
Categorizations in the Schedule of Investments are based on country or territory of incorporation. |
The following is a summary of the inputs used, as of October 31, 2013, involving the Fund's assets and liabilities carried at fair value. The inputs or methodology used for valuing securities may not be an indication of the risk associated with investing in those securities. For more information on valuation inputs, and their aggregation into the levels used in the tables below, please refer to the Investment Valuation section in the accompanying Notes to Financial Statements. |
Valuation Inputs at Reporting Date: |
Description | Total | Level 1 | Level 2 | Level 3 |
Investments in Securities: | | | | |
Equities: | | | | |
Consumer Discretionary | $ 4,629,772,221 | $ 3,685,070,697 | $ 938,476,692 | $ 6,224,832 |
Consumer Staples | 3,081,166,976 | 1,423,052,629 | 1,658,107,218 | 7,129 |
Energy | 854,615,737 | 854,615,737 | - | - |
Financials | 6,222,865,829 | 3,264,337,136 | 2,958,528,693 | - |
Health Care | 3,368,941,602 | 2,100,153,705 | 1,268,787,897 | - |
Industrials | 1,882,344,502 | 1,803,994,565 | 78,349,937 | - |
Information Technology | 2,199,144,042 | 1,342,307,518 | 856,836,524 | - |
Materials | 1,629,493,183 | 1,272,479,810 | 357,013,373 | - |
Telecommunication Services | 1,304,874,580 | 606,960,402 | 697,914,178 | - |
Utilities | 70,323,100 | 70,323,100 | - | - |
Investment Companies | 63,695,712 | 63,695,712 | - | - |
Government Obligations | 10,299,786 | - | 10,299,786 | - |
Money Market Funds | 804,112,050 | 804,112,050 | - | - |
Total Investments in Securities: | $ 26,121,649,320 | $ 17,291,103,061 | $ 8,824,314,298 | $ 6,231,961 |
Derivative Instruments: | | | | |
Assets | | | | |
Futures Contracts | $ 6,276,288 | $ 6,276,288 | $ - | $ - |
The following is a summary of transfers between Level 1 and Level 2 for the period ended October 31, 2013. Transfers are assumed to have occurred at the beginning of the period, and are primarily attributable to the valuation techniques used for foreign equity securities, as discussed in the accompanying Notes to Financial Statements: |
Transfers | Total |
Level 1 to Level 2 | $ 2,421,885,219 |
Level 2 to Level 1 | $ 0 |
Value of Derivative Instruments |
The following table is a summary of the Fund's value of derivative instruments by primary risk exposure as of October 31, 2013. For additional information on derivative instruments, please refer to the Derivative Instruments section in the accompanying Notes to Financial Statements. |
Primary Risk Exposure /
Derivative Type | Value |
| Asset | Liability |
Equity Risk | | |
Futures Contracts (a) | $ 6,276,288 | $ - |
Total Value of Derivatives | $ 6,276,288 | $ - |
(a) Reflects gross cumulative appreciation (depreciation) on futures contracts as presented in the Schedule of Investments. Only the period end receivable or payable for daily variation margin and net unrealized appreciation (depreciation) are presented in the Statement of Assets and Liabilities. |
See accompanying notes which are an integral part of the financial statements.
Annual Report
Fidelity Diversified International Fund
Statement of Assets and Liabilities
| October 31, 2013 |
| | |
Assets | | |
Investment in securities, at value (including securities loaned of $264,158,421) - See accompanying schedule: Unaffiliated issuers (cost $18,676,066,715) | $ 25,282,239,256 | |
Fidelity Central Funds (cost $804,112,050) | 804,112,050 | |
Other affiliated issuers (cost $41,830,534) | 35,298,014 | |
Total Investments (cost $19,522,009,299) | | $ 26,121,649,320 |
Receivable for investments sold | | 134,527,377 |
Receivable for fund shares sold | | 14,496,298 |
Dividends receivable | | 69,280,792 |
Distributions receivable from Fidelity Central Funds | | 133,099 |
Prepaid expenses | | 79,941 |
Other receivables | | 1,917,110 |
Total assets | | 26,342,083,937 |
| | |
Liabilities | | |
Payable for investments purchased | $ 61,287,679 | |
Payable for fund shares redeemed | 13,520,941 | |
Accrued management fee | 15,156,326 | |
Payable for daily variation margin for derivative instruments | 1,455,000 | |
Other affiliated payables | 2,800,113 | |
Other payables and accrued expenses | 1,996,069 | |
Collateral on securities loaned, at value | 271,682,888 | |
Total liabilities | | 367,899,016 |
| | |
Net Assets | | $ 25,974,184,921 |
Net Assets consist of: | | |
Paid in capital | | $ 20,330,411,409 |
Undistributed net investment income | | 238,578,397 |
Accumulated undistributed net realized gain (loss) on investments and foreign currency transactions | | (1,203,391,143) |
Net unrealized appreciation (depreciation) on investments and assets and liabilities in foreign currencies | | 6,608,586,258 |
Net Assets | | $ 25,974,184,921 |
| | |
Diversified International:
Net Asset Value, offering price and redemption price per share ($14,432,586,233 ÷ 402,095,782 shares) | | $ 35.89 |
| | |
Class K:
Net Asset Value, offering price and redemption price per share ($11,541,598,688 ÷ 321,748,785 shares) | | $ 35.87 |
Statement of Operations
| Year ended October 31, 2013 |
| | |
Investment Income | | |
Dividends | | $ 577,013,483 |
Interest | | 102,685 |
Income from Fidelity Central Funds | | 14,978,615 |
Income before foreign taxes withheld | | 592,094,783 |
Less foreign taxes withheld | | (43,282,775) |
Total income | | 548,812,008 |
| | |
Expenses | | |
Management fee
Basic fee | $ 167,562,560 | |
Performance adjustment | 5,795,026 | |
Transfer agent fees | 30,945,968 | |
Accounting and security lending fees | 2,433,181 | |
Custodian fees and expenses | 2,627,354 | |
Independent trustees' compensation | 136,354 | |
Appreciation in deferred trustee compensation account | 51 | |
Registration fees | 181,611 | |
Audit | 192,812 | |
Legal | 95,751 | |
Miscellaneous | 198,274 | |
Total expenses before reductions | 210,168,942 | |
Expense reductions | (4,638,378) | 205,530,564 |
Net investment income (loss) | | 343,281,444 |
Realized and Unrealized Gain (Loss) Net realized gain (loss) on: | | |
Investment securities: | | |
Unaffiliated issuers | 1,946,572,950 | |
Other affiliated issuers | (42,988,742) | |
Foreign currency transactions | (1,688,743) | |
Futures contracts | 12,934,707 | |
Total net realized gain (loss) | | 1,914,830,172 |
Change in net unrealized appreciation (depreciation) on: Investment securities | 3,209,792,516 | |
Assets and liabilities in foreign currencies | 1,716,266 | |
Futures contracts | 6,276,288 | |
Total change in net unrealized appreciation (depreciation) | | 3,217,785,070 |
Net gain (loss) | | 5,132,615,242 |
Net increase (decrease) in net assets resulting from operations | | $ 5,475,896,686 |
See accompanying notes which are an integral part of the financial statements.
Annual Report
Statement of Changes in Net Assets
| Year ended
October 31,
2013 | Year ended
October 31,
2012 |
Increase (Decrease) in Net Assets | | |
Operations | | |
Net investment income (loss) | $ 343,281,444 | $ 362,378,873 |
Net realized gain (loss) | 1,914,830,172 | 522,680,347 |
Change in net unrealized appreciation (depreciation) | 3,217,785,070 | 777,447,571 |
Net increase (decrease) in net assets resulting from operations | 5,475,896,686 | 1,662,506,791 |
Distributions to shareholders from net investment income | (361,491,947) | (460,432,289) |
Distributions to shareholders from net realized gain | (51,508,245) | - |
Total distributions | (413,000,192) | (460,432,289) |
Share transactions - net increase (decrease) | (1,244,167,482) | (4,619,314,396) |
Redemption fees | 382,374 | 414,440 |
Total increase (decrease) in net assets | 3,819,111,386 | (3,416,825,454) |
| | |
Net Assets | | |
Beginning of period | 22,155,073,535 | 25,571,898,989 |
End of period (including undistributed net investment income of $238,578,397 and undistributed net investment income of $320,513,134, respectively) | $ 25,974,184,921 | $ 22,155,073,535 |
Financial Highlights - Diversified International
Years ended October 31, | 2013 | 2012 | 2011 | 2010 | 2009 |
Selected Per-Share Data | | | | | |
Net asset value, beginning of period | $ 29.07 | $ 27.49 | $ 29.49 | $ 26.86 | $ 21.96 |
Income from Investment Operations | | | | | |
Net investment income (loss) B | .44 | .42 | .53 E | .37 | .35 |
Net realized and unrealized gain (loss) | 6.90 | 1.65 | (1.99) | 2.61 | 4.86 |
Total from investment operations | 7.34 | 2.07 | (1.46) | 2.98 | 5.21 |
Distributions from net investment income | (.46) | (.49) | (.46) | (.35) | (.31) |
Distributions from net realized gain | (.07) | - | (.08) | - | - |
Total distributions | (.52) H | (.49) | (.54) | (.35) | (.31) |
Redemption fees added to paid in capital B, G | - | - | - | - | - |
Net asset value, end of period | $ 35.89 | $ 29.07 | $ 27.49 | $ 29.49 | $ 26.86 |
Total Return A | 25.66% | 7.72% | (5.07)% | 11.15% | 24.32% |
Ratios to Average Net Assets C, F | | | | | |
Expenses before reductions | .94% | 1.01% | .90% | .98% | 1.01% |
Expenses net of fee waivers, if any | .94% | 1.01% | .89% | .98% | 1.01% |
Expenses net of all reductions | .92% | .99% | .87% | .96% | .99% |
Net investment income (loss) | 1.38% | 1.53% | 1.78% E | 1.34% | 1.58% |
Supplemental Data | | | | | |
Net assets, end of period (000 omitted) | $ 14,432,586 | $ 13,269,769 | $ 17,285,369 | $ 26,527,229 | $ 30,998,270 |
Portfolio turnover rate D | 52% | 35% | 45% | 57% | 54% |
A Total returns would have been lower if certain expenses had not been reduced during the applicable periods shown.
B Calculated based on average shares outstanding during the period.
C Fees and expenses of any underlying Fidelity Central Funds are not included in the Fund's expense ratio. The Fund indirectly bears its proportionate share of the expenses of any underlying Fidelity Central Funds.
D Amount does not include the portfolio activity of any underlying Fidelity Central Funds.
E Investment income per share reflects a large, non-recurring dividend which amounted to $.10 per share. Excluding this non-recurring dividend, the ratio of net investment income (loss) to average net assets would have been 1.44%.
F Expense ratios reflect operating expenses of the class. Expenses before reductions do not reflect amounts reimbursed by the investment adviser or reductions from brokerage service arrangements or reductions from other expense offset arrangements and do not represent the amount paid by the class during periods when reimbursements or reductions occur. Expenses net of fee waivers reflect expenses after reimbursement by the investment adviser but prior to reductions from brokerage service arrangements or other expense offset arrangements. Expenses net of all reductions represent the net expenses paid by the class.
G Amount represents less than $.01 per share.
H Total distributions of $0.52 per share is comprised of distributions from net investment income of $0.456 and distributions from net realized gain of $0.068 per share.
See accompanying notes which are an integral part of the financial statements.
Annual Report
Financial Highlights - Class K
Years ended October 31, | 2013 | 2012 | 2011 | 2010 | 2009 |
Selected Per-Share Data | | | | | |
Net asset value, beginning of period | $ 29.06 | $ 27.51 | $ 29.51 | $ 26.89 | $ 21.98 |
Income from Investment Operations | | | | | |
Net investment income (loss) B | .49 | .47 | .58 E | .42 | .42 |
Net realized and unrealized gain (loss) | 6.90 | 1.63 | (1.97) | 2.61 | 4.85 |
Total from investment operations | 7.39 | 2.10 | (1.39) | 3.03 | 5.27 |
Distributions from net investment income | (.51) | (.55) | (.53) | (.41) | (.36) |
Distributions from net realized gain | (.07) | - | (.08) | - | - |
Total distributions | (.58) | (.55) | (.61) | (.41) | (.36) |
Redemption fees added to paid in capital B, G | - | - | - | - | - |
Net asset value, end of period | $ 35.87 | $ 29.06 | $ 27.51 | $ 29.51 | $ 26.89 |
Total Return A | 25.86% | 7.86% | (4.87)% | 11.33% | 24.64% |
Ratios to Average Net Assets C, F | | | | | |
Expenses before reductions | .80% | .84% | .73% | .79% | .77% |
Expenses net of fee waivers, if any | .80% | .84% | .72% | .79% | .77% |
Expenses net of all reductions | .78% | .83% | .70% | .77% | .76% |
Net investment income (loss) | 1.52% | 1.70% | 1.95% E | 1.54% | 1.81% |
Supplemental Data | | | | | |
Net assets, end of period (000 omitted) | $ 11,541,599 | $ 8,885,304 | $ 8,115,192 | $ 7,697,405 | $ 4,713,909 |
Portfolio turnover rate D | 52% | 35% | 45% | 57% | 54% |
A Total returns would have been lower if certain expenses had not been reduced during the applicable periods shown.
B Calculated based on average shares outstanding during the period.
C Fees and expenses of any underlying Fidelity Central Funds are not included in the Fund's expense ratio. The Fund indirectly bears its proportionate share of the expenses of any underlying Fidelity Central Funds.
D Amount does not include the portfolio activity of any underlying Fidelity Central Funds.
E Investment income per share reflects a large, non-recurring dividend which amounted to $.10 per share. Excluding this non-recurring dividend, the ratio of net investment income (loss) to average net assets would have been 1.61%.
F Expense ratios reflect operating expenses of the class. Expenses before reductions do not reflect amounts reimbursed by the investment adviser or reductions from brokerage service arrangements or reductions from other expense offset arrangements and do not represent the amount paid by the class during periods when reimbursements or reductions occur. Expenses net of fee waivers reflect expenses after reimbursement by the investment adviser but prior to reductions from brokerage service arrangements or other expense offset arrangements. Expenses net of all reductions represent the net expenses paid by the class.
G Amount represents less than $.01 per share.
See accompanying notes which are an integral part of the financial statements.
Annual Report
Fidelity Diversified International Fund
Notes to Financial Statements
For the period ended October 31, 2013
1. Organization.
Fidelity Diversified International Fund (the Fund) is a fund of Fidelity Investment Trust (the Trust) and is authorized to issue an unlimited number of shares. The Trust is registered under the Investment Company Act of 1940, as amended (the 1940 Act), as an open-end management investment company organized as a Massachusetts business trust. The Fund offers Diversified International and Class K shares, each of which has equal rights as to assets and voting privileges. The Fund offered Class F shares during the period June 26, 2009 through December 16, 2011, and all outstanding shares were redeemed by December 16, 2011. Each class has exclusive voting rights with respect to matters that affect that class.
2. Investments in Fidelity Central Funds.
The Fund invests in Fidelity Central Funds, which are open-end investment companies generally available only to other investment companies and accounts managed by Fidelity Management & Research Company (FMR) and its affiliates. The Fund's Schedule of Investments lists each of the Fidelity Central Funds held as of period end, if any, as an investment of the Fund, but does not include the underlying holdings of each Fidelity Central Fund. As an Investing Fund, the Fund indirectly bears its proportionate share of the expenses of the underlying Fidelity Central Funds.
The Money Market Central Funds seek preservation of capital and current income and are managed by Fidelity Investments Money Management, Inc. (FIMM), an affiliate of FMR.
A complete unaudited list of holdings for each Fidelity Central Fund is available upon request or at the Securities and Exchange Commission (the SEC) website at www.sec.gov. In addition, the financial statements of the Fidelity Central Funds, which are not covered by the Fund's Report of Independent Registered Public Accounting Firm, are available on the SEC website or upon request.
3. Significant Accounting Policies.
The financial statements have been prepared in conformity with accounting principles generally accepted in the United States of America (GAAP), which require management to make certain estimates and assumptions at the date of the financial statements. Actual results could differ from those estimates. Subsequent events, if any, through the date that the financial statements were issued have been evaluated in the preparation of the financial statements. The following summarizes the significant accounting policies of the Fund:
Investment Valuation. Investments are valued as of 4:00 p.m. Eastern time on the last calendar day of the period. In accordance with valuation policies and procedures approved by the Board of Trustees (the Board), the Fund attempts to obtain prices from one or more third party pricing vendors or brokers to value its investments. When current market prices, quotations or currency exchange rates are not readily available or reliable, investments will be fair valued in good faith by the FMR Fair Value Committee (the Committee), in accordance with procedures adopted by the Board. Factors used in determining fair value vary by investment type and may include market or investment specific events, changes in interest rates and credit quality. The frequency with which these procedures are used cannot be predicted and they may be utilized to a significant extent. The Committee oversees the Fund's valuation policies and procedures and is responsible for approving and reporting to the Board all fair value determinations.
The Fund categorizes the inputs to valuation techniques used to value its investments into a disclosure hierarchy consisting of three levels as shown below:
Level 1 - quoted prices in active markets for identical investments
Level 2 - other significant observable inputs (including quoted prices for similar investments, interest rates, prepayment speeds, etc.)
Level 3 - unobservable inputs (including the Fund's own assumptions based on the best information available)
Valuation techniques used to value the Fund's investments by major category are as follows:
Equity securities, including restricted securities, for which market quotations are readily available, are valued at the last reported sale price or official closing price as reported by a third party pricing vendor on the primary market or exchange on which they are traded and are categorized as Level 1 in the hierarchy. In the event there were no sales during the day or closing prices are not available, securities are valued at the last quoted bid price or may be valued using the last available price and are generally categorized as Level 2 in the hierarchy. For foreign equity securities, when market or security specific events arise, comparisons to the valuation of American Depositary Receipts (ADRs), futures contracts, Exchange-Traded Funds (ETFs) and certain indexes as well as quoted prices for similar securities may be used and would be categorized as Level 2 in the hierarchy. Utilizing these techniques may result in transfers between Level 1 and Level 2. For equity securities, including restricted securities, where observable inputs are limited, assumptions about market activity and risk are used and these securities may be categorized as Level 3 in the hierarchy.
Debt securities, including restricted securities, are valued based on evaluated prices received from third party pricing vendors or from brokers who make markets in such securities. For U.S. government and government agency obligations, pricing vendors utilize matrix pricing which considers yield or price of bonds of comparable quality, coupon, maturity and type as well as broker-supplied prices. When independent prices are unavailable or unreliable, debt securities may be valued utilizing pricing methodologies which consider similar factors that would be used by third party pricing
Annual Report
3. Significant Accounting Policies - continued
Investment Valuation - continued
vendors. Debt securities are generally categorized as Level 2 in the hierarchy but may be Level 3 depending on the circumstances. ETFs are valued at their last sale price or official closing price as reported by a third party pricing vendor on the primary market or exchange on which they are traded and are categorized as Level 1 in the hierarchy. In the event there were no sales during the day but the exchange reports a closing bid level, ETFs are valued at the closing bid and would be categorized as Level 1 in the hierarchy. In the event there was no closing bid, ETFs may be valued by another method that the Board believes reflects fair value in accordance with the Board's fair value pricing policies and may be categorized as Level 2 in the hierarchy.
Futures contracts are valued at the settlement price established each day by the board of trade or exchange on which they are traded and are categorized as Level 1 in the hierarchy. Investments in open-end mutual funds, including the Fidelity Central Funds, are valued at their closing net asset value (NAV) each business day and are categorized as Level 1 in the hierarchy.
Changes in valuation techniques may result in transfers in or out of an assigned level within the disclosure hierarchy. The aggregate value of investments by input level, as of October 31, 2013, including information on transfers between Levels 1 and 2, is included at the end of the Fund's Schedule of Investments.
Foreign Currency. The Fund may use foreign currency contracts to facilitate transactions in foreign-denominated securities. Gains and losses from these transactions may arise from changes in the value of the foreign currency or if the counterparties do not perform under the contracts' terms.
Foreign-denominated assets, including investment securities, and liabilities are translated into U.S. dollars at the exchange rates at period end. Purchases and sales of investment securities, income and dividends received and expenses denominated in foreign currencies are translated into U.S. dollars at the exchange rate in effect on the transaction date.
The effects of exchange rate fluctuations on investments are included with the net realized and unrealized gain (loss) on investment securities. Other foreign currency transactions resulting in realized and unrealized gain (loss) are disclosed separately.
Investment Transactions and Income. For financial reporting purposes, the Fund's investment holdings and NAV include trades executed through the end of the last business day of the period. The NAV per share for processing shareholder transactions is calculated as of the close of business of the New York Stock Exchange (NYSE), normally 4:00 p.m. Eastern time and includes trades executed through the end of the prior business day. Gains and losses on securities sold are determined on the basis of identified cost and may include proceeds received from litigation. Dividend income is recorded on the ex-dividend date, except for certain dividends from foreign securities where the ex-dividend date may have passed, which are recorded as soon as the Fund is informed of the ex-dividend date. Non-cash dividends included in dividend income, if any, are recorded at the fair market value of the securities received. Distributions received on securities that represent a return of capital or capital gain are recorded as a reduction of cost of investments and/or as a realized gain. Subsequent to ex-dividend date the Fund determines the components of these distributions, based upon receipt of tax filings or other correspondence relating to the underlying investment. Interest income and distributions from the Fidelity Central Funds are accrued as earned. Interest income includes coupon interest and amortization of premium and accretion of discount on debt securities. Investment income is recorded net of foreign taxes withheld where recovery of such taxes is uncertain.
Class Allocations and Expenses. Investment income, realized and unrealized capital gains and losses, common expenses of the Fund, and certain fund-level expense reductions, if any, are allocated daily on a pro-rata basis to each class based on the relative net assets of each class to the total net assets of the Fund. Each class differs with respect to transfer agent fees incurred. Certain expense reductions may also differ by class. For the reporting period, the allocated portion of income and expenses to each class as a percent of its average net assets may vary due to the timing of recording these transactions in relation to fluctuating net assets of the classes. Expenses directly attributable to a fund are charged to that fund. Expenses attributable to more than one fund are allocated among the respective funds on the basis of relative net assets or other appropriate methods. Expense estimates are accrued in the period to which they relate and adjustments are made when actual amounts are known.
Deferred Trustee Compensation. Under a Deferred Compensation Plan (the Plan), independent Trustees may elect to defer receipt of a portion of their annual compensation. Deferred amounts are invested in a cross-section of Fidelity funds, are marked-to-market and remain in the Fund until distributed in accordance with the Plan. The investment of deferred amounts and the offsetting payable to the Trustees are included in the accompanying Statement of Assets and Liabilities.
Income Tax Information and Distributions to Shareholders. Each year, the Fund intends to qualify as a regulated investment company under Subchapter M of the Internal Revenue Code, including distributing substantially all of its taxable income and realized gains. As a result, no provision for U.S. Federal income taxes is required. As of October 31, 2013, the Fund did not have any unrecognized tax benefits in the financial statements; nor is the Fund aware of any tax positions for which it is reasonably possible that the total amounts of unrecognized tax benefits will significantly change in the next twelve months. The Fund files a U.S. federal tax return, in addition to state and local tax returns as required. The Fund's federal income tax returns are subject to examination by the Internal Revenue Service (IRS) for a period of three fiscal years after they are filed. State and local tax
Annual Report
Fidelity Diversified International Fund
Notes to Financial Statements - continued
3. Significant Accounting Policies - continued
Income Tax Information and Distributions to Shareholders - continued
returns may be subject to examination for an additional fiscal year depending on the jurisdiction. Foreign taxes are provided for based on the Fund's understanding of the tax rules and rates that exist in the foreign markets in which it invests.
Distributions are declared and recorded on the ex-dividend date. Income dividends and capital gain distributions are declared separately for each class. Income and capital gain distributions are determined in accordance with income tax regulations, which may differ from GAAP. In addition, the Fund claimed a portion of the payment made to redeeming shareholders as a distribution for income tax purposes.
Capital accounts within the financial statements are adjusted for permanent book-tax differences. These adjustments have no impact on net assets or the results of operations. Temporary book-tax differences will reverse in a subsequent period.
Book-tax differences are primarily due to futures contracts, foreign currency transactions, passive foreign investment companies (PFIC), partnerships, deferred trustees compensation, capital loss carryforwards and losses deferred due to wash sales.
The federal tax cost of investment securities and unrealized appreciation (depreciation) as of period end were as follows:
Gross unrealized appreciation | $ 6,473,560,954 |
Gross unrealized depreciation | (199,424,466) |
Net unrealized appreciation (depreciation) on securities and other investments | $ 6,274,136,488 |
| |
Tax Cost | $ 19,847,512,832 |
The tax-based components of distributable earnings as of period end were as follows:
Undistributed ordinary income | $ 407,009,198 |
Capital loss carryforward | $ (1,038,927,073) |
Net unrealized appreciation (depreciation) | $ 6,276,806,437 |
Capital loss carryforwards are only available to offset future capital gains of the Fund to the extent provided by regulations and may be limited. Under the Regulated Investment Company Modernization Act of 2010 (the Act), the Fund is permitted to carry forward capital losses incurred in taxable years beginning after December 22, 2010 for an unlimited period and such capital losses are required to be used prior to any losses that expire. The capital loss carryforward information presented below, including any applicable limitation, is estimated as of fiscal period end and is subject to adjustment.
Fiscal year of expiration | |
| |
2017 | $ (419,355,221) |
2018 | (619,571,852) |
Total capital loss carryforward | $ (1,038,927,073) |
The tax character of distributions paid was as follows:
| October 31, 2013 | October 31, 2012 |
Ordinary Income | $ 413,000,192 | $ 460,432,289 |
Short-Term Trading (Redemption) Fees. Shares held by investors in the Fund less than 30 days may have been subject to a redemption fee equal to 1.00% of the net asset value of shares redeemed. All redemption fees, which reduce the proceeds of the shareholder redemption, are retained by the Fund and accounted for as an addition to paid in capital.
Restricted Securities. The Fund may invest in securities that are subject to legal or contractual restrictions on resale. These securities generally may be resold in transactions exempt from registration or to the public if the securities are registered. Disposal of these securities may involve time-consuming negotiations and expense, and prompt sale at an acceptable price may be difficult. Information regarding restricted securities is included at the end of the Fund's Schedule of Investments.
New Accounting Pronouncement. The Financial Accounting Standards Board issued in December 2011, Accounting Standard Update No. 2011-11, Disclosures about Offsetting Assets and Liabilities, and in January 2013, Accounting Standards Update No. 2013-1 Clarifying the Scope of Disclosures about Offsetting Assets and Liabilities. These updates create new disclosure requirements requiring entities to disclose both gross and net information
Annual Report
3. Significant Accounting Policies - continued
New Accounting Pronouncement - continued
for derivatives and other financial instruments that are either offset in the Statement of Assets and Liabilities or subject to an enforceable master netting arrangement or similar agreement. The disclosure requirements are effective for annual reporting periods beginning on or after January 1, 2013, and interim periods within those annual periods. Management expects that the impact of the updates' adoption will be limited to additional financial statement disclosures as applicable.
4. Derivative Instruments.
Risk Exposures and the Use of Derivative Instruments. The Fund's investment objective allows the Fund to enter into various types of derivative contracts, including futures contracts. Derivatives are investments whose value is primarily derived from underlying assets, indices or reference rates and may be transacted on an exchange or over-the-counter (OTC). Derivatives may involve a future commitment to buy or sell a specified asset based on specified terms, to exchange future cash flows at periodic intervals based on a notional principal amount, or for one party to make one or more payments upon the occurrence of specified events in exchange for periodic payments from the other party.
The Fund used derivatives to increase returns and to manage exposure to certain risks as defined below. The success of any strategy involving derivatives depends on analysis of numerous economic factors, and if the strategies for investment do not work as intended, the Fund may not achieve its objectives.
The Fund's use of derivatives increased or decreased its exposure to the following risk:
Equity Risk | Equity risk relates to the fluctuations in the value of financial instruments as a result of changes in market prices (other than those arising from interest rate risk or foreign exchange risk), whether caused by factors specific to an individual investment, its issuer, or all factors affecting all instruments traded in a market or market segment. |
The Fund is also exposed to additional risks from investing in derivatives, such as liquidity risk and counterparty credit risk. Liquidity risk is the risk that the Fund will be unable to close out the derivative in the open market in a timely manner. Counterparty credit risk is the risk that the counterparty will not be able to fulfill its obligation to the Fund. Counterparty credit risk related to exchange-traded futures contracts may be mitigated by the protection provided by the exchange on which they trade.
Investing in derivatives may involve greater risks than investing in the underlying assets directly and, to varying degrees, may involve risk of loss in excess of any initial investment and collateral received and amounts recognized in the Statement of Assets and Liabilities. In addition, there may be the risk that the change in value of the derivative contract does not correspond to the change in value of the underlying instrument.
Futures Contracts. A futures contract is an agreement between two parties to buy or sell a specified underlying instrument for a fixed price at a specified future date. The Fund used futures contracts to manage its exposure to the stock market and to fluctuations in currency values.
Upon entering into a futures contract, a fund is required to deposit either cash or securities (initial margin) with a clearing broker in an amount equal to a certain percentage of the face value of the contract. Futures contracts are marked-to-market daily and subsequent daily payments (variation margin) are made or received by a fund depending on the daily fluctuations in the value of the futures contracts and are recorded as unrealized appreciation or (depreciation). This receivable and/or payable, if any, is included in daily variation margin for derivative instruments in the Statement of Assets and Liabilities. Realized gain or (loss) is recorded upon the expiration or closing of a futures contract.
Any open futures contracts at period end are presented in the Schedule of Investments under the caption "Futures Contracts." The underlying face amount at value reflects each contract's exposure to the underlying instrument or index at period end and is representative of activity for the period. Securities deposited to meet initial margin requirements are identified in the Schedule of Investments.
During the period the Fund recognized net realized gain (loss) of $12,934,707 and a change in net unrealized appreciation (depreciation) of $6,276,288 related to its investment in futures contracts. These amounts are included in the Statement of Operations.
5. Purchases and Sales of Investments.
Purchases and sales of securities, other than short-term securities, aggregated $11,742,469,172 and $12,536,561,646, respectively.
Annual Report
Fidelity Diversified International Fund
Notes to Financial Statements - continued
6. Fees and Other Transactions with Affiliates.
Management Fee. FMR and its affiliates provide the Fund with investment management related services for which the Fund pays a monthly management fee. The management fee is the sum of an individual fund fee rate that is based on an annual rate of .45% of the Fund's average net assets and an annualized group fee rate that averaged .25% during the period. The group fee rate is based upon the average net assets of all the mutual funds advised by FMR, including any mutual funds previously advised by FMR that are currently advised by Fidelity SelectCo, LLC, an affiliate of FMR. The group fee rate decreases as assets under management increase and increases as assets under management decrease. In addition, the management fee is subject to a performance adjustment (up to a maximum of ± .20% of the Fund's average net assets over a 36 month performance period). The upward or downward adjustment to the management fee is based on the relative investment performance of Diversified International as compared to an appropriate benchmark index over the same 36 month performance period. For the reporting period, the total annual management fee rate, including the performance adjustment, was .73% of the Fund's average net assets. The performance adjustment included in the management fee rate may be higher or lower than the maximum performance adjustment rate due to the difference between the average net assets for the reporting and performance periods.
Transfer Agent Fees. Fidelity Investments Institutional Operations Company, Inc., (FIIOC), an affiliate of FMR, is the transfer, dividend disbursing and shareholder servicing agent for each class of the Fund. FIIOC receives account fees and asset-based fees that vary according to the account size and type of account of the shareholders of Diversified International. FIIOC receives an asset-based fee of Class K's average net assets. FIIOC pays for typesetting, printing and mailing of shareholder reports, except proxy statements.
For the period, transfer agent fees for each class were as follows:
| Amount | % of
Average
Net Assets |
Diversified International | $ 25,937,426 | .19 |
Class K | 5,008,542 | .05 |
| $ 30,945,968 | |
Accounting and Security Lending Fees. Fidelity Service Company, Inc. (FSC), an affiliate of FMR, maintains the Fund's accounting records. The accounting fee is based on the level of average net assets for each month. Under a separate contract, FSC administers the security lending program. The security lending fee is based on the number and duration of lending transactions.
Brokerage Commissions. The Fund placed a portion of its portfolio transactions with brokerage firms which are affiliates of the investment adviser. Brokerage commissions are included in net realized gain (loss) and change in net unrealized appreciation (depreciation) in the Statement of Operations. The commissions paid to these affiliated firms were $30,251 for the period.
7. Committed Line of Credit.
The Fund participates with other funds managed by FMR or an affiliate in a $4.25 billion credit facility (the "line of credit") to be utilized for temporary or emergency purposes to fund shareholder redemptions or for other short-term liquidity purposes. The Fund has agreed to pay commitment fees on its pro-rata portion of the line of credit, which amounted to $51,110 and is reflected in Miscellaneous expenses on the Statement of Operations. During the period, there were no borrowings on this line of credit.
8. Security Lending.
The Fund lends portfolio securities through a lending agent from time to time in order to earn additional income. For equity securities, a lending agent is used and may loan securities to certain qualified borrowers, including Fidelity Capital Markets (FCM), a broker-dealer affiliated with the Fund. On the settlement date of the loan, the Fund receives collateral (in the form of U.S. Treasury obligations, letters of credit and/or cash) against the loaned securities and maintains collateral in an amount not less than 100% of the market value of the loaned securities during the period of the loan. The market value of the loaned securities is determined at the close of business of the Fund and any additional required collateral is delivered to the Fund on the next business day. If the borrower defaults on its obligation to return the securities loaned because of insolvency or other reasons, the Fund may apply collateral received from the borrower against the obligation. The Fund may experience delays and costs in recovering the securities loaned. Any cash collateral received is invested in the Fidelity Securities Lending Cash Central Fund. The value of loaned securities and cash collateral at period end are disclosed on the Fund's Statement of Assets and Liabilities. At period end, there were no security loans outstanding with FCM. Security lending income represents the income earned on investing cash collateral, less rebates paid to borrowers and any lending agent fees associated with the loan, plus any premium payments received for lending certain types of securities. Security lending income is presented in the Statement of Operations as a component of income from Fidelity Central Funds. Total security lending income during the period amounted to $13,567,672, including $10,418 from securities loaned to FCM.
Annual Report
9. Expense Reductions.
Commissions paid to certain brokers with whom FMR, or its affiliates, places trades on behalf of the Fund include an amount in addition to trade execution, which may be rebated back to the Fund to offset certain expenses. This amount totaled $4,492,719 for the period.
In addition, FMR reimbursed a portion of the Fund's operating expenses during the period in the amount of $144,745.
In addition, through arrangements with the Fund's custodian, credits realized as a result of uninvested cash balances were used to reduce the Fund's expenses. During the period, these credits reduced the Fund's custody expenses by $914.
10. Distributions to Shareholders.
Distributions to shareholders of each class were as follows:
Years ended October 31, | 2013 | 2012A |
From net investment income | | |
Diversified International | $ 204,367,616 | $ 294,773,906 |
Class K | 157,124,331 | 163,061,175 |
Class F | - | 2,597,208 |
Total | $ 361,491,947 | $ 460,432,289 |
From net realized gain | | |
Diversified International | $ 30,475,866 | $ - |
Class K | 21,032,379 | - |
Class F | - | - |
Total | $ 51,508,245 | $ - |
A All Class F shares were redeemed on December 16, 2011.
11. Share Transactions.
Transactions for each class of shares were as follows:
| Shares | Dollars |
Years ended October 31, | 2013 | 2012A | 2013 | 2012A |
Diversified International | | | | |
Shares sold | 63,290,634 | 68,919,981 | $ 2,024,488,853 | $ 1,874,276,249 |
Reinvestment of distributions | 7,563,286 | 10,773,340 | 222,133,713 | 281,938,317 |
Shares redeemed | (125,225,694) | (251,932,423) | (3,964,590,272) | (6,875,660,945) |
Net increase (decrease) | (54,371,774) | (172,239,102) | $ (1,717,967,706) | $ (4,719,446,379) |
Class K | | | | |
Shares sold | 76,686,079 | 107,189,633 | $ 2,416,468,280 | $ 2,919,697,004 |
Reinvestment of distributions | 6,076,286 | 6,242,771 | 178,156,710 | 163,061,175 |
Shares redeemed | (66,739,141) | (102,745,898) | (2,120,824,766) | (2,820,922,083) |
Net increase (decrease) | 16,023,224 | 10,686,506 | $ 473,800,224 | $ 261,836,096 |
Class F | | | | |
Shares sold | - | 439,287 | $ - | $ 11,548,416 |
Reinvestment of distributions | - | 99,472 | - | 2,597,208 |
Shares redeemed | - | (6,767,017) | - | (175,849,737) |
Net increase (decrease) | - | (6,228,258) | $ - | $ (161,704,113) |
A All Class F shares were redeemed on December 16, 2011.
12. Other.
The Fund's organizational documents provide former and current trustees and officers with a limited indemnification against liabilities arising in connection with the performance of their duties to the Fund. In the normal course of business, the Fund may also enter into contracts that provide general indemnifications. The Fund's maximum exposure under these arrangements is unknown as this would be dependent on future claims that may be made against the Fund. The risk of material loss from such claims is considered remote.
Annual Report
Report of Independent Registered Public Accounting Firm
To the Trustees of Fidelity Investment Trust and Shareholders of Fidelity Diversified International Fund:
We have audited the accompanying statement of assets and liabilities of Fidelity Diversified International Fund (the Fund), a fund of Fidelity Investment Trust, including the schedule of investments, as of October 31, 2013, and the related statement of operations for the year then ended, the statement of changes in net assets for each of the two years in the period then ended, and the financial highlights for each of the five years in the period then ended. These financial statements and financial highlights are the responsibility of the Fund's management. Our responsibility is to express an opinion on these financial statements and financial highlights based on our audits.
We conducted our audits in accordance with the standards of the Public Company Accounting Oversight Board (United States). Those standards require that we plan and perform the audit to obtain reasonable assurance about whether the financial statements and financial highlights are free of material misstatement. The Fund is not required to have, nor were we engaged to perform, an audit of its internal control over financial reporting. Our audits included consideration of internal control over financial reporting as a basis for designing audit procedures that are appropriate in the circumstances, but not for the purpose of expressing an opinion on the effectiveness of the Fund's internal control over financial reporting. Accordingly, we express no such opinion. An audit also includes examining, on a test basis, evidence supporting the amounts and disclosures in the financial statements, assessing the accounting principles used and significant estimates made by management, as well as evaluating the overall financial statement presentation. Our procedures included confirmation of securities owned as of October 31, 2013, by correspondence with the custodians and brokers; where replies were not received from brokers, we performed other auditing procedures. We believe that our audits provide a reasonable basis for our opinion.
In our opinion, the financial statements and financial highlights referred to above present fairly, in all material respects, the financial position of Fidelity Diversified International Fund as of October 31, 2013, the results of its operations for the year then ended, the changes in its net assets for each of the two years in the period then ended, and the financial highlights for each of the five years in the period then ended, in conformity with accounting principles generally accepted in the United States of America.
DELOITTE & TOUCHE LLP
Boston, Massachusetts
December 13, 2013
Annual Report
The Trustees, Member of the Advisory Board, and executive officers of the trust and fund, as applicable, are listed below. The Board of Trustees governs the fund and is responsible for protecting the interests of shareholders. The Trustees are experienced executives who meet periodically throughout the year to oversee the fund's activities, review contractual arrangements with companies that provide services to the fund, oversee management of the risks associated with such activities and contractual arrangements, and review the fund's performance. Except for James C. Curvey, Ned C. Lautenbach, Ronald P. O'Hanley and William S. Stavropoulos, each of the Trustees oversees 171 funds. Mr . Curvey oversees 394 funds. Mr Lautenbach, Mr. O'Hanley and Mr. Stavropoulos each oversees 245 funds.
The Trustees hold office without limit in time except that (a) any Trustee may resign; (b) any Trustee may be removed by written instrument, signed by at least two-thirds of the number of Trustees prior to such removal; (c) any Trustee who requests to be retired or who has become incapacitated by illness or injury may be retired by written instrument signed by a majority of the other Trustees; and (d) any Trustee may be removed at any special meeting of shareholders by a two-thirds vote of the outstanding voting securities of the trust.Each Trustee who is not an interested person of the trust and the fund (as defined in the 1940 Act) (Independent Trustee), shall retire not later than the last day of the calendar year in which his or her 75th birthday occurs. The Independent Trustees may waive this mandatory retirement age policy with respect to individual Trustees. The executive officers and Advisory Board Member hold office without limit in time, except that any officer and Advisory Board Member may resign or may be removed by a vote of a majority of the Trustees at any regular meeting or any special meeting of the Trustees. Except as indicated, each individual has held the office shown or other offices in the same company for the past five years.
Experience, Skills, Attributes, and Qualifications of the Fund's Trustees. The Governance and Nominating Committee has adopted a statement of policy that describes the experience, qualifications, attributes, and skills that are necessary and desirable for potential Independent Trustee candidates (Statement of Policy). The Board believes that each Trustee satisfied at the time he or she was initially elected or appointed a Trustee, and continues to satisfy, the standards contemplated by the Statement of Policy. The Governance and Nominating Committee also engages professional search firms to help identify potential Independent Trustee candidates who have the experience, qualifications, attributes, and skills consistent with the Statement of Policy. From time to time, additional criteria based on the composition and skills of the current Independent Trustees, as well as experience or skills that may be appropriate in light of future changes to board composition, business conditions, and regulatory or other developments, have also been considered by the professional search firms and the Governance and Nominating Committee. In addition, the Board takes into account the Trustees' commitment and participation in Board and committee meetings, as well as their leadership of standing and ad hoc committees throughout their tenure.
In determining that a particular Trustee was and continues to be qualified to serve as a Trustee, the Board has considered a variety of criteria, none of which, in isolation, was controlling. The Board believes that, collectively, the Trustees have balanced and diverse experience, qualifications, attributes, and skills, which allow the Board to operate effectively in governing the fund and protecting the interests of shareholders. Information about the specific experience, skills, attributes, and qualifications of each Trustee, which in each case led to the Board's conclusion that the Trustee should serve (or continue to serve) as a trustee of the fund, is provided below.
Board Structure and Oversight Function. James C. Curvey is an interested person (as defined in the 1940 Act) and currently serves as Chairman. The Trustees have determined that an interested Chairman is appropriate and benefits shareholders because an interested Chairman has a personal and professional stake in the quality and continuity of services provided to the fund. Independent Trustees exercise their informed business judgment to appoint an individual of their choosing to serve as Chairman, regardless of whether the Trustee happens to be independent or a member of management. The Independent Trustees have determined that they can act independently and effectively without having an Independent Trustee serve as Chairman and that a key structural component for assuring that they are in a position to do so is for the Independent Trustees to constitute a substantial majority for the Board. The Independent Trustees also regularly meet in executive session. Ned C. Lautenbach serves as Chairman of the Independent Trustees and as such (i) acts as a liaison between the Independent Trustees and management with respect to matters important to the Independent Trustees and (ii) with management prepares agendas for Board meetings.
Fidelity funds are overseen by different Boards of Trustees. The fund's Board oversees Fidelity's equity and high income funds and another Board oversees Fidelity's investment-grade bond, money market, and asset allocation funds. The asset allocation funds may invest in Fidelity funds overseen by the fund's Board. The use of separate Boards, each with its own committee structure, allows the Trustees of each group of Fidelity funds to focus on the unique issues of the funds they oversee, including common research, investment, and operational issues. On occasion, the separate Boards establish joint committees to address issues of overlapping consequences for the Fidelity funds overseen by each Board.
The Trustees operate using a system of committees to facilitate the timely and efficient consideration of all matters of importance to the Trustees, the fund, and fund shareholders and to facilitate compliance with legal and regulatory requirements and oversight of the fund's activities and associated risks. The Board, acting through its committees, has charged FMR and its affiliates with (i) identifying events or circumstances the occurrence of which could have demonstrably adverse effects on the fund's business and/or reputation; (ii) implementing processes and controls to lessen the possibility that such events or circumstances occur or to mitigate the effects of such events or circumstances if they do occur; and (iii) creating and maintaining a system designed to evaluate continuously business and market conditions in order to facilitate the identification and implementation processes described in (i) and (ii) above. Because the day-to-day operations and activities of the fund are carried out by or through FMR, its affiliates and other service providers, the fund's exposure to risks is mitigated but not eliminated by the processes overseen by the Trustees. While each of the Board's committees has responsibility for overseeing different aspects of the fund's activities, oversight is exercised primarily through the Operations, Audit, and Compliance Committees. In addition, the Independent Trustees have worked with FMR to enhance the Board's oversight of investment and financial risks, legal and regulatory risks, technology risks, and operational risks, including the development of additional risk reporting to the Board. For example, a working group comprised of Independent Trustees and FMR has worked and continues to work to review the Fidelity funds' valuation-related activities, reporting and risk management. Appropriate personnel, including but not limited to the fund's Chief Compliance Officer (CCO), FMR's internal auditor, the independent accountants, the fund's Treasurer and portfolio management personnel, make periodic reports to the Board's committees, as appropriate, including an annual review of FMR's risk management program for the Fidelity funds. The responsibilities of each standing committee, including their oversight responsibilities, are described further under "Standing Committees of the Fund's Trustees."
Annual Report
Trustees and Officers - continued
The fund's Statement of Additional Information (SAI) includes more information about the Trustees. To request a free copy, call Fidelity at 1-800-835-5092.
Interested Trustees*:
Correspondence intended for each Trustee who is an interested person may be sent to Fidelity Investments, 245 Summer Street, Boston, Massachusetts 02210.
Name, Year of Birth; Principal Occupations and Other Relevant Experience+ |
James C. Curvey (1935) |
Year of Election or Appointment: 2007 Trustee Chairman of the Board of Trustees |
| Mr. Curvey also serves as Trustee of other Fidelity funds. Mr. Curvey is a Director of Fidelity Investments Money Management, Inc. (2009-present), Director of Fidelity Research & Analysis Co. (2009-present) and Director of FMR and FMR Co., Inc. (2007-present). Mr. Curvey is also Vice Chairman (2007-present) and Director of FMR LLC. In addition, Mr. Curvey serves as an Overseer for the Boston Symphony Orchestra and a member of the Trustees of Villanova University. Previously, Mr. Curvey was the Vice Chairman (2006-2007) and Director (2000-2007) of FMR Corp. |
Ronald P. O'Hanley (1957) |
Year of Election or Appointment: 2011 Trustee |
| Mr. O'Hanley also serves as Trustee of other Fidelity funds. He is Director of Fidelity SelectCo, LLC (2013-present), FMR Co., Inc. (2010-present), Director of Fidelity Investments Money Management, Inc. (2010-present), Director of Fidelity Research & Analysis Company (2010-present), President of Fidelity Asset Management and Corporate Services and a Member of Fidelity's Executive Committee (2010-present). Previously, Mr. O'Hanley served as President and Chief Executive Officer of BNY Mellon Asset Management (2007-2010). Mr. O'Hanley also served as Vice Chairman of Bank New York Mellon Corp. and a member of that firm's Executive Committee. Prior to the 2007 merger of The Bank of New York and Mellon Financial Corporation, he was Vice Chairman of Mellon Financial Corporation and President and Chief Executive Officer of Mellon Asset Management. He joined Mellon in February 1997. Mr. O'Hanley currently serves as Chairman of the Boston Public Library Foundation Board of Directors and sits on the Board of Directors of Beth Israel Deaconess Medical Center, the Board of Trustees of the Marine Biological Laboratory and the Advisory Board of the Maxwell School of Citizenship and Public Administration at Syracuse University. Mr. O'Hanley also chairs the Council on Asset Management for the Financial Services Roundtable and is a member of the Board of Directors of Institutional Investor's U.S. Institute. |
* Trustees have been determined to be "Interested Trustees" by virtue of, among other things, their affiliation with the trust or various entities under common control with FMR.
+ The information above includes each Trustee's principal occupation during the last five years and other information relating to the experience, attributes, and skills relevant to the Trustee's qualifications to serve as a Trustee, which led to the conclusion that each Trustee should serve as a Trustee for the fund.
Annual Report
Independent Trustees:
Correspondence intended for each Independent Trustee (that is, the Trustees other than the Interested Trustees) may be sent to Fidelity Investments, P.O. Box 55235, Boston, Massachusetts 02205-5235.
Name, Year of Birth; Principal Occupations and Other Relevant Experience+ |
Dennis J. Dirks (1948) |
Year of Election or Appointment: 2005 Trustee |
| Mr. Dirks also serves as Trustee of other Fidelity funds. Prior to his retirement in May 2003, Mr. Dirks was Chief Operating Officer and a member of the Board of The Depository Trust & Clearing Corporation (DTCC). He also served as President, Chief Operating Officer, and Board member of The Depository Trust Company (DTC) and President and Board member of the National Securities Clearing Corporation (NSCC). In addition, Mr. Dirks served as Chief Executive Officer and Board member of the Government Securities Clearing Corporation, Chief Executive Officer and Board member of the Mortgage-Backed Securities Clearing Corporation, as a Trustee and a member of the Finance Committee of Manhattan College (2005-2008), and as a Trustee and a member of the Finance Committee of AHRC of Nassau County (2006-2008). Mr. Dirks is a member of the Independent Directors Council (IDC) Governing Council (2010-present) and Board of Directors for The Brookville Center for Children's Services, Inc. (2009-present). |
Alan J. Lacy (1953) |
Year of Election or Appointment: 2008 Trustee |
| Mr. Lacy also serves as Trustee of other Fidelity funds. Mr. Lacy serves as Senior Adviser (2007-present) of Oak Hill Capital Partners, L.P. (private equity). Mr. Lacy also served as Chief Executive Officer (2000-2005) and Vice Chairman (2005-2006) of Sears Holdings Corporation and Sears, Roebuck and Co. (retail). In addition, Mr. Lacy serves as a member of the Board of Directors of Dave & Buster's Entertainment, Inc. (restaurant and entertainment complexes, 2010-present), Earth Fare, Inc. (retail grocery, 2012-present), The Hillman Companies, Inc. (hardware wholesalers, 2010-present), and Bristol-Myers Squibb Company (global pharmaceuticals, 2008-present). Mr. Lacy is a member of the Board of Trustees of The National Parks Conservation Association (2006-present). Previously, Mr. Lacy served as Chairman of the Board of Trustees of the National Parks Conservation Association (2008-2011) and as a member of the Board of Directors for the Western Union Company (global money transfer, 2006-2011). |
Ned C. Lautenbach (1944) |
Year of Election or Appointment: 2000 Trustee Chairman of the Independent Trustees |
| Mr. Lautenbach also serves as Trustee of other Fidelity funds. Mr. Lautenbach currently serves as the Lead Director of the Eaton Corporation Board of Directors (diversified industrial, 1997-present). Mr. Lautenbach is Chairman of the Board of Directors of the Philharmonic Center for the Arts in Naples, Florida (2012-present) and a member of the Council on Foreign Relations (1994-present). Previously, Mr. Lautenbach was a Partner/Advisory Partner at Clayton, Dubilier & Rice, LLC (private equity investment, 1998-2010), as well as a Director of Sony Corporation (2006-2007). |
Joseph Mauriello (1944) |
Year of Election or Appointment: 2008 Trustee |
| Mr. Mauriello also serves as Trustee of other Fidelity funds. Prior to his retirement in January 2006, Mr. Mauriello served in numerous senior management positions including Deputy Chairman and Chief Operating Officer (2004-2005), and Vice Chairman of Financial Services (2002-2004) of KPMG LLP US (professional services, 1965-2005). Mr. Mauriello currently serves as a member of the Board of Directors of XL Group plc. (global insurance and re-insurance, 2006-present). Previously, Mr. Mauriello served as a Director of the Hamilton Funds of the Bank of New York (2006-2007) and of Arcadia Resources Inc. (health care services and products, 2007-2012). |
Robert W. Selander (1950) |
Year of Election or Appointment: 2011 Trustee |
| Mr. Selander also serves as Trustee of other Fidelity funds. Previously, Mr. Selander served as a Member of the Advisory Board of other Fidelity funds (2011), and Executive Vice Chairman (2010), Chief Executive Officer (2009-2010), and President and Chief Executive Officer (1997-2009) of Mastercard, Inc. |
Cornelia M. Small (1944) |
Year of Election or Appointment: 2005 Trustee |
| Ms. Small also serves as Trustee of other Fidelity funds. Ms. Small is a member of the Board of Directors (2009-present) and Chair of the Investment Committee (2010-present) of the Teagle Foundation. Ms. Small also serves on the Investment Committee of the Berkshire Taconic Community Foundation (2008-present). Previously, Ms. Small served as Chairperson (2002-2008) and a member of the Investment Committee and Chairperson (2008-2012) and a member of the Board of Trustees of Smith College. In addition, Ms. Small served as Chief Investment Officer, Director of Global Equity Investments, and a member of the Board of Directors of Scudder, Stevens & Clark and Scudder Kemper Investments. |
William S. Stavropoulos (1939) |
Year of Election or Appointment: 2001 Trustee Vice Chairman of the Independent Trustees |
| Mr. Stavropoulos also serves as Trustee of other Fidelity funds. Mr. Stavropoulos serves as President and Founder of the Michigan Baseball Foundation, the Great Lakes Loons (2007-present). Mr. Stavropoulos is Chairman Emeritus of the Board of Directors of The Dow Chemical Company, where he previously served in numerous senior management positions, including President, CEO (1995-2000; 2002-2004), Chairman of the Executive Committee (2000-2006), and as a member of the Board of Directors (1990-2006). Currently, Mr. Stavropoulos is Chairman of the Board of Directors of Univar Inc. (global distributor of commodity and specialty chemicals), a Director of Teradata Corporation (data warehousing and technology solutions), and Maersk Inc. (industrial conglomerate), and a member of the Advisory Board for Metalmark Capital LLC (private equity investment, 2005-present). Mr. Stavropoulos is an operating advisor to Clayton, Dubilier & Rice, LLC (private equity investment). In addition, Mr. Stavropoulos is a member of the University of Notre Dame Advisory Council for the College of Science, a Trustee of the Rollin L. Gerstacker Foundation, and a Director of the Naples Philharmonic Center for the Arts. Previously, Mr. Stavropoulos served as a Director of Chemical Financial Corporation (bank holding company, 1993-2012) and Tyco International, Ltd. (multinational manufacturing and services, 2007-2012). |
David M. Thomas (1949) |
Year of Election or Appointment: 2008 Trustee |
| Mr. Thomas also serves as Trustee of other Fidelity funds. Mr. Thomas serves as Non-Executive Chairman of the Board of Directors of Fortune Brands Home and Security (home and security products, 2011-present), and as a member of the Board of Directors of Interpublic Group of Companies, Inc. (marketing communication, 2004-present). Previously, Mr. Thomas served as Executive Chairman (2005-2006) and Chairman and Chief Executive Officer (2000-2005) of IMS Health, Inc. (pharmaceutical and healthcare information solutions), and a Director of Fortune Brands, Inc. (consumer products, 2000-2011). |
+ The information above includes each Trustee's principal occupation during the last five years and other information relating to the experience, attributes, and skills relevant to each Trustee's qualifications to serve as a Trustee, which led to the conclusion that each Trustee should serve as a Trustee for the fund.
Advisory Board Member and Executive Officers:
Correspondence intended for each executive officer and Peter S. Lynch may be sent to Fidelity Investments, 245 Summer Street, Boston, Massachusetts 02210. Executive officers appear below in alphabetical order.
Name, Year of Birth; Principal Occupation |
Peter S. Lynch (1944) |
Year of Election or Appointment: 2003 Member of the Advisory Board |
| Mr. Lynch also serves as Member of the Advisory Board of other Fidelity funds. Mr. Lynch is Vice Chairman and a Director of FMR and FMR Co., Inc. In addition, Mr. Lynch serves as a Trustee of Boston College and as the Chairman of the Inner-City Scholarship Fund. Previously, Mr. Lynch served on the Special Olympics International Board of Directors (1997-2006). |
Name, Year of Birth; Principal Occupation |
Elizabeth Paige Baumann (1968) |
Year of Election or Appointment: 2012 Anti-Money Laundering (AML) Officer |
| Ms. Baumann also serves as AML Officer of other funds. She is Chief AML Officer of FMR LLC (2012-present) and is an employee of Fidelity Investments. Previously, Ms. Baumann served as Vice President and Deputy Anti-Money Laundering Officer (2007-2012). |
William C. Coffey (1969) |
Year of Election or Appointment: 2009 Assistant Secretary |
| Mr. Coffey also serves as Assistant Secretary of other funds. He is Senior Vice President and Deputy General Counsel of FMR LLC (2010-present), and is an employee of Fidelity Investments. Previously, Mr. Coffey served as Vice President and Associate General Counsel of FMR LLC (2005-2009). |
Jonathan Davis (1968) |
Year of Election or Appointment: 2010 Assistant Treasurer |
| Mr. Davis also serves as Assistant Treasurer of other funds. Mr. Davis is an employee of Fidelity Investments. Previously, Mr. Davis served as Vice President and Associate General Counsel of FMR LLC (2003-2010). |
Adrien E. Deberghes (1967) |
Year of Election or Appointment: 2008 Deputy Treasurer |
| Mr. Deberghes also serves as an officer of other funds. He is an employee of Fidelity Investments (2008-present). Prior to joining Fidelity Investments, Mr. Deberghes was Senior Vice President of Mutual Fund Administration at State Street Corporation (2007-2008), Senior Director of Mutual Fund Administration at Investors Bank & Trust (2005-2007), and Director of Finance for Dunkin' Brands (2000-2005). |
Stephanie J. Dorsey (1969) |
Year of Election or Appointment: 2010 Assistant Treasurer |
| Ms. Dorsey also serves as an officer of other funds. She is an employee of Fidelity Investments (2008-present) and has served in other fund officer roles. Prior to joining Fidelity Investments, Ms. Dorsey served as Treasurer (2004-2008) of the JPMorgan Mutual Funds and Vice President (2004-2008) of JPMorgan Chase Bank. |
Scott C. Goebel (1968) |
Year of Election or Appointment: 2008 Secretary and Chief Legal Officer (CLO) |
| Mr. Goebel serves as Secretary and CLO of other funds. Mr. Goebel also serves as Secretary of Fidelity Investments Money Management, Inc. (FIMM) (2010-present) and Fidelity Research and Analysis Company (FRAC) (2010-present); General Counsel, Secretary, and Senior Vice President of FMR (2008-present) and FMR Co., Inc. (2008-present); Chief Legal Officer of Fidelity Management & Research (Hong Kong) Limited (2008-present) and Assistant Secretary of Fidelity Management & Research (Japan) Inc. (2008-present), and Fidelity Management & Research (U.K.) Inc. (2008-present). Previously, Mr. Goebel served as Secretary and CLO of other Fidelity funds (2008-2013), Assistant Secretary of FIMM (2008-2010), FRAC (2008-2010), and certain funds (2007-2008); and as Vice President and Secretary of Fidelity Distributors Corporation (FDC) (2005-2007). Mr. Goebel has been employed by FMR LLC or an affiliate since 2001. |
Joseph A. Hanlon (1968) |
Year of Election or Appointment: 2012 Chief Compliance Officer |
| Mr. Hanlon also serves as Chief Compliance Officer of other funds. Mr. Hanlon serves as Compliance Officer of FMR, FMR Co., Inc., Fidelity Investments Money Management, Inc. (FIMM), Fidelity Research and Analysis Company (FRAC), and Fidelity Management & Research (Hong Kong) (2009-present), as Senior Vice President of the Fidelity Asset Management Division (2009-present), and is an employee of Fidelity Investments. Previously, Mr. Hanlon served as Compliance Officer of Fidelity Management & Research (Japan) Inc. (2009-2013), Strategic Advisers, Inc. (2009-2013), and Fidelity Management & Research (U.K.) Inc. (2009-2013). |
Bruce T. Herring (1965) |
Year of Election or Appointment: 2006 Vice President of certain Equity Funds |
| Mr. Herring also serves as Vice President of other funds. He serves as Chief Investment Officer of Fidelity Global Asset Allocation (GAA) (2013-present), Chief Investment Officer and Director of Fidelity Management & Research (U.K.) Inc. (2010-present), Group Chief Investment Officer of FMR, and President of Fidelity Research & Analysis Company (2010-present). Previously, Mr. Herring served as Vice President (2005-2006) and Senior Vice President (2006-2007) of Fidelity Management & Research Company, Vice President of FMR Co., Inc. (2001-2007), and as a portfolio manager for Fidelity U.S. Equity Funds. |
Brian B. Hogan (1964) |
Year of Election or Appointment: 2009 Vice President |
| Mr. Hogan also serves as Vice President of other funds. Mr. Hogan serves as President of FMR's Equity Division (2009-present). Previously, Mr. Hogan served as Senior Vice President, Equity Research of FMR (2006-2009) and as a portfolio manager. |
Chris Maher (1972) |
Year of Election or Appointment: 2013 Assistant Treasurer |
| Mr. Maher serves as Assistant Treasurer of other funds. Mr. Maher is Vice President of Valuation Oversight and is an employee of Fidelity Investments. Previously, Mr. Maher served as Vice President of Asset Management Compliance (2013), Vice President of FMR's Program Management Group (2010-2013), and Vice President of Valuation Oversight (2008-2010). |
Christine Reynolds (1958) |
Year of Election or Appointment: 2008 Chief Financial Officer |
| Ms. Reynolds also serves as Chief Financial Officer of other funds. Ms. Reynolds became President of Fidelity Pricing and Cash Management Services (FPCMS) in August 2008. Ms. Reynolds served as Chief Operating Officer of FPCMS (2007-2008). Previously, Ms. Reynolds served as President, Treasurer, and Anti-Money Laundering officer of the Fidelity funds (2004-2007). |
Kenneth B. Robins (1969) |
Year of Election or Appointment: 2008 President and Treasurer |
| Mr. Robins also serves as an officer of other funds. Mr. Robins serves as Executive Vice President of Fidelity Investments Money Management, Inc. (FIMM) (2013-present) and is an employee of Fidelity Investments (2004-present). Previously, Mr. Robins served in other fund officer roles. |
Gary W. Ryan (1958) |
Year of Election or Appointment: 2005 Assistant Treasurer |
| Mr. Ryan also serves as Assistant Treasurer of other funds. Mr. Ryan is an employee of Fidelity Investments and has served in other fund officer roles. Previously, Mr. Ryan served as Vice President of Fund Reporting in Fidelity Pricing and Cash Management Services (FPCMS) (1999-2005). |
Stephen Sadoski (1971) |
Year of Election or Appointment: 2012 Deputy Treasurer |
| Mr. Sadoski also serves as Deputy Treasurer of other funds. He is an employee of Fidelity Investments (2012-present) and has served in another fund officer role. Prior to joining Fidelity Investments, Mr. Sadoski served as an assistant chief accountant in the Division of Investment Management of the Securities and Exchange Commission (SEC) (2009-2012) and as a senior manager at Deloitte & Touche LLP (1997-2009). |
Stacie M. Smith (1974) |
Year of Election or Appointment: 2013 Deputy Treasurer |
| Ms. Smith also serves as an officer of other funds. She is an employee of Fidelity Investments (2009-present) and has served in other fund officer roles. Prior to joining Fidelity Investments, Ms. Smith served as Senior Audit Manager of Ernst & Young LLP (1996-2009). |
Renee Stagnone (1975) |
Year of Election or Appointment: 2013 Deputy Treasurer |
| Ms. Stagnone also serves as Deputy Treasurer of other funds. Ms. Stagnone is an employee of Fidelity Investments. |
Joseph F. Zambello (1957) |
Year of Election or Appointment: 2011 Deputy Treasurer |
| Mr. Zambello also serves as Deputy Treasurer of other funds. Mr. Zambello is an employee of Fidelity Investments. Previously, Mr. Zambello served as Vice President of FMR's Program Management Group (2009-2011) and Vice President of the Transfer Agent Oversight Group (2005-2009). |
Annual Report
The Board of Trustees of Fidelity Diversified International Fund voted to pay to shareholders of record at the opening of business on record date, the following distributions per share derived from capital gains realized from sales of portfolio securities and dividends derived from net investment income:
| Pay Date | Record Date | Dividends | Capital Gains |
Class K | 12/09/13 | 12/06/13 | $0.367 | $0.234 |
Class K designates 3% of the dividends distributed during the fiscal year as qualifying for the dividends-received deduction for corporate shareholders.
Class K designates 84% of the dividends distributed during the fiscal year as amounts which may be taken into account as a dividend for the purposes of the maxium rate under section 1(h)(11) of the Internal Revenue Code.
The amounts per share which represent income derived from sources within, and taxes paid to, foreign countries or possessions of the United States are as follows:
| Pay Date | Income | Taxes |
Class K | 12/10/12 | $0.483 | $0.023 |
The fund will notify shareholders in January 2014 of amounts for use in preparing 2013 income tax returns.
Annual Report
Board Approval of Investment Advisory Contracts and Management Fees
Fidelity Diversified International Fund
Each year, the Board of Trustees, including the Independent Trustees (together, the Board), votes on the renewal of the management contract and sub-advisory agreements (together, the Advisory Contracts) for the fund. The Board, assisted by the advice of fund counsel and Independent Trustees' counsel, requests and considers a broad range of information relevant to the renewal of the Advisory Contracts throughout the year.
The Board meets regularly and, at each of its meetings, covers an extensive agenda of topics and materials and considers factors that are relevant to its annual consideration of the renewal of the fund's Advisory Contracts, including the services and support provided to the fund and its shareholders. The Board has established various standing committees, each composed of and chaired by Independent Trustees with varying backgrounds, to which the Board has assigned specific subject matter responsibilities in order to enhance effective decision-making by the Board. The Board, acting directly and through its Committees, requests and receives information concerning the annual consideration of the renewal of the fund's Advisory Contracts. The Board also meets as needed to consider matters specifically related to the Board's annual consideration of the renewal of Advisory Contracts. Members of the Board may also meet with trustees of other Fidelity funds through ad hoc joint committees to discuss certain matters relevant to the Fidelity funds.
At its July 2013 meeting, the Board, including the Independent Trustees, unanimously determined to renew the fund's Advisory Contracts. In reaching its determination, the Board considered all factors it believed relevant, including (i) the nature, extent, and quality of the services to be provided to the fund and its shareholders (including the investment performance of the fund); (ii) the competitiveness of the fund's management fee and total expense ratio relative to peer funds; (iii) the total costs of the services to be provided by and the profits to be realized by Fidelity from its relationship with the fund; (iv) the extent to which economies of scale exist and would be realized as the fund grows; and (v) whether fee levels reflect these economies of scale, if any, for the benefit of fund shareholders.
In considering whether to renew the Advisory Contracts for the fund, the Board reached a determination, with the assistance of fund counsel and Independent Trustees' counsel and through the exercise of its business judgment, that the renewal of the Advisory Contracts was in the best interests of the fund and its shareholders and that the compensation payable under the Advisory Contracts was fair and reasonable. The Board's decision to renew the Advisory Contracts was not based on any single factor, but rather was based on a comprehensive consideration of all the information provided to the Board at its meetings throughout the year. The Board, in reaching its determination to renew the Advisory Contracts, was aware that shareholders in the fund have a broad range of investment choices available to them, including a wide choice among mutual funds offered by Fidelity's competitors, and that the fund's shareholders, who have the opportunity to review and weigh the disclosure provided by the fund in its prospectus and other public disclosures, have chosen to invest in this fund, which is a part of the Fidelity family of funds.
Nature, Extent, and Quality of Services Provided. The Board considered the staffing within the investment adviser, Fidelity Management & Research Company (FMR), and the sub-advisers (together, the Investment Advisers) as it relates to the fund, including the backgrounds of the fund's investment personnel, and also considered the fund's investment objective, strategies, and related investment philosophy. The Independent Trustees also had discussions with senior management of Fidelity's investment operations and investment groups. The Board considered the structure of the portfolio manager compensation program and whether this structure provides appropriate incentives to act in the best interests of the fund.
Resources Dedicated to Investment Management and Support Services. The Board and the Fund Oversight and Research Committees reviewed the general qualifications and capabilities of the Investment Advisers' investment staff, including its size, education, experience, and resources, as well as the Investment Advisers' approach to recruiting, training, managing, and compensating investment personnel. The Board noted that FMR has continued to increase the resources devoted to non-U.S. offices, including expansion of Fidelity's global investment organization. The Board also noted that Fidelity's analysts have extensive resources, tools and capabilities that allow them to conduct sophisticated quantitative and fundamental analysis, as well as credit analysis of issuers, counterparties and guarantors. Further, the Board believes that Fidelity's investment professionals have sufficient access to global information and data so as to provide competitive investment results over time, and that those professionals also have access to sophisticated tools that permit them to assess portfolio construction and risk and performance attribution characteristics continuously, as well as to transmit new information and research conclusions rapidly around the world. Additionally, in its deliberations, the Board considered the Investment Advisers' trading and risk management capabilities and resources, which are an integral part of the investment management process.
Shareholder and Administrative Services. The Board considered (i) the nature, extent, quality, and cost of advisory, administrative, and shareholder services performed by the Investment Advisers and their affiliates under the Advisory Contracts and under separate agreements covering transfer agency, pricing and bookkeeping, and securities lending services for the fund; (ii) the nature and extent of the supervision of third party service providers, principally custodians and subcustodians; and (iii) the resources devoted to, and the record of compliance with, the fund's compliance policies and procedures. The Board also reviewed the allocation of fund brokerage, including allocations to brokers affiliated with the Investment Advisers, the use of brokerage commissions to pay fund expenses, and the use of "soft" commission dollars to pay for research services.
The Board noted that the growth of fund assets over time across the complex allows Fidelity to reinvest in the development of services designed to enhance the value or convenience of the Fidelity funds as investment vehicles. These services include 24-hour access to account information and market information through telephone representatives and over the Internet, investor education materials and asset allocation tools, and the expanded availability of Fidelity Investor Centers.
Annual Report
Board Approval of Investment Advisory Contracts and Management Fees - continued
Investment in a Large Fund Family. The Board considered the benefits to shareholders of investing in a Fidelity fund, including the benefits of investing in a fund that is part of a large family of funds offering a variety of investment disciplines and providing a large variety of mutual fund investor services. The Board noted that Fidelity had taken, or had made recommendations that resulted in the Fidelity funds taking, a number of actions over the previous year that benefited particular funds, including (i) continuing to dedicate additional resources to investment research and to the support of the senior management team that oversees asset management; (ii) persisting in efforts to enhance Fidelity's global research capabilities; (iii) launching new funds and making other enhancements to meet client needs for global and income-oriented solutions; (iv) continuing to launch dedicated lower cost underlying funds to meet portfolio construction needs related to expanding underlying fund options for Fidelity funds of funds, specifically for the Freedom Fund product lines; (v) rationalizing product lines and gaining increased efficiencies through the mergers of several funds into other funds; (vi) strengthening Fidelity's index fund offerings by reducing investment minimums and adopting or lowering existing expense caps for certain funds and classes; (vii) enhancing Global Asset Allocation product offerings by launching new funds and strategies, including "open architecture" target date funds that utilize affiliated and unaffiliated sub-advisers; (viii) modifying the eligibility criteria for Institutional Class shares of Advisor funds to increase their marketability to a portion of the defined contribution plan market; (ix) creating a new low-cost retirement share class for certain Advisor funds to appeal to large retirement plans; (x) transitioning the management of certain Fidelity commodity funds to Geode Capital Management LLC, a registered commodity pool operator, while retaining administrative responsibilities for the funds; (xi) reorganizing a number of funds; and (xii) taking steps toward establishing a new Fidelity adviser to manage sector-based funds and products.
Investment Performance. The Board considered whether the fund has operated in accordance with its investment objective, as well as its record of compliance with its investment restrictions and its performance history.
The Board took into account discussions with the Investment Advisers about fund investment performance that occur at Board meetings throughout the year. In this regard the Board noted that as part of regularly scheduled fund reviews and other reports to the Board on fund performance, the Board periodically considers annualized return information for the fund, for different time periods, measured against a securities market index ("benchmark index") and a peer group of mutual funds with similar objectives ("peer group"). In its evaluation of fund investment performance, the Board gave particular attention to information indicating changes in performance of certain Fidelity funds for specific time periods and the Investment Advisers' explanations for any overperformance or underperformance.
In addition to reviewing absolute and relative fund performance, the Independent Trustees periodically consider the appropriateness of fund performance metrics in evaluating the results achieved. In general, the Independent Trustees believe that fund performance should be evaluated based on net performance (after fees and expenses) of both the highest performing and lowest performing classes, where applicable, compared to appropriate benchmark indices, over appropriate time periods which may include full market cycles, and compared to peer groups, as applicable, over the same periods, taking into account relevant factors including the following: general market conditions; issuer-specific information; tactical opportunities for investment; and fund cash flows and other factors.
The Independent Trustees recognize that shareholders evaluate performance on a net basis over their own holding periods, for which one-, three-, and five-year periods are used as a proxy. For this reason, the performance information reviewed by the Board also included net cumulative calendar year total return information for the fund and an appropriate benchmark index and peer group for the most recent one-, three-, and five-year periods, as shown below. Returns are shown compared to the 25th percentile (top of box) and 75th percentile (bottom of box) of the peer universe. Returns of the benchmark index are "net MA," i.e., adjusted for tax withholding rates applicable to U.S.-based mutual funds organized as Massachusetts business trusts.
Annual Report
Fidelity Diversified International Fund
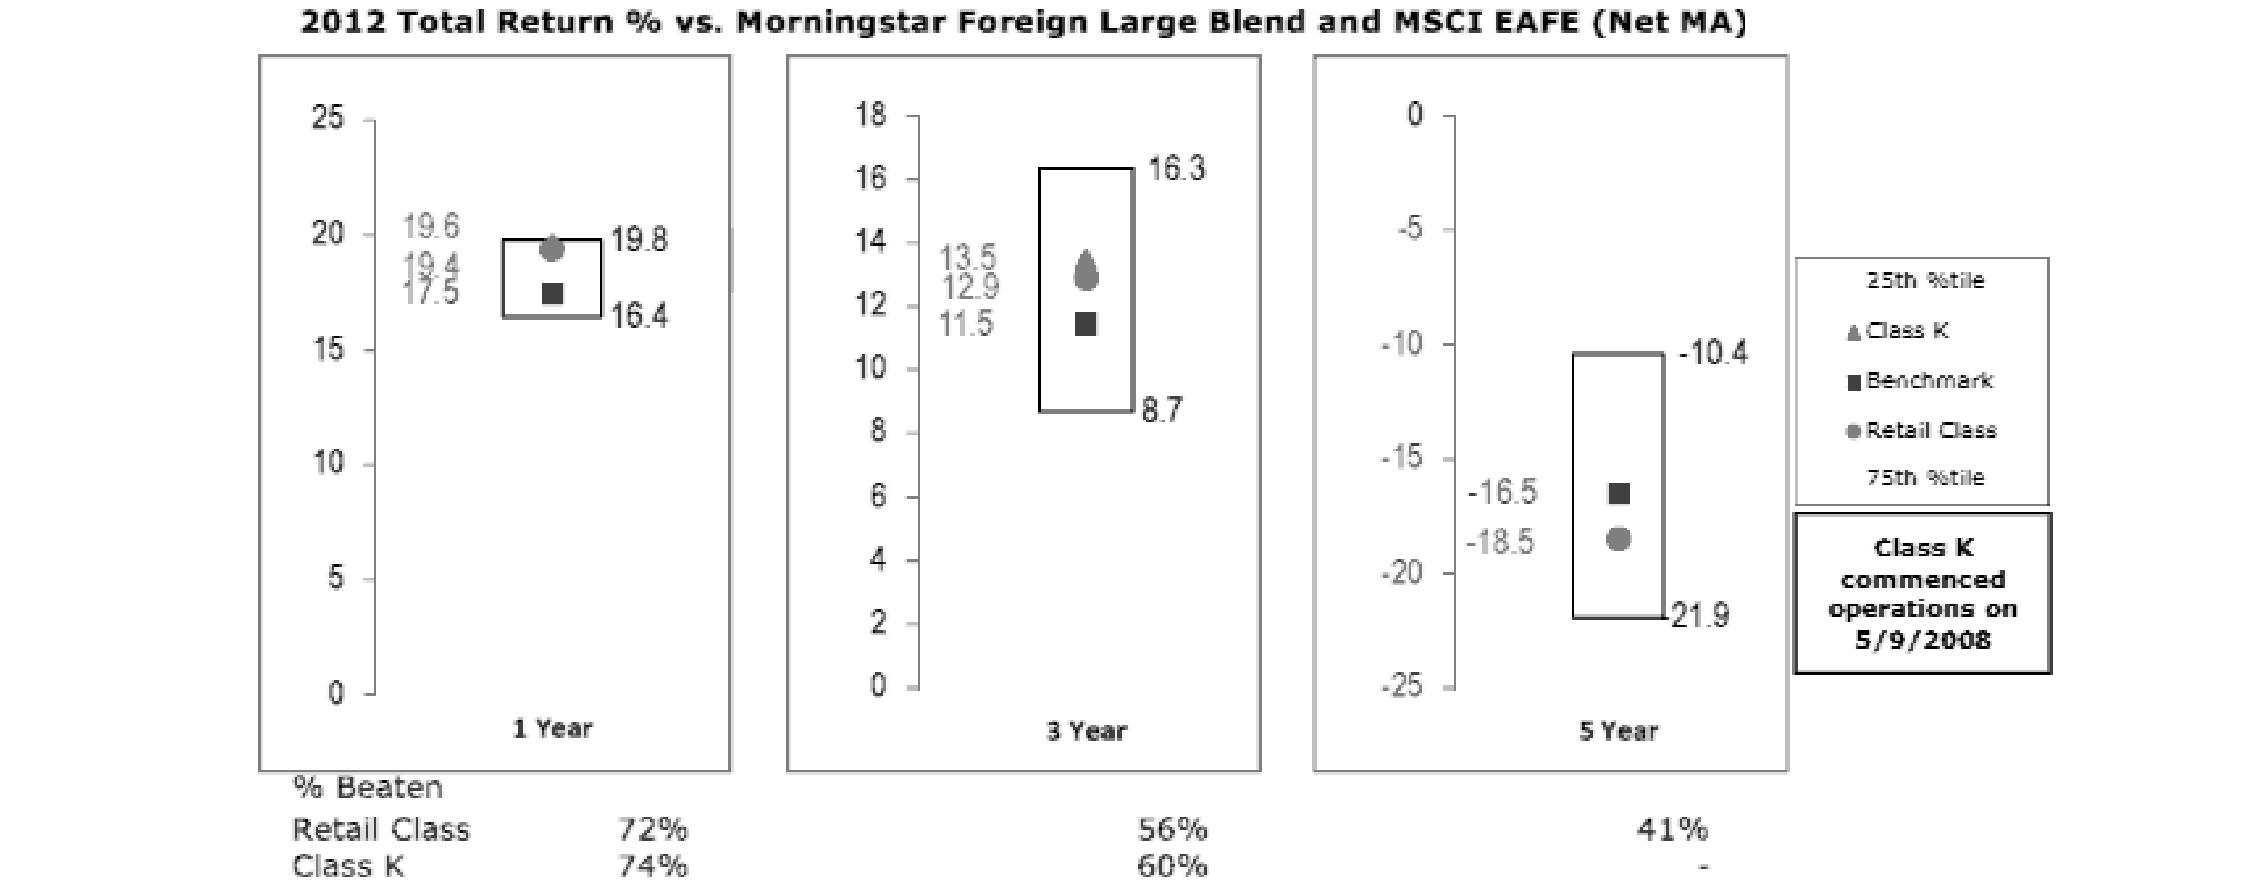
The Board also considered that the fund's management fee is subject to upward or downward adjustment depending upon whether, and to what extent, the fund's investment performance for the performance period exceeds, or is exceeded by, a securities index, thus leading to a performance adjustment for the same period. The Board noted that the performance adjustment provides FMR with a strong economic incentive to seek to achieve superior performance for the fund's shareholders and helps to more closely align the interests of FMR and the fund's shareholders.
Based on its review, the Board concluded that the nature, extent, and quality of services provided to the fund under the Advisory Contracts should benefit the fund's shareholders.
Competitiveness of Management Fee and Total Expense Ratio. The Board considered the fund's management fee and total expense ratio compared to "mapped groups" of competitive funds and classes. Fidelity creates "mapped groups" by combining similar Lipper investment objective categories that have comparable management fee characteristics. Combining Lipper investment objective categories aids the Board's management fee and total expense ratio comparisons by broadening the competitive group used for comparison and by reducing the number of universes to which various Fidelity funds are compared.
Management Fee. The Board considered two proprietary management fee comparisons for the 12-month periods shown in the chart below. The group of Lipper funds used by the Board for management fee comparisons is referred to below as the "Total Mapped Group." The Total Mapped Group comparison focuses on a fund's standing in terms of gross management fees before expense reimbursements or caps, and without giving effect to the fund's performance adjustment, relative to the total universe of funds with comparable investment mandates, regardless of whether their management fee structures also are comparable. Funds with comparable investment mandates offer exposure to similar types of securities. Funds with comparable management fee structures have similar management fee contractual arrangements (e.g., flat rate charged for advisory services, all-inclusive fee rate, etc.). "TMG %" represents the percentage of funds in the Total Mapped Group that had management fees that were lower than the fund's. For example, a TMG % of 16% means that 84% of the funds in the Total Mapped Group had higher management fees than the fund. The "Asset-Size Peer Group" (ASPG) comparison focuses on a fund's standing relative to a subset of non-Fidelity funds within the Total Mapped Group that are similar in size and management fee structure. The ASPG represents at least 15% of the funds in the Total Mapped Group with comparable asset size and management fee structures, subject to a minimum of 50 funds (or all funds in the Total Mapped Group if fewer than 50). Additional information, such as the ASPG quartile in which the fund's management fee ranked and the impact of the fund's performance adjustment, is also included in the chart and considered by the Board.
Annual Report
Board Approval of Investment Advisory Contracts and Management Fees - continued
Fidelity Diversified International Fund
The Board noted that the fund's management fee ranked below the median of its Total Mapped Group and below the median of its ASPG for 2012. The Board also noted the effect of the fund's positive performance adjustment on the fund's management fee ranking.
Based on its review, the Board concluded that the fund's management fee is fair and reasonable in light of the services that the fund receives and the other factors considered.
Total Expense Ratio. In its review of each class's total expense ratio, the Board considered the fund's management fee as well as other fund or class expenses, as applicable, such as transfer agent fees, pricing and bookkeeping fees, and custodial, legal, and audit fees. The Board also noted the effects of any waivers and reimbursements on fees and expenses, as well as the impact of the fund's performance adjustment. As part of its review, the Board also considered the current and historical total expense ratios of each class of the fund compared to competitive fund median expenses. Each class of the fund is compared to those funds and classes in the Total Mapped Group (used by the Board for management fee comparisons) that have a similar sales load structure.
The Board noted that the total expense ratio of each class ranked below its competitive median for 2012.
Fees Charged to Other Fidelity Clients. The Board also considered Fidelity fee structures and other information with respect to clients of FMR and its affiliates, such as other mutual funds advised or subadvised by FMR or its affiliates, pension plan clients, and other institutional clients. The Board noted the findings of the 2013 ad hoc joint committee (created with the board of other Fidelity funds), which reviewed and compared Fidelity's institutional investment advisory business with its business of providing services to the Fidelity funds, including the differences in services provided, fees charged, and costs incurred, as well as competition in their respective marketplaces.
Based on its review of total expense ratios and fees charged to other Fidelity clients, the Board concluded that the total expense ratio of each class of the fund was reasonable in light of the services that the fund and its shareholders receive and the other factors considered.
Costs of the Services and Profitability. The Board considered the revenues earned and the expenses incurred by Fidelity in conducting the business of developing, marketing, distributing, managing, administering and servicing the fund and servicing the fund's shareholders. The Board also considered the level of Fidelity's profits in respect of all the Fidelity funds.
On an annual basis, FMR presents to the Board Fidelity's profitability for the fund. Fidelity calculates the profitability for each fund, as well as aggregate profitability for groups of Fidelity funds and all Fidelity funds, using a series of detailed revenue and cost allocation methodologies which originate with the books and records of Fidelity on which Fidelity's audited financial statements are based. The Audit Committee of the Board reviews any significant changes from the prior year's methodologies.
PricewaterhouseCoopers LLP (PwC), independent registered public accounting firm and auditor to Fidelity and certain Fidelity funds, has been engaged annually by the Board as part of the Board's assessment of Fidelity's profitability analysis. PwC's engagement includes the review and assessment of the methodologies used by Fidelity in determining the revenues and expenses attributable to Fidelity's mutual fund business, and completion of agreed-upon procedures surrounding the mathematical accuracy of fund profitability and its conformity to allocation methodologies. After considering PwC's reports issued under the engagement and information provided by Fidelity, the Board concluded that while other allocation methods may also be reasonable, Fidelity's profitability methodologies are reasonable in all material respects.
Annual Report
The Board also reviewed Fidelity's non-fund businesses and fall-out benefits related to the mutual fund business as well as cases where Fidelity's affiliates may benefit from or be related to the fund's business.
The Board considered the costs of the services provided by and the profits realized by Fidelity in connection with the operation of the fund and was satisfied that the profitability was not excessive in the circumstances.
Economies of Scale. The Board considered whether there have been economies of scale in respect of the management of the Fidelity funds, whether the Fidelity funds (including the fund) have appropriately benefited from any such economies of scale, and whether there is potential for realization of any further economies of scale. The Board considered the extent to which the fund will benefit from economies of scale through increased services to the fund, through waivers or reimbursements, or through fee or expense reductions. The Board also noted that in 2009, it and the board of other Fidelity funds created an ad hoc committee (the Economies of Scale Committee) to analyze whether FMR attains economies of scale in respect of the management and servicing of the Fidelity funds, whether the Fidelity funds have appropriately benefited from such economies of scale, and whether there is potential for realization of any further economies of scale.
The Board recognized that the fund's management contract incorporates a "group fee" structure, which provides for lower group fee rates as total fund assets under FMR's management increase, and for higher group fee rates as total fund assets under FMR's management decrease. FMR calculates the group fee rates based on a tiered asset "breakpoint" schedule that varies based on asset class. The Board considered that the group fee is designed to deliver the benefits of economies of scale to fund shareholders when total Fidelity fund assets increase, even if assets of any particular fund are unchanged or have declined, because some portion of Fidelity's costs are attributable to services provided to all Fidelity funds, and all funds benefit if those costs can be allocated among more assets. The Board concluded that, given the group fee structure, fund shareholders will benefit from lower management fees as assets under FMR's management increase at the fund complex level, regardless of whether Fidelity achieves any such economies of scale.
The Board concluded, taking into account the analysis of the Economies of Scale Committee, that economies of scale, if any, are being appropriately shared between fund shareholders and Fidelity.
Amendment to Description of Group Fee Rate. At its July 2013 meeting, the Board voted to approve an amendment to the fund's management contract to modify the description of the "group fee rate" effective August 1, 2013. The Board noted that under the prior description in the contract, the group fee rate was based on the average net assets of all registered investment companies with which FMR has management contracts. Under the contract's tiered asset breakpoint schedule, the group fee rate is lower as total fund assets under FMR's management increase, and higher as total fund assets under FMR's management decrease. The Board considered that the prior description would have excluded the assets of 64 Fidelity sector funds from the group fee rate calculation once Fidelity SelectCo, LLC, an affiliate of FMR, assumed management responsibilities for those funds. The Board noted that modifying the description of the group fee rate to continue to include the assets of those 64 funds for purposes of determining group fee rate breakpoints would avoid an immediate adverse impact on the group fee rate for any fund.
Additional Information Requested by the Board. In order to develop fully the factual basis for consideration of the Fidelity funds' Advisory Contracts, the Board requested and received additional information on certain topics, including: (i) fund performance trends and Fidelity's long-term strategies for certain funds; (ii) the potential to further rationalize the Fidelity fund lineup with the possibility of achieving savings for the funds and Fidelity; (iii) the methodology with respect to competitive fund data and peer group classifications; (iv) the arrangements with, and performance of, certain sub-advisers on behalf of the Fidelity funds, as well as certain proposed participating affiliate arrangements; (v) the realization of fall-out benefits in certain Fidelity business units; (vi) Fidelity's group fee structures, including the rationale for the individual fee rates of certain categories of funds and the definition of group assets; (vii) trends regarding industry use of performance fee structures and the performance adjustment methodologies applicable to the Fidelity funds; (viii) additional competitive analysis regarding the total expenses for certain classes; and (ix) fund profitability methodology, including Fidelity's cost allocation methodology, and the impact of certain factors on fund profitability results.
Based on its evaluation of all of the conclusions noted above, and after considering all factors it believed relevant, the Board ultimately concluded that the advisory fee structures are fair and reasonable, and that the fund's Advisory Contracts should be renewed.
Annual Report
Investment Adviser
Fidelity Management & Research Company
Boston, MA
Investment Sub-Advisers
FMR Co., Inc.
Fidelity Management & Research (U.K.) Inc.
Fidelity Management & Research
(Hong Kong) Limited
Fidelity Management & Research
(Japan) Inc.
FIL Investment Advisors
FIL Investment Advisors (UK) Limited
FIL Investments (Japan) Limited
General Distributor
Fidelity Distributors Corporation
Smithfield, RI
Transfer and Service Agents
Fidelity Investments Institutional
Operations Company, Inc.
Boston, MA
Fidelity Service Company, Inc.
Boston, MA
Custodian
JPMorgan Chase Bank
New York, NY
(Fidelity Investment logo)(registered trademark)
Corporate Headquarters
245 Summer St., Boston, MA 02210
www.fidelity.com
DIF-K-UANN-1213
1.863004.105
Item 2. Code of Ethics
As of the end of the period, October 31, 2013, Fidelity Investment Trust (the trust) has adopted a code of ethics, as defined in Item 2 of Form N-CSR, that applies to its President and Treasurer and its Chief Financial Officer. A copy of the code of ethics is filed as an exhibit to this Form N-CSR.
Item 3. Audit Committee Financial Expert
The Board of Trustees of the trust has determined that Joseph Mauriello is an audit committee financial expert, as defined in Item 3 of Form N-CSR. Mr. Mauriello is independent for purposes of Item 3 of Form N-CSR.
Item 4. Principal Accountant Fees and Services
Fees and Services
The following table presents fees billed by Deloitte & Touche LLP, the member firms of Deloitte Touche Tohmatsu, and their respective affiliates (collectively, "Deloitte Entities") in each of the last two fiscal years for services rendered to Fidelity Diversified International Fund, Fidelity International Capital Appreciation Fund, and Fidelity Worldwide Fund (the "Funds"):
Services Billed by Deloitte Entities
October 31, 2013 FeesA
| Audit Fees | Audit-Related Fees | Tax Fees | All Other Fees |
Fidelity Diversified International Fund | $97,000 | $- | $6,900 | $4,700 |
Fidelity International Capital Appreciation Fund | $51,000 | $- | $6,900 | $600 |
Fidelity Worldwide Fund | $49,000 | $- | $5,800 | $700 |
October 31, 2012 FeesA
| Audit Fees | Audit-Related Fees | Tax Fees | All Other Fees |
Fidelity Diversified International Fund | $94,000 | $- | $6,800 | $3,600 |
Fidelity International Capital Appreciation Fund | $49,000 | $- | $6,800 | $400 |
Fidelity Worldwide Fund | $50,000 | $- | $5,700 | $500 |
A Amounts may reflect rounding.
The following table presents fees billed by PricewaterhouseCoopers LLP ("PwC") in each of the last two fiscal years for services rendered to Fidelity Overseas Fund (the "Fund"):
Services Billed by PwC
October 31, 2013 FeesA
| Audit Fees | Audit-Related Fees | Tax Fees | All Other Fees |
Fidelity Overseas Fund | $65,000 | $- | $9,300 | $2,300 |
October 31, 2012 FeesA
| Audit Fees | Audit-Related Fees | Tax Fees | All Other Fees |
Fidelity Overseas Fund | $65,000 | $- | $11,400 | $2,400 |
A Amounts may reflect rounding.
The following table presents fees billed by PwC and Deloitte Entities that were required to be approved by the Audit Committee for services that relate directly to the operations and financial reporting of the Funds and that are rendered on behalf of Fidelity Management & Research Company ("FMR") and entities controlling, controlled by, or under common control with FMR (not including any sub-adviser whose role is primarily portfolio management and is subcontracted with or overseen by another investment adviser) that provide ongoing services to the Funds ("Fund Service Providers"):
Services Billed by Deloitte Entities
| October 31, 2013A | October 31, 2012A |
Audit-Related Fees | $1,010,000 | $720,000 |
Tax Fees | $- | $- |
All Other Fees | $800,000 | $1,305,000 |
A Amounts may reflect rounding.
Services Billed by PwC
| October 31, 2013A | October 31, 2012A |
Audit-Related Fees | $5,395,000 | $3,640,000 |
Tax Fees | $- | $- |
All Other Fees | $50,000 | $- |
A Amounts may reflect rounding.
"Audit-Related Fees" represent fees billed for assurance and related services that are reasonably related to the performance of the fund audit or the review of the fund's financial statements and that are not reported under Audit Fees.
"Tax Fees" represent fees billed for tax compliance, tax advice or tax planning that relate directly to the operations and financial reporting of the fund.
"All Other Fees" represent fees billed for services provided to the fund or Fund Service Provider, a significant portion of which are assurance related, that relate directly to the operations and financial reporting of the fund, excluding those services that are reported under Audit Fees, Audit-Related Fees or Tax Fees.
Assurance services must be performed by an independent public accountant.
* * *
The aggregate non-audit fees billed by PwC and Deloitte Entities for services rendered to the Funds, FMR (not including any sub-adviser whose role is primarily portfolio management and is subcontracted with or overseen by another investment adviser), and any Fund Service Provider for each of the last two fiscal years of the Funds are as follows:
Billed By | October 31, 2013 A | October 31, 2012 A |
PwC | $6,305,000 | $4,185,000 |
Deloitte Entities | $1,945,000 | $2,090,000 |
A Amounts may reflect rounding.
The trust's Audit Committee has considered non-audit services that were not pre-approved that were provided by PwC and Deloitte Entities to Fund Service Providers to be compatible with maintaining the independence of PwC and Deloitte Entities in their audits of the Funds, taking into account representations from PwC and Deloitte Entities, in accordance with Public Company Accounting Oversight Board rules, regarding their independence from the Funds and their related entities and FMR's review of the appropriateness and permissibility under applicable law of such non-audit services prior to their provision to the Fund Service Providers.
Audit Committee Pre-Approval Policies and Procedures
The trust's Audit Committee must pre-approve all audit and non-audit services provided by a fund's independent registered public accounting firm relating to the operations or financial reporting of the fund. Prior to the commencement of any audit or non-audit services to a fund, the Audit Committee reviews the services to determine whether they are appropriate and permissible under applicable law.
The Audit Committee has adopted policies and procedures to, among other purposes, provide a framework for the Committee's consideration of non-audit services by the audit firms that audit the Fidelity funds. The policies and procedures require that any non-audit service provided by a fund audit firm to a Fidelity fund and any non-audit service provided by a fund auditor to a Fund Service Provider that relates directly to the operations and financial reporting of a Fidelity fund ("Covered Service") are subject to approval by the Audit Committee before such service is provided.
All Covered Services must be approved in advance of provision of the service either: (i) by formal resolution of the Audit Committee, or (ii) by oral or written approval of the service by the Chair of the Audit Committee (or if the Chair is unavailable, such other member of the Audit Committee as may be designated by the Chair to act in the Chair's absence). The approval contemplated by (ii) above is permitted where the Treasurer determines that action on such an engagement is necessary before the next meeting of the Audit Committee.
Non-audit services provided by a fund audit firm to a Fund Service Provider that do not relate directly to the operations and financial reporting of a Fidelity fund are reported to the Audit Committee on a periodic basis.
Non-Audit Services Approved Pursuant to Rule 2-01(c)(7)(i)(C) and (ii) of Regulation S-X ("De Minimis Exception")
There were no non-audit services approved or required to be approved by the Audit Committee pursuant to the De Minimis Exception during the Funds' last two fiscal years relating to services provided to (i) the Funds or (ii) any Fund Service Provider that relate directly to the operations and financial reporting of the Funds.
Item 5. Audit Committee of Listed Registrants
Not applicable.
Item 6. Investments
(a) Not applicable.
(b) Not applicable
Item 7. Disclosure of Proxy Voting Policies and Procedures for Closed-End Management Investment Companies
Not applicable.
Item 8. Portfolio Managers of Closed-End Management Investment Companies
Not applicable.
Item 9. Purchase of Equity Securities by Closed-End Management Investment Company and Affiliated Purchasers
Not applicable.
Item 10. Submission of Matters to a Vote of Security Holders
There were no material changes to the procedures by which shareholders may recommend nominees to the trust's Board of Trustees.
Item 11. Controls and Procedures
(a)(i) The President and Treasurer and the Chief Financial Officer have concluded that the trust's disclosure controls and procedures (as defined in Rule 30a-3(c) under the Investment Company Act) provide reasonable assurances that material information relating to the trust is made known to them by the appropriate persons, based on their evaluation of these controls and procedures as of a date within 90 days of the filing date of this report.
(a)(ii) There was no change in the trust's internal control over financial reporting (as defined in Rule 30a-3(d) under the Investment Company Act) that occurred during the second fiscal quarter of the period covered by this report that has materially affected, or is reasonably likely to materially affect, the trust's internal control over financial reporting.
Item 12. Exhibits
(a) | (1) | Code of Ethics pursuant to Item 2 of Form N-CSR is filed and attached hereto as EX-99.CODE ETH. |
(a) | (2) | Certification pursuant to Rule 30a-2(a) under the Investment Company Act of 1940 (17 CFR 270.30a-2(a)) is filed and attached hereto as Exhibit 99.CERT. |
(a) | (3) | Not applicable. |
(b) | | Certification pursuant to Rule 30a-2(b) under the Investment Company Act of 1940 (17 CFR 270.30a-2(b)) is furnished and attached hereto as Exhibit 99.906CERT. |
SIGNATURES
Pursuant to the requirements of the Securities Exchange Act of 1934 and the Investment Company Act of 1940, the registrant has duly caused this report to be signed on its behalf by the undersigned, thereunto duly authorized.
Fidelity Investment Trust
By: | /s/Kenneth B. Robins |
| Kenneth B. Robins |
| President and Treasurer |
| |
Date: | December 26, 2013 |
Pursuant to the requirements of the Securities Exchange Act of 1934 and the Investment Company Act of 1940, this report has been signed below by the following persons on behalf of the registrant and in the capacities and on the dates indicated.
By: | /s/Kenneth B. Robins |
| Kenneth B. Robins |
| President and Treasurer |
| |
Date: | December 26, 2013 |
By: | /s/Christine Reynolds |
| Christine Reynolds |
| Chief Financial Officer |
| |
Date: | December 26, 2013 |